summit view community profile - university of arizona view community... · summit view community...
TRANSCRIPT

Made possible by funding from the Pima County Health Department via the U.S. Department of Health and Human Services.
Summit View Community Profile
Developed by the CPPW Evaluation Team University of Arizona
Mel and Enid Zuckerman College of Public Health
for the
Communities Putting Prevention to Work Program Pima County Health Department

May 4, 2012
SOURCES: Govtrack.us. Arizona’s 7
th Congressional District & Map. Available at: http://www.govtrack.us/congress/findyourreps.xpd?state=AZ&district=7.
Pima County Board of Supervisors. District Map. Available at: http://www.pima.gov/bos/distmap/images/bos17.pdf. U.S. Census Bureau. 2005-2009 American Community Survey 5-Year Estimates. Available at: http://factfinder.census.gov. U.S. Department of Housing & Urban Development. Designated Colonias in Arizona. Available at: http://www.hud.gov/local/az/groups/coloniasaz.cfm.
SUMMIT VIEW
Census tract
Neighborhood boundaries
Population: 8,125
Location: Outside of metro Tucson, about 2 miles south of Tucson International Airport
Neighborhood Boundaries: North: E. Old Vail Connection Rd. South: E. Blackbrush Rd. West: S. Nogales Hwy East: S. Country Club Rd.
Land area: About 1.5 sq. miles (neighborhood)
Colonia: No
Congressional District: 7
Board of Supervisors District: 2
Census Tract: 41.06
Ward: 5
1
Data Sources: This community profile contains
information from multiple sources.
The magnifying glass symbol indicates that the information came from public sources like the
U.S. Census Bureau or agency websites.
The camera symbol indicates that the information originated from an observational assessment of the community conducted by
evaluators from the University Of Arizona College Of Public Health.
The microphone symbol indicates that the information came from an interview with the CPPW neighborhood Connector conducted by evaluators from the University of Arizona
College of Public Health.
The clipboard symbol indicates the data originated from the community assessments
administered to neighborhood residents by the CPPW neighborhood Connector.

May 4, 2012
SOURCE: U.S. Census Bureau. 2005-2009 American Community Survey 5-Year Estimates. Available at: http://factfinder.census.gov.
Demographics (ACS 2005-2009)
SUMMIT VIEW
PIMA COUNTY
U.S.
GENDER Male 66.0% 49.0% 49.3%
Female 34.0% 51.0% 50.7%
AGE
Median age 31.3 years 36.8 years 36.5 years
Under 5 years 4.5% 6.9% 6.9%
18 years and over 76.5% 76.3% 75.4%
65 years and over 5.9% 14.7% 12.6%
HOUSEHOLDS AND FAMILIES
Average household size 3.97 people 2.62 people 2.60 people
Average family size 4.39 people 3.30 people 3.19 people
Median household income $36,942 $45,885 $51,425
Median family income $39,647 $56,711 $62,363
Per capita income $7,334 $24,556 $27,041
RACE AND ETHNICITY
Not Hispanic or Latino:
White alone 32.4% 57.2% 65.8%
Black or African American alone
6.7% 3.1% 12.1%
American Indian and Alaska Native alone
2.0% 2.5% 0.7%
Asian alone 0.2% 2.4% 4.3%
Native Hawaiian and Other Pacific Islander alone
0.0% 0.1% 0.1%
Some other race alone 0.0% 0.3% 0.2%
Two or more races 0.1% 1.6% 1.6%
Hispanic or Latino (of any race)
58.6% 32.8% 15.1%
NATIVITY / LANGUAGE
Foreign born 25.5% 13.2% 12.4%
Speak a language other than English at home (population 5 years and over)
53.7% 28.0% 19.6%
Employment by Industry
Of the Summit View population age 16 years and over, about one-
quarter (26%) is in the labor force, compared to 65% of the U.S.
population.
Construction is the top industry in Summit View,
accounting for 24% of labor. This industry accounts for
only 9% of labor countywide.
The biggest source of employment in Pima County,
educational, health and social services (24% of labor),
accounts for 20% of labor in Summit View.
POPULATION CHARACTERISTICS
The population of Summit View differs from the population of Pima County and the overall U.S. population (see table at right). Compared to these two groups, residents in Summit View:
Are more likely to be male – 66% of Summit View residents are male, a substantially greater proportion than the Pima County and the U.S.
Are slightly younger – There are fewer adults over 65 in Summit View than Pima County and the U.S.
Live in larger household and have larger families – Average household and family size are larger than the county and the nation.
Have lower incomes – Per capita income is less than one-third those of Pima County and the nation.
Are more Hispanic – More than 50% of the Summit View population identifies as Hispanic or Latino (of any race) compared to 33% of those in Pima County and 15% of the U.S. population.
Are more likely to be foreign born – More than 25% of those in Summit View were born outside the U.S., about double the proportion for Pima County and the U.S.
Are more likely to speak a language other than English at home – More than 50% of Summit View residents compared to less than 20% of those nationwide.
2

May 4, 2012
SOURCE: U.S. Census Bureau. 2005-2009 American Community Survey 5-Year Estimates. Available at: http://factfinder.census.gov.
NEIGHBORHOOD CHARACTERISTICS: HOMES VS. COMMERCIAL DESTINATIONS
Residential Areas
Housing characteristics: Summit View has 1,394 housing units
16% of housing units in Summit View are vacant, compared to about 12% in Pima County.
There are more homeowners than renters: 74% of housing units in Summit View are owner-occupied and 26% are renter-occupied.
0.0% of housing units lack complete plumbing facilities
0.0% lack complete kitchen facilities
0.6% have no telephone services
Occupied Housing Units by Year
Householder Moved Into Unit
0%
10%
20%
30%
40%
1969 or
before
1970-
1979
1980-
1989
1990-
1999
2000-
2004
2005 or
later
Commercial / Public Access Destinations
The Summit View neighborhood is vastly residential and includes only a few commercial destinations, one school, and one park.
Two food stores and an ice cream truck were observed within the neighborhood boundaries.
Several home-based businesses such as childcare, woodcutting, construction, and animals for sale were advertised on corners and along roads.
Neighborhood Assets
Top 3 things Summit View survey respondents like MOST about their neighborhood (N=65):
Calm and quiet 14%
Large lots 12%
The people 11%
Some of them live in trailers and some are getting abused in terms of their housing rights. They have been
kicked out and they have to keep moving and the kids miss school.
Who answered the survey?
65 members of the Summit View community
20% in English
80% in Spanish
The surveys were conducted door to door, at Summit View Elementary School, and a community health fair in 2011
3

May 4, 2012
Open to the public? P
lay e
qu
ipm
en
t
Gra
ss
Sp
ort
s fie
lds
Te
nn
is c
ou
rts
Be
nche
s
Pic
nic
ta
ble
s
Wa
ter
fou
nta
ins
Restr
oom
s
Bik
e r
acks
Tra
sh
bin
s
Exe
rcis
e s
tation
s
Wa
lkin
g tra
ils
Lig
hts
Po
ol
Ve
nd
ing
ma
chin
es
Au
dito
ry a
nn
oya
nce
Litte
r /
bro
ke
n g
lass
Dog
re
fuse
Dog
s u
na
tte
nd
ed
Evid
en
ce o
f alc
oh
ol
/ su
bsta
nce u
se
Se
x p
ara
phe
rnalia
Gra
ffiti / van
dalis
m
Summit View ES
D. E. Summit Park
Obesity is
high, people don’t think,
people the way the
cook, they don’t
know how or what to
look for.
They need so many
things and one of
them is good
information about
health and nutrition.
S.
Van
essa
Ln
.
S. E
pp
erso
n L
n.
Two recreational facilities were identified in the Summit View neighborhood (see map at right). These include:
Summit View Elementary School 1900 E. Summit St.
Dan Eckstrom Summit Park 1800 E. Summit St.
These recreational facilities were assessed for the presence/visibility and quality of features:
COMMUNITY RECREATIONAL FACILITIES
4

May 4, 2012
COMMUNITY RECREATIONAL FACILITIES – PARKS ACCESSIBLE TO THE PUBLIC
DAN ECKSTROM SUMMIT PARK Medium-size recreational area that is open to the public and includes the following features:
- Unshaded play equipment (see photo at bottom left) - Sports fields and grassy areas (see photo at top right) - Benches and unshaded picnic tables - Restrooms (locked at time of observation) - Water fountains - Bike racks - Trash bins - Walking trails - Lights
There was no evidence of alcohol or substance, or sex paraphernalia. Some litter was observed. Twenty-three Summit View residents surveyed (35%) are
aware of the neighborhood or local school recreational facilities; 46% are not aware; and 14% indicated they do not know
what recreational resources are available (N = 65).
5

May 4, 2012
\
SUMMIT VIEW ELEMENTARY SCHOOL
Medium-size joint-use recreational facility with gates unlocked, accessible until sunset (see photo at right). The area includes:
- Basketball courts - Bike racks - Lights - Restrooms (in the school) - Shaded and unshaded play equipment (see photo at bottom left) - Shaded benches and picnic tables - Soccer and baseball fields and grassy areas - Trash bins - Water fountains
The area is well maintained, with no graffiti and no evidence of alcohol or substance use or sex paraphernalia. Some litter and dog refuse were visible.
COMMUNITY RECREATIONAL FACILITIES – SCHOOLS ACCESSIBLE TO THE PUBLIC
The parents tell me, “This area needs traffic lights and stop signs”. One parent
was very upset that people were speeding and not giving people time to cross, so she
organized a few people and started pushing for traffic signs and a few other things.
6

May 4, 2012
SOURCES: City of Tucson. Tucson Metro Bike Map. Available at: http://bikeped.pima.gov/Pubs/MetroBikeMap07-10PG2.pdf. SunTran. System-wide Map. http://www.suntran.com/pdf/Current%20System%20Map%20AUG%2010.pdf.
Bus Service
SunTran (Tucson’s regional bus service)
One Sun Shuttle route (Green Valley / Sahuarita connector) connects Summit View to metro Tucson. Dial-a-ride service is also available for this route.
92%
46%
38%
34%
31%
0 10 20 30
A Park
Just Go For A Walk
Neighbor's/Friend's House
School
Convenience Store
Most common walk/bike destinations N = 26
PUBLIC AND ACTIVE TRANSPORTATION
Map of Sun Tran Routes in Summit View
Bikeability
Bike Routes:
There are no designated bike routes in Summit View.
Summit View lacks a transportation infrastructure, as many roads in the Summit View neighborhood are unpaved. During the observational assessment, pedestrians were observed walking to and from the park, small markets, and to neighbors’ homes.
40% (26) of surveyed Summit View residents say that they bike or walk in or through their neighborhood.
Some roads in Summit View are paved, but the majority is dirt and gravel
7
May 4, 2012
FOOD ACCESSIBILITY
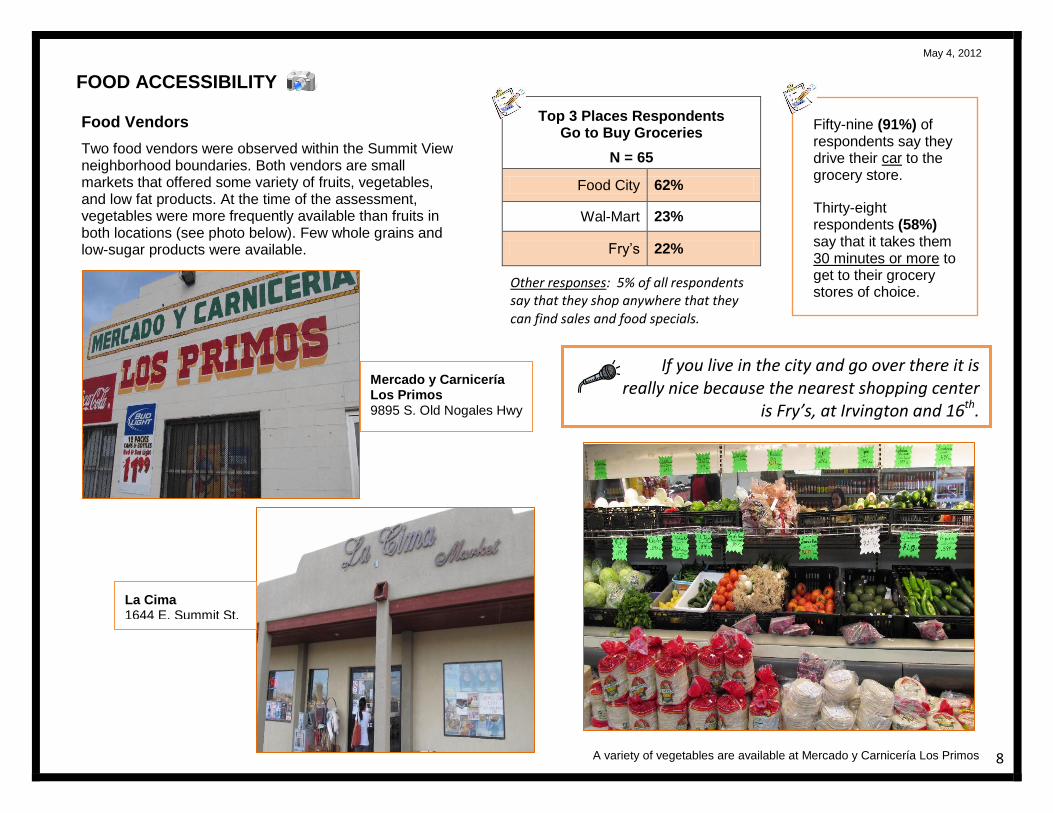
Food Vendors
Two food vendors were observed within the Summit View neighborhood boundaries. Both vendors are small markets that offered some variety of fruits, vegetables, and low fat products. At the time of the assessment, vegetables were more frequently available than fruits in both locations (see photo below). Few whole grains and low-sugar products were available.
Mercado y Carnicería Los Primos 9895 S. Old Nogales Hwy
La Cima 1644 E. Summit St.
A variety of vegetables are available at Mercado y Carnicería Los Primos
Other responses: 5% of all respondents say that they shop anywhere that they can find sales and food specials.
Fifty-nine (91%) of respondents say they drive their car to the grocery store.
Thirty-eight respondents (58%) say that it takes them 30 minutes or more to get to their grocery stores of choice.
If you live in the city and go over there it is really nice because the nearest shopping center
is Fry’s, at Irvington and 16th.
Top 3 Places Respondents Go to Buy Groceries
N = 65
Food City 62%
Wal-Mart 23%
Fry’s 22%
8

May 4, 2012
SOURCES: LocalHarvest. Map-based search engine. Available at: http://www.localharvest.org/. University Physicians Healthcare. University Physicians Hospital. Available at: http://www.uph.org/Hospitals/UPHHospitalatKinoCampus/tabid/84/Default.aspx.
Closest hospital (located approximately 5 miles north of Summit View):
University Physicians Hospital at Kino 2800 E. Ajo Way
Services: Emergency room, pharmacy, laboratory, inpatient/ outpatient surgery, behavioral health, and more.
Health service providers in Summit View:
El Rio Community Health Centers – Summit View School-Based Clinic*
Services: Family practice, pediatrics
*Serves Sunnyside Unified School District students
Farmers’ Markets
NONE WITHIN TARGET AREA
Closest farmers’ market (about 6.5 miles from the Summit View neighborhood):
El Pueblo Farmers’ Market SW corner of Irvington Rd. & 6th Ave. Saturdays 9am - 1pm (year-round) Accepts WIC benefits and Food Stamps
Gardening
60%
14%
Percentage of respondents who would like to grow vegetables, fruit or eggs
(N = 65)
Yes
No
HEALTH SERVICES FOOD SYSTEMS RESOURCES
I think they were planning on starting a garden but didn’t have anyone to take care of it during the
summer.
Obesity is high, people
don’t think, the way
they cook, they don’t
know how or what to
look for.
They need so many
things and one of them
is good information
about health and
nutrition.
N = 65
35% of Summit View residents surveyed have a
garden where they can grow their own food or know a
neighbor who does.
55% of respondents said that it is possible for them to
produce fruits, vegetables or eggs.
18% of residents surveyed
said that Home/ Community Gardens would help their
families eat more fresh fruit and vegetables.
9

May 4, 2012
SOURCE: Arizona Department of Education. Child Nutrition Programs. Tables SY2009, SY2010. Available at: http://www.ade/state.az.us/health-safety/cnp/frpercentages/.
SCHOOLS & CHILD CARE
Child Care
A Reliable Day Care
Little Stars Day Care
Los Potrillos
Summit View Head Start 10170 S. Epperson Lane
Schools
Summit View Elementary School
Children and youth who reside in Summit View attend schools in Sunnyside Unified School District (SUSD). One SUSD public school (Summit View Elementary) is located within the target area boundaries. Enrollment at this school is 600 students, and 89% of these students qualified for free or reduced lunch status in March 2010.
FAITH-BASED ORGANIZATIONS
COMMUNITY ORGANIZATIONS
There is a program that will start very soon with
Summit View Elementary that I was notified about
today by our PTA and they are going to start a
program and they are bringing somebody from the
Food Bank. I hear that there are things starting
right now. Iglesia Pentecostes Nuevo Pacto (located across from Summit View Elementary School)
10

May 4, 2012
SOURCE: U.S. Census Bureau. 2005-2009 American Community Survey 5-Year Estimates. Available at: http://factfinder.census.gov.
COMMUNITY STRESS INDICATORS COMMUNITY CONCERNS
Poverty
In Summit View, proportions of individuals and families living below the poverty level are greater than in Pima County.
Crime
No data is available for Summit View.
Percent whose income in the past 12 months is below poverty level
Summit View
Pima County
U.S.
All People 25.8% 15.7% 13.5%
18 years and over 18.6% 13.8% 11.8%
65 years and over 10.7% 8.4% 9.8%
Related children under 18 years 37.6% 21.6% 18.2%
Related children 5 to 17 years 36.8% 19.6% 16.9%
Families 24.1% 10.7% 9.9%
With related children under 18 years
33.7% 17.6% 15.3%
With related children under 5 years
13.6% 19.4% 16.6%
Families with female householder, no husband present
27.5% 27.5% 28.7%
With related children under 18 years
42.2% 35.5% 37.1%
Vandalism along a road in Summit View
It is very rural; it does not look like it is part of the U.S. It is calm and quiet, there are no traffic lights and it is very dark… Some of the students are comfortable where they are and the other half is not comfortable.
I remember hearing on the radio that they would arrest you if you were undocumented and students would come to school late and I would say, “What happened?” And they would say, “Oh, there are so many cops around I was afraid to go out.”
75%
71%
69%
44%
45%
0 10 20 30 40 50 60
Garbage in streets/on sidewalks
Stray dogs
Ugly, unimproved routes
Traffic speed
Abandoned furniture on sidewalks
Top 5 Concerns When Outside N = 65
11

May 4, 2012
SOURCE: U.S. Census Bureau – Census 2000. Available at http://factfinder.census.gov.
NEIGHBORHOOD PRIORITIES
77%
66%
58%
50%
37%
0 10 20 30 40 50 60
Night Lighting
Better Flood Control
Cleaner Washes
Walking Paths/Sidewalks
More Police
Top 5 Desired Neighborhood Improvements (N = 65) Other desired improvements of surveyed
residents:
Playgrounds (35%) More Speed Bumps (34%) Ball Fields (34%) Grocery Stores (32%) More trees (29%) Crosswalks (29%) Parks (18%) More Neighborhood Events (18%) Community Gardens (16%)
Additional survey responses for healthy activities:
Provide education and information on urban farming and chickens so we can produce our own food (44%)
Establish a community garden (43%) Provide recipes for quick meal preparation using
seasonal vegetables (43%) Provide technical assistance for vegetable growing
and water-harvesting (37%) Establish and enforce standards of cleanliness for the
stores in our community (28%)
69%
52%
54%
49%
49%
0 10 20 30 40 50
Public transportation to large supermarkets
Start a farmers' market in the community
Bring stores closer to our homes
Make low-cost cooking/nutrition classes available
Get the foods we want available in local community stores
Top 5 ways Summit View residents think would help their community eat healthier
(N = 65)
12

May 4, 2012
SOURCE: U.S. Census Bureau – Census 2000. Available at http://factfinder.census.gov.
COMMUNITY OPPORTUNITIES
An after-school sports activity at Summit View Elementary School
Mailboxes in Summit View are often clustered into groups, such as this group outside of La Cima market. Because residents likely visit there daily, this could be a great opportunity for
health promotion.
Sustainability
Maintaining the park Creating and maintaining a community
garden and farmers’ market Community Involvement
We need to organize ourselves and clean the park.
Other students want to make changes but they don’t know how or where to begin
At the elementary school, they need a lot of things. They need a parking lot for the parents and they need more activities.
Tapping into Resources
We should think about the things that we have and how we can use them. We have a park and we should use them. Education and information opens everyone’s eyes
13