summer flounder review of 2015 management measures august 13, 2014
TRANSCRIPT

Summer Flounder
Review of 2015 Management Measures
August 13, 2014
Overview
Last year: 2014-2015 specifications set for summer flounder
Review fishery performance
Review implemented 2015 specifications
Timeline
July 1: Advisory Panel meets to develop Fishery Performance Reports
July 23: SSC meets to review ABC recommendations
July 25: Monitoring Committee webinar to review ACTs and management measures
Stock Status
2013 benchmark stock assessment (SAW/SARC 57)–age-structured assessment program
(ASAP)
Not overfished and overfishing not occurring in 2012
2014 data update (landings, discards, and survey indices)
Fishing Mortality
19
82
19
84
19
86
19
88
19
90
19
92
19
94
19
96
19
98
20
00
20
02
20
04
20
06
20
08
20
10
20
12
0
5,000
10,000
15,000
20,000
25,000
30,000
0.0
0.2
0.4
0.6
0.8
1.0
1.2
1.4
1.6
1.8
2.0
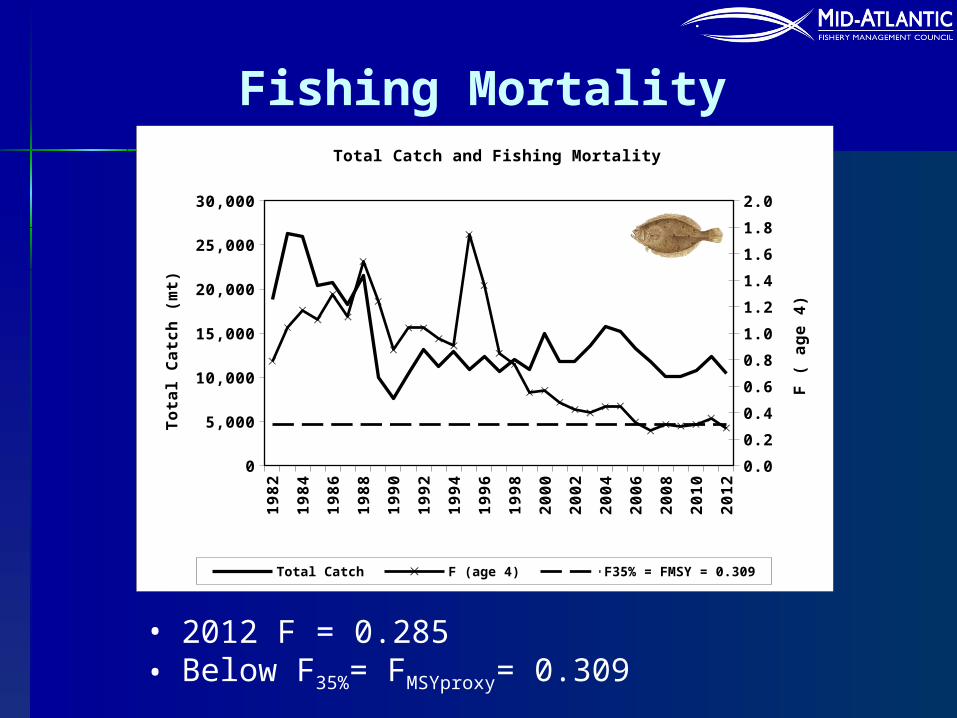
Total Catch and Fishing Mortality
Total Catch F (age 4) F35% = FMSY = 0.309
To
tal C
atc
h (
mt)
F (
ag
e 4
)
• 2012 F = 0.285• Below F35%= FMSYproxy= 0.309
Biomass
19
82
19
84
19
86
19
88
19
90
19
92
19
94
19
96
19
98
20
00
20
02
20
04
20
06
20
08
20
10
20
12
0
10,000
20,000
30,000
40,000
50,000
60,000
70,000
0
20,000
40,000
60,000
80,000
100,000
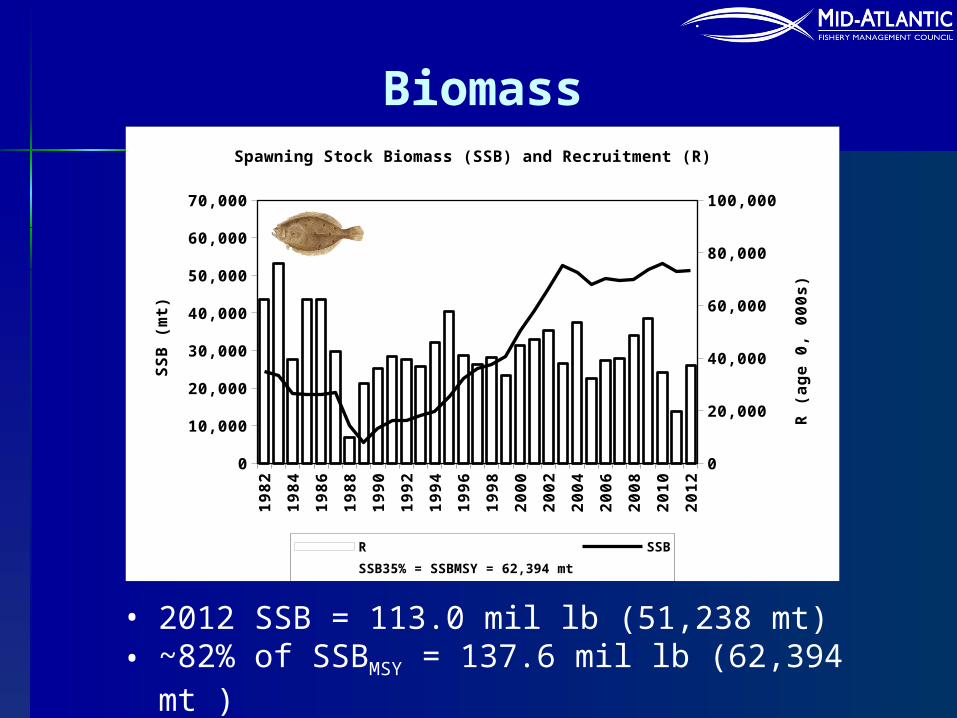
Spawning Stock Biomass (SSB) and Recruitment (R)
R SSB
SSB35% = SSBMSY = 62,394 mt
SS
B (
mt)
R (
ag
e 0
, 00
0s
)
• 2012 SSB = 113.0 mil lb (51,238 mt)• ~82% of SSBMSY = 137.6 mil lb (62,394 mt )
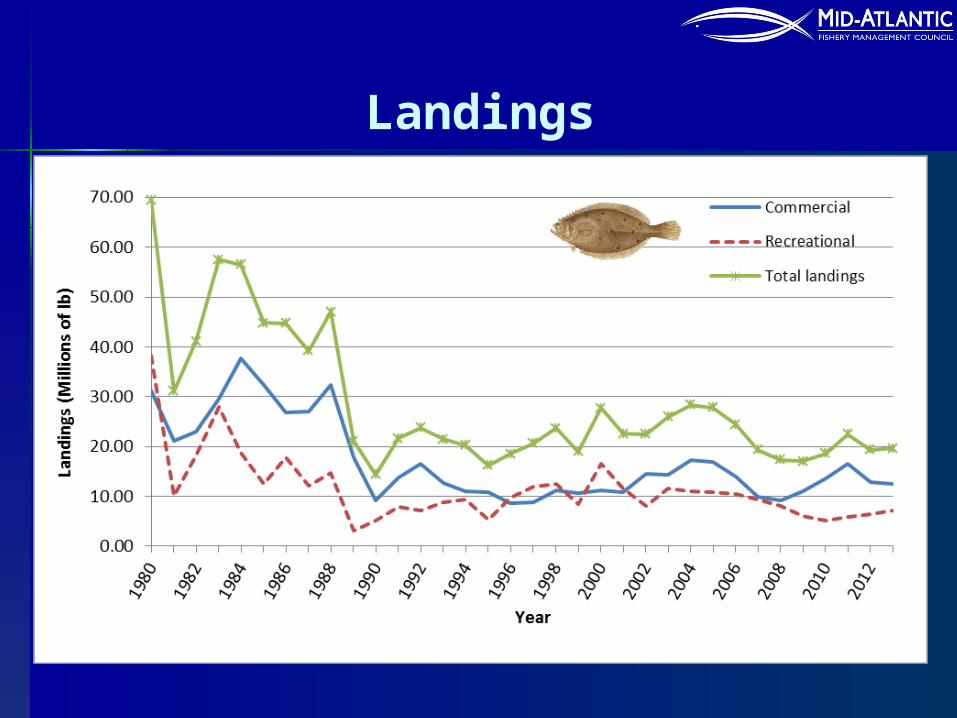
Landings
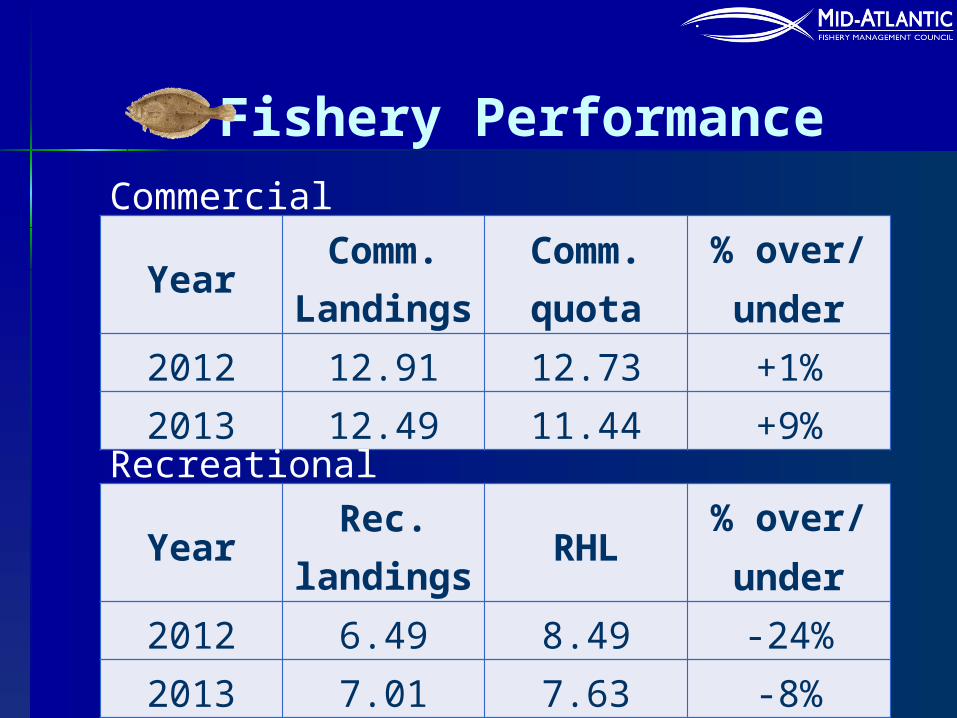
Fishery Performance
YearComm. Landing
s
Comm. quota
% over/under
2012 12.91 12.73 +1%2013 12.49 11.44 +9%
YearRec.
landingsRHL
% over/under
2012 6.49 8.49 -24%2013 7.01 7.63 -8%
Commercial
Recreational
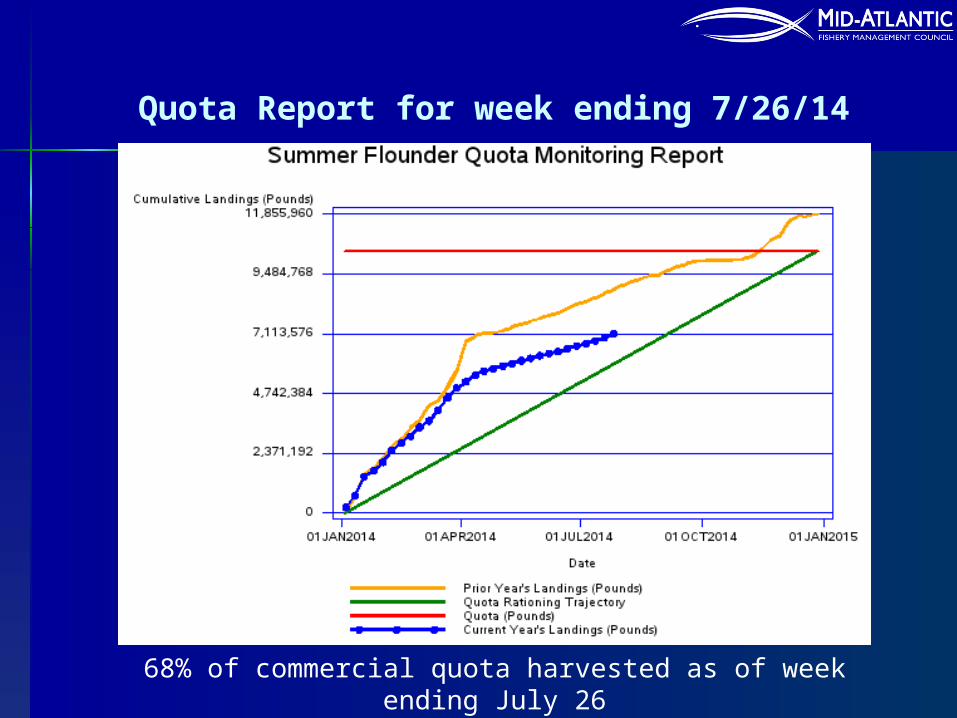
Quota Report for week ending 7/26/14
68% of commercial quota harvested as of week ending July 26
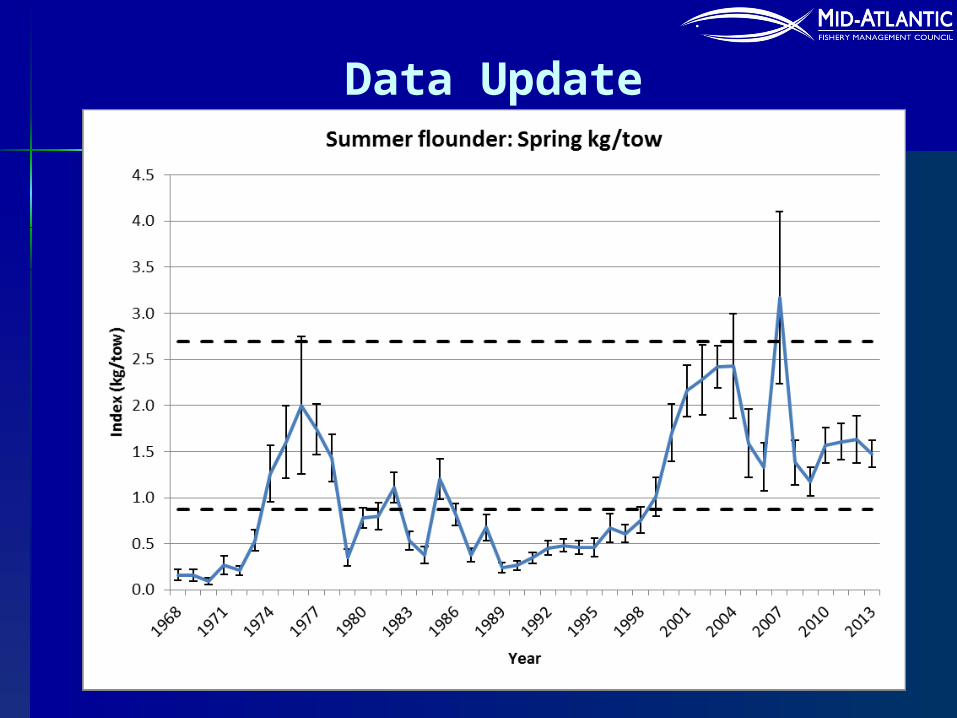
Data Update

Data Update

Data UpdateChesMMap and NEAMAP Trawl Surveys
Year
1975 1980 1985 1990 1995 2000 2005 2010 2015
Ch
es
MM
ap
Nu
mb
er/
tow
0
50
100
150
200
NE
AM
AP
Nu
mb
er/
tow
0
1
2
3
4
5
6
ChesMMap NEAMAP Spr NEAMAP Fall

AP Fishery Performance Report
Lack of confidence in MRIP estimates–Believe recent effort reductions not
captured by outdated effort surveys–New effort methodology should be
implemented immediately
Have seen recreational effort shifts by state due to regional conservation equivalency regs.
AP Fishery Performance Report
Concern about high size limits resulting in high fishing pressure on large females
Closure of Oregon Inlet drastically affecting commercial landings in NC
Commercial effort shifts away from southern states due to management measures (TED requirements in NC)
AP Fishery Performance Report
Research plan comments:
–Research into different hook types to reduce recreational discard mortality
–Explore uses of smartphone applications/other technology for voluntary angler surveys
Regulatory Review
September 2013 SSC review (benchmark stock assessment)
Level 3 assessment designation
2014-2016 ABC recommendations based on stock projections and Council risk policy (see staff memo)
Council and Board: 2014-2015 ABC recommendation
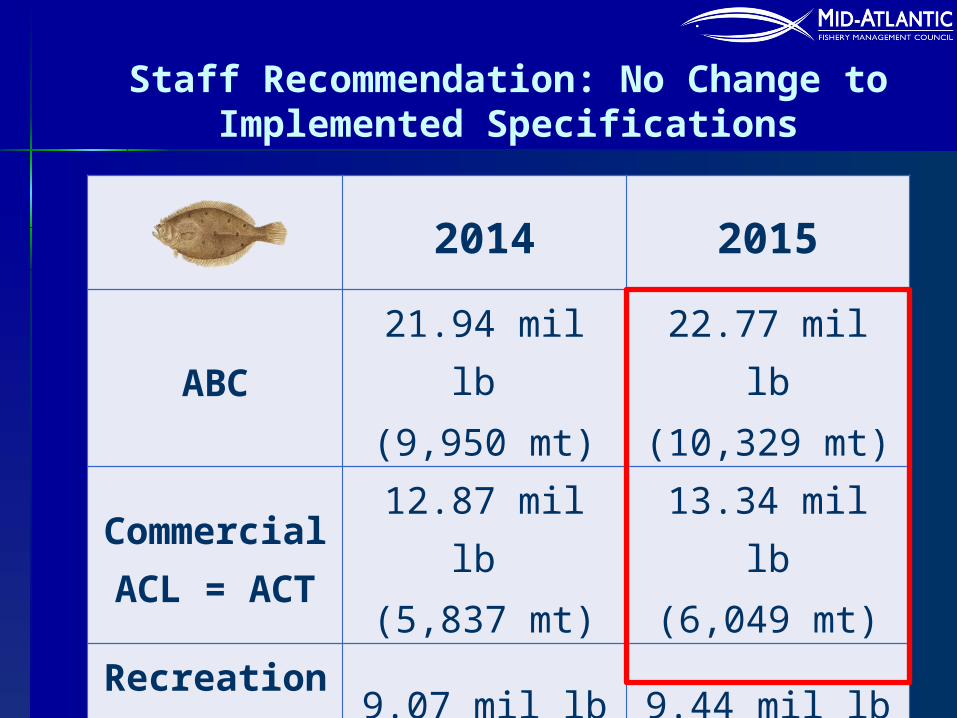
2014 2015
ABC21.94 mil lb (9,950 mt)
22.77 mil lb(10,329 mt)
Commercial ACL =
ACT
12.87 mil lb (5,837 mt)
13.34 mil lb(6,049 mt)
Recreational ACL =
ACT
9.07 mil lb (4,113 mt)
9.44 mil lb (4,280 mt)
Staff Recommendation: No Change to Implemented Specifications
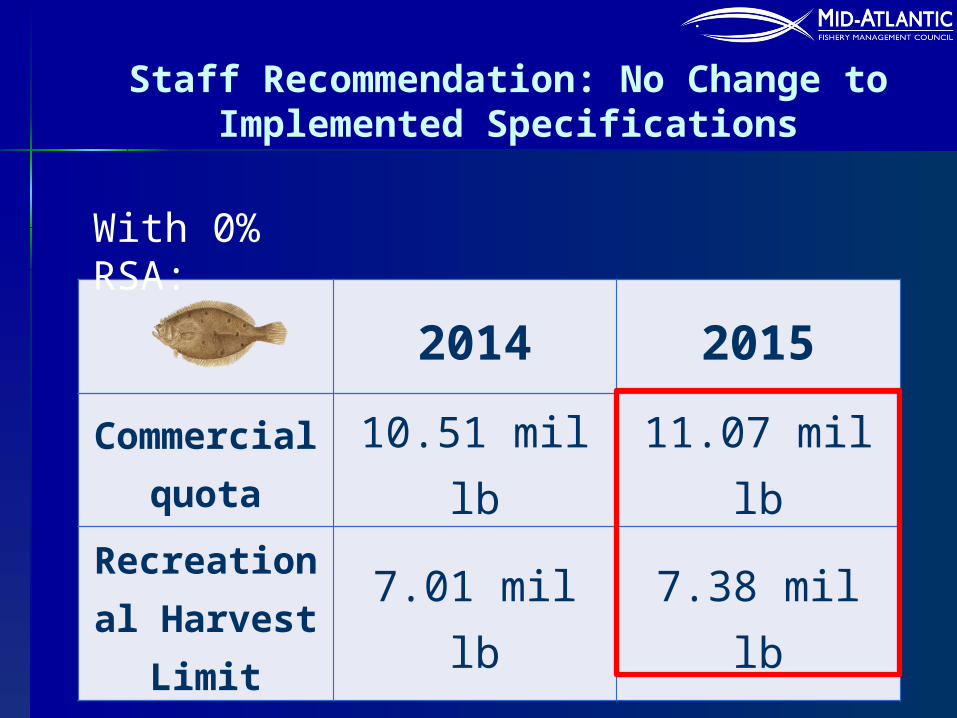
Staff Recommendation: No Change to Implemented Specifications
2014 2015
Commercial quota
10.51 mil lb 11.07 mil lb
Recreational Harvest
Limit7.01 mil lb 7.38 mil lb
With 0% RSA:

Staff Recommendation
No changes to 2015 Annual Catch Targets (ACTs), commercial minimum fish size (14-inch total length), gear requirements, or exemption programs
SSC
No compelling evidence to warrant a change to the recommended 2015 ABC

Monitoring Committee
No recommended changes to 2015 ACTs or management measures
Questions?