summative evaluation report: seminole county public ......jul 28, 2016 · summative evaluation...
TRANSCRIPT
1
21st CCLC Community Learning Centers
Summative Evaluation Report:
Seminole County Public Schools – Middle (South)
July 28, 2016, 2016
Kaitlin Trippany
This work is funded through a contract with the Florida Department of Education
[590-2446B-6CCC6]
2
TABLE OF CONTENTS Section Page ACKNOWLEDGEMENTS 3 1.0 OVERVIEW AND HISTORY 4
2.0 STUDENT CHARATERISTICS 5 3.0 PROGRAM OPERATIONS 8 4.0 STAFF CHARACTERISTICS 8
5.0 OBJECTIVES AND OUTCOMES 10 6.0 PROGRESS TOWARD SUSTAINABILITY 13 7.0 LESSONS LEARNED AND RECOMMENDATIONS 14

3
ACKNOWLEDGEMENTS Special thanks should be given to the following individuals for helping implement this grant during the 2015-2016 school year. Project Administrators:
Ms. Pattie Reda, Site Coordinator for the 21st Century Community Learning Centers – Led the implementation of the grants at three sites. Ms. Taucier Smalls-West, Coordinator of Special Projects/Title I (Instructional Support) and Project Director for all 21st CCLC programs in Seminole County Public Schools – Provided administrative oversight.
Ms. Jamee Minnetto, Resource Development Coordinator, Seminole County Public Schools – Supported the implementation of the grant through grant writing, budget planning, and compliance.
Site Principals:
Principals at the Greenwood Lakes, Milwee, and South Seminole 21st Century Community Learning Centers – Supported the implementation of the grant by providing on-going collaboration at each site.
4
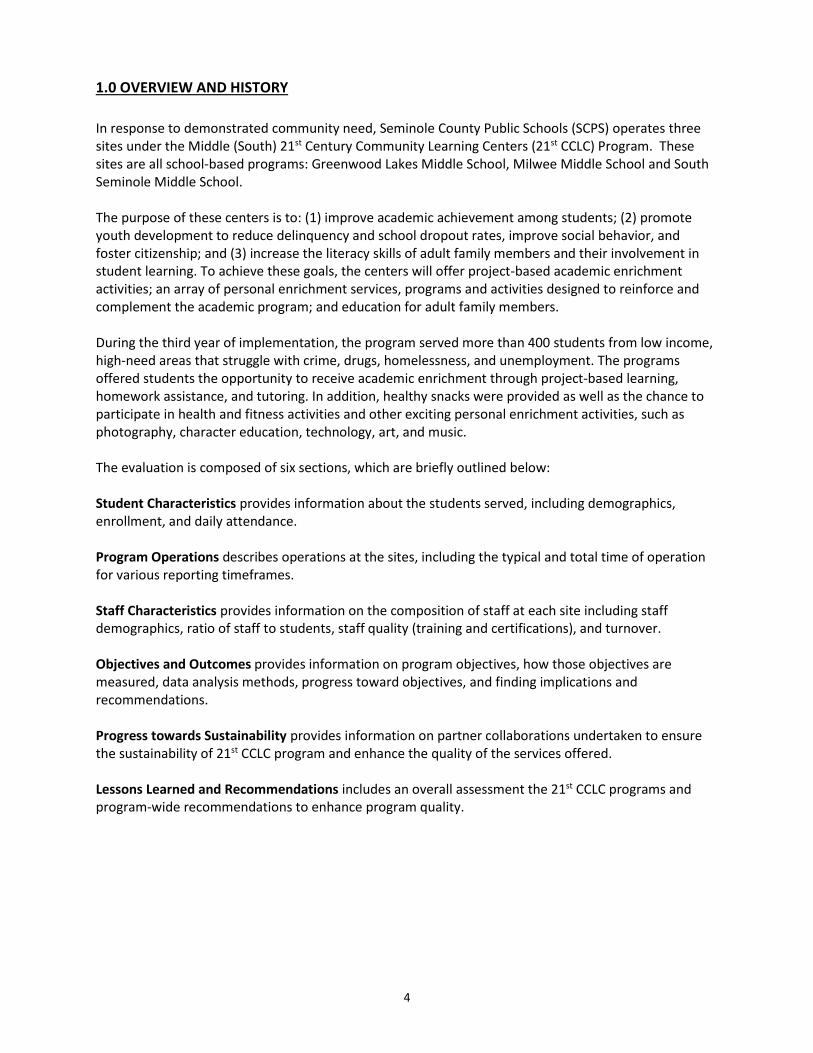
1.0 OVERVIEW AND HISTORY
In response to demonstrated community need, Seminole County Public Schools (SCPS) operates three sites under the Middle (South) 21st Century Community Learning Centers (21st CCLC) Program. These sites are all school-based programs: Greenwood Lakes Middle School, Milwee Middle School and South Seminole Middle School. The purpose of these centers is to: (1) improve academic achievement among students; (2) promote youth development to reduce delinquency and school dropout rates, improve social behavior, and foster citizenship; and (3) increase the literacy skills of adult family members and their involvement in student learning. To achieve these goals, the centers will offer project-based academic enrichment activities; an array of personal enrichment services, programs and activities designed to reinforce and complement the academic program; and education for adult family members. During the third year of implementation, the program served more than 400 students from low income, high-need areas that struggle with crime, drugs, homelessness, and unemployment. The programs offered students the opportunity to receive academic enrichment through project-based learning, homework assistance, and tutoring. In addition, healthy snacks were provided as well as the chance to participate in health and fitness activities and other exciting personal enrichment activities, such as photography, character education, technology, art, and music. The evaluation is composed of six sections, which are briefly outlined below: Student Characteristics provides information about the students served, including demographics, enrollment, and daily attendance. Program Operations describes operations at the sites, including the typical and total time of operation for various reporting timeframes. Staff Characteristics provides information on the composition of staff at each site including staff demographics, ratio of staff to students, staff quality (training and certifications), and turnover. Objectives and Outcomes provides information on program objectives, how those objectives are measured, data analysis methods, progress toward objectives, and finding implications and recommendations. Progress towards Sustainability provides information on partner collaborations undertaken to ensure the sustainability of 21st CCLC program and enhance the quality of the services offered. Lessons Learned and Recommendations includes an overall assessment the 21st CCLC programs and program-wide recommendations to enhance program quality.
5
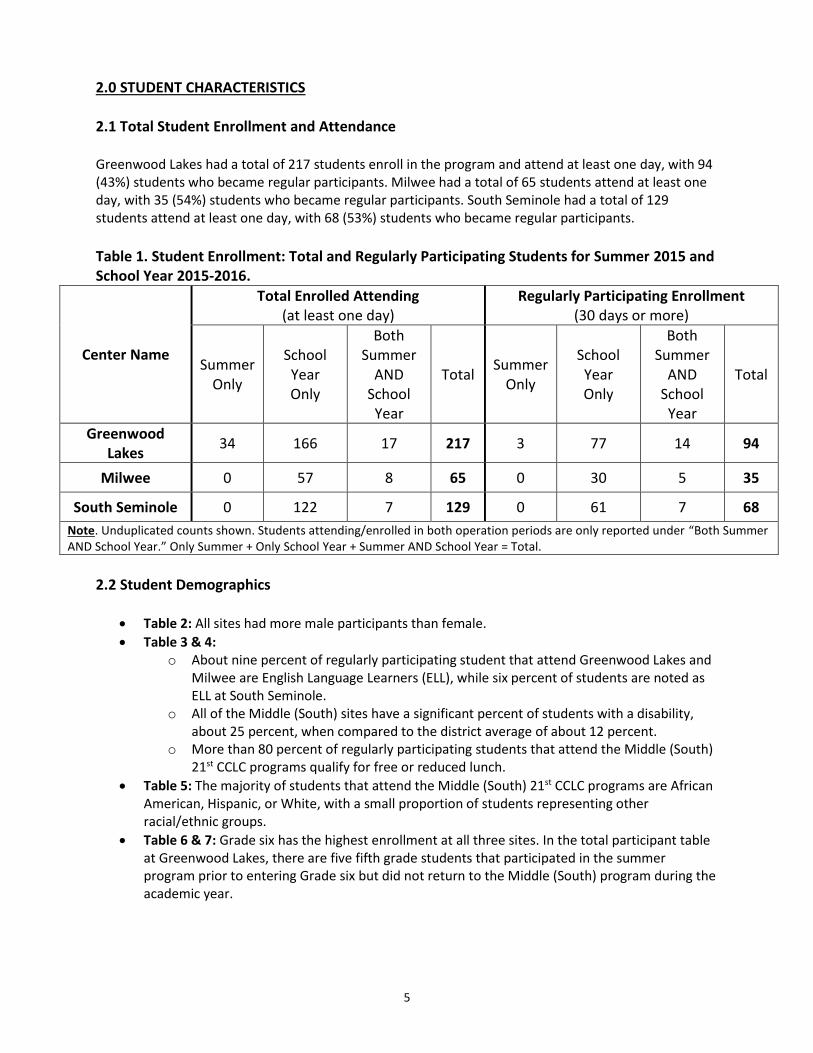
2.0 STUDENT CHARACTERISTICS 2.1 Total Student Enrollment and Attendance Greenwood Lakes had a total of 217 students enroll in the program and attend at least one day, with 94 (43%) students who became regular participants. Milwee had a total of 65 students attend at least one day, with 35 (54%) students who became regular participants. South Seminole had a total of 129 students attend at least one day, with 68 (53%) students who became regular participants.
Table 1. Student Enrollment: Total and Regularly Participating Students for Summer 2015 and School Year 2015-2016.
Center Name
Total Enrolled Attending (at least one day)
Regularly Participating Enrollment (30 days or more)
Summer Only
School Year Only
Both Summer
AND School Year
Total Summer
Only
School Year Only
Both Summer
AND School Year
Total
Greenwood Lakes
34 166 17 217 3 77 14 94
Milwee 0 57 8 65 0 30 5 35
South Seminole 0 122 7 129 0 61 7 68
Note. Unduplicated counts shown. Students attending/enrolled in both operation periods are only reported under “Both Summer AND School Year.” Only Summer + Only School Year + Summer AND School Year = Total.
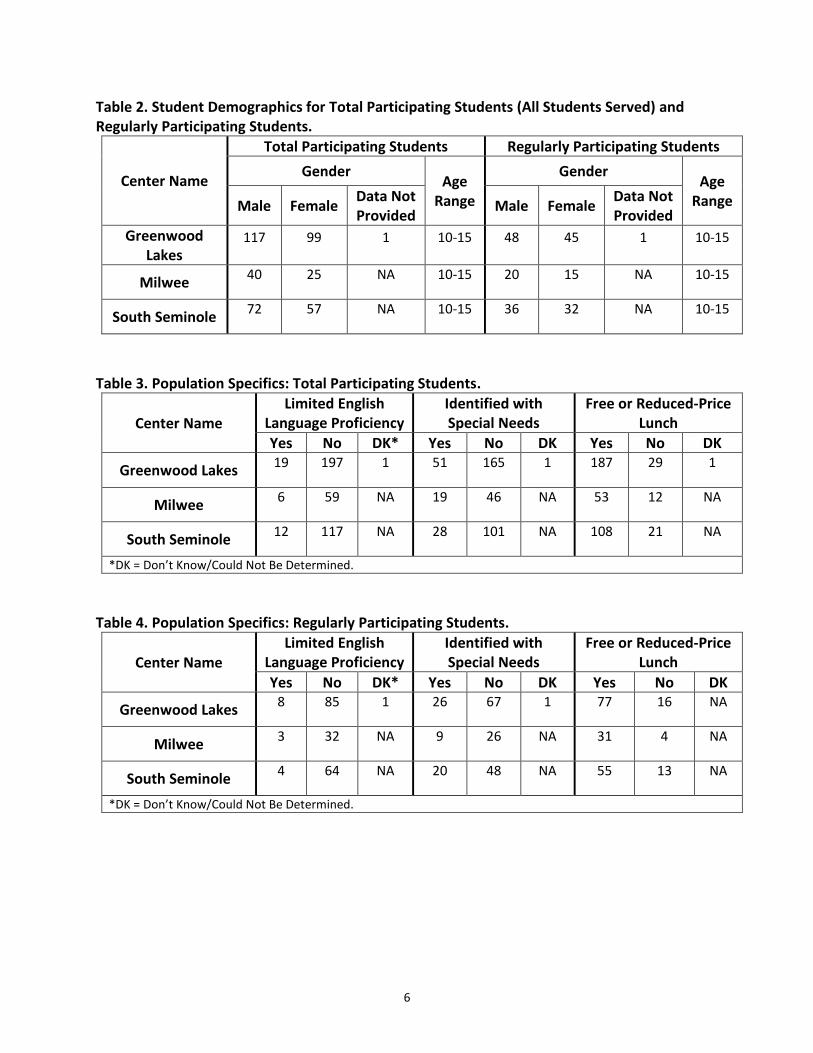
2.2 Student Demographics
Table 2: All sites had more male participants than female.
Table 3 & 4: o About nine percent of regularly participating student that attend Greenwood Lakes and
Milwee are English Language Learners (ELL), while six percent of students are noted as ELL at South Seminole.
o All of the Middle (South) sites have a significant percent of students with a disability, about 25 percent, when compared to the district average of about 12 percent.
o More than 80 percent of regularly participating students that attend the Middle (South) 21st CCLC programs qualify for free or reduced lunch.
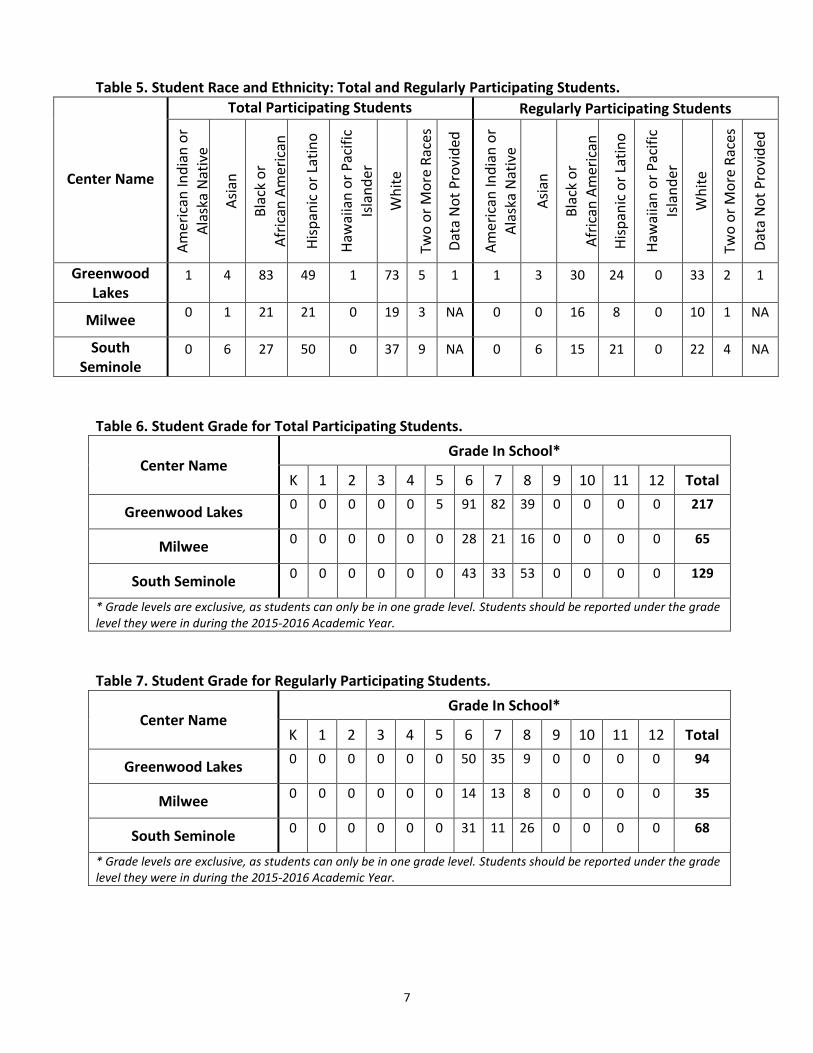
Table 5: The majority of students that attend the Middle (South) 21st CCLC programs are African American, Hispanic, or White, with a small proportion of students representing other racial/ethnic groups.
Table 6 & 7: Grade six has the highest enrollment at all three sites. In the total participant table at Greenwood Lakes, there are five fifth grade students that participated in the summer program prior to entering Grade six but did not return to the Middle (South) program during the academic year.
6
Table 2. Student Demographics for Total Participating Students (All Students Served) and Regularly Participating Students.
Center Name
Total Participating Students Regularly Participating Students
Gender Age
Range
Gender Age
Range Male Female Data Not Provided
Male Female Data Not Provided
Greenwood Lakes
117 99 1 10-15 48 45 1 10-15
Milwee 40 25 NA 10-15 20 15 NA 10-15
South Seminole 72 57 NA 10-15 36 32 NA 10-15
Table 3. Population Specifics: Total Participating Students.
Center Name Limited English
Language Proficiency Identified with Special Needs
Free or Reduced-Price Lunch
Yes No DK* Yes No DK Yes No DK
Greenwood Lakes 19 197 1 51 165 1 187 29 1
Milwee 6 59 NA 19 46 NA 53 12 NA
South Seminole 12 117 NA 28 101 NA 108 21 NA
*DK = Don’t Know/Could Not Be Determined.
Table 4. Population Specifics: Regularly Participating Students.
Center Name Limited English
Language Proficiency Identified with Special Needs
Free or Reduced-Price Lunch
Yes No DK* Yes No DK Yes No DK
Greenwood Lakes 8 85 1 26 67 1 77 16 NA
Milwee 3 32 NA 9 26 NA 31 4 NA
South Seminole 4 64 NA 20 48 NA 55 13 NA
*DK = Don’t Know/Could Not Be Determined.
7
Table 5. Student Race and Ethnicity: Total and Regularly Participating Students.
Center Name
Total Participating Students Regularly Participating Students
Am
eri
can
Ind
ian
or
Ala
ska
Nat
ive
Asi
an
Bla
ck o
r
Afr
ican
Am
eri
can
His
pan
ic o
r La
tin
o
Haw
aiia
n o
r P
acif
ic
Isla
nd
er
Wh
ite
Two
or
Mo
re R
aces
Dat
a N
ot
Pro
vid
ed
Am
eri
can
Ind
ian
or
Ala
ska
Nat
ive
Asi
an
Bla
ck o
r
Afr
ican
Am
eri
can
His
pan
ic o
r La
tin
o
Haw
aiia
n o
r P
acif
ic
Isla
nd
er
Wh
ite
Two
or
Mo
re R
aces
Dat
a N
ot
Pro
vid
ed
Greenwood Lakes
1 4 83 49 1 73 5 1 1 3 30 24 0 33 2 1
Milwee 0 1 21 21 0 19 3 NA 0 0 16 8 0 10 1 NA
South Seminole
0 6 27 50 0 37 9 NA 0 6 15 21 0 22 4 NA
Table 6. Student Grade for Total Participating Students.
Center Name Grade In School*
K 1 2 3 4 5 6 7 8 9 10 11 12 Total
Greenwood Lakes 0 0 0 0 0 5 91 82 39 0 0 0 0 217
Milwee 0 0 0 0 0 0 28 21 16 0 0 0 0 65
South Seminole 0 0 0 0 0 0 43 33 53 0 0 0 0 129
* Grade levels are exclusive, as students can only be in one grade level. Students should be reported under the grade level they were in during the 2015-2016 Academic Year. Table 7. Student Grade for Regularly Participating Students.
Center Name Grade In School*
K 1 2 3 4 5 6 7 8 9 10 11 12 Total
Greenwood Lakes 0 0 0 0 0 0 50 35 9 0 0 0 0 94
Milwee 0 0 0 0 0 0 14 13 8 0 0 0 0 35
South Seminole 0 0 0 0 0 0 31 11 26 0 0 0 0 68
* Grade levels are exclusive, as students can only be in one grade level. Students should be reported under the grade level they were in during the 2015-2016 Academic Year.
8
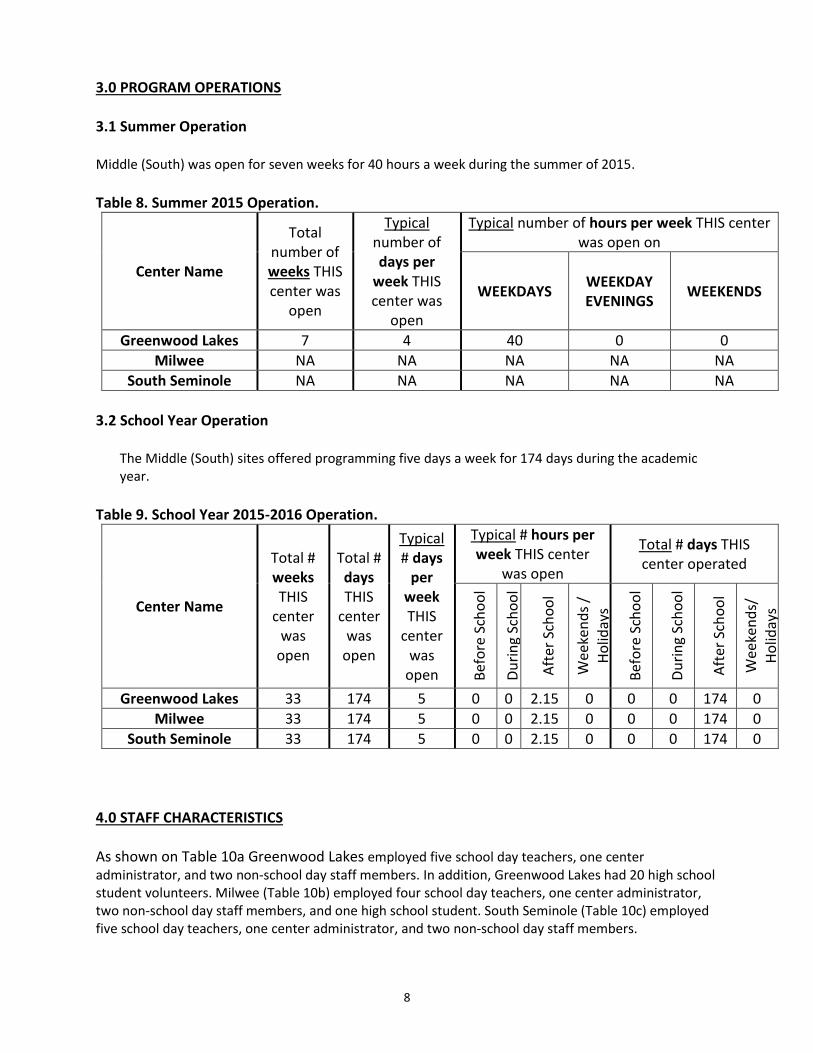
3.0 PROGRAM OPERATIONS 3.1 Summer Operation Middle (South) was open for seven weeks for 40 hours a week during the summer of 2015.
Table 8. Summer 2015 Operation.
Center Name
Total number of weeks THIS center was
open
Typical number of days per
week THIS center was
open
Typical number of hours per week THIS center was open on
WEEKDAYS WEEKDAY EVENINGS
WEEKENDS
Greenwood Lakes 7 4 40 0 0
Milwee NA NA NA NA NA
South Seminole NA NA NA NA NA
3.2 School Year Operation
The Middle (South) sites offered programming five days a week for 174 days during the academic year.
Table 9. School Year 2015-2016 Operation.
Center Name
Total # weeks THIS
center was
open
Total # days THIS
center was
open
Typical # days
per week THIS
center was
open
Typical # hours per week THIS center
was open
Total # days THIS center operated
Bef
ore
Sch
oo
l
Du
rin
g Sc
ho
ol
Aft
er S
cho
ol
Wee
ken
ds
/ H
olid
ays
Bef
ore
Sch
oo
l
Du
rin
g Sc
ho
ol
Aft
er S
cho
ol
Wee
ken
ds/
H
olid
ays
Greenwood Lakes 33 174 5 0 0 2.15 0 0 0 174 0
Milwee 33 174 5 0 0 2.15 0 0 0 174 0
South Seminole 33 174 5 0 0 2.15 0 0 0 174 0
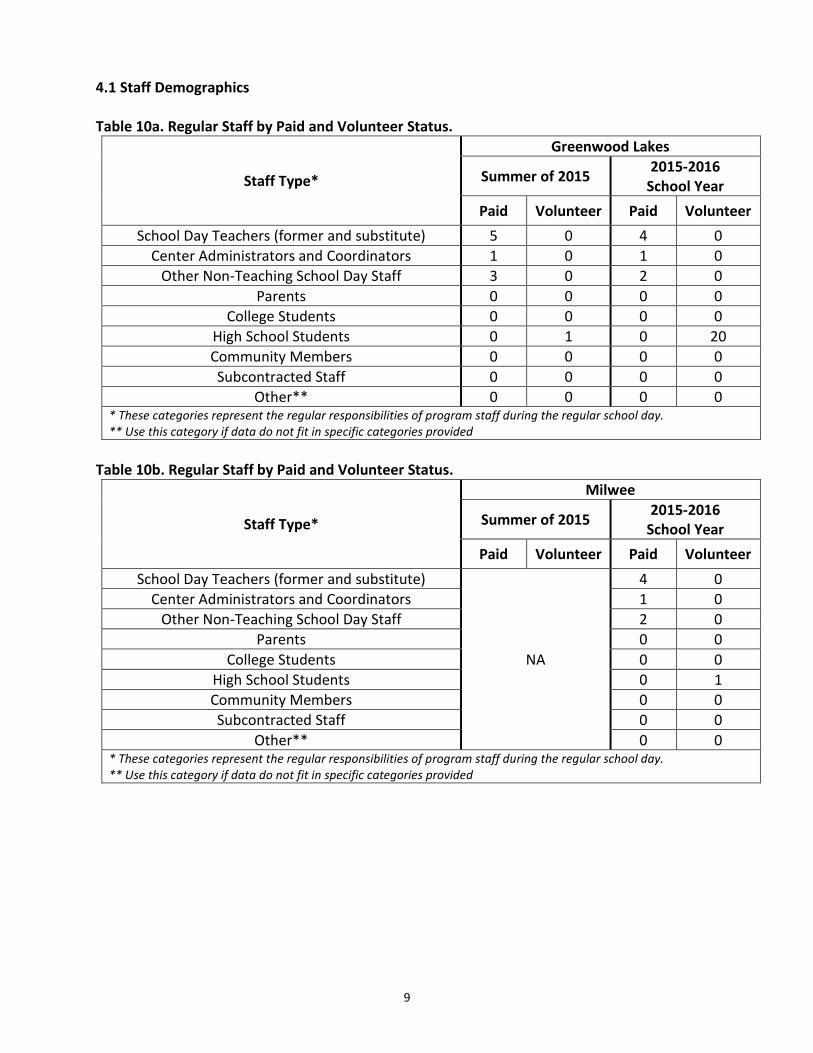
4.0 STAFF CHARACTERISTICS As shown on Table 10a Greenwood Lakes employed five school day teachers, one center administrator, and two non-school day staff members. In addition, Greenwood Lakes had 20 high school student volunteers. Milwee (Table 10b) employed four school day teachers, one center administrator, two non-school day staff members, and one high school student. South Seminole (Table 10c) employed five school day teachers, one center administrator, and two non-school day staff members.
9
4.1 Staff Demographics Table 10a. Regular Staff by Paid and Volunteer Status.
Staff Type*
Greenwood Lakes
Summer of 2015 2015-2016
School Year
Paid Volunteer Paid Volunteer
School Day Teachers (former and substitute) 5 0 4 0
Center Administrators and Coordinators 1 0 1 0
Other Non-Teaching School Day Staff 3 0 2 0
Parents 0 0 0 0
College Students 0 0 0 0
High School Students 0 1 0 20
Community Members 0 0 0 0
Subcontracted Staff 0 0 0 0
Other** 0 0 0 0 * These categories represent the regular responsibilities of program staff during the regular school day. ** Use this category if data do not fit in specific categories provided
Table 10b. Regular Staff by Paid and Volunteer Status.
Staff Type*
Milwee
Summer of 2015 2015-2016
School Year
Paid Volunteer Paid Volunteer
School Day Teachers (former and substitute)
NA
4 0
Center Administrators and Coordinators 1 0
Other Non-Teaching School Day Staff 2 0
Parents 0 0
College Students 0 0
High School Students 0 1
Community Members 0 0
Subcontracted Staff 0 0
Other** 0 0 * These categories represent the regular responsibilities of program staff during the regular school day. ** Use this category if data do not fit in specific categories provided

10
Table 10c. Regular Staff by Paid and Volunteer Status.
Staff Type*
South Seminole
Summer of 2015 2015-2016
School Year
Paid Volunteer Paid Volunteer
School Day Teachers (former and substitute)
NA
5 0
Center Administrators and Coordinators 1 0
Other Non-Teaching School Day Staff 2 0
Parents 0 0
College Students 0 0
High School Students 0 0
Community Members 0 0
Subcontracted Staff 0 0
Other** 0 0 * These categories represent the regular responsibilities of program staff during the regular school day. ** Use this category if data do not fit in specific categories provided
4.2 Student-to-Staff Ratio All sites operated with 12:1 student-to-staff ratio for academic enrichment and an 18:1 student-to-staff
ratio for personal enrichment (non-academic). This ratio was consistent throughout the 2015-16
program year. Parents and community member volunteers were scheduled regularly to enhance the
student to staff ratios when possible.
4.3 Staff Training All sites conducted monthly staff meetings that included professional development. The professional development covered topics such as classroom management, behavior modification, student character development, project-based learning, and curricular and instruction adjustments and refinement. The district project director provided (or brought in others to provide) regular training about curriculum, transition to common core standards, and the use of data to improve programming in order to support the professional growth of the Site Coordinator. The Site Coordinator and Lead Teachers then disseminated applicable information received from seminars, monthly district Site Coordinator leadership meetings, and community resources to site staff.
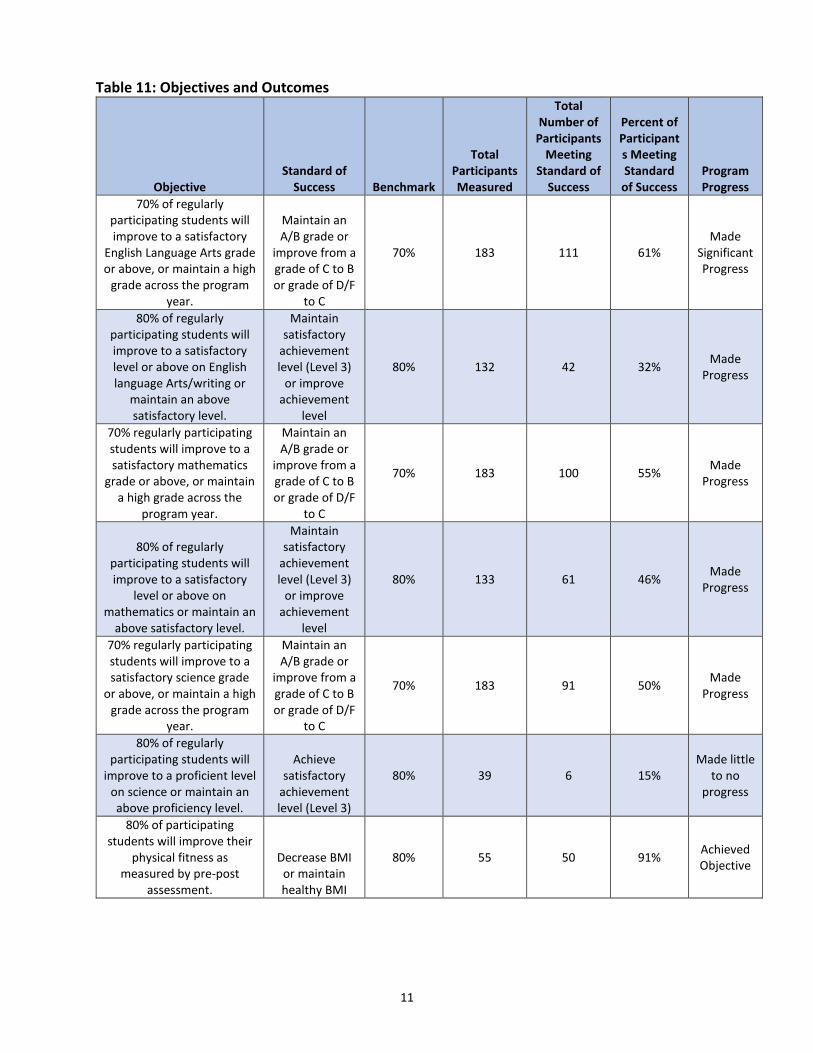
5.0 OBJECTIVES and OUTCOMES 5.1 Objective Assessment Table 11 displays Middle (South) objectives and progress toward meeting the objectives.
11
Table 11: Objectives and Outcomes
Objective Standard of
Success Benchmark
Total Participants Measured
Total Number of
Participants Meeting
Standard of Success
Percent of Participants Meeting Standard
of Success Program Progress
70% of regularly participating students will improve to a satisfactory
English Language Arts grade or above, or maintain a high
grade across the program year.
Maintain an A/B grade or
improve from a grade of C to B or grade of D/F
to C
70% 183 111 61% Made
Significant Progress
80% of regularly participating students will improve to a satisfactory level or above on English language Arts/writing or
maintain an above satisfactory level.
Maintain satisfactory
achievement level (Level 3)
or improve achievement
level
80% 132 42 32% Made
Progress
70% regularly participating students will improve to a satisfactory mathematics
grade or above, or maintain a high grade across the
program year.
Maintain an A/B grade or
improve from a grade of C to B or grade of D/F
to C
70% 183 100 55% Made
Progress
80% of regularly participating students will improve to a satisfactory
level or above on mathematics or maintain an
above satisfactory level.
Maintain satisfactory
achievement level (Level 3)
or improve achievement
level
80% 133 61 46% Made
Progress
70% regularly participating students will improve to a satisfactory science grade
or above, or maintain a high grade across the program
year.
Maintain an A/B grade or
improve from a grade of C to B or grade of D/F
to C
70% 183 91 50% Made
Progress
80% of regularly participating students will
improve to a proficient level on science or maintain an above proficiency level.
Achieve satisfactory
achievement level (Level 3)
80% 39 6 15% Made little
to no progress
80% of participating students will improve their
physical fitness as measured by pre-post
assessment.
Decrease BMI or maintain healthy BMI
80% 55 50 91% Achieved Objective

12
Objective Standard of
Success Benchmark
Total Participants Measured
Total Number of
Participants Meeting
Standard of Success
Percent of Participants Meeting Standard
of Success Program Progress
50% of participating students will improve their
disciplinary problems as measured by school/district
records
Decrease discipline
referrals from Q4 to Q2
50% 193 156 81% Achieved Objective
80% of participating students will improve their
engagement in career exploration as measured by
surveys
Increase score on survey by 1
or maintain 100%
80% 39 21 54% Made
Progress
50% of participating family members will improve their
involvement in student education as measured by a
parent survey.
Increase score on survey by 1
or maintain 100%
50% 13 6 46% Made
Significant Progress
5.2 Other Findings Family members responded very favorably to the majority of questions on the end-of-year survey. Most family members (about 75 percent) were very satisfied or satisfied with all aspects of the programs. All family member respondents would sign their child up for the program in the future and recommend the program to others. However, there were only 12 family member respondents, so it may not be a representative sample. Students also felt that the Middle (South) 21st CCLC programs were beneficial socially. The majority, more 60 percent, of students also felt that adults at the program cared about them, felt the program helped them understand the importance of following rules and helped complete their homework.
The majority teachers that responded felt that the 21st CCLC program did not improve the student’s academic performance, classroom behavior, or motivation to learn. Teachers only responded about 19 specific students so it may not representative of all students attending the program. Nevertheless, it may be beneficial for the program to further explore the academic needs of the students.
5.3 Student Success Snapshot The student success snapshot is a seventh grader who entered the program at the beginning of the school year having the highest risk score of all students attending the school. She was habitually truant last year and missed over 100 days of school. She was placed at such a high risk due to attendance, standardized test scores, GPA, and the number of failed courses. This student was recruited into the program due to her high academic risk level. Due to the compassion of the staff, this student flourished this year. She worked very hard in all academic pursuits and had near
13
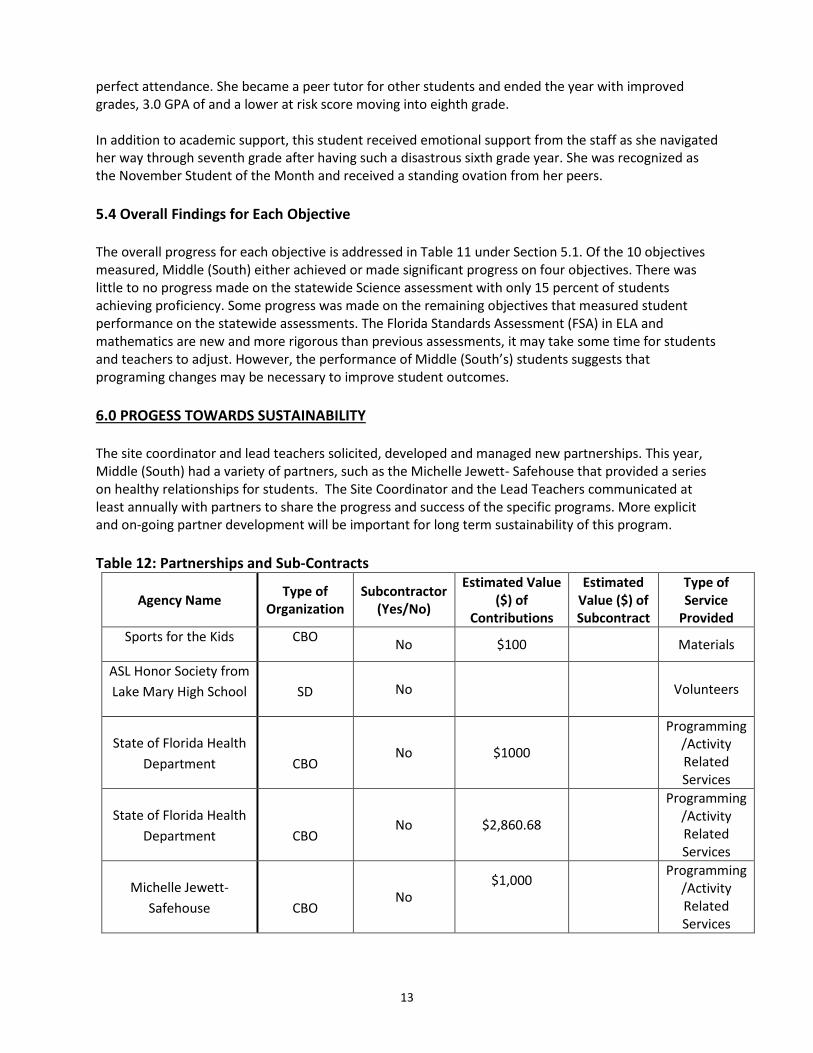
perfect attendance. She became a peer tutor for other students and ended the year with improved grades, 3.0 GPA of and a lower at risk score moving into eighth grade. In addition to academic support, this student received emotional support from the staff as she navigated her way through seventh grade after having such a disastrous sixth grade year. She was recognized as the November Student of the Month and received a standing ovation from her peers.
5.4 Overall Findings for Each Objective The overall progress for each objective is addressed in Table 11 under Section 5.1. Of the 10 objectives measured, Middle (South) either achieved or made significant progress on four objectives. There was little to no progress made on the statewide Science assessment with only 15 percent of students achieving proficiency. Some progress was made on the remaining objectives that measured student performance on the statewide assessments. The Florida Standards Assessment (FSA) in ELA and mathematics are new and more rigorous than previous assessments, it may take some time for students and teachers to adjust. However, the performance of Middle (South’s) students suggests that programing changes may be necessary to improve student outcomes.
6.0 PROGESS TOWARDS SUSTAINABILITY The site coordinator and lead teachers solicited, developed and managed new partnerships. This year, Middle (South) had a variety of partners, such as the Michelle Jewett- Safehouse that provided a series on healthy relationships for students. The Site Coordinator and the Lead Teachers communicated at least annually with partners to share the progress and success of the specific programs. More explicit and on-going partner development will be important for long term sustainability of this program.
Table 12: Partnerships and Sub-Contracts
Agency Name Type of
Organization Subcontractor
(Yes/No)
Estimated Value ($) of
Contributions
Estimated Value ($) of Subcontract
Type of Service
Provided
Sports for the Kids CBO No $100 Materials
ASL Honor Society from
Lake Mary High School SD No Volunteers
State of Florida Health
Department CBO No $1000
Programming/Activity Related Services
State of Florida Health
Department CBO No $2,860.68
Programming/Activity Related Services
Michelle Jewett-
Safehouse CBO No
$1,000
Programming/Activity Related Services

14
Agency Name Type of
Organization Subcontractor
(Yes/No)
Estimated Value ($) of
Contributions
Estimated Value ($) of Subcontract
Type of Service
Provided
Dr. Gul
Dadlani/Nemours
Hospital HBO No $1,250
Programming/Activity Related Services
UF/IFAS Extension,
Seminole County CBO No
$500
Programming/Activity Related Services
Boys Town/Justin
Colson CBO No $1,083
Programming/Activity Related Services
Note: Value of subcontract must be ZERO if the agency is listed as “No” in the subcontractor column. Likewise, the value of the subcontract must be greater than ZERO if the agency is listed as “Yes” in the subcontractor column. Note: The USED’s federal definition differentiates between a “partner” and a “subcontractor”. A subcontractor receives compensation (to some extent) for their services; partners do not.
7.0 LESSONS LEARNED AND RECOMMENDATIONS The Seminole County Public Schools Middle (South) 21st CCLC program has provided high quality services
to the students and family members who attended this year. The site has achieved or made significant
progress on many of the program objectives, including classroom grades, discipline, and physical fitness.
There a few key recommendations that may help enhance the program quality:
As a result of the increase in rigor of the statewide assessments it may be necessary to re-evaluate some of the Middle (South) programming or add additional support to ensure that students are learning and mastering the new standards.
In addition, improving Science achievement is a district priority and should continue to be a focus for Middle (South).