summary report of nih inclusion data – fy2005
DESCRIPTION
Summary Report of NIH Inclusion Data – FY2005. Carlos E. Caban, Ph.D., M.P.H. Office of Extramural Research, OD NIH October 24, 2006. Overview of the Report Data. Executive Summary Tables Total NIH Clinical Research Reported in FY2005 is summarized in revised tables - PowerPoint PPT PresentationTRANSCRIPT
October 24, 2006 Advisory Committee on Research on Women’s Health.
1
Summary Report of NIH Inclusion Data – FY2005
Carlos E. Caban, Ph.D., M.P.H.Office of Extramural Research, OD
NIHOctober 24, 2006
October 24, 2006 Advisory Committee on Research on Women’s Health.
2
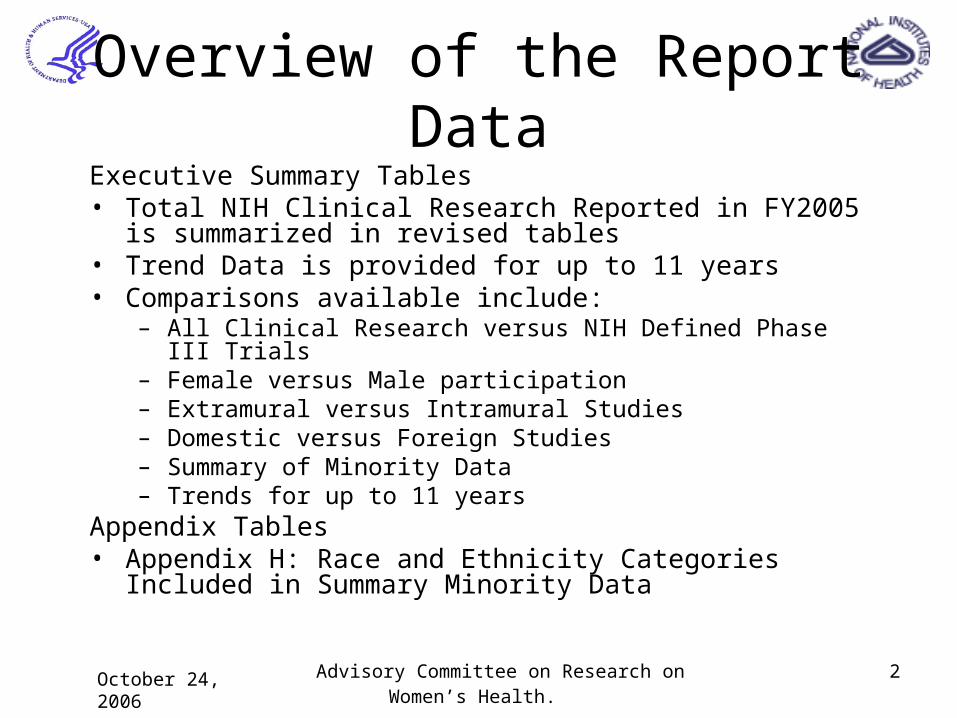
Overview of the Report DataExecutive Summary Tables• Total NIH Clinical Research Reported in FY2005 is
summarized in revised tables• Trend Data is provided for up to 11 years• Comparisons available include:
– All Clinical Research versus NIH Defined Phase III Trials– Female versus Male participation– Extramural versus Intramural Studies– Domestic versus Foreign Studies– Summary of Minority Data – Trends for up to 11 years
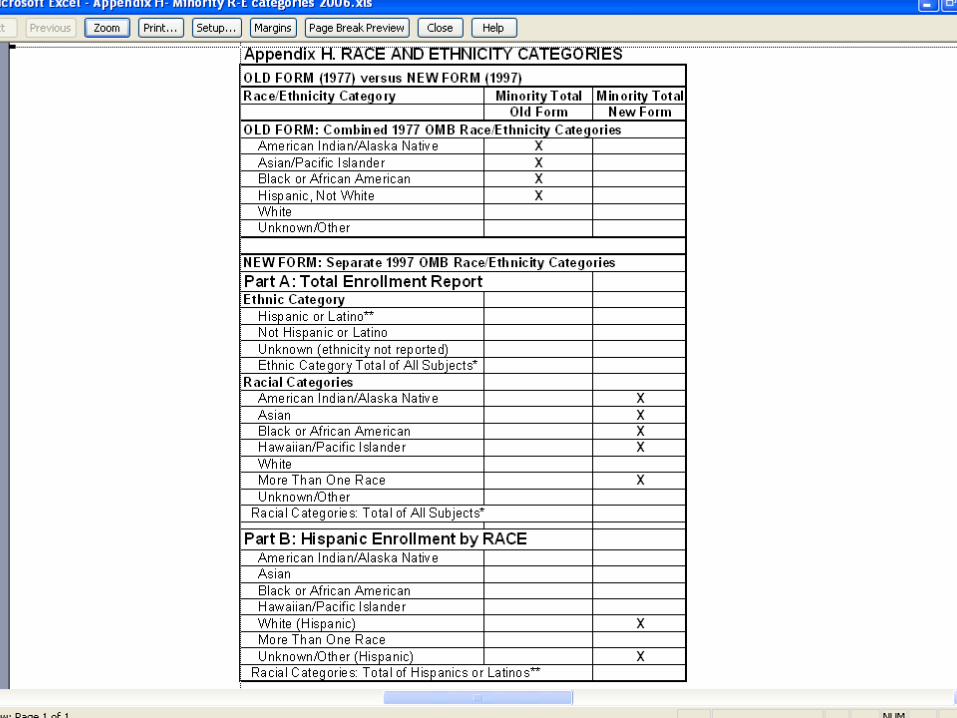
Appendix Tables • Appendix H: Race and Ethnicity Categories Included in
Summary Minority Data

October 24, 2006 Advisory Committee on Research on Women’s Health.
3
NIH Clinical Research
• NIH Clinical research studies are determined in accordance with the definition of clinical research to include, for example, non-intervention clinical research, clinical trials, epidemiologic studies, behavioral studies, and database studies.
• Data on inclusion is tabulated by looking at human subject populations in NIH-defined Phase III clinical trials and other human subject research studies.
• "Total All Clinical Studies" includes NIH Defined Phase III Clinical Trials.
October 24, 2006 Advisory Committee on Research on Women’s Health.
4
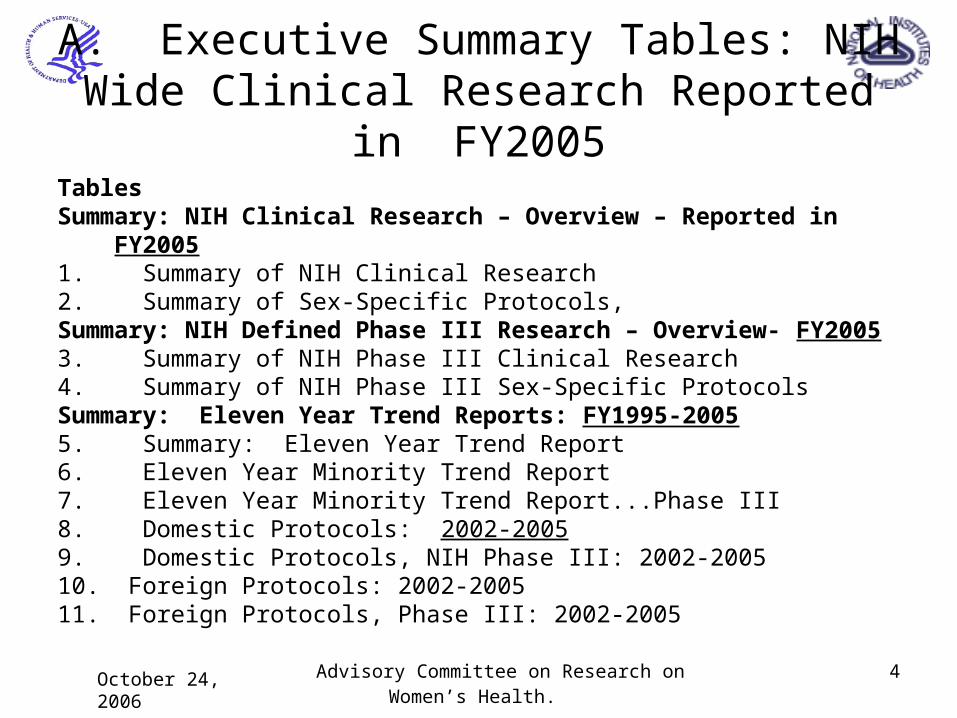
A. Executive Summary Tables: NIH Wide Clinical Research Reported in FY2005
TablesSummary: NIH Clinical Research – Overview – Reported in FY20051. Summary of NIH Clinical Research2. Summary of Sex-Specific Protocols, Summary: NIH Defined Phase III Research – Overview- FY20053. Summary of NIH Phase III Clinical Research 4. Summary of NIH Phase III Sex-Specific Protocols Summary: Eleven Year Trend Reports: FY1995-20055. Summary: Eleven Year Trend Report6. Eleven Year Minority Trend Report7. Eleven Year Minority Trend Report...Phase III 8. Domestic Protocols: 2002-20059. Domestic Protocols, NIH Phase III: 2002-200510. Foreign Protocols: 2002-200511. Foreign Protocols, Phase III: 2002-2005
October 24, 2006 Advisory Committee on Research on Women’s Health.
6
Brief Data Summary
Brief Presentations:
• Summary of NIH Clinical Research Reported in FY2005 – Table 1
• Presentation of Trend Data – – Female and Male Enrollment– Protocols and Enrollment– Domestic and Foreign– Minority Inclusion
October 24, 2006 Advisory Committee on Research on Women’s Health.
7
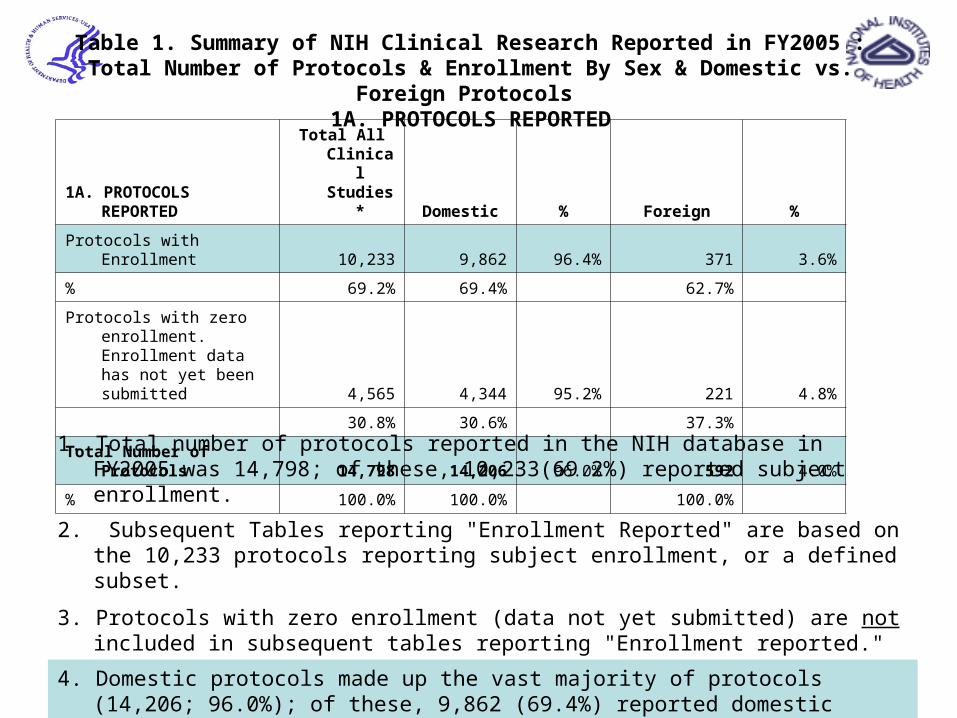
Table 1. Summary of NIH Clinical Research Reported in FY2005 :Total Number of Protocols & Enrollment By Sex & Domestic vs. Foreign Protocols
1A. PROTOCOLS REPORTED
1A. PROTOCOLS REPORTED
Total All Clinical Studies* Domestic % Foreign %
Protocols with Enrollment 10,233 9,862 96.4% 371 3.6%
% 69.2% 69.4% 62.7%
Protocols with zero enrollment. Enrollment data has not yet been submitted 4,565 4,344 95.2% 221 4.8%
30.8% 30.6% 37.3%
Total Number of Protocols 14,798 14,206 96.0% 592 4.0%
% 100.0% 100.0% 100.0%
1. Total number of protocols reported in the NIH database in FY2005 was 14,798; of these, 10,233(69.2%) reported subject enrollment.
2. Subsequent Tables reporting "Enrollment Reported" are based on the 10,233 protocols reporting subject enrollment, or a defined subset.
3. Protocols with zero enrollment (data not yet submitted) are not included in subsequent tables reporting "Enrollment reported."
4. Domestic protocols made up the vast majority of protocols (14,206; 96.0%); of these, 9,862 (69.4%) reported domestic subject enrollment.
October 24, 2006 Advisory Committee on Research on Women’s Health.
8
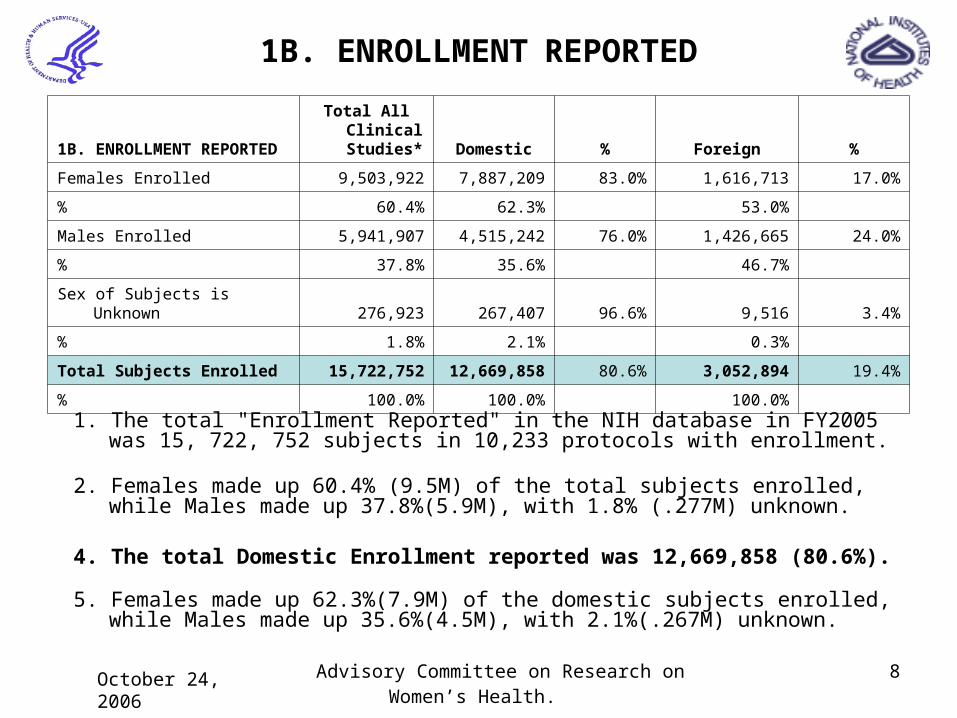
1B. ENROLLMENT REPORTED
1B. ENROLLMENT REPORTED
Total All Clinical Studies* Domestic % Foreign %
Females Enrolled 9,503,922 7,887,209 83.0% 1,616,713 17.0%
% 60.4% 62.3% 53.0%
Males Enrolled 5,941,907 4,515,242 76.0% 1,426,665 24.0%
% 37.8% 35.6% 46.7%
Sex of Subjects is Unknown 276,923 267,407 96.6% 9,516 3.4%
% 1.8% 2.1% 0.3%
Total Subjects Enrolled 15,722,752 12,669,858 80.6% 3,052,894 19.4%
% 100.0% 100.0% 100.0%
1. The total "Enrollment Reported" in the NIH database in FY2005 was 15, 722, 752 subjects in 10,233 protocols with enrollment.
2. Females made up 60.4% (9.5M) of the total subjects enrolled, while Males made up 37.8%(5.9M), with 1.8% (.277M) unknown.
4. The total Domestic Enrollment reported was 12,669,858 (80.6%).
5. Females made up 62.3%(7.9M) of the domestic subjects enrolled, while Males made up 35.6%(4.5M), with 2.1%(.267M) unknown.
October 24, 2006 Advisory Committee on Research on Women’s Health.
9
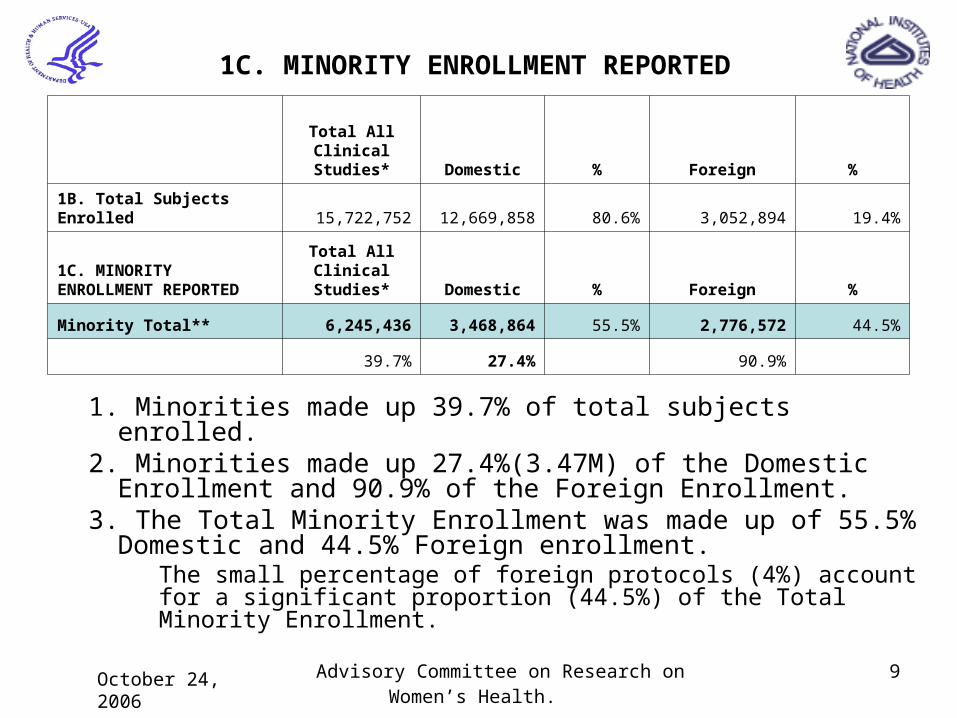
1C. MINORITY ENROLLMENT REPORTED
1. Minorities made up 39.7% of total subjects enrolled.2. Minorities made up 27.4%(3.47M) of the Domestic Enrollment and
90.9% of the Foreign Enrollment.
3. The Total Minority Enrollment was made up of 55.5% Domestic and 44.5% Foreign enrollment.
The small percentage of foreign protocols (4%) account for a significant proportion (44.5%) of the Total Minority Enrollment.
Total All Clinical Studies* Domestic % Foreign %
1B. Total Subjects Enrolled 15,722,752 12,669,858 80.6% 3,052,894 19.4%
1C. MINORITY ENROLLMENT REPORTED
Total All Clinical Studies* Domestic % Foreign %
Minority Total** 6,245,436 3,468,864 55.5% 2,776,572 44.5%
39.7% 27.4% 90.9%
October 24, 2006 Advisory Committee on Research on Women’s Health.
10
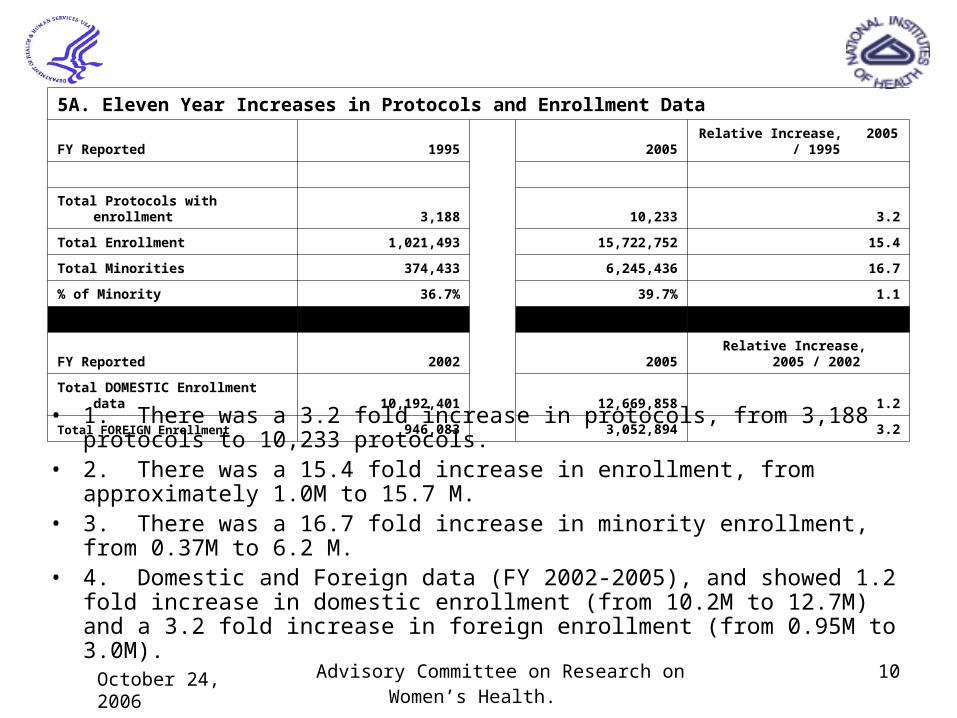
• 1. There was a 3.2 fold increase in protocols, from 3,188 protocols to 10,233 protocols.
• 2. There was a 15.4 fold increase in enrollment, from approximately 1.0M to 15.7 M.
• 3. There was a 16.7 fold increase in minority enrollment, from 0.37M to 6.2 M.• 4. Domestic and Foreign data (FY 2002-2005), and showed 1.2 fold increase
in domestic enrollment (from 10.2M to 12.7M) and a 3.2 fold increase in foreign enrollment (from 0.95M to 3.0M).
5A. Eleven Year Increases in Protocols and Enrollment Data
FY Reported 1995 2005 Relative Increase, 2005 / 1995
Total Protocols with enrollment 3,188 10,233 3.2
Total Enrollment 1,021,493 15,722,752 15.4
Total Minorities 374,433 6,245,436 16.7
% of Minority 36.7% 39.7% 1.1
FY Reported 2002 2005 Relative Increase, 2005 / 2002
Total DOMESTIC Enrollment data 10,192,401 12,669,858 1.2
Total FOREIGN Enrollment 946,083 3,052,894 3.2
October 24, 2006 Advisory Committee on Research on Women’s Health.
11
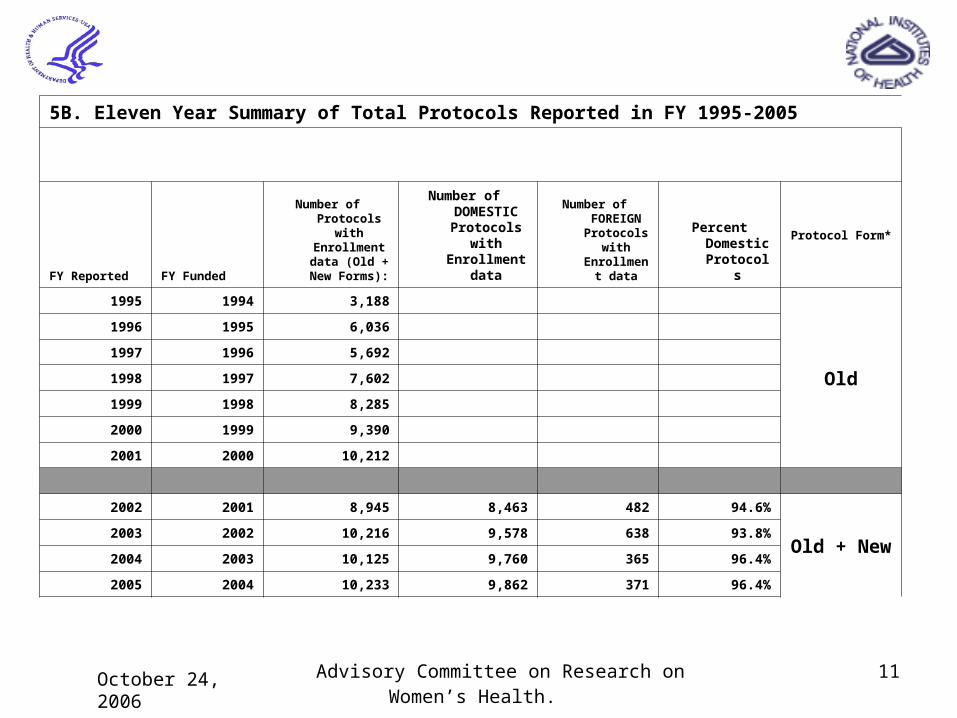
5B. Eleven Year Summary of Total Protocols Reported in FY 1995-2005
FY Reported FY Funded
Number of Protocols
with Enrollment data (Old +
New Forms):
Number of DOMESTIC Protocols
with Enrollment
data
Number of FOREIGN Protocols
with Enrollment
data
Percent DomesticProtocols
Protocol Form*
1995 1994 3,188
Old
1996 1995 6,036
1997 1996 5,692
1998 1997 7,602
1999 1998 8,285
2000 1999 9,390
2001 2000 10,212
2002 2001 8,945 8,463 482 94.6%
Old + New2003 2002 10,216 9,578 638 93.8%
2004 2003 10,125 9,760 365 96.4%
2005 2004 10,233 9,862 371 96.4%
October 24, 2006 Advisory Committee on Research on Women’s Health.
12
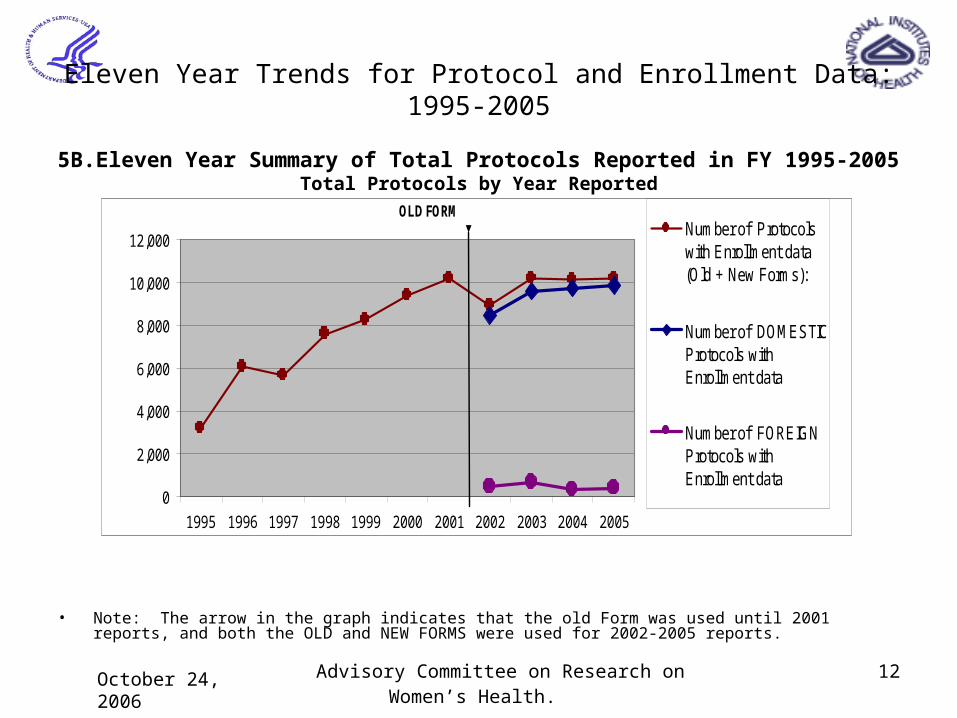
Eleven Year Trends for Protocol and Enrollment Data: 1995-2005
5B.Eleven Year Summary of Total Protocols Reported in FY 1995-2005Total Protocols by Year Reported
0
2,000
4,000
6,000
8,000
10,000
12,000
1995 1996 1997 1998 1999 2000 2001 2002 2003 2004 2005
Number of Protocolswith Enrollment data(Old + New Forms):
Number of DOMESTICProtocols withEnrollment data
Number of FOREIGNProtocols withEnrollment data
OLD FORM OLD+NEW FORMS
• Note: The arrow in the graph indicates that the old Form was used until 2001 reports, and both the OLD and NEW FORMS were used for 2002-2005 reports.

October 24, 2006 Advisory Committee on Research on Women’s Health.
13
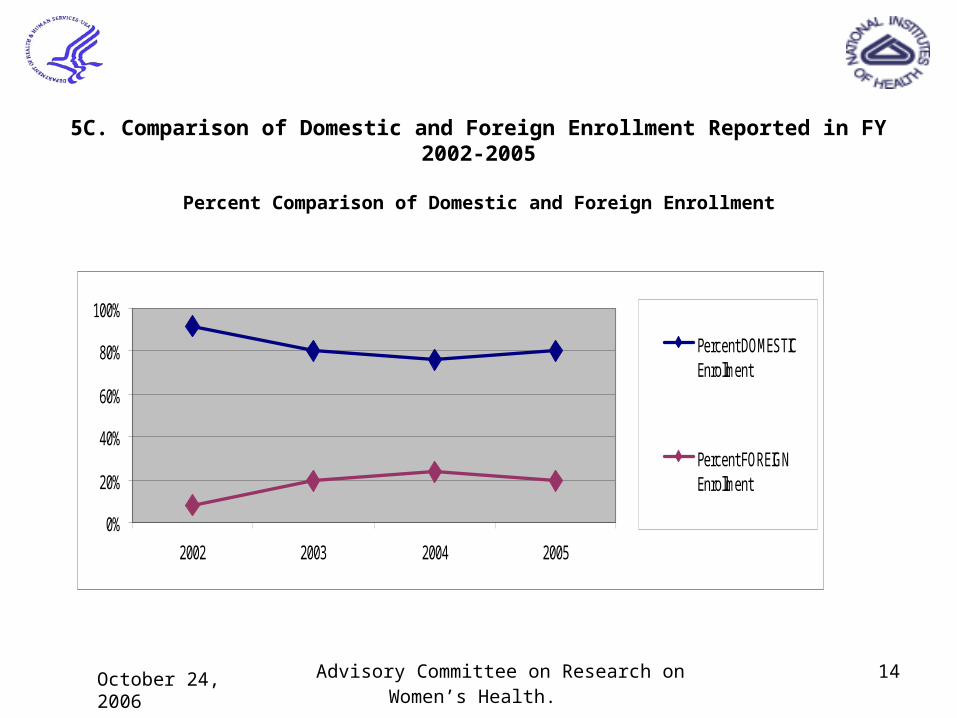
5C. Comparison of Domestic and Foreign Enrollment Reported in FY 2002-2005
FY Reported FY FundedTotal Enrollment data
(Old+New Forms):Total DOMESTICEnrollment data
PercentDOMESTICEnrollment
Total FOREIGN Enrollment
Percent FOREIGN
Enrollment
2002 2001 11,138,484 10,192,401 91.5% 946,083 8.5%
2003 2002 14,772,254 11,911,357 80.6% 2,860,897 19.4%
2004 2003 18,923,920 14,359,793 75.9% 4,564,127 24.1%
2005 2004 15,722,752 12,669,858 80.6% 3,052,894 19.4%
October 24, 2006 Advisory Committee on Research on Women’s Health.
14
5C. Comparison of Domestic and Foreign Enrollment Reported in FY 2002-2005
Percent Comparison of Domestic and Foreign Enrollment
0%
20%
40%
60%
80%
100%
2002 2003 2004 2005
Percent DOMESTICEnrollment
Percent FOREIGNEnrollment
October 24, 2006 Advisory Committee on Research on Women’s Health.
15
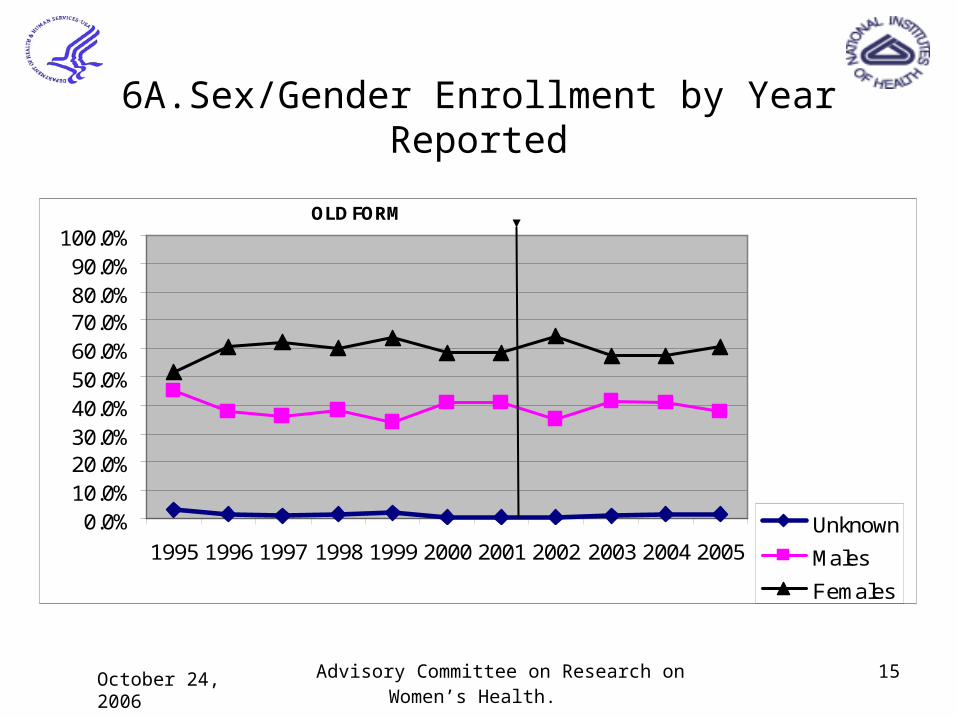
0.0%10.0%20.0%30.0%40.0%50.0%60.0%70.0%80.0%90.0%
100.0%
1995 1996 1997 1998 1999 2000 2001 2002 2003 2004 2005Unknown
Males
Females
OLD FORM OLD+NEW FORMS
6A.Sex/Gender Enrollment by Year Reported

October 24, 2006 Advisory Committee on Research on Women’s Health.
16
6F. Comparison of Domestic and Foreign Minority Participation for FY 2002-2005
FYReported FY Funded
FOREIGNMinorityEnrollment
ForeignTotalEnrollment
DOMESTICMinorityEnrollment
DomesticTotalEnrollment
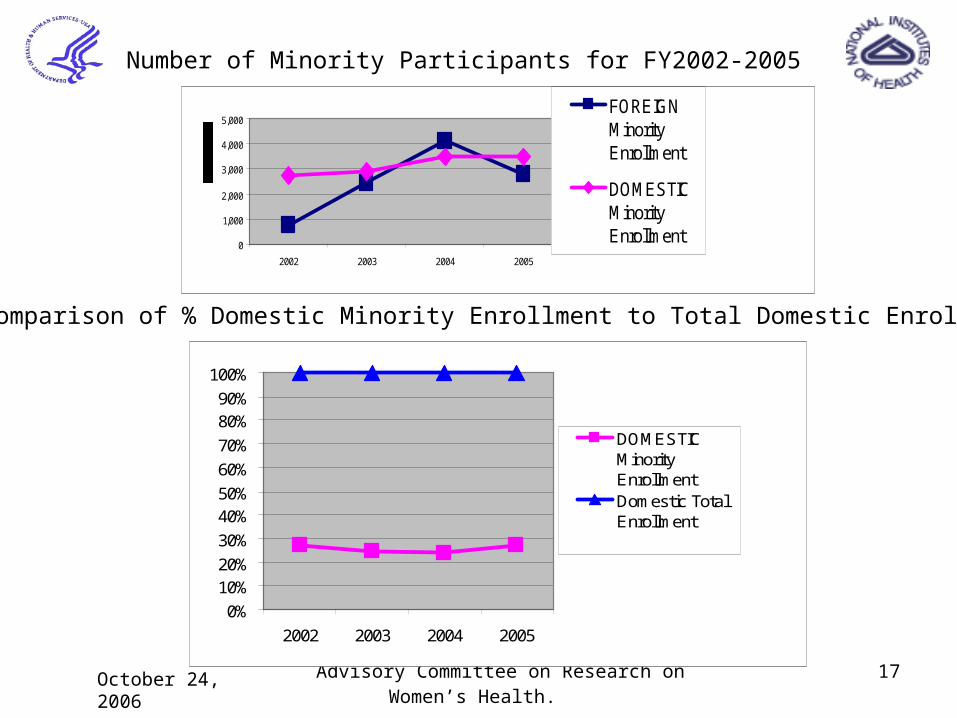
2002 2001 777,461 946,083 2,754,820 10,149,869
82.2% 100.0% 27.1% 100.0%
2003 2002 2,452,329 2,860,897 2,935,363 11,911,357
85.7% 100.0% 24.6% 100.0%
2004 2003 4,147,255 4,564,127 3,464,356 14,359,793
90.9% 100.0% 24.1% 100.0%
2005 2004 2,776,565 3,052,894 3,468,864 12,669,858
90.9% 100.0% 27.4% 100.0%
October 24, 2006 Advisory Committee on Research on Women’s Health.
17
0
1,000
2,000
3,000
4,000
5,000
2002 2003 2004 2005
FOREIGNMinorityEnrollment
DOMESTICMinorityEnrollment
0%
10%20%
30%
40%50%
60%
70%
80%90%
100%
2002 2003 2004 2005
DOMESTICMinorityEnrollmentDomestic TotalEnrollment
Number of Minority Participants for FY2002-2005
Comparison of % Domestic Minority Enrollment to Total Domestic Enrollment
October 24, 2006 Advisory Committee on Research on Women’s Health.
18
General Summary• The number of clinical studies and total
and minority enrollment have increased significantly over 11 years
• More Females have been reported than males, although the F/M ratio is relatively constant
• The vast majority are domestic studies• Domestic minority enrollment has been
~25% of total domestic enrollment