summary report 2015 prc community health needs assessment
TRANSCRIPT

Summary Report
2015 PRC Community
Health Needs Assessment
RCRH Service Area
Prepared for:
Rapid City Regional Hospital
In collaboration with:
Regional Health
By:
Professional Research Consultants, Inc.
11326 P Street Omaha, NE 68136-2316
www.PRCCustomResearch.com
2015-0656-02
© November 2015

COMMUNITY HEALTH NEEDS ASSESSMENT
2
Table of Contents
Introduction 4
About This Assessment 5
Methodology 5
PRC Community Health Survey 5
Online Key Informant Survey 8
Public Health, Vital Statistics & Other Data 11
Benchmark Data 12
Determining Significance 12
Information Gaps 13
IRS Form 990, Schedule H Compliance 14
Summary of Findings 15
Significant Health Needs of the Community 16
Prioritization of Health Needs 17
Summary Tables: Comparisons With Benchmark Data 18
Reading the Data Summary Tables 18
Data Charts & Key Informant Input 31
Community Characteristics 32
Population Characteristics 32
Social Determinants of Health 33
General Health Status 36
Overall Health Status 36
Mental Health 39
Death, Disease & Chronic Conditions 54
Leading Causes of Death 54
Cardiovascular Disease 56
Cancer 67
Respiratory Disease 78
Injury & Violence 84
Diabetes 97
Alzheimer’s Disease 106
Kidney Disease 111
Potentially Disabling Conditions 116
Infectious Disease 124
Influenza & Pneumonia Vaccination 124
COMMUNITY HEALTH NEEDS ASSESSMENT
3
HIV 126
Sexually Transmitted Diseases 130
Immunization & Infectious Diseases 134
Births 137
Prenatal Care 137
Birth Outcomes & Risks 137
Family Planning 142
Modifiable Health Risks 146
Actual Causes Of Death 146
Nutrition, Physical Activity & Weight 148
Substance Abuse 170
Tobacco Use 183
Access to Health Services 192
Lack of Health Insurance Coverage (Age 18 to 64) 192
Difficulties Accessing Healthcare 194
Primary Care Services 205
Emergency Room Utilization 209
Oral Health 210
Vision Care 217
Health Literacy 217
Local Healthcare 220
Perceptions of Local Healthcare Services 220
Outmigration 221
Resources Available to Address the Significant Health Needs 222
Appendix 233
Evaluation of Past Work 234

Introduction

COMMUNITY HEALTH NEEDS ASSESSMENT
5
About This Assessment
This Community Health Needs Assessment is a systematic, data-driven approach to determining the health
status, behaviors and needs of residents in the service area of Rapid City Regional Hospital (RCRH).
Subsequently, this information may be used to inform decisions and guide efforts to improve community health
and wellness.
A Community Health Needs Assessment provides information so that communities may identify issues of
greatest concern and decide to commit resources to those areas, thereby making the greatest possible impact
on community health status.
This assessment was conducted on behalf of Rapid City Regional Hospital by Professional Research
Consultants, Inc. (PRC). PRC is a nationally-recognized healthcare consulting firm with extensive experience
conducting Community Health Needs Assessments such as this in hundreds of communities across the United
States since 1994.
Methodology
This assessment incorporates data from both quantitative and qualitative sources. Quantitative data input
includes primary research (the PRC Community Health Survey) and secondary research (vital statistics and
other existing health-related data); these quantitative components allow for comparison to benchmark data at
the state and national levels. Qualitative data input includes primary research gathered through an Online Key
Informant Survey of various community stakeholders.
PRC Community Health Survey
Survey Instrument
The survey instrument used for this study is based largely on the Centers for Disease Control and Prevention
(CDC) Behavioral Risk Factor Surveillance System (BRFSS), as well as various other public health surveys
and customized questions addressing gaps in indicator data relative to health promotion and disease
prevention objectives and other recognized health issues. The final survey instrument was developed by
Regional Health and PRC.
Community Defined for This Assessment
The study area for the survey effort (referred to as the “RCRH Service Area” in this report, is comprised of
Butte, Custer, Fall River, Lawrence, Mead, Oglala Lakota (formerly Shannon) and Pennington Counties in
South Dakota This area definition, based on the areas of residents of recent patients, is illustrated in the
following map.

COMMUNITY HEALTH NEEDS ASSESSMENT
6
Sample Approach & Design
A precise and carefully executed methodology is critical in asserting the validity of the results gathered in the
PRC Community Health Survey. Thus, to ensure the best representation of the population surveyed, a
telephone interview methodology — one that incorporates both landline and cell phone interviews — was
employed. The primary advantages of telephone interviewing are timeliness, efficiency and random-selection
capabilities.
The sample design used for this effort consisted of a sample of 575 individuals age 18 and older in the RCRH
Service Area. Because this study is part of a larger effort involving multiple regions and hospital service areas,
the surveys were distributed among various strata. Once the interviews were completed, these were weighted
in proportion to the actual population distribution so as to appropriately represent the RCRH Service Area as a
whole. All administration of the surveys, data collection and data analysis was conducted by Professional
Research Consultants, Inc. (PRC).
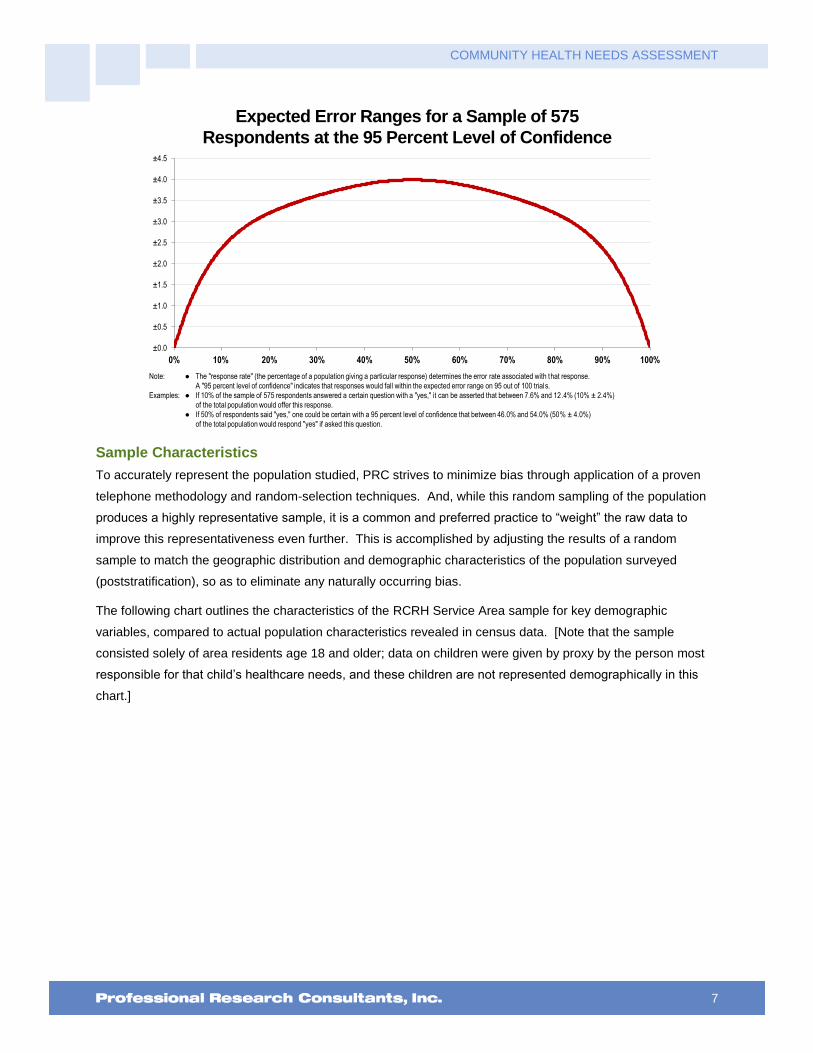
For statistical purposes, the maximum rate of error associated with a sample size of 575 respondents is ±4.0%
at the 95 percent level of confidence.
COMMUNITY HEALTH NEEDS ASSESSMENT
7
Expected Error Ranges for a Sample of 575
Respondents at the 95 Percent Level of Confidence
Note: � The "response rate" (the percentage of a population giving a particular response) determines the error rate associated with that response.
A "95 percent level of confidence" indicates that responses would fall within the expected error range on 95 out of 100 trials.
Examples: � If 10% of the sample of 575 respondents answered a certain question with a "yes," it can be asserted that between 7.6% and 12.4% (10% 2.4%)
of the total population would offer this response.
� If 50% of respondents said "yes," one could be certain with a 95 percent level of confidence that between 46.0% and 54.0% (50% 4.0%)
of the total population would respond "yes" if asked this question.
±0.0
±0.5
±1.0
±1.5
±2.0
±2.5
±3.0
±3.5
±4.0
±4.5
0% 10% 20% 30% 40% 50% 60% 70% 80% 90% 100%
Sample Characteristics
To accurately represent the population studied, PRC strives to minimize bias through application of a proven
telephone methodology and random-selection techniques. And, while this random sampling of the population
produces a highly representative sample, it is a common and preferred practice to “weight” the raw data to
improve this representativeness even further. This is accomplished by adjusting the results of a random
sample to match the geographic distribution and demographic characteristics of the population surveyed
(poststratification), so as to eliminate any naturally occurring bias.
The following chart outlines the characteristics of the RCRH Service Area sample for key demographic
variables, compared to actual population characteristics revealed in census data. [Note that the sample
consisted solely of area residents age 18 and older; data on children were given by proxy by the person most
responsible for that child’s healthcare needs, and these children are not represented demographically in this
chart.]

COMMUNITY HEALTH NEEDS ASSESSMENT
8
Population & Survey Sample Characteristics(RCRH Service Area, 2015)
Sources: � Census 2010, Summary File 3 (SF 3). US Census Bureau.
� 2015 PRC Community Health Survey, Professional Research Consultants, Inc.
49.5
%
50.5
%
37.5
% 44.0
%
18.5
%
83.8
%
2.6%
13.6
%
36.4
%
49.5
%
50.5
%
37.4
% 44.0
%
18.6
%
84.7
%
1.9%
13.4
%
35.7
%
0%
20%
40%
60%
80%
100%
Men Women 18 to 39 40 to 64 65+ White Hispanic Other <200% FPL
Actual Population Weighted Survey Sample
Further note that the poverty descriptions and segmentation used in this report are based on administrative
poverty thresholds determined by the US Department of Health & Human Services. These guidelines define
poverty status by household income level and number of persons in the household (e.g., the 2014 guidelines
place the poverty threshold for a family of four at $23,850 annual household income or lower). In sample
segmentation: “low income” refers to community members living in a household with defined poverty status or
living just above the poverty level, earning up to twice the poverty threshold; “mid/high income” refers to those
households living on incomes which are twice or more the federal poverty level.
The sample design and the quality control procedures used in the data collection ensure that the sample is
representative. Thus, the findings may be generalized to the total population of community members in the
defined area with a high degree of confidence.
Online Key Informant Survey
To solicit input from key informants, those individuals who have a broad interest in the health of the community,
an Online Key Informant Survey was also implemented as part of this process. A list of recommended
participants was provided by Regional Health; this list included names and contact information for physicians,
public health representatives, other health professionals, social service providers, and a variety of other
community leaders. Potential participants were chosen because of their ability to identify primary concerns of
the populations with whom they work, as well as of the community overall.
Key informants were contacted by email, introducing the purpose of the survey and providing a link to take the
survey online; reminder emails were sent as needed to increase participation. In all, 294 community
stakeholders took part in the Online Key Informant Survey, as outlined in the following chart:

COMMUNITY HEALTH NEEDS ASSESSMENT
9
Online Key Informant Survey Participation
Key Informant Type Number Invited Number Participating
Physician 38 19
Public Health Representative 13 9
Other Health Provider 225 149
Social Services Provider 66 50
Community/Business Leader 106 67
Final participation included representatives of the organizations outlined below.
American Heart Association
American Red Cross
Banking
BCS
Behavior Management Systems
Black Hills Area Community Foundation
Black Hills Birth to Three
Black Hills Habitat for Humanity
Black Hills Living Well Magazine
Black Hills Pediatrics and Neonatology
Black Hills Special Services Cooperative
Black Hills State University
Black Hills Works
Board Member
Boys and Girls Club of Lead - Deadwood
Catholic Social Services
Children's Home Society of South Dakota
City of Custer City
City of Rapid City
City of Rapid City - Parks and Recreation
City of Spearfish, Rec and Aquatics
Center
City of Sturgis
City of Wall
City/County Alcohol & Drug Programs
Community Health Center of the Black
Hills
Compass Point ABC Home Care Services
Cornerstone Rescue Mission Apartments
Custer Community Health Services
Custer County Library
Custer Regional Health Board
Custer Regional Hospital
Custer Senior Center
Deadwood History
Department of Health Community Health
Nursing
Department of Social Services
Dialysis Management Group
Eastern Pennington County Ambulance
District
Fall River CHS
Family Assistance Center
Family Health Education Services
Feeding South Dakota
First National Bank
Foundation for Health
Front Porch Coalition
Golden Living Centers
Good Shepherd Clinic
Great Plains Tribal Chairmen's Health
Board
Helpline Center
Home Instead Senior Care of the Black
Hills
Indian Health Service

COMMUNITY HEALTH NEEDS ASSESSMENT
10
Integrity Insurance
Lead Deadwood Regional Hospital
Lead Deadwood Regional Medical Clinic
Lifeline Connection of the Black Hills
Lifescape
Lifeways, Inc.
Live Well Black Hills
Love Inc. of the Black Hills
Massa Berry Regional Medical Clinic
Meade County Community Health
Services
North Side Schools
Northern Hills Dental
Northern Hills Training Center
Pennington County Health and Human
Services
Project Solutions
Radiology Associates
Rapid City Area Metropolitan Planning
Organization
Rapid City Area Schools
Rapid City Community Conversations
Rapid City Community Development
Division
Rapid City Dialysis Center - RCRH
Rapid City Fire Department
Rapid City Regional Family Medicine
Residency
Rapid City Regional Hospital
Regional Health
Regional Health - Home Care and
Hospice of the Hills
Regional Health - Rapid City Market
Regional Health Physicians
Regional Hospital
Regional Medical Clinics
Rural America Initiatives
Same Day Surgery Center
SD Department of Health Community Hlth
Svcs Custer
SD Dept of Health WIC Program Oglala
Lakota County
SD National Guard Service Member and
Family Support
SDPI
SDSU Extension
Senior Citizen
Senior Companions of the Black Hills
South Dakota Community Foundation
South Dakota Department of Health
South Dakota Parent Connection
Spearfish Community Coalition
Spearfish Market
Spearfish Regional Home Care and
Hospice
Spearfish Regional Hospital
Spearfish/Belle Fourche Advisory Council
Spearfish-Belle Advisory Board
Sturgis Regional Health Hospital
Sturgis Regional Hospital Advisory
Council
The Hope Center
The Salvation Army
The Village
Town of Newell
TV Station
United Way of the Black Hills
University of South Dakota Dept of
Nursing, Rapid City
VA Black Hills Health Care Systems
Volunteers of America Northern Rockies
Wedgwood Regional Senior Care
Welcov Healthcare
Wellfully
Westhills Retirement Community
Workforce Diversity Network of the Black
Hills
YMCA
Youth and Family Services
COMMUNITY HEALTH NEEDS ASSESSMENT
11
Through this process, input was gathered from several individuals whose organizations work with low-income,
minority populations, or other medically underserved populations.
Minority Populations
Adolescents, African-Americans, American Indians, Asians, Asian Americans, Chinese, disabled, Eastern Indians, ethnically isolated, Filipinos, Hispanics, immigrants, international students, mentally ill, mixed race, Muslims, Native Americans, Nepalese, Pacific Islanders, Slavic, undocumented residents
Medically Underserved Populations
Adolescents, American Indians, children, those with chronic health issues, college students, diabetics, disabled, those with disrupted home environments, domestic violence victims, elderly, Hispanics, HIV/AIDS patients, homeless, Hospice patients, immigrants, incarcerated, insured persons with high deductible, LGBT residents, low-income residents, those with Medicare/Medicaid, mentally ill, Native Americans, premature babies born under the influence of drugs, rural residents, single parents, those with subsistence vocations, substance abusers, undocumented residents, unemployed, uninsured/underinsured individuals, veterans, women, young adults, young pregnant mothers
In the online survey, key informants were asked to rate the degree to which various health issues are a
problem in their own community. Follow-up questions asked them to describe why they identify problem areas
as such, and how these might be better addressed. Results of their ratings, as well as their verbatim
comments, are included throughout this report as they relate to the various other data presented.
NOTE: These findings represent qualitative rather than quantitative data. The Online Key Informant Survey was
designed to gather input from participants regarding their opinions and perceptions of the health of the
residents in the area. Thus, these findings are based on perceptions, not facts.
Public Health, Vital Statistics & Other Data
A variety of existing (secondary) data sources was consulted to complement the research quality of this
Community Health Needs Assessment. Data were obtained from the following sources (specific citations are
included with the graphs throughout this report):
Center for Applied Research and Environmental Systems (CARES)
Centers for Disease Control & Prevention, Office of Infectious Disease, National Center for HIV/AIDS,
Viral Hepatitis, STD, and TB Prevention
Centers for Disease Control & Prevention, Office of Public Health Science Services, Center for
Surveillance, Epidemiology and Laboratory Services, Division of Health Informatics and Surveillance
(DHIS)
Centers for Disease Control & Prevention, Office of Public Health Science Services, National Center
for Health Statistics
Community Commons
Connecticut Department of Public Health
ESRI ArcGIS Map Gallery
National Cancer Institute, State Cancer Profiles
OpenStreetMap (OSM)
US Census Bureau, American Community Survey
US Census Bureau, County Business Patterns

COMMUNITY HEALTH NEEDS ASSESSMENT
12
US Census Bureau, Decennial Census
US Department of Agriculture, Economic Research Service
US Department of Health & Human Services
US Department of Health & Human Services, Health Resources and Services Administration (HRSA)
US Department of Justice, Federal Bureau of Investigation
US Department of Labor, Bureau of Labor Statistics
Benchmark Data
South Dakota Risk Factor Data
Statewide risk factor data are provided where available as an additional benchmark against which to compare
local survey findings; these data are reported in the most recent BRFSS (Behavioral Risk Factor Surveillance
System) Prevalence and Trend Data published by the Centers for Disease Control and Prevention and the US
Department of Health & Human Services. State-level vital statistics are also provided for comparison of
secondary data indicators.
Nationwide Risk Factor Data
Nationwide risk factor data, which are also provided in comparison charts, are taken from the 2013 PRC
National Health Survey; the methodological approach for the national study is identical to that employed in this
assessment, and these data may be generalized to the US population with a high degree of confidence.
National-level vital statistics are also provided for comparison of secondary data indicators.
Healthy People 2020
Healthy People provides science-based, 10-year national objectives for improving the health of all Americans.
The Healthy People initiative is grounded in the principle that setting national objectives and monitoring
progress can motivate action. For three decades, Healthy People has established benchmarks and monitored
progress over time in order to:
Encourage collaborations across sectors.
Guide individuals toward making informed health decisions.
Measure the impact of prevention activities.
Healthy People 2020 is the product of an extensive stakeholder feedback
process that is unparalleled in government and health. It integrates input from public health and prevention
experts, a wide range of federal, state and local government officials, a consortium of more than 2,000
organizations, and perhaps most importantly, the public. More than 8,000 comments were considered in
drafting a comprehensive set of Healthy People 2020 objectives.
Determining Significance
Differences noted in this report represent those determined to be significant. For survey-derived indicators
(which are subject to sampling error), statistical significance is determined based on confidence intervals (at the
95 percent confidence level) using question-specific samples and response rates. For secondary data
indicators (which do not carry sampling error, but might be subject to reporting error), “significance,” for the
purpose of this report, is determined by a 5% variation from the comparative measure.

COMMUNITY HEALTH NEEDS ASSESSMENT
13
Information Gaps
While this assessment is quite comprehensive, it cannot measure all possible aspects of health in the
community, nor can it adequately represent all possible populations of interest. It must be recognized that
these information gaps might in some ways limit the ability to assess all of the community’s health needs.
For example, certain population groups — such as the homeless, institutionalized persons, or those who only
speak a language other than English or Spanish — are not represented in the survey data. Other population
groups — for example, pregnant women, lesbian/gay/bisexual/transgender residents, undocumented residents,
and members of certain racial/ethnic or immigrant groups — might not be identifiable or might not be
represented in numbers sufficient for independent analyses.
In terms of content, this assessment was designed to provide a comprehensive and broad picture of the health
of the overall community. However, there are certainly a great number of medical conditions that are not
specifically addressed.

COMMUNITY HEALTH NEEDS ASSESSMENT
14
IRS Form 990, Schedule H Compliance
For non-profit hospitals, a Community Health Needs Assessment (CHNA) also serves to satisfy certain
requirements of tax reporting, pursuant to provisions of the Patient Protection & Affordable Care Act of 2010.
To understand which elements of this report relate to those requested as part of hospitals’ reporting on IRS
Form 990 Schedule H, the following table cross-references related sections.
IRS Form 990, Schedule H See Report
Page(s)
Part V Section B Line 1a
A definition of the community served by the hospital facility 5
Part V Section B Line 1b
Demographics of the community 32
Part V Section B Line 1c
Existing health care facilities and resources within the community that are available to
respond to the health needs of the community
221
Part V Section B Line 1d
How data was obtained 5
Part V Section B Line 1f
Primary and chronic disease needs and other health issues of uninsured persons, low-
income persons, and minority groups
Addressed
Throughout
Part V Section B Line 1g
The process for identifying and prioritizing community health
needs and services to meet the community health needs
17
Part V Section B Line 1h
The process for consulting with persons
representing the community's interests
8
Part V Section B Line 1i
Information gaps that limit the hospital facility's
ability to assess the community's health needs
12

Summary of Findings
COMMUNITY HEALTH NEEDS ASSESSMENT
16
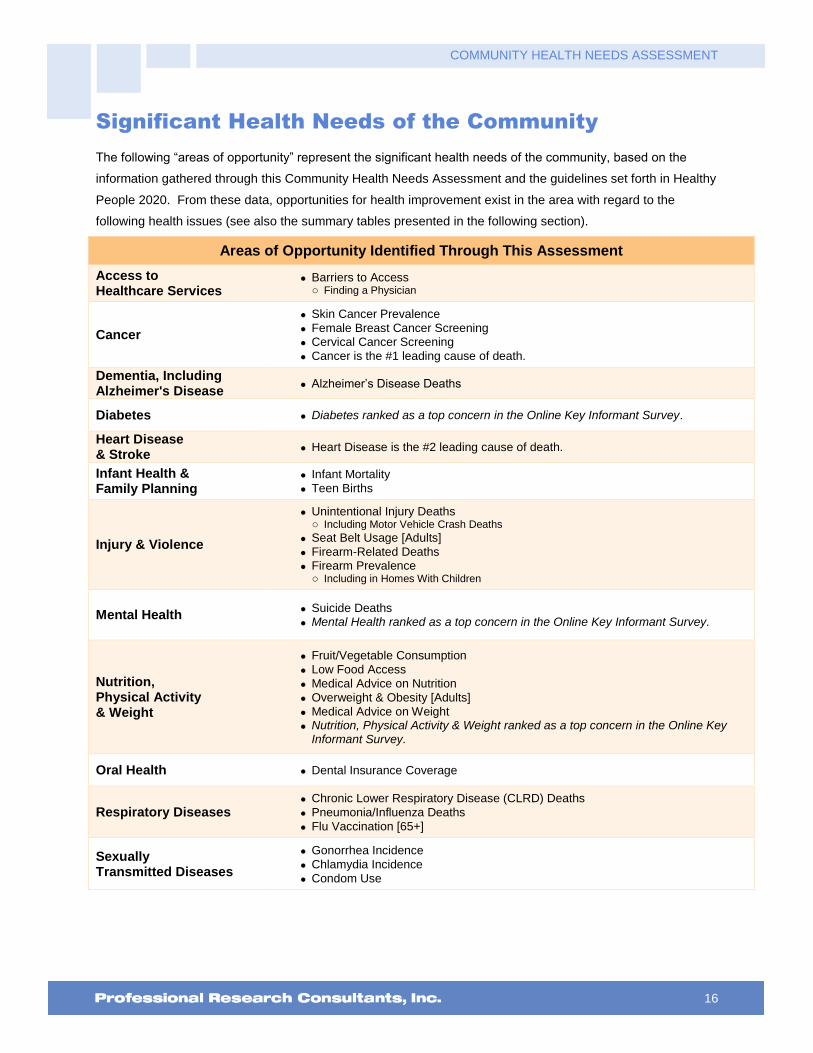
Significant Health Needs of the Community
The following “areas of opportunity” represent the significant health needs of the community, based on the
information gathered through this Community Health Needs Assessment and the guidelines set forth in Healthy
People 2020. From these data, opportunities for health improvement exist in the area with regard to the
following health issues (see also the summary tables presented in the following section).
Areas of Opportunity Identified Through This Assessment
Access to Healthcare Services
Barriers to Access o Finding a Physician
Cancer
Skin Cancer Prevalence
Female Breast Cancer Screening
Cervical Cancer Screening
Cancer is the #1 leading cause of death.
Dementia, Including Alzheimer's Disease
Alzheimer’s Disease Deaths
Diabetes Diabetes ranked as a top concern in the Online Key Informant Survey.
Heart Disease & Stroke
Heart Disease is the #2 leading cause of death.
Infant Health & Family Planning
Infant Mortality
Teen Births
Injury & Violence
Unintentional Injury Deaths o Including Motor Vehicle Crash Deaths
Seat Belt Usage [Adults]
Firearm-Related Deaths
Firearm Prevalence o Including in Homes With Children
Mental Health Suicide Deaths
Mental Health ranked as a top concern in the Online Key Informant Survey.
Nutrition, Physical Activity & Weight
Fruit/Vegetable Consumption
Low Food Access
Medical Advice on Nutrition
Overweight & Obesity [Adults]
Medical Advice on Weight
Nutrition, Physical Activity & Weight ranked as a top concern in the Online Key Informant Survey.
Oral Health Dental Insurance Coverage
Respiratory Diseases Chronic Lower Respiratory Disease (CLRD) Deaths
Pneumonia/Influenza Deaths
Flu Vaccination [65+]
Sexually Transmitted Diseases
Gonorrhea Incidence
Chlamydia Incidence
Condom Use

COMMUNITY HEALTH NEEDS ASSESSMENT
17
Prioritization of Health Needs
In February 2016, Regional Health’s Vice President of Safety, Quality, and Risk Management presented the
results of Rapid City Regional Hospital’s 2015 Community Health Needs Assessment (CHNA) to the Healers
and Transformers Community group who then held a discussion to prioritize the needs for the community. The
group is comprised of hospital caregivers and community representatives. The group reviewed the areas of
opportunity identified in the CHNA and decided to focus on the following three priority areas as part of their
upcoming Community Health Improvement Plan:
Access to Healthcare Services
Mental Health
Nutrition, Weight, and Physical Activity

COMMUNITY HEALTH NEEDS ASSESSMENT
18
Summary Tables:
Comparisons With Benchmark Data
The following tables provide an overview of indicators in the RCRH Service Area. These data are grouped to
correspond with the Focus Areas presented in Healthy People 2020.
Reading the Data Summary Tables
In the following charts, RCRH Service Area results are shown in the larger, blue column.
The columns to the right of the RCRH Service Area column provide trending, as well as comparisons
between local data and any available state and national findings, and Healthy People 2020 targets. Symbols
indicate whether the RCRH Service Area compares favorably (B), unfavorably (h), or comparably (d) to these
external data.
Note that blank table cells signify that data are not available or are not reliable for that area and/or for that
indicator.
RCRH
Service Area
RCRH Service Area vs. Benchmarks
Overall Health vs. SD vs. US vs. HP2020 TREND
% "Fair/Poor" Physical Health 12.6 d d d 12.7 15.3 14.5
% Activity Limitations 18.1 d d d 18.9 21.5 22.7
B d h
better similar worse
RCRH
Service Area
RCRH Service Area vs. Benchmarks
Access to Health Services vs. SD vs. US vs. HP2020 TREND
% [Age 18-64] Lack Health Insurance 14.2 d d h d 14.9 15.1 0.0 14.5
% [Insured] Went Without Coverage in Past Year 6.2 d B 8.1 9.5
% Difficulty Accessing Healthcare in Past Year (Composite)
37.2 d d 39.9 40.1
% Inconvenient Hrs Prevented Dr Visit in Past Year 14.5 d d 15.4 13.8

COMMUNITY HEALTH NEEDS ASSESSMENT
19
RCRH
Service Area
RCRH Service Area vs. Benchmarks
Access to Health Services (continued) vs. SD vs. US vs. HP2020 TREND
% Cost Prevented Getting Prescription in Past Year 9.1 B d 15.8 11.1
% Cost Prevented Physician Visit in Past Year 12.1 B B 18.2 16.7
% Difficulty Getting Appointment in Past Year 20.2 d d 17.0 18.1
% Difficulty Finding Physician in Past Year 14.4 h h 11.0 8.6
% Transportation Hindered Dr Visit in Past Year 3.8 B B 9.4 9.5
% Skipped Prescription Doses to Save Costs 7.8 B B 15.3 14.4
% Difficulty Getting Child's Healthcare in Past Year 2.1 B d 6.0 4.0
Primary Care Doctors per 100,000 73.0 h d 76.8 74.5
% [Age 18+] Have a Specific Source of Ongoing Care 74.7 d h d 76.3 95.0 75.4
% [Age 18-64] Have a Specific Source of Ongoing Care 73.3 d h d 75.6 89.4 74.6
% [Age 65+] Have a Specific Source of Ongoing Care 78.9 d h d 80.0 100.0 78.6
% Have Had Routine Checkup in Past Year 66.9 d d B 67.8 65.0 59.8
% Child Has Had Checkup in Past Year 79.4 d d 84.1 78.1
% Two or More ER Visits in Past Year 5.3 B B 8.9 9.8
% Rate Local Healthcare "Fair/Poor" 19.1 d d 16.5 16.9

COMMUNITY HEALTH NEEDS ASSESSMENT
20
RCRH
Service Area
RCRH Service Area vs. Benchmarks
Access to Health Services (continued) vs. SD vs. US vs. HP2020 TREND
% Outmigration for Medical Care 31.1
Live in a Health Professional Shortage Area (Percent) 23.4 B B 25.6 34.1
% Always/Nearly Always Need Someone to Help Read Health Info
2.8
% Health Info is Seldom/Never Spoken in an Easily Understood Way
5.7
B d h
better similar worse
RCRH
Service Area
RCRH Service Area vs. Benchmarks
Arthritis, Osteoporosis & Chronic Back Conditions vs. SD vs. US vs. HP2020 TREND
% [50+] Arthritis/Rheumatism 36.0 d d 37.3 38.3
% [50+] Osteoporosis 7.9 B d d 13.5 5.3 9.7
% Sciatica/Chronic Back Pain 21.8 d d 18.4 22.5
B d h
better similar worse
RCRH
Service Area
RCRH Service Area vs. Benchmarks
Cancer vs. SD vs. US vs. HP2020 TREND
Cancer (Age-Adjusted Death Rate) 166.7 d d d B 162.4 166.2 161.4 188.5
Prostate Cancer Incidence per 100,000 113.8 B B 142.0 142.3
Female Breast Cancer Incidence per 100,000 120.8 d d 122.0 122.7

COMMUNITY HEALTH NEEDS ASSESSMENT
21
RCRH
Service Area
RCRH Service Area vs. Benchmarks
Cancer (continued) vs. SD vs. US vs. HP2020 TREND
Lung Cancer Incidence per 100,000 64.1 h d 58.5 64.9
Colorectal Cancer Incidence per 100,000 43.1 B d 48.3 43.3
% Skin Cancer 9.5 h h h 6.5 6.7 6.3
% Cancer (Other Than Skin) 6.9 d d d 6.7 6.1 4.9
% [Women 50-74] Mammogram in Past 2 Years 74.2 d h h d 77.1 83.6 81.1 75.0
% [Women 21-65] Pap Smear in Past 3 Years 67.3 h h h h 79.1 83.9 93.0 75.8
% [Age 50-75] Colorectal Cancer Screening 70.0 d d d 75.1 70.5 63.3
B d h
better similar worse
RCRH
Service Area
RCRH Service Area vs. Benchmarks
Chronic Kidney Disease vs. SD vs. US vs. HP2020 TREND
Kidney Disease (Age-Adjusted Death Rate) 4.2 B B B 5.3 13.2 7.8
% Kidney Disease 1.8 d d 2.5 3.0
B d h
better similar worse
COMMUNITY HEALTH NEEDS ASSESSMENT
22
RCRH Service
Area
RCRH Service Area vs. Benchmarks
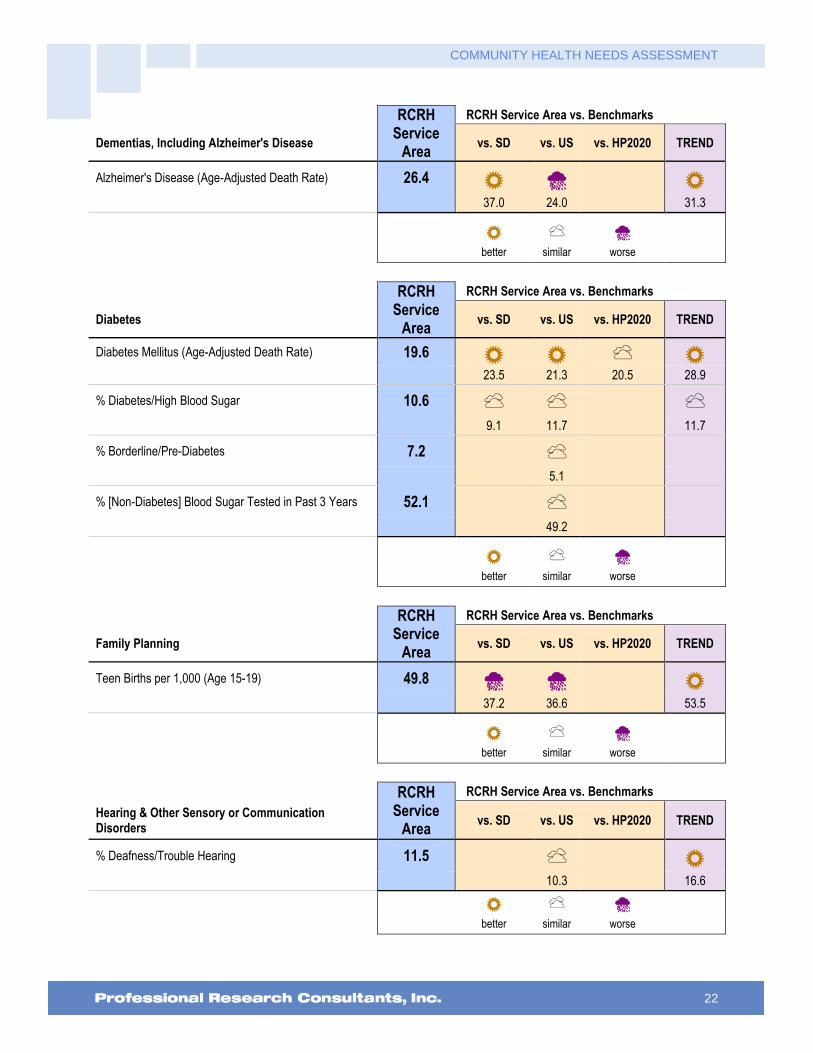
Dementias, Including Alzheimer's Disease vs. SD vs. US vs. HP2020 TREND
Alzheimer's Disease (Age-Adjusted Death Rate) 26.4 B h B 37.0 24.0 31.3
B d h
better similar worse
RCRH Service
Area
RCRH Service Area vs. Benchmarks
Diabetes vs. SD vs. US vs. HP2020 TREND
Diabetes Mellitus (Age-Adjusted Death Rate) 19.6 B B d B 23.5 21.3 20.5 28.9
% Diabetes/High Blood Sugar 10.6 d d d 9.1 11.7 11.7
% Borderline/Pre-Diabetes 7.2 d 5.1
% [Non-Diabetes] Blood Sugar Tested in Past 3 Years 52.1 d 49.2
B d h
better similar worse
RCRH
Service Area
RCRH Service Area vs. Benchmarks
Family Planning vs. SD vs. US vs. HP2020 TREND
Teen Births per 1,000 (Age 15-19) 49.8 h h B 37.2 36.6 53.5
B d h
better similar worse
RCRH
Service Area
RCRH Service Area vs. Benchmarks
Hearing & Other Sensory or Communication Disorders
vs. SD vs. US vs. HP2020 TREND
% Deafness/Trouble Hearing 11.5 d B 10.3 16.6
B d h
better similar worse

COMMUNITY HEALTH NEEDS ASSESSMENT
23
RCRH
Svc Area
RCRH Service Area vs. Benchmarks
Heart Disease & Stroke vs. SD vs. US vs. HP2020 TREND
Diseases of the Heart (Age-Adjusted Death Rate) 149.7 d B d B 153.2 171.3 156.9 191.3
Stroke (Age-Adjusted Death Rate) 34.3 B B d B 39.2 37.0 34.8 40.5
% Heart Disease (Heart Attack, Angina, Coronary Disease)
6.8 d d 6.1 7.9
% Stroke 1.7 d B B 2.8 3.9 3.8
% Blood Pressure Checked in Past 2 Years 94.9 B B d 91.0 92.6 96.9
% Told Have High Blood Pressure (Ever) 31.3 d d h d 30.7 34.1 26.9 36.4
% [HBP] Taking Action to Control High Blood Pressure 91.9 d B 89.2 84.0
% Cholesterol Checked in Past 5 Years 89.6 d B d 86.6 82.1 88.4
% Told Have High Cholesterol (Ever) 32.5 d h d 29.9 13.5 31.6
% [HBC] Taking Action to Control High Blood Cholesterol
92.3 B B 81.4 85.4
% 1+ Cardiovascular Risk Factor 83.4 d d 82.3 85.1
B d h
better similar worse
RCRH
Svc Area
RCRH Service Area vs. Benchmarks
HIV vs. SD vs. US vs. HP2020 TREND
HIV/AIDS (Age-Adjusted Death Rate) 1.7 h B B 0.8 3.2 3.3
% [Age 18-44] HIV Test in the Past Year 24.8 d d 19.3 18.5
B d h
better similar worse

COMMUNITY HEALTH NEEDS ASSESSMENT
24
RCRH
Service Area
RCRH Service Area vs. Benchmarks
Immunization & Infectious Diseases vs. SD vs. US vs. HP2020 TREND
% [Age 65+] Flu Vaccine in Past Year 48.4 h d h h 71.3 57.5 70.0 74.5
% [High-Risk 18-64] Flu Vaccine in Past Year 36.0 d h d 45.9 70.0 46.2
% [Age 65+] Pneumonia Vaccine Ever 78.9 B B h B 65.4 68.4 90.0 67.4
% [High-Risk 18-64] Pneumonia Vaccine Ever 42.5 d h d 41.9 60.0 32.1
% Have Completed Hepatitis B Vaccination Series 44.9 d d 44.7 40.6
B d h
better similar worse
RCRH
Service Area
RCRH Service Area vs. Benchmarks
Injury & Violence Prevention vs. SD vs. US vs. HP2020 TREND
Unintentional Injury (Age-Adjusted Death Rate) 51.9 h h h B 46.4 39.2 36.4 55.8
Motor Vehicle Crashes (Age-Adjusted Death Rate) 14.2 d h h B 14.6 10.7 12.4 24.2
% "Always" Wear Seat Belt 71.9 B h h d 65.2 84.8 92.0 70.3
% Child [Age 0-17] "Always" Uses Seat Belt/Car Seat 89.4 d d 92.2 87.6
% Child [Age 5-17] "Always" Wears Bicycle Helmet 43.1 d d 48.7 38.8
Firearm-Related Deaths (Age-Adjusted Death Rate) 13.3 h h h h 9.3 10.4 9.3 12.1
% Firearm in Home 56.2 h d 34.7 58.8
% [Homes With Children] Firearm in Home 57.5 h d 37.4 62.5

COMMUNITY HEALTH NEEDS ASSESSMENT
25
RCRH
Service Area
RCRH Service Area vs. Benchmarks
Injury & Violence Prevention (continued) vs. SD vs. US vs. HP2020 TREND
% [Homes With Firearms] Weapon(s) Unlocked & Loaded
19.1 d d 16.8 20.7
Homicide (Age-Adjusted Death Rate) 3.5 h B B 2.8 5.7 5.5
Violent Crime per 100,000 305.7 d B 295.0 395.5
% Victim of Violent Crime in Past 5 Years 1.5 d d 2.8 3.0
% Victim of Domestic Violence (Ever) 11.0 B d 15.0 11.1
B d h
better similar worse
RCRH
Service Area
RCRH Service Area vs. Benchmarks
Maternal, Infant & Child Health vs. SD vs. US vs. HP2020 TREND
Low Birthweight Births (Percent) 7.1 h B B 6.5 8.2 7.8
Infant Death Rate 7.5 d h h B 7.3 6.0 6.0 9.2
B d h
better similar worse
RCRH
Service Area
RCRH Service Area vs. Benchmarks
Mental Health & Mental Disorders vs. SD vs. US vs. HP2020 TREND
% "Fair/Poor" Mental Health 8.4 B d 11.9 6.6
% Diagnosed Depression 15.0 B 20.4
% Symptoms of Chronic Depression (2+ Years) 23.7 B d 30.4 21.2
COMMUNITY HEALTH NEEDS ASSESSMENT
26
RCRH
Service Area
RCRH Service Area vs. Benchmarks
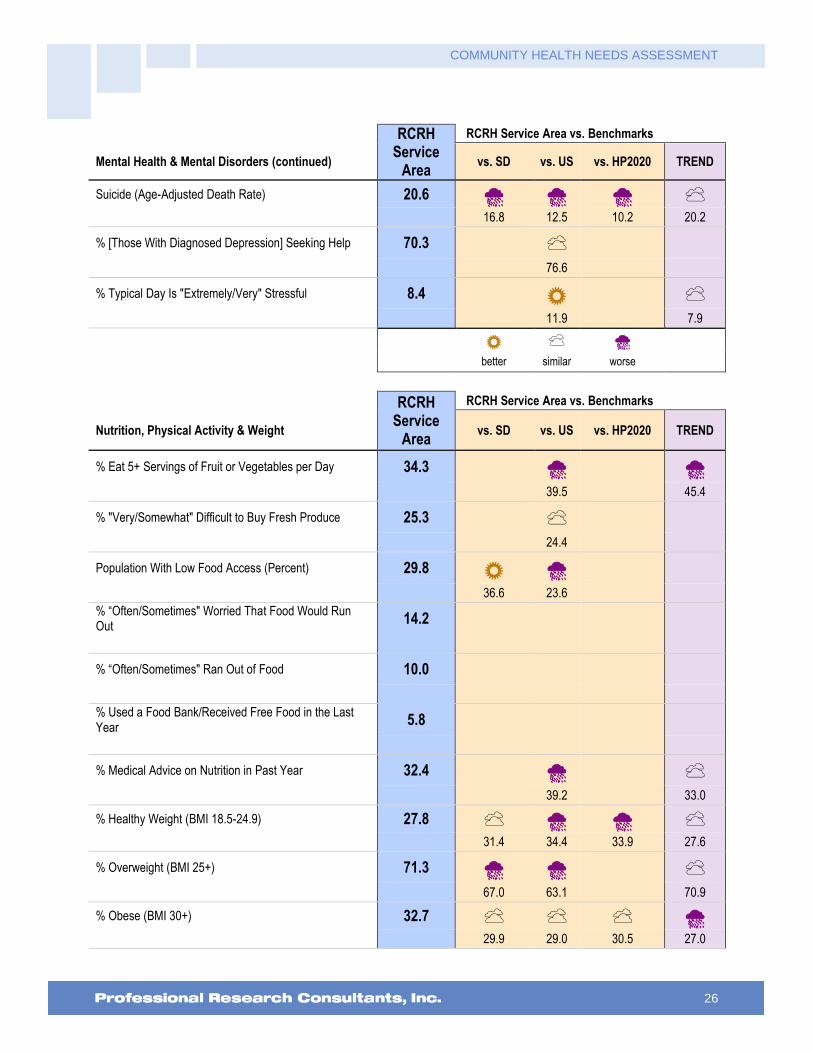
Mental Health & Mental Disorders (continued) vs. SD vs. US vs. HP2020 TREND
Suicide (Age-Adjusted Death Rate) 20.6 h h h d 16.8 12.5 10.2 20.2
% [Those With Diagnosed Depression] Seeking Help 70.3 d 76.6
% Typical Day Is "Extremely/Very" Stressful 8.4 B d 11.9 7.9
B d h
better similar worse
RCRH
Service Area
RCRH Service Area vs. Benchmarks
Nutrition, Physical Activity & Weight vs. SD vs. US vs. HP2020 TREND
% Eat 5+ Servings of Fruit or Vegetables per Day 34.3 h h 39.5 45.4
% "Very/Somewhat" Difficult to Buy Fresh Produce 25.3 d 24.4
Population With Low Food Access (Percent) 29.8 B h 36.6 23.6
% “Often/Sometimes" Worried That Food Would Run Out
14.2
% “Often/Sometimes" Ran Out of Food 10.0
% Used a Food Bank/Received Free Food in the Last Year
5.8
% Medical Advice on Nutrition in Past Year 32.4 h d 39.2 33.0
% Healthy Weight (BMI 18.5-24.9) 27.8 d h h d 31.4 34.4 33.9 27.6
% Overweight (BMI 25+) 71.3 h h d 67.0 63.1 70.9
% Obese (BMI 30+) 32.7 d d d h 29.9 29.0 30.5 27.0

COMMUNITY HEALTH NEEDS ASSESSMENT
27
RCRH
Service Area
RCRH Service Area vs. Benchmarks
Nutrition, Physical Activity & Weight (continued) vs. SD vs. US vs. HP2020 TREND
% Medical Advice on Weight in Past Year 20.8 d d 23.7 18.4
% [Overweights] Counseled About Weight in Past Year 24.1 h d 31.8 22.2
% [Obese Adults] Counseled About Weight in Past Year 34.2 h d 48.3 31.2
% [Overweights] Trying to Lose Weight Both Diet/Exercise
38.1 d B 39.5 30.5
% Child [Age 5-17] Healthy Weight 59.2 d d 56.7 67.8
% Children [Age 5-17] Overweight (85th Percentile) 25.1 d d 31.5 32.3
% Children [Age 5-17] Obese (95th Percentile) 16.4 d d d 14.8 14.5 11.6
% No Leisure-Time Physical Activity 18.9 B d B d 23.9 20.7 32.6 21.9
% Meeting Physical Activity Guidelines 47.4 d d 50.3 48.5
% Moderate Physical Activity 29.1 d d 30.6 29.0
% Vigorous Physical Activity 36.6 d d 38.0 38.5
Recreation/Fitness Facilities per 100,000 13.2 B B 11.9 9.7
% Medical Advice on Physical Activity in Past Year 39.3 d d 44.0 41.2
% Child [Age 2-17] Physically Active 1+ Hours per Day 55.9 d 48.6
B d h
better similar worse

COMMUNITY HEALTH NEEDS ASSESSMENT
28
RCRH Service
Area
RCRH Service Area vs. Benchmarks
Oral Health vs. SD vs. US vs. HP2020 TREND
% [Age 18+] Dental Visit in Past Year 71.4 d B B B 70.9 65.9 49.0 59.0
% Child [Age 2-17] Dental Visit in Past Year 89.4 B B B 81.5 49.0 76.7
% Have Dental Insurance 59.4 h d 65.6 58.5
B d h
better similar worse
RCRH
Service Area
RCRH Service Area vs. Benchmarks
Respiratory Diseases vs. SD vs. US vs. HP2020 TREND
CLRD (Age-Adjusted Death Rate) 46.7 h h B 44.1 42.0 53.1
Pneumonia/Influenza (Age-Adjusted Death Rate) 16.5 d h B 16.4 15.3 17.9
% COPD (Lung Disease) 8.3 h d B 4.5 8.6 14.2
% [Adult] Currently Has Asthma 6.8 B d B 11.8 9.4 10.3
% [Child 0-17] Currently Has Asthma 4.3 d B 7.1 10.0
B d h
better similar worse
RCRH Service
Area
RCRH Service Area vs. Benchmarks
Sexually Transmitted Diseases vs. SD vs. US vs. HP2020 TREND
Gonorrhea Incidence per 100,000 165.5 h h 85.8 107.5
Chlamydia Incidence per 100,000 664.0 h h 476.2 456.7

COMMUNITY HEALTH NEEDS ASSESSMENT
29
RCRH Service
Area
RCRH Service Area vs. Benchmarks
Sexually Transmitted Diseases (continued) vs. SD vs. US vs. HP2020 TREND
% [Unmarried 18-64] 3+ Sexual Partners in Past Year 5.5 B d 11.7 7.9
% [Unmarried 18-64] Using Condoms 24.0 d h 33.6 41.4
B d h
better similar worse
RCRH
Service Area
RCRH Service Area vs. Benchmarks
Substance Abuse vs. SD vs. US vs. HP2020 TREND
Cirrhosis/Liver Disease (Age-Adjusted Death Rate) 19.5 h h h h 12.8 9.9 8.2 16.5
% Current Drinker 59.2 d d d 57.8 56.5 58.1
% Excessive Drinker 14.4 B B B 23.2 25.4 19.2
% Drinking & Driving in Past Month 1.6 B d 5.0 1.3
Drug-Induced Deaths (Age-Adjusted Death Rate) 8.3 h B B B 6.8 14.1 11.3 11.0
% Illicit Drug Use in Past Month 1.2 B B d 4.0 7.1 0.8
% Ever Sought Help for Alcohol or Drug Problem 4.1 d d 4.9 5.1
B d h
better similar worse

COMMUNITY HEALTH NEEDS ASSESSMENT
30
RCRH
Service Area
RCRH Service Area vs. Benchmarks
Tobacco Use vs. SD vs. US vs. HP2020 TREND
% Current Smoker 14.8 B d d B 19.6 14.9 12.0 23.8
% Someone Smokes at Home 9.6 B B 12.7 14.1
% [Nonsmokers] Someone Smokes in the Home 3.9 B d 6.3 6.6
% [Household With Children] Someone Smokes in the Home
6.1 d d 9.7 7.3
% Smoke Cigars 3.1 d h d 4.1 0.2 2.8
% Use Smokeless Tobacco 6.2 d d h d 6.6 4.0 0.3 5.8
B d h
better similar worse
RCRH
Service Area
RCRH Service Area vs. Benchmarks
Vision vs. SD vs. US vs. HP2020 TREND
% Blindness/Trouble Seeing 6.4 h d d 3.1 8.5 8.6
% Eye Exam in Past 2 Years 61.4 d d 56.8 62.8
B d h
better similar worse

Data Charts &
Key Informant Input

COMMUNITY HEALTH NEEDS ASSESSMENT
32
Community Characteristics
Population Characteristics
Data from the US Census Bureau reveal the following statistics for our community relative to size, population,
density, age, race/ethnicity and language. Keep in mind:
A significant positive or negative shift in total population over time impacts healthcare providers and
the utilization of community resources.
Urban areas are identified using population density, count, and size thresholds. Urban areas also
include territory with a high degree of impervious surface (development). Rural areas are all areas that
are not urban.
It is important to understand the age distribution of the population as different age groups have unique
health needs which should be considered separately from others along the age spectrum.
Sources: � Community Commons. Retrieved November 2015 from http://www.chna.org.
Notes: � Data are derived from the US Census Bureau American Community Survey 5-year estimates (2008-2012).
RCRH
Service AreaSouth Dakota United States
Total Population 192,304 825,198 311,536,591
Total Land Area (sq. miles) 14,684.30 75,790.85 3,530,997.60
Population Density 13.1 10.89 88.23
2000-2010 Population Change 10.9% 7.9% 9.7%
Urban Population 64.6% 56.7% 80.9%
Age 0-17 24.3% 24.7% 23.7%
Age 18-64 61.3% 60.8% 62.9%
Age 65+ 14.4% 14.5% 13.4%
White Alone 81.2% 85.6% 74.0%
Native American/Alaskan Native 12.7% 8.7% 0.8%
Some Other Race 2.5% 3.4% 22.4%
Multiple Races 3.6% 2.3% 2.8%
Hispanic or Latino 3.6% 3.0% 16.6%
2000-2010 Hispanic Population Change 62.2% 102.9% 42.7%
Linguistically Isolated Population 0.4% 1.3% 4.8%
Population Characteristics
COMMUNITY HEALTH NEEDS ASSESSMENT
33
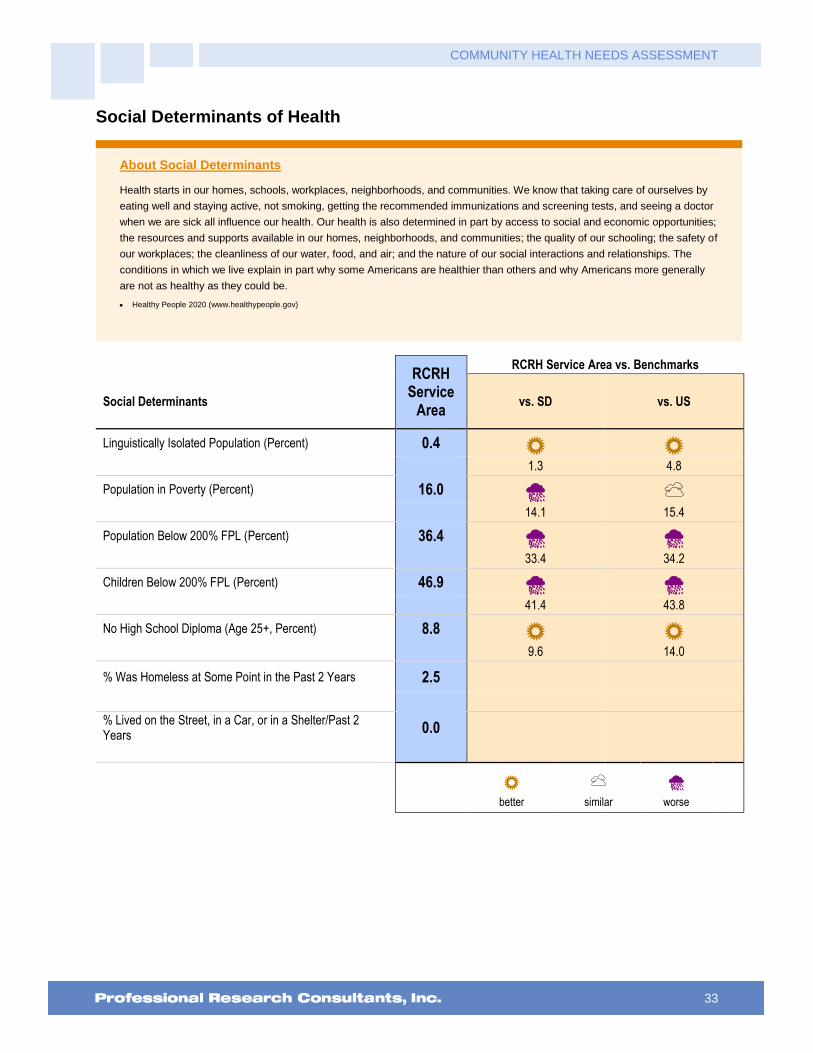
Social Determinants of Health
About Social Determinants
Health starts in our homes, schools, workplaces, neighborhoods, and communities. We know that taking care of ourselves by
eating well and staying active, not smoking, getting the recommended immunizations and screening tests, and seeing a doctor
when we are sick all influence our health. Our health is also determined in part by access to social and economic opportunities;
the resources and supports available in our homes, neighborhoods, and communities; the quality of our schooling; the safety of
our workplaces; the cleanliness of our water, food, and air; and the nature of our social interactions and relationships. The
conditions in which we live explain in part why some Americans are healthier than others and why Americans more generally
are not as healthy as they could be.
Healthy People 2020 (www.healthypeople.gov)
RCRH
Service Area
RCRH Service Area vs. Benchmarks
Social Determinants vs. SD vs. US
Linguistically Isolated Population (Percent) 0.4 B B 1.3 4.8
Population in Poverty (Percent) 16.0 h d 14.1 15.4
Population Below 200% FPL (Percent) 36.4 h h 33.4 34.2
Children Below 200% FPL (Percent) 46.9 h h 41.4 43.8
No High School Diploma (Age 25+, Percent) 8.8 B B 9.6 14.0
% Was Homeless at Some Point in the Past 2 Years 2.5
% Lived on the Street, in a Car, or in a Shelter/Past 2 Years
0.0
B d h
better similar worse

COMMUNITY HEALTH NEEDS ASSESSMENT
34
The following chart outlines the proportion of our population below the federal poverty threshold, as well as
below 200% of the federal poverty level, in comparison to state and national proportions.
Population in Poverty(Populations Living Below 100% and Below 200% of the Poverty Level; 2009-2013)
Sources: � US Census Bureau American Community Survey 5-year estimates (2009-2013).
� Retrieved November 2015 from Community Commons at http://www.chna.org.
Notes: � Poverty is considered a key driver of health status. This indicator is relevant because poverty creates barriers to access including health services, healthy food,
and other necessities that contribute to poor health status.
16.0% 14.1% 15.4%
36.4%33.4% 34.2%
RCRH SD US
0%
20%
40%
60%
80%
100%
<100% of Poverty <200% of Poverty
Education levels are reflected in the proportion of our population without a high school diploma:
Population With No High School Diploma(Population Age 25+ Without a High School Diploma or Equivalent, 2009-2013)
Sources: � US Census Bureau American Community Survey 5-year estimates (2009-2013).
� Retrieved November 2015 from Community Commons at http://www.chna.org.
Notes: � This indicator is relevant because educational attainment is linked to positive health outcomes.
8.8% 9.6%14.0%
RCRH SD US
0%
20%
40%
60%
80%
100%

COMMUNITY HEALTH NEEDS ASSESSMENT
35
“Because of an emergency, have you had to live with a friend or relative in the past two years, even if
this was only temporary?”
“Has there been any time in the past two years when you were living on the street, in a car, or in a
temporary shelter?”
Was Homeless at Some Point in the Past 2 Years
Sources: � 2015 PRC Community Health Survey, Professional Research Consultants, Inc. [Item 311]
Notes: � Asked of all respondents.
2.5%
0%
20%
40%
60%
80%
100%
RCRH
Note: No respondents reported living on the
street, in a car, or in a shelter in the past 2 years.

COMMUNITY HEALTH NEEDS ASSESSMENT
36
General Health Status
Overall Health Status
Self-Reported Health Status
The initial inquiry of the PRC Community Health Survey asked respondents the following:
“Would you say that in general your health is: excellent, very good, good, fair or poor?”
Self-Reported Health Status(RCRH Service Area, 2015)
Sources: � 2015 PRC Community Health Survey, Professional Research Consultants, Inc. [Item 5]
Notes: � Asked of all respondents.
Excellent 18.5%
Very Good 38.0%
Good 31.0%Fair 10.3%
Poor 2.3%
The following charts further detail “fair/poor” overall health responses in the RCRH Service Area in comparison
to benchmark data, as well as by basic demographic characteristics (namely by gender, age groupings, income
[based on poverty status], and race/ethnicity).
Experience “Fair” or “Poor” Overall Health
Sources: � PRC Community Health Surveys, Professional Research Consultants, Inc. [Item 5]
� Behavioral Risk Factor Surveillance System Survey Data. Atlanta, Georgia. United States Department of Health and Human Services, Centers for Disease Control
and Prevention (CDC): 2013 South Dakota data.
� 2013 PRC National Health Survey, Professional Research Consultants, Inc.
Notes: � Asked of all respondents.
12.6% 12.7%15.3%
0%
20%
40%
60%
80%
100%
RCRH SD US
14.5% 12.6%
2012 2015
RCRH Service Area

COMMUNITY HEALTH NEEDS ASSESSMENT
37
Experience “Fair” or “Poor” Overall Health(RCRH Service Area, 2015)
Sources: � 2015 PRC Community Health Survey, Professional Research Consultants, Inc. [Item 5]
Notes: � Asked of all respondents.
� Hispanics can be of any race. Other race categories are non-Hispanic categorizations (e.g., “White” reflects non-Hispanic White respondents).
� Income categories reflect respondent's household income as a ratio to the federal poverty level (FPL) for their household size. “Low Income” includes households
with incomes up to 200% of the federal poverty level; “Mid/High Income” includes households with incomes at 200% or more of the federal poverty level.
9.5%15.6%
7.3%13.7%
21.7%18.9%
8.9% 11.1%
21.4%
12.6%
0%
20%
40%
60%
80%
100%
Men Women 18 to 39 40 to 64 65+ LowIncome
Mid/HighIncome
NH White Other Overall
Activity Limitations
About Disability & Health
An individual can get a disabling impairment or chronic condition at any point in life. Compared with people without disabilities,
people with disabilities are more likely to:
Experience difficulties or delays in getting the health care they need.
Not have had an annual dental visit.
Not have had a mammogram in past 2 years.
Not have had a Pap test within the past 3 years.
Not engage in fitness activities.
Use tobacco.
Be overweight or obese.
Have high blood pressure.
Experience symptoms of psychological distress.
Receive less social-emotional support.
Have lower employment rates.
There are many social and physical factors that influence the health of people with disabilities. The following three areas for
public health action have been identified, using the International Classification of Functioning, Disability, and Health (ICF) and
the three World Health Organization (WHO) principles of action for addressing health determinants.
Improve the conditions of daily life by: encouraging communities to be accessible so all can live in, move through, and interact with their environment; encouraging community living; and removing barriers in the environment using both physical universal design concepts and operational policy shifts.
Address the inequitable distribution of resources among people with disabilities and those without disabilities by increasing: appropriate health care for people with disabilities; education and work opportunities; social participation; and access to needed technologies and assistive supports.
Expand the knowledge base and raise awareness about determinants of health for people with disabilities by increasing: the inclusion of people with disabilities in public health data collection efforts across the lifespan; the inclusion of people with disabilities in health promotion activities; and the expansion of disability and health training opportunities for public health and health care professionals.
Healthy People 2020 (www.healthypeople.gov)

COMMUNITY HEALTH NEEDS ASSESSMENT
38
“Are you limited in any way in any activities because of physical, mental or emotional problems?”
Limited in Activities in Some Way
Due to a Physical, Mental or Emotional Problem
Sources: � PRC Community Health Surveys, Professional Research Consultants, Inc. [Item 105]
� Behavioral Risk Factor Surveillance System Survey Data. Atlanta, Georgia. United States Department of Health and Human Services, Centers for Disease Control
and Prevention (CDC): 2013 South Dakota data.
� 2013 PRC National Health Survey, Professional Research Consultants, Inc.
Notes: � Asked of all respondents.
22.7%18.1%
2012 2015
18.1% 18.9%21.5%
0%
20%
40%
60%
80%
100%
RCRH SD US
RCRH Service Area
Limited in Activities in Some Way
Due to a Physical, Mental or Emotional Problem(RCRH Service Area, 2015)
Sources: � 2015 PRC Community Health Survey, Professional Research Consultants, Inc. [Item 105]
Notes: � Asked of all respondents.
� Hispanics can be of any race. Other race categories are non-Hispanic categorizations (e.g., “White” reflects non-Hispanic White respondents).
� Income categories reflect respondent's household income as a ratio to the federal poverty level (FPL) for their household size. “Low Income” includes households
with incomes up to 200% of the federal poverty level; “Mid/High Income” includes households with incomes at 200% or more of the federal poverty level.
15.0%21.1%
6.0%
21.5%
36.1%
21.8%15.6% 17.6% 19.4% 18.1%
0%
20%
40%
60%
80%
100%
Men Women 18 to 39 40 to 64 65+ LowIncome
Mid/HighIncome
NH White Other Overall

COMMUNITY HEALTH NEEDS ASSESSMENT
39
Mental Health
About Mental Health & Mental Disorders
Mental health is a state of successful performance of mental function, resulting in productive activities, fulfilling relationships
with other people, and the ability to adapt to change and to cope with challenges. Mental health is essential to personal well-
being, family and interpersonal relationships, and the ability to contribute to community or society. Mental disorders are health
conditions that are characterized by alterations in thinking, mood, and/or behavior that are associated with distress and/or
impaired functioning. Mental disorders contribute to a host of problems that may include disability, pain, or death. Mental illness
is the term that refers collectively to all diagnosable mental disorders. Mental disorders are among the most common causes
of disability. The resulting disease burden of mental illness is among the highest of all diseases.
Mental health and physical health are closely connected. Mental health plays a major role in people’s ability to maintain good
physical health. Mental illnesses, such as depression and anxiety, affect people’s ability to participate in health-promoting
behaviors. In turn, problems with physical health, such as chronic diseases, can have a serious impact on mental health and
decrease a person’s ability to participate in treatment and recovery.
The existing model for understanding mental health and mental disorders emphasizes the interaction of social, environmental,
and genetic factors throughout the lifespan. In behavioral health, researchers identify: risk factors, which predispose
individuals to mental illness; and protective factors, which protect them from developing mental disorders. Researchers now
know that the prevention of mental, emotional, and behavioral (MEB) disorders is inherently interdisciplinary and draws on a
variety of different strategies. Over the past 20 years, research on the prevention of mental disorders has progressed. The
major areas of progress include evidence that:
MEB disorders are common and begin early in life.
The greatest opportunity for prevention is among young people.
There are multiyear effects of multiple preventive interventions on reducing substance abuse, conduct disorder, antisocial behavior, aggression, and child maltreatment.
The incidence of depression among pregnant women and adolescents can be reduced.
School-based violence prevention can reduce the base rate of aggressive problems in an average school by 25 to 33%.
There are potential indicated preventive interventions for schizophrenia.
Improving family functioning and positive parenting can have positive outcomes on mental health and can reduce poverty-related risk.
School-based preventive interventions aimed at improving social and emotional outcomes can also improve academic outcomes.
Interventions targeting families dealing with adversities, such as parental depression or divorce, can be effective in reducing risk for depression in children and increasing effective parenting.
Some preventive interventions have benefits that exceed costs, with the available evidence strongest for early childhood interventions.
Implementation is complex, it is important that interventions be relevant to the target audiences.
In addition to advancements in the prevention of mental disorders, there continues to be steady progress in treating mental disorders as new drugs and stronger evidence-based outcomes become available.
Healthy People 2020 (www.healthypeople.gov)
Self-Reported Mental Health Status
“Now thinking about your mental health, which includes stress, depression and problems with
emotions, would you say that, in general, your mental health is: excellent, very good, good, fair or
poor?”

COMMUNITY HEALTH NEEDS ASSESSMENT
40
Self-Reported Mental Health Status(RCRH Service Area, 2015)
Sources: � 2015 PRC Community Health Survey, Professional Research Consultants, Inc. [Item 100]
Notes: � Asked of all respondents.
Excellent 30.8%
Very Good 32.8%
Good 27.9% Fair 7.3%
Poor 1.1%
Experience “Fair” or “Poor” Mental Health
Sources: � PRC Community Health Surveys, Professional Research Consultants, Inc. [Item 100]
� 2013 PRC National Health Survey, Professional Research Consultants, Inc.
Notes: � Asked of all respondents.
6.6% 8.4%
2012 2015
8.4%11.9%
0%
20%
40%
60%
80%
100%
RCRH US
RCRH Service Area

COMMUNITY HEALTH NEEDS ASSESSMENT
41
Experience “Fair” or “Poor” Mental Health(RCRH Service Area, 2015)
Sources: � 2015 PRC Community Health Survey, Professional Research Consultants, Inc. [Item 100]
Notes: � Asked of all respondents.
� Hispanics can be of any race. Other race categories are non-Hispanic categorizations (e.g., “White” reflects non-Hispanic White respondents).
� Income categories reflect respondent's household income as a ratio to the federal poverty level (FPL) for their household size. “Low Income” includes households
with incomes up to 200% of the federal poverty level; “Mid/High Income” includes households with incomes at 200% or more of the federal poverty level.
6.6%10.3% 12.7%
7.3%3.7%
11.6%7.6% 8.0%
11.3%8.5%
0%
20%
40%
60%
80%
100%
Men Women 18 to 39 40 to 64 65+ LowIncome
Mid/HighIncome
NH White Other Overall
Depression
Diagnosed Depression: “Has a doctor or other healthcare provider ever told you that you have a
depressive disorder, including depression, major depression, dysthymia, or minor depression?”
Symptoms of Chronic Depression: “Have you had two years or more in your life when you felt
depressed or sad most days, even if you felt okay sometimes?”
Have Been Diagnosed With a Depressive Disorder
Sources: � 2015 PRC Community Health Survey, Professional Research Consultants, Inc. [Item 103]
� 2013 PRC National Health Survey, Professional Research Consultants, Inc.
Notes: � Asked of all respondents.
� Depressive disorders include depression, major depression, dysthymia, or minor depression.
15.0%20.4%
0%
20%
40%
60%
80%
100%
RCRH US
COMMUNITY HEALTH NEEDS ASSESSMENT
42
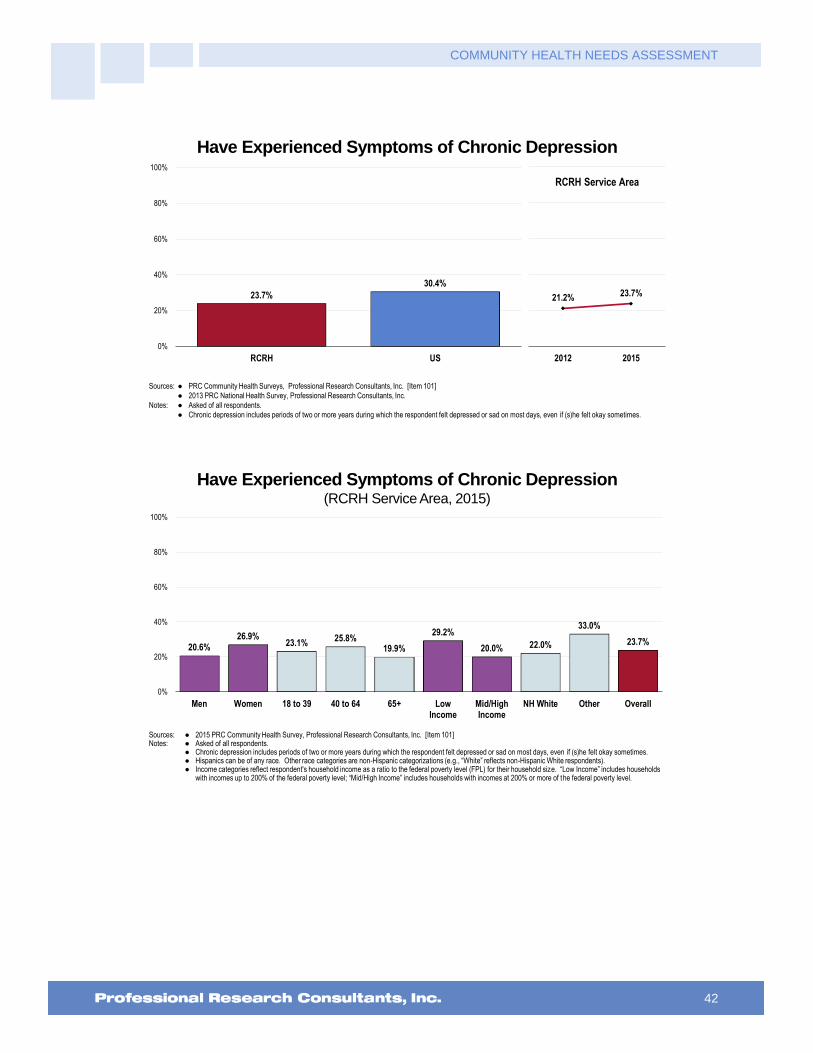
Have Experienced Symptoms of Chronic Depression
Sources: � PRC Community Health Surveys, Professional Research Consultants, Inc. [Item 101]
� 2013 PRC National Health Survey, Professional Research Consultants, Inc.
Notes: � Asked of all respondents.
� Chronic depression includes periods of two or more years during which the respondent felt depressed or sad on most days, even if (s)he felt okay sometimes.
23.7%
30.4%
0%
20%
40%
60%
80%
100%
RCRH US
21.2% 23.7%
2012 2015
RCRH Service Area
Have Experienced Symptoms of Chronic Depression(RCRH Service Area, 2015)
Sources: � 2015 PRC Community Health Survey, Professional Research Consultants, Inc. [Item 101]Notes: � Asked of all respondents.
� Chronic depression includes periods of two or more years during which the respondent felt depressed or sad on most days, even if (s)he felt okay sometimes.� Hispanics can be of any race. Other race categories are non-Hispanic categorizations (e.g., “White” reflects non-Hispanic White respondents).� Income categories reflect respondent's household income as a ratio to the federal poverty level (FPL) for their household size. “Low Income” includes households
with incomes up to 200% of the federal poverty level; “Mid/High Income” includes households with incomes at 200% or more of the federal poverty level.
20.6%26.9%
23.1%25.8%
19.9%
29.2%
20.0% 22.0%
33.0%
23.7%
0%
20%
40%
60%
80%
100%
Men Women 18 to 39 40 to 64 65+ LowIncome
Mid/HighIncome
NH White Other Overall

COMMUNITY HEALTH NEEDS ASSESSMENT
43
Stress
“Thinking about the amount of stress in your life, would you say that most days are: extremely
stressful, very stressful, moderately stressful, not very stressful or not at all stressful?”
Perceived Level of Stress On a Typical Day(RCRH Service Area, 2015)
Sources: � 2015 PRC Community Health Survey, Professional Research Consultants, Inc. [Item 102]
Notes: � Asked of all respondents.
Extremely Stressful0.9%
Very Stressful 7.5%
Moderately Stressful46.8%
Not Very Stressful32.1%
Not At All Stressful12.7%
Perceive Most Days As “Extremely” or “Very” Stressful
Sources: � PRC Community Health Surveys, Professional Research Consultants, Inc. [Item 102]
� 2013 PRC National Health Survey, Professional Research Consultants, Inc.
Notes: � Asked of all respondents.
8.4%11.9%
0%
20%
40%
60%
80%
100%
RCRH US
7.9% 8.4%
2012 2015
RCRH Service Area

COMMUNITY HEALTH NEEDS ASSESSMENT
44
Suicide
The following chart outlines the most current age-adjusted mortality rates attributed to suicide in our population.
(Refer to “Leading Causes of Death” for an explanation of the use of age-adjusting for these rates.)
Suicide: Age-Adjusted Mortality Trends(Annual Average Deaths per 100,000 Population)
Healthy People 2020 Target = 10.2 or Lower
Sources: � CDC WONDER Online Query System. Centers for Disease Control and Prevention, Epidemiology Program Office, Division of Public Health Surveillance
and Informatics. Data extracted November 2015.
� US Department of Health and Human Services. Healthy People 2020. December 2010. http://www.healthypeople.gov [Objective MHMD-1]
Notes: � Deaths are coded using the Tenth Revision of the International Statistical Classification of Diseases and Related Health Problems (ICD-10).
� Rates are per 100,000 population, age-adjusted to the 2000 US Standard Population.
2004-2006 2005-2007 2006-2008 2007-2009 2008-2010 2009-2011 2010-2012 2011-2013
RCRH 20.2 20.1 18.0 17.7 20.3 21.0 20.9 20.6
SD 15.4 14.6 14.7 14.8 16.5 16.5 16.7 16.8
US 11.0 11.1 11.3 11.6 11.8 12.1 12.3 12.5
0
5
10
15
20
25
Mental Health Treatment
Treatment for Self
“Have you ever sought help from a professional for a mental or emotional problem?” (Among those
with a “diagnosed depressive disorder,” which includes respondents reporting a past diagnosis of a
depressive disorder by a physician [such as depression, major depression, dysthymia, or minor
depression]).

COMMUNITY HEALTH NEEDS ASSESSMENT
45
Adults With Diagnosed Depression Who Have Ever
Sought Professional Help for a Mental or Emotional Problem(Among Adults With Diagnosed Depressive Disorder)
Sources: � 2015 PRC Community Health Survey, Professional Research Consultants, Inc. [Item 123]
� 2013 PRC National Health Survey, Professional Research Consultants, Inc.
Notes: � Reflects those respondents with a depressive disorder diagnosed by a physician (such as depression, major depression, dysthymia, or minor depression).
70.3%
76.6%
0%
20%
40%
60%
80%
100%
RCRH US
Key Informant Input: Mental Health
The following chart outlines key informants’ perceptions of the severity of Mental Health as a problem in the
community:
Perceptions of Mental Health
as a Problem in the Community(Key Informants, 2015)
Sources: � PRC Online Key Informant Survey, Professional Research Consultants, Inc.
Notes: � Asked of all respondents.
57.7% 31.3% 8.9%
Major Problem Moderate Problem Minor Problem No Problem At All
Challenges
Among those rating this issue as a “major problem,” the following represent what key informants see as the
main challenges for persons with mental illness:
Access to Care/Services
Access to care and access to getting help. – Other Health Provider (Pennington County)
Access to mental healthcare other than Behavior Management Systems is lacking, particularly when it comes to addiction and psychiatric services. They also have poor coverage for counseling, leaving those without resources struggling. Furthermore, dementia care is a particular concern as we have limited resources for remaining independent and for treatment and guidance for disease progression. – Other Health Provider

COMMUNITY HEALTH NEEDS ASSESSMENT
46
(Pennington County)
Access to mental health is the biggest issue, especially inpatient care. There seems to be a significant increase in mental health concerns for children 10-17 years old in the past two years. Inpatient beds in the appropriate mental health facility are at a premium. Patients are often held in hospital beds until the appropriate mental health bed opens, and do not receive mental health services during this time. – Other Health Provider (Pennington County)
Lack of treatment available, affordable care, limited ways to address concerns, lack of support. – Other Health Provider (Pennington County)
Access to care is a challenge in Western South Dakota. Diagnosis and treatment and support for family members, are all supports that are not very available. – Other Health Provider (Black Hills Region)
Access to care, as described in the previous question. – Physician (Pennington County)
Access, Behavioral Management Services is frequently full. Patients dumped from Human Services into the city without adequate resources. – Other Health Provider (Pennington County)
Access to providers. – Other Health Provider (Lawrence County)
Access to adequate and affordable care. – Other Health Provider (Pennington County)
Access to care both inpatient and outpatient. – Physician (Pennington County)
Access. Fragmented. Not enough availability of prescribing providers for those with SPMI. Low income have little resources. – Other Health Provider (Pennington County)
Access and follow up with providers. – Physician (Lawrence County)
The nearest mental health facility is on the other side of the state. Transportation problems keep the patient in hospital with no beds available for this use. Security issues also associated with extended stays at hospital waiting for transportation. – Community/Business Leader (Pennington County)
Treatment and care. – Other Health Provider (Lawrence County)
Lack of access to basic mental health services. Lack of evidence based Practice related to mental healthcare. Limited number of inpatient beds for mental health patients. No inpatient adult substance abuse/chemical dependency specific unit. Limited number of outpatient resources for families. Poverty level in Western South Dakota. Limited access to Transcranial Magnetic Treatment or Electroconvulsive Treatments. – Other Health Provider (Pennington County)
Lack of access to proper treatment and in some cases diagnosis is limited in the area. The steps needed to initiate the proper care chain can lead to frustration for family members, especially if the person needing treatment is an adult. As with most of these healthcare issues in the area, mental health treatment is predominately found in Rapid City and not readily available throughout the surrounding communities. – Community/Business Leader (Pennington County)
Lack of access to mental health providers. – Physician (Black Hills region)
Access to services is our biggest challenge. Providers do not accept Medicaid. Our inpatient services are under scrutiny, and many of our mental health patients are housed at the main hospital instead of the Behavioral Health Center. – Other Health Provider (Pennington County)
Access to mental health services, identifying free programs, cutting counselors in the public school system. – Community/Business Leader (Pennington County)
Access to mental health providers to provide case management to reduce likelihood of crisis situation. Patients with mental health issues often don't have the means to travel the 60 miles to large communities for services. The family practice physician and the emergency department is often the site for management of these conditions with limited to no access to clinical social workers, therapists, case managers for medication compliance and assuring follow through on treatment plan, and psychiatrists. – Other Health Provider (Custer County)
Access to mental healthcare for those that cannot afford it. These people may be diagnose and may have medications prescribed, but they are not being followed to help them maintain. Part of this is non- compliance, but lack of funds for transportation to appointments, medication costs and direct supervision contributes to this. – Other Health Provider (Lawrence County)
Access to mental health providers/counselors. – Other Health Provider (Pennington County)
COMMUNITY HEALTH NEEDS ASSESSMENT
47
Unable to access care through the community mental health center or the community health clinic. Difficulty affording medications and limited access to case management services. – Social Services Provider (Pennington County)
Lack of Providers
There is no mental healthcare providers in this area. It is a huge concern as there aren't enough providers in any area of mental health. Access to any physician is difficult but mental health there just isn't any providers at all. – Other Health Provider (Meade County)
There are not enough mental health professionals to see the number of people with mental health issues. Full diagnostics are not run before prescribing medications. Could help to reduce mis-diagnosis or mis-treatment. – Community/Business Leader (Pennington County)
Lack of mental healthcare providers. – Other Health Provider (Pennington County)
There are not enough mental health providers in this area. They only take selected Medicaid and self-pay patients, which are the ones that need a lot of help. There are long waiting periods to be seen. Sometimes months for an appointment with BMS. – Other Health Provider (Pennington County)
Getting services, there are not enough providers, most of them only take a certain amount of patients on state assistance. For children it is almost impossible to get them into a provider unless admitted to the West Unit. – Other Health Provider (Pennington County)
Not enough mental healthcare providers/counselors/interventionalists. – Other Health Provider (Oglala Lakota County)
They cannot get to appointments outside of our community and do not have enough available mental health staff locally to help met the need and demand. – Other Health Provider (Meade County)
Our community is severely lacking qualified mental health professionals, which causes significant wait times for mental health assessments and quality care. – Social Services Provider (Pennington County)
Access to physiatrists' to prescribe and manage mental health medications. – Other Health Provider (Lawrence County)
Hard to access, few providers, cost. – Public Health Representative (Fall River County)
There is a lack of mental health providers and the crisis is acute with many people needing mental healthcare. There is a lack of resources all around in the mental health world. – Other Health Provider (Black Hills Region)
Behavioral health is short staffed not enough than other services unless you can afford to travel. – Public Health Representative (Oglala Lakota County)
Lack of Psychiatric care. Too many county holds clogging up the system, resulting in a higher suicide rate in Pennington County than in most other counties in the state. Even though it is coming down. Lack of fiscal parity with physical healthcare. – Other Health Provider (Pennington County)
Lack of providers. – Social Services Provider (Pennington County)
Limited Psychiatrists, especially child Psychiatrists. – Physician (Pennington County)
Need an adequate number of Psychiatrists and counselors, with adequate insurance coverage to pay to see them. Public understanding of mental health issues. – Physician (Pennington County)
We have a significant provider shortage in mental health. Compared to chemical dependency treatment with eligible providers requiring a bachelor’s degree or trainee status to bill Medicaid, mental health providers need masters to bill. There are 2-3 child Psychiatrists in Rapid City and perhaps less in the outlying areas. For child mental health, especially youth who are impoverished with Medicaid as their primary payment source, there are few options, limited transportation, and even fewer Medicaid eligible providers. We have tackled adult mental health with the crisis care center, but adolescents and children do not have this option yet. – Social Services Provider (Pennington County)
Very, very limited psychiatric care available especially for Medicaid, Medicare, or uninsured patients. Average waiting time is 6-8 weeks. 2) Organizations like Community Health that serve lower income folks don't have physicians that are comfortable prescribing psychiatric meds.3) Because of the low capacity in our community to treat mental health issues when they are still manageable, often times they end up turning into larger scale issues that need to be addressed in the E.D. or West. – Social Services Provider (Pennington County)

COMMUNITY HEALTH NEEDS ASSESSMENT
48
Very limited access to psychiatry. We have several psychiatrists in the area, more than half of them are over the age of 70. The nurse practitioners operating under the psychiatrists are of mixed utility regarding their diagnostic skills. Soon our community will need more psychiatrists, or access to Telehealth options. Psychology services are also limited, with most having to wait up to 2 or 3 months for outpatient treatment. – Other Health Provider (Pennington County)
Lack of professional providers is stunning. – Other Health Provider (Pennington County)
There are not enough providers that take Medicaid. – Other Health Provider (Meade County)
Providers with knowledge and skills to understand and treat today's mental health issues. Especially for young people. – Community/Business Leader (Meade County)
Finding a doctor that can administer medications and also take T19 patients. – Other Health Provider (Lawrence County)
Providers who offer sliding fees are often full. Some providers need to offer more cost effective programs. Lack of access to psychiatry is extreme, especially for those with limited resources. Few services available for autism. – Community/Business Leader (Pennington County)
Lack of Resources
There is a lack of resources for clients who have mental health needs. Most of the community based centers have a sliding fee scale, which many clients are unable to find the funds for the lowest fee of the scale. They have no extra funds for those types of services. – Public Health Representative (Pennington County)
Lack of resources that continue to follow mentally ill patients, making sure that they take their medications appropriately, making sure that they are compliant with follow ups to their doctors. – Other Health Provider (Pennington County)
No psychiatry. Limited mental health practitioners in our community. – Physician (Lawrence County)
Not enough resources or options. There are so many mental health conditions that finding the resources that will help with a particular problem may not be there. The options seem to be hospitalization or a private doctor. I also see the homeless as having a huge problem with mental health issues. They walk past my office every day. – Community/Business Leader (Pennington County)
Lack of mental health services and the quality of mental health services provided aren't sufficient to address the needs of the population. No trust of the mental health providers that work in the community to remain quite about what was discussed in their appointment. This creates a highly stressful situation that sort of ties the hands of the patients and drives them to abuse drugs and alcohol in order to cope with their mental health issues and the cycle continues with everyone involved. – Other Health Provider (Oglala Lakota County)
There are no counseling services in Custer. Again, because I work in assisted living I see this. I have several residents who would benefit from a counselor visiting them, however, because of Medicare/Medicaid billing rules, counselors cannot come into assisted living. These residents can't afford those visits out of pocket but also are not in good enough health to travel to Rapid City to see a counselor. Many are not even in good enough health to travel downtown Custer. – Other Health Provider (Custer County)
One counselor practicing half-time, ability to pay for mental health services. – Other Health Provider (Lawrence County)
I think there is a big shortage of counselors and too many medical professionals that prescribe medications without appropriate monitoring. – Community/Business Leader (Pennington County)
There are too few counselors and physicians available in the rural areas that surround Rapid City Regional. This results in long wait times and poor access to mental health treatment. The homeless population has especially high incidence of mental health issues. Rapid City has had an increase in crime and I believe there is a correlation between mental illness and untreated mental illness. – Other Health Provider (Pennington County)
Very limited resources. – Other Health Provider (Pennington County)
No Psychiatric services to help with medication management. Limited counseling services. Limited case management services, in reality, none. – Physician (Custer County)
I don't know a lot about what opportunities are available for those with mental health issues. I'm not sure if they do either. Of course, I'm not sure that many of them would take advantage of it because the most serious cases I see, don't think they need treatment. Some type of treatment should be required when their

COMMUNITY HEALTH NEEDS ASSESSMENT
49
behavior is reported to Social Services. I'm afraid it is a tragedy waiting to happen. At the library, I see individuals every day who seem to have untreated mental health issues. Some of them, have serious, obvious problems, like hearing voices, paranoia. This type of illness can affect others. It definitely makes people afraid and wary around individuals who obviously need help. – Community/Business Leader (Custer County)
No services for those with mental health issues. – Community/Business Leader (Butte County)
Lack of resources for our mentally ill patients. The West Unit often times is full. – Other Health Provider (Pennington County)
The biggest challenge is the minimal resource as far as diagnosing, treating and counselling available to people with insurance and the working poor without insurance. – Physician (Lawrence County)
We do not do a good job of providing appropriate support for those who are suffering from mental health issues, this contributes to injury, violence, drugs and alcohol. – Other Health Provider (Pennington County)
Mental Health is an ongoing issue in every community and not much support for these types of patients, we do not have a facility for these individuals. – Other Health Provider (Meade County)
People with co-occurring mental health and complex medical needs are not able to have their needs met living in the community. They have to go to a nursing home which is not always the most socially appropriate setting. Need community based mental health group homes or apartments that can also meet higher level of medical needs and provide medical assistance. – Other Health Provider (Pennington County)
There are numerous mental health patients who are perceived to fall through the cracks in our county/state. Availability of inpatient services are limited and geographically the closest facility for longer term inpatient Psychiatric care is across the state in Yankton. There is perceived lack of community knowledge about the Crisis Center and their capabilities as well. – Other Health Provider (Pennington County)
Medical/behavioral health services for older children, 8-18 year-olds, with autism. There is a lot of OT available and some ABA that is effective with younger children. Older children need intervention in the after school hours to stay safe and healthy and keep out of trouble. – Other Health Provider (Pennington County)
Availability of follow-up appointments after hospitalization within the Behavior Management System. – Other Health Provider (Pennington County)
There is a hard time handling forensic patients for medical behavioral issues. Limited beds for inpatient mental health needs. – Other Health Provider (Pennington County)
Need for dual-diagnosis community resources and treatment, and case management. Many of our severely and persistently mentally ill or those with addictions and are homeless end up taking up the majority of our resources in the Emergency Department. Need some kind of community case management for the 1% that uses the most resources. – Social Services Provider (Pennington County)
Mental health patients are placed in hospital settings as crisis services are ineffective. – Social Services Provider (Pennington County)
Stigma
Stigma and families not knowing where to turn. The resources seem to be better than before, but people don't seem to know how to access them. – Community/Business Leader (Pennington County)
Social acceptance, medical access, safety, available treatment locally. – Community/Business Leader (Lawrence County)
Trust that they can receive quality mental health services without being judged or that their privacy to receive services will not be violated. There is also a lack of culturally trained mental health providers. Mental health services are often limited. – Other Health Provider (Oglala Lakota County)
The stigma of a mental health problem causes the individual and their family to hide the problem. In the past, health plans have had limited or no coverage for mental health problems. When coverage does exist and a medication is prescribed, many times the individual won't take the medication as prescribed. – Social Services Provider (Pennington County)
I think there is a huge stigma on mental health. It is seen as a bad thing to get help with mental problems. I think we need to find ways to remove this stigma. –Other Health Provider (Oglala Lakota County)
One of the biggest challenges is the stigma that still exists. If it was addressed as a physiological issue instead of a crazy or depressed issue, more people would seek assistance in getting their brain chemicals

COMMUNITY HEALTH NEEDS ASSESSMENT
50
back in order. Learning to differentiate between occurrence type of mental health issue and physical would go a long way as well. Support groups are not known about or in our local community. Come winter, it is more difficult for people to travel to Spearfish or other places for help. In addition, people do not want to admit a weakness in that they can't handle everything. – Community/Business Leader (Lawrence County)
Everyone has the need to be accepted, loved, and needed. There's a huge lack in the "understanding" department. – Social Services Provider (Pennington County)
First of all, the universal negative stigma regarding mental health keeps individuals and families from recognizing issues and seeking help. For young people, particularly those with limited support systems, the fear of reaching out for help is even more pronounced. For those that do, there is a need for long term support and connectivity, particularly for teenagers. – Community/Business Leader (Pennington County)
Overcoming stigma to connect with resources. – Social Services Provider (Pennington County)
Stigma, if they have insurance, limits on number of therapy sessions and reliance on pharmaceuticals. – Community/Business Leader (Pennington County)
Reaching out for services. This community has numerous, outstanding mental health resources but I feel that many in our community still feel there is a stigma about having mental health issues. – Social Services Provider (Pennington County)
Too few people recognize the need for mental health and seek assistance. When help is needed and wanted, it can take time to be seen and receive assistance. Some feel they cannot afford the care they need and perhaps some cannot afford the medication they have been prescribed. A growing problem related to mental health is Autism Spectrum Disorder and similar behavioral/mental concerns. There are program available in other parts of the state that will help young children early on to adapt their behaviors but they aren't available in Pennington County. They are also expensive. We need early identification and good intervention. – Other Health Provider (Pennington County)
Affordable Care/Services
It's a lonely world and the price of mental healthcare is high. – Community/Business Leader (Pennington County)
I think the problems we have with mental health are those shared with all communities across the country, since the big shift in mental healthcare and accessibility to affordable resources happened in the 1980's. There is a lack of affordable and accessible care, and a lack of resources for employment, housing, counseling, etc. School children are overly medicated and placed in regular classrooms, where it is the classroom teacher's responsibility to care for that child, often without appropriate training or support. Schools are grossly underfunded in Rapid City, and placing children with special mental or emotional needs in regular classrooms makes a difficult situation even more challenging. – Social Services Provider (Pennington County)
Financial, support systems and unsure where to go are issues for patients. – Other Health Provider (Lawrence County)
Lack and cost of mental health services for all ages especially after age of 19. Families can not refer adult family members easily. Sigma of some in community who view those who receive mental health treatment or assistance as damaged or dangerous person. – Community/Business Leader (Pennington County)
Lack of mental health facilities that are affordable, especially for teenagers. Education, stigma, easier commitment possibilities. Medication monitoring, follow up, other than the Emergency Room. – Other Health Provider (Pennington County)
Affordable services is definitely an issue for some. Stigma about getting help for mental health issues is another. I would love to see medical clinics hire or contract with a mental health professional on site so that individuals who are less likely to walk into a counseling center can still get the help they need. I think we would see more follow-up on referrals with this type of system as well. Lawrence County needs someone who provides excellent psychiatric services for kids and adults. This is a big unmet need in our community. Communication between clinics and mental health providers could use improvement as well. – Other Health Provider (Lawrence County)
Access to good mental healthcare, being uninsured. – Other Health Provider (Pennington County)
For those without insurance there is a limited amount of resources available for counseling, medication, assessments. Many individuals who live in poverty do not have access to these things and then have unmanaged disorders. Many become homeless or self-medicate with alcohol. – Social Services Provider
COMMUNITY HEALTH NEEDS ASSESSMENT
51
(Pennington County)
Access to affordable treatment, especially for those who are not eligible for Medicaid. Also, support for clients to follow through on treatment regimens. Decreasing the stigma of mental health diagnoses. – Public Health Representative (Pennington County)
Insurance and knowledge. – Social Services Provider (Pennington County)
Timely Access to Appointments
Waiting lists for Psychiatric assessments and medication needs. – Other Health Provider (Pennington County)
Overbooked, difficult to find care. – Other Health Provider (Pennington County)
Access to timely psychiatric services, especially competent child psychiatric services. Some patients have to wait months to get services. Also, I think we lack the right kinds of crisis intervention services and the right degree or continuum of services. We have the psych unit for the extreme, we have people's homes which is often felt to be unsafe if a person is still in a crisis state after leaving the hospital, and we have behavioral/correctional resources such as ARISE and Wellspring, both implying the child did something wrong. Many times they did not, they are just having a mental health episode or issue. We need to develop resources, interventions that are not punitive in nature or make the child feel like what they are experiencing emotionally or mentally is criminal or delinquent like. Also, families need help setting up a safe transition for their kids coming out of the hospital. These stays are often not long enough or the family is scared to do it on their own. – Social Services Provider (Pennington County)
Waiting list to receive services, some are not aware of services available, some simply are in a state of not knowing they need help and what kind of help they need, others are so ill that they need someone to help them such as an advocate, others do not have transportation to get to services. – Social Services Provider (Pennington County)
Diagnosis/Treatment
Diagnosis, on-going follow up to help people stay on their medications and programs. – Other Health Provider (Pennington County)
Addiction and mental health left unmanaged. Community outreach to reach this group of individuals who would not normally access treatments or therapies on their own. – Other Health Provider (Pennington County)
Untreated mental health issues, along with substance abuse, appear to be a primary cause of homelessness in our area. We have minimal resources for affordable mental healthcare. – Other Health Provider (Pennington County)
Noncompliance with medications and treatment. Either choosing not to take the medication or not being able to afford the medication. – Other Health Provider (Pennington County)
Chronic diagnosis such as schizophrenia where the disease will always have periods of compliance and non-compliance with medication. Stigma. Mental health issues are usually coupled with depression and/or poor coping mechanisms. Alcohol is a cheap way to cope and that leads to physical ailments. – Other Health Provider (Pennington County)
These individuals are not seen until they are in an acute crisis, then they are treated and released without a good support system. – Other Health Provider (Pennington County)
People continuing to live in difficult circumstances, not seeking treatment, not following through with treatment, counseling or medications. – Social Services Provider (Pennington County)
Prevalence/Incidence
This is a growing concern, particularly as evidenced with behavioral issues seen in children. Plus, experience has indicated a need for mental health resources. – Community/Business Leader (Pennington County)
We see a very large number of adolescents with mental health issues such as depression and suicidal gestures. This problem seems to be nearly epidemic for adolescents in some areas such as the reservations. These adolescents do not seem to have coping mechanisms or ways to access needed services. Even when admitted for inpatient assessment/treatment, there is very often a delay in placement to adolescent psych services because of a lack of available beds in the inpatient psych unit. These adolescents frequently spend 1-2 days in the acute care hospital where their mental health needs are not able to be addressed adequately.

COMMUNITY HEALTH NEEDS ASSESSMENT
52
Many of these adolescents have repeat admissions, they report that they spend only 1-2 days in the inpatient psych area and are not prepared to deal with their mental health issues when they are discharged. This is becoming a crisis in our community's adolescent population. – Other Health Provider (Pennington County)
There are not enough Pediatric Psychiatric beds in the state, much less in Rapid City. – Physician (Pennington County)
Depression. Apparent in number of suicides and responses to everyday life problems. – Community/Business Leader (Lawrence County)
I see so many people who do not know how to cope. I work with the military and veteran community. Suicide and or behavior health issues continue to increase. I also work with youth in middle and high school. The lack of self-esteem, confidence, bullying when combined with a dysfunctional home is a breeding ground for depression and growing mental health issues. – Social Services Provider (Pennington County)
The number of people with mental health issues versus the number of individuals that are care providers treating patients. Alcohol would be the number one issue. – Other Health Provider (Pennington County)
Mental Health problems are epidemic. Medications take long periods to evaluate and treat conditions, without adequate counseling or spiritual or financial support. There is not enough follow through and I feel like many fall through the cracks of healthcare and not enough support. It seems as if people cycle back and forth through the system, West or Yankton, without any solutions for them. – Other Health Provider (Lawrence County)
Contributing Factors
Not enough money for level of case management needed. Lack of staffing to access free drugs for the number of people needing assistance with the cost of medications. Shortage of affordable shelter plus care housing. Need for more public education on how to recognize mental health issues to remove fear and stigma. – Community/Business Leader (Pennington County)
Case management for some individuals with mental health issues seems to be problematic. – Social Services Provider (Pennington County)
Most likely lack of quality care from a whole person perspective. Not just the medication side of mental illness, but the social side, the medical side and behavioral factor as well. – Other Health Provider (Pennington County)
We are not addressing this issue as a disease. Instead people are abusing drugs and alcohol which turns into a violent matter. – Other Health Provider (Pennington County)
Poor family dynamics. Generations caught in poverty and lack of education. – Physician (Pennington County)
Challenges with gainful employment, access to mental health and behavioral management, housing, family issues, substance abuse. – Other Health Provider (Pennington County)
Depression, lack of self-worth, lack of education, effects of abuse. – Other Health Provider (Pennington County)
Depression and suicide seem to be the most pressing mental health conditions and community awareness seems to be high at this time. – Physician (Oglala Lakota County)
Shortage of Facilities
Not enough mental health beds. Maybe not enough resources for them in the community. This is a huge problem for our area but also across the country. Care seems inadequate as we see many patients over and over. They go to in patient care and seem to be discharged quickly and return back to the Emergency Department. – Other Health Provider (Pennington County)
Not anywhere near enough mental health beds or healthcare providers, Psychiatrists and therapists available. – Other Health Provider (Pennington County)
There are limited beds for urgent, acute care. There are very few child/adolescent placements for long care. Being that it is hard to place them in long term environments they end up staying in the acute beds limiting access to acute patients. – Other Health Provider (Pennington County)
Need for expanded outpatient and inpatient services and mental healthcare within the acute care setting. – Other Health Provider (Pennington County)

COMMUNITY HEALTH NEEDS ASSESSMENT
53
The biggest challenge is the lack of inpatient adult and adolescent inpatient Psychiatric beds. RCRH Behavioral Health is often full. In addition, Behavioral Management Systems is often not taking new patients for their medication administration program. – Other Health Provider (Pennington County)
Long-term treatment and assistance. – Other Health Provider (Pennington County)
Vulnerable Populations
Homeless populations are heavily affected by mental illness. Access to treatment is limited when loner homeless folks have to wait to be referred by the court, or by a serious mental health episode, or both. No family support. – Community/Business Leader (Pennington County)
Homelessness. – Community/Business Leader (Pennington County)
Elderly depression. Many elderly patients at the hospital are depressed and feel hopeless. They have no money to pay for the care they need without having to sacrifice all their life's savings for. Then once a spouse dies, the living elderly person gets depressed and with people living longer this day and age they can be lonely and depressed for a long time. – Other Health Provider (Pennington County)
The homeless teenage male fall between the cracks. – Other Health Provider (Pennington County)
Homelessness. – Community/Business Leader (Pennington County)
Homelessness, lack of healthcare, drug and alcohol use and facilities to house. – Social Services Provider (Pennington County)
Lack of Education
In the educational system, I have noted individuals, on a fairly frequent basis, who are experiencing mental health challenges. – Community/Business Leader (Lawrence County)
Lack of education about people with mental health issues. – Community/Business Leader (Pennington County)
A lack of education and awareness are again paramount in confronting this issue. Individuals do not know how to identify the warning signs of mental illness, and many still see it as a social stigma that should not be discussed or taught to youth. There is only one part-time counselor in the Lead-Deadwood area, making it nearly impossible and hugely expensive to seek counseling. Referrals that send individuals out of the area to receive mental health services, mean that these individuals are less likely to get the help that they need. They may not have the transportation, and many mental health services are not covered by insurance. Leaving your own community to seek care also decreases the level of accountability to continue care in a responsible manner. – Community/Business Leader (Lawrence County)
High Rate of Suicides
Suicide, it is a leading cause of death and is two and a half times higher than the national average. Depression and alcohol use is the primary contributing factor to the suicide deaths in our community. – Social Services Provider (Pennington County)
Suicide, high rates of suicide in Rapid City and Western South Dakota. – Community/Business Leader (Pennington County)
Comorbidities
Mental health needs that are co-occurring with other illnesses or disabilities. – Community/ Business Leader (Pennington County)
Vitamin and mineral deficiencies. – Community/Business Leader (Pennington County)

COMMUNITY HEALTH NEEDS ASSESSMENT
54
Death, Disease & Chronic Conditions
Leading Causes of Death
Distribution of Deaths by Cause
Cancers and cardiovascular disease (heart disease and stroke) are leading causes of death in the
community.
Leading Causes of Death(RCRH Service Area, 2013)
Sources: � CDC WONDER Online Query System. Centers for Disease Control and Prevention, Epidemiology Program Office, Division of Public Health Surveillance
and Informatics. Data extracted November 2015.
Notes: � Deaths are coded using the Tenth Revision of the International Statistical Classification of Diseases and Related Health Problems (ICD-10).
� CLRD is chronic lower respiratory disease.
Heart Disease 23.2%
Cancer 23.3%
CLRD 7.1%
Unintentional Injuries6.3%
Stroke 4.5%
Alzheimer's Disease4.1%
Other 31.5%
Age-Adjusted Death Rates for Selected Causes
In order to compare mortality in the region with other localities (in this case, the state and the United States), it
is necessary to look at rates of death — these are figures which represent the number of deaths in relation to
the population size (such as deaths per 100,000 population, as is used here).
Furthermore, in order to compare localities without undue bias toward younger or older populations, the
common convention is to adjust the data to some common baseline age distribution. Use of these “age-
adjusted” rates provides the most valuable means of gauging mortality against benchmark data, as well as
Healthy People 2020 targets.
The following chart outlines annual average age-adjusted death rates per 100,000 population for selected
causes of death in the area. (For infant mortality data, see Birth Outcomes & Risks in the Births section of this
report.)
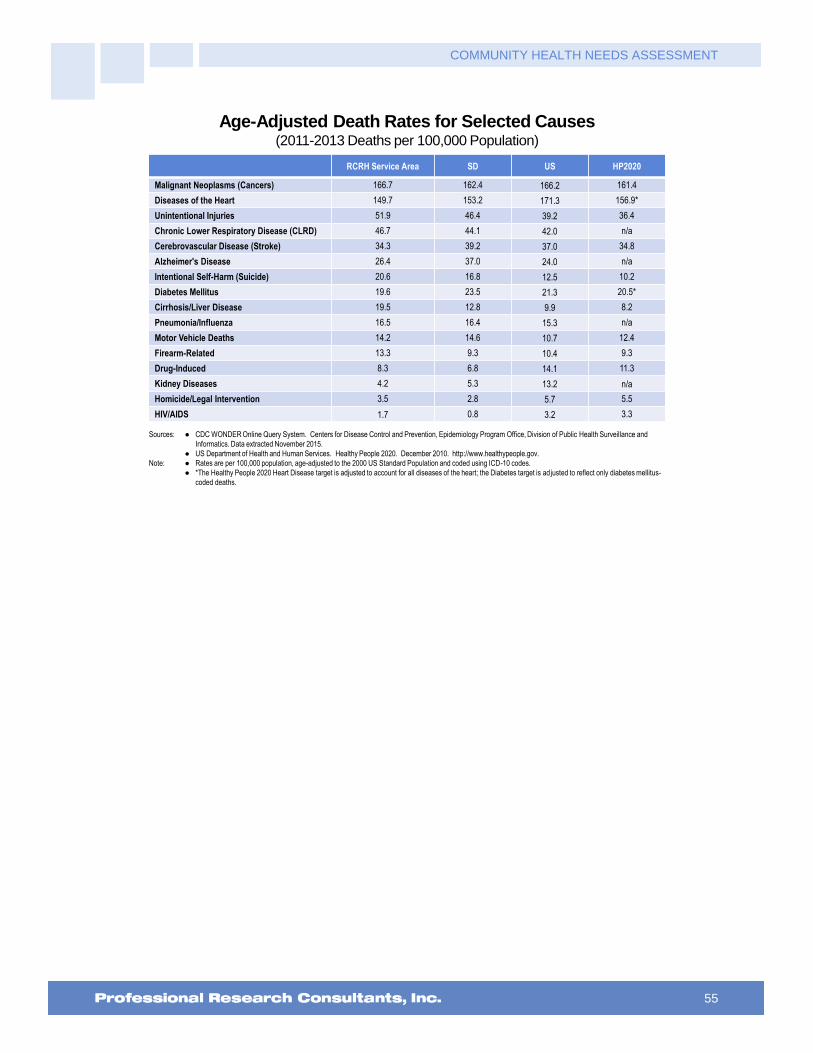
COMMUNITY HEALTH NEEDS ASSESSMENT
55
Age-Adjusted Death Rates for Selected Causes(2011-2013 Deaths per 100,000 Population)
Sources: � CDC WONDER Online Query System. Centers for Disease Control and Prevention, Epidemiology Program Office, Division of Public Health Surveillance and
Informatics. Data extracted November 2015.
� US Department of Health and Human Services. Healthy People 2020. December 2010. http://www.healthypeople.gov.
Note: � Rates are per 100,000 population, age-adjusted to the 2000 US Standard Population and coded using ICD-10 codes.
� *The Healthy People 2020 Heart Disease target is adjusted to account for all diseases of the heart; the Diabetes target is adjusted to reflect only diabetes mellitus-
coded deaths.
RCRH Service Area SD US HP2020
Malignant Neoplasms (Cancers) 166.7 162.4 166.2 161.4
Diseases of the Heart 149.7 153.2 171.3 156.9*
Unintentional Injuries 51.9 46.4 39.2 36.4
Chronic Lower Respiratory Disease (CLRD) 46.7 44.1 42.0 n/a
Cerebrovascular Disease (Stroke) 34.3 39.2 37.0 34.8
Alzheimer's Disease 26.4 37.0 24.0 n/a
Intentional Self-Harm (Suicide) 20.6 16.8 12.5 10.2
Diabetes Mellitus 19.6 23.5 21.3 20.5*
Cirrhosis/Liver Disease 19.5 12.8 9.9 8.2
Pneumonia/Influenza 16.5 16.4 15.3 n/a
Motor Vehicle Deaths 14.2 14.6 10.7 12.4
Firearm-Related 13.3 9.3 10.4 9.3
Drug-Induced 8.3 6.8 14.1 11.3
Kidney Diseases 4.2 5.3 13.2 n/a
Homicide/Legal Intervention 3.5 2.8 5.7 5.5
HIV/AIDS 1.7 0.8 3.2 3.3

COMMUNITY HEALTH NEEDS ASSESSMENT
56
Cardiovascular Disease
About Heart Disease & Stroke
Heart disease is the leading cause of death in the United States, with stroke following as the third leading cause. Together,
heart disease and stroke are among the most widespread and costly health problems facing the nation today, accounting for
more than $500 billion in healthcare expenditures and related expenses in 2010 alone. Fortunately, they are also among the
most preventable.
The leading modifiable (controllable) risk factors for heart disease and stroke are:
High blood pressure
High cholesterol
Cigarette smoking
Diabetes
Poor diet and physical inactivity
Overweight and obesity
The risk of Americans developing and dying from cardiovascular disease would be substantially reduced if major improvements
were made across the US population in diet and physical activity, control of high blood pressure and cholesterol, smoking
cessation, and appropriate aspirin use.
The burden of cardiovascular disease is disproportionately distributed across the population. There are significant disparities in
the following based on gender, age, race/ethnicity, geographic area, and socioeconomic status:
Prevalence of risk factors
Access to treatment
Appropriate and timely treatment
Treatment outcomes
Mortality
Disease does not occur in isolation, and cardiovascular disease is no exception. Cardiovascular health is significantly
influenced by the physical, social, and political environment, including: maternal and child health; access to educational
opportunities; availability of healthy foods, physical education, and extracurricular activities in schools; opportunities for
physical activity, including access to safe and walkable communities; access to healthy foods; quality of working conditions and
worksite health; availability of community support and resources; and access to affordable, quality healthcare.
Healthy People 2020 (www.healthypeople.gov)
Age-Adjusted Heart Disease & Stroke Deaths
The greatest share of cardiovascular deaths is attributed to heart disease.

COMMUNITY HEALTH NEEDS ASSESSMENT
57
Heart Disease: Age-Adjusted Mortality Trends(Annual Average Deaths per 100,000 Population)
Healthy People 2020 Target = 156.9 or Lower (Adjusted)
Sources: � CDC WONDER Online Query System. Centers for Disease Control and Prevention, Epidemiology Program Office, Division of Public Health Surveillance and
Informatics. Data extracted November 2015.
� US Department of Health and Human Services. Healthy People 2020. December 2010. http://www.healthypeople.gov [Objective HDS-2]
Notes: � Deaths are coded using the Tenth Revision of the International Statistical Classification of Diseases and Related Health Problems (ICD-10).
� Rates are per 100,000 population, age-adjusted to the 2000 US Standard Population.
� The Healthy People 2020 Heart Disease target is adjusted to account for all diseases of the heart.
2004-2006 2005-2007 2006-2008 2007-2009 2008-2010 2009-2011 2010-2012 2011-2013
RCRH 191.3 179.2 168.7 159.3 157.9 151.3 150.5 149.7
SD 185.4 177.3 171.0 168.5 165.3 160.8 154.9 153.2
US 214.6 206.1 197.9 190.3 184.7 178.5 174.4 171.3
0
50
100
150
200
250
Stroke: Age-Adjusted Mortality Trends(Annual Average Deaths per 100,000 Population)
Healthy People 2020 Target = 34.8 or Lower
Sources: � CDC WONDER Online Query System. Centers for Disease Control and Prevention, Epidemiology Program Office, Division of Public Health Surveillance and
Informatics. Data extracted November 2015.
� US Department of Health and Human Services. Healthy People 2020. December 2010. http://www.healthypeople.gov [Objective HDS-3]
Notes: � Deaths are coded using the Tenth Revision of the International Statistical Classification of Diseases and Related Health Problems (ICD-10).
� Rates are per 100,000 population, age-adjusted to the 2000 US Standard Population.
2004-2006 2005-2007 2006-2008 2007-2009 2008-2010 2009-2011 2010-2012 2011-2013
RCRH 40.5 39.0 33.3 35.1 32.5 35.5 33.7 34.3
SD 48.5 45.6 41.1 39.8 39.7 40.8 39.9 39.2
US 48.0 45.4 43.5 41.7 40.3 38.9 38.0 37.0
0
10
20
30
40
50
60
Prevalence of Heart Disease & Stroke
“Has a doctor, nurse or other health professional ever told you that you had: A Heart Attack, Also
Called a Myocardial Infarction; or Angina or Coronary Heart Disease?” (Heart disease prevalence below
is a calculated prevalence that includes those responding affirmatively to either.)
“Has a doctor, nurse or other health professional ever told you that you had a stroke?”

COMMUNITY HEALTH NEEDS ASSESSMENT
58
Prevalence of Heart Disease
Sources: � PRC Community Health Surveys, Professional Research Consultants, Inc. [Item 124]
� 2013 PRC National Health Survey, Professional Research Consultants, Inc.
Notes: � Asked of all respondents.
� Includes diagnoses of heart attack, angina or coronary heart disease.
6.8% 6.1%
0%
20%
40%
60%
80%
100%
RCRH US
7.9% 6.8%
2012 2015
RCRH Service Area
Prevalence of Stroke
Sources: � PRC Community Health Surveys, Professional Research Consultants, Inc. [Item 36]
� 2013 PRC National Health Survey, Professional Research Consultants, Inc.
� Behavioral Risk Factor Surveillance System Survey Data. Atlanta, Georgia. United States Department of Health and Human Services, Centers for Disease Control
and Prevention (CDC): 2013 South Dakota data.
Notes: � Asked of all respondents.
3.8% 1.7%
2012 2015
1.7% 2.8% 3.9%
0%
20%
40%
60%
80%
100%
RCRH SD US
RCRH Service Area
Cardiovascular Risk Factors
About Cardiovascular Risk
Controlling risk factors for heart disease and stroke remains a challenge. High blood pressure and cholesterol are still major
contributors to the national epidemic of cardiovascular disease. High blood pressure affects approximately 1 in 3 adults in the
United States, and more than half of Americans with high blood pressure do not have it under control. High sodium intake is a
known risk factor for high blood pressure and heart disease, yet about 90% of American adults exceed their recommendation
for sodium intake.
Healthy People 2020 (www.healthypeople.gov)
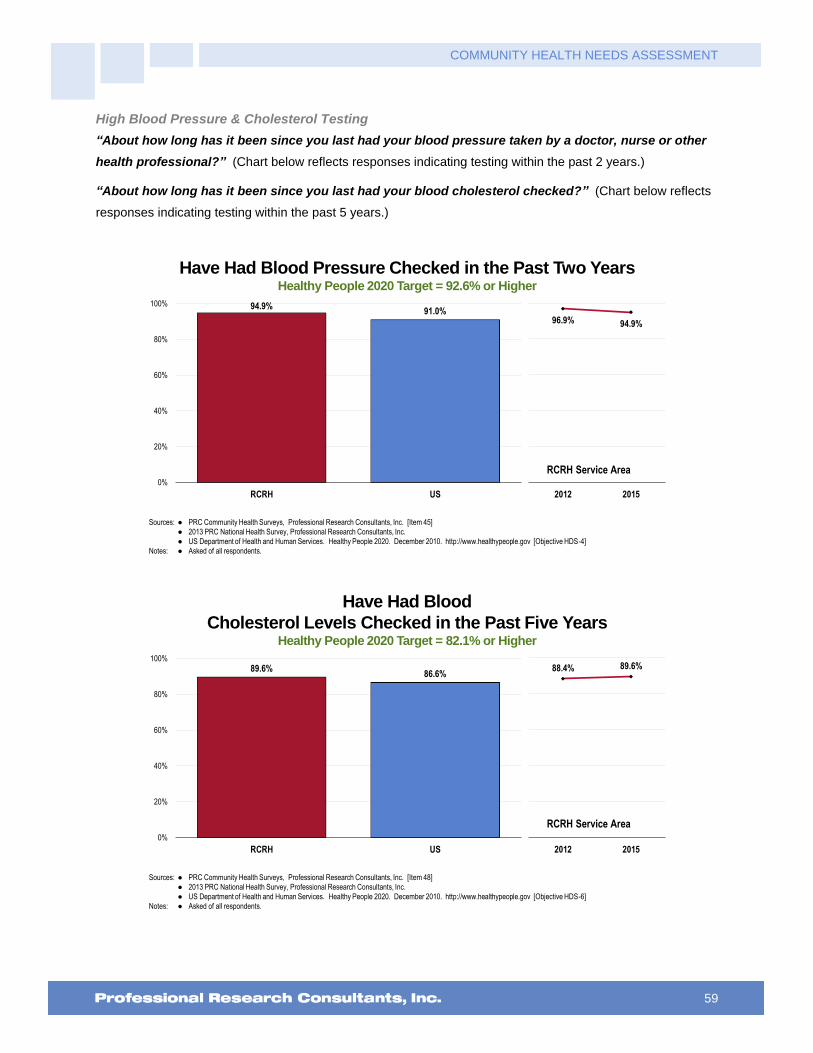
COMMUNITY HEALTH NEEDS ASSESSMENT
59
High Blood Pressure & Cholesterol Testing
“About how long has it been since you last had your blood pressure taken by a doctor, nurse or other
health professional?” (Chart below reflects responses indicating testing within the past 2 years.)
“About how long has it been since you last had your blood cholesterol checked?” (Chart below reflects
responses indicating testing within the past 5 years.)
Have Had Blood Pressure Checked in the Past Two YearsHealthy People 2020 Target = 92.6% or Higher
Sources: � PRC Community Health Surveys, Professional Research Consultants, Inc. [Item 45]
� 2013 PRC National Health Survey, Professional Research Consultants, Inc.
� US Department of Health and Human Services. Healthy People 2020. December 2010. http://www.healthypeople.gov [Objective HDS-4]
Notes: � Asked of all respondents.
94.9%91.0%
0%
20%
40%
60%
80%
100%
RCRH US
96.9% 94.9%
2012 2015
RCRH Service Area
Have Had Blood
Cholesterol Levels Checked in the Past Five YearsHealthy People 2020 Target = 82.1% or Higher
Sources: � PRC Community Health Surveys, Professional Research Consultants, Inc. [Item 48]
� 2013 PRC National Health Survey, Professional Research Consultants, Inc.
� US Department of Health and Human Services. Healthy People 2020. December 2010. http://www.healthypeople.gov [Objective HDS-6]
Notes: � Asked of all respondents.
88.4% 89.6%
2012 2015
89.6%86.6%
0%
20%
40%
60%
80%
100%
RCRH US
RCRH Service Area

COMMUNITY HEALTH NEEDS ASSESSMENT
60
High Blood Pressure & Cholesterol Prevalence
“Have you ever been told by a doctor, nurse or other health care professional that you had high blood
pressure?
Prevalence of High Blood PressureHealthy People 2020 Target = 26.9% or Lower
Sources: � PRC Community Health Surveys, Professional Research Consultants, Inc. [Items 43, 125]� Behavioral Risk Factor Surveillance System Survey Data. Atlanta, Georgia. United States Department of Health and Human Services, Centers for Disease Control
and Prevention (CDC): 2013 South Dakota data.� 2013 PRC National Health Survey, Professional Research Consultants, Inc.� US Department of Health and Human Services. Healthy People 2020. December 2010. http://www.healthypeople.gov [Objective HDS-5.1]
Notes: � Asked of all respondents.
36.4%31.3%
2012 2015
31.3% 30.7%34.1%
0%
20%
40%
60%
80%
100%
RCRH SD US
RCRH Service Area
Prevalence of High Blood Pressure(RCRH Service Area, 2015)
Healthy People 2020 Target = 26.9% or Lower
Sources: � 2015 PRC Community Health Survey, Professional Research Consultants, Inc. [Item 125]� US Department of Health and Human Services. Healthy People 2020. December 2010. http://www.healthypeople.gov [Objective HDS-5.1]
Notes: � Asked of all respondents.� Hispanics can be of any race. Other race categories are non-Hispanic categorizations (e.g., “White” reflects non-Hispanic White respondents).� Income categories reflect respondent's household income as a ratio to the federal poverty level (FPL) for their household size. “Low Income” includes households
with incomes up to 200% of the federal poverty level; “Mid/High Income” includes households with incomes at 200% or more of the federal poverty level.
34.7%
28.0%
12.5%
34.8%
58.7%
30.9% 28.8% 30.6%34.6%
31.3%
0%
20%
40%
60%
80%
100%
Men Women 18 to 39 40 to 64 65+ LowIncome
Mid/HighIncome
NH White Other Overall

COMMUNITY HEALTH NEEDS ASSESSMENT
61
“Blood cholesterol is a fatty substance found in the blood. Have you ever been told by a doctor, nurse,
or other health care professional that your blood cholesterol is high?”
Prevalence of High Blood CholesterolHealthy People 2020 Target = 13.5% or Lower
Sources: � PRC Community Health Surveys, Professional Research Consultants, Inc. [Item 126]
� 2013 PRC National Health Survey, Professional Research Consultants, Inc.
� US Department of Health and Human Services. Healthy People 2020. December 2010. http://www.healthypeople.gov [Objective HDS-7]
Notes: � Asked of all respondents.
31.6% 32.5%
2012 2015
32.5%29.9%
0%
20%
40%
60%
80%
100%
RCRH US
RCRH Service Area
Prevalence of High Blood Cholesterol(RCRH Service Area, 2015)
Healthy People 2020 Target = 13.5% or Lower
Sources: � 2015 PRC Community Health Survey, Professional Research Consultants, Inc. [Item 126]� US Department of Health and Human Services. Healthy People 2020. December 2010. http://www.healthypeople.gov [Objective HDS-7]
Notes: � Asked of all respondents.� Hispanics can be of any race. Other race categories are non-Hispanic categorizations (e.g., “White” reflects non-Hispanic White respondents).� Income categories reflect respondent's household income as a ratio to the federal poverty level (FPL) for their household size. “Low Income” includes households
with incomes up to 200% of the federal poverty level; “Mid/High Income” includes households with incomes at 200% or more of the federal poverty level.
36.1%
29.1%
8.9%
39.9%
63.1%
30.2%33.6% 32.7% 31.7% 32.5%
0%
20%
40%
60%
80%
100%
Men Women 18 to 39 40 to 64 65+ LowIncome
Mid/HighIncome
NH White Other Overall

COMMUNITY HEALTH NEEDS ASSESSMENT
62
About Cardiovascular Risk
Individual level risk factors which put people at increased risk for cardiovascular diseases include:
High Blood Pressure
High Blood Cholesterol
Tobacco Use
Physical Inactivity
Poor Nutrition
Overweight/Obesity
Diabetes
National Center for Chronic Disease Prevention and Health Promotion, Centers for Disease Control and Prevention
Three health-related behaviors contribute markedly to cardiovascular disease:
Poor nutrition. People who are overweight have a higher risk for cardiovascular disease. Almost 60% of adults are overweight
or obese. To maintain a proper body weight, experts recommend a well-balanced diet which is low in fat and high in fiber,
accompanied by regular exercise.
Lack of physical activity. People who are not physically active have twice the risk for heart disease of those who are active.
More than half of adults do not achieve recommended levels of physical activity.
Tobacco use. Smokers have twice the risk for heart attack of nonsmokers. Nearly one-fifth of all deaths from cardiovascular
disease, or about 190,000 deaths a year nationally, are smoking-related. Every day, more than 3,000 young people become
daily smokers in the US
Modifying these behaviors is critical both for preventing and for controlling cardiovascular disease. Other steps that adults who
have cardiovascular disease should take to reduce their risk of death and disability include adhering to treatment for high blood
pressure and cholesterol, using aspirin as appropriate, and learning the symptoms of heart attack and stroke.
National Center for Chronic Disease Prevention and Health Promotion, Centers for Disease Control and Prevention
Total Cardiovascular Risk
The following chart reflects the percentage of adults in the area who report one or more of the following: being
overweight; smoking cigarettes; being physically inactive; or having high blood pressure or cholesterol. See
also Nutrition, Physical Activity & Weight and Tobacco Use in the Modifiable Health Risk section of this report.

COMMUNITY HEALTH NEEDS ASSESSMENT
63
Present One or More Cardiovascular Risks or Behaviors(RCRH Service Area, 2015)
Sources: � 2015 PRC Community Health Survey, Professional Research Consultants, Inc. [Item 127]Notes: � Asked of all respondents.
� Cardiovascular risk is defined as exhibiting one or more of the following: 1) no leisure-time physical activity; 2) regular/occasional cigarette smoking; 3) hypertension; 4) high blood cholesterol; and/or 5) being overweight/obese.
� Hispanics can be of any race. Other race categories are non-Hispanic categorizations (e.g., “White” reflects non-Hispanic White respondents).� Income categories reflect respondent's household income as a ratio to the federal poverty level (FPL) for their household size. “Low Income” includes households
with incomes up to 200% of the federal poverty level; “Mid/High Income” includes households with incomes at 200% or more of the federal poverty level.
88.5%
78.4% 76.6%
87.3%90.7% 88.3%
81.9% 83.1% 84.4% 83.4%
0%
20%
40%
60%
80%
100%
Men Women 18 to 39 40 to 64 65+ LowIncome
Mid/HighIncome
NH White Other Overall
Key Informant Input: Heart Disease & Stroke
The following chart outlines key informants’ perceptions of the severity of Heart Disease & Stroke as a problem
in the community:
Perceptions of Heart Disease and Stroke
as a Problem in the Community(Key Informants, 2015)
Sources: � PRC Online Key Informant Survey, Professional Research Consultants, Inc.
Notes: � Asked of all respondents.
24.9% 49.1% 17.7% 8.3%
Major Problem Moderate Problem Minor Problem No Problem At All
Top Concerns
Among those rating this issue as a “major problem,” reasons frequently related to the following:
Prevalence/Incidence
Number of people affected by heart/stroke related illness. – Other Health Provider (Pennington County)
Many people who come into hospice services have heart disease and stroke history. – Other Health Provider (Pennington County)
Again, working with patients at the hospital I see a lot of patients who have heart disease or who come emergently with MI's or stroke symptoms. Much of the heart disease is also related to the high rate of diabetes, obesity and poor diets. – Social Services Provider (Pennington County)
There is a high percentage of patients living with heart disease and the effects of stroke. – Other Health

COMMUNITY HEALTH NEEDS ASSESSMENT
64
Provider (Pennington County)
All heart disease diagnosis make up the number one reason for hospital admissions. Our area also sees significant issues with the primary risk factors of obesity, smoking and high blood pressure. Even though smoking has overall decreased in our area, the rates continue to be high and the smoking rate among women and young adults continues to be very high. Obesity rates in our area have risen drastically in the last 10 years. – Other Health Provider (Pennington County)
There is a high rate of heart and vascular disease present in the communities. There is a lot of fatty and junk foods that are available especially in a "fast food" society where everything is quick. – Other Health Provider (Black Hills Region)
We have many patients admitted with heart disease and stroke. Sedentary lifestyle and poor dietary choices contribute. – Other Health Provider (Pennington County)
Heart disease is the number one killer, although doesn't get all the attention of cancer. – Community/Business Leader (Pennington County)
Number one killer. – Other Health Provider (Pennington County)
Leading cause of death. – Community/Business Leader (Pennington County)
The high incidence rate of heart disease and stroke related issues. – Community/Business Leader (Pennington County)
Problem nation-wide. – Physician (Lawrence County)
Statistically, our population would mirror the national population. Heart disease is a major problem in our country, thus, I would expect to see similar statistics in Lawrence County. – Community/Business Leader (Lawrence County)
It is a major problem nation-wide. Previous statistics have shown stroke to be an issue for Custer County. The rural ranching lifestyle and choices contributes. – Other Health Provider (Custer County)
It is one of the most prevalent life-threatening illnesses, causing significant disability. Many people have risk factors including obesity and smoking. – Physician (Pennington County)
This is a large share of what we see in the Emergency Room and hospital. Probably the number one reason for admission to our hospital. – Physician (Pennington County)
Heart disease and stroke are often deadly or debilitating. There is a high incidence of them in all communities. – Social Services Provider (Pennington County)
Aging Population
Many elderly and seniors have heart disease, and/or are stroke victims. – Community/Business Leader (Custer County)
Community has mega numbers of retirees and older residents. – Community/Business Leader (Lawrence County)
Age demographic, general health of the population. – Community/Business Leader (Lawrence County)
Elderly population. – Public Health Representative (Custer County)
Aging population, lower income, poor diet. – Community/Business Leader (Butte County)
Due to the growing population of aging adults in our community I believe heart disease and stroke are a major problem. Many of these people are life time smokers and have a diet heavy in meat and starches and carbohydrates. The population generally tends to be overweight to obese. – Public Health Representative (Lawrence County)
Aging population. – Community/Business Leader (Custer County)
This is important here because of the age of our residents, many retired people. – Community/Business Leader (Custer County)
Aging population. This community attracts retirees. Obesity or inactivity in all age groups. The need for better education regarding healthy choices. – Other Health Provider (Pennington County)

COMMUNITY HEALTH NEEDS ASSESSMENT
65
Lifestyles
Because healthy lifestyles are not a priority in the community. Limited access to healthy foods. Tobacco use is high. ACE's are high. Substance abuse is high and obesity rate is high. – Other Health Provider (Oglala Lakota County)
Lifestyle. – Community/Business Leader (Lawrence County)
Too many are engaged in unhealthy lifestyles. Drugs, alcohol and homelessness issue take priority, things like heart disease goes untreated. – Community/Business Leader (Pennington County)
I believe heart disease, like diabetes, is a direct result of a community that is not health focused or has an income disparity in access to healthy living options and education. – Social Services Provider (Pennington County)
A majority of our population is overweight and have no facility to utilize that will help them manage their weight. This I feel greatly contributes to the incidence of heart disease and stroke in our area. – Other Health Provider (Oglala Lakota County)
Obesity and smoking rates are higher here than in other towns of our size. – Other Health Provider (Pennington County)
With our Midwestern diet, it affects a good portion of the population in one way or another. Once again, the distance needed to travel to receive proper treatment is sometimes an obstacle as well. – Community/Business Leader (Pennington County)
Comorbidities
Large population of diabetics. Poor diet. Large number of obesity. – Other Health Provider (Pennington County)
Complications from diabetes, weight issues and substance abuse. Lack of education and treatment. – Community/Business Leader (Pennington County)
It goes hand in hand with the diabetes population. Many individuals in this community have members with heart disease or stroke. – Other Health Provider (Pennington County) Uncontrolled diabetes and hypertension are risk factors for both. Patients lack understanding of the diseases. If they feel fine why would there be any problem for my heart or brain. High blood pressure or BS don't cause acute symptoms usually. – Other Health Provider (Oglala Lakota County)
Because the risks for heart disease and stroke that include diabetes, hypertension, obesity, smoking and high cholesterol are prevalent in this community. – Physician (Oglala Lakota County)
These are usually symptoms of larger health problems and surface more often. – Other Health Provider (Custer County)
Access to Care
Patients need to travel to Rapid City to see heart doctors for any heart testing issues. It takes long time to get appointments. Our facilities do not have a stroke team. – Other Health Provider (Lawrence County)
Friends seek other medical centers for heart issues such as going to Sioux Falls or Mayo. – Social Services Provider (Pennington County)
Our population is at risk for high rates of heart disease and stroke. In rural areas, access to specialized care is a challenge. – Other Health Provider (Black Hills Region)
Many folks go untreated due to not having insurance. They ignore their symptoms until the disease has become advanced. – Community/Business Leader (Lawrence County)
Referral to a specialist is a waiting list unless it’s an acute episode. No follow up is available for cardiac rehab, stroke restorative treatments. Physical therapy. – Public Health Representative (Oglala Lakota County)
Education/Compliance
Heart disease and stroke is a huge problem because of the high population of non-compliant patients that we have and the referrals of patient that our community receives from outlying areas. Also it is difficult for patients who already have heart disease to get a follow up appointment with the Cardiologist within two weeks after hospital discharge. Patients have verbalized that the staff at the heart doctors are not easy to talk

COMMUNITY HEALTH NEEDS ASSESSMENT
66
with and sometimes are referred to as rude. Medications for heart disease are high dollar medications and are at time not affordable even if a patient does have a prescription plan. Exercise programs for working population are not easily found to work with a usual Monday - Friday working schedule. Lots of people have to work more than one job just to make ends meet and healthcare takes a back burner to other necessities. The acute hospital therapy department does not take an aggressive role to get stroke patients going unless the patient is admitted to inpatient rehab unit. – Other Health Provider (Pennington County)
Lack of education on preventing or treating the disease itself. Preventable education should be initiated at a young age. Teaching triggers of the disease needs to be addressed more intently. – Other Health Provider (Pennington County)
Access to Healthy Food
I believe that heart disease and stroke are a major problem in our community because of poor access to healthy foods, especially in rural areas. It is often cheaper to eat processed, unhealthy foods. –Other Health Provider (Oglala Lakota County)
Vitamin and mineral deficiencies. – Community/Business Leader (Pennington County)

COMMUNITY HEALTH NEEDS ASSESSMENT
67
Cancer
About Cancer
Continued advances in cancer research, detection, and treatment have resulted in a decline in both incidence and death rates
for all cancers. Among people who develop cancer, more than half will be alive in five years. Yet, cancer remains a leading
cause of death in the United States, second only to heart disease.
Many cancers are preventable by reducing risk factors such as: use of tobacco products; physical inactivity and poor nutrition;
obesity; and ultraviolet light exposure. Other cancers can be prevented by getting vaccinated against human papillomavirus
and hepatitis B virus. In the past decade, overweight and obesity have emerged as new risk factors for developing certain
cancers, including colorectal, breast, uterine corpus (endometrial), and kidney cancers. The impact of the current weight trends
on cancer incidence will not be fully known for several decades. Continued focus on preventing weight gain will lead to lower
rates of cancer and many chronic diseases.
Screening is effective in identifying some types of cancers (see US Preventive Services Task Force [USPSTF]
recommendations), including:
Breast cancer (using mammography)
Cervical cancer (using Pap tests)
Colorectal cancer (using fecal occult blood testing, sigmoidoscopy, or colonoscopy)
Healthy People 2020 (www.healthypeople.gov)
Age-Adjusted Cancer Deaths
Among the leading causes of cancer deaths are lung cancer, prostate cancer among men, breast
cancer among women, and colorectal cancer (both genders).
Cancer: Age-Adjusted Mortality Trends(Annual Average Deaths per 100,000 Population)
Healthy People 2020 Target = 161.4 or Lower
Sources: � CDC WONDER Online Query System. Centers for Disease Control and Prevention, Epidemiology Program Office, Division of Public Health Surveillance and
Informatics. Data extracted November 2015.
� US Department of Health and Human Services. Healthy People 2020. December 2010. http://www.healthypeople.gov [Objective C-1]
Notes: � Deaths are coded using the Tenth Revision of the International Statistical Classification of Diseases and Related Health Problems (ICD-10).
� Rates are per 100,000 population, age-adjusted to the 2000 US Standard Population.
2004-2006 2005-2007 2006-2008 2007-2009 2008-2010 2009-2011 2010-2012 2011-2013
RCRH 188.5 188.5 182.7 173.8 168.2 170.3 173.6 166.7
SD 177.7 176.7 171.9 167.1 166.0 166.5 167.9 162.4
US 184.6 182.1 179.2 176.4 174.2 171.8 169.4 166.2
0
40
80
120
160
200

COMMUNITY HEALTH NEEDS ASSESSMENT
68
Age-Adjusted Cancer Death Rates by Site(2011-2013 Annual Average Deaths per 100,000 Population)
Sources: � CDC WONDER Online Query System. Centers for Disease Control and Prevention, Epidemiology Program Office, Division of Public
Health Surveillance and Informatics. Data extracted November 2015.
� US Department of Health and Human Services. Healthy People 2020. December 2010. http://www.healthypeople.gov
RCRH Service Area SD US HP2020
Lung Cancer 46.0 43.9 44.7 45.5
Prostate Cancer 23.1 18.9 19.8 21.8
Female Breast Cancer 20.1 21.1 21.3 20.7
Colorectal Cancer 13.3 15.7 14.9 14.5
Cancer Incidence
Incidence rates (or case rates) reflect the number of newly diagnosed cases in a given population in a given
year, regardless of outcome. They are usually expressed as cases per 100, 000 population per year. Here,
these rates are also age-adjusted.
Cancer Incidence Rates by Site(Annual Average Age-Adjusted Incidence per 100,000 Population, 2007-2011)
Sources: � State Cancer Profiles: 2007-11.
� Retrieved November 2015 from Community Commons at http://www.chna.org.
Notes: � This indicator reports the age adjusted incidence rate (cases per 100,000 population per year) of cancers, adjusted to 2000 US standard population age groups
(under age 1, 1-4, 5-9, ..., 80-84, 85 and older). This indicator is relevant because cancer is a leading cause of death and it is important to identify cancers
separately to better target interventions.
120.
8
113.
8
64.1
43.1
122.
0
142.
0
58.5
48.3
122.
7
142.
3
64.9
43.3
Female Breast Cancer Prostate Cancer Lung Cancer Colon/Rectal Cancer
0
20
40
60
80
100
120
140
160
RCRH SD US

COMMUNITY HEALTH NEEDS ASSESSMENT
69
Prevalence of Cancer
Skin Cancer
“Would you please tell me if you have ever suffered from or been diagnosed with cancer, not counting
skin cancer?”
“Would you please tell me if you have ever suffered from or been diagnosed with skin cancer?”
Prevalence of Skin Cancer
Sources: � PRC Community Health Surveys, Professional Research Consultants, Inc. [Item 31]
� Behavioral Risk Factor Surveillance System Survey Data. Atlanta, Georgia. United States Department of Health and Human Services, Centers for Disease Control
and Prevention (CDC): 2013 South Dakota data.
� 2013 PRC National Health Survey, Professional Research Consultants, Inc.
Notes: � Asked of all respondents.
6.3%9.5%
2012 2015
9.5%6.5% 6.7%
0%
20%
40%
60%
80%
100%
RCRH SD US
RCRH Service Area
Prevalence of Cancer (Other Than Skin Cancer)
Sources: � PRC Community Health Surveys, Professional Research Consultants, Inc. [Item 30]
� Behavioral Risk Factor Surveillance System Survey Data. Atlanta, Georgia. United States Department of Health and Human Services, Centers for Disease Control
and Prevention (CDC): 2013 South Dakota data.
� 2013 PRC National Health Survey, Professional Research Consultants, Inc.
Notes: � Asked of all respondents.
6.9% 6.7% 6.1%
0%
20%
40%
60%
80%
100%
RCRH SD US
4.9% 6.9%
2012 2015
RCRH Service Area

COMMUNITY HEALTH NEEDS ASSESSMENT
70
Cancer Risk
About Cancer Risk
Reducing the nation’s cancer burden requires reducing the prevalence of behavioral and environmental factors that increase
cancer risk.
All cancers caused by cigarette smoking could be prevented. At least one-third of cancer deaths that occur in the United States are due to cigarette smoking.
According to the American Cancer Society, about one-third of cancer deaths that occur in the United States each year are due to nutrition and physical activity factors, including obesity.
National Center for Chronic Disease Prevention and Health Promotion, Centers for Disease Control and Prevention
Cancer Screenings
The American Cancer Society recommends that both men and women get a cancer-related checkup during a
regular doctor's checkup. It should include examination for cancers of the thyroid, testicles, ovaries, lymph
nodes, oral cavity, and skin, as well as health counseling about tobacco, sun exposure, diet and nutrition, risk
factors, sexual practices, and environmental and occupational exposures.
Screening levels in the community were measured in the PRC Community Health Survey relative to: prostate
cancer (PSA and/or digital rectal examination); female breast cancer (mammography); cervical cancer (Pap
smear testing); and colorectal cancer (sigmoidoscopy and fecal occult blood testing).
Female Breast Cancer Screening
About Screening for Breast Cancer
The US Preventive Services Task Force (USPSTF) recommends screening mammography, with or without clinical breast
examination (CBE), every 1-2 years for women age 40 and older.
Rationale: The USPSTF found fair evidence that mammography screening every 12-33 months significantly reduces mortality
from breast cancer. Evidence is strongest for women age 50-69, the age group generally included in screening trials. For
women age 40-49, the evidence that screening mammography reduces mortality from breast cancer is weaker, and the
absolute benefit of mammography is smaller, than it is for older women. Most, but not all, studies indicate a mortality benefit for
women undergoing mammography at ages 40-49, but the delay in observed benefit in women younger than 50 makes it
difficult to determine the incremental benefit of beginning screening at age 40 rather than at age 50.
The absolute benefit is smaller because the incidence of breast cancer is lower among women in their 40s than it is among
older women. The USPSTF concluded that the evidence is also generalizable to women age 70 and older (who face a higher
absolute risk for breast cancer) if their life expectancy is not compromised by comorbid disease. The absolute probability of
benefits of regular mammography increase along a continuum with age, whereas the likelihood of harms from screening (false-
positive results and unnecessary anxiety, biopsies, and cost) diminish from ages 40-70. The balance of benefits and potential
harms, therefore, grows more favorable as women age. The precise age at which the potential benefits of mammography
justify the possible harms is a subjective choice. The USPSTF did not find sufficient evidence to specify the optimal screening
interval for women age 40-49.
US Preventive Services Task Force, Agency for Healthcare Research and Quality, US Department of Health & Human Services Note that other organizations (e.g., American Cancer Society, American Academy of Family Physicians, American College of Physicians, National Cancer Institute) may have slightly different screening guidelines.

COMMUNITY HEALTH NEEDS ASSESSMENT
71
Cervical Cancer Screenings
About Screening for Cervical Cancer
The US Preventive Services Task Force (USPSTF) strongly recommends screening for cervical cancer in women who have
been sexually active and have a cervix.
Rationale: The USPSTF found good evidence from multiple observational studies that screening with cervical cytology (Pap
smears) reduces incidence of and mortality from cervical cancer. Direct evidence to determine the optimal starting and
stopping age and interval for screening is limited. Indirect evidence suggests most of the benefit can be obtained by beginning
screening within 3 years of onset of sexual activity or age 21 (whichever comes first) and screening at least every 3 years. The
USPSTF concludes that the benefits of screening substantially outweigh potential harms.
The USPSTF recommends against routinely screening women older than age 65 for cervical cancer if they have had adequate
recent screening with normal Pap smears and are not otherwise at high risk for cervical cancer.
Rationale: The USPSTF found limited evidence to determine the benefits of continued screening in women older than 65. The
yield of screening is low in previously screened women older than 65 due to the declining incidence of high-grade cervical
lesions after middle age. There is fair evidence that screening women older than 65 is associated with an increased risk for
potential harms, including false-positive results and invasive procedures. The USPSTF concludes that the potential harms of
screening are likely to exceed benefits among older women who have had normal results previously and who are not otherwise
at high risk for cervical cancer.
The USPSTF recommends against routine Pap smear screening in women who have had a total hysterectomy for benign
disease.
Rationale: The USPSTF found fair evidence that the yield of cytologic screening is very low in women after hysterectomy and
poor evidence that screening to detect vaginal cancer improves health outcomes. The USPSTF concludes that potential harms
of continued screening after hysterectomy are likely to exceed benefits.
US Preventive Services Task Force, Agency for Healthcare Research and Quality, US Department of Health & Human Services Note that other organizations (e.g., American Cancer Society, American Academy of Family Physicians, American College of Physicians, National Cancer Institute) may have slightly different screening guidelines.
Colorectal Cancer Screenings
About Screening for Colorectal Cancer
The USPSTF recommends screening for colorectal cancer using fecal occult blood testing, sigmoidoscopy, or colonoscopy in
adults, beginning at age 50 years and continuing until age 75 years.
The evidence is convincing that screening for colorectal cancer with fecal occult blood testing, sigmoidoscopy, or colonoscopy
detects early-stage cancer and adenomatous polyps. There is convincing evidence that screening with any of the three
recommended tests (FOBT, sigmoidoscopy, colonoscopy) reduces colorectal cancer mortality in adults age 50 to 75 years.
Follow-up of positive screening test results requires colonoscopy regardless of the screening test used.
US Preventive Services Task Force, Agency for Healthcare Research and Quality, US Department of Health & Human Services Note that other organizations (e.g., American Cancer Society, American Academy of Family Physicians, American College of Physicians, National Cancer Institute) may have slightly different screening guidelines.

COMMUNITY HEALTH NEEDS ASSESSMENT
72
Breast Cancer Screening: “A mammogram is an x-ray of each breast to look for cancer. How long has
it been since you had your last mammogram?” (Calculated below among women age 50 to 74 indicating
screening within the past 2 years.)
Cervical Cancer Screening: “A Pap test is a test for cancer of the cervix. How long has it been since
you had your last Pap test?” (Calculated below among women age 21 to 65 indicating screening within the
past 3 years.)
Colorectal Cancer Screening: “Sigmoidoscopy and colonoscopy are exams in which a tube is inserted
in the rectum to view the colon for signs of cancer or other health problems. How long has it been
since your last sigmoidoscopy or colonoscopy?” and “A blood stool test is a test that may use a
special kit at home to determine whether the stool contains blood. How long has it been since you had
your last blood stool test?” (Calculated below among both genders age 50 to 75 indicating fecal occult blood
testing within the past year and/or sigmoidoscopy/colonoscopy [lower endoscopy] within the past 10 years.)
Have Had a Mammogram in the Past Two Years(Among Women Age 50-74)
Healthy People 2020 Target = 81.1% or Higher
Sources: � PRC Community Health Surveys, Professional Research Consultants, Inc. [Items 128-129]� Behavioral Risk Factor Surveillance System Survey Data. Atlanta, Georgia. United States Department of Health and Human Services, Centers for Disease Control
and Prevention (CDC): 2012 South Dakota data.� 2013 PRC National Health Survey, Professional Research Consultants, Inc.� US Department of Health and Human Services. Healthy People 2020. December 2010. http://www.healthypeople.gov [Objective C-17]
Notes: � Reflects female respondents 50-74.� *Note that state data reflects all women 50 and older (vs. women 50-74 in local, US and Healthy People data).
75.0% 74.2%
2012 2015
74.2%77.1%
83.6%
0%
20%
40%
60%
80%
100%
RCRH SD US
RCRH Service Area

COMMUNITY HEALTH NEEDS ASSESSMENT
73
Have Had a Pap Smear in the Past Three Years(Among Women Age 21-65)
Healthy People 2020 Target = 93.0% or Higher
Sources: � PRC Community Health Surveys, Professional Research Consultants, Inc. [Item 130]
� Behavioral Risk Factor Surveillance System Survey Data. Atlanta, Georgia. United States Department of Health and Human Services, Centers for Disease Control
and Prevention (CDC): 2012 South Dakota data.
� 2013 PRC National Health Survey, Professional Research Consultants, Inc.
� US Department of Health and Human Services. Healthy People 2020. December 2010. http://www.healthypeople.gov [Objective C-15]
Notes: � Reflects female respondents age 21 to 65.
� *Note that the South Dakota percentage represents all women age 18 and older.
75.8%
67.3%
2012 2015
67.3%
79.1%83.9%
0%
20%
40%
60%
80%
100%
RCRH SD US
RCRH Service Area
Have Had a Colorectal Cancer Screening(Among Adults Age 50-75)
Healthy People 2020 Target = 70.5% or Higher
Sources: � PRC Community Health Surveys, Professional Research Consultants, Inc. [Item 133]
� 2013 PRC National Health Survey, Professional Research Consultants, Inc.
� US Department of Health and Human Services. Healthy People 2020. December 2010. http://www.healthypeople.gov [Objective C-16]
Notes: � Asked of all respondents age 50 through 75.
� In this case, the term “colorectal screening” refers to adults age 50-75 receiving a FOBT (fecal occult blood test) in the past year and/or a lower endoscopy
(sigmoidoscopy/colonoscopy) in the past 10 years.
63.3%
70.0%
2012 2015
70.0%75.1%
0%
20%
40%
60%
80%
100%
RCRH US
RCRH Service Area

COMMUNITY HEALTH NEEDS ASSESSMENT
74
Key Informant Input: Cancer
The following chart outlines key informants’ perceptions of the severity of Cancer as a problem in the
community:
Perceptions of Cancer
as a Problem in the Community(Key Informants, 2015)
Sources: � PRC Online Key Informant Survey, Professional Research Consultants, Inc.
Notes: � Asked of all respondents.
23.9% 47.7% 20.8% 7.6%
Major Problem Moderate Problem Minor Problem No Problem At All
Top Concerns
Among those rating this issue as a “major problem,” reasons frequently related to the following:
Prevalence/Incidence
It just seems to be a major problem in many communities, and as I've said before, our community is older. So, we tend to have our fair share of families dealing with cancer. Many seem to travel far away, to Mayo Clinic and Denver, for their cancer treatments. – Community/Business Leader (Custer County)
Frequency in population. Scope of types of cancer. Scope of demographics with cancer. Care available to cancer patients locally. Cost of access to cancer treatment in travel. Sense of urgency in population with symptoms. Knowledge of access to funding for assistance. Absence of supportive groups, such as cancer support groups. Acceptability socially to access counseling. Lack of insurance coverage. High deductibles. Familial domino effect from issues surrounding reality of illness. – Community/Business Leader (Lawrence County)
Just started providing chemotherapy at the hospital and oncologist states that he sees a higher incidence of cancer in Lawrence and Butte counties. – Other Health Provider (Lawrence County)
Because it is so prevalent, but I have no idea why. Maybe because a lot of people used to smoke or chew and it's just. Now catching up with them. – Other Health Provider (Pennington County)
There is what seems to be a very high incidence of cancer within the community across all ages and types of cancer. Within just my sphere of work and friends I know of over 20 people who have had cancer. – Community/Business Leader (Pennington County)
It seems that there are lots of people who are struggling with cancer of some type in our community, perhaps this is true everywhere, but I feel I know many in our community. – Community/Business Leader (Custer County)
There is a large number of people with cancer in our community. I believe there is a lack of screening and treatment with minorities in this area. – Community/Business Leader (Pennington County)
It is affecting more and more people every day. – Other Health Provider (Lawrence County)
I work in hospice and we serve many people young and old who have cancer and have limited access to treatment. – Other Health Provider (Pennington County)
It touches so many people. Ongoing appointments are needed. Rural area requires travel. – Other Health Provider (Pennington County)
Prevalence. – Community/Business Leader (Pennington County)
COMMUNITY HEALTH NEEDS ASSESSMENT
75
Occurrence of several types of cancers in the area is quite high. I know how many of the patients that come here are dealing with cancer diagnosis. I have connections at RCRH and their Cancer Care Institute is very busy. While not all of these people are from Pennington County, a large portion are. – Other Health Provider (Pennington County)
I work with a number of cancer patients in the course of my hospital position. I see this as increasing in number, not decreasing. I also hear of a greater number of parishioners having been diagnosed with cancer. – Social Services Provider (Pennington County)
I know many people affected by cancer. – Community/Business Leader (Pennington County)
Seems to be high per capita rate of cancer in the area. Common comment once someone is diagnosed is, "you better get to Mayo" or somewhere other than Rapid City. Perception, whether accurate or not is that Rapid City has a high rate of misdiagnosis and/or ineffective treatment. – Community/Business Leader (Pennington County)
Cancer rates are very high in our area and it is one of the top causes of death. We do have the Cancer Center so do have an avenue for treatment for many. – Other Health Provider (Pennington County)
The rate of cancer is high everywhere, including my community. – Social Services Provider (Pennington County)
The prevalence of cancer seems to be high. – Community/Business Leader (Pennington County)
I consider cancer to be a major problem because it seems to affect so many people. There seems to be treatments available but I'm not so sure about assistance between treatments. I also don't see much concentration on the prevention of cancer or pro-active treatments. – Community/Business Leader (Pennington County)
Several diagnosis. – Other Health Provider (Pennington County)
My husband and I know a fair number of people who have or have had cancer in our immediate geographic region. In addition, we know relatives and friends of others who have experienced cancer. – Community/Business Leader (Lawrence County)
Almost every family I know, whether it is a Caucasian, African American, Native American or Hispanic seem to have at least one family member that has been touched somehow with cancer, whether it be Leukemia to rare types of cancers. – Other Health Provider (Pennington County)
Most people I know in this community either have a cancer issue or a heart issue. – Community/Business Leader (Custer County)
My brother was diagnosed with cancer and died a month later. Due to no health insurance or money his care was making him comfortable until he died. Had he had resources to battle his disease it would have made a difference. – Other Health Provider (Pennington County)
Cancer is a major problem in this community as evidenced by the fact that there are several children with cancer who are treated at Univ of MN. Their doctors come here routinely for clinics due to our high numbers. When doing histories on patient, there rarely is a patient who does not have at least one relative with cancer. There are several grants and research studies which are ongoing at Cancer Care Center which again shows this must be a major problem. – Other Health Provider (Pennington County)
Too many healthy people and young people have cancer for uninformed reasons. – Community/Business Leader (Lawrence County)
Many recent deaths. – Other Health Provider (Pennington County)
We have had several young individuals diagnosed with cancer. Lymphoma mostly. These young people have ranged in the age of 17 to 29. Cancer has been diagnosed in other ages too. Per capita it is high here in this area. – Public Health Representative (Meade County)
Lack of Resources
I feel we do not have the best doctors for this. Several people I know that have had cancer has been misdiagnosed and fortunately was persistent and went elsewhere to get it diagnosed properly. – Social Services Provider (Pennington County)
The doctor shortage has created a major wait for expedient treatment including in the outpatient and inpatient setting. Basically all diagnostics are often done by attendings or primary care providers who are not well versed in this, which means that tests often needed in addition, creating a very long flow time from initial

COMMUNITY HEALTH NEEDS ASSESSMENT
76
concern to active treatment. There are also limited services for those lacking funds for transportation to treatment. – Other Health Provider (Pennington County)
Access to doctors without leaving the county. – Community/Business Leader (Butte County)
This is more of a financial concern. Plus many people will go outside of our community for a diagnosis. – Community/Business Leader (Pennington County)
The doctor shortage has created a major wait for expedient treatment including in the outpatient and inpatient setting. Basically all diagnostics are often done by attendings or primary care providers who are not well versed in this, which means that tests often needed in addition, creating a very long flow time from initial concern to active treatment. There are also limited services for those lacking funds for transportation to treatment. – Other Health Provider (Pennington County)
Travel/Expense to be treated for these is overwhelming for the families. – Public Health Representative (Oglala Lakota County)
Many here are needing treatment and have to go to Rapid City for chemo. I do know that RCRH has made strides to begin chemo a few days in Spearfish which is greatly appreciated. Cancers are striking every age group in our area, one 20 year old just died this morning from it. We have many cases of cancers in our community. Some folks have it for quite some time as they cannot afford, or choose not to afford doctors. Everything we eat, drink, inhale, seems to contribute to some form of cancer. – Community/Business Leader (Lawrence County)
Because they are referred out of state for treatment options some cannot afford this. – Social Services Provider (Pennington County)
While the incidence of cancer in the community may not be huge, the inability to get treatment for it in our area is. Many people in our community with cancer have to go elsewhere for treatment. – Community/Business Leader (Lawrence County)
Oncologists don't take call. Will see the patient as they have time or after reviewing the case. – Physician (Lawrence County)
Prevention/Early Diagnosis
Many individuals aren't being screened and thus not diagnosed until the disease is terminal. – Other Health Provider (Pennington County)
Many people who do not have insurance and do not have the means to pay for their medical care often let their symptoms go untreated until it's too late. – Community/Business Leader (Lawrence County)
Patients with cancer have a difficult time coordinating care and sometimes wait until cancer advanced before seeking help. – Physician (Lawrence County)
The problem is the number of people being diagnosed later rather than sooner. Early detection is key in so many cases and yet the plea from healthcare providers for people to seek a diagnosis or an exam seems to go unheard. – Other Health Provider (Pennington County)
Behavioral Risk
There are numerous factors that lend to high rates of smoking, obesity and poor nutrition. – Social Services Provider (Pennington County)
Lifestyle choices play a large role in why cancer rates are so high for our area. I think one of the largest things is tobacco use. I believe that if we lower tobacco use rates, we can lower cancer rates as well. –Other Health Provider (Oglala Lakota County)
The prevalence of tobacco use and the lack of access to healthy and nutritious foods I feel greatly contribute to the incidence of cancer in my community. Also caring for cancer in my community isn't possible. Travel to Rapid City for caring for cancer is a necessity for many residents. Often they are unable to afford the travel expenses. – Other Health Provider (Oglala Lakota County)
Aging Population
We have a large retirement community in the Black Hills. Higher cancer rates with age. We have many people in this area who have been chronically exposed to environmental toxins, pesticides, herbicides, and other farm and ranch chemicals and are old enough to be of "pre-sunscreen" cohorts. – Other Health Provider (Pennington County)

COMMUNITY HEALTH NEEDS ASSESSMENT
77
Aging population. – Community/Business Leader (Butte County)
Nutrition
Vitamin and mineral deficiencies. – Community/Business Leader (Pennington County)

COMMUNITY HEALTH NEEDS ASSESSMENT
78
Respiratory Disease
About Asthma & COPD
Asthma and chronic obstructive pulmonary disease (COPD) are significant public health burdens. Specific methods of
detection, intervention, and treatment exist that may reduce this burden and promote health.
Asthma is a chronic inflammatory disorder of the airways characterized by episodes of reversible breathing problems due to
airway narrowing and obstruction. These episodes can range in severity from mild to life threatening. Symptoms of asthma
include wheezing, coughing, chest tightness, and shortness of breath. Daily preventive treatment can prevent symptoms and
attacks and enable individuals who have asthma to lead active lives.
COPD is a preventable and treatable disease characterized by airflow limitation that is not fully reversible. The airflow limitation
is usually progressive and associated with an abnormal inflammatory response of the lung to noxious particles or gases
(typically from exposure to cigarette smoke). Treatment can lessen symptoms and improve quality of life for those with COPD.
The burden of respiratory diseases affects individuals and their families, schools, workplaces, neighborhoods, cities, and
states. Because of the cost to the healthcare system, the burden of respiratory diseases also falls on society; it is paid for with
higher health insurance rates, lost productivity, and tax dollars. Annual healthcare expenditures for asthma alone are estimated
at $20.7 billion.
Asthma. The prevalence of asthma has increased since 1980. However, deaths from asthma have decreased since the mid-
1990s. The causes of asthma are an active area of research and involve both genetic and environmental factors.
Risk factors for asthma currently being investigated include:
Having a parent with asthma
Sensitization to irritants and allergens
Respiratory infections in childhood
Overweight
Asthma affects people of every race, sex, and age. However, significant disparities in asthma morbidity and mortality exist, in
particular for low-income and minority populations. Populations with higher rates of asthma include: children; women (among
adults) and boys (among children); African Americans; Puerto Ricans; people living in the Northeast United States; people
living below the Federal poverty level; and employees with certain exposures in the workplace.
While there is not a cure for asthma yet, there are diagnoses and treatment guidelines that are aimed at ensuring that all
people with asthma live full and active lives.
Healthy People 2020 (www.healthypeople.gov) [NOTE: COPD was changed to chronic lower respiratory disease (CLRD) with the introduction of ICD-10 codes. CLRD is used in vital statistics reporting, but COPD is still widely used and commonly found in surveillance reports.]
Age-Adjusted Respiratory Disease Deaths
Chronic lower respiratory diseases (CLRD) are diseases affecting the lungs; the most deadly of these is
chronic obstructive pulmonary disease (COPD), which includes emphysema and chronic bronchitis.
Pneumonia and influenza mortality is also illustrated in the following chart. For prevalence of vaccinations
against pneumonia and influenza, see also Immunization & Infectious Disease.

COMMUNITY HEALTH NEEDS ASSESSMENT
79
CLRD: Age-Adjusted Mortality Trends(Annual Average Deaths per 100,000 Population)
Sources: � CDC WONDER Online Query System. Centers for Disease Control and Prevention, Epidemiology Program Office, Division of Public Health Surveillance and
Informatics. Data extracted November 2015.
Notes: � Deaths are coded using the Tenth Revision of the International Statistical Classification of Diseases and Related Health Problems (ICD-10).
� Rates are per 100,000 population, age-adjusted to the 2000 US Standard Population.
� CLRD is chronic lower respiratory disease.
2004-2006 2005-2007 2006-2008 2007-2009 2008-2010 2009-2011 2010-2012 2011-2013
RCRH 53.1 52.1 52.1 51.3 50.3 46.8 47.5 46.7
SD 43.7 45.4 46.3 47.9 47.2 46.1 46.4 44.1
US 42.2 42.1 42.4 42.9 43.2 42.5 42.1 42.0
0
10
20
30
40
50
60
Pneumonia/Influenza: Age-Adjusted Mortality Trends(Annual Average Deaths per 100,000 Population)
Sources: � CDC WONDER Online Query System. Centers for Disease Control and Prevention, Epidemiology Program Office, Division of Public Health Surveillance and
Informatics. Data extracted November 2015.
Notes: � Deaths are coded using the Tenth Revision of the International Statistical Classification of Diseases and Related Health Problems (ICD-10).
� Rates are per 100,000 population, age-adjusted to the 2000 US Standard Population.
2004-2006 2005-2007 2006-2008 2007-2009 2008-2010 2009-2011 2010-2012 2011-2013
RCRH 17.9 18.7 17.2 15.4 16.2 17.2 18.5 16.5
SD 19.8 19.9 17.5 16.1 15.2 15.0 16.2 16.4
US 19.9 18.7 17.6 17.0 16.4 15.8 15.1 15.3
0
5
10
15
20
25

COMMUNITY HEALTH NEEDS ASSESSMENT
80
Prevalence of Respiratory Diseases
COPD
“Would you please tell me if you have ever suffered from or been diagnosed with COPD or chronic
obstructive pulmonary disease, including bronchitis or emphysema?”
Prevalence of
Chronic Obstructive Pulmonary Disease (COPD)
Sources: � PRC Community Health Surveys, Professional Research Consultants, Inc. [Item 25]� Behavioral Risk Factor Surveillance System Survey Data. Atlanta, Georgia. United States Department of Health and Human Services, Centers for Disease Control
and Prevention (CDC): 2013 South Dakota data.� 2013 PRC National Health Survey, Professional Research Consultants, Inc.
Notes: � Asked of all respondents.� Includes those having ever suffered from or been diagnosed with COPD or chronic obstructive pulmonary disease, including bronchitis or emphysema.� *In prior data, the term “chronic lung disease” was used, which also included bronchitis or emphysema;
8.3%4.5%
8.6%
0%
20%
40%
60%
80%
100%
RCRH SD US
14.2%8.3%
2012 2015
RCRH Service Area
Asthma
Adults: “Have you ever been told by a doctor, nurse, or other health professional that you had
asthma?” and “Do you still have asthma?” (Calculated below as a prevalence of all adults who have ever
been diagnosed with asthma and who still have asthma [“current asthma”]).
Children: “Has a doctor or other health professional ever told you that this child had asthma?” and
“Does this child still have asthma?” (Calculated below as a prevalence of all children who have ever been
diagnosed with asthma and who still have asthma [“current asthma”]).

COMMUNITY HEALTH NEEDS ASSESSMENT
81
Adult Asthma: Current Prevalence
Sources: � PRC Community Health Surveys, Professional Research Consultants, Inc. [Item 134]
� 2013 PRC National Health Survey, Professional Research Consultants, Inc.
� Behavioral Risk Factor Surveillance System Survey Data. Atlanta, Georgia. United States Department of Health and Human Services, Centers for Disease Control
and Prevention (CDC): 2013 South Dakota data.
Notes: � Asked of all respondents.
� Includes those who have ever been diagnosed with asthma, and who report that they still have asthma.
10.3%6.8%
2012 2015
6.8%11.8% 9.4%
0%
20%
40%
60%
80%
100%
RCRH SD US
RCRH Service Area
Currently Have Asthma(RCRH Service Area, 2015)
Sources: � 2015 PRC Community Health Survey, Professional Research Consultants, Inc. [Item 134]
Notes: � Asked of all respondents.
� Hispanics can be of any race. Other race categories are non-Hispanic categorizations (e.g., “White” reflects non-Hispanic White respondents).
� Income categories reflect respondent's household income as a ratio to the federal poverty level (FPL) for their household size. “Low Income” includes households
with incomes up to 200% of the federal poverty level; “Mid/High Income” includes households with incomes at 200% or more of the federal poverty level.
6.4% 7.2% 5.5% 6.6%9.7%
6.7% 6.6% 6.4% 8.6% 6.8%
0%
20%
40%
60%
80%
100%
Men Women 18 to 39 40 to 64 65+ LowIncome
Mid/HighIncome
NH White Other Overall

COMMUNITY HEALTH NEEDS ASSESSMENT
82
Childhood Asthma: Current Prevalence(Among Parents of Children Age 0-17)
Sources: � PRC Community Health Surveys, Professional Research Consultants, Inc. [Item 135]
� 2013 PRC National Health Survey, Professional Research Consultants, Inc.
Notes: � Asked of all respondents with children 0 to 17 in the household.
� Includes children who have ever been diagnosed with asthma, and whom are reported to still have asthma.
4.3%7.1%
0%
20%
40%
60%
80%
100%
RCRH US
10.0%4.3%
2012 2015
RCRH Service Area
Key Informant Input: Respiratory Disease
The following chart outlines key informants’ perceptions of the severity of Respiratory Disease as a problem in
the community:
Perceptions of Respiratory Diseases
as a Problem in the Community(Key Informants, 2015)
Sources: � PRC Online Key Informant Survey, Professional Research Consultants, Inc.
Notes: � Asked of all respondents.
14.1% 48.6% 30.2% 7.1%
Major Problem Moderate Problem Minor Problem No Problem At All
Top Concerns
Among those rating this issue as a “major problem,” reasons frequently related to the following:
Prevalence/Incidence
COPD. – Physician (Pennington County)
We have numerous patients who have COPD. We have resources to address this. – Other Health Provider (Pennington County)
Children who grow up with allergies, asthma, or smokers. – Community/Business Leader (Pennington County)
I see a large amount of people in hospice who have respiratory disease. – Other Health Provider (Pennington County)

COMMUNITY HEALTH NEEDS ASSESSMENT
83
COPD and asthma are high in this area. – Public Health Representative (Custer County)
Evident as patients present, as well as the number of individuals in the public with portable oxygen and, if not, obvious air hunger with minimum physical exertion. – Other Health Provider (Lawrence County)
Access to Care
No pulmonology in the community. – Other Health Provider (Meade County)
There are no respiratory therapist. – Public Health Representative (Oglala Lakota County)
Limited Pulmonology resources. – Physician (Pennington County)
Lack of expertise in healthcare providers. – Other Health Provider (Pennington County)
Again, those without insurance or with high deductibles do not seek medical care until it becomes an emergency. – Community/Business Leader (Lawrence County)
Tobacco Use
The prevalence of tobacco use in this area is one of the highest in the nation and there are not aggressive efforts that are being taken to address the harmful effects tobacco usage has on the respiratory system. – Other Health Provider (Oglala Lakota County)
Most are related to smoking, lower income class so it's harder to get help. Mines cause respiratory issues. – Other Health Provider (Lawrence County)
Large number of smokers. – Other Health Provider (Pennington County)
There still exist a high number of individual who smoke and work in the mining industry and other industries that are hazardous to the lungs. – Physician (Lawrence County)
In South Dakota, 23% of our adult population are current cigarette smokers. In addition, due to air quality in the Black Hills and obesity rates, our community is at high risk for respiratory disease. – Other Health Provider (Black Hills Region)
Environmental Factors
Agricultural area. Lots of dust in the air, aging population, many of whom operated farm equipment before there were cabs on them. – Community/Business Leader (Butte County)
Rapid City has poor air quality with the limestone quarries, sand and gravel pits, and wind. A wide variety of plants and the presence of mold increases allergy symptoms. – Social Services Provider (Pennington County)
We have lots of old miners with silicosis and smokers. Also the area where I live is above 5,000 feet altitude, which is not good for breathing problems. Lots of allergens to trigger asthma. – Other Health Provider (Lawrence County)
Close living quarters for several families under one roof. Mold and wood burning particulates. – Other Health Provider (Oglala Lakota County)
Aging Population
Aging population, a lot of smokers. – Other Health Provider (Pennington County)
Compliance
Noncompliance with medications. – Other Health Provider (Pennington County)
Nutrition
Vitamin and mineral deficiencies. – Community/Business Leader (Pennington County)

COMMUNITY HEALTH NEEDS ASSESSMENT
84
Injury & Violence
About Injury & Violence
Injuries and violence are widespread in society. Both unintentional injuries and those caused by acts of violence are among the
top 15 killers for Americans of all ages. Many people accept them as “accidents,” “acts of fate,” or as “part of life.” However,
most events resulting in injury, disability, or death are predictable and preventable.
Injuries are the leading cause of death for Americans ages 1 to 44, and a leading cause of disability for all ages, regardless of
sex, race/ethnicity, or socioeconomic status. More than 180,000 people die from injuries each year, and approximately 1 in 10
sustains a nonfatal injury serious enough to be treated in a hospital emergency department.
Beyond their immediate health consequences, injuries and violence have a significant impact on the well-being of Americans
by contributing to:
Premature death
Disability
Poor mental health
High medical costs
Lost productivity
The effects of injuries and violence extend beyond the injured person or victim of violence to family members, friends,
coworkers, employers, and communities.
Numerous factors can affect the risk of unintentional injury and violence, including individual behaviors, physical environment,
access to health services (ranging from pre-hospital and acute care to rehabilitation), and social environment (from parental
monitoring and supervision of youth to peer group associations, neighborhoods, and communities).
Interventions addressing these social and physical factors have the potential to prevent unintentional injuries and violence.
Efforts to prevent unintentional injury may focus on:
Modifications of the environment
Improvements in product safety
Legislation and enforcement
Education and behavior change
Technology and engineering
Efforts to prevent violence may focus on:
Changing social norms about the acceptability of violence
Improving problem-solving skills (for example, parenting, conflict resolution, coping)
Changing policies to address the social and economic conditions that often give rise to violence
Healthy People 2020 (www.healthypeople.gov)

COMMUNITY HEALTH NEEDS ASSESSMENT
85
Leading Causes of Accidental Death
Leading causes of accidental death in the area include the following:
Leading Causes of Accidental Death(RCRH Service Area, 2011-2013)
Sources: � CDC WONDER Online Query System. Centers for Disease Control and Prevention, Epidemiology Program Office, Division of Public Health Surveillance and
Informatics. Data extracted November 2015.
Notes: � Deaths are coded using the Tenth Revision of the International Statistical Classification of Diseases and Related Health Problems (ICD-10).
Falls 33.9%
Motor Vehicle Accidents 24.8%Poisoning/Noxious
Substances 13.5%
Other 27.9%
Unintentional Injury
Age-Adjusted Unintentional Injury Deaths
The following chart outlines age-adjusted mortality rates for unintentional injury in the area, including age-
adjusted mortality rates attributed specifically to motor vehicle crashes.
Note the Healthy People 2020 targets.
Unintentional Injuries: Age-Adjusted Mortality Trends(Annual Average Deaths per 100,000 Population)
Healthy People 2020 Target = 36.4 or Lower
Sources: � CDC WONDER Online Query System. Centers for Disease Control and Prevention, Epidemiology Program Office, Division of Public Health Surveillance and
Informatics. Data extracted November 2015.
� US Department of Health and Human Services. Healthy People 2020. December 2010. http://www.healthypeople.gov [Objective IVP-11]
Notes: � Deaths are coded using the Tenth Revision of the International Statistical Classification of Diseases and Related Health Problems (ICD-10).
� Rates are per 100,000 population, age-adjusted to the 2000 US Standard Population.
2004-2006 2005-2007 2006-2008 2007-2009 2008-2010 2009-2011 2010-2012 2011-2013
RCRH 55.8 56.0 54.6 50.5 48.6 50.3 51.3 51.9
SD 51.0 48.2 46.4 42.2 42.9 43.4 45.6 46.4
US 39.3 40.0 39.9 39.0 38.2 38.2 38.7 39.2
0
10
20
30
40
50
60

COMMUNITY HEALTH NEEDS ASSESSMENT
86
Motor Vehicle Crashes: Age-Adjusted Mortality Trends(Annual Average Deaths per 100,000 Population)
Healthy People 2020 Target = 12.4 or Lower
Sources: � CDC WONDER Online Query System. Centers for Disease Control and Prevention, Epidemiology Program Office, Division of Public Health Surveillance and
Informatics. Data extracted November 2015.
� US Department of Health and Human Services. Healthy People 2020. December 2010. http://www.healthypeople.gov [Objective IVP-13.1]
Notes: � Deaths are coded using the Tenth Revision of the International Statistical Classification of Diseases and Related Health Problems (ICD-10).
� Rates are per 100,000 population, age-adjusted to the 2000 US Standard Population.
2004-2006 2005-2007 2006-2008 2007-2009 2008-2010 2009-2011 2010-2012 2011-2013
RCRH 24.2 25.5 23.2 20.1 17.4 15.5 14.3 14.2
SD 22.6 20.8 18.5 16.2 15.8 14.8 14.8 14.6
US 14.6 14.3 13.5 12.4 11.4 10.8 10.7 10.7
0
5
10
15
20
25
30
Seat Belt/Car Seat Usage
Adults: “How often do you use seat belts when you drive or ride in a car? Would you say: always,
nearly always, sometimes, seldom, or never?”
Children: “How often does this child wear a child restraint or seat belt when riding in a car? Would you
say: always, nearly always, sometimes, seldom, or never?”
“Always” Wear a Seat Belt
When Driving or Riding in a VehicleHealthy People 2020 Target = 92.0% or Higher
Sources: � PRC Community Health Surveys, Professional Research Consultants, Inc. [Item 49]
� 2013 PRC National Health Survey, Professional Research Consultants, Inc.
� Behavioral Risk Factor Surveillance System Survey Data. Atlanta, Georgia. United States Department of Health and Human Services, Centers for Disease Control
and Prevention (CDC): 2013 South Dakota data.
� US Department of Health and Human Services. Healthy People 2020. December 2010. http://www.healthypeople.gov [Objective IVP-15]
Notes: � Asked of all respondents.
70.3% 71.9%
2012 2015
71.9%
65.2%
84.8%
0%
20%
40%
60%
80%
100%
RCRH SD US
RCRH Service Area
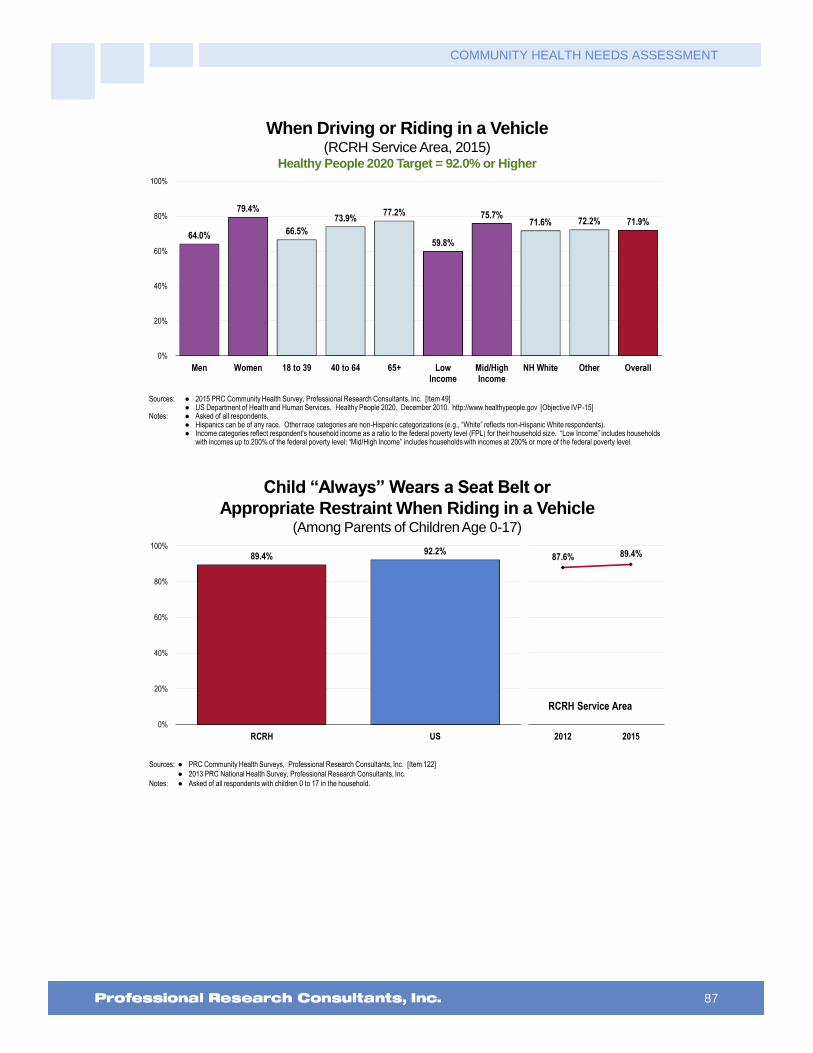
COMMUNITY HEALTH NEEDS ASSESSMENT
87
“Always” Wear a Seat Belt
When Driving or Riding in a Vehicle(RCRH Service Area, 2015)
Healthy People 2020 Target = 92.0% or Higher
Sources: � 2015 PRC Community Health Survey, Professional Research Consultants, Inc. [Item 49]� US Department of Health and Human Services. Healthy People 2020. December 2010. http://www.healthypeople.gov [Objective IVP-15]
Notes: � Asked of all respondents.� Hispanics can be of any race. Other race categories are non-Hispanic categorizations (e.g., “White” reflects non-Hispanic White respondents).� Income categories reflect respondent's household income as a ratio to the federal poverty level (FPL) for their household size. “Low Income” includes households
with incomes up to 200% of the federal poverty level; “Mid/High Income” includes households with incomes at 200% or more of the federal poverty level.
64.0%
79.4%
66.5%
73.9%77.2%
59.8%
75.7%71.6% 72.2% 71.9%
0%
20%
40%
60%
80%
100%
Men Women 18 to 39 40 to 64 65+ LowIncome
Mid/HighIncome
NH White Other Overall
Child “Always” Wears a Seat Belt or
Appropriate Restraint When Riding in a Vehicle(Among Parents of Children Age 0-17)
Sources: � PRC Community Health Surveys, Professional Research Consultants, Inc. [Item 122]
� 2013 PRC National Health Survey, Professional Research Consultants, Inc.
Notes: � Asked of all respondents with children 0 to 17 in the household.
89.4%92.2%
0%
20%
40%
60%
80%
100%
RCRH US
87.6% 89.4%
2012 2015
RCRH Service Area
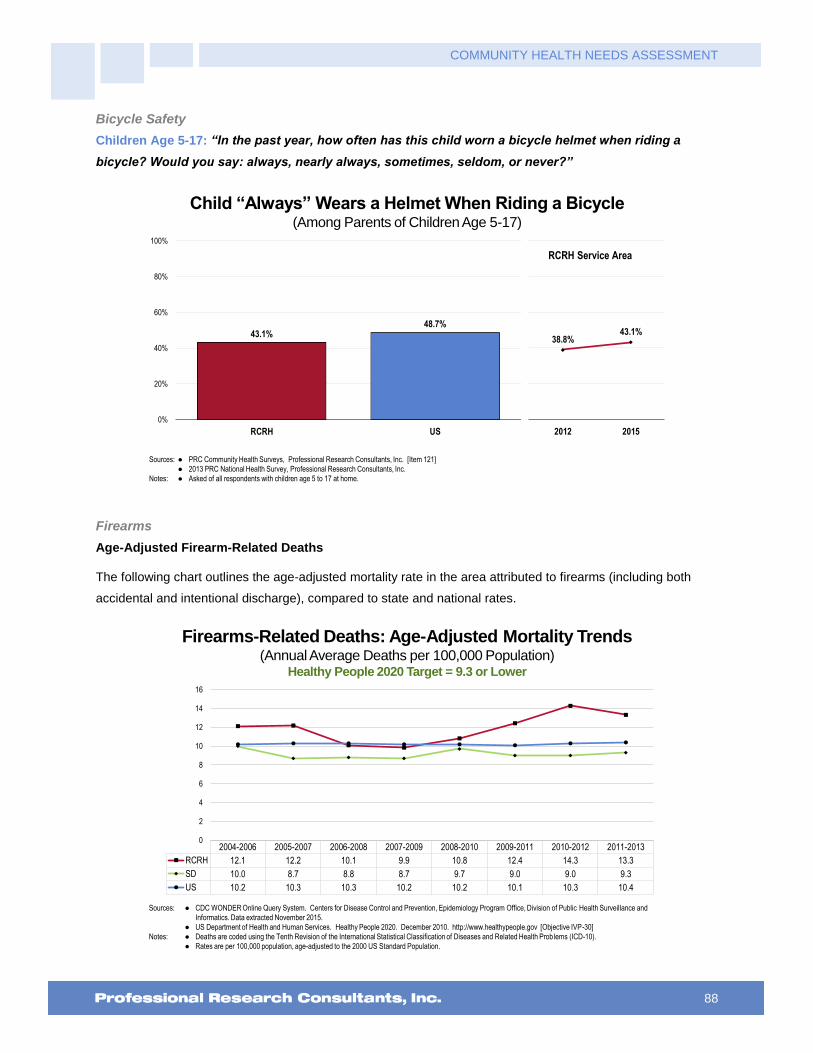
COMMUNITY HEALTH NEEDS ASSESSMENT
88
Bicycle Safety
Children Age 5-17: “In the past year, how often has this child worn a bicycle helmet when riding a
bicycle? Would you say: always, nearly always, sometimes, seldom, or never?”
Child “Always” Wears a Helmet When Riding a Bicycle(Among Parents of Children Age 5-17)
Sources: � PRC Community Health Surveys, Professional Research Consultants, Inc. [Item 121]
� 2013 PRC National Health Survey, Professional Research Consultants, Inc.
Notes: � Asked of all respondents with children age 5 to 17 at home.
43.1%48.7%
0%
20%
40%
60%
80%
100%
RCRH US
38.8%43.1%
2012 2015
RCRH Service Area
Firearms
Age-Adjusted Firearm-Related Deaths
The following chart outlines the age-adjusted mortality rate in the area attributed to firearms (including both
accidental and intentional discharge), compared to state and national rates.
Firearms-Related Deaths: Age-Adjusted Mortality Trends(Annual Average Deaths per 100,000 Population)
Healthy People 2020 Target = 9.3 or Lower
Sources: � CDC WONDER Online Query System. Centers for Disease Control and Prevention, Epidemiology Program Office, Division of Public Health Surveillance and
Informatics. Data extracted November 2015.
� US Department of Health and Human Services. Healthy People 2020. December 2010. http://www.healthypeople.gov [Objective IVP-30]
Notes: � Deaths are coded using the Tenth Revision of the International Statistical Classification of Diseases and Related Health Problems (ICD-10).
� Rates are per 100,000 population, age-adjusted to the 2000 US Standard Population.
2004-2006 2005-2007 2006-2008 2007-2009 2008-2010 2009-2011 2010-2012 2011-2013
RCRH 12.1 12.2 10.1 9.9 10.8 12.4 14.3 13.3
SD 10.0 8.7 8.8 8.7 9.7 9.0 9.0 9.3
US 10.2 10.3 10.3 10.2 10.2 10.1 10.3 10.4
0
2
4
6
8
10
12
14
16

COMMUNITY HEALTH NEEDS ASSESSMENT
89
Presence of Firearms in Homes
“Are there any firearms now kept in or around your home, including those kept in a garage, outdoor
storage area, truck, or car? For the purposes of this inquiry, ‘firearms’ include pistols, shotguns, rifles,
and other types of guns, but do NOT include starter pistols, BB guns, or guns that cannot fire.”
Have a Firearm Kept in or Around the Home
Sources: � PRC Community Health Surveys, Professional Research Consultants, Inc. [Items 52, 137]
� 2013 PRC National Health Survey, Professional Research Consultants, Inc.
Notes: � Asked of all respondents.
� In this case, firearms include pistols, shotguns, rifles, and other types of guns; this does not include starter pistols, BB guns, or guns that cannot fire.
56.2%
34.7%
0%
20%
40%
60%
80%
100%
RCRH US
58.8%56.2%
2012 2015
RCRH Service Area
Have a Firearm Kept in or Around the House(RCRH Service Area, 2015)
Sources: � 2015 PRC Community Health Survey, Professional Research Consultants, Inc. [Item 52]Notes: � Asked of all respondents.
� In this case, firearms include pistols, shotguns, rifles, and other types of guns; this does not include starter pistols, BB guns, or guns that cannot fire.� Hispanics can be of any race. Other race categories are non-Hispanic categorizations (e.g., “White” reflects non-Hispanic White respondents).� Income categories reflect respondent's household income as a ratio to the federal poverty level (FPL) for their household size. “Low Income” includes households
with incomes up to 200% of the federal poverty level; “Mid/High Income” includes households with incomes at 200% or more of the federal poverty level.
61.1%
51.8%
58.4% 58.5%
44.8%
36.8%
67.0%64.4%
12.7%
56.2%
0%
20%
40%
60%
80%
100%
Men Women 18 to 39 40 to 64 65+ LowIncome
Mid/HighIncome
NH White Other Overall

COMMUNITY HEALTH NEEDS ASSESSMENT
90
Intentional Injury (Violence)
Violent Crime
Violent crime is composed of four offenses (FBI Index offenses): murder and non-negligent manslaughter;
forcible rape; robbery; and aggravated assault. Note that the quality of crime data can vary widely from
location to location, depending on the consistency and completeness of reporting among various jurisdictions.
Violent Crime(Rate per 100,000 Population, 2010-2012)
Sources: � Federal Bureau of Investigation, FBI Uniform Crime Reports: 2012.
� Retrieved November 2015 from Community Commons at http://www.chna.org.
Notes: � This indicator reports the rate of violent crime offenses reported by the sheriff's office or county police department per 100,000 residents. Violent crime includes
homicide, rape, robbery, and aggravated assault. This indicator is relevant because it assesses community safety.
� Participation by law enforcement agencies in the UCR program is voluntary. Sub-state data do not necessarily represent an exhaustive list of crimes due to gaps in reporting.
Also, some institutions of higher education have their own police departments, which handle offenses occurring within campus grounds; these offenses are not included in the
violent crime statistics, but can be obtained from the Uniform Crime Reports Universities and Colleges data tables.
305.7 295.0
395.5
RCRH SD US
0
100
200
300
400
500
Violent Crime Experience: “Have you been the victim of a violent crime in your area in the past 5
years?”
Intimate Partner Violence: “The next questions are about different types of violence in relationships
with an intimate partner. By an intimate partner, I mean any current or former spouse, boyfriend, or
girlfriend. Someone you were dating, or romantically or sexually intimate with, would also be
considered an intimate partner. Has an intimate partner ever hit, slapped, pushed, kicked, or hurt you
in any way?”

COMMUNITY HEALTH NEEDS ASSESSMENT
91
Victim of a Violent Crime in the Past Five Years
Sources: � PRC Community Health Surveys, Professional Research Consultants, Inc. [Item 50]
� 2013 PRC National Health Survey, Professional Research Consultants, Inc.
Notes: � Asked of all respondents.
1.5% 2.8%
0%
20%
40%
60%
80%
100%
RCRH US
3.0% 1.5%
2012 2015
RCRH Service Area
Have Ever Been Hit, Slapped, Pushed,
Kicked, or Hurt in Any Way by an Intimate Partner
Sources: � PRC Community Health Surveys, Professional Research Consultants, Inc. [Item 51]
� 2013 PRC National Health Survey, Professional Research Consultants, Inc.
Notes: � Asked of all respondents.
11.0%15.0%
0%
20%
40%
60%
80%
100%
RCRH US
11.1% 11.0%
2012 2015
RCRH Service Area

COMMUNITY HEALTH NEEDS ASSESSMENT
92
Key Informant Input: Injury & Violence
The following chart outlines key informants’ perceptions of the severity of Injury & Violence as a problem in the
community:
Perceptions of Injury and Violence
as a Problem in the Community(Key Informants, 2015)
Sources: � PRC Online Key Informant Survey, Professional Research Consultants, Inc.
Notes: � Asked of all respondents.
33.6% 31.4% 27.3% 7.7%
Major Problem Moderate Problem Minor Problem No Problem At All
Top Concerns
Among those rating this issue as a “major problem,” reasons frequently related to the following:
Prevalence/Incidence
Services provided through the Emergency Department are often related to injury and violence. – Other Health Provider (Pennington County)
Violent crime rates have dramatically increased. – Social Services Provider (Pennington County)
Increase in violent crimes in Rapid City. Overly crowded Emergency Room at RCRH. – Other Health Provider (Pennington County)
The rise of violent crimes. – Community/Business Leader (Pennington County)
Not only has there been a significant increase in violent crime in Rapid City and Pennington County towards others, the rate of suicide, suicide attempts, and self-harm is at its all-time highest. – Social Services Provider (Pennington County)
It seems there is an increase in violence in our county. There seem to be few if any coordinated efforts county-wide to prevent unintentional injuries. There are several doing their best but not enough happens across the board. – Other Health Provider (Pennington County)
In the current year violent crime rates have risen considerable. In my work I also found many individuals exposed to violence and domestic abuse. Much of this is related to the poverty levels and substance abuse problems. – Other Health Provider (Pennington County)
We are off the charts over the past couple of years with assaults, homicides and suicides. – Other Health Provider (Pennington County)
There has recently been another spike in violent crimes, reportedly linked to drug addiction issues. Many motor vehicle accidents are also linked to substance use. There is a need for more inpatient treatment, especially for teenagers. – Public Health Representative (Pennington County)
As of recent, our community has had major concerns with injury and violence. Though there are many variables that contribute to injury and violence in our community, drugs, alcohol, low wages, and mental health concerns are major contributors. – Social Services Provider (Pennington County)
The crime rate has drastically increased over the past year according to Rapid City Police Department statistics. – Other Health Provider (Pennington County)
Violent crime rates are rising by the day. – Social Services Provider (Pennington County)
The injury and violence rate, especially among those who are living in poverty, is much higher than it should

COMMUNITY HEALTH NEEDS ASSESSMENT
93
be. Violence is a common occurrence out on the streets and injuries occur frequently. For those who live in poverty they walk everywhere which causes blisters, sunburns, slips on the ice, broken bones, and being exposed to violence due to unsafe environments. Many of these go unreported. There are many stabbings, assaults, and rapes that occur frequently. – Social Services Provider (Pennington County)
There has been an increase in violence over the last few years with homicides and beatings. I also think that due to our high alcohol and drug rates, we see more of this happening. – Other Health Provider (Pennington County)
Violence is at a raging high in 2015. We are constantly hearing more and more about domestic abuse, homicides, and suicides. We need to force the discipline in our community and hold our citizens to their actions. – Other Health Provider (Pennington County)
The recent beatings and murder in Memorial Park and along the bike path are examples. – Community/Business Leader (Pennington County)
There has been an increase in murders and violent attacks in Rapid City in the last year. – Community/Business Leader (Pennington County)
The crime rate is increasing in Pennington County and as a result there are more injuries and these crimes have been extremely violent, including stabbings and shootings. – Social Services Provider (Pennington County)
You hear about it on the news and in the paper and see the results of it in our hospital. – Other Health Provider (Pennington County)
Looking at the news and listening to the news, there are shootings and stabbings occurring at least weekly. The amount of child abuse that is reported, the number of babies who die at the hand of someone else all show me that this is a major and rising issue. – Other Health Provider (Pennington County)
Just information given on the nightly news seems to indicate an increase in violent crimes, robberies, shootings, drug related arrests. Our community may or may not be any worse than other communities our size or in this region, but it does seem to be a problem. – Social Services Provider (Pennington County)
Recent burglaries, stabbings and shootings in the news. – Other Health Provider (Pennington County)
Just read the newspaper on any given day. Too many people not taught how to work for a living and how to respect your fellow human being. – Other Health Provider (Pennington County)
Recently the news has been filled with stories and statistics highlighting the increase in violent crimes. – Other Health Provider (Pennington County)
Seven deaths in Rapid City this year. Frequent injuries present at the hospital secondary to violence. – Other Health Provider (Pennington County)
Several homicides and assaults within this area. – Other Health Provider (Pennington County)
Six homicides so far in 2015 alone and countless assaults. – Community/Business Leader (Pennington County)
The Rapid City area has one of the highest rates for rape. It has very little resources for sex trafficking and exploitation. – Other Health Provider (Pennington County)
Stressors
Homelessness, unemployment, addictions. These play into why people turn to physical violence. Many assailants use weapons: bats, pipes, tools. Some people are so injured that they require hospitalization and weeks of recovery, and the victim still might not be independent. – Other Health Provider (Pennington County)
Poverty, cycle of abuse, lack of education. – Social Services Provider (Pennington County)
I think when you have a demographic that is just trying to meet basic needs, that incurs a lot of stress. Some individuals turn to violence because of their under-developed coping mechanisms. – Other Health Provider (Pennington County)
Poverty, substance abuse, mental health issues, homelessness. – Other Health Provider (Pennington County)

COMMUNITY HEALTH NEEDS ASSESSMENT
94
Income and job opportunity. Not enough jobs for the population. People trying to feed their families. – Community/Business Leader (Butte County)
Large number of low socioeconomic status individuals. Large number of homeless/jobless. Large number of ETOH abuse. – Other Health Provider (Pennington County)
Poverty is the main reason for all these health disparities. – Public Health Representative (Oglala Lakota County)
We have a high population of unemployed people and racially biased people who feel they need to express themselves by causing injury or promoting violence in one way or another. – Other Health Provider (Pennington County)
Unemployment, because of their environment, their father beat their mother so it's acceptable behavior. Sexual abuse because it's acceptable. Because drug and alcohol is accessible and acceptable. Education that abuse is not acceptable. Mental health has to be addressed, along with substance abuse. – Other Health Provider (Pennington County)
Many individuals in South Dakota, Pennington County, are jobless, they become frustrated as they are unable to make payments on their bills so many individuals drink, which then situations become violent. – Other Health Provider (Pennington County)
Family Violence
Too much domestic violence. – Social Services Provider (Pennington County)
I feel we have some domestic abuse problems, stemming from alcohol and drug abuse, poor parenting in some homes where there are these problems. – Other Health Provider (Pennington County)
I am frequently shocked and saddened by the extreme interpersonal violence that is perpetrated on the reservations. We see severe injuries, usually linked to alcohol use, here at Regional Rehab. If there was any coordinated community public health intervention worth funding on a large scale in South Dakota, reducing violence and alcohol dependence would be it. – Other Health Provider (Pennington County)
Domestic violence. – Social Services Provider (Pennington County)
Domestic violence is not addressed adequately. Many doctors do not ask the question when children and women are brought in for injuries. And yes, men can be abused as well. – Community/Business Leader (Pennington County)
Domestic abuse. – Community/Business Leader (Pennington County)
I work in the child welfare field. I know there is a very high rate of child abuse and even child deaths that occurs due to abuse. In addition, our community has a high rate of domestic violence. Again, we work with kids who grow up in homes with DV. Research has proven that witnessing or being aware of DV going on in the home is one of the most traumatic events that can occur in a child's life. Unfortunately our society is not yet at the point where we identify this exposure in itself as a criminal or child welfare offense. It needs to be an avenue by which professionals can be mandated to work with families. We also know that in homes where DV occurs, other forms of troubling behavior is also happening, i.e. substance abuse, child abuse, neglect. Intervening in these cases can prevent lots of future health and child welfare issues. – Social Services Provider (Pennington County)
I worked at a domestic violence center in the area and saw how many women and children needed support due to violence in their life. It appears those who are caught receive punishment but I do not think punishment is the only answer to this problem, people need education and treatment. – Other Health Provider (Pennington County)
Recent incidents in Memorial Park area. – Social Services Provider (Pennington County)
We see many patients in the Emergency Room as a direct result of violence. Populations we see tend to have significant ETOH use, I personally believe this is a factor as well. – Other Health Provider (Pennington County)
I personally have provided care to individuals who had been seen prior in an Emergency Room for injuries sustained at another person's hand. – Other Health Provider (Oglala Lakota County)
Drug & Alcohol Use
Drug and alcohol addiction, behavioral and relationship issues stem from the need for guidance from a respected, trusted, healthy, emotionally, and spiritually sound role model in the individuals life. When past
COMMUNITY HEALTH NEEDS ASSESSMENT
95
generations are dysfunctional, future generations suffer in larger ways by acting out with anger and depression to name a couple. – Social Services Provider (Pennington County)
I think this directly relates to alcohol and substance abuse. –Other Health Provider (Oglala Lakota County)
Excessive drug use, also we have seen people who have been abused and/or beaten enter our facilities. Homelessness ads to this problem as well. – Social Services Provider (Pennington County)
Because alcohol abuse is so prevalent and poor family structure. Many children are not being raised by two stable parents. Many are in homes with abuse of all kinds as well as alcohol. Motor vehicle accidents occur because of alcohol. Fights because of alcohol and poor supervision and suicide because of all of the above and apparently no expectation or goals for jobs, stable family life, religion, relationships. What does the average 10 year old want to be when they grow up? How does the community and family keep that in mind and work towards a goal of being a happy, fulfilled person? Why not start at a very young age with a "life coach" concept through church, school, etc. and continue on a positive journey? - Physician (Oglala Lakota County)
We have seen a significant increase in meth use and murder rates. This is supported by the police department and county legal services which deal directly with these issues. An increase in drug use can be correlated to an increase in crime and violence. Furthermore, we have taken a high tolerance policy to juvenile crime and drug use so we are not intervening with social services, we are simply not charging youth for offenses that would previously been recorded as crimes. – Social Services Provider (Pennington County)
Substance abuse seems to be spearheading a lot of this. – Community/Business Leader (Pennington County)
Native American Population
Native American community disproportionately uses violence to solve problems. It's a culture of violence in the Native community. – Community/Business Leader (Pennington County)
Native American population is desperately fleeing the reservations for a "better life" yet the services to address the generations of alcoholism and abuse cycles is extremely limited. – Other Health Provider (Pennington County)
There seems to be a high rate of physical violence, especially amount young Native American men in this community. Frequently, there are two or three young men in the ICU at RCRH who are the victims of severe violence. I do not know what makes young men in our community at such a higher risk, but it is a real concern. – Physician (Pennington County)
Work with low income families and have contact with law enforcement people that work on the reservations. I hear about violence often in the news. – Social Services Provider (Pennington County)
Rising rate of violent crimes, especially in Rapid City and with the Native American population. – Other Health Provider (Pennington County)
Lack of Resources
Lack of mental health services and the mental health services that we do have or overwhelmed with the need for their services. – Other Health Provider (Oglala Lakota County)
Lack of support for victims, victim staying with the abuser, lenient legal involvement for abusers. – Social Services Provider (Pennington County)
Very little help for follow up on injury from a violent crime. – Community/Business Leader (Pennington County)
Accidental Injury
There is a large population of tourist and motorcycle riders that get injured frequently in our community. There is also a lot of physical violence in our reservations that is sent to our hospital. – Physician (Pennington County)
Because of the many visitors we have in our area during the summer months, there are many more injuries than in other communities: Hiking, camping, sight-seeing, travel, animal encounters. – Community/Business Leader (Custer County)

COMMUNITY HEALTH NEEDS ASSESSMENT
96
Lack of Parental/Family Involvement
Lack of parental/family involvement, "me" society with the young. – Community/Business Leader (Pennington County)
Drugs, all kinds. Lack of parental responsibility, lack of personnel responsibility. – Other Health Provider (Pennington County)
Rural Area
Farm/ranch area. – Community/Business Leader (Butte County)

COMMUNITY HEALTH NEEDS ASSESSMENT
97
Diabetes
About Diabetes
Diabetes mellitus occurs when the body cannot produce or respond appropriately to insulin. Insulin is a hormone that the body
needs to absorb and use glucose (sugar) as fuel for the body’s cells. Without a properly functioning insulin signaling system,
blood glucose levels become elevated and other metabolic abnormalities occur, leading to the development of serious,
disabling complications. Many forms of diabetes exist; the three common types are Type 1, Type 2, and gestational diabetes.
Effective therapy can prevent or delay diabetic complications.
Diabetes mellitus:
Lowers life expectancy by up to 15 years.
Increases the risk of heart disease by 2 to 4 times.
Is the leading cause of kidney failure, lower limb amputations, and adult-onset blindness.
The rate of diabetes mellitus continues to increase both in the United States and throughout the world. Due to the steady rise in
the number of persons with diabetes mellitus, and possibly earlier onset of type 2 diabetes mellitus, there is growing concern
about the possibility that the increase in the number of persons with diabetes mellitus and the complexity of their care might
overwhelm existing healthcare systems.
People from minority populations are more frequently affected by type 2 diabetes. Minority groups constitute 25% of all adult
patients with diabetes in the US and represent the majority of children and adolescents with type 2 diabetes.
Lifestyle change has been proven effective in preventing or delaying the onset of type 2 diabetes in high-risk individuals.
Healthy People 2020 (www.healthypeople.gov)
Age-Adjusted Diabetes Deaths
Age-adjusted diabetes mortality for the area is shown in the following chart.
Note the Healthy People 2020 target (as adjusted to account for diabetes mellitus-coded deaths).
Diabetes: Age-Adjusted Mortality Trends(Annual Average Deaths per 100,000 Population)
Healthy People 2020 Target = 20.5 or Lower (Adjusted)
Sources: � CDC WONDER Online Query System. Centers for Disease Control and Prevention, Epidemiology Program Office, Division of Public Health Surveillance and
Informatics. Data extracted November 2015.
� US Department of Health and Human Services. Healthy People 2020. December 2010. http://www.healthypeople.gov [Objective D-3]
Notes: � Deaths are coded using the Tenth Revision of the International Statistical Classification of Diseases and Related Health Problems (ICD-10).
� Rates are per 100,000 population, age-adjusted to the 2000 US Standard Population.
� The Healthy People 2020 target for Diabetes is adjusted to account for only diabetes mellitus coded deaths.
2004-2006 2005-2007 2006-2008 2007-2009 2008-2010 2009-2011 2010-2012 2011-2013
RCRH 28.9 28.1 23.1 20.4 20.4 21.3 22.3 19.6
SD 26.4 26.6 25.3 23.2 22.6 24.0 24.1 23.5
US 24.4 23.8 22.8 21.9 21.3 21.1 21.2 21.3
0
5
10
15
20
25
30
35

COMMUNITY HEALTH NEEDS ASSESSMENT
98
Prevalence of Diabetes
“Have you ever been told by a doctor that you have diabetes? (If female, add: Not counting diabetes
only occurring during pregnancy?)”
“(If female, add: Other than during pregnancy,) Have you ever been told by a doctor or other health
professional that you have pre-diabetes or borderline diabetes?”
Prevalence of Diabetes
Sources: � PRC Community Health Surveys, Professional Research Consultants, Inc. [Item 136]
� 2013 PRC National Health Survey, Professional Research Consultants, Inc.
� Behavioral Risk Factor Surveillance System Survey Data. Atlanta, Georgia. United States Department of Health and Human Services, Centers for Disease Control
and Prevention (CDC): 2013 South Dakota data.
Notes: � Asked of all respondents.
� Local and national data exclude gestation diabetes (occurring only during pregnancy).
11.7% 10.6%
2012 2015
10.6% 9.1%11.7%
0%
20%
40%
60%
80%
100%
RCRH SD US
Another 7.2% of adults report
that they have been diagnosed
with “pre-diabetes” or
“borderline” diabetes
(vs. 5.1% nationwide)
RCRH Service Area
Prevalence of Diabetes(RCRH Service Area, 2015)
Sources: � 2015 PRC Community Health Survey, Professional Research Consultants, Inc. [Item 136]Notes: � Asked of all respondents.
� Hispanics can be of any race. Other race categories are non-Hispanic categorizations (e.g., “White” reflects non-Hispanic White respondents).� Income categories reflect respondent's household income as a ratio to the federal poverty level (FPL) for their household size. “Low Income” includes households
with incomes up to 200% of the federal poverty level; “Mid/High Income” includes households with incomes at 200% or more of the federal poverty level. � Excludes gestation diabetes (occurring only during pregnancy).
11.5% 9.8%
0.0%
14.8%
22.4%
14.6%
6.8%10.3%
13.1% 10.6%
0%
20%
40%
60%
80%
100%
Men Women 18 to 39 40 to 64 65+ LowIncome
Mid/HighIncome
NH White Other Overall

COMMUNITY HEALTH NEEDS ASSESSMENT
99
Diabetes Testing
“Have you had a test for high blood sugar or diabetes within the past three years?”
Have Had Blood Sugar Tested in the Past Three Years(Among Non-Diabetics)
Sources: � 2015 PRC Community Health Survey, Professional Research Consultants, Inc. [Item 40]
� 2013 PRC National Health Survey, Professional Research Consultants, Inc.
Notes: � Asked of respondents who have not been diagnosed with diabetes.
52.1%49.2%
0%
20%
40%
60%
80%
100%
RCRH US
Key Informant Input: Diabetes
The following chart outlines key informants’ perceptions of the severity of Diabetes as a problem in the
community:
Perceptions of Diabetes
as a Problem in the Community(Key Informants, 2015)
Sources: � PRC Online Key Informant Survey, Professional Research Consultants, Inc.
Notes: � Asked of all respondents.
48.9% 33.9% 12.8%
Major Problem Moderate Problem Minor Problem No Problem At All
Challenges
Among those rating this issue as a “major problem,” the biggest challenges for people with diabetes are seen
as:
Health Education
Lacking adequate education and support. Financially taking care of diabetes is difficult. Cost of prescriptions keep going up. – Other Health Provider (Pennington County)
Lack of education. – Social Services Provider (Pennington County)

COMMUNITY HEALTH NEEDS ASSESSMENT
100
Lack of education seems to be an issue for some. However, I know that information and education doesn't mean individuals will make life changes. I'm a big proponent of Motivational Interviewing which is an evidence-based practice that focuses on healthcare providers using a certain conversational style with patients that is proven to enhance the motivation for change. I would love to see healthcare professionals trained in this approach and believe it would reduce the frustration often felt by us as professionals when people don't make decisions that we know would enhance their health and well-being. I would be willing to provide education/training if requested. – Other Health Provider (Lawrence County)
I think there are a lot of good programs for people with diabetes. I think people just don't know about the resources available for them. –Other Health Provider (Oglala Lakota County)
Education on prevention, especially for people in high risk categories who see themselves as unable to reduce a genetic risk. – Public Health Representative (Pennington County)
Knowledge about how to prevent and treat as well as the lack of willingness to change personal habits. – Community/Business Leader (Pennington County)
Having enough education and support. – Other Health Provider (Lawrence County)
Lack of education follow up by most patients. Patients are not usually receptive to the importance of controlling their diabetes. – Other Health Provider (Pennington County)
DM is a chronic disease and it's difficult to get patients to understand that they need to take it seriously. DM 2 is brought upon by people's poor lifestyle and eating choices so it's hard to get people to change their lifestyle fast enough to accommodate their new diagnosis. Outpatient DM education is available and almost every doctor addresses the topic with their patients, but it's just getting patients to accept responsibility for their actions that's hard. Society wants a quick fix or a pill to take, DM needs much more than that to be managed. – Other Health Provider (Pennington County)
Consistent, focused diabetes education for patients to gain understanding of the pathophysiology and impact of treatment modalities. – Other Health Provider (Oglala Lakota County)
A lack of education and financial assistance for medication is a large problem. There are several new medications on the market but people cannot afford the co-pay amounts for these medications. Diabetes education is available now but was not available locally for several years. People like to receive all of the healthcare close to home. Patients to have education in order to understand that the number one way to treat type 2 diabetes is through lifestyle modifications. Currently diabetes education is only offered in Custer so people living in outlying towns must still travel to receive the education. – Other Health Provider (Custer County)
Education, coverage of testing supplies, healthy diet options with limited budgets. – Other Health Provider (Pennington County)
Patient education and compliance. – Physician (Pennington County)
Education is available, but transport and cost of education can be issues. – Other Health Provider (Pennington County)
Education of their disease and how to handle or control it. Also, follow through with recommended information. – Other Health Provider (Pennington County)
I believe it is the education and programming currently available especially to the Native American population and rural residents of the state. In addition, fresh fruits and vegetables are lacking in some parts of the area and it is more expensive to get these items then "junk" food causing a lack of compliance. – Other Health Provider (Black Hills Region)
Discovery, understandability, knowing there are good resources in our community to help live with the challenge. – Community/Business Leader (Lawrence County)
Education on diet, traditional bad habits for eating. – Physician (Pennington County)
Eating healthier, increasing self-awareness about how the person can control their chronic disease. Education about disease management. – Other Health Provider (Pennington County)
There is not enough education about nutrition for prevention. – Community/Business Leader (Pennington County)
Healthy eating, making it to appointments, transportation, understanding the teaching they've received and correctly giving medications. – Social Services Provider (Pennington County)

COMMUNITY HEALTH NEEDS ASSESSMENT
101
Funding has been cut drastically for the pre-diabetes programs. – Community/Business Leader (Pennington County)
Disease Management
Poor patient compliance with dealing with their disease. – Other Health Provider (Pennington County)
Following a medication and diet regimen and making lifestyle changes to prevent complications, such as quitting smoking and getting enough exercise. Health literacy may also be a problem. – Physician (Pennington County)
It seems that there are a number of diabetics that have poor control of their diabetes and they don't like to travel to Rapid for their continued care. – Other Health Provider (Meade County)
It is difficult to make the necessary behavior changes to manage diabetes and to prevent diabetes. I assume it is difficult for some to consistently obtain the necessary medications to manage their diabetes. – Other Health Provider (Pennington County)
Compliance, cost and access to diabetes education that is affordable if uninsured or not covered by insurance. – Other Health Provider (Pennington County)
I think the biggest challenge for those with diabetes in our community is self-management. – Other Health Provider (Pennington County)
Many uncontrolled diabetics. – Physician (Lawrence County)
Being able to stabilize their living situation enough to have the time and energy to manage the illness. Low cost food choices are often less healthy and we have a high proportion of individuals living at or below poverty. – Other Health Provider (Pennington County)
Consistent, on-going care and management, lapses due to transportation issues or other barriers. – Community/Business Leader (Pennington County)
Compliance to their medications. Lack of funding to afford medications. Lack of inpatient diabetes education. – Other Health Provider (Pennington County)
Compliance. – Other Health Provider (Pennington County)
Proper way to care for yourself or others with diabetes. – Community/Business Leader (Pennington County)
Compliance. – Public Health Representative (Oglala Lakota County)
Compliance. – Other Health Provider (Custer County)
Non-compliance, genetic disposition, no early detection or teaching prevention. – Other Health Provider (Pennington County)
Non-compliance and lack of knowledge about dialysis. The importance of attending appointments, whether to start it, and when would be appropriate to discontinue it. – Other Health Provider (Pennington County)
Non-compliance, whether from taking responsibility once educated, lack of education, not being able to get to the needed resources, or not being able to afford the medications and good quality foods. Failure to control diabetes leads to so many additional health problems. – Other Health Provider (Pennington County)
Early identification and compliance. – Other Health Provider (Pennington County)
Continuity of care, no meaningful adult endocrine services available for hospitalized patients, poor patient follow-up often due to transportation or other monetary issues. – Other Health Provider (Pennington County)
Coordination of care and access to primary physicians in complex cases. – Physician (Lawrence County)
Ongoing care for this disease. – Other Health Provider (Lawrence County)
Nutrition, Physical Activity & Weight
Poor nutrition, lack of exercise. – Community/Business Leader (Pennington County)
Diet, exercise, regulating their insulin, staying on their medication. Not just go to the Emergency Room because they don't control their insulin. – Other Health Provider (Pennington County)
Dieting and exercise, overall healthcare. – Social Services Provider (Pennington County)
Diet and exercise. – Community/Business Leader (Pennington County)

COMMUNITY HEALTH NEEDS ASSESSMENT
102
Managing weight through diet and exercise. – Community/Business Leader (Pennington County)
Nutrition, activity, wellness, child education, adult education. – Community/Business Leader (Lawrence County)
Trying to stay active and healthy. Paying for medical services. – Community/Business Leader (Lawrence County)
Lifestyle choices. The Native American community in particular has a lot of overweight children and adults. – Social Services Provider (Pennington County)
Many individuals with diabetes are living in poverty and lack access to appropriate diet, exercise and medications. A friend who has diabetes has to carry multiple insurance policies just to be able to afford the medications and she is middle class. – Social Services Provider (Pennington County)
Low socioeconomic status in many diabetics. Poor diets, poor retention of education, poor motivation for better health. – Other Health Provider (Pennington County)
The demographics of the population in South Dakota is prone to acquiring Type II Diabetes. Obesity, sedentary lifestyle and lack of resources in the rural areas, I feel, makes the population more prone to developing diabetes type II. Access to Endocrinologists limited as well for the region. – Other Health Provider (Pennington County)
Diabetes goes hand in hand with increased obesity rates. – Other Health Provider (Pennington County)
Diet and weight. – Community/Business Leader (Pennington County)
A community that supports a healthy lifestyle and values healthy eating and behaviors. – Other Health Provider (Pennington County)
A place for the people to exercise in the winter. – Public Health Representative (Meade County) Vitamin and mineral deficiencies. – Community/Business Leader (Pennington County)
Access to Care/Services
Access to care is accessible, but there is continued difficulty getting medications and/or testing supplies necessary to manage this disease. However, I do not necessarily feel this is isolated to our community. – Physician (Pennington County)
Access to treatment and managing their disease on an on-going basis. – Social Services Provider (Pennington County)
Access to endocrinologists and other specialists as needed. – Other Health Provider (Pennington County)
Access to doctors specializing in diabetic care. Long-term evaluation and treatment coordination. – Other Health Provider (Pennington County)
Access to affordable care, supplies and appropriate nutrition. – Social Services Provider (Pennington County)
Cost for medical care along with the high cost of appropriate foods. Lack of education about the long-term effects of diabetes. – Other Health Provider (Pennington County)
People with diabetes who do not have health insurance often are not able to manage their illness. The cost of syringes and other related items is not covered if they do have insurance so they either cut down on their doses or reuse needles. – Community/Business Leader (Lawrence County)
For adults with diabetes there is inadequate access to high quality endocrinology services. There will now be only one endocrinologist in Rapid City where there is a huge need for this specialty. Even when endocrinologists were available, many difficult to manage patients have been transitioned over to care by PAs who do not have the expertise to deal with patients who are attempting unsuccessfully to control their insulin resistance and manage their diabetes. Several adult diabetes patients have expressed an opinion that the endocrinologists do not seem aggressive or innovative in patient management, but rather seem satisfied with "status quo" for patients who are not satisfied with their own diabetes control. Multiple patients have expressed that they would see other providers if they were available but are not willing to travel to Sioux Falls or Rochester for this ongoing care. – Other Health Provider (Pennington County)
The distance they need to travel to receive treatment. – Community/Business Leader (Pennington County)
Seeing an endocrinologist, there are only two for the adults and one is leaving. Food that is on WIC that is low glycemic. Understanding the impact of obesity on kids, families for life. – Other Health Provider (Pennington County)

COMMUNITY HEALTH NEEDS ASSESSMENT
103
With a car friendly-not walking friendly-community we have made it difficult for daily exercise. We have also made exercise a financial barrier particularly in cold weather seasons. Regarding diabetes, type 2, with unhealthy eating, limited access to exercise and healthy food options especially in impoverished areas, we have a community set-up for increased weight, poor nutrition, and ultimately higher rates of diabetes. – Social Services Provider (Pennington County)
IHS transportation limited for Native Americans to get to Sioux San for supplies. Diabetic supplies are expensive. Low income so most people buy foods they should not be eating and difficult for low income people to get to the food bank because of the location of the food bank and limited affordable resources for individuals to receive education about diabetes. – Other Health Provider (Pennington County)
Prevalence/Incidence
We have a lot of people with diabetes. A large degree is due to inadequate diet. This may range to lack of education on appropriate food intake, it may be due to intentional overeating resulting in obesity or genetics may play a part in some patient’s obesity. A major component I see is due to high cost of nutritional foods. Rather than eat quality meat, the person chooses a cheaper grain product. A peanut butter and jelly sandwich over a piece of chicken, vegetable and salad for dinner. It is much cheaper for the family. The cost of living here in Pennington Co. and in SD is greater than the East Coast. People’s salaries are commensurate with the cost of living so there is less budget to provide quality food. – Social Services Provider (Pennington County)
Diabetes is a major concern for many in our community. There are significant variables for those that struggle with this disease, especially those living in poverty or for the working class poor. Challenges include but not limited to, lack of transportation to and from medical appointments, minimal support at home, inability to afford nutritious foods or ability to prepare of healthy meals, and lack of affordable outreach programs that support those managing and living with diabetes. – Social Services Provider (Pennington County)
A lot of people suffering from this and don't know how to manage it. – Other Health Provider (Custer County)
I'm not sure what the biggest challenges are for those with diabetes, it just seems that many people in our community deal with some level of diabetes. However, I must admit, it does seem less prevalent than some areas in which I have lived before. I think obesity is also less of an issue here than in the past communities in which I've lived. – Community/Business Leader (Custer County)
Very high incidence of diabetes in the community. Need for more and better diabetic education within the healthcare system and within local communities. Needs to be more education in schools and communities regarding diet, weight, and exercise. – Physician (Black Hills region)
I believe so many in the community have diabetes, lack of motivation on proper eating and exercise. Poor eating habits and no exercise are a terrible mix leading to type 2 diabetes. – Other Health Provider (Pennington County)
In our community we have a large percentage of the population at risk for Type 2 Diabetes. The challenges include prevention, diagnosis and treatment. – Other Health Provider (Black Hills Region)
Treatment Cost
Not being able to afford insulin and the supplies or not being able to afford the new medications. Also the co-pays for the people that do have insurance still remains high and is a financial burden for many. Because many do not have insurance, they don't take the insulin or medication as prescribed. Because of that, many are re-admitted to the hospital for DKA or for other medical problems caused by their diabetes not being managed well. – Other Health Provider (Pennington County)
Cost of their medications and the ability to get DB education as an outpatient. No insurance. – Other Health Provider (Pennington County)
Paying for insulin since it is non-generic and proper diabetes education. – Physician (Lawrence County)
Medication cost and compliance. – Other Health Provider (Pennington County)
Cost of new medications that could increase compliance to treatment plan. Older medications may be affordable but are not as conducive to compliance due to frequency and invasive nature of the treatment. Access to inexpensive healthy food choices. Healthy foods are available but often are far too expensive due to patients’ socioeconomic status. Diabetes education classes and support to supplement physician visits. Use of supportive personnel to case manage and get information to patient, engaging patient more in their plan would be helpful. – Other Health Provider (Custer County)
COMMUNITY HEALTH NEEDS ASSESSMENT
104
They cannot afford the medications, strips, and meters prescribed. No gas and or transportation to get to appointments. Has helped in our community to having traveling providers and staff as it makes it easier for patients to get to appointments. – Other Health Provider (Meade County)
Being able to afford the strips to check their blood sugar. – Other Health Provider (Meade County)
Financial means to seek constant care for a chronic illness. – Other Health Provider (Pennington County)
Ability to afford/access expert medical care and affordability for diabetes education. – Other Health Provider (Lawrence County)
Medication and diet compliance, addiction to substances. – Other Health Provider (Pennington County)
Access to Healthy Food
Poor diets due to very low incomes and high costs of nutritious foods. Lack of good medical insurance for medication and supplies. Poor services for Natives through IHS. High cost of diabetes care instructional course not affordable to most people, even those with insurance. There is only one specialist for children. – Community/Business Leader (Pennington County)
When people live in poverty there is little access to good nutritious food, leading them to eat the poor food choices that are available. This, along with little exercise, causes weight gain, which leads to diabetes. Many Native American people are plagued with this disease. – Social Services Provider (Pennington County)
Lack of access to healthy and nutritious foods and lack of knowledge of how to prepare these foods. – Other Health Provider (Oglala Lakota County)
Access to health foods. – Social Services Provider (Pennington County)
Poor nutrition. Not knowing or being able to afford an adequate diet. Not doing regular finger stick testing because of the cost of the test strips. Denial of the diagnosis and just not taking care of oneself. – Other Health Provider (Pennington County)
Likely fresh fruit and vegetables and reasonable prices, and safe places to exercise like a walking track, exercise gym, etc. There is a community gym but patients report that it is small and crowded. I would also think that group visits would be helpful at the IHS facility to introduce diabetics to each other, discuss what others have found to be helpful in the community, maybe organize a produce co-op that would make it feasible to bring in for a certain number of clients fresh items that are picked up on a predictable schedule. – Physician (Oglala Lakota County)
I believe the biggest challenge for people with diabetes in my community is healthy food options and diabetic education resources. – Public Health Representative (Lawrence County)
Lack of Resources
There aren't resources available to make sure people are managing their diabetes properly. There aren't healthy options to instill healthy habits in children to assist with diabetes prevention. – Other Health Provider (Custer County)
Having the support network necessary to manage diabetes. There are linkages to genetics and lifestyle. I believe all of us need to maintain a lifelong awareness of how diabetes may occur in adults. – Community/Business Leader (Lawrence County)
Lack of Endocrinology services in a community with a high incidence of diabetes. – Physician (Pennington County)
Access to physicians locally who specialize in managing diabetes. – Other Health Provider (Lawrence County)
Lack of expertise and physicians to provide care. Noncompliance and financial resources for people to obtain supplies needed. – Other Health Provider (Lawrence County)
Availability of providers and one-on-one management. – Other Health Provider (Pennington County)
Resources for medications and nutrition. – Other Health Provider (Pennington County)
I have had several people say the facility in Sioux Falls in much better in treating diabetes. – Social Services Provider (Pennington County)
I wouldn't say this is a major issue, but a patient's family member is seeking to develop an amputee support group. – Social Services Provider (Pennington County)

COMMUNITY HEALTH NEEDS ASSESSMENT
105
Funding has been cut drastically for the pre-diabetes programs. – Community/Business Leader (Pennington County)
Native American Population
Diabetes is such a big problem with Native Americans. For those that need to see physicians, IHS is such a cumbersome, long process. Even for white residents, diabetes is being seen more frequently due to life choices. – Community/Business Leader (Pennington County)
Native Americans/Alaskan Natives have the highest rate of diabetes in the nation. Many lack the education to care for themselves and prevent many of the complications associated with the disease. – Other Health Provider (Pennington County)
Diabetes is very prevalent in the Native American population in Pennington County and the counties surrounding Pennington. The poverty level is also extremely high in the Native American population consequently many cannot afford to seek adequate treatment and maintain proper nutrition. – Other Health Provider (Pennington County)
Prevention
Preventive care such as eating right, most official diets do not eliminate sugars and preservatives, but stress only the reduction. I think the way we eat is causing so many people with type 2 diabetes. I also think the drug companies have created diet programs and that seems like a conflict of interest in that they want people to stay on their drugs so the diet doesn't help them get better. – Community/Business Leader (Pennington County)
Preventative services along with individualized planning for our diagnosed patients. – Other Health Provider (Lawrence County)
Lack of adequate disease management including preventative actions for pre-diabetes to include diet and exercise. Obesity is contributed to by a childhood of not getting fresh food instead of processed foods. – Other Health Provider (Pennington County)
Lack of prevention, identification and treatment, following and sticking with individual health plans. – Community/Business Leader (Pennington County)
Aging Population
Aging population, lower incomes, poor diet can lead to diabetes. – Community/Business Leader (Butte County)

COMMUNITY HEALTH NEEDS ASSESSMENT
106
Alzheimer’s Disease
About Dementia
Dementia is the loss of cognitive functioning—thinking, remembering, and reasoning—to such an extent that it interferes with a
person’s daily life. Dementia is not a disease itself, but rather a set of symptoms. Memory loss is a common symptom of
dementia, although memory loss by itself does not mean a person has dementia. Alzheimer’s disease is the most common
cause of dementia, accounting for the majority of all diagnosed cases.
Alzheimer’s disease is the 6th leading cause of death among adults age 18 years and older. Estimates vary, but experts
suggest that up to 5.1 million Americans age 65 years and older have Alzheimer’s disease. These numbers are predicted to
more than double by 2050 unless more effective ways to treat and prevent Alzheimer’s disease are found.
Healthy People 2020 (www.healthypeople.gov)
Age-Adjusted Alzheimer ’s Disease Deaths
Age-adjusted Alzheimer’s disease mortality rates are outlined below.
Alzheimer's Disease: Age-Adjusted Mortality Trends(Annual Average Deaths per 100,000 Population)
Sources: � CDC WONDER Online Query System. Centers for Disease Control and Prevention, Epidemiology Program Office, Division of Public Health Surveillance and
Informatics. Data extracted November 2015.
Notes: � Deaths are coded using the Tenth Revision of the International Statistical Classification of Diseases and Related Health Problems (ICD-10).
� Rates are per 100,000 population, age-adjusted to the 2000 US Standard Population.
2004-2006 2005-2007 2006-2008 2007-2009 2008-2010 2009-2011 2010-2012 2011-2013
RCRH 31.3 33.0 33.0 30.0 28.3 26.9 26.7 26.4
SD 27.7 30.5 33.5 35.4 36.7 36.5 37.3 37.0
US 23.4 23.8 24.4 24.6 25.0 24.7 24.5 24.0
0
5
10
15
20
25
30
35
40
Key Informant Input: Dementias, Including Alzheimer’s Disease
The following chart outlines key informants’ perceptions of the severity of Dementias, Including Alzheimer’s
Disease as a problem in the community:

COMMUNITY HEALTH NEEDS ASSESSMENT
107
Perceptions of Dementia/Alzheimer's Disease
as a Problem in the Community(Key Informants, 2015)
Sources: � PRC Online Key Informant Survey, Professional Research Consultants, Inc.
Notes: � Asked of all respondents.
22.1% 52.0% 22.5%
Major Problem Moderate Problem Minor Problem No Problem At All
Top Concerns
Among those rating this issue as a “major problem,” reasons frequently related to the following:
Prevalence/Incidence
Again lots of people in our community seem to be struggling with some form of this disease. – Community/Business Leader (Custer County)
In general Alzheimer's is a growing problem in most communities. In this community, lack of specialized services is a problem. Memory Care Units specifically addressing needs of dementia patients are not available. Family support groups are available somewhat. Local assisted living facilities have in some ways generalized this population into their facilities. This leaves independent or lucid residents dealing with dementia patients when that is not their responsibility as they have their own care needs. – Community/Business Leader (Lawrence County)
I don't believe that our rates of dementia are higher in our community, but that the challenges of rural health make caring for someone with dementia more of a challenge. The shortage of nursing home/long term care beds in our area is a challenge for families looking for round-the-clock care. Few assisted living centers accept Medicaid long-term care coverage, so those that round-the-clock care is sometime not available for low-income families. The Alzheimer's Association does not have a local office with access to their education resources. – Other Health Provider (Black Hills Region)
Dementia/Alzheimer's disease is something I hear of almost in every conversation with elderly people. They either know of someone or have a family member with this disease. I personally have watched five spouses taking care of their mate in an attempt to keep their partner out of a nursing home. – Other Health Provider (Pennington County)
I see many older people and some middle age who have dementia/Alzheimer's Disease. Family struggle with this disease because there is hardly any caregiver support for families. Long-term care is too costly for many families or hiring someone to care for a dementia patient is also too costly, along with very limited support services. – Other Health Provider (Pennington County)
Dementia/Alzheimer's affects a large number of the patients and families that I see and there are limited resources in our community to help them. Family members are left to care for their loved ones 24/7 with little outside help, which is a huge burden on them, and then, if they do get to the point where they can no longer manage this at home, they have few to no choices in where to place them. Many are forced to send their loved ones hours away, across the state or to a different state altogether. Caregivers are already faced with the guilt of placing their loved one, then on top of that, the stress of having nowhere to go after they have made that difficult decision. – Social Services Provider (Pennington County)
More and more people are being diagnosed with this illness. This community has limited availability for the amount of individuals who are stricken with this illness. Also, outpatient support groups overwhelmed, understaffed and in some cases not specifically trained to support both the individuals and families who are dealing with this disease. – Other Health Provider (Pennington County)
Dementia and Alzheimer's are becoming more and more prevalent. There are few homes to take care of these patients. – Community/Business Leader (Pennington County)
Dementia and Alzheimer's rates continue to rise and there isn't a lot of public knowledge on the signs and symptoms. It is always a heavy burden on care givers. – Community/Business Leader (Pennington County)

COMMUNITY HEALTH NEEDS ASSESSMENT
108
This is a growing problem that is not well understood. It has no known cure nor a well-documented way to slow the disease. The impact on the family and community is large and I don't feel our county is prepared for many more people to be diagnosed with dementia. Impact are not only to healthcare, but housing and the mental health of the caregivers. There is a lack of services available to people with dementia. – Other Health Provider (Pennington County)
As our mother is elderly and is now in an assisted living center, experiencing dementia, we have become very aware of the number of people in the region with dementia/Alzheimer's disease. I am certain is has always been evident in Lawrence County but with our personal experience, we have noted the number of individuals who are experiencing the challenges of both diseases. – Community/Business Leader (Lawrence County)
Many of the senior population have issues with some memory loss, anxiety issues, or depression. – Community/Business Leader (Custer County)
Lack of Resources
We have limited resources for this population especially for those that are elderly and those afflicted with chronic addiction. – Other Health Provider (Pennington County)
We have no resources to assist people and their families with this disease and process of. – Other Health Provider (Lawrence County)
There is no services to address this need. The doctor may prescribe medications but other than that family is responsible for their care. – Public Health Representative (Oglala Lakota County)
We have had several people in the area, but no resources or facilities to help them or the caregivers. – Public Health Representative (Meade County)
Not enough resources or support. – Other Health Provider (Pennington County)
Facing it with family member and not sure of resources. – Social Services Provider (Pennington County)
There simply aren't enough resources. Families have nowhere to turn for information. They are left feeling helpless and hopeless and are not sure what to do when caring for a loved one with Alzheimer's or another dementia. They often feel like their loved one must go into a facility and that isn't the case. We don't have enough beds for late stage Alzheimer's people and most of the time, people completely overlook non-medical, in home care places like Home Instead Senior Care. There is very little training available to families and even staff members that work day in and day out with people suffering from Alzheimer's disease. And this just isn't this area, this is a global problem. – Other Health Provider (Pennington County)
There are limited options available for when people with dementia and Alzheimer's are no longer able to reside in their homes with family support. Few assisted livings are able to provide that level of care and only one nursing home has a dementia program and is often full. Need more out of home placement options with high level dementia services. – Other Health Provider (Pennington County)
Services are limited for families and caregivers when individuals with dementia/Alzheimer's are getting close to needing 24 hour care but may not need assisted living services quite yet or families may not be interested in assisted living but need support. – Other Health Provider (Lawrence County)
Support services are very limited for caregivers respite care, etc. Many caregivers will attempt to keep the patient at home for as long as possible to avoid the high costs of nursing homes but then they get burned out and the patient often receives inadequate care. When the patient/family is ready for a Nursing Home, many are limited in the scope of care they provide for dementia patients and the cost is a major limiting factor. – Social Services Provider (Pennington County)
We do not have support services for families caring for their family members with Alzheimer's. No support group. No adult daycare. Very limited number of private sitters and caretakers. – Physician (Custer County)
SNF/AL placement or home care for patients with dementia being hindered by financial resources. – Other Health Provider (Pennington County)
People who are impacted by dementia or Alzheimer's can expect to live with the disease for a large number of years. The services required increase overtime and the number of services available at this time will not meet future demands. The disease is very demanding for people providing care to people with the disease. The respite/adult day options are very few to assist family caregivers. This is a big problem in the more metro areas of Western South Dakota and a huge problem in frontier areas. There is also a need to enhance palliative care training for all medical providers. – Social Services Provider (Pennington County)

COMMUNITY HEALTH NEEDS ASSESSMENT
109
Lack of Treatment Facilities
Only a few secured units. – Community/Business Leader (Pennington County)
I work in assisted living and when a resident becomes too much of a risk to house in our unsecure unit, it is extremely difficult to find placement for them. I also receive a lot of inquiries looking for placement for individuals with substance abuse problems and a huge variety of mental health problems that I cannot admit to my facility. When I must decline these individuals I find it very difficult to find anywhere else to refer them. – Other Health Provider (Custer County)
Dementia beds at long-term care facilities are very limited. There is limited locked ward availability. – Other Health Provider (Pennington County)
Lack of nursing homes. – Community/Business Leader (Pennington County)
Lack of healthcare resources for aggressive Alzheimer's disease patients. They often end up on a locked Mental Health Unit with younger, aggressive patients or at the State Hospital in Yankton. Acutely Confused Alzheimer's Patients are very vulnerable and can easily be taken advantage of in this care settings. Also, limited Adult Day Care and Respite Care resources for caregivers to patients with Alzheimer's disease. – Other Health Provider (Pennington County)
Availability of facilities to accommodate the appropriate level of care for individuals with higher needs like nursing home beds and memory care units. Finding nursing home beds or facilities that can accommodate patients with dementia is always a difficult task. In addition to this, it is extremely difficult to find community doctors in Rapid City that will follow patients in nursing homes. This becomes even more difficult for veterans who have always received their primary care at the VA, as VA doctors are unable to follow patients in nursing homes and community doctors are unwilling to pick up new patients who are going into nursing homes. – Social Services Provider (Pennington County)
There are few places that take true dementia patients. When they are in long term care and have an episode of anger they are immediately transferred to the hospital and return to the LTC facility is frequently denied. – Other Health Provider (Pennington County)
I co-facilitate a support group for dementia caregivers. There are not adequate memory care facilities or in-home resources available to address the needs of those with dementia. One in four people over 65 and one in two people over 80 have dementia. – Social Services Provider (Pennington County)
We have a shortage of beds. Nursing homes have limited willingness to take Medicaid patients. – Social Services Provider (Pennington County)
This tragic disease ends up warehousing seniors in institutions and destroying family finances. For both patients and caregivers there needs to be far more support and research. – Community/Business Leader (Pennington County)
Aging Population
There are many elderly persons at risk for it. There is not a one-stop place where their families can bring them for an evaluation, education and links to community resources. Persons with dementia are at risk for self-neglect and financial exploitation. – Physician (Pennington County)
We have a preponderance of retiree's in the Black Hills. – Other Health Provider (Pennington County)
Once again, the age of the residents in our community is the primary reason this is such a problem. We check out quite a few books to family members who are trying to help and understand those who are dealing with dementia. – Community/Business Leader (Custer County)
We have an aging population and no way to keep these patients in their community. – Other Health Provider (Lawrence County)
As our community ages we see more and more individuals plagued with some form of memory loss and see many more suffering from memory loss in our assisted living and healthcare facilities as well as beginning stages apparent in our independent living. – Other Health Provider (Pennington County)
Aging is a major factor in Rapid City, and services, particularly housing are a real issue for Dementia/Alzheimer's patients here. – Community/Business Leader (Pennington County)
Aging population. – Community/Business Leader (Butte County)

COMMUNITY HEALTH NEEDS ASSESSMENT
110
Access to Care/Services
I think it is a problem in all communities until there is a treatment available that may offset or minimize the effects of the disease. – Community/Business Leader (Pennington County)
I think largely it is an availability and access issue. It creates a tremendous strain on families. Finding adequate care for loved one that is unable to conform to the expectations of their surroundings happens frequently. The client needs outstrips the resources. – Other Health Provider (Pennington County)
There is a large back log to get a visit for neuropsych and or a neurological evaluations. Once diagnosed there are limited facilities designed to handle these patients at a reasonable cost. – Other Health Provider (Pennington County)
Many elder patients and no neurologist available. – Physician (Lawrence County)
Caregiving
Informal/family caregiving is a major issue because of the impact it has on the health and well-being of the person providing care to the people with a disability. Research shows that caregiving can have a wide range of negative impacts on health and wellness. Family caregivers often work and may even be raising children. It is not uncommon for family caregivers to provide 20 hours of service to their loved ones a week. That is equivalent to a part-time job. Family caregivers often forgo their own health and wellness needs to provide assistance to their loved ones, and ultimately their unmet needs cost our healthcare system more. Taking care of our caregivers is essential to ensuring the health of our community. – Social Services Provider (Pennington County)
Health Education
Education and elder care are lacking. – Community/Business Leader (Pennington County)
Nutrition
Vitamin and mineral deficiencies. – Community/Business Leader (Pennington County)

COMMUNITY HEALTH NEEDS ASSESSMENT
111
Kidney Disease
About Chronic Kidney Disease
Chronic kidney disease and end-stage renal disease are significant public health problems in the United States and a major
source of suffering and poor quality of life for those afflicted. They are responsible for premature death and exact a high
economic price from both the private and public sectors. Nearly 25% of the Medicare budget is used to treat people with
chronic kidney disease and end-stage renal disease.
Genetic determinants have a large influence on the development and progression of chronic kidney disease. It is not possible
to alter a person’s biology and genetic determinants; however, environmental influences and individual behaviors also have a
significant influence on the development and progression of chronic kidney disease. As a result, some populations are
disproportionately affected. Successful behavior modification is expected to have a positive influence on the disease.
Diabetes is the most common cause of kidney failure. The results of the Diabetes Prevention Program (DPP) funded by the
national Institute of Diabetes and Digestive and Kidney Diseases (NIDDK) show that moderate exercise, a healthier diet, and
weight reduction can prevent development of type 2 diabetes in persons at risk.
Healthy People 2020 (www.healthypeople.gov)
Age-Adjusted Kidney Disease Deaths
Age-adjusted kidney disease mortality is described in the following chart.
Kidney Disease: Age-Adjusted Mortality Trends(Annual Average Deaths per 100,000 Population)
Sources: � CDC WONDER Online Query System. Centers for Disease Control and Prevention, Epidemiology Program Office, Division of Public Health Surveillance and
Informatics. Data extracted November 2015.
Notes: � Deaths are coded using the Tenth Revision of the International Statistical Classification of Diseases and Related Health Problems (ICD-10).
� Rates are per 100,000 population, age-adjusted to the 2000 US Standard Population.
2004-2006 2005-2007 2006-2008 2007-2009 2008-2010 2009-2011 2010-2012 2011-2013
RCRH 7.8 6.7 8.0 9.8 10.5 7.9 5.7 4.2
SD 7.3 6.6 7.7 9.0 8.8 7.3 5.8 5.3
US 14.7 14.8 14.9 15.0 15.2 14.6 13.9 13.2
0
2
4
6
8
10
12
14
16

COMMUNITY HEALTH NEEDS ASSESSMENT
112
Prevalence of Kidney Disease
“Would you please tell me if you have ever suffered from or been diagnosed with kidney disease?”
Prevalence of Kidney Disease
Sources: � 2015 PRC Community Health Survey, Professional Research Consultants, Inc. [Item 33]
� Behavioral Risk Factor Surveillance System Survey Data. Atlanta, Georgia. United States Department of Health and Human Services, Centers for Disease Control
and Prevention (CDC): 2013 South Dakota data.
� 2013 PRC National Health Survey, Professional Research Consultants, Inc.
Notes: � Asked of all respondents.
1.8% 2.5% 3.0%
0%
20%
40%
60%
80%
100%
RCRH SD US
Prevalence of Kidney Disease(RCRH Service Area, 2015)
Sources: � 2015 PRC Community Health Survey, Professional Research Consultants, Inc. [Item 33]Notes: � Asked of all respondents.
� Hispanics can be of any race. Other race categories are non-Hispanic categorizations (e.g., “White” reflects non-Hispanic White respondents).� Income categories reflect respondent's household income as a ratio to the federal poverty level (FPL) for their household size. “Low Income” includes households
with incomes up to 200% of the federal poverty level; “Mid/High Income” includes households with incomes at 200% or more of the federal poverty level.
2.0% 1.6% 0.0%2.7% 3.6% 2.7% 1.3% 1.8% 2.3% 1.8%
0%
20%
40%
60%
80%
100%
Men Women 18 to 39 40 to 64 65+ LowIncome
Mid/HighIncome
NH White Other Overall

COMMUNITY HEALTH NEEDS ASSESSMENT
113
Key Informant Input: Chronic Kidney Disease
The following chart outlines key informants’ perceptions of the severity of Chronic Kidney Disease as a problem
in the community:
Perceptions of Chronic Kidney Disease
as a Problem in the Community(Key Informants, 2015)
Sources: � PRC Online Key Informant Survey, Professional Research Consultants, Inc.
Notes: � Asked of all respondents.
23.9% 43.1% 26.7% 6.3%
Major Problem Moderate Problem Minor Problem No Problem At All
Top Concerns
Among those rating this issue as a “major problem,” reasons frequently related to the following:
Treatment Barriers
The availability of dialysis is a huge issue. There are often times no openings in either Rapid City or Spearfish lately and people are having to go as far as Sharps Corner for dialysis. – Other Health Provider (Pennington County)
The high number of people needing dialysis services. – Other Health Provider (Pennington County)
We currently have multiple patients in need of hemodialysis. There is only one outpatient dialysis unit and they are often full. – Other Health Provider (Pennington County)
I see a great deal of individuals on dialysis in addition to there being a strain on the dialysis unit, causing some individuals to have to go out of town to receive the life-saving procedure on a continuous basis. – Social Services Provider (Pennington County)
Hemo-dialysis services in Pennington County are full. High Native American population with ESRD in the area. – Other Health Provider (Pennington County)
The number of people who end up in dialysis is high. – Other Health Provider (Pennington County)
Lack of prevention and treatment in our community. – Community/Business Leader (Pennington County)
Many people with end stage renal disease requiring dialysis. Dialysis units are frequently full and patients are having difficulty finding a unit. – Other Health Provider (Pennington County)
We have more people needing dialysis than we can accommodate comfortably. People need good primary care and lifestyle education to keep from getting to end stage kidney disease. – Physician (Pennington County)
The number of people requiring dialysis services continues to increase year by year. – Other Health Provider (Pennington County)
From a healthcare provider standpoint, it is an access problem due to the limited nephrologists in the community along with limited locations for dialysis. The area includes many reservations where patients are treated for chronic kidney disease. – Other Health Provider (Pennington County)
Provider availability. – Other Health Provider (Pennington County)
Our current dialysis units cannot keep up with the growth of dialysis dependent patients. – Other Health Provider (Pennington County)
We have numerous patients admitted to the hospital that are either on dialysis or have end stage renal

COMMUNITY HEALTH NEEDS ASSESSMENT
114
disease and will need dialysis in the future. It is very prevalent in the Native American population. Usually due to DM2 noncompliance. – Other Health Provider (Pennington County)
Many unable to get dialysis. Very hard to get in. – Community/Business Leader (Pennington County)
Not enough dialysis slots. Providers on the reservation units cannot often take patients and they must travel hours to get to Rapid City. Transportation continues to be a struggle for patients on dialysis. CHR and dial a ride services are not offered at times needed for ongoing dialysis treatments to serve the community. Larger dialysis unit is needed to meet the needs. Difficult to find nursing home placement and dialysis available at the same location for discharging patients from the hospital. Nursing homes on the reservation need to take dialysis patients to allow them to stay in their community. – Other Health Provider (Pennington County)
There are only three dialysis centers- not including reservations- that serve Western South Dakota. Pennington County has the outpatient HD center at the Aspen Center, as well as the inpatient HD at RCRH. There is only so much space to accommodate chairs for HD as well as only so many specialized nurses to care for HD patients. And with so many people living longer and HD being given as an option instead of hospice, the HD facilities are stretched to meet the need. – Other Health Provider (Pennington County)
Access to dialysis units and high incidence of diabetes. – Social Services Provider (Pennington County)
There is limited access to dialysis in the community. This is part of a domino effect because of limited access in other counties. Kidney disease occurs as a result of the lack of care/management of other health problems. This includes not keeping appointments for preventative care when illness is mild. – Other Health Provider (Pennington County)
I work in the dialysis unit and there seems to be a high need for dialysis treatments whether it is local in Rapid City, reservations, or surrounding areas in South Dakota. – Other Health Provider (Pennington County)
For those that need dialysis, the closet facility is 50 miles one way. – Public Health Representative (Meade County)
Transportation, to get treated for major or minor issues. – Public Health Representative (Oglala Lakota County)
Comorbidities
There is a lot of diabetes and many patients with ESRD. There is a shortage of Nephrologists to handle this. It is hard to get to see a specialist. – Physician (Pennington County)
Common disease with diabetes and cancer. – Community/Business Leader (Lawrence County)
Uncontrolled diabetes and hypertension are common chronic conditions that cause kidney disease. – Other Health Provider (Oglala Lakota County)
Diabetes that is not treated to control as well as untreated hypertension contribute to chronic kidney disease in the population. It seems that most patients are not aware of the implications of not controlling their diabetes and or high blood pressure and assume that they will be okay if they come on an "as needed" basis allowing their medications to run out.. They do not seem to have access to home blood pressure machines but do have access to home glucose testing. – Physician (Oglala Lakota County)
I see many people on hospice who have developed kidney disease due to uncontrolled diabetes. – Other Health Provider (Pennington County)
Due to diabetes. – Community/Business Leader (Pennington County)
I think it's a big problem in our community due to the high rates of diabetes. –Other Health Provider (Oglala Lakota County)
There are many diabetics in the community and many of them have chronic kidney disease. – Other Health Provider (Oglala Lakota County)
Prevalent diabetes in the area. Large population of people predisposed to chronic kidney disease. – Other Health Provider (Pennington County)
There are many people with diabetes related kidney disease in the community. The need for outpatient dialysis greatly outstrips the availability of slots, which means that local residents may/may not have access to dialysis but people from outside our community who may be visiting here do not have access to dialysis services in our community. This is a real problem for an area that relies on tourism as a source of revenue. – Other Health Provider (Pennington County)
COMMUNITY HEALTH NEEDS ASSESSMENT
115
I work with a number of patients with chronic kidney disease, usually this is due to diabetes. – Social Services Provider (Pennington County)
Native American Population
Because I hear about it in the Native American communities. – Community/Business Leader (Pennington County)
Many people in the Native American population have diabetes. Many people progress to Diabetic Nephrology and end up with CKD. – Other Health Provider (Pennington County)
We have a high population of Native Americans, and this population has a high incidence of chronic kidney disease. We do not have enough dialysis chairs in any of our dialysis units on the west side of South Dakota, so any visitors coming to our area for vacation have trouble getting a dialysis chair while they are here. Also there is a huge incidence of non-compliance with those who have chronic kidney disease and these people are frequently re-admitted to the hospital because of non-compliance, missing dialysis. – Other Health Provider (Pennington County)
Significant Native American diabetic poorly controlled population with subsequent diabetic renal disease. – Physician (Pennington County)
Due to diabetes, kidney disease seems to be cropping up more and more. Native Americans seem to be some of the hardest hit. – Community/Business Leader (Pennington County)
Due to the large Native American population. – Other Health Provider (Pennington County)
Substance Abuse
I believe that chronic kidney disease is often closely linked to untreated substance abuse; that is a challenge in our community. In addition, access to dialysis in rural areas and transportation to dialysis centers is also a challenge our community faces. – Other Health Provider (Black Hills Region)
Aging Population
Aging population. – Community/Business Leader (Butte County)
Disease Management
No compliance with treatment plan and/or dialysis. – Other Health Provider (Pennington County)
Nutrition
Vitamin and mineral deficiencies. – Community/Business Leader (Pennington County)

COMMUNITY HEALTH NEEDS ASSESSMENT
116
Potentially Disabling Conditions
About Arthritis, Osteoporosis & Chronic Back Conditions
There are more than 100 types of arthritis. Arthritis commonly occurs with other chronic conditions, such as diabetes, heart
disease, and obesity. Interventions to treat the pain and reduce the functional limitations from arthritis are important, and may
also enable people with these other chronic conditions to be more physically active. Arthritis affects 1 in 5 adults and
continues to be the most common cause of disability. It costs more than $128 billion per year. All of the human and economic
costs are projected to increase over time as the population ages. There are interventions that can reduce arthritis pain and
functional limitations, but they remain underused. These include: increased physical activity; self-management education; and
weight loss among overweight/obese adults.
Osteoporosis is a disease marked by reduced bone strength leading to an increased risk of fractures (broken bones). In the
United States, an estimated 5.3 million people age 50 years and older have osteoporosis. Most of these people are women,
but about 0.8 million are men. Just over 34 million more people, including 12 million men, have low bone mass, which puts
them at increased risk for developing osteoporosis. Half of all women and as many as 1 in 4 men age 50 years and older will
have an osteoporosis-related fracture in their lifetime.
Chronic back pain is common, costly, and potentially disabling. About 80% of Americans experience low back pain in their
lifetime. It is estimated that each year:
15%-20% of the population develop protracted back pain.
2-8% have chronic back pain (pain that lasts more than 3 months).
3-4% of the population is temporarily disabled due to back pain.
1% of the working-age population is disabled completely and permanently as a result of low back pain.
Americans spend at least $50 billion each year on low back pain. Low back pain is the:
2nd leading cause of lost work time (after the common cold).
3rd most common reason to undergo a surgical procedure.
5th most frequent cause of hospitalization.
Arthritis, osteoporosis, and chronic back conditions all have major effects on quality of life, the ability to work, and basic
activities of daily living.
Healthy People 2020 (www.healthypeople.gov)
Arthritis, Osteoporosis, & Chronic Back Conditions
“Would you please tell me if you have ever suffered from or been diagnosed with arthritis or
rheumatism?” (Reported below among only those age 50+.)
“Would you please tell me if you have ever suffered from or been diagnosed with osteoporosis?”
(Reported below among only those age 50+.)
“Would you please tell me if you have ever suffered from or been diagnosed with sciatica or chronic
back pain?” (Reported below among all adults age 18+.)
See also Activity Limitations in the General Health Status section of this report.

COMMUNITY HEALTH NEEDS ASSESSMENT
117
Prevalence of Arthritis/Rheumatism(Among Adults Age 50 and Older)
Sources: � PRC Community Health Surveys, Professional Research Consultants, Inc. [Item 139]
� 2013 PRC National Health Survey, Professional Research Consultants, Inc.
Notes: � Reflects respondents age 50 and older.
36.0% 37.3%
0%
20%
40%
60%
80%
100%
RCRH US
38.3% 36.0%
2012 2015
RCRH Service Area
Prevalence of Osteoporosis(Among Adults Age 50 and Older)
Healthy People 2020 Target = 5.3% or Lower
Sources: � PRC Community Health Surveys, Professional Research Consultants, Inc. [Item 140]
� 2013 PRC National Health Survey, Professional Research Consultants, Inc.
� US Department of Health and Human Services. Healthy People 2020. December 2010. http://www.healthypeople.gov [Objective AOCBC-10]
Notes: � Reflects respondents age 50 and older.
9.7% 7.9%
2012 2015
7.9%13.5%
0%
20%
40%
60%
80%
100%
RCRH US
RCRH Service Area

COMMUNITY HEALTH NEEDS ASSESSMENT
118
Prevalence of Sciatica/Chronic Back Pain
Sources: � PRC Community Health Surveys, Professional Research Consultants, Inc. [Item 29]
� 2013 PRC National Health Survey, Professional Research Consultants, Inc.
Notes: � Asked of all respondents.
21.8%18.4%
0%
20%
40%
60%
80%
100%
RCRH US
22.5% 21.8%
2012 2015
RCRH Service Area
Key Informant Input: Arthritis, Osteoporosis & Chronic Back Conditions
The following chart outlines key informants’ perceptions of the severity of Arthritis, Osteoporosis & Chronic
Back Conditions as a problem in the community:
Perceptions of Arthritis/Osteoporosis/Back Conditions
as a Problem in the Community(Key Informants, 2015)
Sources: � PRC Online Key Informant Survey, Professional Research Consultants, Inc.
Notes: � Asked of all respondents.
12.5% 45.5% 33.9% 8.2%
Major Problem Moderate Problem Minor Problem No Problem At All
Top Concerns
Among those rating this issue as a “major problem,” reasons frequently related to the following:
Prevalence/Incidence
I believe there are many in the community that suffer with chronic back pain. – Other Health Provider (Pennington County)
Most people in my community are active and have injured their backs through years of use, shoveling, lifting, ranch work. There is an older population in the community and with it comes higher rates of osteoporosis. – Social Services Provider (Pennington County)
There appears to be a lot of patients with pain management problems due to back conditions. – Social Services Provider (Pennington County)
It seems like a lot of people suffer from back pain, although the common denominator usually seems to be overweight, with too much belly fat and strain on the back. – Community/Business Leader (Pennington County)
This is a very common complaint seen in our Radiology Department both as outpatient as well as through the

COMMUNITY HEALTH NEEDS ASSESSMENT
119
emergency department. – Physician (Pennington County)
Many residents come to me and ask about exercises that can help their arthritis or back problems. – Other Health Provider (Pennington County)
Aging Population
The average age of our community is the highest in the state. Older people have more problems with arthritis and osteoporosis. Therefore, there is a need for this kind of care to help improve the quality of life for an aging community. If the local doctors refer someone to a Rheumatologist in Rapid City, it takes a really long time for them to get an initial appointment. – Community/Business Leader (Custer County)
Aging population. – Community/Business Leader (Butte County)
The main age group in Custer County is 60+. Many of these seniors are having problem with their joints and arthritis. – Community/Business Leader (Custer County)
Population has a large number of elderly with arthritic conditions, limiting mobility. – Public Health Representative (Custer County)
The population of the Northern Hills is largely of retirement age. Many people are former ranchers or continue to ranch in their older age. Many back conditions are acquired in farming or ranching accidents, many back conditions are degenerative. Many of these people do not seek medical services due to the long or impossible commutes in winter time. – Public Health Representative (Lawrence County)
Pain Management
Pain management and substance abuse treatment is severely lacking. People have severe pain, but there is not great access to alternative therapy other than narcotics. Addiction is high, drug seeking is high, People are given the medications for a short time, become addicted and then are dismissed from their specialist. Patients have to pay upfront for any pain management specialist service. For a bill of more than a few dollars they will not see the patient and the patients are kicked out onto the street with no support and labeled as addicts. – Physician (Pennington County)
Typically patients are treated with pain medications rather than being referred for physical therapy. Nobody likes dealing with pain medication patients. – Other Health Provider (Pennington County)
Treatment for these issues is taking lightly. Unless you can’t walk, they will not send you to see a specialist- and then it’s only if there is monies available. Motrin is the basic treatment for these issues. – Public Health Representative (Oglala Lakota County)
Obesity and insurance does not pay for alternative treatment such as massage or acupuncture. People develop dependency on pain medication due to having no other choices for treatment for this issue. – Other Health Provider (Pennington County)
Access to Care
Access to multidisciplinary chronic pain treatment is needed in this community. I have worked with the specialty pain clinics for years, providing the mental health services for these patients. There is a great need for increased access, especially in light of the opioid problems nationwide. Physicians are overloading the specialists to avoid opioid prescribing. We need a visible, multidisciplinary pain program in our community to assist both the providers and the patients locked in this struggle. The adjunctive therapies: PT, Psychology, and OT in particular are crucial to healthy adjustment, and improved quality of life for those who suffer from chronic pain. – Other Health Provider (Pennington County)
Minimal services in rheumatology. Patients frequently referred out of state. – Physician (Pennington County)
We have limited healthcare professionals to take care of arthritis, osteoporosis and chronic back conditions, who then turn into chronic pain patients, who then turn into drug seekers. We need more professionals and care managers to help manage this population of patients. – Other Health Provider (Pennington County)
Several individuals have these conditions and are unable to drive the distance to see a specialist. Also, there are a number of individuals who would benefit from weight loss to help with symptom management. – Other Health Provider (Custer County)
Lifestyles
Lifestyle, diet, lack of exercise and education. – Other Health Provider (Oglala Lakota County)

COMMUNITY HEALTH NEEDS ASSESSMENT
120
Several reasons, but physical activity is probably the major problem. – Other Health Provider (Pennington County)
Quality of Life
Nearly every patient we have coming as outpatients to our department have histories of arthritis and/or back problems. This affects people's ability to get out and about, especially in the winter, which can be severe and the steep terrain means they have to navigate many stairs all year round and slippery roads and sidewalks in three of the four seasons. – Other Health Provider (Lawrence County)
Younger Adults
There are more and more younger adults who are struggling with these issues due to work or lack of knowledge. Most people won't go in to be checked until it's chronic. – Community/ Business Leader (Pennington County)
Nutrition
Vitamin deficiencies. – Community/Business Leader (Pennington County)
Vision & Hearing Impairment
Vision Trouble
About Vision
Vision is an essential part of everyday life, influencing how Americans of all ages learn, communicate, work, play, and interact
with the world. Yet millions of Americans live with visual impairment, and many more remain at risk for eye disease and
preventable eye injury.
The eyes are an important, but often overlooked, part of overall health. Despite the preventable nature of some vision
impairments, many people do not receive recommended screenings and exams. A visit to an eye care professional for a
comprehensive dilated eye exam can help to detect common vision problems and eye diseases, including diabetic retinopathy,
glaucoma, cataract, and age-related macular degeneration.
These common vision problems often have no early warning signs. If a problem is detected, an eye care professional can
prescribe corrective eyewear, medicine, or surgery to minimize vision loss and help a person see his or her best.
Healthy vision can help to ensure a healthy and active lifestyle well into a person’s later years. Educating and engaging
families, communities, and the nation is critical to ensuring that people have the information, resources, and tools needed for
good eye health.
Healthy People 2020 (www.healthypeople.gov)

COMMUNITY HEALTH NEEDS ASSESSMENT
121
Hearing Trouble
About Hearing & Other Sensory or Communication Disorders
An impaired ability to communicate with others or maintain good balance can lead many people to feel socially isolated, have
unmet health needs, have limited success in school or on the job. Communication and other sensory processes contribute to
our overall health and well-being. Protecting these processes is critical, particularly for people whose age, race, ethnicity,
gender, occupation, genetic background, or health status places them at increased risk.
Many factors influence the numbers of Americans who are diagnosed and treated for hearing and other sensory or
communication disorders, such a social determinants (social and economic standings, age of diagnosis, cost and stigma of
wearing a hearing aid, and unhealthy lifestyle choices). In addition, biological causes of hearing loss and other sensory or
communication disorders include: genetics; viral or bacterial infections; sensitivity to certain drugs or medications; injury; and
aging.
As the nation’s population ages and survival rates for medically fragile infants and for people with severe injuries and acquired
diseases improve, the prevalence of sensory and communication disorders is expected to rise.
Healthy People 2020 (www.healthypeople.gov)
“Would you please tell me if you have ever suffered from or been diagnosed with blindness or trouble
seeing, even when wearing glasses?”
“Would you please tell me if you have ever suffered from or been diagnosed with deafness or trouble
hearing?”
Note the higher prevalence among older adults (age 65+).
Prevalence of Blindness/Trouble Seeing
Sources: � PRC Community Health Surveys, Professional Research Consultants, Inc. [Item 26]
� Behavioral Risk Factor Surveillance System Survey Data. Atlanta, Georgia. United States Department of Health and Human Services, Centers for Disease Control
and Prevention (CDC): 2013 South Dakota data.
� 2013 PRC National Health Survey, Professional Research Consultants, Inc.
Notes: � Asked of all respondents.
6.4%3.1%
8.5%
0%
20%
40%
60%
80%
100%
RCRH SD US
8.6% 6.4%
2012 2015
RCRH Service Area

COMMUNITY HEALTH NEEDS ASSESSMENT
122
Prevalence of Deafness/Trouble Hearing
Sources: � PRC Community Health Surveys, Professional Research Consultants, Inc. [Item 27]
� 2013 PRC National Health Survey, Professional Research Consultants, Inc.
Notes: � Asked of all respondents.
11.5% 10.3%
0%
20%
40%
60%
80%
100%
RCRH US
16.6%11.5%
2012 2015
RCRH Service Area
Key Informant Input: Vision & Hearing
The following chart outlines key informants’ perceptions of the severity of Vision & Hearing as a problem in the
community:
Perceptions of Hearing and Vision
as a Problem in the Community(Key Informants, 2015)
Sources: � PRC Online Key Informant Survey, Professional Research Consultants, Inc.
Notes: � Asked of all respondents.
8.8% 26.5% 51.0% 13.7%
Major Problem Moderate Problem Minor Problem No Problem At All
Top Concerns
Among those rating this issue as a “major problem,” reasons frequently related to the following:
Access to Care
Access to affordable testing and corrective devices is difficult. – Social Services Provider (Pennington County)
Availability for low income people is at a minimum. – Public Health Representative (Custer County)
Lack of affordable local providers in our area. Transportation is a major issue for many of our local people as is insurance, many fall through the cracks for coverage, making too much for Medicaid but not enough for ACA. – Public Health Representative (Fall River County)
Hearing and vision are often not covered by insurance and many individuals in our community lack any kind of insurance due to cost. Many individuals cannot see or hear properly because they cannot afford the cost. With hearing aids ranging from $3000-$9000 a pair, no individual living in poverty would have the opportunity

COMMUNITY HEALTH NEEDS ASSESSMENT
123
to increase their hearing. Glasses are similar, $75 or more for an eye exam and then the cost of lenses and frames. This makes it very difficult for many to address sight and hearing issues. – Social Services Provider (Pennington County)
General screening and eye glasses can be done, any referral out for any eye institute is waiting list a lot of our diabetics will put off eye exams/treatment once again due to financial/transportation issues. – Public Health Representative (Oglala Lakota County)
We have to have doctors come from Denver and outside sources for many eye diseases. – Community/Business Leader (Pennington County)
I meet with a variety of adults that have vision issues but do not have eye glasses, cannot afford to get glasses. – Social Services Provider (Pennington County)
Aging Population
Simply put, we have a very aged population. – Physician (Lawrence County)
Aging population. Hearing seems to be more of an untreated problem than vision. Many need hearing aids, but can't afford them. There doesn't seem to be any programs to help with this issue. I have a co-worker who can't hear, and it does affect her job performance. Yet, she can't afford hearing aids. Many of our aging patrons have hearing problems. – Community/Business Leader (Custer County)
These are common problems with the elderly. – Community/Business Leader (Custer County)
Due to our large population of the aging client, I believe hearing and vision conditions are a major problem. Due to the rural communities who do not seek medical services often enough, I believe this is a major problem. – Public Health Representative (Lawrence County)
Aging population. – Community/Business Leader (Butte County)
Health Education
Education and getting adequate eye care is a concern, especially for children. – Community/ Business Leader (Pennington County)
Prevalence/Incidence
Many individuals have readers and or magnifying contraption, or suffer from Macular Degeneration. Some have Cataract surgery to help improve their eyesight. Many individuals have hearing aids or suffer from hearing loss and are not shy to tell you to speak up. – Other Health Provider (Pennington County)
Comorbidities
Vision loss due to diabetes. – Other Health Provider (Pennington County)

COMMUNITY HEALTH NEEDS ASSESSMENT
124
Infectious Disease
About Immunization & Infectious Diseases
The increase in life expectancy during the 20th century is largely due to improvements in child survival; this increase is
associated with reductions in infectious disease mortality, due largely to immunization. However, infectious diseases remain a
major cause of illness, disability, and death. Immunization recommendations in the United States currently target 17 vaccine-
preventable diseases across the lifespan.
People in the US continue to get diseases that are vaccine-preventable. Viral hepatitis, influenza, and tuberculosis (TB) remain
among the leading causes of illness and death across the nation and account for substantial spending on the related
consequences of infection.
The infectious disease public health infrastructure, which carries out disease surveillance at the national, state, and local
levels, is an essential tool in the fight against newly emerging and re-emerging infectious diseases. Other important defenses
against infectious diseases include:
Proper use of vaccines
Antibiotics
Screening and testing guidelines
Scientific improvements in the diagnosis of infectious disease-related health concerns
Vaccines are among the most cost-effective clinical preventive services and are a core component of any preventive services
package. Childhood immunization programs provide a very high return on investment. For example, for each birth cohort
vaccinated with the routine immunization schedule, society:
Saves 33,000 lives.
Prevents 14 million cases of disease.
Reduces direct healthcare costs by $9.9 billion.
Saves $33.4 billion in indirect costs.
Healthy People 2020 (www.healthypeople.gov)
Influenza & Pneumonia Vaccination
About Influenza & Pneumonia
Acute respiratory infections, including pneumonia and influenza, are the 8th leading cause of death in the nation, accounting
for 56,000 deaths annually. Pneumonia mortality in children fell by 97% in the last century, but respiratory infectious diseases
continue to be leading causes of pediatric hospitalization and outpatient visits in the US. On average, influenza leads to more
than 200,000 hospitalizations and 36,000 deaths each year. The 2009 H1N1 influenza pandemic caused an estimated 270,000
hospitalizations and 12,270 deaths (1,270 of which were of people younger than age 18) between April 2009 and March 2010.
Healthy People 2020 (www.healthypeople.gov)
Flu Vaccinations
“There are two ways to get the seasonal flu vaccine, one is a shot in the arm and the other is a spray,
mist, or drop in the nose called FluMist®. During the past 12 months, have you had either a seasonal
flu shot or a seasonal flu vaccine that was sprayed in your nose?”
“A pneumonia shot or pneumococcal vaccine is usually given only once or twice in a person's lifetime
and is different from the seasonal flu shot. Have you ever had a pneumonia shot?”
Chart columns below show these findings among those age 65+. Percentages for “high-risk” adults age 18-64
in the RCRH Service Area are also shown; here, “high-risk” includes adults who report having been diagnosed
with heart disease, diabetes or respiratory disease.)

COMMUNITY HEALTH NEEDS ASSESSMENT
125
Note also the Healthy People 2020 targets.
Older Adults: Have Had a Flu Vaccination in the Past Year(Among Adults Age 65+)
Healthy People 2020 Target = 70.0% or Higher
Sources: � PRC Community Health Surveys, Professional Research Consultants, Inc. [Item 141]
� 2013 PRC National Health Survey, Professional Research Consultants, Inc.
� Behavioral Risk Factor Surveillance System Survey Data. Atlanta, Georgia. United States Department of Health and Human Services, Centers for Disease Control
and Prevention (CDC): 2013 South Dakota data.
� US Department of Health and Human Services. Healthy People 2020. December 2010. http://www.healthypeople.gov [Objective IID-12.12]
Notes: � Reflects respondents 65 and older.
� Includes FluMist as a form of vaccination.
74.5%
48.4%
2012 2015
48.4%
71.3%
57.5%
0%
20%
40%
60%
80%
100%
RCRH SD US
RCRH Service Area
Older Adults: Have Ever Had a Pneumonia Vaccine(Among Adults Age 65+)
Healthy People 2020 Target = 90.0% or Higher
Sources: � PRC Community Health Surveys, Professional Research Consultants, Inc. [Item 143]
� 2013 PRC National Health Survey, Professional Research Consultants, Inc.
� Behavioral Risk Factor Surveillance System Survey Data. Atlanta, Georgia. United States Department of Health and Human Services, Centers for Disease Control
and Prevention (CDC): 2013 South Dakota data.
� US Department of Health and Human Services. Healthy People 2020. December 2010. http://www.healthypeople.gov [Objective IID-13.1]
Notes: � Reflects respondents 65 and older.
67.4%
78.9%
2012 2015
78.9%
65.4%68.4%
0%
20%
40%
60%
80%
100%
RCRH SD US
RCRH Service Area
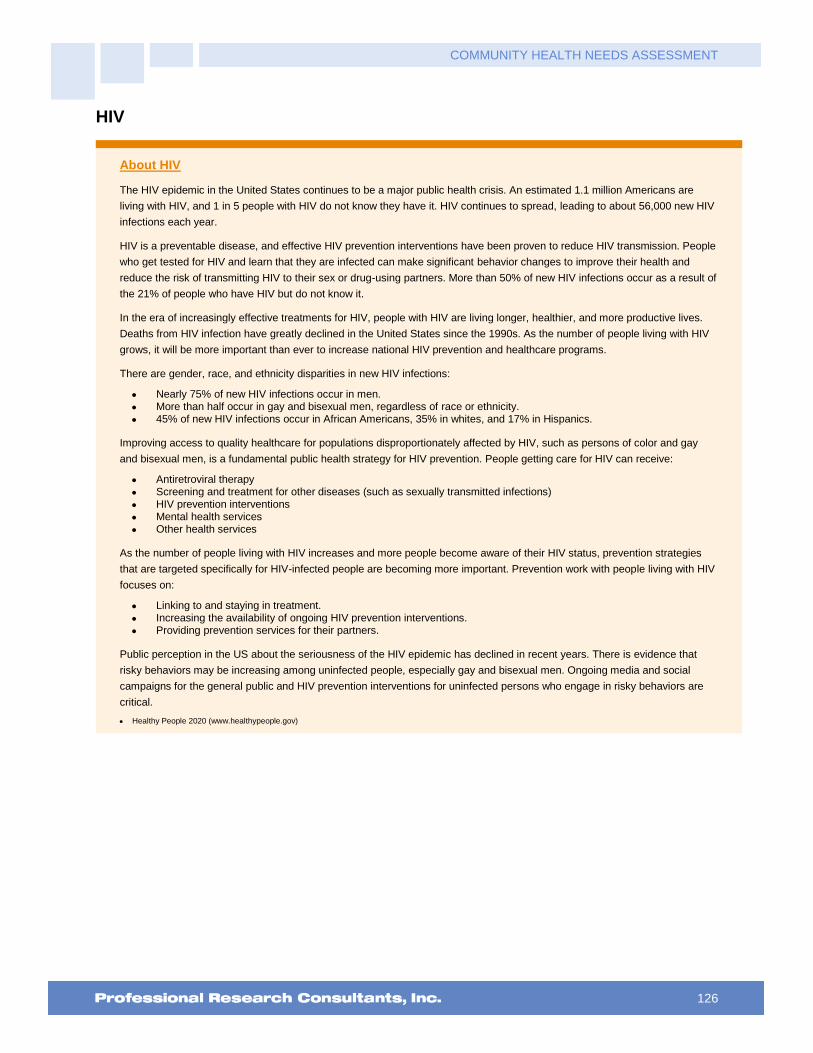
COMMUNITY HEALTH NEEDS ASSESSMENT
126
HIV
About HIV
The HIV epidemic in the United States continues to be a major public health crisis. An estimated 1.1 million Americans are
living with HIV, and 1 in 5 people with HIV do not know they have it. HIV continues to spread, leading to about 56,000 new HIV
infections each year.
HIV is a preventable disease, and effective HIV prevention interventions have been proven to reduce HIV transmission. People
who get tested for HIV and learn that they are infected can make significant behavior changes to improve their health and
reduce the risk of transmitting HIV to their sex or drug-using partners. More than 50% of new HIV infections occur as a result of
the 21% of people who have HIV but do not know it.
In the era of increasingly effective treatments for HIV, people with HIV are living longer, healthier, and more productive lives.
Deaths from HIV infection have greatly declined in the United States since the 1990s. As the number of people living with HIV
grows, it will be more important than ever to increase national HIV prevention and healthcare programs.
There are gender, race, and ethnicity disparities in new HIV infections:
Nearly 75% of new HIV infections occur in men.
More than half occur in gay and bisexual men, regardless of race or ethnicity.
45% of new HIV infections occur in African Americans, 35% in whites, and 17% in Hispanics.
Improving access to quality healthcare for populations disproportionately affected by HIV, such as persons of color and gay
and bisexual men, is a fundamental public health strategy for HIV prevention. People getting care for HIV can receive:
Antiretroviral therapy
Screening and treatment for other diseases (such as sexually transmitted infections)
HIV prevention interventions
Mental health services
Other health services
As the number of people living with HIV increases and more people become aware of their HIV status, prevention strategies
that are targeted specifically for HIV-infected people are becoming more important. Prevention work with people living with HIV
focuses on:
Linking to and staying in treatment.
Increasing the availability of ongoing HIV prevention interventions.
Providing prevention services for their partners.
Public perception in the US about the seriousness of the HIV epidemic has declined in recent years. There is evidence that
risky behaviors may be increasing among uninfected people, especially gay and bisexual men. Ongoing media and social
campaigns for the general public and HIV prevention interventions for uninfected persons who engage in risky behaviors are
critical.
Healthy People 2020 (www.healthypeople.gov)

COMMUNITY HEALTH NEEDS ASSESSMENT
127
HIV/AIDS Deaths
The following chart outlines age-adjusted mortality rates for the area in comparison with state and national
rates.
HIV/AIDS: Age-Adjusted Mortality(2004-2013 Annual Average Deaths per 100,000 Population)
Healthy People 2020 Target = 3.3 or Lower
Sources: � CDC WONDER Online Query System. Centers for Disease Control and Prevention, Epidemiology Program Office, Division of Public Health Surveillance and
Informatics. Data extracted November 2015.
� US Department of Health and Human Services. Healthy People 2020. December 2010. http://www.healthypeople.gov [Objective HIV-12]
Notes: � Deaths are coded using the Tenth Revision of the International Statistical Classification of Diseases and Related Health Problems (ICD-10).
� Rates are per 100,000 population, age-adjusted to the 2000 US Standard Population.
1.7
0.8
3.2
0
1
3
4
RCRH SD US
HIV Testing
“Not counting tests you may have had when donating or giving blood, when was the last time you were
tested for HIV?” (Reported below only among adults age 18 to 44.)
Tested for HIV in the Past Year(Among Adults Age 18-44)
Sources: � PRC Community Health Surveys, Professional Research Consultants, Inc. [Item 145]
� 2013 PRC National Health Survey, Professional Research Consultants, Inc.
Notes: � Reflects respondents age 18 to 44.
24.8%19.3%
0%
20%
40%
60%
80%
100%
RCRH US
RCRH Service Area
18.5%
24.8%
2012 2015

COMMUNITY HEALTH NEEDS ASSESSMENT
128
Key Informant Input: HIV
The following chart outlines key informants’ perceptions of the severity of HIV as a problem in the community:
Perceptions of HIV/AIDS
as a Problem in the Community(Key Informants, 2015)
Sources: � PRC Online Key Informant Survey, Professional Research Consultants, Inc.
Notes: � Asked of all respondents.
6.5% 21.1% 57.5% 15.0%
Major Problem Moderate Problem Minor Problem No Problem At All
Top Concerns
Among those rating this issue as a “major problem,” reasons frequently related to the following:
Stigma
I think HIV/AIDS is still a major taboo topic in our community. People don't exactly feel comfortable talking about HIV and AIDS, which doesn't help the problem. I think we need to get more people talking about HIV and AIDS. –Other Health Provider (Oglala Lakota County)
It’s on the rise, treatment is postpones due to stigma, financial and transportation to get treatment. – Public Health Representative (Oglala Lakota County)
Shaming. Often individuals with this diagnosis will hide it from the community and proceed to engage in sexual relationships with others without the consent of the partner. – Other Health Provider (Oglala Lakota County)
As with family planning, this conservative community does not openly speak of HIV/AIDS which is so generally associated with the gay population. Our community is changing for the better, though, with the growth of a strong and supportive LGBT community. – Social Services Provider (Pennington County)
Lack of Providers
Family Medicine Residency has a monthly clinic with infectious disease healthcare professionals, to help manage the care of the HIV/AIDS patients. However, it is once a month and a few slots available. This is a big utilization problem and volunteers of America help this group out a lot, but it is never enough. – Other Health Provider (Pennington County)
Lack of access to HIV healthcare providers. Lack of HIV/AIDS knowledge among providers. Newly diagnosed HIV patients continue to be told inaccurate information at the time of diagnosis. Lack of knowledge about the Ryan White Program, therefore providers do not refer to the program for help, guidance and information. We now have a wonderful ID provider but before he began his practice here we lacked doctors who specialize in HIV management. – Other Health Provider (Pennington County)
Lack of Resources
I think that there are limited testing sites and most patients are managed at Community Health Center. I am not sure of any resources for testing or treatment in more rural areas. I also believe that HCPs in this area have a low index of suspicion for this diagnosis and that we may be missing this diagnosis. – Other Health Provider (Pennington County)
No resources for these people. – Other Health Provider (Lawrence County)
Family Planning
This goes back to family planning and safe sex. We need to promote safe sex practices in people of all ages.
COMMUNITY HEALTH NEEDS ASSESSMENT
129
I previously worked with a program working with individuals with HIV and AIDS and there are too many with this diagnosis. When the disease itself is almost completely preventable this should be less of a concern. The medications are expensive and many of those living in poverty struggle with this without the help of various programs. – Social Services Provider (Pennington County)

COMMUNITY HEALTH NEEDS ASSESSMENT
130
Sexually Transmitted Diseases
About Sexually Transmitted Diseases
STDs refer to more than 25 infectious organisms that are transmitted primarily through sexual activity. Despite their burdens,
costs, and complications, and the fact that they are largely preventable, STDs remain a significant public health problem in the
United States. This problem is largely unrecognized by the public, policymakers, and health care professionals. STDs cause
many harmful, often irreversible, and costly clinical complications, such as: reproductive health problems; fetal and perinatal
health problems; cancer; and facilitation of the sexual transmission of HIV infection.
Because many cases of STDs go undiagnosed—and some common viral infections, such as human papillomavirus (HPV) and
genital herpes, are not reported to CDC at all—the reported cases of chlamydia, gonorrhea, and syphilis represent only a
fraction of the true burden of STDs in the US. Untreated STDs can lead to serious long-term health consequences, especially
for adolescent girls and young women. Several factors contribute to the spread of STDs.
Biological Factors. STDs are acquired during unprotected sex with an infected partner. Biological factors that affect the
spread of STDs include:
Asymptomatic nature of STDs. The majority of STDs either do not produce any symptoms or signs, or they produce symptoms so mild that they are unnoticed; consequently, many infected persons do not know that they need medical care.
Gender disparities. Women suffer more frequent and more serious STD complications than men do. Among the most serious STD complications are pelvic inflammatory disease, ectopic pregnancy (pregnancy outside of the uterus), infertility, and chronic pelvic pain.
Age disparities. Compared to older adults, sexually active adolescents ages 15 to 19 and young adults ages 20 to 24 are at higher risk for getting STDs.
Lag time between infection and complications. Often, a long interval, sometimes years, occurs between acquiring an STD and recognizing a clinically significant health problem.
Social, Economic and Behavioral Factors. The spread of STDs is directly affected by social, economic, and behavioral
factors. Such factors may cause serious obstacles to STD prevention due to their influence on social and sexual networks,
access to and provision of care, willingness to seek care, and social norms regarding sex and sexuality. Among certain
vulnerable populations, historical experience with segregation and discrimination exacerbates these factors. Social, economic,
and behavioral factors that affect the spread of STDs include: racial and ethnic disparities; poverty and marginalization; access
to healthcare; substance abuse; sexuality and secrecy (stigma and discomfort discussing sex); and sexual networks (persons
“linked” by sequential or concurrent sexual partners).
Healthy People 2020 (www.healthypeople.gov)
Chlamydia & Gonorrhea
Chlamydia. Chlamydia is the most commonly reported STD in the United States; most people who have
chlamydia don’t know it since the disease often has no symptoms.
Gonorrhea. Anyone who is sexually active can get gonorrhea. Gonorrhea can be cured with the right
medication; left untreated, however, gonorrhea can cause serious health problems in both women and men.
The following charts outline local incidence for these STDs.

COMMUNITY HEALTH NEEDS ASSESSMENT
131
Chlamydia & Gonorrhea Incidence(Incidence Rate per 100,000 Population, 2012)
Sources: � Centers for Disease Control and Prevention, National Center for HIV/AIDS, Viral Hepatitis, STD, and TB Prevention: 2011.
� Retrieved November 2015 from Community Commons at http://www.chna.org.
Notes: � This indicator is relevant because it is a measure of poor health status and indicates the prevalence of unsafe sex practices.
664.0
165.5
476.2
85.8
456.7
107.5
Chlamydia Gonorrhea
0
100
200
300
400
500
600
700
800RCRH SD US
Hepatitis B Vaccination
“To be vaccinated against hepatitis B, a series of three shots must be administered, usually at least
one month between shots. Have you completed a hepatitis B vaccination series?”
Have Completed the Hepatitis B Vaccination Series
Sources: � PRC Community Health Surveys, Professional Research Consultants, Inc. [Item 70]
� 2013 PRC National Health Survey, Professional Research Consultants, Inc.
Notes: � Asked of all respondents.
� Includes a series of three shots, usually administered at least one month between shots
44.9% 44.7%
0%
20%
40%
60%
80%
100%
RCRH US
40.6%44.9%
2012 2015
RCRH Service Area

COMMUNITY HEALTH NEEDS ASSESSMENT
132
Safe Sexual Practices
Sexual Partners
“During the past 12 months, with how many people have you had sexual intercourse?”
“Was a condom used the last time you had sexual intercourse?”
Each of these is reported below only among adults who are unmarried and between the ages of 18 and 64.
Had Three or More Sexual Partners in the Past Year(Among Unmarried Adults Age 18-64)
Sources: � PRC Community Health Surveys, Professional Research Consultants, Inc. [Item 86]
� 2013 PRC National Health Survey, Professional Research Consultants, Inc.
Notes: � Asked of all unmarried respondents under the age of 65.
5.5%11.7%
0%
20%
40%
60%
80%
100%
RCRH US
7.9% 5.5%
2012 2015
RCRH Service Area
Condom Was Used During Last Sexual Intercourse(Among Unmarried Adults Age 18-64)
Sources: � PRC Community Health Surveys, Professional Research Consultants, Inc. [Item 87]
� 2013 PRC National Health Survey, Professional Research Consultants, Inc.
Notes: � Asked of all unmarried respondents under the age of 65.
24.0%
33.6%
0%
20%
40%
60%
80%
100%
RCRH US
41.4%
24.0%
2012 2015
RCRH Service Area

COMMUNITY HEALTH NEEDS ASSESSMENT
133
Key Informant Input: Sexually Transmitted Diseases
The following chart outlines key informants’ perceptions of the severity of Sexually Transmitted Diseases as a
problem in the community:
Perceptions of Sexually Transmitted Diseases
as a Problem in the Community(Key Informants, 2015)
Sources: � PRC Online Key Informant Survey, Professional Research Consultants, Inc.
Notes: � Asked of all respondents.
16.1% 34.3% 40.7% 8.9%
Major Problem Moderate Problem Minor Problem No Problem At All
Top Concerns
Among those rating this issue as a “major problem,” reasons frequently related to the following:
Prevalence/Incidence
Recently the local paper stated the incidence of STD's had increased. Stats from the health department show an increase in STDs. – Other Health Provider (Pennington County)
Increase in STD's in our community. Lack of solid sex education program in our public schools. Lack of community initiative to let individuals know where to get tested, information and condoms. – Other Health Provider (Pennington County)
State Department of Health data shows an increase in STDs in Western South Dakota. – Community/Business Leader (Pennington County)
There is a rise in STDs in the area. Education on how to protect yourself and others in contacting STD's and clinic availability to treat the STD. Most patients are afraid to admit they have it and spread it to a lot more people. – Other Health Provider (Pennington County)
Statistics indicate an increase overall. – Other Health Provider (Pennington County)
Western South Dakota made national news for the rates of Gonorrhea. – Social Services Provider (Pennington County)
Our facility has seen an increase in the number of chlamydia cases. – Other Health Provider (Lawrence County)
There is a high rate of chlamydia in the region, as well as the comeback of syphilis. Many clients who get these treatable infections don't worry about the risks and possible re-infection. – Public Health Representative (Pennington County)
Pennington county rates of Chlamydia and gonorrhea have more than doubled in the last 10 years and appear to be continuing to rise. – Other Health Provider (Pennington County)
There is a rise in the number of sexually transmitted diseases in South Dakota over the past two years. – Other Health Provider (Pennington County)
We have too high of rates of gonorrhea, syphilis, and other STDs, higher than a population our size should have. – Other Health Provider (Pennington County)
I just read about this in the newspaper. Based on the story, I selected this as an issue in our community. – Other Health Provider (Pennington County)
High rate of STD's. – Community/Business Leader (Pennington County)

COMMUNITY HEALTH NEEDS ASSESSMENT
134
The rate of STDs is on the rise in South Dakota. – Other Health Provider (Pennington County)
STDs have been on the rise continually in Pennington County, both for adults and youth, but significantly for youth over the past few years. – Social Services Provider (Pennington County)
Unprotected Sex
Similar to HIV/AIDS, we need to promote safe sex practices. – Social Services Provider (Pennington County)
Multiple partners, not seeking treatment or both partners not seeking treatment, lack of education or awareness. – Social Services Provider (Pennington County)
Possibly because people don't think it will happen to them or lack of protection during sex. People not seeking healthcare. – Other Health Provider (Pennington County)
Unprotected sex. – Other Health Provider (Pennington County)
Sex first, ask questions later. No training of abstinence, prophylactic use. Politicization of birth control education in schools and a lack of influence from parents. – Community/Business Leader (Pennington County)
Apparently not using condoms and having multiple partners. – Community/Business Leader (Pennington County)
Lack of Education
Lack of education, myths, culture, lack of willingness to discuss the issues. Schools not allowing education or having programs for education. – Public Health Representative (Fall River County)
Misunderstanding of how STI's can be transmitted. Barriers to obtaining and using condoms. Finances, decreased virility. – Other Health Provider (Oglala Lakota County)
Lack of sex education in schools. – Community/Business Leader (Lawrence County)
Compliance, lack of education. – Public Health Representative (Oglala Lakota County)
Lack of knowledge on the topic as a whole. I think it's also seen with a stigma, so people aren't as willing to get information on STI's. I think we can increase opportunities in healthcare to increase screening rates. –Other Health Provider (Oglala Lakota County)
Lack of knowledge about STD's and how they are spread from person to person. – Other Health Provider (Oglala Lakota County)
Young Adults
Young people aren't always as careful as they should be. – Community/Business Leader (Butte County)
College students, poor incomes, not enough education in the community. – Other Health Provider (Lawrence County)
Lack of Resources
There is a lack of resources to address the issue. Many clients with this problem do not have symptoms and it is very difficult to convince them to seek the appropriate care for their exposure to these infections. – Public Health Representative (Pennington County)
Immunization & Infectious Diseases
Key Informant Input: Immunization & Infectious Diseases
The following chart outlines key informants’ perceptions of the severity of Immunization & Infectious Diseases
as a problem in the community:

COMMUNITY HEALTH NEEDS ASSESSMENT
135
Perceptions of Immunization and Infectious Diseases
as a Problem in the Community(Key Informants, 2015)
Sources: � PRC Online Key Informant Survey, Professional Research Consultants, Inc.
Notes: � Asked of all respondents.
8.4% 41.2% 40.8% 9.5%
Major Problem Moderate Problem Minor Problem No Problem At All
Top Concerns
Among those rating this issue as a “major problem,” reasons frequently related to the following:
Lack of Education
Lack of education. Escalation of immunization myths on social media. Lack of knowledge about infectious diseases on an individual level. – Other Health Provider (Pennington County)
Lack of education, schools not requiring completed immunizations for school attendance. Parents choosing not to vaccinate, lack of education. – Public Health Representative (Fall River County)
Lack of education and poverty. – Social Services Provider (Pennington County)
Lack of follow-through with well-child checks, refusal of immunizations, irrational beliefs about immunizations, lack of transportation or understanding. – Social Services Provider (Pennington County)
There is a large college age population in Spearfish with BHSU. Infection diseases such as STIs tend to be higher with this age group. There is a major lack of sexual education in the middle and high schools in our community. In the last two years we've also had outbreaks of pertussis. This is due to more parents opting out of routine vaccinations for their school-aged children and for themselves. – Public Health Representative (Lawrence County)
Contributing Factors
Transportation. No access to transportation to receive immunizations. Also lack of trust because of the historical trauma that exist between native people receiving immunizations from their healthcare providers that often times weren't effective in treating their aliments. – Other Health Provider (Oglala Lakota County)
Rapid City has a 16% poverty rate. Among those individuals many of them are unable to afford insurance, medical care, or routine checkups. Many of those do not go to the doctor until it is an emergency and then they utilize the Emergency Room. – Social Services Provider (Pennington County)
Uncontrolled diabetes, lack of running water and waste disposal often lacking in many homes. Many people living in small spaces. – Other Health Provider (Oglala Lakota County)
Lack of Resources
Not enough immunization clinics. Public Health will go into the community and give these at local clinics, rarely in the home. – Public Health Representative (Oglala Lakota County)
Difficulty in getting to immunization sites. – Community/Business Leader (Butte County)
From my understanding we have a high volume of hepatitis C and other infectious diseases that need to be treated, but we do not have the capacity to treat them. – Other Health Provider (Pennington County)
Low Immunization Rates
Immunization rates could improve, both for adults and Pediatric patients. Patients may think they've done a lot of research regarding vaccines, but they don't realize it's of poor quality. Not enough encouragement and education for adult immunization. – Other Health Provider (Pennington County)
COMMUNITY HEALTH NEEDS ASSESSMENT
136
Mostly due to number or rate of multi-drug resistant Infections in the community. Immunization rates in some communities are low. Recent outbreak of pertussis in Lawrence County last year. – Other Health Provider (Pennington County)
Kids are coming to school without the proper immunizations. – Community/Business Leader (Pennington County)
Prevalence/Incidence
We have a high incidence of infectious diseases due to a high population of noncompliant people from our area and other areas who transfer patients to our community hospital. We do have infectious disease specialists at our hospital but their acute care case load is very heavy and none of them follow patients on an outpatient basis. Medicare does not cover CADD pumps for patients who need IV antibiotics as an outpatient; and we also have a high population of uninsured patients. Patients take oral antibiotics for a few days until they feel better and then they quit, or they may not be able to afford the antibiotic at all. – Other Health Provider (Pennington County)

COMMUNITY HEALTH NEEDS ASSESSMENT
137
Births
Prenatal Care
About Infant & Child Health
Improving the well-being of mothers, infants, and children is an important public health goal for the US. Their well-being
determines the health of the next generation and can help predict future public health challenges for families, communities, and
the healthcare system. The risk of maternal and infant mortality and pregnancy-related complications can be reduced by
increasing access to quality preconception (before pregnancy) and inter-conception (between pregnancies) care. Moreover,
healthy birth outcomes and early identification and treatment of health conditions among infants can prevent death or disability
and enable children to reach their full potential. Many factors can affect pregnancy and childbirth, including pre-conception
health status, age, access to appropriate healthcare, and poverty.
Infant and child health are similarly influenced by socio-demographic factors, such as family income, but are also linked to the
physical and mental health of parents and caregivers. There are racial and ethnic disparities in mortality and morbidity for
mothers and children, particularly for African Americans. These differences are likely the result of many factors, including social
determinants (such as racial and ethnic disparities in infant mortality; family income; educational attainment among household
members; and health insurance coverage) and physical determinants (i.e., the health, nutrition, and behaviors of the mother
during pregnancy and early childhood).
Healthy People 2020 (www.healthypeople.gov)
Birth Outcomes & Risks
Low-Weight Births
Low birthweight babies, those who weigh less than 2,500 grams (5 pounds, 8 ounces) at birth, are much more
prone to illness and neonatal death than are babies of normal birthweight. Largely a result of receiving poor or
inadequate prenatal care, many low-weight births and the consequent health problems are preventable. Births
of low-weight infants are described below.
Note the Healthy People 2020 target.

COMMUNITY HEALTH NEEDS ASSESSMENT
138
115
PRC Community Health Needs AssessmentRCRH Service Area
Low-Weight Births(Percent of Live Births, 2006-2012)
Healthy People 2020 Target = 7.8% or Lower
Sources: � Centers for Disease Control and Prevention, National Vital Statistics System: 2006-12. Accessed using CDC WONDER.
� Retrieved November 2015 from Community Commons at http://www.chna.org.
� US Department of Health and Human Services. Healthy People 2020. December 2010. http://www.healthypeople.gov [Objective MICH-8.1]
Note: � This indicator reports the percentage of total births that are low birth weight (Under 2500g). This indicator is relevant because low birth weight infants are at high
risk for health problems. This indicator can also highlight the existence of health disparities.
7.1% 6.5% 8.2%
0%
20%
40%
60%
80%
100%
RCRH SD US
Infant Mortality
Infant mortality rates reflect deaths of children less than one year old per 1,000 live births. These rates are
outlined in the following chart.
Note the Healthy People 2020 target.
Infant Mortality Rate(Annual Average Infant Deaths per 1,000 Live Births)
Healthy People 2020 Target = 6.0 or Lower
Sources: � CDC WONDER Online Query System. Centers for Disease Control and Prevention, Epidemiology Program Office, Division of Public Health Surveillance and
Informatics. Data extracted November 2015.
� Centers for Disease Control and Prevention, National Center for Health Statistics.
� US Department of Health and Human Services. Healthy People 2020. December 2010. http://www.healthypeople.gov [Objective MICH-1.3]
Notes: � Rates are three-year averages of deaths of children under 1 year old per 1,000 live births.
2004-2006 2005-2007 2006-2008 2007-2009 2008-2010 2009-2011 2010-2012 2011-2013
RCRH 9.2 8.1 8.3 8.2 9.7 8.2 9.1 7.5
SD 7.7 7.1 7.5 7.4 7.5 6.7 7.4 7.3
US 7.1 7.1 7.0 6.8 6.5 6.3 6.1 6.0
0
2
4
6
8
10
12

COMMUNITY HEALTH NEEDS ASSESSMENT
139
Key Informant Input: Infant & Child Health
The following chart outlines key informants’ perceptions of the severity of Infant & Child Health as a problem in
the community:
Perceptions of Infant and Child Health
as a Problem in the Community(Key Informants, 2015)
Sources: � PRC Online Key Informant Survey, Professional Research Consultants, Inc.
Notes: � Asked of all respondents.
15.7% 39.0% 33.3% 12.0%
Major Problem Moderate Problem Minor Problem No Problem At All
Top Concerns
Among those rating this issue as a “major problem,” reasons frequently related to the following:
Access to Care
People without insurance cannot afford to see a doctor. – Other Health Provider (Meade County)
For those living in poverty care does not always occur to the degree in which it should due to transportation issues, crisis situations, which prevent someone getting to an appointment and sometimes the cost. This area does provide more resources than some of the others but unfortunately many children get missed until they are closer to school age. – Social Services Provider (Pennington County)
Lack of parent seeking medical care/dental care, poor follow through with appointments due to many barriers including transportation, caring for other children. – Social Services Provider (Pennington County)
The absence of good maternal and infant care is a problem. There is no birthing center in the community. The hospital is the only option, and it is not warm or comfortable. A variety of birthing options should be offered to mothers along with holistic therapies to ease the pain: massage, aromatherapy, breathing and movement. – Social Services Provider (Pennington County)
Because there are so many women having babies, it places a greater strain on the pediatric department at RCRH as many of the babies don't have a primary care provider in the community. Therefore parents use the Emergency Department as a clinic. Also, because most of the children are on South Dakota Medicaid, there is limited access to pediatricians because of the clinic's need to maintain financial stability and have to limit the amount of MCD patients they care for. WIC is very much available, but their resources are stretched. – Other Health Provider (Pennington County)
Again, I feel access is there but it is becoming increasingly difficult to obtain timely appointments because our local physicians in Custer are so busy. Walk-in clinic wait times are often several hours. – Other Health Provider (Custer County)
We currently do not have any other resources other than BH Peds and that is an issue. The appointments are backed up, like all the other places, and it's tough to get them in there. Taking them to the Emergency Room is pricey but sometimes the only option we have. Parents need more resources for this issue to be fixed. – Social Services Provider (Pennington County)
Access to care on the reservations. – Other Health Provider (Pennington County)
Cost keeps parents wondering if they can justify a visit. Most parents make sound assessments of their child and know when a visit is needed. I hear, let's wait to see if it goes away too often. – Other Health Provider (Pennington County)

COMMUNITY HEALTH NEEDS ASSESSMENT
140
Infant Mortality
There are many families in Rapid City for whom parenting is a struggle. There are not enough parent support resources in the area. Also, South Dakota continues to have a high infant mortality rate. Many families struggle to accept the safe sleeper recommendations. – Public Health Representative (Pennington County)
Infant mortality and low birth weight babies continue to be a concern. – Other Health Provider (Pennington County)
There is access to care, but South Dakota has a high infant mortality rate, mostly due to prenatal care. – Other Health Provider (Pennington County)
High infant/toddler mortality, may be as much a social problem as a medical problem. – Community/Business Leader (Oglala Lakota County)
Infant mortality is high for this area. – Community/Business Leader (Pennington County)
We have very high infant mortality rates in South Dakota. – Community/Business Leader (Pennington County)
Co-occurrences
We have a high rate of child abuse, neglect, substance abuse by all ages, domestic violence, and youth suicide in our area. These things are tied together and can often be traced back to an inability to detect signs of abuse and neglect earlier in a child's life. We lack providers in our area who have a specialty in signs and indications of child abuse, and we don't have an established protocol to get these kids in to see specialists when we do have concerns. For the rate of child maltreatment we have in western SD we must have more specialization in this area. It is proven in research that 30-40% of child death cases and serious injuries due to abuse, involved kids who saw a medical provider at some point in their life due to injuries caused be abuse and these injuries were not detected or were not tied to suspicion of abuse. If we focus more on early detection through specialized medical providers and can provide services to families, we will prevent many future problems. – Social Services Provider (Pennington County)
Prenatal concerns and substance abuse. Ongoing healthcare and education. – Community/ Business Leader (Pennington County)
Immunization, abuse, lack of medical care, lack of parenting skills, lack of parenting resources, parental substance abuse. – Other Health Provider (Pennington County)
Lack of Education
Again, the root of this issue goes back to knowledge, access and preventative education. Parents must have the resources available to them to keep their children healthy. This means transportation to doctor visits, education in prenatal care, as well as education in the government benefits that may be afforded to them to help care for their children. Particularly high-risk families need individual attention and substantial follow up to keep their children healthy and on track. Child health in this area is substantially impacted by lifestyle choices: many parents smoke, do not know how to prepare healthy meals for their families, and are working irregular hours at multiple part time jobs to make ends meet. They are so rarely home, that meals and exercise become the responsibility of older children, who are in no way equipped to raise their younger siblings. Education and access are imperative to solving this problem. – Community/Business Leader (Lawrence County)
Lack of education and resources, poverty, abuse and neglect. – Social Services Provider (Pennington County)
Lack of education for parenting, role modeling healthy behavior and choices. – Other Health Provider (Oglala Lakota County)
No community education to stress the importance of well-baby checks, immunizations. Nursing in the clinics can do some but there is really no time to do good education. – Public Health Representative (Oglala Lakota County)
Lack of Providers
No pediatricians as providers- or a limited number of them. – Other Health Provider (Oglala Lakota County)
Prenatal care for mothers under the age of 18 is only available in Rapid City, not at Pine Ridge or Sioux San. We need more Ob/Gyns. – Other Health Provider (Pennington County)

COMMUNITY HEALTH NEEDS ASSESSMENT
141
We have very few, if any, specialty physicians for child diseases. – Other Health Provider (Pennington County)
Obesity
Obesity-elevated BMI in all population ages. Our children are overweight and many eat an unhealthy diet. Limited resources to activity or programs in the community. Elevated weight is a potential risk factor in the future. – Other Health Provider (Meade County)
Childhood obesity. – Community/Business Leader (Pennington County)
Premature Births
Premature birth, high rate of premature births in South Dakota. – Social Services Provider (Pennington County)
Socioeconomics
The Native American community has so many small children born into poverty. Fathers are often nonexistent. Mothers are so young and ill-prepared for motherhood. – Social Services Provider (Pennington County)

COMMUNITY HEALTH NEEDS ASSESSMENT
142
Family Planning
Births to Teen Mothers
About Teen Births
The negative outcomes associated with unintended pregnancies are compounded for adolescents. Teen mothers:
Are less likely to graduate from high school or attain a GED by the time they reach age 30.
Earn an average of approximately $3,500 less per year, when compared with those who delay childbearing.
Receive nearly twice as much Federal aid for nearly twice as long.
Similarly, early fatherhood is associated with lower educational attainment and lower income. Children of teen parents are
more likely to have lower cognitive attainment and exhibit more behavior problems. Sons of teen mothers are more likely to be
incarcerated, and daughters are more likely to become adolescent mothers.
Healthy People 2020 (www.healthypeople.gov)
The following chart describes local teen births.
119
PRC Community Health Needs AssessmentRCRH Service Area
Teen Birth Rate(Births to Women Age 15-19 Per 1,000 Female Population Age 15-19, 2006-2012)
Sources: � Centers for Disease Control and Prevention, National Vital Statistics System: 2006-2012. Accessed using CDC WONDER.
� Retrieved November 2015 from Community Commons at http://www.chna.org.
Notes: � This indicator reports the rate of total births to women under the age of 15 - 19 per 1,000 female population age 15 - 19. This indicator is relevant because in many
cases, teen parents have unique social, economic, and health support services. Additionally, high rates of teen pregnancy may indicate the prevalence of unsafe
sex practices.
49.8
37.2 36.6
RCRH SD US
0
20
40
60
80

COMMUNITY HEALTH NEEDS ASSESSMENT
143
Key Informant Input: Family Planning
The following chart outlines key informants’ perceptions of the severity of Family Planning as a problem in the
community:
Perceptions of Family Planning
as a Problem in the Community(Key Informants, 2015)
Sources: � PRC Online Key Informant Survey, Professional Research Consultants, Inc.
Notes: � Asked of all respondents.
18.1% 31.2% 39.2% 11.5%
Major Problem Moderate Problem Minor Problem No Problem At All
Top Concerns
Among those rating this issue as a “major problem,” reasons frequently related to the following:
Unplanned Pregnancies
There are many unplanned pregnancies in this community. Many children born to single-parent households where they are much more likely to live in poverty. RC is a very conservative community and promotes the birth of children out of wedlock, but beyond that, they are rarely a top priority after that. – Other Health Provider (Pennington County)
Many unplanned and/or unwanted pregnancies. – Other Health Provider (Pennington County)
Many unwanted pregnancies. – Other Health Provider (Pennington County)
It is very easy, no matter what sex, income level, race, or demographic to have sex outside of marriage without taking responsibility for the act. The need for acceptance and love in one moment can often bring an irresponsible man/woman, teenager, or adolescent into parenthood with no means to be able to support the baby, either financially, spiritually, or mentally. It is much easier to have an abortion or to try keep the baby when adoption is a safe alternative. – Social Services Provider (Pennington County)
I believe teen pregnancies are an issue in our community. I believe the lack of comprehensive sexual education is part of the problem. – Public Health Representative (Lawrence County)
I see too many young people pushing around baby strollers and no father figure helping to raise these children. There are far too many unplanned pregnancies in our community and the children are suffering. – Other Health Provider (Pennington County)
Many teenage pregnancies. Many women with multiple pregnancies without resources to properly care for their children. – Other Health Provider (Pennington County)
Teen pregnancy. – Community/Business Leader (Pennington County)
Access to Care
There are no low income family planning services available in Sturgis. – Public Health Representative (Meade County)
Limited access. High incidence of little or no prenatal care. – Other Health Provider (Pennington County)
Staffing issues with the clinics/community education is lacking. – Public Health Representative (Oglala Lakota County)
Abortion is part of family planning. Women must either travel to Sioux Falls or out of state to get one. –

COMMUNITY HEALTH NEEDS ASSESSMENT
144
Community/Business Leader (Pennington County)
Our people have to travel to Spearfish or Rapid City to a program where they can pay according to income. A community health office. – Other Health Provider (Meade County)
Access to low or no cost birth control methods is still limited, especially for young women. Also, long-acting reversible methods are not as widely promoted as they could be, especially for young women. – Public Health Representative (Pennington County)
Lack of Education
Lack of education about the sacrifices that must be made in order to raise a family and our young women get pregnant at an extremely young age often time they are still children themselves. – Other Health Provider (Oglala Lakota County)
Lack of education and poverty. – Social Services Provider (Pennington County)
There is a lack of birth control education and resources and women, particularly young women, continue to suffer the consequences. – Physician (Pennington County)
There is a tremendous lack of sex education in the state of South Dakota as a whole. Youth lack a fundamental understanding of their bodies as a whole, and reproduction in general. As a result, they engage in risky behavior at very young ages, unaware of the consequences. Through generations, teen pregnancy has become an accepted community normality, and youth fail to see it as a barrier to future success or an indicator of potential child abuse and neglect. Youth do not have ready resources to get the information that they need to prevent pregnancy and STIs. The issue is perpetuated through generations. The result is young parents, poverty, and in turn, a substantial number of young families using emergency care as their primary care. Through preventative education and accessible resources, youth should learn how to postpone sexual activity and delay or fully negate the associated risks. – Community/Business Leader (Lawrence County)
Birth Control
Several cultures within Pennington County don't believe in taking birth control or are unemployed and spend their time having unprotected sex. Many women give birth to multiple children while never being employed or married. – Other Health Provider (Pennington County)
No one wants to talk about birth control. We still have a lot of teen pregnancy but we pretend that teens will be abstinent. – Community/Business Leader (Pennington County)
I think access to birth control is a major issue. – Other Health Provider (Custer County)
Single Parenting
We are seeing more and more young mothers or families with multiple children who cannot afford proper care. – Community/Business Leader (Pennington County)
Lots of single mothers. – Community/Business Leader (Butte County)
Many single families in the area with numerous children. – Other Health Provider (Pennington County)
Socioeconomics
Because of our welfare system, it encourages women to have babies so they can get more money from welfare. Very sad. – Other Health Provider (Pennington County)
Many women struggle with follow through doctor visits, poor prenatal care, contraceptive use. Women on Medicaid need to sign a consent 30 days ahead of time if they would like a tubal ligation after a pregnancy. It seems that many people don't plan or think about financially caring for children. – Social Services Provider (Pennington County)
We see an overabundance of children that live in poverty or who are homeless. – Social Services Provider (Pennington County)
Conservative Community
Our community does not seem to believe that it is a priority to provide family planning to youth in middle school, yet every day there are more and more teen pregnancies. It is obvious that this is an age of sexual exploration, why not provide resources to youth and their families so they can prevent these unplanned pregnancies. – Social Services Provider (Pennington County)

COMMUNITY HEALTH NEEDS ASSESSMENT
145
This is a conservative community where issues of family planning are not discussed openly, in my opinion, without fear of reprisals or judgment. Planned Parenthood had a problem here, for example. Birth control is a tricky subject for teachers and schools. – Social Services Provider (Pennington County)
Lack of Resources
Rapid City lacks a large amount of access to family planning programs. Programs are either not advertised or are hard to get to without transportation. In a conservative state the promotion of safe sex practices is not as great as it should be. The concentration should be on safe sex rather than abstinence. And we should focus on preventing pregnancies and STDS rather than dealing with this things after they occur. Prevention is key. – Social Services Provider (Pennington County)
We do not have any resources in the community for family planning except the clinics. – Other Health Provider (Meade County)
STDs
Way too high incidence of sexually transmitted diseases. High rate of prenatal babies and higher mortality. – Other Health Provider (Pennington County)
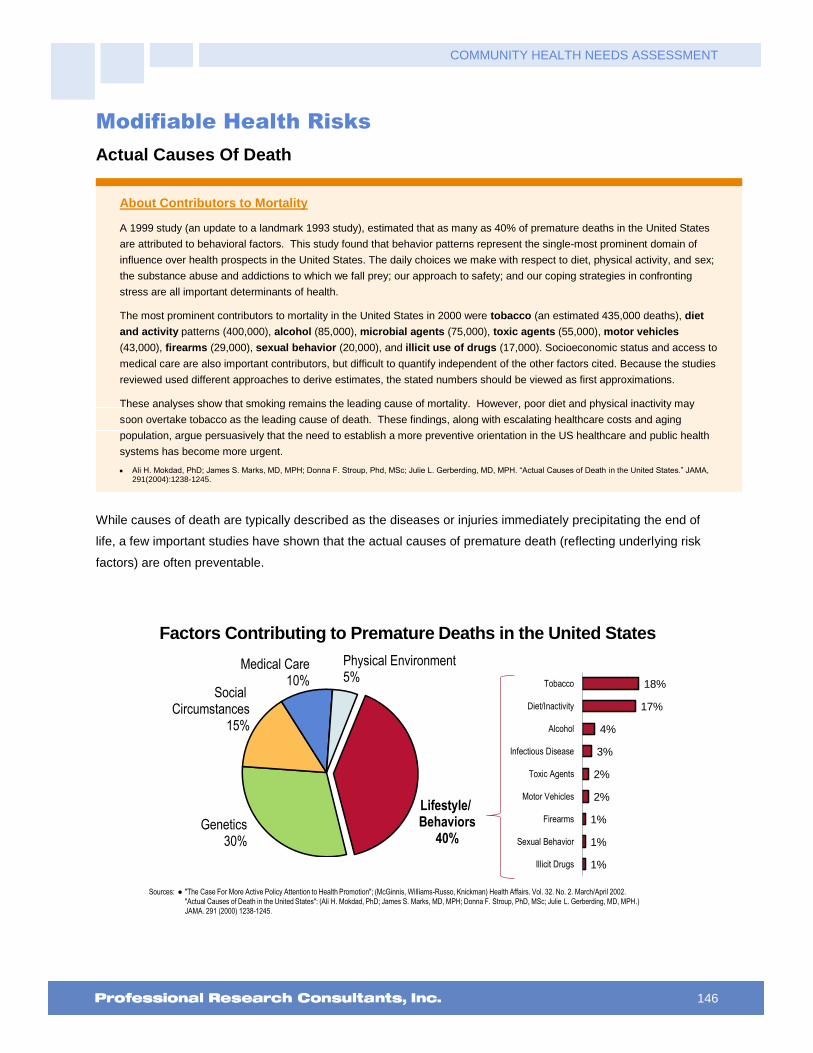
COMMUNITY HEALTH NEEDS ASSESSMENT
146
Modifiable Health Risks
Actual Causes Of Death
About Contributors to Mortality
A 1999 study (an update to a landmark 1993 study), estimated that as many as 40% of premature deaths in the United States
are attributed to behavioral factors. This study found that behavior patterns represent the single-most prominent domain of
influence over health prospects in the United States. The daily choices we make with respect to diet, physical activity, and sex;
the substance abuse and addictions to which we fall prey; our approach to safety; and our coping strategies in confronting
stress are all important determinants of health.
The most prominent contributors to mortality in the United States in 2000 were tobacco (an estimated 435,000 deaths), diet
and activity patterns (400,000), alcohol (85,000), microbial agents (75,000), toxic agents (55,000), motor vehicles
(43,000), firearms (29,000), sexual behavior (20,000), and illicit use of drugs (17,000). Socioeconomic status and access to
medical care are also important contributors, but difficult to quantify independent of the other factors cited. Because the studies
reviewed used different approaches to derive estimates, the stated numbers should be viewed as first approximations.
These analyses show that smoking remains the leading cause of mortality. However, poor diet and physical inactivity may
soon overtake tobacco as the leading cause of death. These findings, along with escalating healthcare costs and aging
population, argue persuasively that the need to establish a more preventive orientation in the US healthcare and public health
systems has become more urgent.
Ali H. Mokdad, PhD; James S. Marks, MD, MPH; Donna F. Stroup, Phd, MSc; Julie L. Gerberding, MD, MPH. “Actual Causes of Death in the United States.” JAMA, 291(2004):1238-1245.
While causes of death are typically described as the diseases or injuries immediately precipitating the end of
life, a few important studies have shown that the actual causes of premature death (reflecting underlying risk
factors) are often preventable.
Factors Contributing to Premature Deaths in the United States
Sources: � "The Case For More Active Policy Attention to Health Promotion"; (McGinnis, Williams-Russo, Knickman) Health Affairs. Vol. 32. No. 2. March/April 2002.
"Actual Causes of Death in the United States": (Ali H. Mokdad, PhD; James S. Marks, MD, MPH; Donna F. Stroup, PhD, MSc; Julie L. Gerberding, MD, MPH.)
JAMA. 291 (2000) 1238-1245.
Lifestyle/ Behaviors
40%Genetics
30%
Social Circumstances
15%
Medical Care10%
Physical Environment5%
18%
17%
4%
3%
2%
2%
1%
1%
1%
Tobacco
Diet/Inactivity
Alcohol
Infectious Disease
Toxic Agents
Motor Vehicles
Firearms
Sexual Behavior
Illicit Drugs
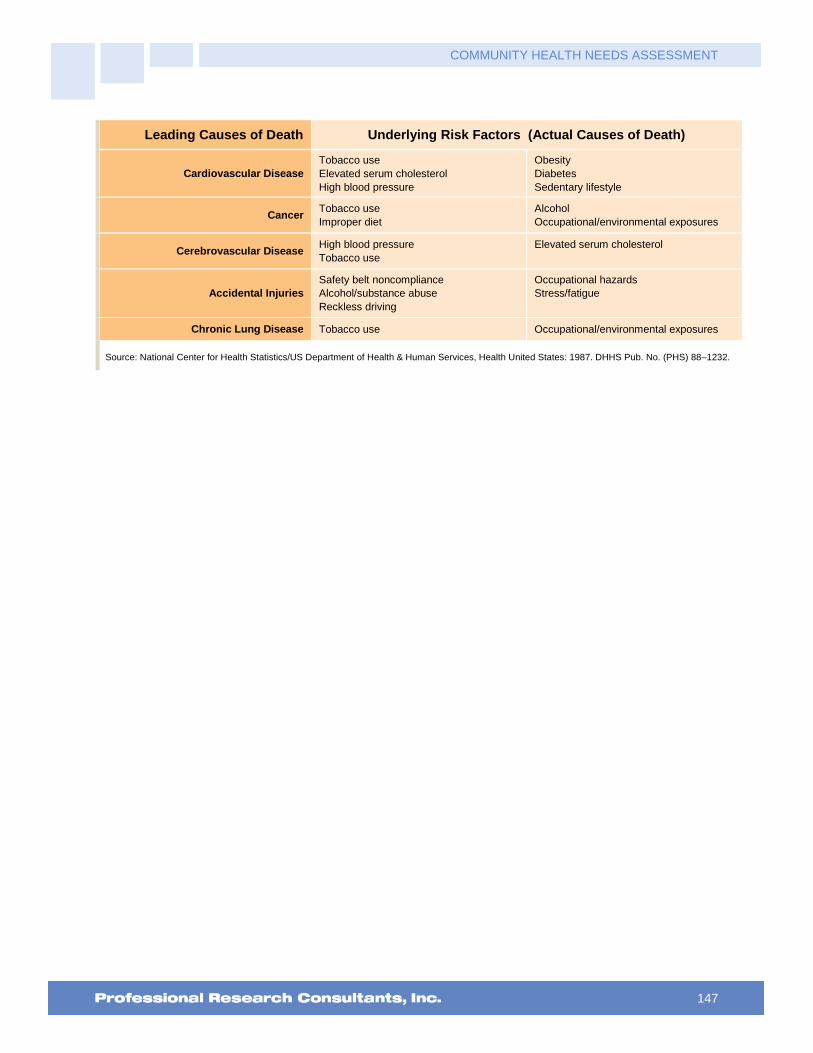
COMMUNITY HEALTH NEEDS ASSESSMENT
147
Leading Causes of Death Underlying Risk Factors (Actual Causes of Death)
Cardiovascular Disease
Tobacco use
Elevated serum cholesterol
High blood pressure
Obesity
Diabetes
Sedentary lifestyle
Cancer Tobacco use
Improper diet
Alcohol
Occupational/environmental exposures
Cerebrovascular Disease High blood pressure
Tobacco use
Elevated serum cholesterol
Accidental Injuries
Safety belt noncompliance
Alcohol/substance abuse
Reckless driving
Occupational hazards
Stress/fatigue
Chronic Lung Disease Tobacco use Occupational/environmental exposures
Source: National Center for Health Statistics/US Department of Health & Human Services, Health United States: 1987. DHHS Pub. No. (PHS) 88–1232.

COMMUNITY HEALTH NEEDS ASSESSMENT
148
Nutrition, Physical Activity & Weight
Nutrition
About Healthful Diet & Healthy Weight
Strong science exists supporting the health benefits of eating a healthful diet and maintaining a healthy body weight. Efforts to
change diet and weight should address individual behaviors, as well as the policies and environments that support these
behaviors in settings such as schools, worksites, healthcare organizations, and communities.
The goal of promoting healthful diets and healthy weight encompasses increasing household food security and eliminating
hunger.
Americans with a healthful diet:
Consume a variety of nutrient-dense foods within and across the food groups, especially whole grains, fruits, vegetables, low-fat or fat-free milk or milk products, and lean meats and other protein sources.
Limit the intake of saturated and trans fats, cholesterol, added sugars, sodium (salt), and alcohol.
Limit caloric intake to meet caloric needs.
Diet and body weight are related to health status. Good nutrition is important to the growth and development of children. A
healthful diet also helps Americans reduce their risks for many health conditions, including: overweight and obesity;
malnutrition; iron-deficiency anemia; heart disease; high blood pressure; dyslipidemia (poor lipid profiles); type 2 diabetes;
osteoporosis; oral disease; constipation; diverticular disease; and some cancers.
Diet reflects the variety of foods and beverages consumed over time and in settings such as worksites, schools, restaurants,
and the home. Interventions to support a healthier diet can help ensure that:
Individuals have the knowledge and skills to make healthier choices.
Healthier options are available and affordable.
Social Determinants of Diet. Demographic characteristics of those with a more healthful diet vary with the nutrient or food
studied. However, most Americans need to improve some aspect of their diet.
Social factors thought to influence diet include:
Knowledge and attitudes
Skills
Social support
Societal and cultural norms
Food and agricultural policies
Food assistance programs
Economic price systems
Physical Determinants of Diet. Access to and availability of healthier foods can help people follow healthful diets. For
example, better access to retail venues that sell healthier options may have a positive impact on a person’s diet; these venues
may be less available in low-income or rural neighborhoods.
The places where people eat appear to influence their diet. For example, foods eaten away from home often have more
calories and are of lower nutritional quality than foods prepared at home.
Marketing also influences people’s—particularly children’s—food choices.
Healthy People 2020 (www.healthypeople.gov)

COMMUNITY HEALTH NEEDS ASSESSMENT
149
Daily Recommendation of Fruits/Vegetables
To measure fruit and vegetable consumption, survey respondents were asked multiple questions, specifically
about the foods and drinks they consumed on the day prior to the interview.
“Now I would like you to think about the foods you ate or drank yesterday. Include all the foods you
ate, both at home and away from home. How many servings of fruit or fruit juices did you have
yesterday?”
“How many servings of vegetables did you have yesterday?”
The questions above are used to calculate daily fruit/vegetable consumption for adults at the respondent level.
The proportion reporting having 5 or more servings per day is shown below.
Consume Five or More Servings of Fruits/Vegetables Per Day
Sources: � PRC Community Health Surveys, Professional Research Consultants, Inc. [Item 146]
� 2013 PRC National Health Survey, Professional Research Consultants, Inc.
Notes: � Asked of all respondents.
� For this issue, respondents were asked to recall their food intake on the previous day.
34.3%39.5%
0%
20%
40%
60%
80%
100%
RCRH US
45.4%
34.3%
2012 2015
RCRH Service Area

COMMUNITY HEALTH NEEDS ASSESSMENT
150
Consume Five or More Servings of Fruits/Vegetables Per Day(RCRH Service Area, 2015)
Sources: � 2015 PRC Community Health Survey, Professional Research Consultants, Inc. [Item 146]
Notes: � Asked of all respondents.
� Hispanics can be of any race. Other race categories are non-Hispanic categorizations (e.g., “White” reflects non-Hispanic White respondents).
� Income categories reflect respondent's household income as a ratio to the federal poverty level (FPL) for their household size. “Low Income” includes households
with incomes up to 200% of the federal poverty level; “Mid/High Income” includes households with incomes at 200% or more of the federal poverty level.
� For this issue, respondents were asked to recall their food intake on the previous day.
30.6%
38.0% 38.3%32.1% 33.5%
22.4%
40.7%34.6% 34.0% 34.3%
0%
20%
40%
60%
80%
100%
Men Women 18 to 39 40 to 64 65+ LowIncome
Mid/HighIncome
NH White Other Overall
Access to Fresh Produce
“How difficult is it for you to buy fresh produce like fruits and vegetables at a price you can afford —
would you say: very difficult, somewhat difficult, not too difficult, or not at all difficult?”
Find It “Very” or “Somewhat”
Difficult to Buy Affordable Fresh Produce(RCRH Service Area, 2015)
Sources: � 2015 PRC Community Health Survey, Professional Research Consultants, Inc. [Item 91]
Notes: � Asked of all respondents.
� Hispanics can be of any race. Other race categories are non-Hispanic categorizations (e.g., “White” reflects non-Hispanic White respondents).
� Income categories reflect respondent's household income as a ratio to the federal poverty level (FPL) for their household size. “Low Income” includes households
with incomes up to 200% of the federal poverty level; “Mid/High Income” includes households with incomes at 200% or more of the federal poverty level.
19.3%
31.2%28.3%
25.2%19.4%
47.4%
14.7%
23.7%
34.3%
25.3% 24.4%
0%
20%
40%
60%
80%
100%
Men Women 18 to 39 40 to 64 65+ LowIncome
Mid/HighIncome
NH White Other Overall US

COMMUNITY HEALTH NEEDS ASSESSMENT
151
A food desert is defined as a low-income area where a significant number or share of residents is far from a
supermarket, where "far" is more than 1 mile in urban areas and more than 10 miles in rural areas. The chart
for this indicator below is based on US Department of Agriculture data.
Population With Low Food Access(Percent of Population That Is Far From a Supermarket or Large Grocery Store, 2010)
Sources: � US Department of Agriculture, Economic Research Service, USDA - Food Access Research Atlas (FARA): 2010.
� Retrieved November 2015 from Community Commons at http://www.chna.org.
Notes: � This indicator reports the percentage of the population living in census tracts designated as food deserts. A food desert is defined as low-income areas where a
significant number or share of residents is far from a supermarket, where "far" is more than 1 mile in urban areas and more than 10 miles in rural areas. This
indicator is relevant because it highlights populations and geographies facing food insecurity.
29.8%
36.6%
23.6%
RCRH SD US
0%
20%
40%
60%
80%
100%
Food Insecurity
“Now I am going to read two statements that people have made about their food situation. Please tell
me whether each statement was "Often True," "Sometimes True," or "Never True" for you in the past 12
months”
“The first statement is: ‘I worried about whether our food would run out before we got money to buy
more.’ Was this statement: Often True, Sometimes True, or Never True?”
“The next statement is: ‘The food that we bought just did not last, and we did not have money to get
more.’ Was this statement: Often True, Sometimes True, or Never True?”

COMMUNITY HEALTH NEEDS ASSESSMENT
152
“Often” or “Sometimes” Worried That
Food Would Run Out at Some Point in the Past Year(RCRH Service Area, 2015)
Sources: � 2015 PRC Community Health Survey, Professional Research Consultants, Inc. [Item 313]
Notes: � Asked of all respondents.
� Hispanics can be of any race. Other race categories are non-Hispanic categorizations (e.g., “White” reflects non-Hispanic White respondents).
� Income categories reflect respondent's household income as a ratio to the federal poverty level (FPL) for their household size. “Low Income” includes households
with incomes up to 200% of the federal poverty level; “Mid/High Income” includes households with incomes at 200% or more of the federal poverty level.
11.4%17.0%
21.6%
12.0%6.1%
34.4%
5.2%9.1%
42.0%
14.2%
0%
20%
40%
60%
80%
100%
Men Women 18 to 39 40 to 64 65+ LowIncome
Mid/HighIncome
NH White Other Overall
“Often” or “Sometimes” Ran Out of Food in the Past Year(RCRH Service Area, 2015)
Sources: � 2015 PRC Community Health Survey, Professional Research Consultants, Inc. [Item 314]
Notes: � Asked of all respondents.
� Hispanics can be of any race. Other race categories are non-Hispanic categorizations (e.g., “White” reflects non-Hispanic White respondents).
� Income categories reflect respondent's household income as a ratio to the federal poverty level (FPL) for their household size. “Low Income” includes households
with incomes up to 200% of the federal poverty level; “Mid/High Income” includes households with incomes at 200% or more of the federal poverty level.
7.3%12.6% 13.7%
9.1%5.3%
24.7%
4.0%7.2%
24.3%
10.0%
0%
20%
40%
60%
80%
100%
Men Women 18 to 39 40 to 64 65+ LowIncome
Mid/HighIncome
NH White Other Overall

COMMUNITY HEALTH NEEDS ASSESSMENT
153
“In the past year, have you gone to a food bank or received free meals provided by churches or other
organizations?”
Relied on a Food Bank or Received Free Meals in the Past Year(RCRH Service Area, 2015)
Sources: � 2015 PRC Community Health Survey, Professional Research Consultants, Inc. [Item 315]
Notes: � Asked of all respondents.
� Hispanics can be of any race. Other race categories are non-Hispanic categorizations (e.g., “White” reflects non-Hispanic White respondents).
� Income categories reflect respondent's household income as a ratio to the federal poverty level (FPL) for their household size. “Low Income” includes households
with incomes up to 200% of the federal poverty level; “Mid/High Income” includes households with incomes at 200% or more of the federal poverty level.
� In this case, free meals might be from churches or other charitable organizations.
5.2% 6.4% 5.3% 6.7% 5.3%
17.6%
1.0%5.1%
9.5%5.8%
0%
20%
40%
60%
80%
100%
Men Women 18 to 39 40 to 64 65+ LowIncome
Mid/HighIncome
NH White Other Overall

COMMUNITY HEALTH NEEDS ASSESSMENT
154
Physical Activity
About Physical Activity
Regular physical activity can improve the health and quality of life of Americans of all ages, regardless of the presence of a
chronic disease or disability. Among adults and older adults, physical activity can lower the risk of: early death; coronary heart
disease; stroke; high blood pressure; type 2 diabetes; breast and colon cancer; falls; and depression. Among children and
adolescents, physical activity can: improve bone health; improve cardiorespiratory and muscular fitness; decrease levels of
body fat; and reduce symptoms of depression. For people who are inactive, even small increases in physical activity are
associated with health benefits.
Personal, social, economic, and environmental factors all play a role in physical activity levels among youth, adults, and older
adults. Understanding the barriers to and facilitators of physical activity is important to ensure the effectiveness of interventions
and other actions to improve levels of physical activity.
Factors positively associated with adult physical activity include: postsecondary education; higher income; enjoyment of
exercise; expectation of benefits; belief in ability to exercise (self-efficacy); history of activity in adulthood; social support from
peers, family, or spouse; access to and satisfaction with facilities; enjoyable scenery; and safe neighborhoods.
Factors negatively associated with adult physical activity include: advancing age; low income; lack of time; low motivation;
rural residency; perception of great effort needed for exercise; overweight or obesity; perception of poor health; and being
disabled. Older adults may have additional factors that keep them from being physically active, including lack of social support,
lack of transportation to facilities, fear of injury, and cost of programs.
Among children ages 4 to 12, the following factors have a positive association with physical activity: gender (boys); belief in
ability to be active (self-efficacy); and parental support.
Among adolescents ages 13 to 18, the following factors have a positive association with physical activity: parental education;
gender (boys); personal goals; physical education/school sports; belief in ability to be active (self-efficacy); and support of
friends and family.
Environmental influences positively associated with physical activity among children and adolescents include:
Presence of sidewalks
Having a destination/walking to a particular place
Access to public transportation
Low traffic density
Access to neighborhood or school play area and/or recreational equipment
People with disabilities may be less likely to participate in physical activity due to physical, emotional, and psychological
barriers. Barriers may include the inaccessibility of facilities and the lack of staff trained in working with people with disabilities.
Healthy People 2020 (www.healthypeople.gov)

COMMUNITY HEALTH NEEDS ASSESSMENT
155
Recommended Levels of Physical Activity
Adults (age 18–64) should do 2 hours and 30 minutes a week of moderate-intensity, or 1 hour and 15 minutes (75 minutes) a
week of vigorous-intensity aerobic physical activity, or an equivalent combination of moderate- and vigorous-intensity aerobic
physical activity. Aerobic activity should be performed in episodes of at least 10 minutes, preferably spread throughout the
week.
Additional health benefits are provided by increasing to 5 hours (300 minutes) a week of moderate-intensity aerobic physical
activity, or 2 hours and 30 minutes a week of vigorous-intensity physical activity, or an equivalent combination of both.
Older adults (age 65 and older) should follow the adult guidelines. If this is not possible due to limiting chronic conditions, older
adults should be as physically active as their abilities allow. They should avoid inactivity. Older adults should do exercises that
maintain or improve balance if they are at risk of falling.
For all individuals, some activity is better than none. Physical activity is safe for almost everyone, and the health benefits of
physical activity far outweigh the risks.
2008 Physical Activity Guidelines for Americans, U.S. Department of Health and Human Services. www.health.gov/PAGuidelines
Physical Activity Levels
Leisure-Time Physical Activity. Leisure-time physical activity includes any physical activities or exercises
(such as running, calisthenics, golf, gardening, walking, etc.) which take place outside of one’s line of work.
“During the past month, other than your regular job, did you participate in any physical activities or
exercises, such as running, calisthenics, golf, gardening, or walking for exercise?”
Note the corresponding Healthy People 2020 target in the chart below.
No Leisure-Time Physical Activity in the Past MonthHealthy People 2020 Target = 32.6% or Lower
Sources: � PRC Community Health Surveys, Professional Research Consultants, Inc. [Item 92]
� Behavioral Risk Factor Surveillance System Survey Data. Atlanta, Georgia. United States Department of Health and Human Services, Centers for Disease Control
and Prevention (CDC): 2013 South Dakota data.
� 2013 PRC National Health Survey, Professional Research Consultants, Inc.
� US Department of Health and Human Services. Healthy People 2020. December 2010. http://www.healthypeople.gov [Objective PA-1]
Notes: � Asked of all respondents.
21.9%18.9%
2012 2015
18.9%23.9%
20.7%
0%
20%
40%
60%
80%
100%
RCRH SD US
RCRH Service Area

COMMUNITY HEALTH NEEDS ASSESSMENT
156
No Leisure-Time Physical Activity in the Past Month(RCRH Service Area, 2015)
Healthy People 2020 Target = 32.6% or Lower
Sources: � 2015 PRC Community Health Survey, Professional Research Consultants, Inc. [Item 92]
� US Department of Health and Human Services. Healthy People 2020. December 2010. http://www.healthypeople.gov [Objective PA-1]
Notes: � Asked of all respondents.
� Hispanics can be of any race. Other race categories are non-Hispanic categorizations (e.g., “White” reflects non-Hispanic White respondents).
� Income categories reflect respondent's household income as a ratio to the federal poverty level (FPL) for their household size. “Low Income” includes households
with incomes up to 200% of the federal poverty level; “Mid/High Income” includes households with incomes at 200% or more of the federal poverty level.
18.5% 19.2%15.7%
19.4%25.2% 23.7%
15.7% 16.1%
33.3%
18.9%
0%
20%
40%
60%
80%
100%
Men Women 18 to 39 40 to 64 65+ LowIncome
Mid/HighIncome
NH White Other Overall
Meeting Physical Activity Recommendations. Meeting physical activity requirements means satisfying a
minimum threshold of minutes per week with a combination of vigorous- and/or moderate-intensity physical
activity (as determined from the questions below). These thresholds are described in the orange box above.
“Vigorous activities cause large increases in breathing or heart rate, while moderate activities cause
small increases in breathing or heart rate. Now, thinking about when you are not working, how many
days per week or per month do you do vigorous activities for at least 20 minutes at a time, such as
running, aerobics, heavy yard work, or anything else that causes large increases in breathing and heart
rate?”
“And on how many days per week or per month do you do moderate activities for at least 30 minutes at
a time, such as brisk walking, bicycling, vacuuming, gardening, or anything else that causes some
increase in breathing or heart rate?”

COMMUNITY HEALTH NEEDS ASSESSMENT
157
Meets Physical Activity Recommendations
Sources: � PRC Community Health Surveys, Professional Research Consultants, Inc. [Item 147]� 2013 PRC National Health Survey, Professional Research Consultants, Inc.
Notes: � Asked of all respondents.
� In this case the term “meets physical activity recommendations” refers to participation in moderate physical activity (exercise that produces only light sweatingor a slight to moderate increase in breathing or heart rate ) at least 5 times a week for 30 minutes at a time, and/or vigorous physical activity (activities thatcause heavy sweating or large increases in breathing or heart rate) at least 3 times a week for 20 minutes at a time.
47.4%50.3%
0%
20%
40%
60%
80%
100%
RCRH US
48.5% 47.4%
2012 2015
RCRH Service Area
Meets Physical Activity Recommendations(RCRH Service Area, 2015)
Sources: � 2015 PRC Community Health Survey, Professional Research Consultants, Inc. [Item 147]Notes: � Asked of all respondents.
� Hispanics can be of any race. Other race categories are non-Hispanic categorizations (e.g., “White” reflects non-Hispanic White respondents).� Income categories reflect respondent's household income as a ratio to the federal poverty level (FPL) for their household size. “Low Income” includes households
with incomes up to 200% of the federal poverty level; “Mid/High Income” includes households with incomes at 200% or more of the federal poverty level. � In this case the term “meets physical activity recommendations” refers to participation in moderate physical activity (exercise that produces only light sweating
or a slight to moderate increase in breathing or heart rate ) at least 5 times a week for 30 minutes at a time, and/or vigorous physical activity (activities thatcause heavy sweating or large increases in breathing or heart rate) at least 3 times a week for 20 minutes at a time.
46.8% 47.9%
55.3%
42.4%39.4%
42.3%
53.6%48.0%
44.4%47.4%
0%
20%
40%
60%
80%
100%
Men Women 18 to 39 40 to 64 65+ LowIncome
Mid/HighIncome
NH White Other Overall

COMMUNITY HEALTH NEEDS ASSESSMENT
158
Access to Physical Activity
Recreation & Fitness Facility Access. Here, recreation/fitness facilities include establishments engaged in
operating facilities which offer “exercise and other active physical fitness conditioning or recreational sports
activities.” Examples include athletic clubs, gymnasiums, dance centers, tennis clubs, and swimming pools.
Population With Recreation & Fitness Facility Access(Number of Recreation & Fitness Facilities per 100,000 Population, 2013)
Sources: � US Census Bureau, County Business Patterns: 2011. Additional data analysis by CARES.
� Retrieved November 2015 from Community Commons at http://www.chna.org.
Notes: � Recreation and fitness facilities are defined by North American Industry Classification System (NAICS) Code 713940 , which include Establishments engaged in
operating facilities which offer “exercise and other active physical fitness conditioning or recreational sports activities”. Examples include athletic clubs,
gymnasiums, dance centers, tennis clubs, and swimming pools. This indicator is relevant because access to recreation and fitness facilities encourages physical
activity and other healthy behaviors.
13.2 11.99.7
RCRH SD US
0
20
40
60
80
Children’s Physical Activity
“During the past 7 days, on how many days was this child physically active for a total of at least 60
minutes per day?”
Child Is Physically Active for One or More Hours per Day(Among Children Age 2-17)
Sources: � 2015 PRC Community Health Survey, Professional Research Consultants, Inc. [Item 117]
� 2013 PRC National Health Survey, Professional Research Consultants, Inc.
Notes: � Asked of all respondents with children age 2-17 at home.
� Includes children reported to have one or more hours of physical activity on each of the seven days preceding the survey.
55.9%
48.6%
0%
20%
40%
60%
80%
100%
RCRH US

COMMUNITY HEALTH NEEDS ASSESSMENT
159
Weight Status
About Overweight & Obesity
Because weight is influenced by energy (calories) consumed and expended, interventions to improve weight can support
changes in diet or physical activity. They can help change individuals’ knowledge and skills, reduce exposure to foods low in
nutritional value and high in calories, or increase opportunities for physical activity. Interventions can help prevent unhealthy
weight gain or facilitate weight loss among obese people. They can be delivered in multiple settings, including healthcare
settings, worksites, or schools.
The social and physical factors affecting diet and physical activity (see Physical Activity topic area) may also have an impact on
weight. Obesity is a problem throughout the population. However, among adults, the prevalence is highest for middle-aged
people and for non-Hispanic black and Mexican American women. Among children and adolescents, the prevalence of obesity
is highest among older and Mexican American children and non-Hispanic black girls. The association of income with obesity
varies by age, gender, and race/ethnicity.
Healthy People 2020 (www.healthypeople.gov)
Body Mass Index (BMI), which describes relative weight for height, is significantly correlated with total body fat content. The
BMI should be used to assess overweight and obesity and to monitor changes in body weight. In addition, measurements of
body weight alone can be used to determine efficacy of weight loss therapy. BMI is calculated as weight (kg)/height squared
(m2). To estimate BMI using pounds and inches, use: [weight (pounds)/height squared (inches2)] x 703.
In this report, overweight is defined as a BMI of 25.0 to 29.9 kg/m2 and obesity as a BMI ≥30 kg/m2. The rationale behind these
definitions is based on epidemiological data that show increases in mortality with BMIs above 25 kg/m2. The increase in
mortality, however, tends to be modest until a BMI of 30 kg/m2 is reached. For persons with a BMI ≥30 kg/m2, mortality rates
from all causes, and especially from cardiovascular disease, are generally increased by 50 to 100 percent above that of
persons with BMIs in the range of 20 to 25 kg/m2.
Clinical Guidelines on the Identification, Evaluation, and Treatment of Overweight and Obesity in Adults: The Evidence Report. National Institutes of Health. National Heart, Lung, and Blood Institute in Cooperation With The National Institute of Diabetes and Digestive and Kidney Diseases. September 1998.
Classification of Overweight and Obesity by BMI BMI (kg/m2)
Underweight <18.5
Healthy Weight 18.5 – 24.9
Overweight, not Obese 25.0 – 29.9
Obese ≥30.0
Source: Clinical Guidelines on the Identification, Evaluation, and Treatment of Overweight and Obesity in Adults: The Evidence Report. National Institutes of Health. National Heart, Lung, and Blood Institute in Cooperation With The National Institute of Diabetes and Digestive and Kidney Diseases. September 1998.
Adult Weight Status
“About how much do you weigh without shoes?”
“About how tall are you without shoes?”
The survey questions above were used to calculate a Body Mass Index or BMI value (described above) for
each respondent. This calculation allows us to examine the proportion of the population who is at a healthy
weight, or who is overweight or obese (see table above).
Note the Healthy People 2020 target for obesity.

COMMUNITY HEALTH NEEDS ASSESSMENT
160
Prevalence of Total Overweight(Percent of Adults With a Body Mass Index of 25.0 or Higher)
Sources: � PRC Community Health Surveys, Professional Research Consultants, Inc. [Item 151]
� 2013 PRC National Health Survey, Professional Research Consultants, Inc.
� Behavioral Risk Factor Surveillance System Survey Data. Atlanta, Georgia. United States Department of Health and Human Services, Centers for Disease Control
and Prevention (CDC): 2013 South Dakota data.
Notes: � Based on reported heights and weights, asked of all respondents.
� The definition of overweight is having a body mass index (BMI), a ratio of weight to height (kilograms divided by meters squared), greater than or equal to 25.0,
regardless of gender. The definition for obesity is a BMI greater than or equal to 30.0.
70.9% 71.3%
2012 2015
71.3%67.0%
63.1%
0%
20%
40%
60%
80%
100%
RCRH SD US
RCRH Service Area
Prevalence of Obesity(Percent of Adults With a Body Mass Index of 30.0 or Higher)
Healthy People 2020 Target = 30.5% or Lower
Sources: � PRC Community Health Surveys, Professional Research Consultants, Inc. [Item 151]� 2013 PRC National Health Survey, Professional Research Consultants, Inc.� US Department of Health and Human Services. Healthy People 2020. December 2010. http://www.healthypeople.gov [Objective NWS-9]� Behavioral Risk Factor Surveillance System Survey Data. Atlanta, Georgia. United States Department of Health and Human Services, Centers for Disease Control
and Prevention (CDC): 2013 South Dakota data.Notes: � Based on reported heights and weights, asked of all respondents.
� The definition of obesity is having a body mass index (BMI), a ratio of weight to height (kilograms divided by meters squared), greater than or equal to 30.0,regardless of gender.
27.0%32.7%
2012 2015
32.7%29.9% 29.0%
0%
20%
40%
60%
80%
100%
RCRH SD US
RCRH Service Area

COMMUNITY HEALTH NEEDS ASSESSMENT
161
Prevalence of Obesity(Percent of Adults With a BMI of 30.0 or Higher; RCRH Service Area, 2015)
Healthy People 2020 Target = 30.5% or Lower
Sources: � 2015 PRC Community Health Survey, Professional Research Consultants, Inc. [Item 151]� US Department of Health and Human Services. Healthy People 2020. December 2010. http://www.healthypeople.gov [Objective NWS-9]
Notes: � Based on reported heights and weights, asked of all respondents.� Hispanics can be of any race. Other race categories are non-Hispanic categorizations (e.g., “White” reflects non-Hispanic White respondents).� Income categories reflect respondent's household income as a ratio to the federal poverty level (FPL) for their household size. “Low Income” includes households
with incomes up to 200% of the federal poverty level; “Mid/High Income” includes households with incomes at 200% or more of the federal poverty level. � The definition of obesity is having a body mass index (BMI), a ratio of weight to height (kilograms divided by meters squared), greater than or equal to 30.0,
regardless of gender.
34.3%31.0%
33.6% 33.1% 31.7%34.9%
31.3% 32.5% 34.5% 32.7%
0%
20%
40%
60%
80%
100%
Men Women 18 to 39 40 to 64 65+ LowIncome
Mid/HighIncome
NH White Other Overall
Weight Control
About Maintaining a Healthy Weight
Individuals who are at a healthy weight are less likely to:
Develop chronic disease risk factors, such as high blood pressure and dyslipidemia.
Develop chronic diseases, such as type 2 diabetes, heart disease, osteoarthritis, and some cancers.
Experience complications during pregnancy.
Die at an earlier age.
All Americans should avoid unhealthy weight gain, and those whose weight is too high may also need to lose weight.
Healthy People 2020 (www.healthypeople.gov)
Weight Management. The following three questions were used to calculate the proportion of adults who are
overweight or obese and who are using a combination of both diet and exercise in order to try to lose weight.
“Are you now trying to lose weight?”
“Are you eating either fewer calories or less fat to lose weight?”
“Are you using physical activity or exercise to lose weight?”
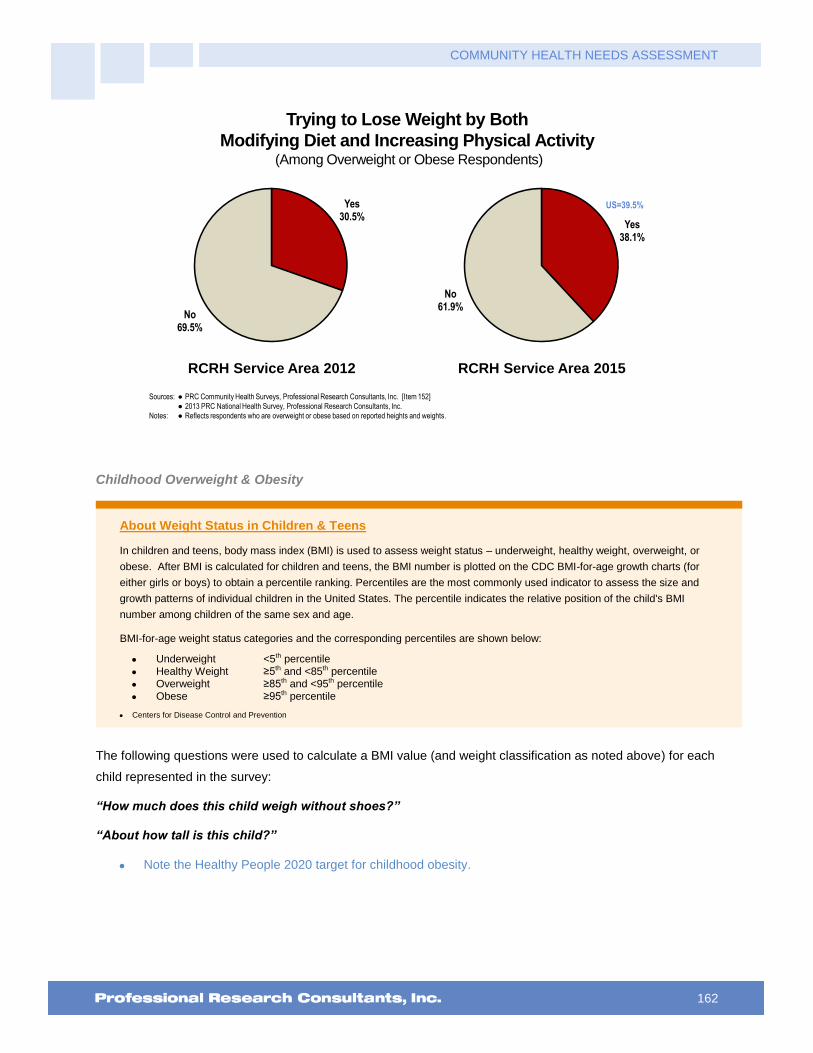
COMMUNITY HEALTH NEEDS ASSESSMENT
162
Trying to Lose Weight by Both
Modifying Diet and Increasing Physical Activity(Among Overweight or Obese Respondents)
Sources: � PRC Community Health Surveys, Professional Research Consultants, Inc. [Item 152]
� 2013 PRC National Health Survey, Professional Research Consultants, Inc.
Notes: � Reflects respondents who are overweight or obese based on reported heights and weights.
Yes30.5%
No69.5%
Yes38.1%
No61.9%
RCRH Service Area 2012 RCRH Service Area 2015
US=39.5%
Childhood Overweight & Obesity
About Weight Status in Children & Teens
In children and teens, body mass index (BMI) is used to assess weight status – underweight, healthy weight, overweight, or
obese. After BMI is calculated for children and teens, the BMI number is plotted on the CDC BMI-for-age growth charts (for
either girls or boys) to obtain a percentile ranking. Percentiles are the most commonly used indicator to assess the size and
growth patterns of individual children in the United States. The percentile indicates the relative position of the child's BMI
number among children of the same sex and age.
BMI-for-age weight status categories and the corresponding percentiles are shown below:
Underweight <5th percentile
Healthy Weight ≥5th and <85th percentile
Overweight ≥85th and <95th percentile
Obese ≥95th percentile
Centers for Disease Control and Prevention
The following questions were used to calculate a BMI value (and weight classification as noted above) for each
child represented in the survey:
“How much does this child weigh without shoes?”
“About how tall is this child?”
Note the Healthy People 2020 target for childhood obesity.

COMMUNITY HEALTH NEEDS ASSESSMENT
163
Child Total Overweight Prevalence(Children Age 5-17 Who Are Overweight/Obese; BMI in the 85th Percentile or Higher)
Sources: � PRC Community Health Surveys, Professional Research Consultants, Inc. [Item 155]
� 2013 PRC National Health Survey, Professional Research Consultants, Inc.
Notes: � Asked of all respondents with children age 5-17 at home.
� Overweight among children is determined by children’s Body Mass Index status at or above the 85 th percentile of US growth charts by gender and age.
25.1%31.5%
0%
20%
40%
60%
80%
100%
RCRH US
32.3%
25.1%
2012 2015
RCRH Service Area
Child Obesity Prevalence(Children Age 5-17 Who Are Obese; BMI in the 95th Percentile or Higher)
Healthy People 2020 Target = 14.5% or Lower
Sources: � PRC Community Health Surveys, Professional Research Consultants, Inc. [Item 155]
� 2013 PRC National Health Survey, Professional Research Consultants, Inc.
� US Department of Health and Human Services. Healthy People 2020. December 2010. http://www.healthypeople.gov [Objective NWS-10.4]
Notes: � Asked of all respondents with children age 5-17 at home.
� Obesity among children is determined by children’s Body Mass Index status equal to or above the 95 th percentile of US growth charts by gender and age.
11.6%16.4%
2012 2015
16.4% 14.8%
0%
20%
40%
60%
80%
100%
RCRH US
RCRH Service Area

COMMUNITY HEALTH NEEDS ASSESSMENT
164
Key Informant Input: Nutrition, Physical Activity & Weight
The following chart outlines key informants’ perceptions of the severity of Nutrition, Physical Activity & Weight
as a problem in the community:
Perceptions of Nutrition, Physical Activity, and Weight
as a Problem in the Community(Key Informants, 2015)
Sources: � PRC Online Key Informant Survey, Professional Research Consultants, Inc.
Notes: � Asked of all respondents.
41.7% 41.3% 11.6%
Major Problem Moderate Problem Minor Problem No Problem At All
Top Concerns
Among those rating this issue as a “major problem,” reasons frequently related to the following:
Access to Affordable Healthy Food
It is a nationwide issue. Access to affordable food, real food, not manufactured food. I believe everyone would like to eat well, but select not too, or cannot access real food and must select packaged food. – Other Health Provider (Pennington County)
Low wages means people purchase inexpensive foods with carbs. The cost of organic produce. – Community/Business Leader (Pennington County)
Diabetes, poor eating habits, eating healthy costs more money than eating junk food. – Other Health Provider (Pennington County)
Access to affordable healthy foods year round. Difficulty of staying active during winter months. – Other Health Provider (Pennington County)
Access to health foods in our community is a huge issue. Most of the food bought on the reservation is from convenience stores and most of that food is unhealthy. Loss of food sovereignty. Loss of traditional food way and the way we viewed food as medicine for our spirit and bodies. People view fry bread, popovers and cake as traditional or food used to honor at ceremonies. We also have a lot of hardworking families and young families and sometimes they eat what is fast and easy, not valuing nutritional content. Sugar sweetened beverages is a huge problem on the reservation. Physical activity has also tapered off with the influx of technology. Now more people are overweight than normal or under so it has become normal and thus does not carry with it the same stigma. The build environment is not really conducive to physical activity and the playgrounds are not always considered a safe place to play. – Other Health Provider (Oglala Lakota County)
Low wages does not allow for good nutritional foods, work long hours, no energy left to care for self, and lack of resources available for physical activity. Restaurants do not serve affordable foods that are healthy. – Other Health Provider (Pennington County)
Lack of healthy, cost friendly foods available. Lack of education on the impact of long term high carb, high saturated fat diet. Impact of regular sugar containing drinks on overall health and dental well-being. Lack of activity or understanding of importance for health. – Other Health Provider (Oglala Lakota County)
This area has a great deal of individuals who cannot afford healthy food, do not participate in physical activity, and are overweight. Certain studies have shown that healthy foods do not cost more than unhealthy but in reality this is not true. Many of those living in poverty may not have access to a stove or a fridge so the availability of fresh food which is not processed is not easy. It is easier to buy off the dollar menu at McDonalds than it is to buy fresh food, try to keep it fresh, and attempt to cook it. People lack the tools, the

COMMUNITY HEALTH NEEDS ASSESSMENT
165
skills, and the resources to be truly healthy especially if they are living in poverty. – Social Services Provider (Pennington County)
Lack of ability to afford healthy food options. – Other Health Provider (Pennington County)
Our area seems to have a larger than normal percentage of overweight people and people that are noticeably out of shape. I believe that poor nutrition plays a role in this and may be the result of a lack of education or simply that nutritious foods tend to be more expensive than the non-nutritious foods. Also, exercise would obviously improve conditions considerably. – Other Health Provider (Lawrence County)
Although healthy food is available, people make unhealthy choices. Such choices are likely made based on convenience, ignorance, cost and culture. – Other Health Provider (Pennington County)
No access to healthy nutritious foods or facilities to partake in physical activity. No knowledgeable staff in the communities that work to teach these skills and to work with these individuals with diverse needs regarding their weight. – Other Health Provider (Oglala Lakota County)
Poor eating habits. Too much fast food and pre-packaged food items. Homelessness or not having the opportunity to cook nutritious meals. Poverty, not being able to afford nutritious items. Ignorance of what is nutritious and what isn't. Laziness. – Other Health Provider (Pennington County)
Income levels below average for a many of residents in low to middle class. Poor nutritional choices based on price of quality foods and what is available for those on government programs. Lack of interest in self-improvement or weight loss. Organized exercise and fitness programs are cost prohibitive and only available in larger communities. – Other Health Provider (Lawrence County)
Many people living in poverty can't afford to purchase fruits and vegetables or other more nutritional foods. Low income people can't afford to pay the fees to participate in sports programs, join the recreation centers or YMCA programs. Many obese people need the support systems and comradery of organized programs to maintain motivation, but can't afford it. – Community/Business Leader (Pennington County)
Focus on healthy lifestyle and preventative medicine is lacking. Patients prefer taking a tablet to exercise. Perception that healthy food is too expensive. Poor transportation access, making routine access to fresh foods difficult. Ability to use community assistance to purchase foods with little to no nutritive value. Lack of education regarding healthy eating and cooking. – Other Health Provider (Pennington County)
I think that the greatest challenge in this area is poverty. Families do not have ready access to healthy foods, or the education or resources to purchase and prepare them. Because parents must piece together multiple part-time jobs to make ends meet, there is a fundamental lack of leisure time. This means that families are not exercising or being active together. Which, in turn, means that these habits are not being established in our youth, and the problem is being perpetuated through generations. There are a lack of safe, free spaces for people to be active, and with the long winters, this impedes the ability to exercise. Youth sports are prohibitively expensive for many families. – Community/Business Leader (Lawrence County)
Culture, cost of healthy foods, expense of access to facilities for exercise. – Public Health Representative (Fall River County)
Affordable healthy foods. Even if patients want to make healthy changes, they often can't afford it. Information on what comprises a healthy diet and how to cook healthy meals. Prioritizing the time it takes to exercise and working it into a busy day or stressors are so great with simply making a living or taking care of family needs, exercise is not a priority. – Other Health Provider (Custer County)
Limited healthy food options and gym activity. – Other Health Provider (Custer County)
Many people who are overweight are also low income with limited access to nutritious food. Others simply make poor food choices and for a variety of reasons, choose not to exercise regularly. – Social Services Provider (Pennington County)
Lifestyle
Lack of exercise, overeating, unbalanced nutrition. A portion of society in general doesn't know how to exercise or eat healthy. – Social Services Provider (Pennington County)
I think there just aren't opportunities for physical activity. Nutrition, many people are just unaware on how to cook and eat healthy. In my opinion it has become the norm to eat out and eat processed unhealthy foods. We need to get back to cooking in our homes. –Other Health Provider (Oglala Lakota County)
Weather conditions often prevent people from getting outside to exercise contributing to high number of overweight individuals. Many young adults have had no hands on experience with cooking, so fast food or

COMMUNITY HEALTH NEEDS ASSESSMENT
166
processed food is the go to all too often, again contributing to the overweight/obese problem. – Community/Business Leader (Pennington County)
Poor eating habits, poverty. – Physician (Pennington County)
Poor diet and nutrition choices made by many patients. Obesity continues to be all too common. – Physician (Lawrence County)
It is difficult to change behavior to manage weight and stay physically active. Nutrition takes a focused effort and quality, affordable fruit and vegetables can be difficult to find. – Other Health Provider (Pennington County)
Focusing on self-care and wellness. Access and prioritization of self-care leading to wellness. – Community/Business Leader (Lawrence County)
Malnutrition related to substance abuse or chronic illness, obesity and inactivity. – Other Health Provider (Pennington County)
People choose not to eat healthy. They eat on the run and do not eat healthy because they cannot afford to eat well, often are working two jobs and cannot cook nutritious meals, take time to exercise. Mental health problems are also a huge contributing factor to poor physical health and weight problems. – Social Services Provider (Pennington County)
Managing time, finances and daily family pressures that allows for physical activity and good nutrition. The relative absence of family meals and people always on the go seems to be a large contributor. – Community/Business Leader (Pennington County)
Changing behaviors. – Other Health Provider (Pennington County)
In general, people do not take responsibility for eating healthy diets, getting moderate exercise and controlling their weight. – Physician (Black Hills region)
Willingness to live a healthy lifestyle. – Other Health Provider (Pennington County)
Unhealthy life styles. Poverty. Escapism. – Community/Business Leader (Pennington County)
Getting the overweight population to take charge of their lives to exercise. The Deadwood Rec Center is affordable for anyone, as is the Handley Center in Lead. Good nutrition is also an important topic missing from our area. – Community/Business Leader (Lawrence County)
Weight loss is a hard and ongoing process. People don't make it a priority to eat well and or exercise to control obesity. Some people have bad metabolism and struggle with weight loss even when they do exercise regularly and generally eat well with a few splurges. Food is expensive and nutritious food is not affordable by all. Some lack education for inexpensive healthy meals. We live in a beautiful area, we can all get out and walk, so access to exercise should not be a problem except in the unsafest parts of town. – Other Health Provider (Pennington County)
Lack of Education
Lack of education, poverty, apathy, drugs and alcohol. – Social Services Provider (Pennington County)
Limited access to educational resources. – Social Services Provider (Pennington County)
Education, availability of healthy choices. – Social Services Provider (Pennington County)
Education, awareness, desire and affordability, especially for people living in poverty of healthy living and food choices. Local cultural acceptance of unhealthy lifestyles. – Social Services Provider (Pennington County)
Food and allergy education for the community and food establishments. – Social Services Provider (Pennington County)
Lack of information and support. – Community/Business Leader (Pennington County)
Education and general help for the public. – Community/Business Leader (Lawrence County)
Lack of education and support. – Community/Business Leader (Pennington County)
There needs to be a collective effort to champion the value of proper nutrition, activity and weight control. There needs to be a focused effort on the individual and collective benefit of physical activity. – Community/Business Leader (Lawrence County)

COMMUNITY HEALTH NEEDS ASSESSMENT
167
Very little education on diet, especially correct information. Physicians have little training on nutrition in medical school. – Other Health Provider (Pennington County)
Not enough education based on weight issues. – Other Health Provider (Pennington County)
Nutrition education in the schools, community. I would like to be able to endorse better choice foods at the grocery store. Limited access to an open gym situation. No indoor pool for exercise for those who don't weight bear well. – Physician (Custer County)
Once again I believe that a lack of education plays a major role in this. Currently CRH is trying to expand services so that more services can be provided to help with weight loss that will covered by insurance. Patients cannot afford to pay out of pocket. The weather in the winter does have an impact as people do not get outside as much. – Other Health Provider (Custer County)
I think our healthcare professionals should be required to give lessons in schools to educate students. Even one lesson a year would be impressive. – Community/Business Leader (Pennington County)
Prevention
The Pennington County population is very indifferent to taking a proactive step in preventing many diseases. There are many free opportunities to exercise in this community but we still have a high number of lifestyle diseases in our community. – Other Health Provider (Pennington County)
Many of the other conditions identified at the beginning of the survey are chronic disease and prevention is the key to reducing the impact of these diseases. Prevention efforts must strive to move beyond educational programs because the research does not seem to support long-term behavior change. Walkable community initiatives and crime prevention, so people feel safe to walk, is the key. A very unpopular solution is taxing food and beverage linked to poor health outcomes. It worked for reducing tobacco use rates and it is probably the only think that will reduce consumption of low quality food that does not contribute to overall health and well-being. – Social Services Provider (Pennington County)
Employers in this area do not put an emphasis on prevention when it comes to their employees and physicians and providers focus on treating the diseases rather than focusing on prevention in the first place. – Other Health Provider (Pennington County)
You only see a small sector of the community partaking in healthcare and it is usually after there is an issue. – Community/Business Leader (Butte County)
These issues are not seen as essential for any period of time to most people. Other priorities get more attention. – Physician (Pennington County)
Lack of community and physician engagement in addressing these issues. – Other Health Provider (Lawrence County)
Obesity
There seems to be an excessive amount of overweight people in this part of the country with no desire to exercise. – Physician (Pennington County)
We have an aging population at high risk for obesity-related problems. – Other Health Provider (Black Hills Region)
The biggest issue is the rise of obesity and subsequent comorbidities. The lifestyle choices made seem to be poor and the reliance on the health system to fix the after affects are costly. – Other Health Provider (Pennington County)
South Dakota has some of highest levels of obesity in the nation. – Community/Business Leader (Pennington County)
Many obese patients. Obesity leads to other health issues and trouble making appointments due to increased pain. – Other Health Provider (Pennington County)
Obesity. – Community/Business Leader (Pennington County)
The high rate of obesity and lack of physical activity. Nutrition is a hard system to make the public understand as well. – Community/Business Leader (Pennington County)
Much of the population is overweight and they do not eat healthy nor do they eat regular meals throughout the day. This is being taught to children growing up and the next generation is more inclined to follow in our footsteps. Physical activity is also a concern as all three of these challenges go hand in hand. Obesity, poor
COMMUNITY HEALTH NEEDS ASSESSMENT
168
nutrition and decreased physical activity all lead to other healthcare problems including HTN, DM, depression, etc. – Other Health Provider (Pennington County)
Access to Care
These things disproportionately plague lower income people. Pennington County has more than their share. – Other Health Provider (Pennington County)
Rural area. – Other Health Provider (Pennington County)
Many are poor. They don't know how to eat healthy on limited incomes. Lack of resources to join gym. Some are just not motivated to live a healthy lifestyle. – Other Health Provider (Pennington County)
Need safe places to exercise. Some areas do not have sidewalks, and there have been incidents of people being attacked in public parks. The healthiest food is not always the cheapest or easiest to prepare for busy people. – Physician (Pennington County)
Access to safe places to walk and exercise, especially in the North part of Rapid City. Access to supermarkets/healthy food outlets for people with limited transportation. Opportunities to participate in sports for lower income students. – Public Health Representative (Pennington County)
Cost and lack of availability of qualified people in the area to teach wellness such as registered dietitians. – Social Services Provider (Pennington County)
The cost of programs. – Other Health Provider (Pennington County)
Motivation, Compliance
Lack of self-management. – Other Health Provider (Pennington County)
Compliance, not enough education and staff to get out there and help. – Public Health Representative (Oglala Lakota County)
Apathy or undiagnosed depression on the part of those who don't value eating right and exercising regularly. – Community/Business Leader (Pennington County)
Motivation for people to be able to link this to how good they feel overall. – Community/Business Leader (Pennington County)
Lack of motivation. – Other Health Provider (Pennington County)
Individual's motivation for change and lack of financial means. – Other Health Provider (Pennington County)
Socioeconomics
We have a large Native population here, and most are economically disadvantaged. Unemployment is about 4.5% for the non-Native population, and about 50% for Natives. As a result, this population often eats fast food, which is cheap but deadly. 60% of Native adults have diabetes. – Social Services Provider (Pennington County)
There is lots of emphasis on physical activity and weight control, but not for people of low income or people who work long hours. Lots of fast food places that offer cheap non-nutritious foods. – Other Health Provider (Pennington County)
Nutrition needs, especially for children. Many families are below the poverty line and while the kids get fed a meal in school, they may not on weekends and during summer vacations. Community cupboards are always in need of contributions. – Other Health Provider (Lawrence County)
Low motivation for health. Low socioeconomic status. Junk food is cheaper than healthy food. – Other Health Provider (Pennington County)
I think there are a variety of challenges which affect the different socioeconomic tiersLarge size of all the food. Schedules that aren't conducive to exercise. People who aren't motivated. People on state assistance which makes obtaining fresh fruits/vegetables too expensive. Not understanding the implications long term of type II diabetes, cost of insulin, test strips, monitor is usually free and other supplies. Cost of the insurance that is required to have but then doesn't cover much of what is needed. – Other Health Provider (Pennington County)
High number of individuals in a low socioeconomic class. – Other Health Provider (Lawrence County)

COMMUNITY HEALTH NEEDS ASSESSMENT
169
Infrastructure
Our church sponsors a weekly after school program. Over 20 children attend. Many because they get something to eat. – Community/Business Leader (Butte County)
Hot lunch, food stamps, education, desire. – Other Health Provider (Pennington County)
Lack of bicycling/walking facilities throughout the community. Encouraged to drive, not walk/ride. – Community/Business Leader (Pennington County)
Ice in the winter is the biggest challenge. – Other Health Provider (Pennington County)

COMMUNITY HEALTH NEEDS ASSESSMENT
170
Substance Abuse
About Substance Abuse
Substance abuse has a major impact on individuals, families, and communities. The effects of substance abuse are
cumulative, significantly contributing to costly social, physical, mental, and public health problems. These problems include:
Teenage pregnancy
Human immunodeficiency virus/acquired immunodeficiency syndrome (HIV/AIDS)
Other sexually transmitted diseases (STDs)
Domestic violence
Child abuse
Motor vehicle crashes
Physical fights
Crime
Homicide
Suicide
Substance abuse refers to a set of related conditions associated with the consumption of mind- and behavior-altering
substances that have negative behavioral and health outcomes. Social attitudes and political and legal responses to the
consumption of alcohol and illicit drugs make substance abuse one of the most complex public health issues. In addition to the
considerable health implications, substance abuse has been a flash-point in the criminal justice system and a major focal point
in discussions about social values: people argue over whether substance abuse is a disease with genetic and biological
foundations or a matter of personal choice.
Advances in research have led to the development of evidence-based strategies to effectively address substance abuse.
Improvements in brain-imaging technologies and the development of medications that assist in treatment have gradually
shifted the research community’s perspective on substance abuse. There is now a deeper understanding of substance abuse
as a disorder that develops in adolescence and, for some individuals, will develop into a chronic illness that will require lifelong
monitoring and care.
Improved evaluation of community-level prevention has enhanced researchers’ understanding of environmental and social
factors that contribute to the initiation and abuse of alcohol and illicit drugs, leading to a more sophisticated understanding of
how to implement evidence-based strategies in specific social and cultural settings.
A stronger emphasis on evaluation has expanded evidence-based practices for drug and alcohol treatment. Improvements
have focused on the development of better clinical interventions through research and increasing the skills and qualifications of
treatment providers.
Healthy People 2020 (www.healthypeople.gov)
Related Age-Adjusted Mortality
Cirrhosis/Liver Disease. Heavy alcohol use contributes to a significant share of liver disease, including
cirrhosis. The chart below outlines age-adjusted mortality for cirrhosis/liver disease in the area.
Drug-Induced Deaths. Drug-induced deaths include all deaths for which drugs are the underlying cause,
including those attributable to acute poisoning by drugs (drug overdoses) and deaths from medical conditions
resulting from chronic drug use (e.g., drug-induced Cushing's syndrome). A “drug” includes illicit or street drugs
(e.g., heroin and cocaine), as well as legal prescription and over-the-counter drugs; alcohol is not included.
These deaths may also be either intentional (e.g., suicide) or unintentional (accidental). The chart below
outlines local age-adjusted mortality for drug-induced deaths.
Note the corresponding Healthy People 2020 targets.

COMMUNITY HEALTH NEEDS ASSESSMENT
171
Cirrhosis/Liver Disease: Age-Adjusted Mortality Trends(Annual Average Deaths per 100,000 Population)
Healthy People 2020 Target = 8.2 or Lower
Sources: � CDC WONDER Online Query System. Centers for Disease Control and Prevention, Epidemiology Program Office, Division of Public Health Surveillance and
Informatics. Data extracted November 2015.
� US Department of Health and Human Services. Healthy People 2020. December 2010. http://www.healthypeople.gov [Objective SA-11]
Notes: � Deaths are coded using the Tenth Revision of the International Statistical Classification of Diseases and Related Health Problems (ICD-10).
� Rates are per 100,000 population, age-adjusted to the 2000 US Standard Population.
2004-2006 2005-2007 2006-2008 2007-2009 2008-2010 2009-2011 2010-2012 2011-2013
RCRH 16.5 14.3 13.9 13.3 11.8 11.3 17.3 19.5
SD 10.7 10.6 11.1 10.6 10.2 10.1 11.7 12.8
US 8.9 8.9 9.0 9.1 9.2 9.4 9.7 9.9
0
5
10
15
20
25
Drug-Induced Deaths: Age-Adjusted Mortality Trends(Annual Average Deaths per 100,000 Population)
Healthy People 2020 Target = 11.3 or Lower
Sources: � CDC WONDER Online Query System. Centers for Disease Control and Prevention, Epidemiology Program Office, Division of Public Health Surveillance and
Informatics. Data extracted November 2015.
� UD Department of Health and Human Services. Healthy People 2020. December 2010. http://www.healthypeople.gov [Objective SA-12].
Notes: � Deaths are coded using the Tenth Revision of the International Statistical Classification of Diseases and Related Health Problems (ICD-10).
� Rates are per 100,000 population, age-adjusted to the 2000 US Standard Population.
2004-2006 2005-2007 2006-2008 2007-2009 2008-2010 2009-2011 2010-2012 2011-2013
RCRH 11.0 9.1 9.8 11.0 11.2 11.5 8.8 8.3
SD 6.2 5.4 5.9 6.3 7.1 7.0 6.7 6.8
US 11.5 12.2 12.7 12.6 12.7 13.1 13.5 14.1
0
2
4
6
8
10
12
14
16
Alcohol Use
Current Drinkers. “Current drinkers” include survey respondents who had at least one drink of alcohol in the
month preceding the interview. For the purposes of this study, a “drink” is considered one can or bottle of beer,
one glass of wine, one can or bottle of wine cooler, one cocktail, or one shot of liquor.
“During the past 30 days, on how many days did you have at least one drink of any alcoholic beverage
such as beer, wine, a malt beverage, or liquor?”

COMMUNITY HEALTH NEEDS ASSESSMENT
172
Excessive Drinkers. Excessive drinking reflects the number of persons aged 18 years and over who drank 5
or more drinks during a single occasion (for men) or 4 or more drinks during a single occasion (for women)
during the past 30 days OR who averaged more than 2 drinks per day (for men) or more than 1 drink per day
(for women).
“On the day(s) when you drank, about how many drinks did you have on the average?”
“Considering all types of alcoholic beverages, how many times during the past 30 days did you have 5
(if male)/4 (if female) or more drinks on an occasion?”
Note the Healthy People 2020 target.
Current Drinkers
Sources: � PRC Community Health Surveys, Professional Research Consultants, Inc. [Item 160]
� Behavioral Risk Factor Surveillance System Survey Data. Atlanta, Georgia. United States Department of Health and Human Services, Centers for Disease Control
and Prevention (CDC): 2013 South Dakota data.
� 2013 PRC National Health Survey, Professional Research Consultants, Inc.
Notes: � Asked of all respondents.
� Current drinkers had at least one alcoholic drink in the past month.
58.1% 59.2%
2012 2015
59.2% 57.8% 56.5%
0%
20%
40%
60%
80%
100%
RCRH SD US
RCRH Service Area
Excessive DrinkersHealthy People 2020 Target = 25.4% or Lower
Sources: � PRC Community Health Surveys, Professional Research Consultants, Inc. [Item 164]� 2013 PRC National Health Survey, Professional Research Consultants, Inc.� US Department of Health and Human Services. Healthy People 2020. December 2010. http://www.healthypeople.gov [Objective SA-15]
Notes: � Asked of all respondents.� Excessive drinking reflects the number of persons aged 18 years and over who drank more than two drinks per day on average (for men) or more than one drink per day
on average (for women) OR who drank 5 or more drinks during a single occasion (for men) or 4 or more drinks during a single occasion (for women) during the past 30 days.
14.4%
23.2%
0%
20%
40%
60%
80%
100%
RCRH US
19.2%14.4%
2012 2015
RCRH Service Area

COMMUNITY HEALTH NEEDS ASSESSMENT
173
Excessive Drinkers(Total Area, 2015)
Healthy People 2020 Target = 25.4% or Lower
Sources: � 2015 PRC Community Health Survey, Professional Research Consultants, Inc. [Item 164]
� US Department of Health and Human Services. Healthy People 2020. December 2010. http://www.healthypeople.gov [Objective SA-15]
Notes: � Asked of all respondents.
� Hispanics can be of any race. Other race categories are non-Hispanic categorizations (e.g., "NH White" reflects non-Hispanic White respondents).
� Income categories reflect respondent's household income as a ratio to the federal poverty level (FPL) for their household size. “Very Low Income” includes
households with incomes less than 100% of the federal poverty level; “Low Income” includes households with incomes from 100–199% of the federal poverty level;
“Mid/High Income” includes households with incomes at 200% or more of the federal poverty level.
� Excessive drinking reflects the number of persons aged 18 years and over who drank more than two drinks per day on average (for men) or more than one drink
per day on average (for women) OR who drank 5 or more drinks during a single occasion (for men) or 4 or more drinks during a single occasion (for women) during
the past 30 days.
20.2%
8.8%
15.7% 16.6%
7.8% 8.9%
18.4%15.0%
11.4%14.4%
0%
20%
40%
60%
80%
100%
Men Women 18 to 39 40 to 64 65+ LowIncome
Mid/HighIncome
NH White Other Overall
Drinking & Driving. As a self-reported measure – and because this indicator reflects potentially illegal
behavior – it is reasonable to expect that it might be underreported, and that the actual incidence of drinking
and driving in the community is likely higher.
“During the past 30 days, how many times have you driven when you've had perhaps too much to
drink?”
Have Driven in the Past Month
After Perhaps Having Too Much to Drink
Sources: � PRC Community Health Surveys, Professional Research Consultants, Inc. [Item 65]
� 2013 PRC National Health Survey, Professional Research Consultants, Inc.
Notes: � Asked of all respondents.
1.6%5.0%
0%
20%
40%
60%
80%
100%
RCRH US
1.3% 1.6%
2012 2015
RCRH Service Area

COMMUNITY HEALTH NEEDS ASSESSMENT
174
Illicit Drug Use
“During the past 30 days, have you used an illegal drug or taken a prescription drug that was not
prescribed to you?”
Note the Healthy People 2020 target.
Illicit Drug Use in the Past MonthHealthy People 2020 Target = 7.1% or Lower
Sources: � PRC Community Health Surveys, Professional Research Consultants, Inc. [Item 66]
� 2013 PRC National Health Survey, Professional Research Consultants, Inc.
� US Department of Health and Human Services. Healthy People 2020. December 2010. http://www.healthypeople.gov [Objective SA-13.3]
Notes: � Asked of all respondents.
0.8% 1.2%
2012 2015
1.2%4.0%
0%
20%
40%
60%
80%
100%
RCRH US
RCRH Service Area
Alcohol & Drug Treatment
“Have you ever sought professional help for an alcohol or drug-related problem?”
Have Ever Sought Professional Help
for an Alcohol/Drug-Related Problem
Sources: � PRC Community Health Surveys, Professional Research Consultants, Inc. [Item 67]
� 2013 PRC National Health Survey, Professional Research Consultants, Inc.
Notes: � Asked of all respondents.
4.1% 4.9%
0%
20%
40%
60%
80%
100%
RCRH US
5.1% 4.1%
2012 2015
RCRH Service Area

COMMUNITY HEALTH NEEDS ASSESSMENT
175
Key Informant Input: Substance Abuse
The following chart outlines key informants’ perceptions of the severity of Substance Abuse as a problem in the
community:
Perceptions of Substance Abuse
as a Problem in the Community(Key Informants, 2015)
Sources: � PRC Online Key Informant Survey, Professional Research Consultants, Inc.
Notes: � Asked of all respondents.
53.2% 32.1% 11.4%
Major Problem Moderate Problem Minor Problem No Problem At All
Barriers to Treatment
Among those rating this issue as a “major problem,” the greatest barriers to accessing substance abuse
treatment are viewed as:
Lack of Facilities/Resources
Distance and lack of transportation. – Community/Business Leader (Butte County)
Transportation and cost. Some local services, but not full time and are often during the day when people need to work. – Other Health Provider (Custer County)
Although the city/county Detox program remains quite busy, we have few options for ongoing treatment of substance abuse, especially narcotic, both legal and illegal use. Patients from our community frequently drive to Pierre or Aberdeen or into Wyoming or Nebraska for access to necessary medications such as Suboxone or Methadone. I feel this leads to a very high rate of relapse that continues to threaten to health and livelihood of many in our community. I recently had a patient tell me she either had to drive to Aberdeen or she could just buy Suboxone on the street for $50, which she felt was much cheaper in the long run. However, she is missing great portions of her care, including a follow up by a professional trained to deal the mental health implications of drug abuse. – Physician (Pennington County)
Not in immediate community, have to travel at least 18 miles to access this service. – Other Health Provider (Lawrence County)
Location, acceptability to counseling socially, counseling in a timely manner, domestic denial. – Community/Business Leader (Lawrence County)
Lack of treatment centers for a number of offenders. – Physician (Pennington County)
There are very few programs available to people seeking these services. The programs that are available are expensive, take people away from their jobs and families and many times are located outside of the community. When treatment is completed, people are placed back into the same setting that initially caused the addiction. This may be the biggest challenge we face as a community. Substance abuse many times leads to loss of employment, domestic violence, child abuse and neglect, homelessness, hunger. – Social Services Provider (Pennington County)
The local treatment place closed. Many don't want assistance as they treat the pain in their lives with drugs instead of learning to overcome the pain, loneliness. – Community/Business Leader (Lawrence County)
There are limited agencies to help with substance abuse in an affordable manner. Most people can't afford to go to a treatment facility for 30-60 days so they try and do it on their own. Detox is available to help short term, but they are full a lot of the time and turn away. – Other Health Provider (Pennington County)
There are not very many programs available and often the affected person has to leave the community to

COMMUNITY HEALTH NEEDS ASSESSMENT
176
receive help. Substance use especially alcohol, is socially acceptable and when a person has an issue, it is very difficult to admit and then seek care. – Public Health Representative (Pennington County)
One substance abuse treatment center exists in the entire area. Often our addicts are placed in jail and aren't counseled on how to refrain from using once out of the system. – Other Health Provider (Oglala Lakota County)
Not enough treatment centers or options. – Other Health Provider (Pennington County)
I know very little about accessing substance abuse treatment in Lawrence County. This may because there is a lack of it, or because of my own short fall. Substance abuse is a tremendous issue in our community. – Community/Business Leader (Lawrence County)
Connecting with resources, lack of knowledge, peer pressure in young teens and adults. – Social Services Provider (Pennington County)
The amount of resources available compared to how many people we have who have a substance abuse problem. Our detoxification center, for many, is a revolving door. They are admitted to detox and then released only to be admitted again a short time later. This takes beds away from those that would use it to get the help they need and want. – Other Health Provider (Pennington County)
Very little help for substance abuse, especially for inpatient care. – Community/Business Leader (Pennington County)
We need a detox center that individuals could go to after the acute stage of their illness is managed. – Other Health Provider (Pennington County)
Waiting list for services, people not realizing they have a problem, insurance or cost of services, going to treatment again if they have gone before thinking it won't work again. – Social Services Provider (Pennington County)
Waiting too long for health. We have a hygienist in our family who sees "meth mouth" all the time, and there are no resources for the local dentist profession to use to encourage those with meth addictions to seek help. – Community/Business Leader (Pennington County)
Involuntary treatment process does not happen for chronic patients. – Social Services Provider (Pennington County)
Lack of good providers and lack of willingness by most to accept they have a problem. There is a huge need for more providers in this area. More education to those who have a problem to encourage them to get help. – Community/Business Leader (Pennington County)
Abstinence-only programs, zero tolerance for failure. Social stigma. The lack of effectiveness of programs. – Community/Business Leader (Pennington County)
Limited access to primary care. Transportation issues. Management of detox and lack of residential treatment programs and support. No inpatient chemical dependency unit. – Other Health Provider (Pennington County)
Not enough qualified substance abuse providers for outpatient, private treatment in the Black Hills. Patients avoid more public community resources. – Other Health Provider (Pennington County)
Lack of community resources and programs. – Physician (Pennington County)
The hospital in Rapid City does not have a substance abuse counselor. – Other Health Provider (Pennington County)
There are currently no inpatient Chemical Dependency Counselors. In addition, lack of transportation to and from treatment programs. – Other Health Provider (Pennington County)
Lack of resources. – Community/Business Leader (Pennington County)
Availability and cost of treatment programs. – Community/Business Leader (Pennington County)
Availability of programs. – Other Health Provider (Pennington County)
Funding and ability to get inpatient evaluations, making it easier for those with funding to get directly into an inpatient treatment program or have coverage for outpatient services. Alcohol related health problems such as detoxing, GI bleeds, Encephalopathy, pancreatitis, liver disease often see multiple re-admissions and it is up to the addict to get funding and seek treatment- which rarely happens. Families are met with "it will take 30 days" then the cycle continues. AA is the only cost free option. – Other Health Provider (Pennington County)

COMMUNITY HEALTH NEEDS ASSESSMENT
177
Funding. – Other Health Provider (Pennington County)
Funding, education and a way to travel to treatment. – Other Health Provider (Pennington County)
There is a lack of inpatient treatment options in the area. Programs that offer step-down programs and transitional housing are also lacking. There needs to be a treatment facility that does not allow passes for the first few weeks, because people need more time to become secure in their sobriety before being allowed on pass. Relapsing after treatment makes it difficult for people to believe they can achieve sobriety by accessing the treatment options offered in the community. People cannot afford the cost of the private facilities, and they think they cannot afford to leave their jobs and families to go to inpatient treatment. – Social Services Provider (Pennington County)
We have no local inpatient addiction recovery programs. – Community/Business Leader (Pennington County)
We have a large population who would benefit from inpatient treatment programs which are hard to get in to. There is limited outpatient Chemical Dependency counselors available as well. – Other Health Provider (Pennington County)
Lack of funded facilities other than the county jail. – Physician (Lawrence County)
Again, limited inpatient, long term programs and very limited detox beds. RCRH is being used as a detox center which is taking beds from more acute patients. – Other Health Provider (Pennington County)
Availability of treatment groups, professionals, and centers, the same is true of wider mental health issues. – Other Health Provider (Pennington County)
Denial, Motivation
Admitting they have a problem is the biggest problem. Emotional support from long suffering family members may be lacking. For some the cost of existing programs may be a barrier, for others there is government and private support to get into the programs. I also wonder how information is disseminated to the abusers themselves as well as to concerned family members. – Social Services Provider (Pennington County)
Self-awareness, prideful, cultural. – Social Services Provider (Pennington County)
Lack of people recognizing that they have a problem. – Other Health Provider (Pennington County)
Admitting they have a problem, homelessness, poverty, mental illness. – Other Health Provider (Pennington County)
Not thinking they have a problem, denial. Not knowing they can face life sober. Not knowing where to turn or who to ask for help. Not knowing what to do first or how to admit without being judged by friends, family, employers, etc. Not being able to afford treatment due to no insurance, transportation to the facility, etc. – Social Services Provider (Pennington County)
Individual's fear and motivation to change. – Other Health Provider (Pennington County)
Greatest barrier is that they don't see it as a problem. Women who are pregnant won't let us give their baby certain medications but yet there is a great increase in women who are delivering who are positive for marijuana and a greater increase in women who are positive for hardcore drugs, such as meth, amphetamines, cocaine and occasionally heroin. Another barrier is probably that they sometimes are in a bad situation that the drugs make them feel better so euphoria is bliss. – Other Health Provider (Pennington County)
Supportive and relationally healthy friends and family. Hope for a better future and a reason and desire to change. – Social Services Provider (Pennington County)
They don't feel they have a problem. – Public Health Representative (Meade County)
Failure to acknowledge they have a problem. – Other Health Provider (Pennington County)
My opinion, self-awareness and desire to stop. – Other Health Provider (Pennington County)
Denial, lack of will power or desire to change, mental health, inability to get to treatment center, peer pressures, homelessness and depression. – Social Services Provider (Pennington County)
Many do not see the need to discontinue using alcohol or drugs. Low rates of diagnosis of substance abuse issues. Access to programs for substance abuse. – Other Health Provider (Black Hills Region)
Motivation to better themselves and the costs to get treatment. – Community/Business Leader (Pennington County)

COMMUNITY HEALTH NEEDS ASSESSMENT
178
Desire to quit and inpatient treatment. – Other Health Provider (Lawrence County)
They don't want to quit so they don't feel the need to access a treatment program. Also the cost of treatment programs are a barrier. The lack of treatment programs that will assess patients while they are in the acute hospital for admittance to a treatment program. Why does the patient need to be evaluated for a treatment program after they get out of the hospital. Our detox unit is very inconsistent with who they will take back to the detox unit after the patient has been in the hospital for detoxing. – Other Health Provider (Pennington County)
The patient having willingness to change. Then once they do want to change there are no inpatient treatment centers on this side of the state. – Other Health Provider (Pennington County)
Lack of interest in changing their behaviors. Many are forced into treatment, and this has been proven ineffective. – Other Health Provider (Pennington County)
Themselves. People have to want to help themselves, but many of them do not. – Other Health Provider (Pennington County)
Affordable Care/Services
I feel the greatest barrier is that people feel that they won't have a supportive environment or people to come back to once they return from substance abuse treatment. There is not a lot for aftercare. I have also heard a lot of people say that they are afraid to lose their friends, who they feel would not want to be around them if they are sober. Money is also an issue and having access to care is another. – Other Health Provider (Oglala Lakota County)
Finance, personal image, education and support for treatment. – Other Health Provider (Lawrence County)
Culturally sensitive care and cost. – Social Services Provider (Pennington County)
A barrier to seeking treatment is affordability. Having insurance is not a guarantee that addiction treatment will be covered. Even when insurance does cover treatment, there might not be an accessible treatment center or provider in your local community. When a person is fortunate enough to receive treatment for addiction, it might not be at the same intensity or duration necessary to be effective. Another concern is that emotional and financial toll it take on the family. If using a person-centered approach, treatment will typically be longer than 30 days. This is not always acceptable if employed or a person has no support system in place. – Social Services Provider (Pennington County)
Lack of long term affordable care to treat substance abuse issues over a long period of time. We have a high number of chronic, long term abusers. – Other Health Provider (Pennington County)
Willingness to receive treatment, cost, many are uninsured. – Other Health Provider (Pennington County)
Money and availability for low income people to receive help. – Public Health Representative (Custer County)
Finances and money. – Other Health Provider (Lawrence County)
Financial. – Other Health Provider (Pennington County)
Finances, lack of guidance, lack of wanting to quit. – Other Health Provider (Pennington County)
Cost, availability of services and stigma. – Public Health Representative (Pennington County)
Cost and availability. I only know of detox and that is only temporary. – Physician (Pennington County)
Money. Health insurance. Lack of motivation to quit. Lack of support systems. – Community/Business Leader (Pennington County)
Cost. – Other Health Provider (Pennington County)
Low wages, inability to pay for services, lack of support. – Other Health Provider (Pennington County)
Available treatment that is not cost-prohibitive. – Social Services Provider (Pennington County)
Cost, limited resources and denial. – Other Health Provider (Pennington County)
Cost. – Community/Business Leader (Pennington County)
High-Risk Populations
Large population of low socioeconomic status people. – Other Health Provider (Pennington County)
We have many Native Americans living in the area that need assistance but have no resources or other

COMMUNITY HEALTH NEEDS ASSESSMENT
179
support. – Community/Business Leader (Pennington County)
It is such a complicated problem. This problem, like most of the problems I've tagged in this survey, is tied to poverty. Drugs and alcohol are cheap and much more accessible than services to combat them. Addiction is a disease, and drugs and alcohol help to numb the pain of some people's existence. To access some services clients must be sober, Cornerstone Mission, Hope Center. I understand why, but it is a barrier to some. Why should people get clean and sober if there are no jobs or opportunities, or better lives that are attainable if they do? - Social Services Provider (Pennington County)
Poverty. – Public Health Representative (Oglala Lakota County)
Many people live in poverty, have mental health issues and look for a way to self-medicate instead of seeking help for their problems. – Other Health Provider (Pennington County)
The homeless rate is extremely high with few resources for those individuals. A large majority of the homeless are plagued with mental health and substance abuse issues. – Other Health Provider (Pennington County)
People with substance abuse issues that are homeless are often placed in nursing homes inappropriately and substance abuse needs are not met. Need inpatient and transitional substance abuse treatment for individuals with inconsistent housing. – Other Health Provider (Pennington County)
According to several policemen I know, and recent demographic reports, most of the crime in Rapid City has some connection to substance abuse. There are several groups in town that deal with the symptoms and treatment, but our community should be looking at prevention. Broken families, single parent families, poverty, low level of education, low wages, low levels of personal responsibility, lack of affordable housing, etc. All of these circumstances may lead to excessive stress in individuals and families which may lead to substance abuse which is followed closely by many types of crimes... child abuse and neglect, domestic abuse, theft, assaults, and much more. This problem needs to be attached from many sides. We must grow a community of individuals who strive to be independent and support themselves rather than a community of individuals that are waiting for the government to provide everything for them. The good feeling of self-independence will spawn solutions. – Community/Business Leader (Pennington County)
This is very prevalent with particularly the young people. I think it is the change in the family unit and pressures on our young. – Community/Business Leader (Butte County)
We work with adolescents so I will answer accordingly. Not all adolescents need treatment for substance abuse. Even though they are using, early intervention could be utilized yet people don't seem to understand that the earlier a young person receives some form of intervention the less likely they will continue on to addiction. Once they are truly addicted if the agency that does a treatment needs assessment builds a relationship with the young person they will typically go to treatment, not all, but most. – Social Services Provider (Pennington County)
Substance abuse is a large problem in the community. Substance abuse does not discriminate and can be seen in all demographics. For those living in poverty it is harder to get support toward recovery due to cost which makes that demographic appear to have a greater abuse issue. The problem with that is that they do not have access to recovery as those who have the means do. – Social Services Provider (Pennington County)
Shame, Stigma
Pride. Lack of understanding and compassion from others. Fear that they won't get better. Treatment centers that are closer to home. – Community/Business Leader (Pennington County)
Shame, embarrassment, lack of awareness of treatment options. Lack of understanding of detox by healthcare providers. Lack of available detox centers or clinics. – Other Health Provider (Oglala Lakota County)
Stigma, costs of treatment, confidence in the system. –Other Health Provider (Oglala Lakota County)
Lack of confidentially, we are in a small town. – Public Health Representative (Meade County)
Being addicted. Cost. Stigma. – Other Health Provider (Pennington County)
Substance use in our community is exacerbated by cultural influences. The stigma surrounding substance abuse treatment is major barrier to accessing treatment. Education and awareness of addiction treatment options needs to be highlighted more frequently in our community. – Social Services Provider (Pennington County)

COMMUNITY HEALTH NEEDS ASSESSMENT
180
The stigma probably holds some people back. For people who have experienced trauma that has never been addressed they are using substances to cope. Substance abuse is seen by some to be a delinquent or criminal behavior, which it is sometimes, but if we are only looking at it that way and not addressing trauma, they will still have issues. Also, if we address child's needs and trauma earlier in life and be preventative, than our substance abuse issue becomes less severe. – Social Services Provider (Pennington County)
Patients are embarrassed. Some are too proud to ask for help. Withdrawals can be very difficult. – Other Health Provider (Pennington County)
Embarrassment and availability. – Other Health Provider (Pennington County)
Increasing Drug Problem
Meth use is on the rise so the first issue in treatment is prevention. Our state previously did a stop meth campaign that was effective. Federally, funding has been cut for prevention programs and is not being subsidized by the state. Treatment facilities, like Wellfully, rely on prevention programs as a major referring agent to identify higher needs. If you reduce prevention options and referring sources to treatment, then you increase barriers to care. – Social Services Provider (Pennington County)
The increase in street drugs, synthetics and alcohol use are directly linked to increases in violent crime in our community. The main barrier is structure of the drug and alcohol system in our state. Everything must begin with an assessment, an overpriced and useless method of determining use and needs. Furthermore there is usually a lengthy wait for the all-powerful assessment before anything can move forward in the legal system. It's really a joke, and does not help anyone with movement toward recovery. – Social Services Provider (Pennington County)
A major number of patients hospitalized at Rapid City Regional Hospital have an addiction to Alcohol ETOH. Some too to other drugs. ETOH is the most accepted of all "drugs" in our culture, other than tobacco. It is pervasive among the Native American population. There is not a week that goes by when I am working with the family of someone who is dying from ETOH abuse. Because it is accepted, often people deny that there is a problem. Many of our patients reside on a reservation and their access to treatment programs/AA etc. is minimal. Their desire to change is also minimal as it is a way of life. Often more than one family member is hospitalized with ETOH related conditions. – Social Services Provider (Pennington County)
Continued high use of prescription and non-prescription drug use throughout Western South Dakota. – Other Health Provider (Pennington County)
Methamphetamine use has jumped dramatically, also alcohol and other drugs, even tobacco. – Community/Business Leader (Pennington County)
Many of the people in our community struggle with this problem, again not dependent on age or race or financial situation. This is a problem with both drugs and alcohol. – Community/ Business Leader (Custer County)
Prescription drug abuse. – Other Health Provider (Pennington County)
Overuse of alcohol. – Physician (Black Hills region)
Many problems with substance abuse. – Physician (Lawrence County)
Co-occurrences
This seems to be an underlying concern for many other issues. – Community/Business Leader (Pennington County)
This may be closely related with mental health. On many occasions we refer those who under the influence to detox only to learn that they are released the very next day. There must be some way to coordinate efforts for long term support. – Community/Business Leader (Pennington County)
Availability of drugs and alcohol, peer pressure, education, moral issue, stigma, not knowing that it's available and acceptable behavior in their home. – Other Health Provider (Pennington County)
Addiction, availability of substances, lack of understanding about harm, not ready to quit, accepted in their peer group. – Social Services Provider (Pennington County)
Lack of Education
Knowledge. – Social Services Provider (Pennington County)
Information and funding. How does a person wanting treatment go about getting treatment, where do they
COMMUNITY HEALTH NEEDS ASSESSMENT
181
go, and how is it paid for? What do families do when concerned about a person not interested in treatment? There's a lot of confusion about how the system works and what options are available. Fear would decrease if information was readily available and if funding sources were an option for those who can't afford treatment, the majority. – Other Health Provider (Lawrence County)
Education and outreach. – Other Health Provider (Pennington County)
Lack of education, availability to access substances, lack of local assistance, parental acceptance of substance use. – Public Health Representative (Fall River County)
Cultural Acceptance
I would guess that it is an acceptable habit by the comments that I have heard. They drink when relatives show up even for the funeral of a person that died from alcoholism. The drug use other than alcohol also appears to be socially acceptable so treatment is not deemed necessary. I am not aware of the legal enforcement of drug abuse on the reservation or the DUI road monitoring but it does not seem to be a deterrent. From second hand information, even random drug screening among employees is not enforced and even discouraged so it would seem that it adds to the perception that it is acceptable behavior. – Physician (Oglala Lakota County)
As a society, we tolerate the use of substances and behavior that foreshadow abuse and addiction. It's like we "wink" at wrongful or destructive behavior until such a time it becomes truly destructive and an inconvenience or blight to our community. Example, you can't host a military function or chamber of commerce event without alcohol. In doing this we are saying, "We can't have an event without alcohol." What does this say to our youth? How many events encourage the perpetuation or steps toward addiction. Then, when we have an individual within our work teams with an addiction, they are usually on their own or with their family alone, to work their way through this. The stigma is huge. I agree people need to take responsibility for their actions. But don't we as a society need to assume responsibility for creating a climate of tolerance for behavior and activities that we know will lead some to a place of destruction. – Social Services Provider (Pennington County)
Most Problematic Substances
Key informants (who rated this as a “major problem”) most often identified alcohol,
methamphetamines or other amphetamines, and prescription medications as the most problematic
substances abused in the community.

COMMUNITY HEALTH NEEDS ASSESSMENT
182
Most
Problematic Second-Most Problematic
Third-Most Problematic
Total Mentions
Alcohol 80.3% 9.9% 5.9% 117
Methamphetamines or Other Amphetamines 13.1% 45.5% 23.7% 99
Prescription Medications 1.6% 18.2% 29.7% 59
Marijuana 2.5% 14.0% 15.3% 38
Synthetic Drugs (e.g. Bath Salts, K2/Spice) 1.6% 1.7% 9.3% 15
Cocaine or Crack 0.0% 2.5% 5.1% 9
Inhalants 0.0% 1.7% 5.1% 8
Over-The-Counter Medications 0.0% 2.5% 2.5% 6
Club Drugs (e.g. MDMA, GHB, Ecstasy, Molly) 0.8% 1.7% 1.7% 5
Heroin or Other Opioids 0.0% 2.5% 0.8% 4
Hallucinogens or Dissociative Drugs (e.g. Ketamine, PCP, LSD, DXM)
0.0% 0.0% 0.8% 1

COMMUNITY HEALTH NEEDS ASSESSMENT
183
Tobacco Use
About Tobacco Use
Tobacco use is the single most preventable cause of death and disease in the United States. Scientific knowledge about the
health effects of tobacco use has increased greatly since the first Surgeon General’s report on tobacco was released in 1964.
Tobacco use causes:
Cancer
Heart disease
Lung diseases (including emphysema, bronchitis, and chronic airway obstruction)
Premature birth, low birth weight, stillbirth, and infant death
There is no risk-free level of exposure to secondhand smoke. Secondhand smoke causes heart disease and lung cancer in
adults and a number of health problems in infants and children, including: severe asthma attacks; respiratory infections; ear
infections; and sudden infant death syndrome (SIDS).
Smokeless tobacco causes a number of serious oral health problems, including cancer of the mouth and gums, periodontitis,
and tooth loss. Cigar use causes cancer of the larynx, mouth, esophagus, and lung.
Healthy People 2020 (www.healthypeople.gov)
Cigarette Smoking
“Do you now smoke cigarettes every day, some days, or not at all?”
Note the Healthy People 2020 target.
Current SmokersHealthy People 2020 Target = 12.0% or Lower
Sources: � PRC Community Health Surveys, Professional Research Consultants, Inc. [Item 156]� 2013 PRC National Health Survey, Professional Research Consultants, Inc.� Behavioral Risk Factor Surveillance System Survey Data. Atlanta, Georgia. United States Department of Health and Human Services, Centers for Disease Control
and Prevention (CDC): 2013 South Dakota data.� US Department of Health and Human Services. Healthy People 2020. December 2010. http://www.healthypeople.gov [Objective TU-1.1]
Notes: � Asked of all respondents.� Includes regular and occasional smokers (those who smoke cigarettes everyday or on some days).
23.8%
14.8%
2012 2015
14.8%19.6%
14.9%
0%
20%
40%
60%
80%
100%
RCRH SD US
RCRH Service Area
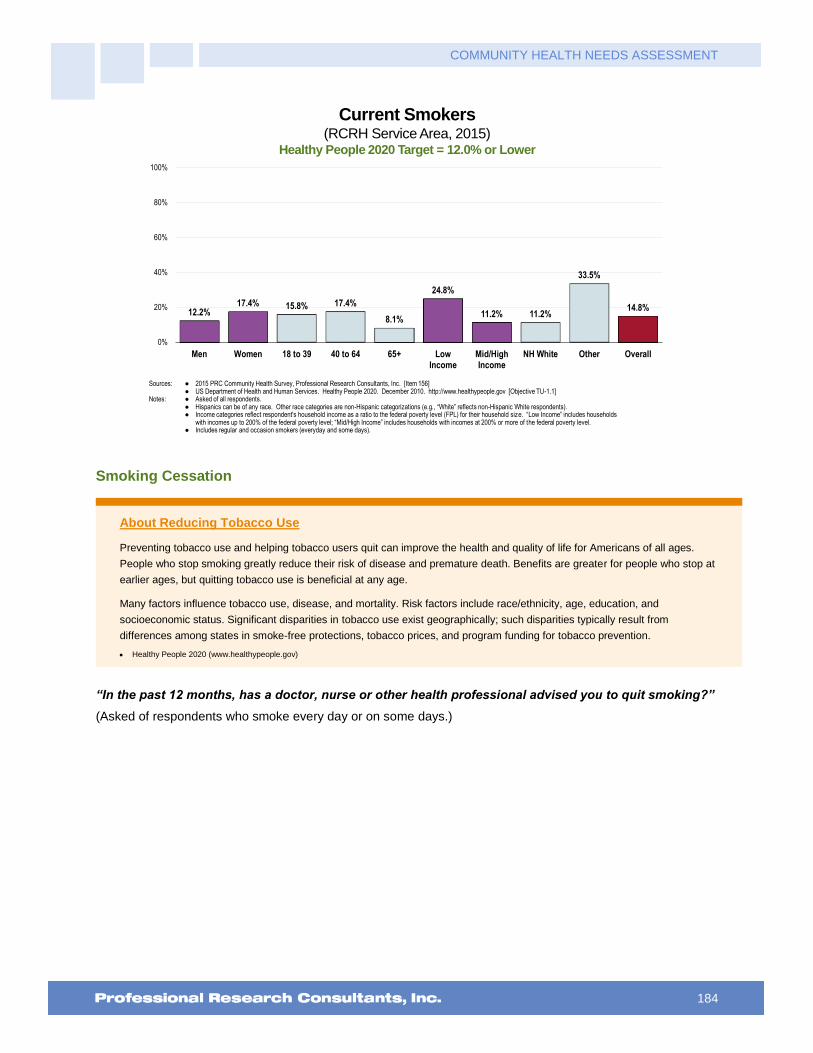
COMMUNITY HEALTH NEEDS ASSESSMENT
184
Current Smokers(RCRH Service Area, 2015)
Healthy People 2020 Target = 12.0% or Lower
Sources: � 2015 PRC Community Health Survey, Professional Research Consultants, Inc. [Item 156]� US Department of Health and Human Services. Healthy People 2020. December 2010. http://www.healthypeople.gov [Objective TU-1.1]
Notes: � Asked of all respondents.� Hispanics can be of any race. Other race categories are non-Hispanic categorizations (e.g., “White” reflects non-Hispanic White respondents).� Income categories reflect respondent's household income as a ratio to the federal poverty level (FPL) for their household size. “Low Income” includes households
with incomes up to 200% of the federal poverty level; “Mid/High Income” includes households with incomes at 200% or more of the federal poverty level. � Includes regular and occasion smokers (everyday and some days).
12.2%17.4% 15.8% 17.4%
8.1%
24.8%
11.2% 11.2%
33.5%
14.8%
0%
20%
40%
60%
80%
100%
Men Women 18 to 39 40 to 64 65+ LowIncome
Mid/HighIncome
NH White Other Overall
Smoking Cessation
About Reducing Tobacco Use
Preventing tobacco use and helping tobacco users quit can improve the health and quality of life for Americans of all ages.
People who stop smoking greatly reduce their risk of disease and premature death. Benefits are greater for people who stop at
earlier ages, but quitting tobacco use is beneficial at any age.
Many factors influence tobacco use, disease, and mortality. Risk factors include race/ethnicity, age, education, and
socioeconomic status. Significant disparities in tobacco use exist geographically; such disparities typically result from
differences among states in smoke-free protections, tobacco prices, and program funding for tobacco prevention.
Healthy People 2020 (www.healthypeople.gov)
“In the past 12 months, has a doctor, nurse or other health professional advised you to quit smoking?”
(Asked of respondents who smoke every day or on some days.)
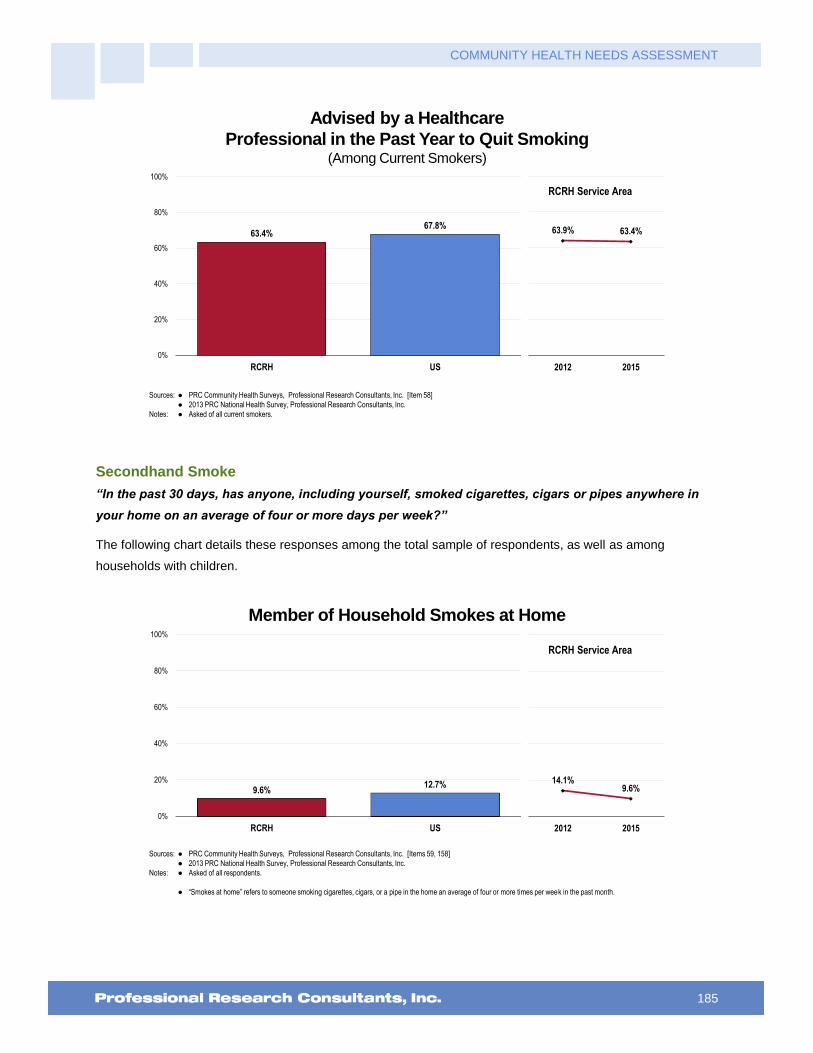
COMMUNITY HEALTH NEEDS ASSESSMENT
185
Advised by a Healthcare
Professional in the Past Year to Quit Smoking (Among Current Smokers)
Sources: � PRC Community Health Surveys, Professional Research Consultants, Inc. [Item 58]
� 2013 PRC National Health Survey, Professional Research Consultants, Inc.
Notes: � Asked of all current smokers.
63.4%67.8%
0%
20%
40%
60%
80%
100%
RCRH US
63.9% 63.4%
2012 2015
RCRH Service Area
Secondhand Smoke
“In the past 30 days, has anyone, including yourself, smoked cigarettes, cigars or pipes anywhere in
your home on an average of four or more days per week?”
The following chart details these responses among the total sample of respondents, as well as among
households with children.
Member of Household Smokes at Home
Sources: � PRC Community Health Surveys, Professional Research Consultants, Inc. [Items 59, 158]
� 2013 PRC National Health Survey, Professional Research Consultants, Inc.
Notes: � Asked of all respondents.
� “Smokes at home” refers to someone smoking cigarettes, cigars, or a pipe in the home an average of four or more times per week in the past month.
14.1%9.6%
2012 2015
9.6%12.7%
0%
20%
40%
60%
80%
100%
RCRH US
RCRH Service Area
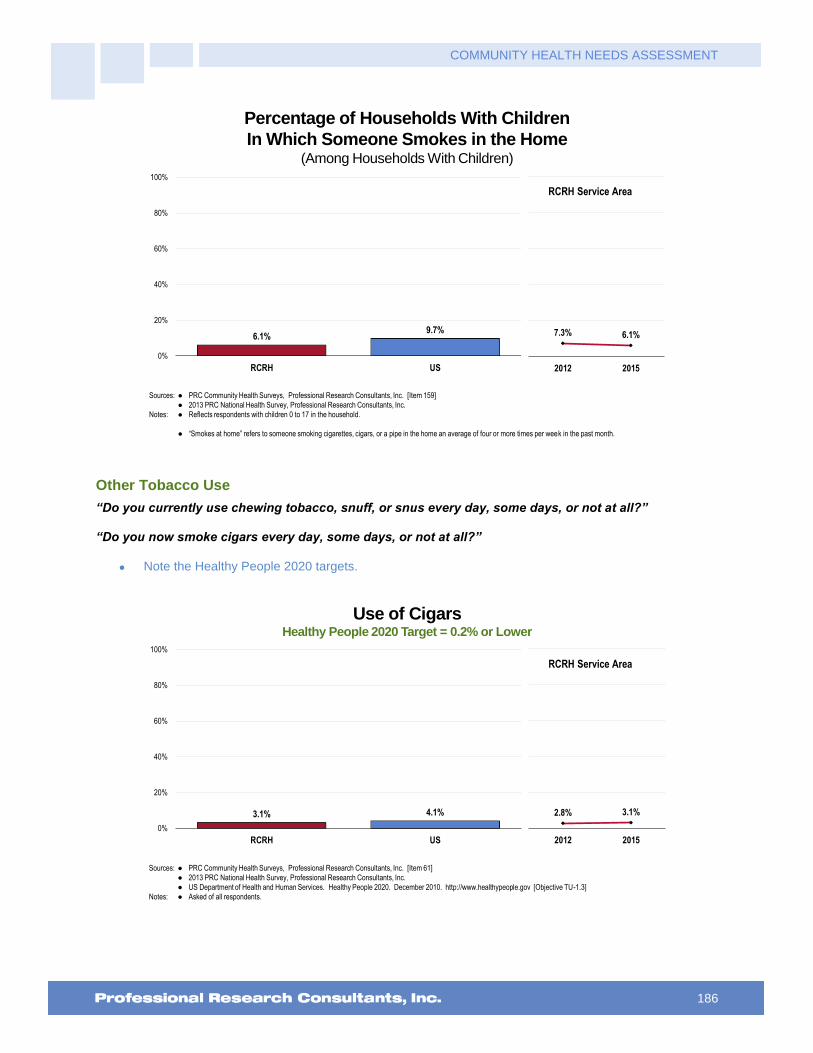
COMMUNITY HEALTH NEEDS ASSESSMENT
186
Percentage of Households With Children
In Which Someone Smokes in the Home(Among Households With Children)
Sources: � PRC Community Health Surveys, Professional Research Consultants, Inc. [Item 159]
� 2013 PRC National Health Survey, Professional Research Consultants, Inc.
Notes: � Reflects respondents with children 0 to 17 in the household.
� “Smokes at home” refers to someone smoking cigarettes, cigars, or a pipe in the home an average of four or more times per week in the past month.
6.1%9.7%
0%
20%
40%
60%
80%
100%
RCRH US
7.3% 6.1%
2012 2015
RCRH Service Area
Other Tobacco Use
“Do you currently use chewing tobacco, snuff, or snus every day, some days, or not at all?”
“Do you now smoke cigars every day, some days, or not at all?”
Note the Healthy People 2020 targets.
Use of CigarsHealthy People 2020 Target = 0.2% or Lower
Sources: � PRC Community Health Surveys, Professional Research Consultants, Inc. [Item 61]
� 2013 PRC National Health Survey, Professional Research Consultants, Inc.
� US Department of Health and Human Services. Healthy People 2020. December 2010. http://www.healthypeople.gov [Objective TU-1.3]
Notes: � Asked of all respondents.
2.8% 3.1%
2012 2015
3.1% 4.1%
0%
20%
40%
60%
80%
100%
RCRH US
RCRH Service Area

COMMUNITY HEALTH NEEDS ASSESSMENT
187
Use of Smokeless TobaccoHealthy People 2020 Target = 0.3% or Lower
Sources: � PRC Community Health Surveys, Professional Research Consultants, Inc. [Item 60]
� 2013 PRC National Health Survey, Professional Research Consultants, Inc.
� Behavioral Risk Factor Surveillance System Survey Data. Atlanta, Georgia. United States Department of Health and Human Services, Centers for Disease Control
and Prevention (CDC): 2013 South Dakota data.
� US Department of Health and Human Services. Healthy People 2020. December 2010. http://www.healthypeople.gov [Objective TU-1.2]
Notes: � Asked of all respondents.
� Smokeless tobacco includes chewing tobacco or snuff.
5.8% 6.2%
2012 2015
6.2% 6.6%4.0%
0%
20%
40%
60%
80%
100%
RCRH SD US
RCRH Service Area
Key Informant Input: Tobacco Use
The following chart outlines key informants’ perceptions of the severity of Tobacco Use as a problem in the
community:
Perceptions of Tobacco Use
as a Problem in the Community(Key Informants, 2015)
Sources: � PRC Online Key Informant Survey, Professional Research Consultants, Inc.
Notes: � Asked of all respondents.
34.1% 40.3% 19.4% 6.2%
Major Problem Moderate Problem Minor Problem No Problem At All
Top Concerns
Among those rating this issue as a “major problem,” reasons frequently related to the following:
Prevalence/Incidence
Continue to seek/smell tobacco presence with staff and families that I work with. – Social Services Provider (Pennington County)
High level of tobacco use. – Other Health Provider (Pennington County)
High percentage of patients use tobacco. – Other Health Provider (Pennington County)
At least 85% of the patients I interact with are dependent upon tobacco products. – Social Services Provider

COMMUNITY HEALTH NEEDS ASSESSMENT
188
(Pennington County)
Again the one of the highest level of tobacco usage is in Oglala Lakota County. There are no aggressive efforts being implemented to try and deter these levels. Everyone seems to be aware of the harmful effects of tobacco use but historically tobacco use has become a part of Native culture. if you smoke it is likely that you parents smoke, their parents smoked and their parents before them smoked. It becomes something that you just do to be social and then it becomes and addiction. – Other Health Provider (Oglala Lakota County)
Work with many patients and families who are tobacco users or have been and have resulting medical issues. – Other Health Provider (Pennington County)
Many people in the community smoke - Public Health Representative (Meade County)
I own rentals, low rent and it is difficult to find tenants who do not smoke. – Community/ Business Leader (Pennington County)
Tobacco use in the area is high among most demographics. The smoking bans have decreased some of the visibility but it is still a large issue. Tobacco is a drug and should be treated as such. – Social Services Provider (Pennington County)
In group settings the smell of nicotine is evident. Watching people who are smoking on the outskirts of the places of work although the area may be marked as a "No smoking area". – Other Health Provider (Pennington County)
Many people smoke who are admitted to the hospital. – Other Health Provider (Pennington County)
We have many in our community that are heavy users of tobacco. The detrimental health effects, affect all of us. They have increased medical care costs and put a strain on resources. – Other Health Provider (Pennington County)
I see numerous people still using tobacco along with seeing the effects of using tobacco. – Other Health Provider (Pennington County)
Many people still smoking and using chewing tobacco. – Other Health Provider (Lawrence County)
High rates of smoking among certain classes of society. – Physician (Pennington County)
This continues to be a large part of our population smokes. We see many health related issues in our Emergency Department and inpatient. – Other Health Provider (Lawrence County)
Despite knowing the negative effects of tobacco, many people in the community still use tobacco. – Social Services Provider (Pennington County)
With all of the prevention efforts over the past couple decades so intense, tobacco use is still very prevalent in our community. However as cigarette use goes down, smoke-less tobacco use is increasing. E-cigarette use is on the rise and is just as unhealthy and is finding other drugs in the hookah pens. – Social Services Provider (Pennington County)
Bad smoking habits. – Other Health Provider (Pennington County)
Statistical percentage of persons using tobacco. – Other Health Provider (Lawrence County)
Many people still smoke either because they just want to smoke or because they believe they can't quit after trying. Young people continue to start smoking in their teens. Smoking is not allowed in bars, restaurants and casinos but in order to get into any building one must run the gauntlet of all the smokers standing outside the buildings to smoke. – Other Health Provider (Lawrence County)
Too many people use tobacco. Too many young people start to use tobacco. Too many parents use tobacco products around their children. This is perpetuated by the high levels of tobacco use in and around gaming establishments in Deadwood. – Community/Business Leader (Lawrence County)
Wide spread tobacco use. – Public Health Representative (Fall River County)
Past statistics has shown Custer County to be a high tobacco use area. Education is widespread regarding the risk as it is elsewhere and choice to quit is difficult as it is everywhere else. Being as rural as the area is, it is likely the support for quitting is not as readily available as it may be elsewhere. There are still areas that do not have internet service that allow for full benefit of resources. – Other Health Provider (Custer County)
This seems to becoming chronic again. – Community/Business Leader (Pennington County)
I believe that nationwide the use of tobacco has been reduced to less than 20% of the population. I believe

COMMUNITY HEALTH NEEDS ASSESSMENT
189
here in Rapid City it is upwards of 30%, and a serious problem among young adults and teenagers. – Social Services Provider (Pennington County)
Not just a problem in my community. – Other Health Provider (Pennington County)
In our Western culture, we see a lot of smokeless tobacco use. Some cigarettes. – Public Health Representative (Meade County)
Population of long time smokers. – Other Health Provider (Pennington County)
I do not have a good answer to this question. I think that we have a legacy of smoking, parents who smoke often have children who smoke. In addition, maybe because of the number of people who work outside we have a higher incidence. I think that many of our youth do not expect to have a long life and that may make smoking more attractive. – Other Health Provider (Black Hills Region)
Youth
Not only is the number of adults using tobacco high but the number of adolescents I observe using is troubling. – Other Health Provider (Pennington County)
Any tobacco use is a problem. Young people can be seen smoking outside of buildings everywhere. – Other Health Provider (Pennington County)
Many young people smoking. – Physician (Lawrence County)
Tobacco use is a problem for several reasons. Youth are vulnerable to the hookah pipes and vapor pens that are sold under the label of non-addicting flavored smoke and promote not only tobacco addiction but the use of other substances in those pipes/pens. Tobacco use for teens used to be a citation, now the police department is so busy with other issues they are no longer addressing tobacco so the teens see this as approval. We know when teens break the law to smoke cigarettes it makes it just that much easier to break the law with other things. Teens becoming addicted to nicotine at an early age will cause ongoing increased health problems as they age. – Social Services Provider (Pennington County)
It appears that the target market is young, less educated and minority individuals. – Community/Business Leader (Pennington County)
Although smoking rates have gone down some, the last couple of years have seen some increases again especially in women and young adults. We also have a large number of users of smokeless tobacco in our western/ranch culture. – Other Health Provider (Pennington County)
Permissive parenting. Availability of tobacco. You see kids smoking all the time, they are not educated. – Community/Business Leader (Pennington County)
Young people still dipping. – Community/Business Leader (Butte County)
Comorbidities
The use of tobacco increases the incidence of cancer and heart disease, and complicates other diseases such as pulmonary diseases, asthma, COPD, multiple sclerosis, and decreases the body's ability to heal. – Social Services Provider (Pennington County)
Many patients being seen for heart disease and stroke list among their risk factors smoking. There are also a number of COPD patients that are due to smoking. – Physician (Oglala Lakota County)
Again this is a major reason people are seen in our Emergency Room and hospital as well as in the clinics. Heart disease, stroke, peripheral vascular disease, lung disease. Both young and old. – Physician (Pennington County)
We see related health problems from tobacco use. Especially in the working poor population who tend to rely on this crutch to deal with life issues that poverty or near poverty life has as a part of it. – Community/Business Leader (Pennington County)
Patients presenting with pulmonary issues and currently or have smoked. Evident with any walking about in the community and witness the number of individuals smoking tobacco or smokeless tobacco. – Other Health Provider (Lawrence County)
High cancer rates. – Community/Business Leader (Pennington County)
The number of people who have lung cancer. – Social Services Provider (Pennington County)
Many of our Emergency Room patients report they are smokers, even if they have health problems that are
COMMUNITY HEALTH NEEDS ASSESSMENT
190
directly impacted by smoking. – Other Health Provider (Pennington County)
Health Education
As I said previously with the loss of our traditions we see a loss of the sacredness of tobacco. Now it has become commercialized and it is addictive. It is often used as a coping mechanism as it is often related to mental health issues. Young people especially view smoking and chewing as something "cool to do" because their peers and older relatives do it. – Other Health Provider (Oglala Lakota County)
Even with the knowledge that tobacco use is harmful, many people still use tobacco. – Other Health Provider (Pennington County)
There is no logical explanation for why persons most unable to afford cigarettes continue to smoke. Perhaps smoking is seen as a freedom to those in poverty. The younger generation is perhaps less likely to believe the addictive power of nicotine and they are the least able to find the inner strength to quit. – Other Health Provider (Lawrence County)
People will spend money on cigarettes but they won't buy their medications that are prescribed. – Other Health Provider (Pennington County)
Still widely accepted in our community. Lack of education related to the South Dakota Quit Line. – Other Health Provider (Pennington County)
Lack of interest or lack of education in healthy behaviors. – Other Health Provider (Pennington County)
Lack of awareness about harm caused by tobacco use. Addiction from a young age. Peer group. – Social Services Provider (Pennington County)
Addiction
Habit confused with ritual use. Poor role modeling and lack of understanding of long term risks. – Other Health Provider (Oglala Lakota County)
Not sure how to respond to this question, however, I know tobacco is a problem for many and I know many who want to quit but struggle. A problem for minors as well. – Other Health Provider (Lawrence County)
Tobacco is very addictive. Many who smoke do not have the skills, knowledge, support or resources to stop this addiction. Tobacco seems to be considered by youth to be an adult activity and is "cool to do", an activity done to fit in. – Public Health Representative (Pennington County)
Nicotine is one of the most addictive drugs and for many lower income folks it's their only source of pleasure. It also helps them calm their nerves. Often they will go without other necessities so they can buy their cigarettes. – Community/Business Leader (Lawrence County)
I found that when one addiction has been addressed, if not dealt with properly, even though families may attend support groups, that one addiction is switched to another and if drinking was the major issue then the addiction switches to smoking or tobacco use. – Other Health Provider (Pennington County)
Lack of Prevention
The Spearfish Community Coalition has received a tobacco cessation grant from the state for the past two years based on the need for tobacco prevention. Also, the SCC has conducted the pride survey for five years in the Spearfish Middle School and High School. Students have self-reported a high use of tobacco, more than any other substance. – Community/Business Leader (Lawrence County)
The SD quit line is useful to have but the patients need to start at the primary care provider office to be referred. I think this needs lots more community education on how to quit smoking or using tobacco products or the effects of tobacco products on one’s health. – Other Health Provider (Pennington County)
Cessation Programs
Poor resources. There is the Quit line and compliance with medications/treatment. – Public Health Representative (Oglala Lakota County)
Not enough workplace benefits for helping stop use and promotion of these initiatives. – Other Health Provider (Pennington County)
Coping Mechanism
To cope with stresses of everyday life and to keep from overeating? - Social Services Provider (Pennington

COMMUNITY HEALTH NEEDS ASSESSMENT
191
County)
It is a comforting measure. – Other Health Provider (Pennington County)
E-Cigarettes
The new use of vapors and hookah lounges are actually entry level drugs for other tobacco use. – Social Services Provider (Pennington County)
Public Policy
Tobacco use continues to be an issue but I do think it has improved since smoking has been banned in restaurants and bars. – Other Health Provider (Custer County)
I think a lot of policy around tobacco use is just not enforced. We have seen what work policy can do in the tobacco realm, it is just a matter of replicating those successes and enforcing these policies. –Other Health Provider (Oglala Lakota County)
Statistics
Statistics indicate complications and continued smoking patterns and volume. – Other Health Provider (Pennington County)

COMMUNITY HEALTH NEEDS ASSESSMENT
192
Access to Health Services
Lack of Health Insurance Coverage (Age 18 to 64)
Survey respondents were asked a series of questions to determine their healthcare insurance coverage, if any,
from either private or government-sponsored sources. Here, lack of health insurance coverage reflects
respondents age 18 to 64 (thus excluding the Medicare population) who have no type of insurance coverage
for healthcare services – neither private insurance nor government-sponsored plans (e.g., Medicaid).
“Do you have any government-assisted healthcare coverage, such as Medicare, Medicaid (or another
state-sponsored program), or VA/military benefits?”
“Do you currently have: health insurance you get through your own or someone else's employer or
union; health insurance you purchase yourself; or, you do not have health insurance and pay for health
care entirely on your own?”
Note the Healthy People 2020 target of universal coverage.
Lack of Healthcare Insurance Coverage(Among Adults Age 18-64)
Healthy People 2020 Target = 0.0% (Universal Coverage)
Sources: � PRC Community Health Surveys, Professional Research Consultants, Inc. [Item 165]
� Behavioral Risk Factor Surveillance System Survey Data. Atlanta, Georgia. United States Department of Health and Human Services, Centers for Disease Control
and Prevention (CDC): 2013 South Dakota data.
� 2013 PRC National Health Survey, Professional Research Consultants, Inc.
� US Department of Health and Human Services. Healthy People 2020. December 2010. http://www.healthypeople.gov [Objective AHS-1]
Notes: � Asked of all respondents under the age of 65.
14.5% 14.2%
2012 2015
14.2% 14.9% 15.1%
0%
20%
40%
60%
80%
100%
RCRH SD US
RCRH Service Area
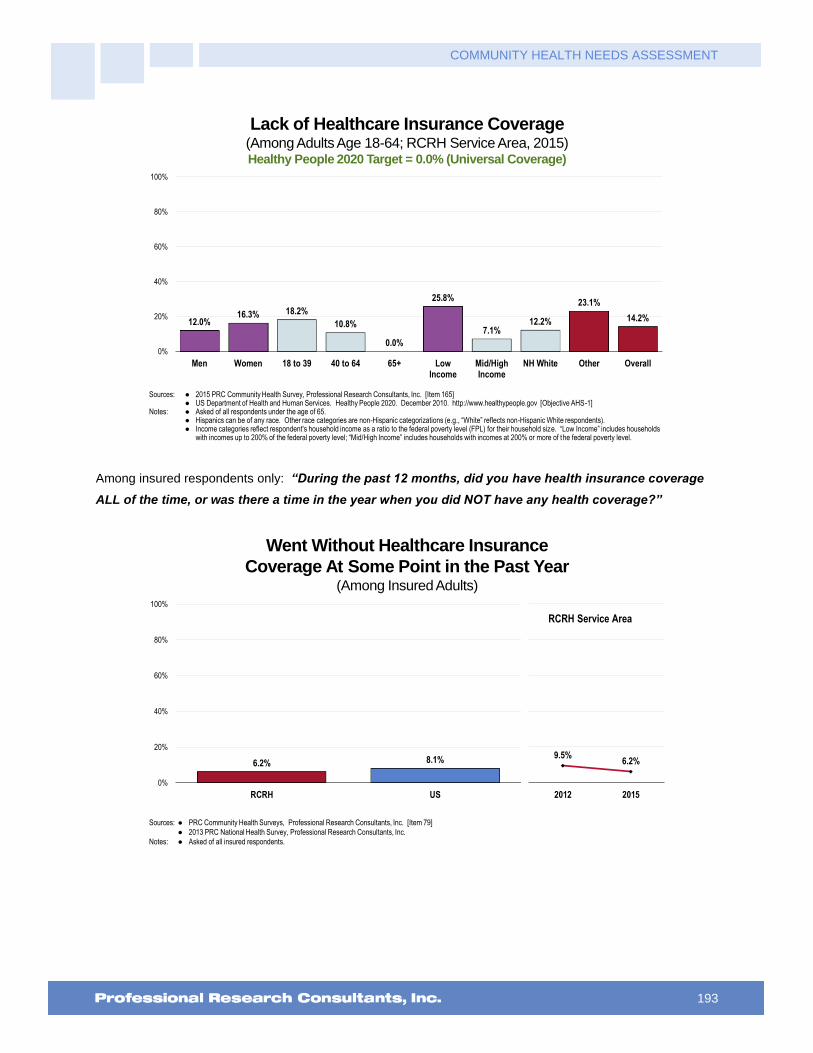
COMMUNITY HEALTH NEEDS ASSESSMENT
193
Lack of Healthcare Insurance Coverage(Among Adults Age 18-64; RCRH Service Area, 2015)Healthy People 2020 Target = 0.0% (Universal Coverage)
Sources: � 2015 PRC Community Health Survey, Professional Research Consultants, Inc. [Item 165]� US Department of Health and Human Services. Healthy People 2020. December 2010. http://www.healthypeople.gov [Objective AHS-1]
Notes: � Asked of all respondents under the age of 65.� Hispanics can be of any race. Other race categories are non-Hispanic categorizations (e.g., “White” reflects non-Hispanic White respondents).� Income categories reflect respondent's household income as a ratio to the federal poverty level (FPL) for their household size. “Low Income” includes households
with incomes up to 200% of the federal poverty level; “Mid/High Income” includes households with incomes at 200% or more of the federal poverty level.
12.0%16.3% 18.2%
10.8%
0.0%
25.8%
7.1%12.2%
23.1%
14.2%
0%
20%
40%
60%
80%
100%
Men Women 18 to 39 40 to 64 65+ LowIncome
Mid/HighIncome
NH White Other Overall
Among insured respondents only: “During the past 12 months, did you have health insurance coverage
ALL of the time, or was there a time in the year when you did NOT have any health coverage?”
Went Without Healthcare Insurance
Coverage At Some Point in the Past Year(Among Insured Adults)
Sources: � PRC Community Health Surveys, Professional Research Consultants, Inc. [Item 79]
� 2013 PRC National Health Survey, Professional Research Consultants, Inc.
Notes: � Asked of all insured respondents.
6.2% 8.1%
0%
20%
40%
60%
80%
100%
RCRH US
9.5%6.2%
2012 2015
RCRH Service Area

COMMUNITY HEALTH NEEDS ASSESSMENT
194
Difficulties Accessing Healthcare
About Access to Healthcare
Access to comprehensive, quality health care services is important for the achievement of health equity and for increasing the
quality of a healthy life for everyone. It impacts: overall physical, social, and mental health status; prevention of disease and
disability; detection and treatment of health conditions; quality of life; preventable death; and life expectancy.
Access to health services means the timely use of personal health services to achieve the best health outcomes. It requires
three distinct steps: 1) Gaining entry into the health care system; 2) Accessing a health care location where needed services
are provided; and 3) Finding a health care provider with whom the patient can communicate and trust.
Healthy People 2020 (www.healthypeople.gov)
Barriers to Healthcare Access
To better understand healthcare access barriers, survey participants were asked whether any of the following
barriers to access prevented them from seeing a physician or obtaining a needed prescription in the past year.
“Was there a time in the past 12 months when…
… you needed medical care, but had difficulty finding a doctor?”
… you had difficulty getting an appointment to see a doctor?”
… you needed to see a doctor, but could not because of the cost?”
… a lack of transportation made it difficult or prevented you from seeing a doctor or making a
medical appointment?”
… you were not able to see a doctor because the office hours were not convenient?”
… you needed a prescription medicine, but did not get it because you could not afford it?”
The percentages shown in the following chart reflect the total population, regardless of whether medical care
was needed or sought.
Barriers to Access Have
Prevented Medical Care in the Past Year
Sources: � PRC Community Health Surveys, Professional Research Consultants, Inc. [Items 7-12]
� 2013 PRC National Health Survey, Professional Research Consultants, Inc.
Notes: � Asked of all respondents.
18.1%13.8%
8.6%
16.7%11.1% 9.5%
20.2%14.5% 14.4% 12.1%
9.1%3.8%
17.0% 15.4%11.0%
18.2% 15.8%9.4%
0%
20%
40%
60%
80%
100%
Getting aDr Appointment
InconvenientOffice Hours
Findinga Doctor
Cost(Doctor Visit)
Cost(Prescriptions)
Lack ofTransportation
RCRH 2012 RCRH 2015 US

COMMUNITY HEALTH NEEDS ASSESSMENT
195
The following chart reflects the composite percentage of the total population experiencing problems accessing
healthcare in the past year (indicating one or more of the aforementioned barriers or any other problem not
specifically asked), again regardless of whether they needed or sought care.
Experienced Difficulties or Delays of Some Kind
in Receiving Needed Healthcare in the Past Year
Sources: � PRC Community Health Surveys, Professional Research Consultants, Inc. [Item 169]
� 2013 PRC National Health Survey, Professional Research Consultants, Inc.
Notes: � Asked of all respondents.
� Represents the percentage of respondents experiencing one or more barriers to accessing healthcare in the past 12 months.
37.2%39.9%
0%
20%
40%
60%
80%
100%
RCRH US
40.1%37.2%
2012 2015
RCRH Service Area
Experienced Difficulties or Delays of Some Kind
in Receiving Needed Healthcare in the Past Year(RCRH Service Area, 2015)
Sources: � 2015 PRC Community Health Survey, Professional Research Consultants, Inc. [Item 169]Notes: � Asked of all respondents.
� Represents the percentage of respondents experiencing one or more barriers to accessing healthcare in the past 12 months.� Hispanics can be of any race. Other race categories are non-Hispanic categorizations (e.g., “White” reflects non-Hispanic White respondents).� Income categories reflect respondent's household income as a ratio to the federal poverty level (FPL) for their household size. “Low Income” includes households
with incomes up to 200% of the federal poverty level; “Mid/High Income” includes households with incomes at 200% or more of the federal poverty level.
31.4%
42.8% 41.1%38.1%
26.8%
50.9%
30.5%34.6%
51.3%
37.2%
0%
20%
40%
60%
80%
100%
Men Women 18 to 39 40 to 64 65+ LowIncome
Mid/HighIncome
NH White Other Overall
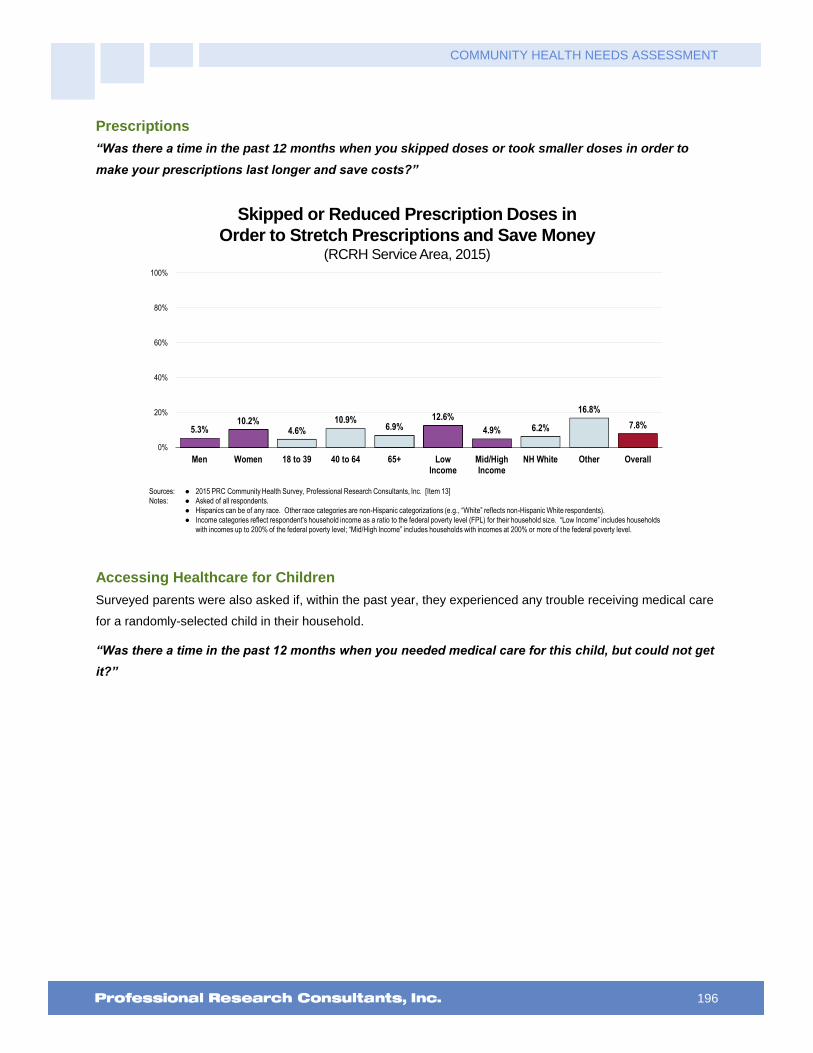
COMMUNITY HEALTH NEEDS ASSESSMENT
196
Prescriptions
“Was there a time in the past 12 months when you skipped doses or took smaller doses in order to
make your prescriptions last longer and save costs?”
Skipped or Reduced Prescription Doses in
Order to Stretch Prescriptions and Save Money(RCRH Service Area, 2015)
Sources: � 2015 PRC Community Health Survey, Professional Research Consultants, Inc. [Item 13]
Notes: � Asked of all respondents.
� Hispanics can be of any race. Other race categories are non-Hispanic categorizations (e.g., “White” reflects non-Hispanic White respondents).
� Income categories reflect respondent's household income as a ratio to the federal poverty level (FPL) for their household size. “Low Income” includes households
with incomes up to 200% of the federal poverty level; “Mid/High Income” includes households with incomes at 200% or more of the federal poverty level.
5.3%10.2%
4.6%10.9%
6.9%12.6%
4.9% 6.2%
16.8%
7.8%
0%
20%
40%
60%
80%
100%
Men Women 18 to 39 40 to 64 65+ LowIncome
Mid/HighIncome
NH White Other Overall
Accessing Healthcare for Children
Surveyed parents were also asked if, within the past year, they experienced any trouble receiving medical care
for a randomly-selected child in their household.
“Was there a time in the past 12 months when you needed medical care for this child, but could not get
it?”
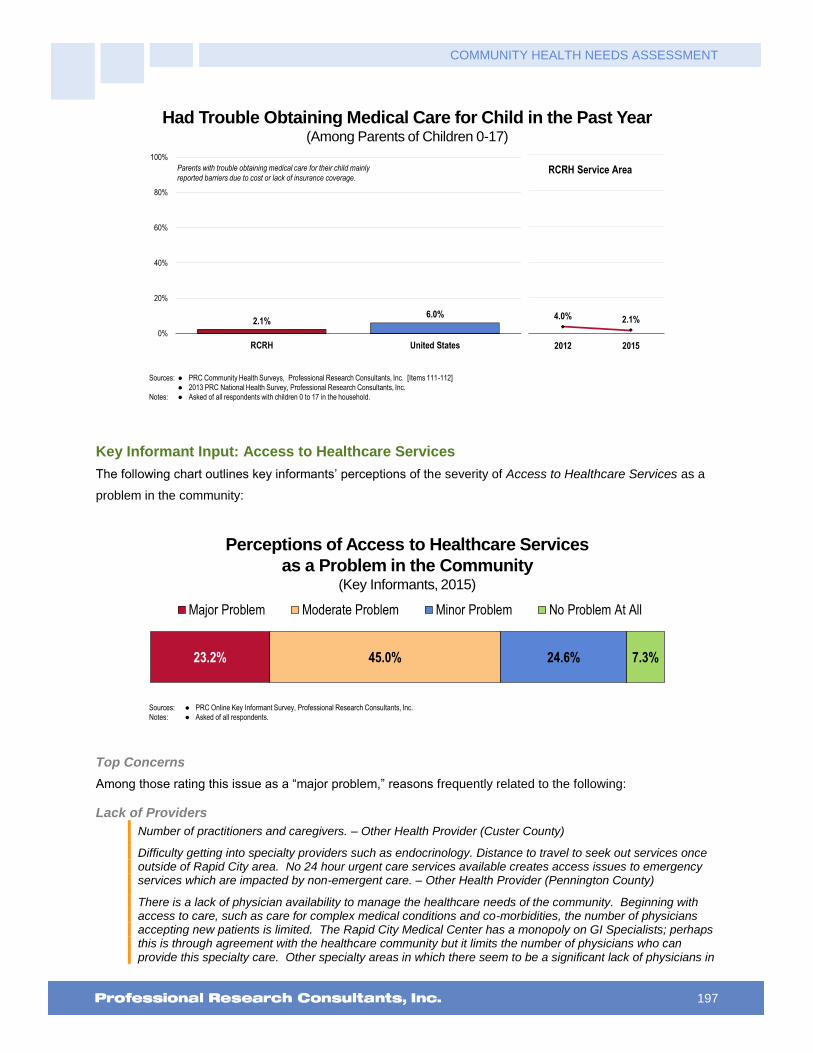
COMMUNITY HEALTH NEEDS ASSESSMENT
197
Had Trouble Obtaining Medical Care for Child in the Past Year(Among Parents of Children 0-17)
Sources: � PRC Community Health Surveys, Professional Research Consultants, Inc. [Items 111-112]
� 2013 PRC National Health Survey, Professional Research Consultants, Inc.
Notes: � Asked of all respondents with children 0 to 17 in the household.
2.1%6.0%
0%
20%
40%
60%
80%
100%
RCRH United States
Parents with trouble obtaining medical care for their child mainly
reported barriers due to cost or lack of insurance coverage.
4.0% 2.1%
2012 2015
RCRH Service Area
Key Informant Input: Access to Healthcare Services
The following chart outlines key informants’ perceptions of the severity of Access to Healthcare Services as a
problem in the community:
Perceptions of Access to Healthcare Services
as a Problem in the Community(Key Informants, 2015)
Sources: � PRC Online Key Informant Survey, Professional Research Consultants, Inc.
Notes: � Asked of all respondents.
23.2% 45.0% 24.6% 7.3%
Major Problem Moderate Problem Minor Problem No Problem At All
Top Concerns
Among those rating this issue as a “major problem,” reasons frequently related to the following:
Lack of Providers
Number of practitioners and caregivers. – Other Health Provider (Custer County)
Difficulty getting into specialty providers such as endocrinology. Distance to travel to seek out services once outside of Rapid City area. No 24 hour urgent care services available creates access issues to emergency services which are impacted by non-emergent care. – Other Health Provider (Pennington County)
There is a lack of physician availability to manage the healthcare needs of the community. Beginning with access to care, such as care for complex medical conditions and co-morbidities, the number of physicians accepting new patients is limited. The Rapid City Medical Center has a monopoly on GI Specialists; perhaps this is through agreement with the healthcare community but it limits the number of physicians who can provide this specialty care. Other specialty areas in which there seem to be a significant lack of physicians in

COMMUNITY HEALTH NEEDS ASSESSMENT
198
this area include endocrinology, psychiatry, infectious disease, internal medicine, and that is just the specialties that I can immediately recall. Chronic disease care is an area in which there is an increasing demand but not a corresponding increase in medical care availability. Hospice care is also a limited area of availability. Not all patients can be admitted to hospice because of their workload. – Other Health Provider (Pennington County)
Not enough primary care, people in remote areas have transportation issues. Specialty care is a major issue with the closest being Rapid City. People who can travel for specialty care will go to Sioux Falls, Billings or Denver. – Other Health Provider (Lawrence County)
There simply aren't enough providers in primary care and aren't physicians that are interested in coming to the region/area. – Other Health Provider (Pennington County)
Lack of primary care and internal medicine providers. Bad processes and bad customer service at the primary care clinic. – Other Health Provider (Lawrence County)
Our service area is very large and we have very few specialty opportunities. – Other Health Provider (Pennington County)
Access to specialty care. – Physician (Oglala Lakota County)
Lack of healthcare specialists. – Other Health Provider (Pennington County)
Dermatology is missing from the Deadwood-Lead Area. Skin cancer and skin issues are a major concern. – Community/Business Leader (Lawrence County)
Chronic health concerns that result in patients being re-admitted to the hospital frequently. There are many patients who readmit to the hospital with uncontrolled symptoms and pain due to chronic health issues and comorbid issues. Primarily due to not having a primary care physician to address these concerns with so they do not have to present themselves to the Emergency Department. – Other Health Provider (Pennington County)
Endocrinology, difficulty in referring patients. They won't see noncompliant patients which are the most difficult patients to manage. – Physician (Lawrence County)
Palliative care and end-of-life care. People with life-threatening illnesses have need for control of symptoms and for psychological and spiritual support, as well as help to decide the best medical care for their condition. They are often not aware of resources available to help, such as hospice care, or how to access them. – Physician (Pennington County)
Lack of specialty care for pediatric patients. Families must travel to access needed care. Impacts time out of work/school, arranging and funding travel expenses, prior authorization process that is increasingly restrictive, greater out of pocket costs if provider out of network. – Social Services Provider (Pennington County)
Palliative, end of life care, hospice house is a great start, however, more is needed. – Community/Business Leader (Pennington County)
Dermatology is an area that is not covered specifically here. – Community/Business Leader (Custer County)
Having enough healthcare providers, consistent healthcare providers. Lack of both, often causes mistrust in provider, if provider is not invested in my healthcare, why should I be, is often said. Follow up appointment are difficult to obtain and or wait time is astronomical. – Other Health Provider (Oglala Lakota County)
Lack and decrease in physicians in clinics over the last five years without new physicians coming to the community. Increased number of people without health insurance. – Other Health Provider (Lawrence County)
Availability of primary care providers in the area. It is very difficult for a well person, such as myself, to find a local primary care provider, let alone, a person with complex medical issues. – Other Health Provider (Pennington County)
Limited number of providers and difficult access to healthcare. Very difficult to get same day appointment. – Physician (Lawrence County)
There is not enough access to primary care. New patients have difficulty finding providers accepting new patients and when they do, often have to wait several weeks to months to get in to get established with that provider. Internal medicine is another area where patients are unable to find a provider who specializes in internal medicine to take care of their complex medical issues. Mental health access is very poor. It is often near impossible to see a mental health provider who is able to prescribe and manage medications. – Other

COMMUNITY HEALTH NEEDS ASSESSMENT
199
Health Provider (Lawrence County)
Lack of reliable transportation for low income families. – Social Services Provider (Pennington County)
Affordable Care/Services
It's hard for people with lesser means to afford healthcare and get to proper transportation to the services. – Community/Business Leader (Pennington County)
Lack of finances. – Other Health Provider (Pennington County)
Affordable healthcare services in an easy to access location. Access to specialized care for the uninsured. Fragmented availability. – Other Health Provider (Pennington County)
Healthcare for those that don't meet income guidelines to get health coverage. – Community/ Business Leader (Pennington County)
Money of course is always one of the biggest factors. Individual's motivation to change or comply with recommendations is also another. Mental health resources are limited with long waiting lists for Psychiatric evaluations for people who are indigent. Waiting lists for veterans and Native Americans continue to grow to address medical and psychiatric needs. Methamphetamine addiction continues to grow in our community. The need for a medical detox continues to rise with those afflicted with chronic addiction and medical issues. Medication-assisted therapies are not utilized in this area, despite proven research when dealing with opiate addiction, resulting in increased criminal behavior to get the drugs they are seeking. We have a substantial number of homeless/transients that frequent many resources within our community at a costly rate. This community needs to come together as a whole to focus on meeting basic needs of food, clothing and shelter to minimize these costs. – Other Health Provider (Pennington County)
Having affordable healthcare. The Obama proposal has helped somewhat, but there are those who do not qualify for subsidized healthcare because they make just enough, but can't afford to make the payments. Education is another issue with this. – Community/Business Leader (Pennington County)
Cost of care. People seem to be able to utilize Mayo Clinic in Minnesota for similar cost. – Community/Business Leader (Lawrence County)
We see too many that would be considered the working poor. They have health insurance, but cannot afford to access it due to high deductibles and/or co-pays. That leaves many of the less significant health issues being unaddressed and can lead to major health issues developing. There is a significant and growing need for more mental health services. There are not enough providers in general, not enough providers that will accept Medicaid, and not enough providers that will treat people with developmental or intellectual disabilities and have a co-occurring mental health diagnosis. This population is growing fast. There are not enough general practitioners that are both willing and able to work with people with developmental or intellectual disabilities. – Community/Business Leader (Pennington County)
Insurance coverage. Not whether they are covered, but what kind of coverage is realistically available. Many have moved to high deductible plans or are on Medicaid. – Physician (Lawrence County)
Healthcare for the elderly and indigent. Cost would be the major reason it's a problem, but also transportation availability. Yes, there are buses that operate in many areas of central Rapid City, and Dial-A-Ride is also available, but many times these are not convenient to the participant. I'm talking about having to walk to a bus stop or waiting a long time, several hours, for Dial-A-Ride to take someone home after a particularly exhausting procedure, like dialysis or chemo. – Social Services Provider (Pennington County)
South Dakota has not been willing to allow Medicaid expansion. – Social Services Provider (Pennington County)
The big challenge is financial. Contract health runs out of money on a continuous basis so services are denied. Transportations is a big issue a lot of our elderly cannot even drive and don't have dependable family to take them to their appointments. Family members work and cannot take the time off to take their elderly parents/kids for care. We could use more specialty clinics for arthritis, dermatology, cancers, children's dental needs and podiatry. Everything in general our clinics at IHS are overwhelmed. The waiting time is 4 or more hours to be seen. It's rare to get right through in a timely manner. Safe places to exercise for our diabetic people. A challenge to getting these clinics would be finding a suitable location. Transportation issues would still be an issue getting the patients to these clinics. More mobile clinics for x-ray, mammograms, CT. It seems unless you are dying you can't have an MRI, angiograms, preventive care. Every visit turns into a crisis situation. People wait. – Public Health Representative (Oglala Lakota County)
Cost, we still have a large number of uninsured people in our community. Not the very low income, they have

COMMUNITY HEALTH NEEDS ASSESSMENT
200
Medicaid, not the elderly they have Medicare. But middle and low income are falling through the cracks. Insurance is still very expensive. – Other Health Provider (Meade County)
I work with many people who are underinsured or not insured at all and for that reason they do not proactively access healthcare, instead end up using the Emergency Room. A large part of the problem is being able to get in with providers for uninsured/underinsured patients within a timely manner. When looking at mental health issues in Pennington County, this is a MAJOR issue. For lower income folks to get an appointment with a psychiatrist when their condition is still treatable on an outpatient level seems slim to none. Usually what ends up happening is the condition worsens until they need to be seen at the E.D. or West which is unfortunate for the client as well as the community expenses. Further, it is extremely frustrating that the Regional E.D. is run by "contract" providers which means patients are billed out of network, even if Regional is in their preferred network. This creates a lot of extra expense for the patient and community frustrations. – Social Services Provider (Pennington County)
The biggest challenge is for the population of low income families who don't have insurance, they are not getting healthcare needs met. Community clinics are full and Urgent Cares require payments up front, which is a huge deterrent for families with limited incomes. – Social Services Provider (Pennington County)
Lack of affordable health insurance. Too many people use the Emergency Room as their primary care provider. New Community Health Clinic needs to do extensive marketing of their services to get to the underserved. – Community/Business Leader (Pennington County)
High costs of health insurance and high deductibles prevent people from seeking care. Doctors who don't accept Medicaid patients. – Community/Business Leader (Pennington County)
The working poor and those below the Federal Poverty line have no access to insurance and thus wait much too long to take care of their medical needs. – Community/Business Leader (Lawrence County)
Access to income-based clinics. – Other Health Provider (Pennington County)
Lack of enough physicians who will accept Title 19, lack of transportation, lack of medical insurance, lack of income to pay for services. – Social Services Provider (Pennington County)
Medicare/Medicaid patients have problems getting primary care provider to accept them. – Other Health Provider (Pennington County)
Limited access to facilities that take Medicaid/Medicare. – Social Services Provider (Pennington County)
Cost is a big issue to accessing healthcare. With one Community Health Clinic to serve such a large population of uninsured and under insured it is not possible to provide all of the services necessary to provide care. Urgent care facilities are available but one must have payment at the time of service. This pushes people to use the Emergency Room repeatedly for their primary care. Also, geographically our community is very spread out. Public transportation is limited to many of the major health facilities. – Social Services Provider (Pennington County)
Cost, inability to pay for services. I also think families struggle with making payments. It appears that there are healthcare facilities in our area are not flexible with making payment arrangements. I have heard families complain about their outstanding bill being turned into collections before they have even had the opportunity to make payment arrangements. I understand the need for services to be paid for but adding stress to the family due to outstanding balances is not good either. – Other Health Provider (Pennington County)
Access to Care/Services
I feel access to medical care, especially mental health services and drug rehabilitation services, is the largest challenge in our community. There are no Psychiatrists taking new Medicaid patients. BMS has traditionally filled this role, but has severely limited the acceptance of new patients secondary to short-staffing. The Community Crisis Center is helpful, but only a small step in the right direction. Patients can be evaluated at Community Crisis, but then have significantly limited follow up options, leading to a very high risk of reoccurrence. – Physician (Pennington County)
All of western South Dakota suffers from severe shortage of primary care providers. Regardless of ethnicity or geographic location, it is difficult to get in to a family or internal medicine or primary care provider. To make it worse, the IHS fails to fulfill its obligation to care for Native American population and only provides limited primary care provider services. This area serves several different vulnerable population categories and all need access to primary care providers. – Other Health Provider (Pennington County)
Providing liaisons for those in need of healthcare that lack the capacity to seek out and obtain proper care. – Physician (Pennington County)

COMMUNITY HEALTH NEEDS ASSESSMENT
201
I hear many complaints in our community about lack of availability of primary care providers, as internal med providers in Rapid City continue to leave their practices for hospitalist positions. While NP and PA providers are valuable, community members complain that they are unable to access physician services and often wait weeks for appointments. – Other Health Provider (Pennington County)
Lack of outpatient adult primary care, particularly in the area of Internal Medicine. – Physician (Pennington County)
Physician coverage for patients in skilled nursing facilities is lacking tremendously. Physicians will not accept new patients to skilled nursing facilities. Many physicians will not cover their own patients in skilled nursing facilities either. – Other Health Provider (Pennington County)
Care of the geriatric patient that is admitted to long term skilled nursing facility. Many of the primary care physicians in our town will not care for their patient in the nursing home. – Other Health Provider (Pennington County)
Productive referral of all types of care for veterans: housing, mental, physical, general, substance abuse, behavioral and relationship. – Social Services Provider (Pennington County)
Can't get into local clinic. – Other Health Provider (Lawrence County)
The access to the physician or provider services is the biggest issue. We need as a community one central standardized place to seek medical care. Unified hospital and clinic system. – Other Health Provider (Lawrence County)
Availability of appropriate resources and affordability. – Other Health Provider (Pennington County)
The long wait to get in to see a doctor and the coordination between the facilities is beyond frustrating. The phone system is terrible, as is the helpfulness of those that finally answer. – Community/Business Leader (Lawrence County)
It takes at least a month to see any of the physicians at Massa Berry. – Other Health Provider (Meade County)
Long wait times for appointments. Uncoordinated care. – Physician (Lawrence County)
Primary care and specialty services are usually booked about many weeks in advance and it is hard to get into a provider to be seen. This creates delays in care and treatment. – Other Health Provider (Black Hills Region)
You have to wait way too long to get in to see any provider when you are ill. Rarely do you get to see your preferred provider. – Other Health Provider (Lawrence County)
We do not have enough providers to offer extended hours or to schedule patients in a timely fashion. We are often booked out 4-6 weeks. We are working on recruiting two new doctors. – Physician (Custer County)
Oglala Lakota County is such a rural area that often residents have to drive anywhere from 30-75 minutes to receive any form of healthcare be it outpatient or inpatient care. Also because of the rural setting coming by a quality provider and keeping them is an issue. Many times providers are overwhelmed by the amount of care that is needed for their patients. – Other Health Provider (Oglala Lakota County)
The distance they have to travel to receive care. The lack of healthcare insurance, hence much needed care becomes cost prohibitive if they need to travel for care without IHS referrals. The lack of resources for preventive care. The low health literacy. The lack of transportation to even access local healthcare facilities. – Other Health Provider (Oglala Lakota County)
Those without T19 cannot get into the care of a physician. – Other Health Provider (Pennington County)
One of the biggest challenges related to access to healthcare is that many people do not have confidence in the healthcare system. –Other Health Provider (Oglala Lakota County)
Transportation
Rural location so transportation to local hospitals and clinics is an issue. Wait times are long and often take a whole day. Referrals have to be made to see outside specialists because either those services are not provided or only provided once a month. Hard to keep specialized doctors in reservation clinics. It is also hard to get appointments in Rapid City to see specialists once the referral process finally goes through, often a wait of a month or two is normal. Financial difficulties in making appointments in Rapid City. Indian Health Service contract health issues have limited ability to pay for outside referrals and many people do not have private insurance. Sometimes Rapid City Regional will not accept patients as they are "full". – Other Health

COMMUNITY HEALTH NEEDS ASSESSMENT
202
Provider (Oglala Lakota County)
I feel transportation to and from services is a big issue. Many people walk to and from appointments and they are late or just cancel because they can't get there. I wish there was a fund or a corporation to help fund these services for people. This may not be a health issue but it could be for if they could have transportation to and from the appointments. They would have better follow up and manageable health conditions. Without the proper transportation, people are falling through the cracks and not getting proper healthcare. – Other Health Provider (Pennington County)
For a portion of our community there are residents who don't want vehicles. Others can only afford healthcare through IHS. Many times waiting to be seen takes up a good portion of their day and rescheduling doesn't work if you have little access to reliable transportation. – Social Services Provider (Pennington County)
People do not have adequate transportation to access services. – Other Health Provider (Oglala Lakota County)
Patients with limited transportation cannot get to appointments. Public transit systems do not run at times that work for appointments for patients. Services end too early in the day to meet patient's needs. Some clinic appointments, like dialysis, are not complete until 8:00 PM or later, leaving no options for patients to get home. CHR also provides wonderful services but needs more drivers and expanded times to meet patient needs. Patients that must travel from the reservations to Rapid City for needed services have limited options. Life flight is over used for medical issues due to poor compliance, costing too much to IHS, leaving no funding for other transportation. Dialysis needs more slots as to the nursing homes to provide patients options to receive cares in the home community. Dialysis units on the reservations need to provide services to avoid patients needing to travel and nursing homes on the reservations need to accept dialysis patients. – Other Health Provider (Pennington County)
Many of our people do not have transportation to go to the grocery store, not to mention doctor's appointments. – Other Health Provider (Pennington County)
Lack of transportation, lack of insurance. – Social Services Provider (Pennington County)
Transportation is a barrier in our community to accessing healthcare services. Lack of insurance to pay for health is another issue. At the IHS Indian Hospital getting an appointment to be seen for an appointment is a major issue. Lack of money to treat major health issues is always a problem for IHS. – Other Health Provider (Pennington County)
Transportation. – Other Health Provider (Pennington County)
The closest facility is at least 25 miles away. Many in our community have limited ways of traveling that distance due to age or no personal transportation. They have to rely on Prairie Hills that does not serve our community daily. – Community/Business Leader (Butte County)
Transportation and knowledge. Many people are unable to get from Lead to Deadwood for care and do not have a vehicle or the means to pay for a cab to get to Spearfish. Parents are under-educated about services available to get their children quality healthcare, and often skip it altogether because they are afraid of the cost, waiting to use emergency services as their family doctor. While the clinic provides free sports physicals in Deadwood, 70% of the school district youth live in Lead and are unable to get there. This means that they cannot participate in school sports, which is another strike against their health and well-being. Parents also fear bringing children in for care because they may be reported for abuse/neglect scenarios. There is not a solid, non-religious resource accessible to lead youth for sexual and reproductive health concerns. – Community/Business Leader (Lawrence County)
Prevention
Regional Health needs to focus on preventative health programs for the community. This is the main source of healthcare in the area and they are not as focused in the preventative programs as they are in the acute phases. While this focus is important, if we can help increase an individual's disease self-management, then the visits to the Emergency Department could decrease. Increase preventative doctor visits, increase healthier choices. – Other Health Provider (Pennington County)
Aggregate Wellness. Our community, like many, focus copious amounts of time and resources on ceaseless disease management. I respectfully suggest that we collaborate and reach towards proactive and when needed, reactive nutrition, fitness and overall mental, social, spiritual wellness as means to alleviate and advance our community. I think we can lead the nation if we work towards this noble intention. I thank you kindly for caring enough to ask and want to be part of the solution. – Community/Business Leader (Lawrence

COMMUNITY HEALTH NEEDS ASSESSMENT
203
County)
Our community could benefit greatly from promoting healthy living as an asset and an expectation. Healthcare could be viewed as a vehicle to stay healthy and strong, rather than something prescriptive to fix a problem. – Community/Business Leader (Pennington County)
Indian Health Services
Indian Health Services do not support the Native Americans and their health needs. They do not work with local hospitals to provide solutions and reimbursements. – Community/Business Leader (Pennington County)

COMMUNITY HEALTH NEEDS ASSESSMENT
204
Type of Care Most Difficult to Access
Key informants (who rated this as a “major problem”) most often identified mental health care, chronic
disease care, primary care, substance abuse treatment, and dental care as the most difficult to access
in the community.
Most Difficult to
Access
Second-Most Difficult to
Access
Third-Most Difficult to
Access
Total Mentions
Mental Health Care 44.3% 11.9% 10.5% 40
Chronic Disease Care 13.1% 15.3% 12.3% 24
Primary Care 16.4% 11.9% 7.0% 21
Substance Abuse Treatment 4.9% 13.6% 14.0% 19
Dental Care 9.8% 15.3% 5.3% 18
Specialty Care 3.3% 11.9% 12.3% 16
Pain Management 0.0% 11.9% 12.3% 14
Elder Care 1.6% 3.4% 8.8% 8
Urgent Care 1.6% 1.7% 5.3% 5
Prenatal Care 1.6% 1.7% 3.5% 4
Palliative Care 0.0% 0.0% 3.5% 2
All Types of Care 1.6% 0.0% 0.0% 1
Hospice Care 0.0% 0.0% 1.8% 1
Preventative Care 0.0% 0.0% 1.8% 1
Spiritual Care 1.6% 0.0% 0.0% 1
STI and Pregnancy Testing/Counseling for Youth 0.0% 0.0% 1.8% 1

COMMUNITY HEALTH NEEDS ASSESSMENT
205
Primary Care Services
About Primary Care
Improving health care services depends in part on ensuring that people have a usual and ongoing source of care. People with
a usual source of care have better health outcomes and fewer disparities and costs. Having a primary care provider (PCP) as
the usual source of care is especially important. PCPs can develop meaningful and sustained relationships with patients and
provide integrated services while practicing in the context of family and community. Having a usual PCP is associated with:
Greater patient trust in the provider
Good patient-provider communication
Increased likelihood that patients will receive appropriate care
Improving health care services includes increasing access to and use of evidence-based preventive services. Clinical
preventive services are services that: prevent illness by detecting early warning signs or symptoms before they develop into a
disease (primary prevention); or detect a disease at an earlier, and often more treatable, stage (secondary prevention).
Healthy People 2020 (www.healthypeople.gov)
Access to Primary Care
This indicator is relevant because a shortage of health professionals contributes to access and health status
issues.
177
PRC Community Health Needs AssessmentRCRH Service Area
Access to Primary Care(Number of Primary Care Physicians per 100,000 Population, 2012)
Sources: � US Department of Health & Human Services, Health Resources and Services Administration, Area Health Resource File: 2012.
� Retrieved November 2015 from Community Commons at http://www.chna.org.
Notes: � This indicator is relevant because a shortage of health professionals contributes to access and health status issues.
73.0
76.8
74.5
RCRH SD US
71
72
73
74
75
76
77
78
Specific Source of Ongoing Care
Having a specific source of ongoing care includes having a doctor’s office, clinic, urgent care center, walk-in
clinic, health center facility, hospital outpatient clinic, HMO or prepaid group, military/VA clinic, or some other
kind of place to go if one is sick or needs advice about his or her health. This resource is crucial to the concept
of “patient-centered medical homes” (PCMH).
“Is there a particular place that you usually go to if you are sick or need advice about your health?”
“What kind of place is it: a medical clinic, an urgent care center/walk-in clinic, a doctor's office, a

COMMUNITY HEALTH NEEDS ASSESSMENT
206
hospital emergency room, military or other VA healthcare, or some other place?”
The following chart illustrates the proportion of the RCRH Service Area population with a specific source of
ongoing medical care. Note that a hospital emergency room is not considered a specific source of ongoing
care in this instance.
Note the Healthy People 2020 objectives.
Have a Specific Source of Ongoing Medical CareHealthy People 2020 Target = 95.0% or Higher [All Ages]
Sources: � PRC Community Health Surveys, Professional Research Consultants, Inc. [Item 166]
� 2013 PRC National Health Survey, Professional Research Consultants, Inc.
� US Department of Health and Human Services. Healthy People 2020. December 2010. http://www.healthypeople.gov [Objective AHS-5.1]
Notes: � Asked of all respondents.
75.4% 74.7%
2012 2015
74.7% 76.3%
0%
20%
40%
60%
80%
100%
RCRH US
RCRH Service Area
Have a Specific Source of Ongoing Medical Care(RCRH Service Area, 2015)
Healthy People 2020 Target = 95.0% or Higher [All Ages]; ≥89.4% [18-64]; 100% [65+]
Sources: � 2015 PRC Community Health Survey, Professional Research Consultants, Inc. [Items 166-168]� US Department of Health and Human Services. Healthy People 2020. December 2010. http://www.healthypeople.gov [Objectives AHS-5.1, 5.3, 5.4]
Notes: � Asked of all respondents.� Hispanics can be of any race. Other race categories are non-Hispanic categorizations (e.g., “White” reflects non-Hispanic White respondents).� Income categories reflect respondent's household income as a ratio to the federal poverty level (FPL) for their household size. “Low Income” includes households
with incomes up to 200% of the federal poverty level; “Mid/High Income” includes households with incomes at 200% or more of the federal poverty level.
70.9%
78.5%
67.9%
77.9% 78.9%76.1%
70.6%76.0%
67.1%
74.7%
0%
20%
40%
60%
80%
100%
Men Women 18 to 39 40 to 64 65+ LowIncome
Mid/HighIncome
NH White Other Overall

COMMUNITY HEALTH NEEDS ASSESSMENT
207
Utilization of Primary Care Services
Adults: “A routine checkup is a general physical exam, not an exam for a specific injury, illness or
condition. About how long has it been since you last visited a doctor for a routine checkup?”
Children: “About how long has it been since this child visited a doctor for a routine checkup or general
physical exam, not counting visits for a specific injury, illness, or condition?”
Have Visited a Physician for a Checkup in the Past Year
Sources: � PRC Community Health Surveys, Professional Research Consultants, Inc. [Item 17]
� Behavioral Risk Factor Surveillance System Survey Data. Atlanta, Georgia. United States Department of Health and Human Services, Centers for Disease Control
and Prevention (CDC): 2013 South Dakota data.
� 2013 PRC National Health Survey, Professional Research Consultants, Inc.
Notes: � Asked of all respondents.
66.9% 67.8%65.0%
0%
20%
40%
60%
80%
100%
RCRH SD US
59.8%
66.9%
2012 2015
RCRH Service Area
Have Visited a Physician for a Checkup in the Past Year(RCRH Service Area, 2015)
Sources: � 2015 PRC Community Health Survey, Professional Research Consultants, Inc. [Item 17]
Notes: � Asked of all respondents.
� Hispanics can be of any race. Other race categories are non-Hispanic categorizations (e.g., “White” reflects non-Hispanic White respondents).
� Income categories reflect respondent's household income as a ratio to the federal poverty level (FPL) for their household size. “Low Income” includes households
with incomes up to 200% of the federal poverty level; “Mid/High Income” includes households with incomes at 200% or more of the federal poverty level.
64.3%69.7%
51.9%
68.3%
90.9%
53.4%
68.7% 66.4%72.0%
66.9%
0%
20%
40%
60%
80%
100%
Men Women 18 to 39 40 to 64 65+ LowIncome
Mid/HighIncome
NH White Other Overall

COMMUNITY HEALTH NEEDS ASSESSMENT
208
Child Has Visited a Physician
for a Routine Checkup in the Past Year(Among Parents of Children 0-17)
Sources: � PRC Community Health Surveys, Professional Research Consultants, Inc. [Item 113]
� 2013 PRC National Health Survey, Professional Research Consultants, Inc.
Notes: � Asked of all respondents with children 0 to 17 in the household.
79.4%84.1%
0%
20%
40%
60%
80%
100%
RCRH US
78.1% 79.4%
2012 2015
RCRH Service Area

COMMUNITY HEALTH NEEDS ASSESSMENT
209
Emergency Room Utilization
“In the past 12 months, how many times have you gone to a hospital emergency room about your own
health? This includes ER visits that resulted in a hospital admission.” (Responses below reflect the
percentage with two or more visits in the past year.)
Have Used a Hospital
Emergency Room More Than Once in the Past Year
Sources: � PRC Community Health Surveys, Professional Research Consultants, Inc. [Items 23-24]
� 2013 PRC National Health Survey, Professional Research Consultants, Inc.
Notes: � Asked of all respondents.
5.3%8.9%
0%
20%
40%
60%
80%
100%
RCRH US
9.8%5.3%
2012 2015
RCRH Service Area
Have Used a Hospital Emergency Room
More Than Once in the Past Year(RCRH Service Area, 2015)
Sources: � 2015 PRC Community Health Survey, Professional Research Consultants, Inc. [Item 23]
Notes: � Asked of all respondents.
� Hispanics can be of any race. Other race categories are non-Hispanic categorizations (e.g., “White” reflects non-Hispanic White respondents).
� Income categories reflect respondent's household income as a ratio to the federal poverty level (FPL) for their household size. “Low Income” includes households
with incomes up to 200% of the federal poverty level; “Mid/High Income” includes households with incomes at 200% or more of the federal poverty level.
5.7% 4.9% 6.7% 5.0% 3.7%9.7%
3.7% 4.8%8.8%
5.3%
0%
20%
40%
60%
80%
100%
Men Women 18 to 39 40 to 64 65+ LowIncome
Mid/HighIncome
NH White Other Overall

COMMUNITY HEALTH NEEDS ASSESSMENT
210
Oral Health
About Oral Health
Oral health is essential to overall health. Good oral health improves a person’s ability to speak, smile, smell, taste, touch, chew,
swallow, and make facial expressions to show feelings and emotions. However, oral diseases, from cavities to oral cancer,
cause pain and disability for many Americans. Good self-care, such as brushing with fluoride toothpaste, daily flossing, and
professional treatment, is key to good oral health. Health behaviors that can lead to poor oral health include: tobacco use;
excessive alcohol use; and poor dietary choices.
The significant improvement in the oral health of Americans over the past 50 years is a public health success story. Most of the
gains are a result of effective prevention and treatment efforts. One major success is community water fluoridation, which now
benefits about 7 out of 10 Americans who get water through public water systems. However, some Americans do not have
access to preventive programs. People who have the least access to preventive services and dental treatment have greater
rates of oral diseases. A person’s ability to access oral healthcare is associated with factors such as education level, income,
race, and ethnicity.
Barriers that can limit a person’s use of preventive interventions and treatments include: limited access to and availability of
dental services; lack of awareness of the need for care; cost; and fear of dental procedures.
There are also social determinants that affect oral health. In general, people with lower levels of education and income, and
people from specific racial/ethnic groups, have higher rates of disease. People with disabilities and other health conditions, like
diabetes, are more likely to have poor oral health.
Potential strategies to address these issues include:
Implementing and evaluating activities that have an impact on health behavior.
Promoting interventions to reduce tooth decay, such as dental sealants and fluoride use.
Evaluating and improving methods of monitoring oral diseases and conditions.
Increasing the capacity of State dental health programs to provide preventive oral health services.
Increasing the number of community health centers with an oral health component.
Healthy People 2020 (www.healthypeople.gov)
Dental Care
Adults: “About how long has it been since you last visited a dentist or a dental clinic for any reason?”
Children Age 2-17: “About how long has it been since this child visited a dentist or dental clinic?”
Note the Healthy People 2020 targets.

COMMUNITY HEALTH NEEDS ASSESSMENT
211
Have Visited a Dentist or
Dental Clinic Within the Past YearHealthy People 2020 Target = 49.0% or Higher
Sources: � PRC Community Health Surveys, Professional Research Consultants, Inc. [Item 21]� 2013 PRC National Health Survey, Professional Research Consultants, Inc.� US Department of Health and Human Services. Healthy People 2020. December 2010. http://www.healthypeople.gov [Objective OH-7]� Behavioral Risk Factor Surveillance System Survey Data. Atlanta, Georgia. United States Department of Health and Human Services, Centers for Disease Control
and Prevention (CDC): 2012 South Dakota data.Notes: � Asked of all respondents.
59.0%
71.4%
2012 2015
71.4% 70.9%65.9%
0%
20%
40%
60%
80%
100%
RCRH SD US
RCRH Service Area
Have Visited a Dentist or
Dental Clinic Within the Past Year(RCRH Service Area, 2015)
Healthy People 2020 Target = 49.0% or Higher
Sources: � 2015 PRC Community Health Survey, Professional Research Consultants, Inc. [Item 21]
� US Department of Health and Human Services. Healthy People 2020. December 2010. http://www.healthypeople.gov [Objective OH-7]
Notes: � Asked of all respondents.
� Hispanics can be of any race. Other race categories are non-Hispanic categorizations (e.g., “White” reflects non-Hispanic White respondents).
� Income categories reflect respondent's household income as a ratio to the federal poverty level (FPL) for their household size. “Low Income” includes households
with incomes up to 200% of the federal poverty level; “Mid/High Income” includes households with incomes at 200% or more of the federal poverty level.
71.4% 71.4% 69.7%73.4%
67.1%
60.6%
76.0%72.7%
63.6%
71.4%
0%
20%
40%
60%
80%
100%
Men Women 18 to 39 40 to 64 65+ LowIncome
Mid/HighIncome
NH White Other Overall
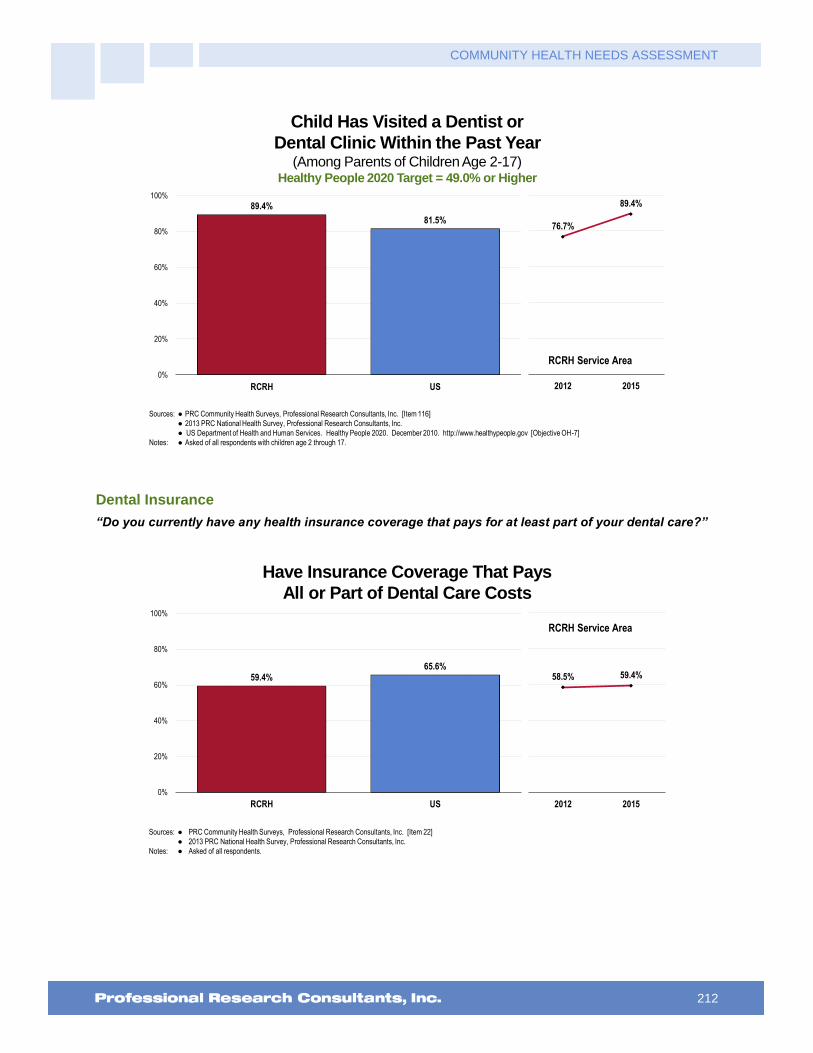
COMMUNITY HEALTH NEEDS ASSESSMENT
212
Child Has Visited a Dentist or
Dental Clinic Within the Past Year(Among Parents of Children Age 2-17)
Healthy People 2020 Target = 49.0% or Higher
Sources: � PRC Community Health Surveys, Professional Research Consultants, Inc. [Item 116]
� 2013 PRC National Health Survey, Professional Research Consultants, Inc.
� US Department of Health and Human Services. Healthy People 2020. December 2010. http://www.healthypeople.gov [Objective OH-7]
Notes: � Asked of all respondents with children age 2 through 17.
76.7%
89.4%
2012 2015
89.4%
81.5%
0%
20%
40%
60%
80%
100%
RCRH US
RCRH Service Area
Dental Insurance
“Do you currently have any health insurance coverage that pays for at least part of your dental care?”
Have Insurance Coverage That Pays
All or Part of Dental Care Costs
Sources: � PRC Community Health Surveys, Professional Research Consultants, Inc. [Item 22]
� 2013 PRC National Health Survey, Professional Research Consultants, Inc.
Notes: � Asked of all respondents.
59.4%65.6%
0%
20%
40%
60%
80%
100%
RCRH US
58.5% 59.4%
2012 2015
RCRH Service Area
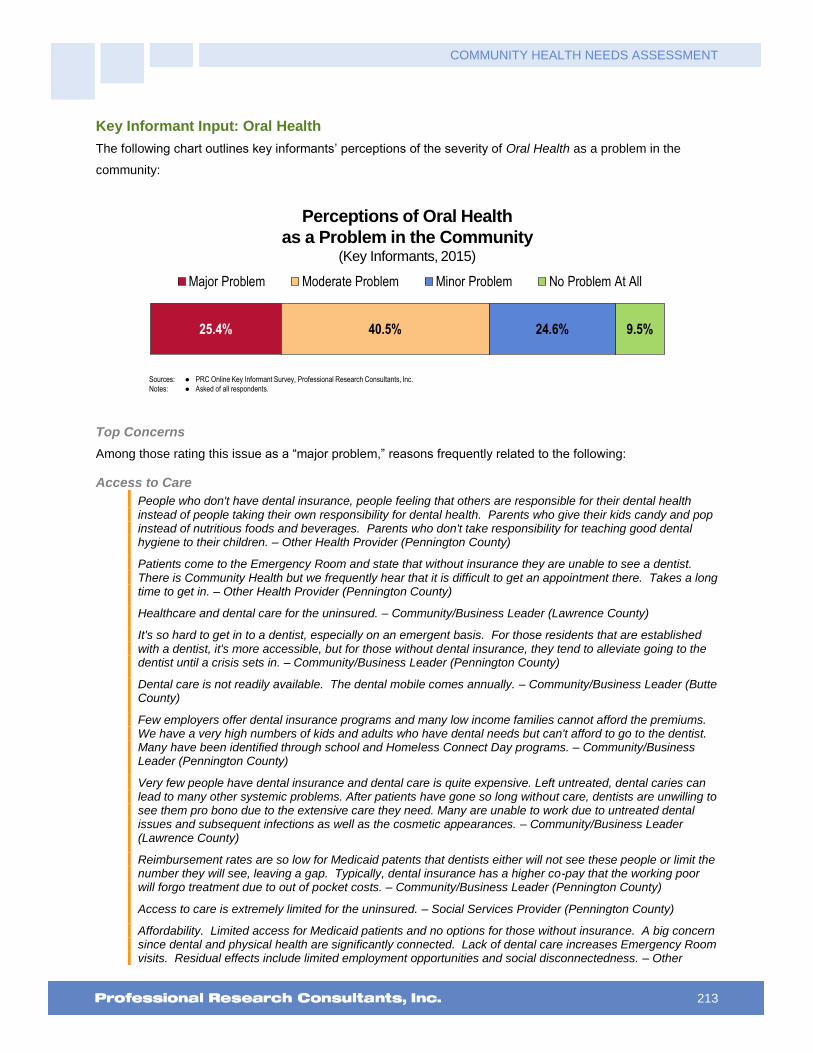
COMMUNITY HEALTH NEEDS ASSESSMENT
213
Key Informant Input: Oral Health
The following chart outlines key informants’ perceptions of the severity of Oral Health as a problem in the
community:
Perceptions of Oral Health
as a Problem in the Community(Key Informants, 2015)
Sources: � PRC Online Key Informant Survey, Professional Research Consultants, Inc.
Notes: � Asked of all respondents.
25.4% 40.5% 24.6% 9.5%
Major Problem Moderate Problem Minor Problem No Problem At All
Top Concerns
Among those rating this issue as a “major problem,” reasons frequently related to the following:
Access to Care
People who don't have dental insurance, people feeling that others are responsible for their dental health instead of people taking their own responsibility for dental health. Parents who give their kids candy and pop instead of nutritious foods and beverages. Parents who don't take responsibility for teaching good dental hygiene to their children. – Other Health Provider (Pennington County)
Patients come to the Emergency Room and state that without insurance they are unable to see a dentist. There is Community Health but we frequently hear that it is difficult to get an appointment there. Takes a long time to get in. – Other Health Provider (Pennington County)
Healthcare and dental care for the uninsured. – Community/Business Leader (Lawrence County)
It's so hard to get in to a dentist, especially on an emergent basis. For those residents that are established with a dentist, it's more accessible, but for those without dental insurance, they tend to alleviate going to the dentist until a crisis sets in. – Community/Business Leader (Pennington County)
Dental care is not readily available. The dental mobile comes annually. – Community/Business Leader (Butte County)
Few employers offer dental insurance programs and many low income families cannot afford the premiums. We have a very high numbers of kids and adults who have dental needs but can't afford to go to the dentist. Many have been identified through school and Homeless Connect Day programs. – Community/Business Leader (Pennington County)
Very few people have dental insurance and dental care is quite expensive. Left untreated, dental caries can lead to many other systemic problems. After patients have gone so long without care, dentists are unwilling to see them pro bono due to the extensive care they need. Many are unable to work due to untreated dental issues and subsequent infections as well as the cosmetic appearances. – Community/Business Leader (Lawrence County)
Reimbursement rates are so low for Medicaid patents that dentists either will not see these people or limit the number they will see, leaving a gap. Typically, dental insurance has a higher co-pay that the working poor will forgo treatment due to out of pocket costs. – Community/Business Leader (Pennington County)
Access to care is extremely limited for the uninsured. – Social Services Provider (Pennington County)
Affordability. Limited access for Medicaid patients and no options for those without insurance. A big concern since dental and physical health are significantly connected. Lack of dental care increases Emergency Room visits. Residual effects include limited employment opportunities and social disconnectedness. – Other

COMMUNITY HEALTH NEEDS ASSESSMENT
214
Health Provider (Lawrence County)
Lack of insurance, high costs even with insurance, providers not accepting Medicaid. Lack of providers, providers requiring payment at the time of services. Providers sending people away due to lack of ability to pay. Lack of faith in local providers. – Public Health Representative (Fall River County)
Without insurance, dental care is unaffordable and inaccessible. Very few dentists will see Medicaid patients. Delta Dental bus is only here occasionally and mostly sees children. The dental community should be ashamed of themselves for their lack of attention to real need. – Community/Business Leader (Pennington County)
Affordable Care/Services
In recent community needs assessment surveys the lack of affordable medical and dental services is always toward the top of the list. When people have limited income, dental care often falls to the bottom of the list of priorities. – Social Services Provider (Pennington County)
Many people cannot afford dental care, and not taking care of their teeth or oral health negatively impacts their overall health. – Social Services Provider (Pennington County)
Cost and education. Parents are not feeding their kids well, giving them juice and soda, causing oral health and dental issues from a very young age. Dental insurance is rare, and many people do not prioritize oral health as a result. – Community/Business Leader (Lawrence County)
Dental health services for low-income families. Right now if you are low income and you have a broken off tooth or other dental care needed, you will have to go to Community Health Dental at 6:30 AM and wait for a cancelation. If you are not one of the first three in line, waiting for them to open at 8:00 am, you will not be seen, and there is a good chance you will still not be seen if there are no cancelations that day. You could make an appointment, but it will be at least three months before you are seen and that will only be for the initial exam, not the treatment. – Social Services Provider (Pennington County)
Parents don't either care or have the resources to take the kids to the dentist. Many Medicaid patients have to go to Rapid, or that is the common perception at least. – Community/Business Leader (Lawrence County)
Dentists are very expensive and most people don't have coverage and if they do, it's a high deductible. – Social Services Provider (Pennington County)
Lack of oral or dental care in the community. – Other Health Provider (Oglala Lakota County)
A large number of patients do not have access to services. – Social Services Provider (Pennington County)
For those without insurance and money there are almost no options. Community health runs a clinic, but most patients are not able to get in, or the clinic is too full. – Physician (Pennington County)
Little access to affordable dental care. Many area dentists severely cap the number of Medicaid individuals they take. Low income and substance abuse issues compound dental needs. – Other Health Provider (Pennington County)
Lack of access to affordable oral healthcare. – Other Health Provider (Pennington County)
Affordable dental care is not available to the area population who do not have dental insurance. Dental problems lead to a cadre of health problems. – Other Health Provider (Pennington County)
Many young adults cannot afford dental care, are in college, have little or no income. – Social Services Provider (Pennington County)
Lack of Providers Accepting Medicaid/Medicare
The number of dentists that take Medicaid or free services is very few. – Community/Business Leader (Pennington County)
One dentist in town who does not accept Medicare or Medicaid and is expensive out of pocket. – Other Health Provider (Custer County)
Oral Health and Dental care is lacking in this area due to many oral care offices have limited appointments for Medicaid or self-pay patients. Community Health offers a dental office, but it is always full for the patients and some can't wait all day to be seen. More offices need to open up for Medicaid patients or self-pay patients. They are the ones with poor hygiene which leads into other health issues which eventually costs the state more money. – Other Health Provider (Pennington County)

COMMUNITY HEALTH NEEDS ASSESSMENT
215
Not enough Title XIX dentists. – Community/Business Leader (Pennington County)
No dental programs that accept new Medicaid patients - Public Health Representative (Meade County)
Medicaid patients and those that are poor have limited services available to them. – Other Health Provider (Pennington County)
Limited dental clinics take South Dakota Medicaid. Patients waiting for organ transplants need dental care prior to listing. Long waits for donated dental and community health. IHS has limited services. – Other Health Provider (Pennington County)
Providers do not accept Medicaid, which prohibits a large number of people from obtaining dental care. The Community Health Center of the Black Hills provides such care, but they are limited in numbers of people they can see. Patients with acute problems have to go the clinic and wait for a work-in appointment, which could be a long time. I have seen a dental problem turn into a medical problem with an infected tooth on a Pediatric patient was not taken care of. – Other Health Provider (Pennington County)
Most folks don't have dental coverage. Medicaid and Medicare don't cover enough. Leads to more health issues than we know. – Other Health Provider (Pennington County)
Poor Dental Health
Poor oral care. – Other Health Provider (Pennington County)
I see many people who need oral care for themselves and for their children. – Other Health Provider (Pennington County)
Many people have horrible dental hygiene and do not receive proper dental care for these issues. – Community/Business Leader (Lawrence County)
Lack of seeking treatment, lack of education about early dental care, nutrition. – Social Services Provider (Pennington County)
In talking with families, dental is the thing least prioritized. YFS with the "Dental Bus" provides several thousands of dollars of free care to kids on state assistance who can't get into dentist. Community Health has a dentist as does Indian Health Services but this is limited by the fact the person needs to meet criteria e.g. race or income. In observing people on a daily basis, there is much bad dentition in the world and I don't think people are just not wanting to go to the dentist. – Other Health Provider (Pennington County)
We see a lot of poor dentition in the hospital that contributes to the overall health of the patient while they are hospitalized, including sepsis-related problems. This is very prevalent in the Native American population. – Physician (Pennington County)
Lack of understanding of the long term exposure to regular and sugared drinks on dentition in toddlers. Lack of same on adults. Lack of prevention. Lack of dental providers working to preserve teeth. – Other Health Provider (Oglala Lakota County)
Poor dentation evident in clients as they present for healthcare and is evident in the general population as one interacts with the public. – Other Health Provider (Lawrence County)
Socioeconomics
Again, those living in poverty may not have insurance or cannot afford this basic care. And those who are able to get services do not get the higher level services that may be provided to others. They get teeth pulled rather than fixed. Many of those living in poverty have rotten teeth, various cavities, missing teeth, or pain. This isn't due to drugs in most cases but most often is due to bad oral health and basic dental care. – Social Services Provider (Pennington County)
Lack of education. Poor dental hygiene practices. Lack of providers to accept Title 19, poverty. – Social Services Provider (Pennington County)
My husband is an elementary school teacher so I am aware of the great need for dental services in lower income schools here. There is a dental bus that visits schools, but teachers are asked to choose just 10% of the neediest cases. It is a very big problem. The need exceeds the resources available. How can a child with a toothache concentrate, study or learn? If a child falls back in school by the age of 7, most often that child's fate is sealed. It is tragic and it happens all over in Rapid City. – Social Services Provider (Pennington County)

COMMUNITY HEALTH NEEDS ASSESSMENT
216
Lack of Resources
No dental facility in the area. They have to travel over 75 miles one way to see a dentist. – Public Health Representative (Meade County)
Always a shortage of dental providers. It is a struggle to access dental services as scheduling is only done once in a while. They treat primarily emergency dental patients as that is what seems to be the norm so that routine dental procedures are pushed out. I remember as a child we had a dental clinic in Manderson and they worked in collaboration with the schools to provide routine services and so our dental visits were always on time. – Other Health Provider (Oglala Lakota County)
Lack of Providers
There are a lack of dentists in our community, making it very hard to get an appointment. Appointments are scheduled months in advance and are difficult to cancel without waiting again for months. I have also heard within our community that not many dentists take Medicaid, making it hard for those individuals to get care. – Community/Business Leader (Lawrence County)
No pediatric dentist available. – Public Health Representative (Oglala Lakota County)
Native American Population
This is huge in the Native American population. Some of it is educationally based. – Community/Business Leader (Pennington County)

COMMUNITY HEALTH NEEDS ASSESSMENT
217
Vision Care
“When was the last time you had an eye exam in which the pupils were dilated? This would have made
you temporarily sensitive to bright light.” (Responses in the following chart represent those with an eye
exam within the past 2 years.)
See also Vision & Hearing in the Death, Disease & Chronic Conditions section of this report.
Had an Eye Exam in the Past Two
Years During Which the Pupils Were Dilated
Sources: � PRC Community Health Surveys, Professional Research Consultants, Inc. [Item 20]
� 2013 PRC National Health Survey, Professional Research Consultants, Inc.
Notes: � Asked of all respondents.
61.4%56.8%
0%
20%
40%
60%
80%
100%
RCRH US
62.8% 61.4%
2012 2015
RCRH Service Area
Health Literacy
“The next questions are about health information. How often is health information SPOKEN in a way
that is easy for you to understand? Would you say: always, nearly always, sometimes, seldom, or
never?”
“People who might help you read health information include family members, friends, caregivers,
doctors, nurses, or other health professionals. How often do you need to have someone help you read
health information? Would you say: always, nearly always, sometimes, seldom, or never?”

COMMUNITY HEALTH NEEDS ASSESSMENT
218
Health Information is “Seldom”
or “Never” Spoken in an Easily Understood Way
Sources: � 2015 PRC Community Health Survey, Professional Research Consultants, Inc. [Item 316]
Notes: � Asked of all respondents.
5.7%
0%
20%
40%
60%
80%
100%
RCRH
Health Information is “Seldom”
or “Never” Spoken in an Easily Understood Way(RCRH Service Area, 2015)
Sources: � 2015 PRC Community Health Survey, Professional Research Consultants, Inc. [Item 316]
Notes: � Asked of all respondents.
� Hispanics can be of any race. Other race categories are non-Hispanic categorizations (e.g., “White” reflects non-Hispanic White respondents).
� Income categories reflect respondent's household income as a ratio to the federal poverty level (FPL) for their household size. “Low Income” includes households
with incomes up to 200% of the federal poverty level; “Mid/High Income” includes households with incomes at 200% or more of the federal poverty level.
5.8% 5.5% 7.7%4.4% 4.4%
9.0%3.4% 4.4%
12.4%
5.7%
0%
20%
40%
60%
80%
100%
Men Women 18 to 39 40 to 64 65+ LowIncome
Mid/HighIncome
NH White Other Overall

COMMUNITY HEALTH NEEDS ASSESSMENT
219
“Always/Nearly Always” Need
Someone to Help Read Health Information
Sources: � 2015 PRC Community Health Survey, Professional Research Consultants, Inc. [Item 317]
Notes: � Asked of all respondents.
2.8%
0%
20%
40%
60%
80%
100%
RCRH
“Always/Nearly Always” Need
Someone to Help Read Health Information(RCRH Service Area, 2015)
Sources: � 2015 PRC Community Health Survey, Professional Research Consultants, Inc. [Item 317]
Notes: � Asked of all respondents.
� Hispanics can be of any race. Other race categories are non-Hispanic categorizations (e.g., “White” reflects non-Hispanic White respondents).
� Income categories reflect respondent's household income as a ratio to the federal poverty level (FPL) for their household size. “Low Income” includes households
with incomes up to 200% of the federal poverty level; “Mid/High Income” includes households with incomes at 200% or more of the federal poverty level.
3.1% 2.7% 4.2%1.0%
4.6% 5.1%2.0% 2.8% 3.4% 2.8%
0%
20%
40%
60%
80%
100%
Men Women 18 to 39 40 to 64 65+ LowIncome
Mid/HighIncome
NH White Other Overall
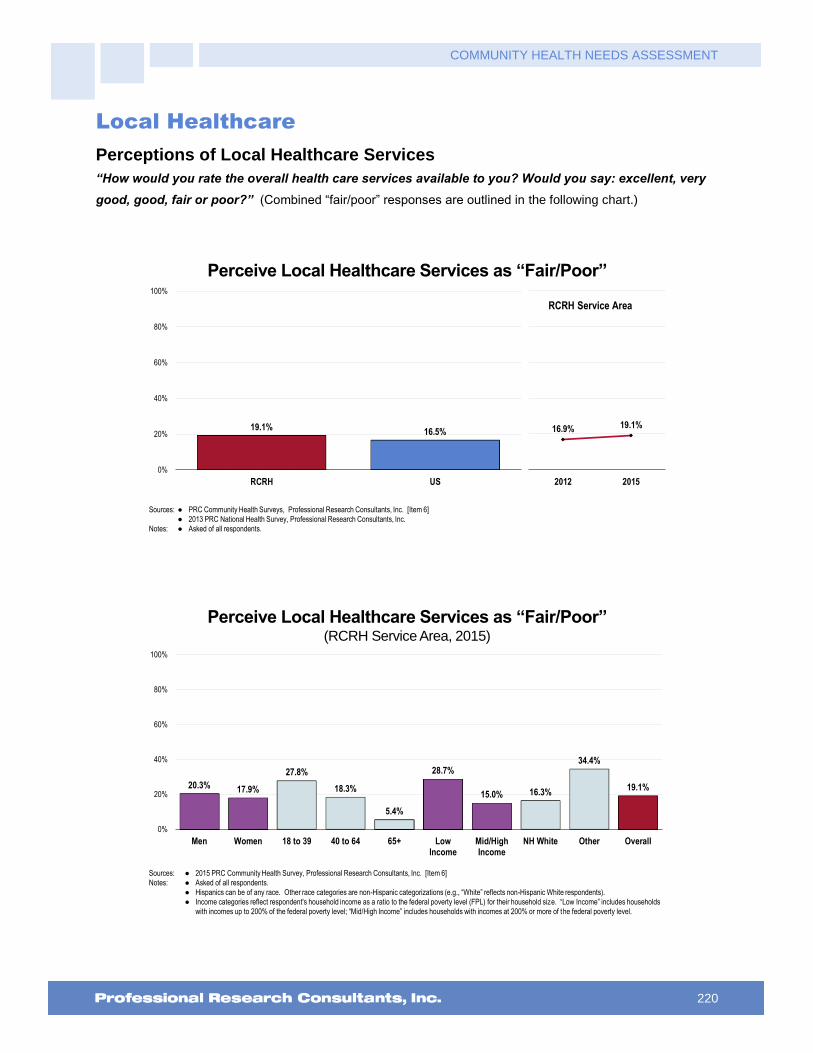
COMMUNITY HEALTH NEEDS ASSESSMENT
220
Local Healthcare
Perceptions of Local Healthcare Services
“How would you rate the overall health care services available to you? Would you say: excellent, very
good, good, fair or poor?” (Combined “fair/poor” responses are outlined in the following chart.)
Perceive Local Healthcare Services as “Fair/Poor”
Sources: � PRC Community Health Surveys, Professional Research Consultants, Inc. [Item 6]
� 2013 PRC National Health Survey, Professional Research Consultants, Inc.
Notes: � Asked of all respondents.
19.1%16.5%
0%
20%
40%
60%
80%
100%
RCRH US
16.9% 19.1%
2012 2015
RCRH Service Area
Perceive Local Healthcare Services as “Fair/Poor”(RCRH Service Area, 2015)
Sources: � 2015 PRC Community Health Survey, Professional Research Consultants, Inc. [Item 6]
Notes: � Asked of all respondents.
� Hispanics can be of any race. Other race categories are non-Hispanic categorizations (e.g., “White” reflects non-Hispanic White respondents).
� Income categories reflect respondent's household income as a ratio to the federal poverty level (FPL) for their household size. “Low Income” includes households
with incomes up to 200% of the federal poverty level; “Mid/High Income” includes households with incomes at 200% or more of the federal poverty level.
20.3% 17.9%
27.8%
18.3%
5.4%
28.7%
15.0% 16.3%
34.4%
19.1%
0%
20%
40%
60%
80%
100%
Men Women 18 to 39 40 to 64 65+ LowIncome
Mid/HighIncome
NH White Other Overall

COMMUNITY HEALTH NEEDS ASSESSMENT
221
Outmigration
“Is there any health care service for which you feel the need to leave the local area to receive care?”
“(If Yes) What would you say is the MAIN reason you feel the need to leave the local area for care??”
Currently Leave the Area for Medical Care(RCRH Service Area, 2015)
Sources: � 2015 PRC Community Health Survey, Professional Research Consultants, Inc. [Item 309]
Notes: � Asked of all respondents.
� Hispanics can be of any race. Other race categories are non-Hispanic categorizations (e.g., “White” reflects non-Hispanic White respondents).
� Income categories reflect respondent's household income as a ratio to the federal poverty level (FPL) for their household size. “Low Income” includes households
with incomes up to 200% of the federal poverty level; “Mid/High Income” includes households with incomes at 200% or more of the federal poverty level.
31.3% 31.0% 32.9% 34.7%
19.7%
32.5% 30.8% 30.8%33.4% 31.1%
0%
20%
40%
60%
80%
100%
Men Women 18 to 39 40 to 64 65+ LowIncome
Mid/HighIncome
NH White Other Overall
Reason for Leaving the Area for Medical Care(Among Respondents Who Currently Leave the Area for Care, 2015)
Sources: � 2015 PRC Community Health Survey, Professional Research Consultants, Inc. [Item 309]
Notes: � Asked of all respondents.
RCRH
Service Area
Specialty Care 30.2%
Availability of Physicians/Services 26.7%
Quality of Care 26.6%
Other Reasons 16.5%

COMMUNITY HEALTH NEEDS ASSESSMENT
222
Resources Available to Address the Significant Health Needs
The following represent potential measures and resources (such as programs, organizations, and facilities in
the community) available to address the significant health needs identified in this report. This list is not
exhaustive but rather outlines those resources identified in the course of conducting this Community Health
Needs Assessment.
Access to Healthcare Services
211 Helpline
Anpetu Luta Otipi Drug and Alcohol Treatment Center
Behavior Management System
Better Choices, Better Health
Black Hills State University
Black Hills Veterans Administration
Carson Drug
Case Managers at Mental Health Facilities
CHR
Churches
City Bus
Clinics
Community Crisis Center
Community Health Center of the Black Hills
Cornerstone Rescue Mission
County Based Programs
Crisis Care Center
Custer Ambulance Service
Custer Regional Clinic
Custer Regional Hospital/Clinic
Custer Regional Senior Care
D.A.V.
Department of Health
Department of Social Services
Department of Veterans Affairs
Diabetes Education Programs
Dial-a-Ride
Education
Emergency Room
EMS
Extended Hours Clinic
Family Medicine Residency Clinic
Federal and State Health Insurance Programs
Foundation for Health
Four Directions Women's Clinic
Good Shepherd Church
Good Shepherd Clinic
Great Plains Tribal Chairmen's Health Board
Gunderson Lutheran
Head Hunters
Hope Center
Indian Health Services
Kyle Health Center
Local Non-Profits
Lutheran Social Services
Oglala Sioux Tribal Health Department
OST Ambulance Service
OST Transit
OST Treasurers Office
Prescription Programs
Private Providers
Public Transportation
Queen City Regional Medical Center/Clinic
RAI
Rapid City Regional Hospital
Rapid City Regional West
Rapid Transit
Recruitment
Regional Clinic
Regional Dermatology
Regional Health
Regional Hospital
Religious Organizations
Reservation Ambulance Services and Vans
Ronald McDonald Dental Mobile
Schools
Scovel Psychological, Psychological Associates
Sioux San Hospital
Sweetgrass Project
Taxis
The Mission
Town of Spearfish
Transitional Care Clinic
Tribal Community Health Representatives Program
Urgent Care
Vehicle Repair Discounts for Poor or Elderly
Youth and Family Services
Arthritis, Osteoporosis & Chronic Back Conditions
AARP
Acupuncturist
Arthritis and Lupus Information Day
Arthritis Association
Arthritis Foundation
Aspen Center
Belle Fourche Regional Clinic
Black Hills Arthritis Association
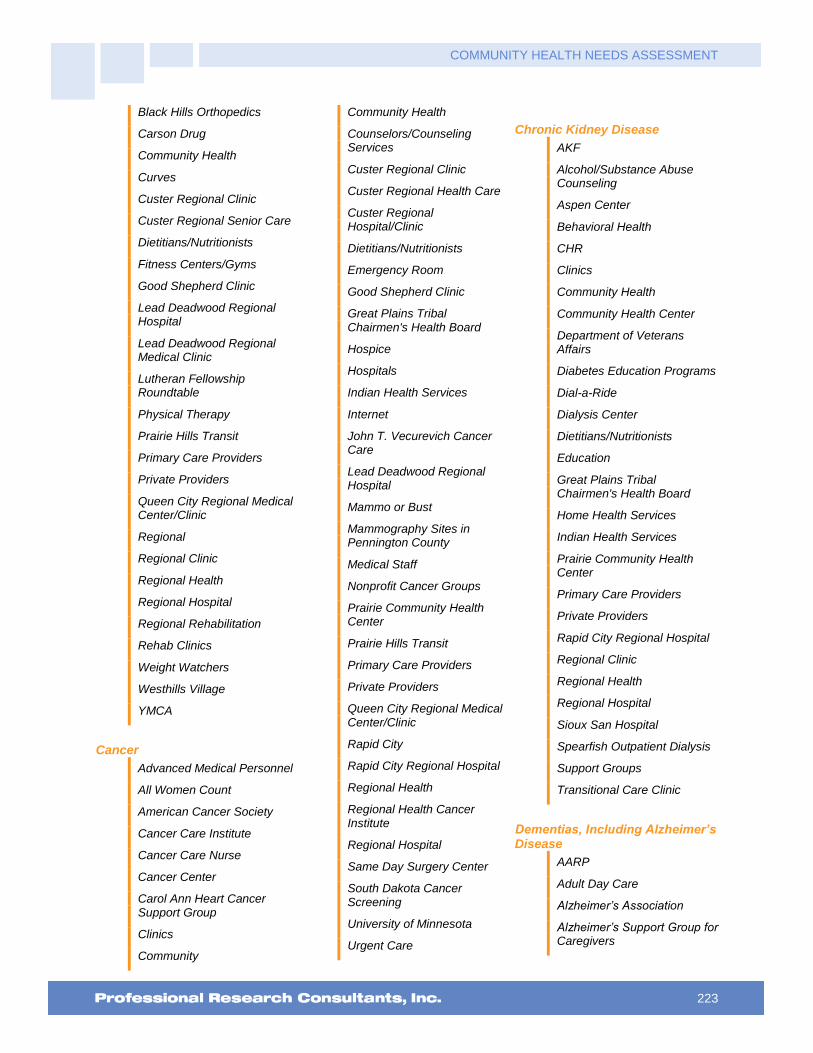
COMMUNITY HEALTH NEEDS ASSESSMENT
223
Black Hills Orthopedics
Carson Drug
Community Health
Curves
Custer Regional Clinic
Custer Regional Senior Care
Dietitians/Nutritionists
Fitness Centers/Gyms
Good Shepherd Clinic
Lead Deadwood Regional Hospital
Lead Deadwood Regional Medical Clinic
Lutheran Fellowship Roundtable
Physical Therapy
Prairie Hills Transit
Primary Care Providers
Private Providers
Queen City Regional Medical Center/Clinic
Regional
Regional Clinic
Regional Health
Regional Hospital
Regional Rehabilitation
Rehab Clinics
Weight Watchers
Westhills Village
YMCA
Cancer
Advanced Medical Personnel
All Women Count
American Cancer Society
Cancer Care Institute
Cancer Care Nurse
Cancer Center
Carol Ann Heart Cancer Support Group
Clinics
Community
Community Health
Counselors/Counseling Services
Custer Regional Clinic
Custer Regional Health Care
Custer Regional Hospital/Clinic
Dietitians/Nutritionists
Emergency Room
Good Shepherd Clinic
Great Plains Tribal Chairmen's Health Board
Hospice
Hospitals
Indian Health Services
Internet
John T. Vecurevich Cancer Care
Lead Deadwood Regional Hospital
Mammo or Bust
Mammography Sites in Pennington County
Medical Staff
Nonprofit Cancer Groups
Prairie Community Health Center
Prairie Hills Transit
Primary Care Providers
Private Providers
Queen City Regional Medical Center/Clinic
Rapid City
Rapid City Regional Hospital
Regional Health
Regional Health Cancer Institute
Regional Hospital
Same Day Surgery Center
South Dakota Cancer Screening
University of Minnesota
Urgent Care
Chronic Kidney Disease
AKF
Alcohol/Substance Abuse Counseling
Aspen Center
Behavioral Health
CHR
Clinics
Community Health
Community Health Center
Department of Veterans Affairs
Diabetes Education Programs
Dial-a-Ride
Dialysis Center
Dietitians/Nutritionists
Education
Great Plains Tribal Chairmen's Health Board
Home Health Services
Indian Health Services
Prairie Community Health Center
Primary Care Providers
Private Providers
Rapid City Regional Hospital
Regional Clinic
Regional Health
Regional Hospital
Sioux San Hospital
Spearfish Outpatient Dialysis
Support Groups
Transitional Care Clinic
Dementias, Including Alzheimer’s Disease
AARP
Adult Day Care
Alzheimer’s Association
Alzheimer’s Support Group for Caregivers

COMMUNITY HEALTH NEEDS ASSESSMENT
224
Assisted Living - Edgewood Vista
Assisted Living Centers
Behavioral Health
Bella Vista
Boost Your Brain Fitness Program
Comfort Keepers and Home Health Services
Community Health
Counselors/Counseling Services
Custer Regional Clinic
Custer Regional Health Care
Custer Regional Hospital/Clinic
Custer Regional Senior Care
Daisy House
Day Care Centers
Dementia Alzheimer’s Support Group
Dementia Care Facilities
Dementia Support Group at Fairmont Grand Manor
Dementia, Memory Care Units
Department of Social Services
Department of Veterans Affairs
Dorsett Home
Edgewood Vista
Emergency Room
Fit Kits
Fountain Springs
Golden Hills Assisted Living
Golden Living Center – Bella Vista
Home Health Services
Home Instead Senior Care of the Black Hills
Hospitals
Hot Springs Facilities
Indian Health Services
Internet
Long-term Care Facility
Manlove Psychiatric Group
Medicaid
Neuropsychological Testing
Nursing Homes
Pennington County Health and Human Services
Primrose Manor
Private Providers
Psychiatric Unit
Rapid City Regional Hospital
Regional Health
Senior Information Network/South Dakota Extension
Skilled Nursing Facilities
Speech Therapy
Support Groups
There's a Heart
Walk to End Alzheimer’s
Western Resources for Independent Living
Westhills Village
WRDI
Yankton Services
Diabetes
American Diabetes Association
Aspen Center
Bariatric Medicine
Better Choices, Better Health
Black Hills Family Practice
Black Hills Veterans Administration
Bountiful Baskets
Carson Drug
City/County Alcohol and Drug Programs
Clinics
Community Education Classes
Community Health Center
Community Health Center of the Black Hills
Community Health Nurse
Cornerstone Rescue Mission
Curves
Custer Regional Clinic
Custer Regional Health Care
Custer Regional Hospital/Clinic
Department of Veterans Affairs
Diabetes Education Programs
Diabetes Education/Diabetic Coalition
Diabetes Prevention Program
Diabetes, Inc.
Diabetic Support Groups
Dietitians/Nutritionists
DM Prevention
DPP Programs
Education
Ellsworth AFB, SD Diabetes Education Program
EMS
Fitness Centers/Gyms
Friends and Family
Glucometers
Good Shepherd Clinic
Great Plains Tribal Chairmen's Health Board
Health and Human Services
Help Line
Home Health Services
Hospitals
Indian Health Services
Internet
Juvenile Diabetes Support Group
Lead Deadwood Regional Medical Clinic
Massa Berry Clinic
Media

COMMUNITY HEALTH NEEDS ASSESSMENT
225
Non-profit Support Groups
Parks and Recreation
Pharmaceutical Funded Patient Assistance Programs
Pharmacy
Pine Ridge Indian Health Services
Podiatry in Pine Ridge
Prairie Community Health Center
Primary Care Providers
Private Providers
Public Library
Queen City Regional Medical Center/Clinic
RAI
Rapid City Community Health Center
Rapid City Diabetes Education Program
Rapid City Emergency Physicians Group
Rapid City Medical Clinics
Rapid City Regional Health
Rapid City Regional Hospital
Regional Clinic
Regional Health
Regional Hospital
Schools
SDPI Diabetes Program
Sioux San Hospital
Social Services
Spearfish DM
Spearfish Regional Hospital
Spearfish Regional Medical Clinic
Sturgis Regional Hospital
Transitional Care Clinic
WIC
YMCA
Youth and Family Services
Family Planning
Birth Right
Black Hills Clinic
Black Hills Family Practice
Black Hills Ob/Gyn
CareNet
Catholic Social Services
Churches
Clinics
Community Health Center
Community Health Center of the Black Hills
Cornerstone Rescue Mission
Custer Regional Clinic
Department of Health
Family Planning
Four Directions Women's Clinic
Hospitals
Indian Health Services
Lead Deadwood Regional Hospital
Lead Deadwood Regional Medical Clinic
Love Inc.
Lutheran Social Services
Massa Berry Clinic
Medicaid
Native Women's Health Care
Office of Family and Community Health
Organization for Youth and Families
Pine Ridge Indian Health Services
Planned Parenthood
Primary Care Providers
Private Providers
Rapid City Regional Hospital
Regional Health
Rural America Initiatives
Schools
Sioux San Hospital
South Dakota Department of Health
Urgent Care
WIC
Youth and Family Services
Hearing & Vision
Black Hills Eye Institute
Custer Regional Clinic
Custer Regional Health Care
Custer Regional Senior Care
Eye Clinic Sioux San
Hearing Aid Stores
Indian Health Services
JVN - Imaging - Diabetes Program for Indians
Lions Club
Low Vision Support Group
Medicaid
Mountain Plains Audiology
Pine Ridge Indian Health Services
Premier Family Eyecare
Private Providers
Queen City Regional Medical Center/Clinic
Relators for Kids
Spearfish Regional Medical Clinic
Vision Source
VSP
Heart Disease & Stroke
1-800-SDQuits
American Heart Association
Better Choices, Better Health
Black Hills Surgical
Bountiful Baskets
Cardiac Rehabilitation
CHF Clinic
Churches

COMMUNITY HEALTH NEEDS ASSESSMENT
226
Clinics
Community Health Center
Community Health Nurse
Custer Ambulance Service
Custer Regional Clinic
Custer Regional Health Care
Custer Regional Hospital/Clinic
Custer Regional Senior Care
Diabetes Prevention Program
Dietitians/Nutritionists
Emergency Room
Fitness Centers/Gyms
Good Shepherd Clinic
Great Plains Good Health and Wellness Program
Great Plains Tribal Chairmen's Health Board
Home Health Services
Hospitals
Indian Health Services
Internet
Lead Deadwood Regional Hospital
Lead Deadwood Regional Medical Clinic
Live Well Black Hills
Media
Medical Staff
Mended Hearts Support Group
Oglala Sioux Tribal Health Department
Parks and Recreation
Pine Ridge Indian Health Services
Primary Care Providers
Private Providers
Queen City Regional Medical Center/Clinic
Quit Line
Rapid City Regional Hospital
Regional Cardiology Group
Regional Clinic
Regional Health
Regional Hospital
Regional Rehabilitation
Rehab Clinics
Schools
Sioux San Hospital
Spearfish Regional Hospital
Spearfish Regional Medical Clinic
State of South Dakota
Stroke Care Public Education
Urgent Care
Weight Watchers
YMCA
HIV/AIDS
Community Health
Community Health Center
Family Medicine Residency Clinic
Indian Health Services
Private Providers
Rapid City Regional Hospital
Regional
Residency Center
Resources for the LGBT Community
Ryan White Foundation
Sioux San Hospital
South Dakota Department of Health
STD Screening Sites
Volunteers of America
Immunization & Infectious Diseases
BHSU Health Services
Black Hills Pediatrics
CHS
Clinics
Community Health
Custer Regional Clinic
Department of Health
Department of Health - Bright Start
Extension Service
Family Medicine Residency Clinic
Family Planning
Home Health Services
Indian Health Services
Infusion Plus
Medicaid
Pharmacy
Pine Ridge Indian Health Services
Primary Care Providers
Private Providers
Rapid City Regional Hospital
Regional
Regional Health
Schools
Sioux San Hospital
South Dakota Department of Health
State Immunization Record/Database
Urgent Care
WIC
Infant & Child Health
Behavior Management
Birth to Three
Black Hills Pediatrics
Boys and Girls Club
Children's Home Society Child Advocacy Center
Churches
Clinics
Community Health
Community Health Center
Community Health Center of the Black Hills

COMMUNITY HEALTH NEEDS ASSESSMENT
227
Custer Regional Clinic
Department of Health
Department of Health - Bright Start
Department of Social Services
Emergency Room
Free Clinic
Good Shepherd Clinic
Government Programs
Health and Human Services
Home Health Services
Hospitals
Indian Health Services
Lead Deadwood Regional Hospital
Lead Deadwood Regional Medical Clinic
Love Inc.
Lutheran Social Services
March of Dimes
Mommy's Closet
Native Women's Health Care
Parks and Recreation
Pine Ridge Indian Health Services
Primary Care Providers
Private Providers
Rapid City Regional Hospital
Regional
Regional Health
Residency Center
Schools
Sioux San Hospital
South Dakota Crisis Hotline
South Dakota Department of Health
Volunteers of America
WIC
YMCA
Youth and Family Services
Injury & Violence
211 Helpline
24/7 Program
911
AA/NA
Alcohol Addiction Centers
Anpetu Luta Otipi Drug and Alcohol Treatment Center
Behavior Management
Behavior Management System
Behavioral Health Facilities
Boys and Girls Club
Casa
Catholic Social Services
Child Protection Services
Children's Home Society Child Advocacy Center
Churches
Clinics
Community Health
Cornerstone Rescue Mission
Counselors/Counseling Services
County Public Defenders
Criminal Justice System
Crisis Care Center
Custer Ambulance Service
Custer Regional Hospital/Clinic
Department of Criminal Investigators
Department of Social Services
Detox Center
Drug and Alcohol Abuse Programs
Drug/ETOH Abuse Counseling
Emergency Room
First Responders
Fitness Centers/Gyms
Friends and Family
Front Porch Coalition
Full Circle
Girls Inc.
Health and Human Services
Hope Center
Indian Health Services
Jobs
Law Enforcement
Legal Aid
Lutheran Social Services
Mental Health Association
Mental Health Facilities
Oglala Sioux Tribal Health Department
Parenting Classes
Pennington County Detoxification Center
Pennington County Sheriff's Office
Pennington County Victims Advocacy Office
Pine Ridge Indian Health Services
Programs for the Homeless
Rapid City Community Development
Rapid City Crisis Care Center
Rapid City Police Department
Rapid City Regional Hospital
SART
Schools
Senior Citizen Centers
Shelters
Sweetgrass Project
The Mission
The Salvation Army
Urgent Care
WAVI
Wellspring
WIC
Women Against Violence
Women's and Children's Home

COMMUNITY HEALTH NEEDS ASSESSMENT
228
Working Against Violence
Youth and Family Services
Mental Health
211 Helpline
AA/NA
Access to Recovery Program
Arise
Battered Women's Shelter
Behavior Management System
Behavioral Health Facilities
Behavioral Health Management
Behavioral West
Better Choices, Better Health
BIA Program
Black Hills Children's Home
Black Hills Psychiatry Associates
Black Hills Psychology
Black Hills Works
Canyon Hills
Catholic Social Services
Children's Home Society Child Advocacy Center
Christian Lutheran Services
Chrysalis
Churches
Clinic/Hospital
Clinics
Community Health at Mission
Community Health Center
Community Health Center of the Black Hills
Community Mental Health Center
Cornerstone Rescue Mission
Counselors/Counseling Services
Crisis Care Center
CSS
Custer Regional Clinic
Department of Social Services
Department of Veterans Affairs
Detox Center
Emergency Room
Employee Assistance Programs
Four Directions Women's Clinic
Front Porch Coalition
Gambling Support Group
Grief Support Groups
Health and Human Services
Help Line
Homeless Shelters
Hope Center
Indian Health Services
Internet
Lawrence County Mental Health Services
Lead Deadwood Regional Hospital
Lead Deadwood Regional Medical Clinic
Lifeways
Lutheran Social Services
Mainstream
Manlove Psychiatric Group
Massa Berry Clinic
Mental Health Association
Mental Health Board
National Alliance for the Mentally Ill
National Resources
Northern Hills Training Center
Outpatient Treatment Programs
Pennington County Detoxification Center
Pennington County Health and Human Services
Pennington County Jail
Pine Ridge Indian Health Services
Primary Care Providers
Private Providers
Psychological Hospital
Rapid City Regional Health
Rapid City Regional Hospital
Rapid City Regional West
Recruitment
Regional Behavioral Health Center
Regional Health
Regional Hospital
Regional West
Religious Organizations
Schools
Scovel Psychological, Psychological Associates
Sioux San Hospital
Social Services
Support Groups
Sweetgrass Project
Volunteers of America
Walmart
WAVI
Wellfully/Wellspring
Wellspring
Yankton Services
Yankton State Hospital
YMCA
Youth and Family Services
Nutrition, Physical Activity & Weight
Anytime Fitness
Bariatric Medicine
Behavior Management
Better Choices, Better Health
BHSU Health Services
Bike Clubs, Ski Clubs, Running Clubs
Bountiful Baskets

COMMUNITY HEALTH NEEDS ASSESSMENT
229
Boys and Girls Club
CAP
Children's Park in Memorial Park
Churches
City Pools
Clinic/Hospital
Commercial
Community Education Classes
Community Gardens
Community Health
Community Health Center
County Extension - Expanded Food and Nutrition Ed
Crossfit
Curves
Custer Regional Hospital/Clinic
Dakota Debit Cards
Day Care Centers
Deadwood Rec Center
Deadwood Recreation Center
Department of Agriculture
Department of Health
Department of Social Services
Diabetes Education Programs
Diabetes Prevention Program
Diet Centers
Diet Plans
Dietitians/Nutritionists
Education
Elderly Meals/Meals on Wheels
Evan's Plunge
Farmer's Market
Feeding South Dakota
Fitness Centers/Gyms
Food Bank
Food Pantry
Food Stamps/EBT
Great Plains Tribal Chairmen's Health Board
Grocery Stores
Handley Rec Center
Head Start Program
Health for Life
Healthy Systems USA
Hospitals
Indian Health Services
Live Well Black Hills
Love Inc.
Meals on Wheels
Meals Programs
Mickelson Trail
My Workplace
Negative Reinforcement in the Form of Higher Premiums
Okiciyapi Wellness Center
Outpatient Medical Services
Outside
Oyate Bilhelya Program
Parks and Recreation
Pennington County Extension Office
Pine Ridge Indian Health Services
Primary Care Providers
Private Providers
RAI
Rapid City Club for Boys
Rapid City Parks and Recreation
Rapid City Regional Hospital
Rapid Ride
Regional
Regional Health
Regional Hospital
Roosevelt Pool Complex
Rural America Initiatives
Schools
SDSU Extension Program
Sioux San Hospital
Smart Choices
Snap Fitness
SNAP Program
Spearfish Recreation Center
State of South Dakota
State Resources
Storehouse/Backpack Program
Swim Center, YMCA, Sioux San
The Black Hills
The Mission
University
Weight Watchers
Wellness Campus
WIC
YMCA
Youth and Family Services
Oral Health
Advanced Dental Professionals
Black Hills Family Practice
Black Hills Pediatrics
Clinics
Community Health
Community Health Center
Community Health Center of the Black Hills
Community Health Dental Services
Community Health Nurse
Dakota Smiles
Deadwood Dental
Delta Dental Bus
Dental Bus
Department of Veterans Affairs
Destination Dentistry
Donated Dental Program
Fall River Health Care

COMMUNITY HEALTH NEEDS ASSESSMENT
230
Fox Dentistry
Good Shepherd Clinic
Healthy Smiles Program
Homeless Connect Day - Free Dental Exams
Indian Health Services
Loftus Dental
Massa Dental
Medicaid
Northern Hills Dental
Pennington County Health and Human Services
Pine Ridge Indian Health Services
Private Providers
Rapid City Regional Hospital
Ray Dental Group
Regional Health
Regional Hospital
Ronald McDonald Dental Mobile
Schools
Sioux San Hospital
South Dakota Dental Association
University of Colorado
Youth and Family Services
Respiratory Diseases
1-800-SDQuits
Better Breathers Support Group
Black Hills Family Practice
Clinics
Community Health
COPD Foundation
Department of Social Services
DME Resources
EPA
Great Plains Tribal Chairmen's Health Board
Health Concepts
Home Health Services
Lead Deadwood Regional Hospital
Lead Deadwood Regional Medical Clinic
Massa Berry Clinic
Oxygen Supplies
Pine Ridge Indian Health Services
Private Providers
Queen City Regional Medical Center/Clinic
Rapid City Regional Hospital
Regional Clinic
Regional Health
Regional Hospital
Respiratory Rehabilitation
Schools
Sioux San Hospital
Spearfish Regional Hospital
Western Resources for Independent Living
Sexually Transmitted Diseases
All Medical Facilities
BHSU Health Services
Black Hills Center for Equality
CHS
Clinics
Community Education Classes
Community Health
Community Health and Human Services
Community Health Center
Community Health Center of the Black Hills
Department of Health
Department of Health and Family Planning
Emergency Room
Family Medicine Residency Clinic
Family Planning
Four Directions Women's Clinic
Friends and Family
Lead Deadwood Regional Hospital
Lead Deadwood Regional Medical Clinic
Nurse on the College Campus
Pennington County Health and Human Services
Pine Ridge Indian Health Services
Planned Parenthood
Pregnancy Care Center
Private Providers
Queen City Regional Medical Center/Clinic
Regional Hospital
Schools
Sioux San Hospital
South Dakota Department of Health
Spearfish Regional Medical Clinic
STD Program, St. Patrick Street
Urgent Care
Volunteers of America
Substance Abuse
211 Helpline
24/7 Program
AA/NA
Access to Recovery Program
Addiction Recovery Center
Addiction Recovery Center of the Black Hills
Anpetu Luta Otipi Drug and Alcohol Treatment Center
ATR
Awareness Counseling
Behavior Management
Behavior Management System

COMMUNITY HEALTH NEEDS ASSESSMENT
231
Behavioral Health
BIA Program
Black Hills Addiction Recovery Center
Black Hills Health Care System
Canyon Hills
Catholic Social Services
Celebrate Recovery
Chemical Dependency Programs
Christian Life Ministries
Churches
City County
City/County Alcohol and Drug Programs
Clinic/Hospital
Clinics
Community Alternative of the Black Hills
Community Health
Compass Point
Cornerstone Rescue Mission
Counselors/Counseling Services
County Based Programs
Crisis Care Center
Custer County Sheriff's Office
Custer Regional Hospital/Clinic
DARE Program
Department of Veterans Affairs
Detox Center
Drug Court
Full Circle
Great Plains Tribal Chairmen's Health Board
Homeless Shelters
Hope Center
Impact Program
Indian Health Services
Jail
Law Enforcement
Lifeline Connections
Lifeways
Lutheran Social Services
MADD
Mainstream
Mental Health Facilities
My Workplace
Native American Substance Treatment Programs
Native Healing Program
Northern Hills Drug and Alcohol
Oglala Sioux Tribal Health Department
Other Programs
Outpatient Medical Services
Outpatient Treatment Programs
Parents of Abusers
Pennington County Detoxification Center
Pennington County Jail
Prairie Hills Transit
Prison
Private Providers
Rapid City Detox
Rapid City Police Department
Rapid City Regional Health
Rapid City Regional Hospital
Rapid City/Pennington County Drug and Alcohol Treatment
Regional Behavioral Health Center
Regional Health
Regional Hospital
Regional Rehabilitation
Regional West
Rehab Clinics
Roads Inc.
Roads Treatment Center
Rural America Initiatives
Schools
Sioux San Hospital
Social Services
Southern Hills Treatment Clinic
State of South Dakota
Support Groups
Treatment Centers
Wellfully/Wellspring
Youth and Family Services
YouthWise
Tobacco Use
1-800-SDQuits
Addiction Recovery Center of the Black Hills
All Medical Facilities
American Cancer Society
American Heart Association
American Lung Association
ASAP
Black Hills Community Health Center
Career Learning Center
CHS
Clinic/Hospital
Community Health
Comp Cancer Program - Department of Health
Counselors/Counseling Services
Department of Health
Department of Health Smoking Cessation Programs
Department of Veterans Affairs
Employee Assistance Programs
Friends and Family
Great Plains Tribal Chairmen's Health Board
Indian Health Services
Lifeways

COMMUNITY HEALTH NEEDS ASSESSMENT
232
Over the Counter Medications
Pharmacy
Prairie Community Health Center
Private Providers
Public Health Agencies
Quit Line
Rapid City Regional Health
Rapid City Regional Hospital
Regional Health
Religious Organizations
Schools
Sioux San Hospital
Smoking Cessation Programs
South Dakota Department of Health
Spearfish Community Coalition
State of South Dakota
State Resources
Television
Tobacco Funding
Western Prevention Resource Center
Youth and Family Services
YouthWise

Appendix

COMMUNITY HEALTH NEEDS ASSESSMENT
234
Evaluation of Past Work
Access to Health Services Strategy #1: RCRH will collaborate with the South Dakota Foundation of Medical Care’s community
Transitions Coalition. This is a community group involving pharmacists, clinics, long-term care and
hospital employees from multiple facilities. The goal of the group is to identify areas of opportunity and
to work on developing or improving processes that would prevent readmission to the hospital. This
group has currently identified two areas of focus: outpatient medication reconciliation and timely
primary care physician follow-up.
o RCRH continues to be involved in this coalition. Beginning in FY 2014, the SD Foundation of
Medical Care is working on the 11th statement of work from CMS with the following task
orders: Beneficiary Engagement, Diabetes, Adverse Drug Events, Palliative Care and
Communication.
Strategy #2: RCRH will lead the Community Paramedics Program. This program will help get the
patients in our community to the right level of care at the right time. With a goal to reduce readmission
rates as well as to improve care transitions, we will develop a process in which paramedics will do
home visits to high risk patients recently discharged from the hospital within 24 hours. This home visit
will include medication reconciliation, education, and identifying possible interventions the patient may
need once they have come home. This program will also offer an opportunity to reach out to those
patients who many need minimal intervention that can be provided by the paramedics, rather than
sending the patient to the Emergency Department.
o Effective October 30, 2014, the Community Paramedics Program was suspended due to
pressure from the South Dakota State Board of Medicine. The funding organization
(Vucurevich Foundation), the City Attorney, and the Mayor have been consulted, with the
intent of taking the request back to the Board of Medicine to reconsider allowing the program
in the state of South Dakota.
Strategy #3: RCRH will support and utilize Regional On-Call, a transfer center that coordinates all
admission requests from other hospitals and local physicians. The transfer center will capture patient
medical and demographic information, facilitate communication between providers, and handle patient
placement. Additionally, through the Hospitalist Direct Admission process, RCRH facilitates direct
inpatient to inpatient transfer, therefore bypassing the Emergency Department. This process is a
multidisciplinary team approach to care coordination with daily huddles and collaboration among team
members.
o Regional On-Call Transfer Center handles all calls for incoming transfers from outlying
facilities for RCRH and Spearfish Regional Hospital. Transfer Center coordinates on average
1000 cases per month. Patients’ medical information is gathered at time of referring call.
Transfer Center then contacts correct accepting provider based on established protocols.
Referring provider is able to communicate directly with accepting provider. Transfer Center
also coordinates all patient placements within RCRH which facilitates inpatient to inpatient
transfers therefore bypassing the Emergency Department.
Strategy #4: RCRH will continue to collaborate and contract with Prairie Hills Transit to provide patient
transport services between facilities and home after discharge for patients who are lacking
transportation. This allows access to transportation and facilitates timely discharge and efficient patient
flow throughout the health system.
o RCRH is continuing its contract with Prairie Hills Transit for these services.
Strategy #5: RCRH has formed and will continue to support the Patient Oriented Interdisciplinary
Team (POINT), which is leading a discharge planning process that encourages increased
communication among providers, patients, and families in order to decrease cost and length of stay
while maintaining a patient-centered approach.
o POINT is continuously evolving and the Regional Value Improvement System (RVIS) is
helping move things along. Now referred to as Physician Rounding, and will be an RIE.

COMMUNITY HEALTH NEEDS ASSESSMENT
235
Considering a huddle right outside the door of the patient, with patient’s nurse leading the
huddle. Regional Health Strategic Initiatives beginning May 2015 include
#1: To improve patient & family understanding of their plan of care and how the
patient is progressing toward discharge which will also support time for patients and
families to as questions; Measurement a) H-CAPS survey questions regarding
physicians listening carefully ; Executive Lead is RCRH employee.
#2: To improve the patient & family experience by providing clear and simple itinerary
of what to expect in our system; Measurement a) H-CAPS and CG-CAHPS survey
questions regarding communication; Executive lead left and position is open.
Strategy #6: RCRH will support partnerships to enhance access to care, including: Black Hills
Community Health Care Center, Regional Urgent Care, Pine Ridge Regional Medical Clinic, and other
programs supporting enhanced access to primary care.
o Currently planning a primary care redesign. Regional Health Strategic Initiative beginning May
2015 includes
#1: To provide same day access to primary care provider, diagnostics, and
therapeutics; Measurement a) Patient survey questions relating to convenience and
ability to make an appointment as needed, and b)Two primary care, diagnostics, and
therapeutic appointments will be available on the same day across the Regional
Health system; Executive Lead is a RCRH employee.
#2 Native American Community and Indian Health Services (IHS) Outreach; Purpose
– Improve Native American population health by implementing local access to care
by partnering with Tribal Governments and IHS; Measurement – Improve the health
of underserved populations by providing care in the appropriate setting rather than in
our emergency departments with the goal of reducing uncompensated care by 25%;
Executive Team Lead is a RCRH employee.
o Family Medicine Residency (FMR) operates a Health Home for eligible patients, with 137
patients enrolled as of 5/4/15. FMR also has Transitions of Care program and all FMR
patients are scheduled for a follow-up appointment before discharge from the hospital, with
the appointment taking place within 14 days of discharge. Staff from FMR Health Home calls
the patient within 2 days of discharge to follow up on how they are doing and to remind them
of the follow-up appointment.
Additional Strategies:
o Care Management – setting up protocols for evidence-based chronic disease management.
o Phytel – population health software tool – implementation began August 2014. The tool helps
to identify and reach out to patients with gaps in care and provide data to coordinate the care
to close the gaps.
o Care Coordination VSA May 18-21, 2015 – goal is to have Care Coordinator in every clinic,
and revamp inpatient Care Coordination.
o RCRH Poverty Team established March 2015; led by two RCRH nurses who attended a four-
day poverty and coaching institute. Poverty Coaches will serve as the organization’s on-site
poverty expert, helping to break down barriers in the organization and developing system-
wide approaches for improving outcomes for families and individuals experiencing poverty.
Poverty coaches are trained to conduct Poverty Competency Assessments and assist their
organizations in developing and implementing customized action plans with measureable
results.
Injury & Violence Prevention Strategy #1: Head Injury Prevention: Includes education and helmet giveaways through Kohl’s “Don’t
Thump Your Melon” program for grade school children. Ski helmets are also distributed at the Ski for
Light event to children, adolescents and adults.

COMMUNITY HEALTH NEEDS ASSESSMENT
236
o Kohl’s Don’t Thump Your Melon - The program provides helmets to those in need, proper
fitting of helmets, and bicycle safety tools.
March 19, 2015 Robbinsdale Elementary
March 26, 2015 Grandview Elementary (470 helmets)
March 27, 2015 South Park Elementary (371 helmets)
(Emailed contact on 5/4/15 about bicycle education for 2nd
graders.)
o Ski for Light – organizers asked us to stop distributing free helmets, as they have vendors that
sell helmets which conflicts with their ability to do so.
Strategy #2: Fall Prevention: Includes education and screenings through Stand Strong for Life, a
program for the elderly and individuals with balance issues and Window Safety, a program for parents
of grade school children.
o There has been no action with Stand Strong for Life.
Strategy #3: Automobile Safety: RCRH has partnered with programs to distribute car seats for infants
and children. RCRH has also partnered with Freshman Impact and Graduated Drivers Licensing.
o RCRH is continuing to distribute car safety seats to eligible patients. Eligibility requirements to
receive child safety seat include participating in one of the following programs: Women,
Infants, & Children (WIC); Child Care Assistance; Head Start; Medicaid; Children's Health
Insurance Program (CHIP); Supplemental Nutrition Assistance Program (SNAP).
o RCRH emailed head of Graduated Drivers Licensing on 5/4/15.
o Freshman Impact in Rapid City in October, 2014.
Head of Freshman Impact was emailed by RCRH about the event May 4, 2015.
Additional Strategies:
o Period of Purple Crying – RCRH is funding and distributing a DVD/booklet to all mothers who
deliver babies. This provided education on shaken baby syndrome.
o RCRH is a partner in Cribs for Kids which allows eligible parents to go to the Department of
Health to pick up a free crib.
Diabetes Strategy #1: Diabetes Prevention: Partner with Regional Medical Clinic Diabetes Education and the
YMCA of Rapid City to promote community Diabetes Prevention Programs (DPP).
o DPP is being offered at Regional Medical Clinic – Aspen and the YMCA of Rapid City, but
currently not being formally promoted at RCRH.
Strategy #2: Diabetes Screening: Currently RCRH is working with diabetes care specialists to develop
new staff education, tools, screening, and management protocols in the areas of Emergency
Department, Obstetrics, Medical/Surgical, and Surgery.
o No action has been taken. New Physician Champion is needed and a gap exists at the loss of
previous physician. Lead in program has been emailed for update as of 5/4/15.
o ADA has guidelines on screening for diabetes; concurrent coding – we don’t have yet but we
may in the future. Staff education through Nurse Diabetes Champions and in-services. We
have protocols and order sets to help guide clinicians regarding screening of patients for
diabetes.
Strategy #3: Diabetes Management: RCRH recognizes that providing consistent, evidence-based
diabetes care will assist in the long-term goal of decreasing diabetes related morbidity and mortality in
our community.
o RCRH will offer consultation and coaching services in support of the system-wide
collaborative Diabetes Care Management Pilot being developed through Regional Medical
Clinics. Recommendations resulting from the pilot will be implemented across the system.
Process undertaken to integrate/align process, forms and education. Geographic
data was pulled (number of patients with diabetes and correlating AIC levels,

COMMUNITY HEALTH NEEDS ASSESSMENT
237
physician and zip code). Scope of practice (RD vs. RN) was evaluated. Phytel
population health management tool helps identify and reach out to patients with gaps
in care or with poor glucose control.
o Develop a system-wide diabetes service line focused on improving patient satisfaction, quality
of care and continuity of services.
During FY 2014, Diabetes Education was expanded to include Sturgis and Custer.
System Diabetes Team’s Proposed Patient Centered Diabetes Care Model includes:
1) Outpatient education: Programs under one umbrella, branch programs in
Sturgis and Custer, enhanced services to Lead/Deadwood and telehealth
and/or outreach to all rural areas
2) Clinics: educating providers and nurses on referral criteria, care
management of patients, provider mentoring on diabetes medication
adjustment, auto referrals for A1C’s =>8% into education, competencies
3) Hospitals: Basal/Bolus insulin management routinely used, hospitals
glycemic goals met, readmissions goals met, policies standardized
throughout the system, diabetes order sets standardized throughout the
system
4) Nursing home/assisted living: evaluation of current glycemic control, carb
counting added to meal plans, insulin dosed on CHO consumed, staff
education to increase knowledge base of staff and improve outcomes for
patients in their later years, provide education for family members of those
residents so they better understand the disease and how they can help
o Through Diabetes Nurse Champions, RCRH nursing service will receive evidence-based care
education in order to manage, provide care, and educate patients. RCRH will implement
evidence-based diabetes protocols.
Emailed program leader for update 5/4/15.
Glucommander will go live Oct. 2015. Diabetes Nurse Champions will be superusers
for the Glucommander (Glytec) implementation. 2012, 2013, & 2014
Custer led 5-hr classes for Diabetes Nurse Champions (new) and updates for those
previously trained. Most CRN’s (Clinical Resource Nurses) are trained as Diabetes
Nurse Champions (and doctors, pharmacists), serving as resource for medical staff.
Have metrics they are measuring with Glucommander – most notably to improve
glucose management. Consistent 24-hr/day management. All nurses and physicians
will be trained as end-users for Glucommander. First roll out at RCRH, then to the
other Regional Health hospitals. Employee has been working on a Rapid
Improvement Event – Glucs & Grubs (timing of the meal insulin) – 4382 – confirm w/
employee. Readmission Rate for Diabetes – went up 1% since March 2015 –
Program leader is evaluating to see what we can do to prevent re-admissions
o Partner with South Dakota Department of Health to offer a lay-led Chronic Disease Self-
Management Program (CDSMP).
Regional Health provides staff and in-kind donations for Better Choices, Better Health
– the Stanford University chronic disease self-management program. RCRH
employee serves as the West Region Contact for South Dakota, is trained as a
Master Trainer, serves on the state-wide steering committee, and organizes and
leads workshops. During FY 14, seven workshops took place
Strategy #4: Diabetes Provider Education: Educate primary care providers and their teams on
evidence-based practices regarding diabetes management in all health care settings.
o Glucommander training offered to all hospital physicians. RCRH employees (3) have been
educating Hospitalists present at their meetings. CNP with Glytec is putting together a 20-
minute computer-based education program for providers. Provider, pharmacy and nursing
training will be offered for Glucommander.

COMMUNITY HEALTH NEEDS ASSESSMENT
238
Strategy #5: Diabetes Nutrition Education: Hire a culinary trained chef who will offer classes to
demonstrate the ease and timeliness of cooking a healthy and appetizing meal for people with
diabetes. Provide healthy and appetizing recipes for people with diabetes.
o RCRH hired chef with plans to begin offering cooking classes in FY 15.
Mental Health & Mental Disorders Strategy #1: RCRH will continue to support the 24/7 Crisis Care Center by fulfilling the Regional
Health monetary grant to the Collaborative (1.5 million dollars over 3 years). RCRH will also support
the development of the Crisis Care Center’s sustainability plan and provide in kind support from
Regional Health employees as members of the Collaborative and related committees.
o There are new directors of both the Crisis Care Center and Behavioral Health. RCRH finished
the 3 year financial commitment to the Crisis Care Center in December 2013.
Strategy #2: RCRH will educate the public about mental health and substance abuse issues. Support
will be given to the biannual mental health educational forums and the annual mental health
awareness day celebration at Main Street Square in Rapid City.
o Behavioral Health hosts monthly mental health forums that are presented by Dr. Manlove.
They are well attended by residence, outside agencies and hospital staff.
Strategy #3: RCRH will provide support for suicide prevention and education by providing office space
for the Front Porch Coalition which works to prevent suicide and support families impacted by suicide.
o 364 square feet @ $23 per square foot = $8,372 value (per lease agreement with the Front
Porch Coalition).
o Suicidal Ideation assessment is being done on every RCRH admit - can get data from
Meditech; in ED if patient is positive for suicide ideation, they complete the SAD assessment -
can get data from Forerun.
o In April 2015, Regional Health received approval from internal IRB and Legal to be a hospital
partner with the Helpline Center on a five-year Youth Suicide Prevention Project funded by
SAMHSA. The project will identify, support, educate and refer youth at risk to behavioral
health services through targeting the youth directly and by training the clinical service
providers and direct care staff who work with youth at risk. The populations targeted include
youth who have made a suicide attempt or expressed suicidal ideation at an emergency
department or inpatient psychiatric unit, youth attending institutions of higher learning,
immigrant youth, LGBTQ youth, youth at K-12 school districts, American Indian youth in the
juvenile justice system and military family members and veterans. The grant project
incorporates the entire 10-24 year age range through strategies and activities that identify,
refer and monitor youth with suicide ideation, and provide interventions and follow up with
youth who have made suicide attempts.
Strategy #4: RCRH will provide support of analysis and development of a program to address youth
and family crisis. Staff from RCRH will be involved in meetings to develop a youth crisis model similar
to the adult model to improve access to mental health and intensive family therapy for youth and
families.
o Behavioral Health sends representatives to the monthly Juvenile System of Care
Collaborative meetings facilitated by the John T. Vucurevich Foundation and brings
multidisciplinary agencies together to address mental health needs for children and
adolescents.

COMMUNITY HEALTH NEEDS ASSESSMENT
239
Nutrition, Physical Activity and Weight Status Strategy #1: RCRH will offer culinary classes to demonstrate the ease and timeliness of cooking a
healthy, inexpensive, and appetizing meal. Healthy and appetizing recipes will be provided.
o RCRH is now offering healthier choices in RCRH cafeteria and has removed the fryer.
Chef-prepared healthy dishes with recipes are offered on Thursdays.
o RCRH hired a chef with plans to offer cooking classes in FY 15.
Strategy #2: RCRH will continue to offer and expand community wellness programs, including but
not limited to: medically and non-medically supervised weight-loss programs, nutritional
counseling, exercise programs, RCRH gym memberships for employees and spouses, body
composition analysis, and overall health assessments.
o RCRH staff conducted blood pressure screenings at the Black Hills Stock Show on Feb 6-
7, 2015.
o Regional Health Wellbeing Committee has been established with Chief Human Resource
Officer who is serving as Executive Sponsor.
o Regional Health Strategic Initiative beginning May 2015: Promote Community Health
Education
Purpose – Move towards population wellness through education of defined
groups
Measurement
Physician and caregiver volunteerism
Reduction of readmission program penalties
Strategy #3: RCRH will continue to support Pioneering Healthier Communities (PHC) by providing
in kind support from Regional Health employees to be members of the Coalition and related
committees. Opportunities include work to increase physical activity among Rapid City adults by
5% by 2016. Work consists of conducting a city-wide campaign, creating a healthy workplace
toolkit, and implementing a healthy impact assessment for the city.
o PHC re-branded to Live Well Black Hills. Regional Health employees continue to co-chair
and serve on the coalition. Focus on healthy policy, program and promotion. Specific
efforts fall in the category of Move Well (physical activity), Work Well (workplace
wellness), Eating Well, Feeling Well and Breathing Well.
Strategy #4: RCRH will partner with North Rapid Community Schools by serving on the Health,
Wellness and Safety Committee to ensure the basic physical, mental and emotional health needs
of young people and their families are recognized and addressed. The committee is tasked with
networking and collaborating together to provide increased access to families regarding health,
safety and wellbeing.
o The committee has not met during FY 14.
Additional Strategies:
o RCRH employee serves as youth mentor for SD Youth Foundation’s Healthy Living Youth
Council.