summary of vital statistics 2008
TRANSCRIPT

1800
1810
1820
1830
1840
1850
1860
1870
1880
1890
1900
1910
1920
1930
1940
1950
1960
1970
1980
1990
2000
2008
010
2030
4050
60
Dea
t hs
per
1,0 0
0 Po
pula
tion
1804SMALL POX 169
1805YELLOW FEVER 270 1822
YELLOW FEVER 166
1824SMALL POX 394
1832CHOLERA 3513
1834SMALL POX 233CHOLERA 971
1836-37MEASLES 443SCARLET FEVER 579
1849CHOLERA 5071
1854CHOLERA 2509
1870YELLOW FEVER 9
1865SMALL POX 664
1866CHOLERA 1137
1887DIPHTHERIA 4509
1892TYPHUS FEVER 200 SMALL POX 302
1892CHOLERA 9
1901-1902 SMALL POX410 AND 310LAST EPIDEMIC
1904MENINGITIS 2219 1918
INFLUENZA 12,562
1842CROTON AQUEDUCT OPENED
1907 CONTROL OF TYPHOID CARRIERS 1910 CHLORINATION OF WATER 1911 MILK STATIONS FOR BABIES INAUGURATED 1912 PASTEURIZATION OF MILK
POPULATION 119,734 242,278 696,115 1,478,103 2,507,414 4,766,883 6,930,446 7,891,957 7,894,862 7,322,564 8,008,278
OLD CITY OF NEW YORK FORMER CITIES OF GREATER CITY OF NEW YORK NEW YORK & BROOKLYN
...As Shown by the Death Rate as Recorded in the Official Records of the Department of Health and Mental Hygiene.
THE IMPACT OF WTC DISASTER DEATHS ON NEW YORK CITY'S DEATH RATE
1999
2000
2001
2002
2003
2004
2005
2006
2007
6
6.5
7
7.5
8
8.5
9
Dea
ths
per 1
,000
Pop
ulat
ion ALL DEATHS
EXCLUDING2,747 WTC DEATHS
SUMMARY OF VITAL STATISTICS 2008THE CITY OF NEW YORK
1851SMALL POX 562
1872SMALL POX 1666
1875SMALL POX 1899
1881SMALL POX 503
BUREAU OF VITAL STATISTICS, NEW YORK CITY DEPARTMENT OF HEALTH AND MENTAL HYGIENE 125 WORTH STREET, CN 7, NEW YORK, NEW YORK 10013
2001WORLD TRADE CENTER DISASTER 2747
1994 HIV 7102
Michael R. Bloomberg, Mayor Thomas A. Farley, M.D., M.P.H., Commissioner
Carolyn Greene, M.D., Acting Deputy Commissioner, Division of Epidemiology
SUMMARY OF VITAL STATISTICS 2008
THE CITY OF NEW YORK
Bureau of Vital Statistics New York City Department of Health and Mental Hygiene
Elizabeth Begier, M.D., M.P.H., Assistant Commissioner
Regina Zimmerman, Ph.D., M.P.H., Director, Office of Vital Statistics Steven Schwartz, Ph.D., Registrar
Kevin Koshar, M.P.P., Director, Office of Vital Records Wenhui Li, Ph.D., Director, Statistical Analysis and Reporting Unit Flor Betancourt, M.A., Director, Birth and Death Registration Unit
Tara Das, Ph.D., M.P.H, Director, Electronic Vital Event Registry System Unit Ann Madsen, Ph.D., M.P.H, Director, Quality Assurance Unit
JANUARY 2010 This report was prepared by the Statistical Analysis and Reporting Unit of the Bureau of Vital Statistics: Wenhui Li, Ph.D., Joseph Kennedy, Darlene Kelley, Ying Sun, Ph.D., Gil Maduro, Ph.D., and Shunhua Shen, M.S. The data are derived from vital event certificates filed with and processed by the staff of the Offices of Vital Records and Vital Statistics. The HIV Epidemiology and Field Service Program provided data for Table 48 and text for Figure 14. The Bureaus of Communicable Disease, Immunization, and Tuberculosis Control provided data for Table 47. New York City Office of City Clerk provided marriage license data for Table 1 and Table 49. This publication is available at http://www.nyc.gov/vitalstats.

3
CONTENTS
PAGEIntroduction . . . . . . . . . . . . . . . . . . . . . . . . . . . . . . . . . . . . . . . . . . . . . . . . . . . . . . . . . . . . . . . . . . . . . . . . . . . . . . . . . . . . . . . . . . . 5Highlights . . . . . . . . . . . . . . . . . . . . . . . . . . . . . . . . . . . . . . . . . . . . . . . . . . . . . . . . . . . . . . . . . . . . . . . . . . . . . . . . . . . . . . . . . . . . 6
Table 1 Population, live births, fertility rates, marriages, deaths, and infant mortality, 1898-2008. . . . . . . . . . . . . . . . . . . . . . . . . . . . . . . . . 7Table 2 Population estimates by age, mutually exclusive race and Hispanic origin, and sex, 2008. . . . . . . . . . . . . . . . . . . . . . . . . . . . . . . . . 8Table 3 Deaths and death rates per 1,000 population by age, ethnic group, and sex, 2008 . . . . . . . . . . . . . . . . . . . . . . . . . . . . . . . . . . . . . . 8Table 4 Deaths by cause by borough of residence and sex, and ICD-10/ICD-9 comparability ratio, 2008. . . . . . . . . . . . . . . . . . . . . . . . . . . . 10-11Table 5 Leading causes of death in specified age groups by sex, 2008. . . . . . . . . . . . . . . . . . . . . . . . . . . . . . . . . . . . . . . . . . . . . . . . . . . . . . 12-13Table 5a Leading causes of premature death by sex, age under 65, 2008. . . . . . . . . . . . . . . . . . . . . . . . . . . . . . . . . . . . . . . . . . . . . . . . . . . . . 16Table 6 Leading causes of death in specified ethnic groups by sex, 2008. . . . . . . . . . . . . . . . . . . . . . . . . . . . . . . . . . . . . . . . . . . . . . . . . . . . 17Table 6a Leading causes of premature death in specified ethnic groups by sex, age under 65, 2008. . . . . . . . . . . . . . . . . . . . . . . . . . . . . . . . 18Table 7 Deaths and death rates per 100,000 population from selected causes by ethnic group and sex, 2008. . . . . . . . . . . . . . . . . . . . . . . . 19Table 8 Deaths and death rates per 100,000 population from selected causes by community district of residence, 2008. . . . . . . . . . . . . . . . 20-21Table 9 Deaths by place of death, 2002-2008. . . . . . . . . . . . . . . . . . . . . . . . . . . . . . . . . . . . . . . . . . . . . . . . . . . . . . . . . . . . . . . . . . . . . . . . 22Table 10 Deaths by ancestry and borough of residence, 2008. . . . . . . . . . . . . . . . . . . . . . . . . . . . . . . . . . . . . . . . . . . . . . . . . . . . . . . . . . . . . 22Table 11 Selected characteristics of deaths due to fatal occupational injuries, 2008 . . . . . . . . . . . . . . . . . . . . . . . . . . . . . . . . . . . . . . . . . . . . 23Table 12 Deaths by birthplace and borough of residence, 2008 . . . . . . . . . . . . . . . . . . . . . . . . . . . . . . . . . . . . . . . . . . . . . . . . . . . . . . . . . . . 24Table 13 Deaths by birthplace and age, 2008 . . . . . . . . . . . . . . . . . . . . . . . . . . . . . . . . . . . . . . . . . . . . . . . . . . . . . . . . . . . . . . . . . . . . . . . . . 24Table 14 Deaths due to accidents by age and sex, 2008. . . . . . . . . . . . . . . . . . . . . . . . . . . . . . . . . . . . . . . . . . . . . . . . . . . . . . . . . . . . . . . . . 25Table 15 Deaths due to intentional self-harm (suicide) by age and sex, 2008. . . . . . . . . . . . . . . . . . . . . . . . . . . . . . . . . . . . . . . . . . . . . . . . . . 25Table 16 Deaths due to assault (homicide) and legal intervention by age and sex, 2008. . . . . . . . . . . . . . . . . . . . . . . . . . . . . . . . . . . . . . . . . 26Table 17 Deaths due to events of undetermined intent by age and sex, 2008. . . . . . . . . . . . . . . . . . . . . . . . . . . . . . . . . . . . . . . . . . . . . . . . . . 26Table 18 Deaths due to complications of medical and surgical care by age and sex, 2008. . . . . . . . . . . . . . . . . . . . . . . . . . . . . . . . . . . . . . . . 26Table 19 Deaths due to firearms by age and sex, 2008. . . . . . . . . . . . . . . . . . . . . . . . . . . . . . . . . . . . . . . . . . . . . . . . . . . . . . . . . . . . . . . . . . 26Table 20 Deaths from HIV disease by sex, age, and ethnic group, 1983-2008. . . . . . . . . . . . . . . . . . . . . . . . . . . . . . . . . . . . . . . . . . . . . . . . . 28-29Table 21 Deaths and death rates per 100,000 population for selected causes by ethnic group, sex, and age, 2008. . . . . . . . . . . . . . . . . . . . . 31Table 22 Life expectancy at specified ages by sex and ethnic group, 1989-1991 and 1999-2001 . . . . . . . . . . . . . . . . . . . . . . . . . . . . . . . . . . 32Table 23 Life expectancy at specified ages by sex, 1999-2007 . . . . . . . . . . . . . . . . . . . . . . . . . . . . . . . . . . . . . . . . . . . . . . . . . . . . . . . . . . . . 33Table 24 Years of potential life lost (YPLL) before age 75 by sex and selected causes of death, 2008. . . . . . . . . . . . . . . . . . . . . . . . . . . . . . . . 34Table 25 Deaths and crude death rates per 100,000 population from selected causes, 1901-2008. . . . . . . . . . . . . . . . . . . . . . . . . . . . . . . . . . 36-37Table 25a Average yearly age-sex-specific death rates per 1,000 population, 1909-2001. . . . . . . . . . . . . . . . . . . . . . . . . . . . . . . . . . . . . . . . . . 38Table 25b Average yearly age-sex-race-adjusted death rates for selected causes per 100,000 population, 1901-2001. . . . . . . . . . . . . . . . . . . . . 38Table 26 Live births, and spontaneous terminations, and induced terminations of pregnancy by borough of residence and age of woman. . . . 41Table 27 Spontaneous terminations of pregnancy by gestational age and age of woman, 2008. . . . . . . . . . . . . . . . . . . . . . . . . . . . . . . . . . . . 41Table 27a Selected characteristics of spontaneous terminations of pregnancy, 28 weeks gestation and over by age of woman, 2008 . . . . . . . . 42Table 27b Selected characteristics of spontaneous terminations of pregnancy, 28 weeks gestation and over by ethnic group
of woman, 2008 . . . . . . . . . . . . . . . . . . . . . . . . . . . . . . . . . . . . . . . . . . . . . . . . . . . . . . . . . . . . . . . . . . . . . . . . . . . . . . . . . . . . . . . . 42Table 28 Live births, spontaneous terminations of pregnancy 28 weeks gestation and over, and induced terminations of pregnancy, by boroughs of residence and occurrence, 2008. . . . . . . . . . . . . . . . . . . . . . . . . . . . . . . . . . . . . . . . . . . . . . . . . . . . . . . . . . . . . . . . 43Table 28a Teen births and pregnancy rates by ethnic group and borough of residence, 2008. . . . . . . . . . . . . . . . . . . . . . . . . . . . . . . . . . . . . . 44Table 29 Induced terminations of pregnancy by selected characteristics and age of woman, 2008. . . . . . . . . . . . . . . . . . . . . . . . . . . . . . . . . . 45Table 29a Induced terminations of pregnancy by woman's marital status, age, and ethnic group, 1999-2008. . . . . . . . . . . . . . . . . . . . . . . . . . 45Table 30 Live births by ancestry of mother and borough of residence, 2008. . . . . . . . . . . . . . . . . . . . . . . . . . . . . . . . . . . . . . . . . . . . . . . . . . 46Table 31 Live births by mother's ethnic group and age, 2008. . . . . . . . . . . . . . . . . . . . . . . . . . . . . . . . . . . . . . . . . . . . . . . . . . . . . . . . . . . . . 46Table 32 Selected characteristics of live births by age of mother, 2008 . . . . . . . . . . . . . . . . . . . . . . . . . . . . . . . . . . . . . . . . . . . . . . . . . . . . . . 47Table 33 Selected characteristics of live births by mother's ethnic group, 2008 . . . . . . . . . . . . . . . . . . . . . . . . . . . . . . . . . . . . . . . . . . . . . . . . 48Table 34 Live births by selected characteristics and infant deaths by health center district of residence, 2008 . . . . . . . . . . . . . . . . . . . . . . . . . 50Table 35 Live births by selected characteristics and mother's ancestry, 2008. . . . . . . . . . . . . . . . . . . . . . . . . . . . . . . . . . . . . . . . . . . . . . . . . . 50Table 36 Live births by selected characteristics and infant deaths by community district of residence, 2008 . . . . . . . . . . . . . . . . . . . . . . . . . . 51Table 37 Live births by mother's birthplace and borough of residence, 2008. . . . . . . . . . . . . . . . . . . . . . . . . . . . . . . . . . . . . . . . . . . . . . . . . . 54Table 38 Live births by mother's birthplace and age, 2008. . . . . . . . . . . . . . . . . . . . . . . . . . . . . . . . . . . . . . . . . . . . . . . . . . . . . . . . . . . . . . . 54Table 39 Live births to teenagers (age<20) by selected characteristics and infant deaths by health center district of residence, 2008 . . . . . . . 55Table 40 Live births to teenagers (age<20) by selected characteristics, 1995-2008. . . . . . . . . . . . . . . . . . . . . . . . . . . . . . . . . . . . . . . . . . . . . 55Table 41 Live births to teenagers (age<20) by selected characteristics and infant deaths by community district of residence, 2006-2008 . . . . 59Table 42a Live births and infant deaths by birth weight, ethnic group, and age, 2008. . . . . . . . . . . . . . . . . . . . . . . . . . . . . . . . . . . . . . . . . . . . 60Table 42b Infant mortality rates by birth weight, ethnic group, and age, 2008. . . . . . . . . . . . . . . . . . . . . . . . . . . . . . . . . . . . . . . . . . . . . . . . . . 60Table 42c Live births and infant deaths by gestational age, ethnic group, and age, 2008. . . . . . . . . . . . . . . . . . . . . . . . . . . . . . . . . . . . . . . . . . 61Table 42d Infant mortality rates by gestational age, ethnic group, and age, 2008. . . . . . . . . . . . . . . . . . . . . . . . . . . . . . . . . . . . . . . . . . . . . . . . 61Table 43 Infant deaths by ethnic group, sex, and age, 2008. . . . . . . . . . . . . . . . . . . . . . . . . . . . . . . . . . . . . . . . . . . . . . . . . . . . . . . . . . . . . . . 61Table 44 Infant deaths by cause, sex, and age, 2008. . . . . . . . . . . . . . . . . . . . . . . . . . . . . . . . . . . . . . . . . . . . . . . . . . . . . . . . . . . . . . . . . . . . 62Table 45 Infant mortality rate by mother's birthplace, 2002-2008. . . . . . . . . . . . . . . . . . . . . . . . . . . . . . . . . . . . . . . . . . . . . . . . . . . . . . . . . . 62Table 46 Live births, and infant mortality, and maternal mortality by mother's ethnic group, 1992-2008. . . . . . . . . . . . . . . . . . . . . . . . . . . . . 63Table 47 Number of selected reportable diseases, 1940-2008. . . . . . . . . . . . . . . . . . . . . . . . . . . . . . . . . . . . . . . . . . . . . . . . . . . . . . . . . . . . . 64Table 48 Incidence of AIDS by sex, major risk group, and year of diagnosis, 1981-2008. . . . . . . . . . . . . . . . . . . . . . . . . . . . . . . . . . . . . . . . . 64Table 49 Marriages, births, deaths, and infant deaths by month and average per day, 2008 . . . . . . . . . . . . . . . . . . . . . . . . . . . . . . . . . . . . . . 65

4
Table 50 Most popular baby names by sex, selected years . . . . . . . . . . . . . . . . . . . . . . . . . . . . . . . . . . . . . . . . . . . . . . . . . . . . . . . . . . . . . . . 65Table 51 Most popular baby names by sex and mother's ethnic group, 2008 . . . . . . . . . . . . . . . . . . . . . . . . . . . . . . . . . . . . . . . . . . . . . . . . . 65Table 52 Live births by borough and institution, 2008 . . . . . . . . . . . . . . . . . . . . . . . . . . . . . . . . . . . . . . . . . . . . . . . . . . . . . . . . . . . . . . . . . . 66Table 53 Fetal-infant mortality rate per 1,000 births and fetal deaths by Perinatal Period of Risk, year, and ethnic group, 2004-2008 . . . . . . . 68Table 53a Fetal-infant mortality rate per 1,000 births and fetal deaths by Perinatal Period of Risk, and community district of residence,
2004-2008 . . . . . . . . . . . . . . . . . . . . . . . . . . . . . . . . . . . . . . . . . . . . . . . . . . . . . . . . . . . . . . . . . . . . . . . . . . . . . . . . . . . . . . . . . . . . 69Table 54 Smoking-attributable deaths, and age-adjusted death rates, and their changes, age 35 years and older, 2003-2008 . . . . . . . . . . . . . . 70-71Table 55 Alcohol-attributable deaths, age 20 years and older, 2003-2008 . . . . . . . . . . . . . . . . . . . . . . . . . . . . . . . . . . . . . . . . . . . . . . . . . . . . 72
Figure 1 Age composition of the population, 1900-2000 . . . . . . . . . . . . . . . . . . . . . . . . . . . . . . . . . . . . . . . . . . . . . . . . . . . . . . . . . . . . . . . . 9Figure 2 Age-sex composition of the population, 2008 estimate . . . . . . . . . . . . . . . . . . . . . . . . . . . . . . . . . . . . . . . . . . . . . . . . . . . . . . . . . . . 9Figure 3 Deaths by ethnic group, 1989-2008 . . . . . . . . . . . . . . . . . . . . . . . . . . . . . . . . . . . . . . . . . . . . . . . . . . . . . . . . . . . . . . . . . . . . . . . . . 9Figure 4 Leading causes of death for males, 2008 . . . . . . . . . . . . . . . . . . . . . . . . . . . . . . . . . . . . . . . . . . . . . . . . . . . . . . . . . . . . . . . . . . . . . 14Figure 5 Leading causes of death for females, 2008 . . . . . . . . . . . . . . . . . . . . . . . . . . . . . . . . . . . . . . . . . . . . . . . . . . . . . . . . . . . . . . . . . . . . 14Figure 6a Age-adjusted death rates for trachea, bronchus, and lung malignant neoplasms, by sex, age 20 and over, 1994-2008 . . . . . . . . . . . 15Figure 6b Age-specific death rates for trachea, bronchus, and lung malignant neoplasms, by selected age group, 1994-2008 . . . . . . . . . . . . . 15Figure 7 Age-adjusted death rates for trachea, bronchus, and lung malignant neoplasms, by ethnic group, age 20 and over, 2008 . . . . . . . . . 15Figure 8 Number of deaths from selected causes, age under 65, 1989-2008 . . . . . . . . . . . . . . . . . . . . . . . . . . . . . . . . . . . . . . . . . . . . . . . . . 16Figure 9 Fatal occupational injuries by sex, 1997-2008 . . . . . . . . . . . . . . . . . . . . . . . . . . . . . . . . . . . . . . . . . . . . . . . . . . . . . . . . . . . . . . . . . 23Figure 10 Fatal occupational injuries by selected industries, 2008 . . . . . . . . . . . . . . . . . . . . . . . . . . . . . . . . . . . . . . . . . . . . . . . . . . . . . . . . . . 23Figure 11 Number of deaths from selected natural causes, 1989-2008 . . . . . . . . . . . . . . . . . . . . . . . . . . . . . . . . . . . . . . . . . . . . . . . . . . . . . . . 27Figure 12 Number of deaths from selected external causes, 1989-2008 . . . . . . . . . . . . . . . . . . . . . . . . . . . . . . . . . . . . . . . . . . . . . . . . . . . . . . 27Figure 13 Deaths due to HIV disease by sex and selected ethnic group, 1983-2008 . . . . . . . . . . . . . . . . . . . . . . . . . . . . . . . . . . . . . . . . . . . . . 30Figure 14 Mean age at death, all deaths and HIV disease deaths by sex, 1989-2008 . . . . . . . . . . . . . . . . . . . . . . . . . . . . . . . . . . . . . . . . . . . . 30Figure 15 Changes in life expectancy at selected ages by sex, 1990 and 2000, New York City and United States . . . . . . . . . . . . . . . . . . . . . . 35Figure 16 Years of potential life lost (YPLL) before age 75 by sex, selected causes, 2008 . . . . . . . . . . . . . . . . . . . . . . . . . . . . . . . . . . . . . . . . . 35Figure 17 Live births, and induced terminations, and spontaneous terminations of pregnancy by age of woman, 2008 . . . . . . . . . . . . . . . . . . 39Figure 18 Infant, neonatal, and post-neonatal mortality rates, 1991-2008 . . . . . . . . . . . . . . . . . . . . . . . . . . . . . . . . . . . . . . . . . . . . . . . . . . . . 39Figure 19 Number of live births, induced terminations, and spontaneous terminations, 1989-2008 . . . . . . . . . . . . . . . . . . . . . . . . . . . . . . . . . 40Figure 20 Percent and rate of live births to teenagers by borough of residence, 2006-2008 . . . . . . . . . . . . . . . . . . . . . . . . . . . . . . . . . . . . . . . 40Figure 21 Percent of live births covered by Medicaid, 1989-2008 . . . . . . . . . . . . . . . . . . . . . . . . . . . . . . . . . . . . . . . . . . . . . . . . . . . . . . . . . . 49Figure 22 Percent of multiple births by mother's age, 1991-2008 . . . . . . . . . . . . . . . . . . . . . . . . . . . . . . . . . . . . . . . . . . . . . . . . . . . . . . . . . . . 49Figure 23 Live births by mother's ethnic group, 1989-2008 . . . . . . . . . . . . . . . . . . . . . . . . . . . . . . . . . . . . . . . . . . . . . . . . . . . . . . . . . . . . . . . 53Figure 24 Percent of live births with specified characteristics, 1989-2008 . . . . . . . . . . . . . . . . . . . . . . . . . . . . . . . . . . . . . . . . . . . . . . . . . . . . 53Figure 25 Infant mortality rate, 1898-2008 . . . . . . . . . . . . . . . . . . . . . . . . . . . . . . . . . . . . . . . . . . . . . . . . . . . . . . . . . . . . . . . . . . . . . . . . . . . . 58Figure 26 Infant mortality rate by ethnic group, 2008 . . . . . . . . . . . . . . . . . . . . . . . . . . . . . . . . . . . . . . . . . . . . . . . . . . . . . . . . . . . . . . . . . . . . 58Figure 27 Components of Perinatal Periods of Risk . . . . . . . . . . . . . . . . . . . . . . . . . . . . . . . . . . . . . . . . . . . . . . . . . . . . . . . . . . . . . . . . . . . . . 67Figure 28 Fetal-infant mortality rates per 1,000 births and fetal deaths, 1999-2008 . . . . . . . . . . . . . . . . . . . . . . . . . . . . . . . . . . . . . . . . . . . . . 68
Map 1 Percent of live births to non-married mothers by community district of residence, 2008 . . . . . . . . . . . . . . . . . . . . . . . . . . . . . . . . . . 52Map 2 Percent of live births to foreign-born mothers by community district of residence, 2008 . . . . . . . . . . . . . . . . . . . . . . . . . . . . . . . . . . 52Map 3 Percent of live births to teenagers by community district of residence, 2006-2008 . . . . . . . . . . . . . . . . . . . . . . . . . . . . . . . . . . . . . . 56Map 4 Percent pre-pregnancy obesity by community district of residence, 2008 . . . . . . . . . . . . . . . . . . . . . . . . . . . . . . . . . . . . . . . . . . . . . 56Map 5 Infant mortality rate by community district of residence, 2008 . . . . . . . . . . . . . . . . . . . . . . . . . . . . . . . . . . . . . . . . . . . . . . . . . . . . . 57Map 6 Infant mortality rate by health center district of residence, 2008 . . . . . . . . . . . . . . . . . . . . . . . . . . . . . . . . . . . . . . . . . . . . . . . . . . . . 57Map 7 Health center districts and boroughs, New York City . . . . . . . . . . . . . . . . . . . . . . . . . . . . . . . . . . . . . . . . . . . . . . . . . . . . . . . . . . . . 97Map 8 Community districts and boroughs, New York City . . . . . . . . . . . . . . . . . . . . . . . . . . . . . . . . . . . . . . . . . . . . . . . . . . . . . . . . . . . . . 98 Perinatal Periods of Risk (PPOR) approach to understanding fetal-infant mortality . . . . . . . . . . . . . . . . . . . . . . . . . . . . . . . . . . . . . . . . . . . . . . . . . . . . 67-69
Special Section: Take Care New York (TCNY) - Vital Indicators. . . . . . . . . . . . . . . . . . . . . . . . . . . . . . . . . . . . . . . . . . . . . . . . . . . . . . . . . . . . . . . . . . 73-77Figure SS1 Age-adjusted death rate per 100,000 population for smoking-attributable deaths (age 35 years and older) by sex, 2002-2008. . . . . 73Figure SS2 Age-adjusted premature death rate per 100,000 population for major cardiovascular by race/ethnicity, 1994-2008. . . . . . . . . . . . . 74Figure SS3 Age-adjusted death rate per 100,000 population for HIV by race/ethnicity, 1994-2008. . . . . . . . . . . . . . . . . . . . . . . . . . . . . . . . . . 74Figure SS4 Age-adjusted suicide death rate per 100,000 population by sex, 1994-2008. . . . . . . . . . . . . . . . . . . . . . . . . . . . . . . . . . . . . . . . . . . 75Figure SS5 Age-adjusted death rate per 100,000 population for accidental poisoning/drug overdose by poverty area, 2000-2008. . . . . . . . . . . 75Figure SS6 Age-adjusted colorectal death rate per 100,000 population by race/ethnicity, 1994-2008. . . . . . . . . . . . . . . . . . . . . . . . . . . . . . . . . 76Figure SS7 Infant mortality rate per 1,000 live births, 1994-2008. . . . . . . . . . . . . . . . . . . . . . . . . . . . . . . . . . . . . . . . . . . . . . . . . . . . . . . . . . . . 76Figure SS8 Infant mortality rate per 10,000 live births due to injuries and SIDS by race/ethnicity, 1999-2008. . . . . . . . . . . . . . . . . . . . . . . . . . 77Figure SS9 Teen pregnancy rate per 1,000 women by race/ethnicity, 1999-2008. . . . . . . . . . . . . . . . . . . . . . . . . . . . . . . . . . . . . . . . . . . . . . . . 77
Rates and Ratios Defined . . . . . . . . . . . . . . . . . . . . . . . . . . . . . . . . . . . . . . . . . . . . . . . . . . . . . . . . . . . . . . . . . . . . . . . . . . . . . . . . . . . . . . . . . . . . . . 78
Technical Notes . . . . . . . . . . . . . . . . . . . . . . . . . . . . . . . . . . . . . . . . . . . . . . . . . . . . . . . . . . . . . . . . . . . . . . . . . . . . . . . . . . . . . . . . . . . . . . . . . . . . . 79-85
Sample certificates of birth, death, spontaneous and induced termination of pregnancy . . . . . . . . . . . . . . . . . . . . . . . . . . . . . . . . . . . . . . . . . . . . . . . 86-96

5
INTRODUCTION SUMMARY OF VITAL STATISTICS - 2008
DESCRIPTION The 2008 Annual Summary presents data on 2008 vital events including births, deaths, and spontaneous and induced terminations of pregnancy in New York City (NYC). These data, compiled by the Office of Vital Statistics, are derived from vital event certificates filed with the Office of Vital Records at the NYC Department of Health and Mental Hygiene (DOHMH). The Office of Vital Records is responsible for registering, archiving, amending, and issuing certified copies of all vital events occurring in NYC. All NYC vital events (births, deaths, spontaneous and induced terminations of pregnancy) are required to be filed with the NYC DOHMH, Bureau of Vital Statistics. For deaths, the Electronic Vital Events Registration System (EVERS)’s Electronic Death Registrations System (EDRS) has been available for voluntary use by hospitals since 2005. On January 1, 2008, the DOHMH launched the Electronic Birth Registration System (EBRS), a new component of the web-based EVERS. All hospitals registering more than 100 births per year were mandated to provide birth certificate data using this new electronic system. With this launch came the revised birth certificate based on the recommended 2003 US Standard Certificate of Live Birth (http://www.cdc.gov/nchs/data/dvs/birth11-03final-ACC.pdf). As a result, some of the birth data items have changed. For specific information on changes to birth items, please see the Technical Notes section of this Summary under Births. All information on spontaneous and induced termination of pregnancy events are collected on paper certificates and entered at the DOHMH. The Annual Summary presents tables, figures, and maps detailing population and vital event data. Deaths are characterized by demographics, natural and external causes, life expectancy, years of potential life lost due to specific causes. Trends in smoking-related and alcohol-related deaths are included. Incidence of AIDS and other selected reportable diseases are also presented. Births are presented by a number of variables, including mother’s age, ethnicity, ancestry, marital status, parity, newborn’s sex, gestational age, weight, plurality, and Apgar score. Frequencies of marriage and baby names are also included. Special attention is given to teenage births and infant mortality. Tables on Perinatal Periods of Risk (PPOR) are also presented. Lastly, this Summary includes a special report that describes Take Care New York 2012, vital indicators of health in NYC. This report presents data on all births, deaths, and spontaneous and induced terminations of pregnancy in NYC. They may occur to both residents and non-residents. Tables with geographic breakdowns distinguish among residents, non-residents, and resident status unknown. In tables showing no geographic breakdowns, all vital events occurring in NYC are included. For Annual Summaries back to 1961, see our website at: www.nyc.gov/vitalstats. If you have used previous Summaries, you will find that most table numbers remain consistent, providing the ability to assess changes and trends in the data. However, figure numbers have changed, as many are new and supplement the data tables. NYC Vital Statistics data are also available on the website indicated above or on the EpiQuery website at: https://a816-healthpsi.nyc.gov/epiquery/EpiQuery/. EpiQuery for Vital Statistics is a relatively new site; it currently contains death and birth data for individual years between 2000 and 2007, and all-cause and cause-of-death specific trend data from 1994 to 2007. New data and modifications are being implemented regularly.

6
HIGHLIGHTS Births - Births to teenagers have declined each year since 1994, with the exception of an increase in 2006, decreasing by 1.7% between 2007 and 2008 to 8,423. Births to teenagers comprised 6.6% of all live births in 2008 and have decreased each year since 1994. Infant Deaths - The 2008 infant mortality rate (IMR) of 5.5 infant deaths (under one year of age) per 1,000 live births, remained very close to its 2007 historical low. In the last 10 years IMR has declined 20.3%, from 6.9 in 1999 (Table 1). Perinatal Periods of Risk - Total fetal-infant mortality declined 1.4% from 2007 to 2008. There are still striking disparities among mother’s racial/ethnic groups, with non-Hispanic black women having the highest rate. Deaths – The mortality rate was stable at the historically low rate of 6.5 deaths be 1,000 persons. The rate of premature deaths (occurring under age 65) remained at 2.2 per 1,000 in 2008. Leading Causes of Death - Heart disease, cancer, and influenza/pneumonia, in that order, remained the top three leading causes of death in 2008 (Table 5). Deaths due to diabetes mellitus increased 5.3%, deaths due to chronic lower respiratory disease increased 12.5% and deaths due to essential hypertension and hypertensive renal disease increased 12.4%. Drug-related deaths decreased 13.3%. Cancer, Heart Disease and HIV remain the top three leading causes of premature deaths (deaths among those under 65 years old) in 2008 (Table 5a). Deaths due to the use of or poisoning by psychoactive drugs decreased 14.3%. Smoking-attributable Deaths - Deaths caused by smoking in adults aged 35 years and older decreased 11.2% over the past 5 years, from 8,520 in 2003 to 7,569 in 2008. These decreases were driven by an estimated 418 fewer ischemic heart disease deaths and 239 fewer trachea, lung, and bronchus deaths. Alcohol-attributable Deaths – Alcohol-attributable deaths in adults aged 20 and older remained steady at approximately 1,700 deaths per year between 2003 and 2008. Life Expectancy – Life expectancy continued to rise, increasing nearly 5 months from 79.0 in 2006 to 79.4 in 2007 (Table 23). Data from 2008 are not included since deaths occurring to NYC residents outside of NYC are not yet available. Other Notable Changes in Causes of Death – While HIV remains among the 10 leading causes of death in NYC, in the last 5 years, no deaths from HIV disease have occurred among infants and for the first time in 2008 no HIV deaths have occurred in New Yorkers below the age of 15 (Table 20). Special Section - This summary, for the first time, reports trends in all Take Care New York Vital Indicators. Details on methods used in the Summary preparation are provided in the Technical Notes at the end of this report.

7
Table 1. Population, Live Births, Fertility Rates, Marriages, Deaths, and Infant Mortality, New York City, 1898-2008
Live Births Fertility Rates Marriages Deaths Infant MortalityRate per Per 1,000 Rate per Rate per Deaths Rate per
Population Total 1,000 Women Total 1,000 Total 1,000 Under 1,000 Year April 1 Reported* Population Aged 15-44 Reported* Population Reported* Population One Year* Live Births
1898-1900 3,358,000 119,000 35.4 30,535 9.1 67,503 20.1 16,264 136.7
1901-1905 3,786,000 129,000 34.1 37,988 10.0 71,689 18.9 15,611 121.01906-1910 4,473,000 144,000 32.2 44,966 10.1 75,865 17.0 16,609 115.31911-1915 5,049,000 140,581 27.8 51,157 10.1 74,666 14.8 14,060 100.01916-1920 5,492,000 136,101 24.8 59,081 10.8 80,435 14.6 12,004 88.21921-1925 6,175,000 130,462 21.1 62,710 10.2 69,303 11.2 8,985 68.9
1926-1930 6,703,000 125,590 18.7 62,278 9.3 75,395 11.2 7,662 61.01931-1935 7,101,000 106,179 15.0 63,273 8.9 75,561 10.6 5,521 52.01936-1940 7,363,000 102,418 13.9 69,184 9.4 76,065 10.3 4,079 39.81941-1945 7,597,000 126,495 16.7 76,086 10.0 78,382 10.3 3,525 27.91946-1950 7,815,000 158,926 20.3 90,914 11.6 79,708 10.2 4,139 26.0
1951-1955 7,867,000 163,526 20.8 71,689 9.1 80,583 10.2 3,986 24.41956-1960 7,806,000 166,949 21.4 68,281 8.7 84,290 10.8 4,290 25.71961-1965 7,816,200 165,197 21.1 68,318 8.7 87,597 11.2 4,333 26.2
1966 7,850,000 153,335 19.5 66,689 8.5 88,418 11.3 3,819 24.91967 7,862,000 145,802 18.5 68,876 8.8 87,610 11.1 3,489 23.91968 7,873,000 141,920 18.0 73,307 9.3 91,169 11.6 3,282 23.11969 7,885,000 146,221 18.5 75,220 9.5 88,535 11.2 3,563 24.41970 7,894,862 149,192 18.9 74,174 9.4 88,161 11.2 3,230 21.6
1971 7,832,000 131,920 16.8 73,810 9.4 86,724 11.1 2,751 20.91972 7,731,000 117,088 15.1 73,253 9.5 85,363 11.0 2,321 19.81973 7,648,000 110,639 14.5 70,104 9.2 82,319 10.8 2,206 19.91974 7,566,000 110,642 14.6 61,925 8.2 79,846 10.6 2,175 19.71975 7,484,000 109,418 14.6 59,591 8.0 76,312 10.2 2,110 19.3
1976 7,401,000 109,995 14.9 55,829 7.5 77,538 10.5 2,092 19.01977 7,318,000 110,486 15.1 52,804 7.2 75,011 10.3 1,971 17.81978 7,236,000 106,720 14.7 54,247 7.5 73,081 10.1 1,827 17.11979 7,154,000 106,021 14.8 58,532 8.2 72,079 10.1 1,767 16.71980 7,071,639 107,066 15.1 63.6 58,637 8.3 76,625 10.8 1,719 16.1
1981 7,097,000 108,547 15.3 63.9 61,775 8.7 73,329 10.3 1,678 15.51982 7,122,000 111,487 15.7 65.1 66,619 9.4 73,083 10.3 1,706 15.31983 7,147,000 112,353 15.7 65.1 68,164 9.5 73,544 10.3 1,603 14.31984 7,172,000 113,332 15.8 65.1 76,336 10.6 74,278 10.4 1,540 13.61985 7,197,000 118,542 16.5 67.6 77,897 10.8 74,852 10.4 1,591 13.4
1986 7,222,000 122,108 16.9 69.0 82,199 11.4 75,702 10.5 1,566 12.81987 7,247,000 127,386 17.6 71.5 76,194 10.5 76,448 10.5 1,673 13.11988 7,272,000 132,226 18.2 73.6 74,137 10.2 77,817 10.7 1,770 13.41989 7,297,000 137,673 18.9 76.0 69,758 9.6 75,957 10.4 1,827 13.31990 7,322,564 139,630 19.1 76.5 71,301 9.7 73,875 10.1 1,620 11.6
1991 7,388,000 138,148 18.7 75.3 69,314 9.4 72,421 9.8 1,575 11.41992 7,455,000 136,002 18.2 73.8 71,947 9.7 71,001 9.5 1,390 10.21993 7,522,000 133,583 17.8 72.1 72,490 9.6 73,408 9.8 1,366 10.21994 7,590,000 133,662 17.6 71.8 70,438 9.3 71,038 9.4 1,207 9.01995 7,658,000 131,009 17.1 70.1 71,507 9.3 70,769 9.2 1,155 8.8
1996 7,727,000 126,901 16.4 67.5 79,361 10.3 66,784 8.6 992 7.81997 7,796,000 123,313 15.8 65.3 80,027 10.3 62,506 8.0 881 7.11998 7,866,000 124,252 15.8 65.5 53,661 6.8 61,010 7.8 843 6.81999 7,937,000 123,739 15.6 64.9 55,075 6.9 62,470 7.9 848 6.92000 8,008,278 125,563 15.7 65.5 58,291 7.3 60,839 7.6 839 6.7
2001** 8,055,166 124,023 15.4 ** 64.7 ** 72,587 9.0 ** 62,964 7.8 ** 760 6.12001** 8,055,166 Excluding World Trade Center disaster deaths 60,218 7.5 **2002** 8,072,011 122,937 15.2 ** 64.4 ** 65,490 8.1 ** 59,651 7.4 ** 742 6.02003** 8,085,742 124,345 15.4 ** 65.2 ** 61,101 7.6 ** 59,213 7.3 ** 807 6.52004** 8,104,079 124,099 15.3 ** 65.3 ** 62,057 7.7 ** 57,466 7.1 ** 760 6.12005** 8,143,197 122,725 15.1 ** 64.8 ** 66,348 8.1 ** 57,068 7.0 ** 732 6.0
2006** 8,214,426 125,506 15.3 ** 66.5 ** 65,619 8.0 ** 55,391 6.7 ** 740 5.92007 8,274,527 128,961 15.6 68.5 66,483 8.0 54,073 6.5 697 5.42008 8,363,710 127,680 15.3 68.0 66,670 8.0 54,193 6.5 698 5.5
* Figures prior to 1966 are averages across the years presented; single-year figures prior to 1966 appear in the annual summaries for 1965 and earlier. Figures for 1898-1913 births are estimated. Intercensal population counts from 1960 to 1990 use a linear interpolation, while 1990 to 2000 are interpolated using an exponential formula. Number of marriages is provided by New York City Office of City Clerk.**Population data for years 2001-2006 have been revised by using pre-challenged U.S. Census Bureau's estimates and therefore rates may be slightly different from previous publication. All estimates are at July 1 of each year. See Technical Notes: Population.

8
Table 2. Population Estimates by Age, Mutually Exclusive Race and Hispanic Origin, and Sex, New York City, 2008
All Hispanic Non-Hispanic White Non-Hispanic Black Asian and Pacific Islander Other or Multiple RaceAge in Years Total Male Female Total Male Female Total Male Female Total Male Female Total Male Female Total Male Female
All Ages 8,363,710 3,995,209 4,368,501 2,313,399 1,120,337 1,193,062 2,959,458 1,434,499 1,524,959 1,965,085 884,609 1,080,476 998,598 494,636 503,962 127,170 61,128 66,042Under 5 575,742 294,310 281,432 198,553 100,889 97,664 159,694 82,032 77,662 134,316 68,340 65,976 66,933 34,684 32,249 16,246 8,365 7,8815-9 519,022 265,374 253,648 171,659 87,579 84,080 148,197 76,263 71,934 126,615 64,111 62,504 60,136 31,087 29,049 12,415 6,334 6,08110-14 498,542 254,346 244,196 166,766 84,892 81,874 131,359 67,608 63,751 136,004 68,816 67,188 55,155 28,385 26,770 9,258 4,645 4,61315-19 551,139 278,564 272,575 182,780 91,444 91,336 147,427 76,097 71,330 156,504 77,862 78,642 55,050 28,520 26,530 9,378 4,641 4,73720-24 580,628 281,935 298,693 182,661 90,261 92,400 172,773 85,525 87,248 154,088 71,299 82,789 60,645 29,937 30,708 10,461 4,913 5,54825-29 597,650 294,076 303,574 191,710 100,168 91,542 175,780 83,964 91,816 143,944 69,051 74,893 76,830 36,421 40,409 9,386 4,472 4,91430-34 643,340 312,978 330,362 184,551 94,597 89,954 234,822 114,743 120,079 126,185 57,121 69,064 88,993 42,300 46,693 8,789 4,217 4,57235-39 675,694 329,967 345,727 180,883 89,442 91,441 254,456 129,983 124,473 135,930 59,550 76,380 95,481 46,790 48,691 8,944 4,202 4,74240-44 643,889 317,112 326,777 173,054 84,286 88,768 227,330 119,355 107,975 148,552 65,282 83,270 86,138 43,912 42,226 8,815 4,277 4,53845-49 614,902 300,113 314,789 156,886 74,571 82,315 215,086 111,937 103,149 152,333 67,373 84,960 82,419 42,207 40,212 8,178 4,025 4,15350-54 552,696 261,447 291,249 131,948 60,241 71,707 207,120 102,822 104,298 132,588 57,291 75,297 74,032 37,675 36,357 7,008 3,418 3,59055-59 483,987 222,887 261,100 110,044 48,761 61,283 195,289 94,351 100,938 112,521 47,170 65,351 60,524 29,994 30,530 5,609 2,611 2,99860-64 388,605 173,141 215,464 86,519 37,616 48,903 167,348 77,798 89,550 88,549 35,531 53,018 42,168 20,426 21,742 4,021 1,770 2,25165-69 300,254 129,822 170,432 65,891 28,244 37,647 131,516 59,386 72,130 68,901 26,232 42,669 31,030 14,737 16,293 2,916 1,223 1,69370-74 237,728 100,161 137,567 49,020 19,980 29,040 108,503 47,824 60,679 53,539 19,949 33,590 24,688 11,638 13,050 1,978 770 1,20875-79 189,494 74,953 114,541 35,156 13,071 22,085 97,480 40,676 56,804 38,255 13,131 25,124 17,161 7,498 9,663 1,442 577 86580-84 149,175 53,255 95,920 23,665 7,880 15,785 84,930 31,709 53,221 28,511 8,828 19,683 11,042 4,513 6,529 1,027 325 70285 & Over 161,223 50,768 110,455 21,653 6,415 15,238 100,348 32,426 67,922 27,750 7,672 20,078 10,173 3,912 6,261 1,299 343 956
Data Source: U.S. Census Bureau, as of September 2009.
Table 3. Deaths and Death Rates per 1,000 Population* by Age, Ethnic Group**, and Sex, New York City, 2008
Age in All Hispanic Non-Hispanic White Non-Hispanic Black Asian and Pacific IslanderOther/MultipleRace/Unknown
Years Total Male Female Total Male Female Total Male Female Total Male Female Total Male Female Total Male FemaleNo. Rate No. Rate No. Rate No. Rate No. Rate No. Rate No. Rate No. Rate No. Rate No. Rate No. Rate No. Rate No. Rate No. Rate No. Rate No. No. No.
All Ages 54,193 6.5 26,342 6.6 27,851 6.4 9,329 4.0 4,842 4.3 4,487 3.8 27,131 9.2 12,914 9.0 14,217 9.3 14,006 7.1 6,541 7.4 7,465 6.9 2,971 3.0 1,635 3.3 1,336 2.7 756 410 346
Age-Adjusted 6.1 7.5 5.1 5.5 6.9 4.5 6.0 7.3 5.0 7.6 9.4 6.4 3.8 4.6 3.1Under 5 798 1.4 449 1.5 349 1.2 207 1.0 133 1.3 74 0.8 197 1.2 104 1.3 93 1.2 314 2.3 171 2.5 143 2.2 50 0.7 24 0.7 26 0.8 30 17 135-9 77 0.1 50 0.2 27 0.1 21 0.1 13 0.1 8 0.1 21 0.1 13 0.2 8 0.1 28 0.2 21 0.3 7 0.1 5 0.1 2 0.1 3 0.1 - 1 110-14 76 0.2 45 0.2 31 0.1 27 0.2 13 0.2 14 0.2 17 0.1 12 0.2 5 0.1 25 0.2 16 0.2 9 0.1 7 0.1 4 0.1 3 0.1 0 - -15-19 206 0.4 145 0.5 61 0.2 54 0.3 41 0.4 13 0.1 44 0.3 30 0.4 14 0.2 92 0.6 62 0.8 30 0.4 13 0.2 9 0.3 4 0.2 3 3 -20-24 383 0.7 286 1.0 97 0.3 114 0.6 87 1.0 27 0.3 97 0.6 72 0.8 25 0.3 148 1.0 113 1.6 35 0.4 19 0.3 12 0.4 7 0.2 5 2 325-29 483 0.8 339 1.2 144 0.5 127 0.7 102 1.0 25 0.3 132 0.8 88 1.0 44 0.5 180 1.3 126 1.8 54 0.7 35 0.5 16 0.4 19 0.5 9 7 230-34 550 0.9 356 1.1 194 0.6 152 0.8 108 1.1 44 0.5 153 0.7 103 0.9 50 0.4 207 1.6 121 2.1 86 1.2 29 0.3 16 0.4 13 0.3 9 8 135-39 743 1.1 483 1.5 260 0.8 210 1.2 145 1.6 65 0.7 199 0.8 138 1.1 61 0.5 273 2.0 159 2.7 114 1.5 51 0.5 34 0.7 17 0.3 10 7 340-44 1,208 1.9 734 2.3 474 1.5 350 2.0 225 2.7 125 1.4 333 1.5 230 1.9 103 1.0 439 3.0 228 3.5 211 2.5 63 0.7 37 0.8 26 0.6 23 14 945-49 1,898 3.1 1,162 3.9 736 2.3 447 2.8 290 3.9 157 1.9 575 2.7 379 3.4 196 1.9 727 4.8 400 5.9 327 3.8 110 1.3 66 1.6 44 1.1 39 27 1250-54 2,663 4.8 1,629 6.2 1,034 3.6 601 4.6 374 6.2 227 3.2 899 4.3 565 5.5 334 3.2 953 7.2 549 9.6 404 5.4 158 2.1 106 2.8 52 1.4 52 35 1755-59 3,344 6.9 2,046 9.2 1,298 5.0 729 6.6 455 9.3 274 4.5 1,282 6.6 809 8.6 473 4.7 1,099 9.8 617 13.1 482 7.4 186 3.1 131 4.4 55 1.8 48 34 1460-64 3,902 10.0 2,264 13.1 1,638 7.6 815 9.4 474 12.6 341 7.0 1,644 9.8 971 12.5 673 7.5 1,203 13.6 661 18.6 542 10.2 188 4.5 123 6.0 65 3.0 52 35 1765-69 4,146 13.8 2,367 18.2 1,779 10.4 854 13.0 498 17.6 356 9.5 1,678 12.8 992 16.7 686 9.5 1,312 19.0 680 25.9 632 14.8 242 7.8 156 10.6 86 5.3 60 41 1970-74 4,832 20.3 2,598 25.9 2,234 16.2 911 18.6 476 23.8 435 15.0 2,151 19.8 1,205 25.2 946 15.6 1,410 26.3 695 34.8 715 21.3 294 11.9 193 16.6 101 7.7 66 29 3775-79 5,880 31.0 2,905 38.8 2,975 26.0 1,000 28.4 464 35.5 536 24.3 3,073 31.5 1,598 39.3 1,475 26.0 1,396 36.5 614 46.8 782 31.1 339 19.8 189 25.2 150 15.5 72 40 3280-84 7,277 48.8 3,271 61.4 4,006 41.8 987 41.7 422 53.6 565 35.8 4,258 50.1 2,006 63.3 2,252 42.3 1,517 53.2 595 67.4 922 46.8 416 37.7 200 44.3 216 33.1 99 48 5185+ 15,727 97.5 5,213 102.7 10,514 95.2 1,723 79.6 522 81.4 1,201 78.8 10,378 103.4 3,599 111.0 6,779 99.8 2,683 96.7 713 92.9 1,970 98.1 766 75.3 317 81.0 449 71.7 177 62 115
Mean age atdeath 71.7 67.6 75.6 66.0 61.4 71.1 76.6 72.9 80.0 66.5 62.0 70.4 70.7 68.3 73.5 67.5 63.3 72.4
Median age atdeath 76 71 80 69 64 75 81 77 84 70 65 74 75 72 79 72 66 79
* Population data are from U.S. Census Bureau's estimates as of September 2009.
** Multiple race categories were introduced in January 2003 when New York City implemented a new death certificate form. Beginning in 2003, multiple races are included in "Other/Mutiple Race/Unknown" category. See Technical Notes: Mutiple Race.

Figure 1. Age Composition of the Population New York City, 1900-2000
The changing age composition of New York City reflects changes in life expectancy as well as natural historic trends. The effect of the economic depression of the 1930s on the number of live births is seen in the lower percentage of residents under age 15 in 1940, while the post-World War II baby boom increased this segment rapidly after 1950. From 1900 to 2000, the proportion of residents age 45 and over doubled from 16% to 32% (more than 100% increase), with the greatest increase among those 85 and over. From 1990 to 2000, the proportion of residents age 65 to 84 declined 11%, while the proportion 85 and over increased 15%. Over this ten-year period, the median age of city residents increased from 33.7 to 34.2 years.
9
1900
1910
1920
1930
1940
1950
1960
1970
1980
1990
2000
Cen
sus
Year
s
Age Groups (Years)
31% 53% 13%
29%
28%
24%
20%
21%
24%
24%
20%
20%
3%
3%
53% 16% 3%
55% 17% 4%
53% 22% 5%
47% 24% 7%
40% 26% 10%
41% 23% 11%
45% 21% 12%
48% 19% 12%
14%55%
0.1%
0.1%
0.1%
0.1%
0.2%
0.3%
0.4%
0.7%
1.1%
1.3%
Under 15 15-44 45-64 65-84 85+
012345
80-84
75-79
70-74
65-69
60-64
55-59
50-54
45-49
40-44
35-39
30-34
25-29
20-24
15-19
10-14
5-9
0-4
0 1 2 3 4 5
85+Figure 2. Age-Sex Composition of the Population New York City, 2008 Estimate
This age-sex pyramid shows each age-sex group as a percent of the total population. There are more females than males overall, 52% to 48%, and more females in every age group over 19. The greatest difference is among those 85 and over, where there are more than two times as many women as men. The smaller segments of both males and females in the 5-9 and 10-14 age groups reflect the lower number of births in late 1990s and early 2000s compared to births in the past five years.
Percent of Population Percent of Population
Males Females
Age (Years)
20% 1.5%47% 21% 10%
Figure 3. Deaths by Ethnic Group,* New York City, 1989-2008
Between 1989 and 2008, the overall number of deaths decreased 28.7%, from 75,957 to 54,193. Non-Hispanic white deaths, which decreased 37.4%, accounted for most of the overall deaths. Deaths among non-Hispanic blacks decreased less, about 23%. In the same time period, deaths among Hispanics and Asians increased 4.3% and 29.9%, respectively. However, according to the Census, from 1990 to 2008 the population of Hispanics and Asians in the City increased 29.7% and 103.8%, respectively. Note that WTC disaster deaths are not included in this graph for the year 2001.* Race categories were changed in 2003. See Technical Notes: Race in the 2000 Census and Multiple Race.
1989
1990
1991
1992
1993
1994
1995
1996
1997
1998
1999
2000
2001
2002
2003
2004
2005
2006
2007
2008
Year
0
20
40
60
80
Thou
s and
s
Non-Hispanic Black
Non-Hispanic White
Hispanic
Asian & Pacific Islander
Other or Unknown

10
Table 4. Deaths by Cause by Borough of Residence and Sex, and ICD-10/ICD-9 Comparability RatioNew York City, 2008
BOROUGH OF RESIDENCE SEXICD10/ICD9
Staten Non- Residence Comparability Cause (Codes from International Classification of Diseases, Tenth Revision, 1999) Total Manhattan Bronx Brooklyn Queens Island Residents Unknown Male Female RatioTotal Deaths . . . . . . . . . . . . . . . . . . . . . . . . . . . . . . . . . . . . . . . . . . . . . . . . . . . . . . . . . . . . . . . . . . . . . . . . . . . 54,193 9,868 8,666 15,790 12,393 3,455 3,786 235 26,342 27,851
Natural Causes . . . . . . . . . . . . . . . . . . . . . . . . . . . . . . . . . . . . . . . . . . . . . . . . . . . . . . . . . . . . . . . . . . . . . . . . . 51,249 9,389 8,174 14,931 11,787 3,264 3,539 165 24,229 27,020
1.# Tuberculosis (A16-A19) . . . . . . . . . . . . . . . . . . . . . . . . . . . . . . . . . . . . . . . . . . . . . . . . . . . . . . . . . . . . 18 5 5 4 3 – 1 – 15 3 0.88 Respiratory tuberculosis (A16) . . . . . . . . . . . . . . . . . . . . . . . . . . . . . . . . . . . . . . . . . . . . . . . . . . . . . 13 3 4 3 2 – 1 – 11 2 0.94
2.# Septicemia (A40-A41) . . . . . . . . . . . . . . . . . . . . . . . . . . . . . . . . . . . . . . . . . . . . . . . . . . . . . . . . . . . . . . 324 52 93 89 60 12 16 2 153 171 1.19 3.# Viral hepatitis (B15-B19) . . . . . . . . . . . . . . . . . . . . . . . . . . . . . . . . . . . . . . . . . . . . . . . . . . . . . . . . . . . . 377 83 82 95 47 23 44 3 260 117 0.71 4.# Human immunodeficiency virus (HIV) disease (B20-B24) . . . . . . . . . . . . . . . . . . . . . . . . . . . . . . . . . . 1,073 268 305 318 105 26 37 14 702 371 1.08 5. All other infective and parasitic diseases (Rest of A01-B99) . . . . . . . . . . . . . . . . . . . . . . . . . . . . . . . . . 260 50 61 53 52 19 25 – 131 129 6.# Malignant neoplasms (C00-C97) . . . . . . . . . . . . . . . . . . . . . . . . . . . . . . . . . . . . . . . . . . . . . . . . . . . . . 13,047 2,618 1,938 3,443 2,716 825 1,474 33 6,476 6,571 1.01
Lip, oral cavity, and pharynx (C00-C14) . . . . . . . . . . . . . . . . . . . . . . . . . . . . . . . . . . . . . . . . . . . . . 188 39 30 50 48 3 17 1 133 55 0.96 Esophagus (C15) . . . . . . . . . . . . . . . . . . . . . . . . . . . . . . . . . . . . . . . . . . . . . . . . . . . . . . . . . . . . . . . 296 55 49 79 53 23 35 2 204 92 0.99
Stomach (C16) . . . . . . . . . . . . . . . . . . . . . . . . . . . . . . . . . . . . . . . . . . . . . . . . . . . . . . . . . . . . . . . . . 464 82 65 142 112 19 43 1 279 185 1.01 Colon, rectum, and anus (C18-C21) . . . . . . . . . . . . . . . . . . . . . . . . . . . . . . . . . . . . . . . . . . . . . . . . 1,419 273 225 428 287 94 107 5 713 706 1.00
Liver and intrahepatic bile ducts (C22) . . . . . . . . . . . . . . . . . . . . . . . . . . . . . . . . . . . . . . . . . . . . . . 570 112 101 140 116 33 66 2 402 168 0.96 Pancreas (C25) . . . . . . . . . . . . . . . . . . . . . . . . . . . . . . . . . . . . . . . . . . . . . . . . . . . . . . . . . . . . . . . . 950 203 122 252 195 61 114 3 432 518 1.00 Larynx (C32) . . . . . . . . . . . . . . . . . . . . . . . . . . . . . . . . . . . . . . . . . . . . . . . . . . . . . . . . . . . . . . . . . . 111 17 25 24 22 14 7 2 89 22 1.01 Trachea, bronchus, and lung (C33-C34) . . . . . . . . . . . . . . . . . . . . . . . . . . . . . . . . . . . . . . . . . . . . . 2,908 605 428 768 607 229 263 8 1,593 1,315 0.98 Melanoma of skin (C43) . . . . . . . . . . . . . . . . . . . . . . . . . . . . . . . . . . . . . . . . . . . . . . . . . . . . . . . . . 119 28 12 28 23 12 16 – 72 47 0.95 Mesothelioma (C45) . . . . . . . . . . . . . . . . . . . . . . . . . . . . . . . . . . . . . . . . . . . . . . . . . . . . . . . . . . . . 30 5 3 4 3 – 15 – 20 10 Breast (C50) . . . . . . . . . . . . . . . . . . . . . . . . . . . . . . . . . . . . . . . . . . . . . . . . . . . . . . . . . . . . . . . . . . . 1,102 232 168 306 207 81 107 1 7 1,095 1.01 Cervix uteri (C53) . . . . . . . . . . . . . . . . . . . . . . . . . . . . . . . . . . . . . . . . . . . . . . . . . . . . . . . . . . . . . . 138 25 34 42 22 3 12 – – 138 1.00 Corpus uteri and uterus, part unspecified (C54-C55) . . . . . . . . . . . . . . . . . . . . . . . . . . . . . . . . . . . . 284 51 56 99 32 19 27 – – 284 1.02 Ovary (C56) . . . . . . . . . . . . . . . . . . . . . . . . . . . . . . . . . . . . . . . . . . . . . . . . . . . . . . . . . . . . . . . . . . 354 72 38 96 78 31 39 – – 354 0.99 Prostate (C61) . . . . . . . . . . . . . . . . . . . . . . . . . . . . . . . . . . . . . . . . . . . . . . . . . . . . . . . . . . . . . . . . . 720 136 132 185 146 36 83 2 720 – 1.01 Kidney and renal pelvis (C64-C65) . . . . . . . . . . . . . . . . . . . . . . . . . . . . . . . . . . . . . . . . . . . . . . . . . 219 37 35 44 59 13 30 1 135 84 1.00 Bladder (C67) . . . . . . . . . . . . . . . . . . . . . . . . . . . . . . . . . . . . . . . . . . . . . . . . . . . . . . . . . . . . . . . . . 306 63 36 67 89 17 33 1 206 100 1.00 Meninges, brain, and other parts of central nervous system (C70-C72) . . . . . . . . . . . . . . . . . . . . . . 249 48 25 57 60 13 46 – 144 105 0.98 Lymphoid, hematopoietic and related tissues (C81-C96) . . . . . . . . . . . . . . . . . . . . . . . . . . . . . . . . . 1,296 258 170 305 260 63 237 3 688 608 1.00 Hodgkin's disease (C81) . . . . . . . . . . . . . . . . . . . . . . . . . . . . . . . . . . . . . . . . . . . . . . . . . . . . . . . 39 10 10 10 6 1 2 – 24 15 1.00 Non-Hodgkin's lymphoma (C82-C85) . . . . . . . . . . . . . . . . . . . . . . . . . . . . . . . . . . . . . . . . . . . . 479 96 64 111 97 22 87 2 265 214 0.98 Multiple myeloma and immunoproliferative neoplasms (C88, C90) . . . . . . . . . . . . . . . . . . . . . . 246 56 39 61 49 11 30 – 117 129 1.04 Leukemia (C91-C95) . . . . . . . . . . . . . . . . . . . . . . . . . . . . . . . . . . . . . . . . . . . . . . . . . . . . . . . . . . 532 96 57 123 108 29 118 1 282 250 1.01
7.# In situ or benign neoplasms and neoplasms of uncertain or unknown behavior (D00-D48) . . . . . . . . . 222 40 27 57 45 12 41 – 105 117 1.63 8.# Anemias (D50-D64) . . . . . . . . . . . . . . . . . . . . . . . . . . . . . . . . . . . . . . . . . . . . . . . . . . . . . . . . . . . . . . . 60 9 13 21 9 – 6 2 25 35 0.94 9.# Diabetes mellitus (E10-E14) . . . . . . . . . . . . . . . . . . . . . . . . . . . . . . . . . . . . . . . . . . . . . . . . . . . . . . . . . 1,643 297 379 511 313 74 68 1 763 880 1.02 10.## Mental and behavioral disorders due to use of alcohol (F10) . . . . . . . . . . . . . . . . . . . . . . . . . . . . . . . . 210 53 35 52 47 9 7 7 174 36 11. Mental and behavioral disorders due to use of psychoactive substance excluding
alcohol and tobacco (F11-F16, F18-F19) ### . . . . . . . . . . . . . . . . . . . . . . . . . . . . . . . . . . . . . . . . . . . 129 24 66 9 14 6 3 7 100 29 12. Diseases of nervous system (G00-G98) . . . . . . . . . . . . . . . . . . . . . . . . . . . . . . . . . . . . . . . . . . . . . . . . 855 259 162 157 194 34 47 2 346 509 # Meningitis (G00,G03) . . . . . . . . . . . . . . . . . . . . . . . . . . . . . . . . . . . . . . . . . . . . . . . . . . . . . . . . . . . 23 5 7 3 6 2 – – 13 10 1.01 # Parkinson's disease (G20-G21) . . . . . . . . . . . . . . . . . . . . . . . . . . . . . . . . . . . . . . . . . . . . . . . . . . . . 158 62 31 16 37 3 9 – 94 64 1.01 # Alzheimer's disease (G30) . . . . . . . . . . . . . . . . . . . . . . . . . . . . . . . . . . . . . . . . . . . . . . . . . . . . . . . . 374 122 75 65 91 7 14 – 93 281 1.58 13. Major cardiovascular diseases (I00-I78) . . . . . . . . . . . . . . . . . . . . . . . . . . . . . . . . . . . . . . . . . . . . . . . . 24,016 3,729 3,354 7,717 6,148 1,798 1,205 65 10,847 13,169 1.00 # Diseases of heart (I00-I09, I11, I13, I20-I51) . . . . . . . . . . . . . . . . . . . . . . . . . . . . . . . . . . . . . . . . . . 21,192 3,104 2,838 7,001 5,515 1,670 1,004 60 9,587 11,605 0.99
Acute rheumatic fever and chronic rheumatic heart diseases (I00-I09) . . . . . . . . . . . . . . . . . . . . 53 11 8 11 13 2 8 – 14 39 0.88 Hypertensive heart disease (I11) . . . . . . . . . . . . . . . . . . . . . . . . . . . . . . . . . . . . . . . . . . . . . . . . . 1,704 340 324 529 362 74 66 9 810 894 0.80 Hypertensive heart and renal disease (I13) . . . . . . . . . . . . . . . . . . . . . . . . . . . . . . . . . . . . . . . . . 92 21 20 26 16 4 5 – 41 51 1.13 Chronic ischemic heart disease (I20, I25) . . . . . . . . . . . . . . . . . . . . . . . . . . . . . . . . . . . . . . . . . . 15,475 1,974 1,841 5,355 4,351 1,235 678 41 6,998 8,477 1.01 Acute myocardial infarction (I21-I22) . . . . . . . . . . . . . . . . . . . . . . . . . . . . . . . . . . . . . . . . . . . . . 2,609 463 439 774 533 269 125 6 1,156 1,453 0.99
Continued on next page.

11
Table 4. Deaths by Cause by Borough of Residence and Sex, and ICD-10/ICD-9 Comparability RatioNew York City, 2008 (Continued)
BOROUGH OF RESIDENCE SEXICD10/ICD9
Staten Non- Residence Comparability Cause (Codes from International Classification of Diseases, Tenth Revision, 1999) Total Manhattan Bronx Brooklyn Queens Island Residents Unknown Male Female Ratio
Cardiomyopathy (I42) . . . . . . . . . . . . . . . . . . . . . . . . . . . . . . . . . . . . . . . . . . . . . . . . . . . . . . . . . 126 29 17 29 31 9 10 1 85 41 Heart failure (I50) . . . . . . . . . . . . . . . . . . . . . . . . . . . . . . . . . . . . . . . . . . . . . . . . . . . . . . . . . . . . 382 97 79 88 56 35 25 2 152 230 1.04
# Essential hypertension and hypertensive renal disease (I10, I12, I15) *. . . . . . . . . . . . . . . . . . . . . . 889 210 163 230 199 31 55 1 404 485 1.12 # Cerebrovascular diseases (I60-I69) . . . . . . . . . . . . . . . . . . . . . . . . . . . . . . . . . . . . . . . . . . . . . . . . . 1,512 341 273 387 338 72 98 3 633 879 1.05 # Atherosclerosis (I70) . . . . . . . . . . . . . . . . . . . . . . . . . . . . . . . . . . . . . . . . . . . . . . . . . . . . . . . . . . . . 191 31 48 42 47 10 13 – 80 111 0.97 # Aortic aneurysm and dissection (I71) . . . . . . . . . . . . . . . . . . . . . . . . . . . . . . . . . . . . . . . . . . . . . . . 139 27 18 32 26 13 22 1 88 51 1.00 14.# Influenza and pneumonia (J10-J18) . . . . . . . . . . . . . . . . . . . . . . . . . . . . . . . . . . . . . . . . . . . . . . . . . . . 2,300 483 382 621 596 110 104 4 1,044 1,256 0.70 15.# Chronic lower respiratory diseases (J40-J47) . . . . . . . . . . . . . . . . . . . . . . . . . . . . . . . . . . . . . . . . . . . . . 1,605 347 269 416 388 105 79 1 704 901 1.04 Emphysema (J43) . . . . . . . . . . . . . . . . . . . . . . . . . . . . . . . . . . . . . . . . . . . . . . . . . . . . . . . . . . . . . . . 150 29 23 35 42 13 8 – 72 78 0.96
Asthma (J45-J46) . . . . . . . . . . . . . . . . . . . . . . . . . . . . . . . . . . . . . . . . . . . . . . . . . . . . . . . . . . . . . . . 149 28 38 58 18 4 3 – 65 84 0.89 16. Pneumoconiosis due to asbestos and other mineral fibres (J61) . . . . . . . . . . . . . . . . . . . . . . . . . . . . . . 1 – – 1 – – – – 1 – 17.# Pneumonitis due to solids and liquids (J69) . . . . . . . . . . . . . . . . . . . . . . . . . . . . . . . . . . . . . . . . . . . . . 42 9 15 7 6 2 2 1 21 21 1.10 18.# Peptic ulcer (K25-K28) . . . . . . . . . . . . . . . . . . . . . . . . . . . . . . . . . . . . . . . . . . . . . . . . . . . . . . . . . . . . . 102 12 21 32 26 5 5 1 52 50 0.97 19.# Chronic liver disease and cirrhosis (K70, K73-K74) . . . . . . . . . . . . . . . . . . . . . . . . . . . . . . . . . . . . . . . 542 98 100 148 113 24 55 4 366 176 1.03
Alcoholic liver disease (K70) . . . . . . . . . . . . . . . . . . . . . . . . . . . . . . . . . . . . . . . . . . . . . . . . . . . . . . 377 68 71 102 80 18 34 4 280 97 1.00 20.# Cholelithiasis and other disorders of gallbladder (K80-K82). . . . . . . . . . . . . . . . . . . . . . . . . . . . . . . . . . 65 8 9 18 17 7 6 – 26 39 0.96 21.# Nephritis, nephrotic syndrome and nephrosis (N00-N07, N17-N19, N25-N27). . . . . . . . . . . . . . . . . . 385 78 58 126 77 22 22 2 179 206 1.26
Renal failure (N17-N19) . . . . . . . . . . . . . . . . . . . . . . . . . . . . . . . . . . . . . . . . . . . . . . . . . . . . . . . . . 336 64 47 113 69 20 21 2 149 187 1.33 22.# Pregnancy, childbirth, and the puerperium (O00-O99). . . . . . . . . . . . . . . . . . . . . . . . . . . . . . . . . . . . 42 3 9 13 15 1 1 – – 42 1.14
Maternal causes** (A34, O00-O95, O98-O99). . . . . . . . . . . . . . . . . . . . . . . . . . . . . . . . . . . . . . . . 39 3 9 13 12 1 1 – – 39 23.# Certain conditions originating in the perinatal period (P00-P96) . . . . . . . . . . . . . . . . . . . . . . . . . . . . . 373 57 75 115 72 10 41 3 205 168 1.08 24.# Congenital malformations, deformations, and chromosomal abnormalities (Q00-Q99) . . . . . . . . . . . . 289 38 44 79 61 13 53 1 163 126 0.90 25. Symptoms, signs and abnormal findings, not elsewhere classified (R00-R94, R96-R99 ) . . . . . . . . . . . . 286 132 46 42 44 6 11 5 110 176 0.98
Pending final determination (R99) . . . . . . . . . . . . . . . . . . . . . . . . . . . . . . . . . . . . . . . . . . . . . . . . . . 1 – – 1 – – – – 1 – 26. Sudden infant death syndrome (R95) . . . . . . . . . . . . . . . . . . . . . . . . . . . . . . . . . . . . . . . . . . . . . . . . . . 12 – 2 6 4 – – – 4 8 1.06 27. All other natural causes (Rest of A00-R99). . . . . . . . . . . . . . . . . . . . . . . . . . . . . . . . . . . . . . . . . . . . . . . 2,971 637 624 781 615 121 186 7 1,257 1,714
External Causes . . . . . . . . . . . . . . . . . . . . . . . . . . . . . . . . . . . . . . . . . . . . . . . . . . . . . . . . . . . . . . . . . . . . . . . . 2,944 479 492 859 606 191 247 70 2,113 831
Injury by firearms (W32-W34, X72-X74, X93-X95, Y22-Y24, Y35.0). . . . . . . . . . . . . . . . . . . . . . . . . . . 390 43 91 138 68 22 26 2 367 23 1.00
28.## Accidents (V01-X59,Y85-Y86) . . . . . . . . . . . . . . . . . . . . . . . . . . . . . . . . . . . . . . . . . . . . . . . . . . . . . . . 1,651 274 264 455 346 118 158 36 1,121 530 1.03 Accidental poisoning by psychoactive substances, excluding alcohol and
tobacco (X40-X42, X44) ###. . . . . . . . . . . . . . . . . . . . . . . . . . . . . . . . . . . . . . . . . . . . . . . . . . . . . 607 106 113 163 111 49 51 14 448 159 1.04 ## Mental and behavioral disorders due to use of or accidental poisoning by psychoactive
substance excluding alcohol and tobacco (F11-F16, F18-F19, X40-X42, X44) ###. . . . . . . . . . . . . . . 736 130 179 172 125 55 54 21 548 188 Motor vehicle accidents ***. . . . . . . . . . . . . . . . . . . . . . . . . . . . . . . . . . . . . . . . . . . . . . . . . . . . . . 320 42 31 96 81 17 49 4 209 111 0.95 Accidental falls (W00-W19) . . . . . . . . . . . . . . . . . . . . . . . . . . . . . . . . . . . . . . . . . . . . . . . . . . . . . . 388 75 66 92 86 33 33 3 233 155 0.77 29.# Intentional self-harm (suicide) (U03^, X60-X84, Y87.0) . . . . . . . . . . . . . . . . . . . . . . . . . . . . . . . . . . . . 473 105 65 130 109 24 34 6 348 125 1.00 30.# Assault (homicide) (U01-U02^, X85-Y09, Y87.1) . . . . . . . . . . . . . . . . . . . . . . . . . . . . . . . . . . . . . . . . . 558 58 134 204 98 22 35 7 477 81 1.00 31.# Legal Intervention (Y35, Y89.0) . . . . . . . . . . . . . . . . . . . . . . . . . . . . . . . . . . . . . . . . . . . . . . . . . . . . . . 9 – 2 6 – – 1 – 9 – 0.94 32. Events of undetermined intent (Y10-Y34, Y87.2, Y89.9). . . . . . . . . . . . . . . . . . . . . . . . . . . . . . . . . . . . 192 30 21 53 40 20 8 20 128 64 0.99 33.# Complications of medical and surgical care (Y40-Y84, Y88). . . . . . . . . . . . . . . . . . . . . . . . . . . . . . . . . 59 12 6 11 13 6 10 1 28 31 0.63 34.# Operations of war and their sequelae (Y36,Y89.1). . . . . . . . . . . . . . . . . . . . . . . . . . . . . . . . . . . . . . . . 2 – – – – 1 1 – 2 –
Note: Beginning on January 1, 1999, all causes were coded using ICD-10. See Technical Notes: Comparability Ratio. The NCHS list of 113 selected causes of death is the base list for tabulating causes in this table. Some causes have been dropped from this listdue to small numbers and others added due to their importance in New York City.# Eligible to be ranked as leading causes nationally and in New York City. Several causes were added to this list in 2000 and 2003; they are of relatively low frequency in New York City and do not affect rankings of leading causes.
## The following cause groups are not ranked as leading causes nationally, but are eligible to be ranked as leading causes in NYC because of the number of deaths and their public health importance: "Mental and behavioral disorders due to use of alcohol", "Mental and behavioral disorders due to use of psychoactive substance excluding alcohol and tobacco", and "Accidents", which in NYC excludes poisoning by psychoactive substances (excluding alcohol and tobacco).### See Technical Notes: Drug Related Deaths.
* Cause-of-death definition was changed in 2008 to reflect the addition of Secondary hypertension (ICD code I15).** Maternal deaths exclude deaths occurring more than 42 days after the termination of pregnancy, and include obstetrical tetanus. See Technical Notes: Maternal Death and Maternal Mortality.***Motor vehicle accident codes include: V02-V04, V09.0, V09.2, V12-V14, V19.0-V19.2, V19.4-V19.6, V20-V79, V80.3-V80.5, V81.0-V81.1, V82.0-V82.1, V83-V86, V87.0-V87.8, V88.0-V88.8, V89.0, V89.2.
^ U01-U03 were introduced by NCHS in 2001 for classifying and coding deaths due to acts of terrorism. Those codes are not part of the ICD-10.

12
Table 5. Leading Causes of Death in Specified Age Groups by SexNew York City, 2008
All Male Female
Rank ALL AGES Deaths Percent Deaths Percent Deaths Percent1 Diseases of Heart. . . . . . . . . . . . . . . . . . . . . . . . . . . . . . . . . . . . . . . . . . . . 21,192 39.1 9,587 36.4 11,605 41.72 Malignant Neoplasms. . . . . . . . . . . . . . . . . . . . . . . . . . . . . . . . . . . . . . . . 13,047 24.1 6,476 24.6 6,571 23.63 Influenza and Pneumonia. . . . . . . . . . . . . . . . . . . . . . . . . . . . . . . . . . . . . 2,300 4.2 1,044 4.0 1,256 4.54 Diabetes Mellitus. . . . . . . . . . . . . . . . . . . . . . . . . . . . . . . . . . . . . . . . . . . . 1,643 3.0 763 2.9 880 3.25 Chronic Lower Respiratory Diseases. . . . . . . . . . . . . . . . . . . . . . . . . . . . . 1,605 3.0 704 2.7 901 3.26 Cerebrovascular Diseases. . . . . . . . . . . . . . . . . . . . . . . . . . . . . . . . . . . . . 1,512 2.8 633 2.4 879 3.27 Human Immunodeficiency Virus (HIV) Disease. . . . . . . . . . . . . . . . . . . . . 1,073 2.0 702 2.7 371 1.38 Accidents Except Poisoning by Psychoactive Substance. . . . . . . . . . . . . . . 1,044 1.9 673 2.6 371 1.39 Essential Hypertension and Hypertensive Renal Disease*. . . . . . . . . . . . . 889 1.6 404 1.5 485 1.710 Use of or Poisoning by Psychoactive Substance . . . . . . . . . . . . . . . . . . . . 736 1.4 548 2.1 188 0.7
All Other Causes . . . . . . . . . . . . . . . . . . . . . . . . . . . . . . . . . . . . . . . . . . . 9,152 16.9 4,808 18.3 4,344 15.6Total . . . . . . . . . . . . . . . . . . . . . . . . . . . . . . . . . . . . . . . . . . . . . . . . . . . . . . 54,193 100.0 26,342 100.0 27,851 100.0
Rank UNDER 1 YEAR Deaths Percent Deaths Percent Deaths Percent1 Congenital Malformations, Deformations. . . . . . . . . . . . . . . . . . . . . . . . . . 151 21.6 87 22.1 64 21.12 Short Gestation and Low Birth Weight. . . . . . . . . . . . . . . . . . . . . . . . . . . . 114 16.3 57 14.5 57 18.83 Cardiovascular Disorders Originating in the Perinatal Period. . . . . . . . . . . 96 13.8 50 12.7 46 15.14 External Causes . . . . . . . . . . . . . . . . . . . . . . . . . . . . . . . . . . . . . . . . . . . . 69 9.9 38 9.6 31 10.25 Respiratory Distress of Newborn. . . . . . . . . . . . . . . . . . . . . . . . . . . . . . . . 41 5.9 29 7.4 12 3.96 Newborn Affected by Complications of Placenta . . . . . . . . . . . . . . . . . . . . 19 2.7 10 2.5 9 3.07 Necrotizing Enterocolitis of Newborn. . . . . . . . . . . . . . . . . . . . . . . . . . . . 17 2.4 8 2.0 9 3.08 Sudden Infant Death Syndrome. . . . . . . . . . . . . . . . . . . . . . . . . . . . . . . . . 12 1.7 4 1.0 8 2.69 Other Respiratory Conditions Originating in the Perinatal Period. . . . . . . . 11 1.6 9 2.3 2 0.710 Diseases of Heart. . . . . . . . . . . . . . . . . . . . . . . . . . . . . . . . . . . . . . . . . . . . 10 1.4 6 1.5 4 1.3
All Other Causes . . . . . . . . . . . . . . . . . . . . . . . . . . . . . . . . . . . . . . . . . . . 158 22.6 96 24.4 62 20.4Total. . . . . . . . . . . . . . . . . . . . . . . . . . . . . . . . . . . . . . . . . . . . . . . . . . . . . . 698 100.0 394 100.0 304 100.0
Rank 1 TO 14 YEARS Deaths Percent Deaths Percent Deaths Percent1 Malignant Neoplasms. . . . . . . . . . . . . . . . . . . . . . . . . . . . . . . . . . . . . . . . 49 19.4 29 19.3 20 19.42 Accidents Except Poisoning by Psychoactive Substance. . . . . . . . . . . . . . . 42 16.6 32 21.3 10 9.73 Congenital Malformations, Deformations. . . . . . . . . . . . . . . . . . . . . . . . . . 34 13.4 20 13.3 14 13.64 Assault (Homicide). . . . . . . . . . . . . . . . . . . . . . . . . . . . . . . . . . . . . . . . . . 15 5.9 7 4.7 8 7.85 Chronic Lower Respiratory Diseases. . . . . . . . . . . . . . . . . . . . . . . . . . . . . 13 5.1 6 4.0 7 6.86 Diseases of Heart. . . . . . . . . . . . . . . . . . . . . . . . . . . . . . . . . . . . . . . . . . . . 12 4.7 8 5.3 4 3.97 Influenza and Pneumonia. . . . . . . . . . . . . . . . . . . . . . . . . . . . . . . . . . . . . 10 4.0 5 3.3 5 4.98 Anemias . . . . . . . . . . . . . . . . . . . . . . . . . . . . . . . . . . . . . . . . . . . . . . . . . . 5 2.0 1 0.7 4 3.9
All Other Causes. . . . . . . . . . . . . . . . . . . . . . . . . . . . . . . . . . . . . . . . . . . . 73 28.9 42 28.0 31 30.1Total. . . . . . . . . . . . . . . . . . . . . . . . . . . . . . . . . . . . . . . . . . . . . . . . . . . . . . 253 100.0 150 100.0 103 100.0
Rank 15 TO 24 YEARS Deaths Percent Deaths Percent Deaths Percent1 Assault (Homicide). . . . . . . . . . . . . . . . . . . . . . . . . . . . . . . . . . . . . . . . . . 164 27.8 152 35.3 12 7.62 Accidents Except Poisoning by Psychoactive Substance. . . . . . . . . . . . . . . 84 14.3 67 15.5 17 10.83 Malignant Neoplasms. . . . . . . . . . . . . . . . . . . . . . . . . . . . . . . . . . . . . . . . 63 10.7 31 7.2 32 20.34 Intentional Self-harm (Suicide). . . . . . . . . . . . . . . . . . . . . . . . . . . . . . . . . . 43 7.3 35 8.1 8 5.15 Use of or Poisoning by Psychoactive Substance . . . . . . . . . . . . . . . . . . . . 37 6.3 29 6.7 8 5.16 Diseases of Heart. . . . . . . . . . . . . . . . . . . . . . . . . . . . . . . . . . . . . . . . . . . . 32 5.4 24 5.6 8 5.17 Congenital Malformations, Deformations. . . . . . . . . . . . . . . . . . . . . . . . . . 18 3.1 11 2.6 7 4.48 Human Immunodeficiency Virus (HIV) Disease. . . . . . . . . . . . . . . . . . . . . 17 2.9 7 1.6 10 6.39 Chronic Lower Respiratory Diseases. . . . . . . . . . . . . . . . . . . . . . . . . . . . . 8 1.4 5 1.2 3 1.910 Pregnancy, Childbirth and the Puerperium. . . . . . . . . . . . . . . . . . . . . . . . . 7 1.2 – – 7 4.4
All Other Causes. . . . . . . . . . . . . . . . . . . . . . . . . . . . . . . . . . . . . . . . . . . . 116 19.7 70 16.2 46 29.1Total. . . . . . . . . . . . . . . . . . . . . . . . . . . . . . . . . . . . . . . . . . . . . . . . . . . . . . 589 100.0 431 100.0 158 100.0
Rank 25 TO 34 YEARS Deaths Percent Deaths Percent Deaths Percent1 Assault (Homicide). . . . . . . . . . . . . . . . . . . . . . . . . . . . . . . . . . . . . . . . . . 179 17.3 157 22.6 22 6.52 Malignant Neoplasms. . . . . . . . . . . . . . . . . . . . . . . . . . . . . . . . . . . . . . . . 140 13.6 72 10.4 68 20.13 Accidents Except Poisoning by Psychoactive Substance. . . . . . . . . . . . . . . 107 10.4 86 12.4 21 6.23 Use of or Poisoning by Psychoactive Substance . . . . . . . . . . . . . . . . . . . . 107 10.4 85 12.2 22 6.55 Intentional Self-harm (Suicide). . . . . . . . . . . . . . . . . . . . . . . . . . . . . . . . . . 85 8.2 57 8.2 28 8.36 Human Immunodeficiency Virus (HIV) Disease. . . . . . . . . . . . . . . . . . . . . 77 7.5 48 6.9 29 8.67 Diseases of Heart. . . . . . . . . . . . . . . . . . . . . . . . . . . . . . . . . . . . . . . . . . . . 75 7.3 58 8.3 17 5.08 Pregnancy, Childbirth and the Puerperium. . . . . . . . . . . . . . . . . . . . . . . . . 20 1.9 – – 20 5.99 Diabetes Mellitus. . . . . . . . . . . . . . . . . . . . . . . . . . . . . . . . . . . . . . . . . . . . 18 1.7 11 1.6 7 2.110 Congenital Malformations, Deformations. . . . . . . . . . . . . . . . . . . . . . . . . . 15 1.5 7 1.0 8 2.4
All Other Causes. . . . . . . . . . . . . . . . . . . . . . . . . . . . . . . . . . . . . . . . . . . . 210 20.3 114 16.4 96 28.4Total. . . . . . . . . . . . . . . . . . . . . . . . . . . . . . . . . . . . . . . . . . . . . . . . . . . . . . 1,033 100.0 695 100.0 338 100.0
Continued on next page.
Note: For each age group, the ten leading causes of death for both sexes combined are arranged in decreasing order of frequency; causes with fewer than five deaths are not shown.
* Cause-of-death definition was changed in 2008 to reflect the addition of secondary hypertension (ICD-10 code I15).

13
Table 5. Leading Causes of Death in Specified Age Groups by SexNew York City, 2008 (Continued)
All Male FemaleRank 35 TO 44 YEARS Deaths Percent Deaths Percent Deaths Percent
1 Malignant Neoplasms. . . . . . . . . . . . . . . . . . . . . . . . . . . . . . . . . . . . . . . . . . . . . 382 19.6 166 13.6 216 29.42 Diseases of Heart. . . . . . . . . . . . . . . . . . . . . . . . . . . . . . . . . . . . . . . . . . . . . . . . 291 14.9 201 16.5 90 12.33 Human Immunodeficiency Virus (HIV) Disease. . . . . . . . . . . . . . . . . . . . . . . . . 246 12.6 144 11.8 102 13.94 Use of or Poisoning by Psychoactive Substance . . . . . . . . . . . . . . . . . . . . . . . . 185 9.5 138 11.3 47 6.45 Assault (Homicide). . . . . . . . . . . . . . . . . . . . . . . . . . . . . . . . . . . . . . . . . . . . . . . 97 5.0 84 6.9 13 1.86 Intentional Self-harm (Suicide). . . . . . . . . . . . . . . . . . . . . . . . . . . . . . . . . . . . . . 93 4.8 65 5.3 28 3.87 Accidents Except Poisoning by Psychoactive Substance. . . . . . . . . . . . . . . . . . . 82 4.2 65 5.3 17 2.38 Chronic Liver Disease and Cirrhosis. . . . . . . . . . . . . . . . . . . . . . . . . . . . . . . . . . 53 2.7 38 3.1 15 2.09 Cerebrovascular Diseases. . . . . . . . . . . . . . . . . . . . . . . . . . . . . . . . . . . . . . . . . . 45 2.3 23 1.9 22 3.010 Diabetes Mellitus. . . . . . . . . . . . . . . . . . . . . . . . . . . . . . . . . . . . . . . . . . . . . . . . 44 2.3 30 2.5 14 1.9
All Other Causes. . . . . . . . . . . . . . . . . . . . . . . . . . . . . . . . . . . . . . . . . . . . . . . . . 433 22.2 263 21.6 170 23.2Total. . . . . . . . . . . . . . . . . . . . . . . . . . . . . . . . . . . . . . . . . . . . . . . . . . . . . . . . . . . 1,951 100.0 1,217 100.0 734 100.0
Rank 45 TO 54 YEARS Deaths Percent Deaths Percent Deaths Percent1 Malignant Neoplasms. . . . . . . . . . . . . . . . . . . . . . . . . . . . . . . . . . . . . . . . . . . . . 1,320 28.9 634 22.7 686 38.82 Diseases of Heart. . . . . . . . . . . . . . . . . . . . . . . . . . . . . . . . . . . . . . . . . . . . . . . . 959 21.0 652 23.4 307 17.33 Human Immunodeficiency Virus (HIV) Disease. . . . . . . . . . . . . . . . . . . . . . . . . 425 9.3 275 9.9 150 8.54 Use of or Poisoning by Psychoactive Substance . . . . . . . . . . . . . . . . . . . . . . . . 256 5.6 181 6.5 75 4.25 Chronic Liver Disease and Cirrhosis. . . . . . . . . . . . . . . . . . . . . . . . . . . . . . . . . . 142 3.1 99 3.5 43 2.46 Accidents Except Poisoning by Psychoactive Substance. . . . . . . . . . . . . . . . . . . 141 3.1 111 4.0 30 1.77 Cerebrovascular Diseases. . . . . . . . . . . . . . . . . . . . . . . . . . . . . . . . . . . . . . . . . . 137 3.0 79 2.8 58 3.38 Diabetes Mellitus. . . . . . . . . . . . . . . . . . . . . . . . . . . . . . . . . . . . . . . . . . . . . . . . 130 2.9 79 2.8 51 2.99 Intentional Self-harm (Suicide). . . . . . . . . . . . . . . . . . . . . . . . . . . . . . . . . . . . . . 107 2.3 84 3.0 23 1.310 Viral Hepatitis. . . . . . . . . . . . . . . . . . . . . . . . . . . . . . . . . . . . . . . . . . . . . . . . . . . 102 2.2 78 2.8 24 1.4
All Other Causes. . . . . . . . . . . . . . . . . . . . . . . . . . . . . . . . . . . . . . . . . . . . . . . . . 842 18.5 519 18.6 323 18.2Total. . . . . . . . . . . . . . . . . . . . . . . . . . . . . . . . . . . . . . . . . . . . . . . . . . . . . . . . . . . 4,561 100.0 2,791 100.0 1,770 100.0
Rank 55 TO 64 YEARS Deaths Percent Deaths Percent Deaths Percent1 Malignant Neoplasms. . . . . . . . . . . . . . . . . . . . . . . . . . . . . . . . . . . . . . . . . . . . . 2,594 35.8 1,327 30.8 1,267 43.22 Diseases of Heart. . . . . . . . . . . . . . . . . . . . . . . . . . . . . . . . . . . . . . . . . . . . . . . . 2,027 28.0 1,330 30.9 697 23.73 Diabetes Mellitus. . . . . . . . . . . . . . . . . . . . . . . . . . . . . . . . . . . . . . . . . . . . . . . . 268 3.7 147 3.4 121 4.14 Human Immunodeficiency Virus (HIV) Disease. . . . . . . . . . . . . . . . . . . . . . . . . 231 3.2 173 4.0 58 2.05 Cerebrovascular Diseases. . . . . . . . . . . . . . . . . . . . . . . . . . . . . . . . . . . . . . . . . . 184 2.5 102 2.4 82 2.86 Chronic Liver Disease and Cirrhosis. . . . . . . . . . . . . . . . . . . . . . . . . . . . . . . . . . 181 2.5 131 3.0 50 1.77 Influenza and Pneumonia. . . . . . . . . . . . . . . . . . . . . . . . . . . . . . . . . . . . . . . . . . 164 2.3 98 2.3 66 2.28 Chronic Lower Respiratory Diseases. . . . . . . . . . . . . . . . . . . . . . . . . . . . . . . . . . 163 2.2 90 2.1 73 2.59 Viral Hepatitis. . . . . . . . . . . . . . . . . . . . . . . . . . . . . . . . . . . . . . . . . . . . . . . . . . . 162 2.2 124 2.9 38 1.310 Accidents Except Poisoning by Psychoactive Substance. . . . . . . . . . . . . . . . . . . 145 2.0 98 2.3 47 1.6
All Other Causes. . . . . . . . . . . . . . . . . . . . . . . . . . . . . . . . . . . . . . . . . . . . . . . . . 1,127 15.6 690 16.0 437 14.9Total. . . . . . . . . . . . . . . . . . . . . . . . . . . . . . . . . . . . . . . . . . . . . . . . . . . . . . . . . . . 7,246 100.0 4,310 100.0 2,936 100.0
Rank 65 TO 74 YEARS Deaths Percent Deaths Percent Deaths Percent1 Malignant Neoplasms. . . . . . . . . . . . . . . . . . . . . . . . . . . . . . . . . . . . . . . . . . . . . 3,142 35.0 1,682 33.9 1,460 36.42 Diseases of Heart. . . . . . . . . . . . . . . . . . . . . . . . . . . . . . . . . . . . . . . . . . . . . . . . 3,127 34.8 1,791 36.1 1,336 33.33 Diabetes Mellitus. . . . . . . . . . . . . . . . . . . . . . . . . . . . . . . . . . . . . . . . . . . . . . . . 388 4.3 188 3.8 200 5.04 Influenza and Pneumonia. . . . . . . . . . . . . . . . . . . . . . . . . . . . . . . . . . . . . . . . . . 317 3.5 192 3.9 125 3.15 Chronic Lower Respiratory Diseases. . . . . . . . . . . . . . . . . . . . . . . . . . . . . . . . . . 290 3.2 148 3.0 142 3.56 Cerebrovascular Diseases. . . . . . . . . . . . . . . . . . . . . . . . . . . . . . . . . . . . . . . . . . 236 2.6 117 2.4 119 3.07 Essential Hypertension and Hypertensive Renal Disease. . . . . . . . . . . . . . . . . . 145 1.6 90 1.8 55 1.48 Accidents Except Poisoning by Psychoactive Substance. . . . . . . . . . . . . . . . . . . 124 1.4 78 1.6 46 1.19 Chronic Liver Disease and Cirrhosis. . . . . . . . . . . . . . . . . . . . . . . . . . . . . . . . . . 103 1.1 61 1.2 42 1.010 Nephritis, Nephrotic Syndrome and Nephrosis . . . . . . . . . . . . . . . . . . . . . . . . . 76 0.8 38 0.8 38 0.9
All Other Causes. . . . . . . . . . . . . . . . . . . . . . . . . . . . . . . . . . . . . . . . . . . . . . . . . 1,030 11.5 580 11.7 450 11.2Total. . . . . . . . . . . . . . . . . . . . . . . . . . . . . . . . . . . . . . . . . . . . . . . . . . . . . . . . . . . 8,978 100.0 4,965 100.0 4,013 100.0
Rank 75 TO 84 YEARS Deaths Percent Deaths Percent Deaths Percent1 Diseases of Heart. . . . . . . . . . . . . . . . . . . . . . . . . . . . . . . . . . . . . . . . . . . . . . . . 5,772 43.9 2,708 43.8 3,064 43.92 Malignant Neoplasms. . . . . . . . . . . . . . . . . . . . . . . . . . . . . . . . . . . . . . . . . . . . . 3,357 25.5 1,686 27.3 1,671 23.93 Influenza and Pneumonia. . . . . . . . . . . . . . . . . . . . . . . . . . . . . . . . . . . . . . . . . . 652 5.0 309 5.0 343 4.94 Chronic Lower Respiratory Diseases. . . . . . . . . . . . . . . . . . . . . . . . . . . . . . . . . . 536 4.1 232 3.8 304 4.45 Diabetes Mellitus. . . . . . . . . . . . . . . . . . . . . . . . . . . . . . . . . . . . . . . . . . . . . . . . 440 3.3 196 3.2 244 3.56 Cerebrovascular Diseases. . . . . . . . . . . . . . . . . . . . . . . . . . . . . . . . . . . . . . . . . . 415 3.2 166 2.7 249 3.67 Essential Hypertension and Hypertensive Renal Disease. . . . . . . . . . . . . . . . . . 250 1.9 106 1.7 144 2.18 Accidents Except Poisoning by Psychoactive Substance. . . . . . . . . . . . . . . . . . . 155 1.2 65 1.1 90 1.39 Alzheimer's Disease . . . . . . . . . . . . . . . . . . . . . . . . . . . . . . . . . . . . . . . . . . . . . 101 0.8 26 0.4 75 1.110 Nephritis, Nephrotic Syndrome and Nephrosis . . . . . . . . . . . . . . . . . . . . . . . . . 98 0.7 40 0.6 58 0.8
All Other Causes. . . . . . . . . . . . . . . . . . . . . . . . . . . . . . . . . . . . . . . . . . . . . . . . . 1,381 10.5 642 10.4 739 10.6Total. . . . . . . . . . . . . . . . . . . . . . . . . . . . . . . . . . . . . . . . . . . . . . . . . . . . . . . . . . . 13,157 100.0 6,176 100.0 6,981 100.0
Rank 85 AND OVER Deaths Percent Deaths Percent Deaths Percent1 Diseases of Heart. . . . . . . . . . . . . . . . . . . . . . . . . . . . . . . . . . . . . . . . . . . . . . . . 8,887 56.5 2,809 53.9 6,078 57.82 Malignant Neoplasms. . . . . . . . . . . . . . . . . . . . . . . . . . . . . . . . . . . . . . . . . . . . . 1,996 12.7 846 16.2 1,150 10.93 Influenza and Pneumonia. . . . . . . . . . . . . . . . . . . . . . . . . . . . . . . . . . . . . . . . . . 1,037 6.6 368 7.1 669 6.44 Chronic Lower Respiratory Diseases. . . . . . . . . . . . . . . . . . . . . . . . . . . . . . . . . . 487 3.1 167 3.2 320 3.05 Cerebrovascular Diseases. . . . . . . . . . . . . . . . . . . . . . . . . . . . . . . . . . . . . . . . . . 469 3.0 129 2.5 340 3.26 Diabetes Mellitus. . . . . . . . . . . . . . . . . . . . . . . . . . . . . . . . . . . . . . . . . . . . . . . . 347 2.2 106 2.0 241 2.37 Essential Hypertension and Hypertensive Renal Disease. . . . . . . . . . . . . . . . . . 289 1.8 91 1.7 198 1.98 Alzheimer's Disease . . . . . . . . . . . . . . . . . . . . . . . . . . . . . . . . . . . . . . . . . . . . . 241 1.5 52 1.0 189 1.89 Accidents Except Poisoning by Psychoactive Substance. . . . . . . . . . . . . . . . . . . 147 0.9 61 1.2 86 0.810 Nephritis, Nephrotic Syndrome and Nephrosis . . . . . . . . . . . . . . . . . . . . . . . . . 119 0.8 46 0.9 73 0.7
All Other Causes. . . . . . . . . . . . . . . . . . . . . . . . . . . . . . . . . . . . . . . . . . . . . . . . . 1,708 10.9 538 10.3 1,170 11.1Total. . . . . . . . . . . . . . . . . . . . . . . . . . . . . . . . . . . . . . . . . . . . . . . . . . . . . . . . . . . 15,727 100.0 5,213 100.0 10,514 100.0

41.7%
23.6%
4.5% 3.2%
3.2%
23.8%
Diseases of Heart
Malignant NeoplasmsInfluenza and Pneumonia
Chronic Lower Respiratory DiseaseDiabetes Mellitus
All Other Causes
Figure 4. Leading Causes of Death for Males New York City, 2008
14
Figure 5. Leading Causes of Death for Females New York City, 2008
36.4%
24.6%
4.0% 2.9%
2.7%
29.5%Diseases of Heart
Malignant NeoplasmsInfluenza and PneumoniaDiabetes Mellitus
Chronic Lower Respiratory DiseaseAll Other Causes
Sixty-one percent of the 26,342 deaths among New York City males in 2008 were caused by either diseases of heart (36.4%) or malignant neoplasms (24.6%), about 1 percentage point decrease from 2007. Influenza and pneumonia caused 4% of deaths, and diabetes mellitus caused 2.9%. After more than two decades, HIV disease deaths were no longer among top 5 leading causes of deaths for males. Chronic lower respiratory disease now took over 5th place in leading causes with 2.7% of total male deaths. The percent of deaths caused by the top 5 leading causes among males decreased 0.4 percentage point from 2007 to 2008. All remaining causes of deaths among males accounted for 29.5% of total deaths.
The two leading causes of death among females, diseases of the heart and malignant neoplasms, were the same as those for males, and accounted for 41.7% and 23.6% of the 27,851 deaths, respectively. Influenza and pneumonia caused 4.5% of deaths. The fourth and fifth leading causes in females are the same as those of males but in different order: chronic lower respiratory disease and diabetes mellitus each caused 3.2% of female deaths in 2008. All remaining causes of deaths among females accounted for 23.8% of total deaths.

Figure 6a. Age-Adjusted Death Rates* for Trachea, Bronchus, and Lung Malignant Neoplasms, by Sex,
Age 20 and Over, New York City, 1994-2008
15
Figure 7. Age-Adjusted Death Rates* for Trachea, Bronchus, and Lung Malignant Neoplasms, by Ethnic Group,
Age 20 and Over, New York City, 2008
1994
1995
1996
1997
1998
1999
2000
2001
2002
2003
2004
2005
2006
2007
2008
Year*
0.0
20.0
40.0
60.0
80.0
100.0
120.0
Age
-Adj
uste
d R a
te p
er 1
0 0,0
00 P
o pul
atio
n
Male Female
30.4
35.6
57.9
49.7
HispanicAsian & Pacific Islander
Non-Hispanic WhiteNon-Hispanic Black
Ethnic Group
0.0
10.0
20.0
30.0
40.0
50.0
60.0
70.0
Age
-Adj
uste
d R a
te p
er 1
0 0,0
00 P
o pul
atio
n
Trachea, bronchus, and lung cancers are the leading causes of death among all cancers. The age-adjusted death rate for men decreased dramatically in the past 15 years, from 104.0 per 100,000 population in 1994 to 63.3 in 2008. In contrast, the age-adjusted rate was relatively stable for women over the same time period, from 46.1 per 100,000 population in 1994 to 37.1 in 2008. See Comparability Ratio in Technical Notes for information about the effect of ICD-9/ICD-10 coding changes. Comparability ratios for trachea, bronchus, and lung cancers from ICD-9 to ICD-10 are 0.98 for males and 0.99 for females. *See “Demographics, Population” in Technical Notes for information about population estimates.
The age-adjusted rate of trachea, bronchus, and lung cancer is the lowest for Hispanics, at 30.4 per 100,000 population, and highest for non-Hispanic whites, at 57.9 per 100,000 population. The rates for Asian and Pacific Islanders and non-Hispanic blacks are 35.6 and 49.7 per 100,000 population, respectively in 2008. *See “Demographics, Population” in Technical Notes for information about population estimates.
1994
1995
1996
1997
1998
1999
2000
2001
2002
2003
2004
2005
2006
2007
2008
Year*
0.0
20.0
40.0
60.0
80.0
100.0
120.0
140.0
Cru
d e R
ate
per
100,
000
Popu
latio
n
Age 35-44 Age 45-54 Age 55-64
Figure 6b. Age-Specific Death Rates* for Trachea, Bronchus, and Lung Malignant Neoplasms by Selected Age Group
New York City, 1994-2008
Trachea, bronchus, and lung cancers are the leading causes of death among all cancers. The age-specific death rates shown all decreased in the past 15 years, changing from 123.5 per 100,000 population to 70.1 for the 55-64 age group, from 45.3 to 20.6 for the 45-54 age group, and 6.8 to 2.3 for the 35-44 age group. Greatest improvements were among adults aged 35-44.See Comparability Ratio in Technical Notes for information about the effect of ICD-9/ICD-10 coding changes.*See “Demographics, Population” in Technical Notes for information about population estimates.

16
1989
1990
1991
1992
1993
1994
1995
1996
1997
1998
1999
2000
2001
2002
2003
2004
2005
2006
2007
2008
Year
0
500
1000
1500
2000
2500
Num
b er
ofD
eath
s
Diabetes Mellitus Colorectal Cancer Homicide Suicide
Accidents Breast Cancer, Female Drug Related
Figure 8. Number of Premature Deaths from Selected Causes Age under 65 Years, New York City, 1989-2008
The number of homicide deaths among those under 65 years of age declined steadily between 1990 and 1998. Since 1998, it has remained near 600 deaths per year through 2006. The number of homicide deaths was 538 in 2008. (Note, reported WTC deaths are homicides and not included for the year 2001.) Suicide deaths peaked in 1989 at 587 and since then declined to 391 in 2008. The number of colorectal cancer deaths occurring among those under 65 years of age is flat in the past two decades, from 445 in 1989 to 450 in 2008. Accidental deaths have fluctuated since their surge in 2001, which was due to the Flight 587 air crash. During the past two decades, diabetes mellitus declined to a low of 318 deaths in 1989 and then increased; since 1994, it has remained near 500 deaths per year. Breast cancer deaths in women have decreased slowly over the past two decades from approximately 700 deaths in 1989 to 491 in 2008.Drug-related deaths (mental disorders due to substance use or accidental poisoning) to those under 65 years of age had sharp drop, from 923 in 1989 to 633 in 1990, then an increase to 1,117 in 1993. Since then, drug-related deaths decreased to 707 in 2008.
Table 5a. Leading Causes of Death by Sex, Age Under 65New York City, 2008
All Male FemaleRank Cause of Death Deaths Percent Deaths Percent Deaths Percent
1 Malignant Neoplasms. . . . . . . . . . . . . . . . . . . . . . . . . . . . . . . . . . . . . . . . . 4,552 27.9 2,262 22.6 2,290 36.1 Trachea, bronchus, and lung . . . . . . . . . . . . . . . . . . . . . . . . . . . . . . . . . 894 5.5 521 5.2 373 5.9 Breast . . . . . . . . . . . . . . . . . . . . . . . . . . . . . . . . . . . . . . . . . . . . . . . . . . 493 3.0 2 0.0 491 7.7 Colon, rectum, and anus . . . . . . . . . . . . . . . . . . . . . . . . . . . . . . . . . . . . 450 2.8 233 2.3 217 3.4 Liver and intrahepatic bile ducts . . . . . . . . . . . . . . . . . . . . . . . . . . . . . . 292 1.8 229 2.3 63 1.0 Pancreas. . . . . . . . . . . . . . . . . . . . . . . . . . . . . . . . . . . . . . . . . . . . . . . . . 267 1.6 156 1.6 111 1.7
2 Diseases of Heart. . . . . . . . . . . . . . . . . . . . . . . . . . . . . . . . . . . . . . . . . . . . 3,406 20.9 2,279 22.8 1,127 17.83 Human Immunodeficiency Virus (HIV) Disease. . . . . . . . . . . . . . . . . . . . . 996 6.1 647 6.5 349 5.54 Use of or Poisoning by Psychoactive Substance . . . . . . . . . . . . . . . . . . . . . 707 4.3 529 5.3 178 2.85 Accidents Except Poisoning by Psychoactive Substance. . . . . . . . . . . . . . . 618 3.8 469 4.7 149 2.36 Assault (Homicide). . . . . . . . . . . . . . . . . . . . . . . . . . . . . . . . . . . . . . . . . . . 539 3.3 462 4.6 77 1.27 Diabetes Mellitus. . . . . . . . . . . . . . . . . . . . . . . . . . . . . . . . . . . . . . . . . . . . 468 2.9 273 2.7 195 3.18 Cerebrovascular Diseases. . . . . . . . . . . . . . . . . . . . . . . . . . . . . . . . . . . . . . 392 2.4 221 2.2 171 2.79 Intentional Self-harm (Suicide). . . . . . . . . . . . . . . . . . . . . . . . . . . . . . . . . . 391 2.4 289 2.9 102 1.610 Chronic Liver Disease and Cirrhosis . . . . . . . . . . . . . . . . . . . . . . . . . . . . . 385 2.4 275 2.8 110 1.7
All Other Causes . . . . . . . . . . . . . . . . . . . . . . . . . . . . . . . . . . . . . . . . . . . . 3,877 23.7 2,282 22.8 1,595 25.1Total . . . . . . . . . . . . . . . . . . . . . . . . . . . . . . . . . . . . . . . . . . . . . . . . . . . . . . 16,331 100.0 9,988 100.0 6,343 100.0
Note: Ten leading causes of death are arranged in the order of frequency for both sexes combined.
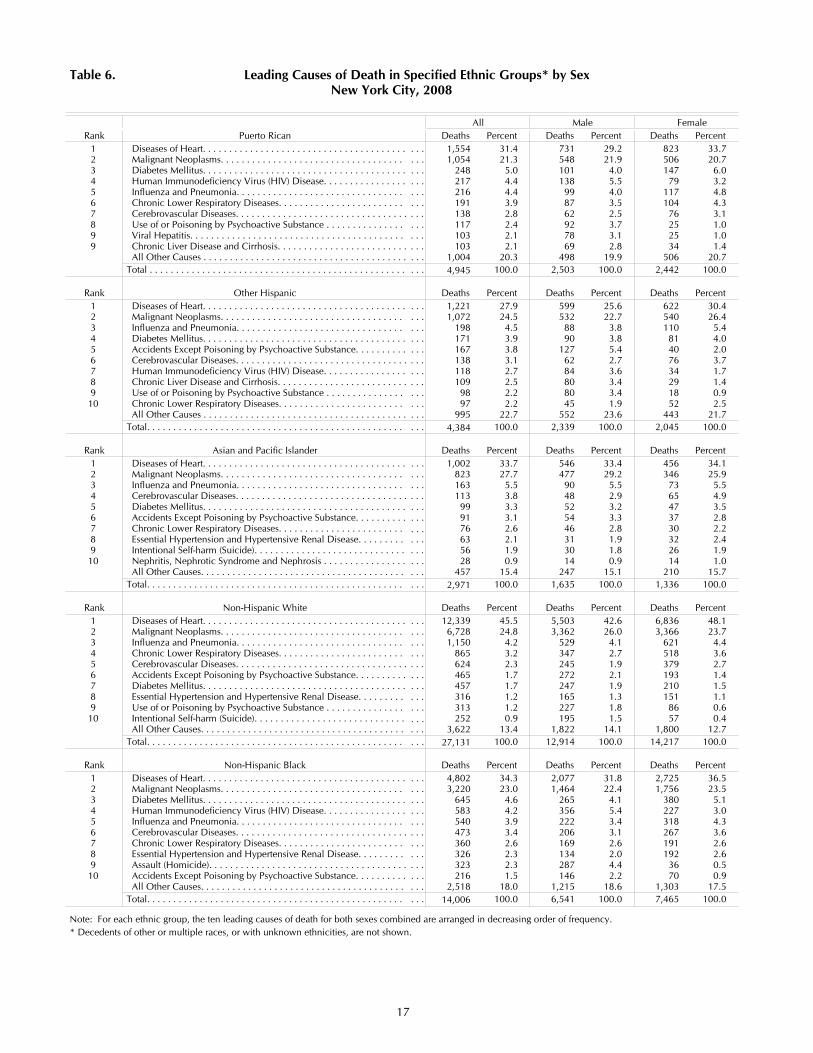
17
Table 6. Leading Causes of Death in Specified Ethnic Groups* by Sex New York City, 2008
All Male FemaleRank Puerto Rican Deaths Percent Deaths Percent Deaths Percent
1 Diseases of Heart. . . . . . . . . . . . . . . . . . . . . . . . . . . . . . . . . . . . . . . . . . 1,554 31.4 731 29.2 823 33.72 Malignant Neoplasms. . . . . . . . . . . . . . . . . . . . . . . . . . . . . . . . . . . . . . . 1,054 21.3 548 21.9 506 20.73 Diabetes Mellitus. . . . . . . . . . . . . . . . . . . . . . . . . . . . . . . . . . . . . . . . . . 248 5.0 101 4.0 147 6.04 Human Immunodeficiency Virus (HIV) Disease. . . . . . . . . . . . . . . . . . . 217 4.4 138 5.5 79 3.25 Influenza and Pneumonia. . . . . . . . . . . . . . . . . . . . . . . . . . . . . . . . . . . . 216 4.4 99 4.0 117 4.86 Chronic Lower Respiratory Diseases. . . . . . . . . . . . . . . . . . . . . . . . . . . . 191 3.9 87 3.5 104 4.37 Cerebrovascular Diseases. . . . . . . . . . . . . . . . . . . . . . . . . . . . . . . . . . . . 138 2.8 62 2.5 76 3.18 Use of or Poisoning by Psychoactive Substance . . . . . . . . . . . . . . . . . . . 117 2.4 92 3.7 25 1.09 Viral Hepatitis. . . . . . . . . . . . . . . . . . . . . . . . . . . . . . . . . . . . . . . . . . . . 103 2.1 78 3.1 25 1.09 Chronic Liver Disease and Cirrhosis. . . . . . . . . . . . . . . . . . . . . . . . . . . . 103 2.1 69 2.8 34 1.4
All Other Causes . . . . . . . . . . . . . . . . . . . . . . . . . . . . . . . . . . . . . . . . . . 1,004 20.3 498 19.9 506 20.7Total . . . . . . . . . . . . . . . . . . . . . . . . . . . . . . . . . . . . . . . . . . . . . . . . . . . . 4,945 100.0 2,503 100.0 2,442 100.0
Rank Other Hispanic Deaths Percent Deaths Percent Deaths Percent1 Diseases of Heart. . . . . . . . . . . . . . . . . . . . . . . . . . . . . . . . . . . . . . . . . . 1,221 27.9 599 25.6 622 30.42 Malignant Neoplasms. . . . . . . . . . . . . . . . . . . . . . . . . . . . . . . . . . . . . . . 1,072 24.5 532 22.7 540 26.43 Influenza and Pneumonia. . . . . . . . . . . . . . . . . . . . . . . . . . . . . . . . . . . . 198 4.5 88 3.8 110 5.44 Diabetes Mellitus. . . . . . . . . . . . . . . . . . . . . . . . . . . . . . . . . . . . . . . . . . 171 3.9 90 3.8 81 4.05 Accidents Except Poisoning by Psychoactive Substance. . . . . . . . . . . . . 167 3.8 127 5.4 40 2.06 Cerebrovascular Diseases. . . . . . . . . . . . . . . . . . . . . . . . . . . . . . . . . . . . 138 3.1 62 2.7 76 3.77 Human Immunodeficiency Virus (HIV) Disease. . . . . . . . . . . . . . . . . . . 118 2.7 84 3.6 34 1.78 Chronic Liver Disease and Cirrhosis. . . . . . . . . . . . . . . . . . . . . . . . . . . . 109 2.5 80 3.4 29 1.49 Use of or Poisoning by Psychoactive Substance . . . . . . . . . . . . . . . . . . . 98 2.2 80 3.4 18 0.910 Chronic Lower Respiratory Diseases. . . . . . . . . . . . . . . . . . . . . . . . . . . . 97 2.2 45 1.9 52 2.5
All Other Causes . . . . . . . . . . . . . . . . . . . . . . . . . . . . . . . . . . . . . . . . . . 995 22.7 552 23.6 443 21.7Total. . . . . . . . . . . . . . . . . . . . . . . . . . . . . . . . . . . . . . . . . . . . . . . . . . . . . 4,384 100.0 2,339 100.0 2,045 100.0
Rank Asian and Pacific Islander Deaths Percent Deaths Percent Deaths Percent1 Diseases of Heart. . . . . . . . . . . . . . . . . . . . . . . . . . . . . . . . . . . . . . . . . . 1,002 33.7 546 33.4 456 34.12 Malignant Neoplasms. . . . . . . . . . . . . . . . . . . . . . . . . . . . . . . . . . . . . . . 823 27.7 477 29.2 346 25.93 Influenza and Pneumonia. . . . . . . . . . . . . . . . . . . . . . . . . . . . . . . . . . . . 163 5.5 90 5.5 73 5.54 Cerebrovascular Diseases. . . . . . . . . . . . . . . . . . . . . . . . . . . . . . . . . . . . 113 3.8 48 2.9 65 4.95 Diabetes Mellitus. . . . . . . . . . . . . . . . . . . . . . . . . . . . . . . . . . . . . . . . . . 99 3.3 52 3.2 47 3.56 Accidents Except Poisoning by Psychoactive Substance. . . . . . . . . . . . . 91 3.1 54 3.3 37 2.87 Chronic Lower Respiratory Diseases. . . . . . . . . . . . . . . . . . . . . . . . . . . . 76 2.6 46 2.8 30 2.28 Essential Hypertension and Hypertensive Renal Disease. . . . . . . . . . . . 63 2.1 31 1.9 32 2.49 Intentional Self-harm (Suicide). . . . . . . . . . . . . . . . . . . . . . . . . . . . . . . . 56 1.9 30 1.8 26 1.910 Nephritis, Nephrotic Syndrome and Nephrosis . . . . . . . . . . . . . . . . . . . 28 0.9 14 0.9 14 1.0
All Other Causes. . . . . . . . . . . . . . . . . . . . . . . . . . . . . . . . . . . . . . . . . . 457 15.4 247 15.1 210 15.7Total. . . . . . . . . . . . . . . . . . . . . . . . . . . . . . . . . . . . . . . . . . . . . . . . . . . . . 2,971 100.0 1,635 100.0 1,336 100.0
Rank Non-Hispanic White Deaths Percent Deaths Percent Deaths Percent1 Diseases of Heart. . . . . . . . . . . . . . . . . . . . . . . . . . . . . . . . . . . . . . . . . . 12,339 45.5 5,503 42.6 6,836 48.12 Malignant Neoplasms. . . . . . . . . . . . . . . . . . . . . . . . . . . . . . . . . . . . . . . 6,728 24.8 3,362 26.0 3,366 23.73 Influenza and Pneumonia. . . . . . . . . . . . . . . . . . . . . . . . . . . . . . . . . . . . 1,150 4.2 529 4.1 621 4.44 Chronic Lower Respiratory Diseases. . . . . . . . . . . . . . . . . . . . . . . . . . . . 865 3.2 347 2.7 518 3.65 Cerebrovascular Diseases. . . . . . . . . . . . . . . . . . . . . . . . . . . . . . . . . . . . 624 2.3 245 1.9 379 2.76 Accidents Except Poisoning by Psychoactive Substance. . . . . . . . . . . . . 465 1.7 272 2.1 193 1.47 Diabetes Mellitus. . . . . . . . . . . . . . . . . . . . . . . . . . . . . . . . . . . . . . . . . . 457 1.7 247 1.9 210 1.58 Essential Hypertension and Hypertensive Renal Disease. . . . . . . . . . . . 316 1.2 165 1.3 151 1.19 Use of or Poisoning by Psychoactive Substance . . . . . . . . . . . . . . . . . . . 313 1.2 227 1.8 86 0.610 Intentional Self-harm (Suicide). . . . . . . . . . . . . . . . . . . . . . . . . . . . . . . . 252 0.9 195 1.5 57 0.4
All Other Causes. . . . . . . . . . . . . . . . . . . . . . . . . . . . . . . . . . . . . . . . . . 3,622 13.4 1,822 14.1 1,800 12.7Total. . . . . . . . . . . . . . . . . . . . . . . . . . . . . . . . . . . . . . . . . . . . . . . . . . . . . 27,131 100.0 12,914 100.0 14,217 100.0
Rank Non-Hispanic Black Deaths Percent Deaths Percent Deaths Percent1 Diseases of Heart. . . . . . . . . . . . . . . . . . . . . . . . . . . . . . . . . . . . . . . . . . 4,802 34.3 2,077 31.8 2,725 36.52 Malignant Neoplasms. . . . . . . . . . . . . . . . . . . . . . . . . . . . . . . . . . . . . . . 3,220 23.0 1,464 22.4 1,756 23.53 Diabetes Mellitus. . . . . . . . . . . . . . . . . . . . . . . . . . . . . . . . . . . . . . . . . . 645 4.6 265 4.1 380 5.14 Human Immunodeficiency Virus (HIV) Disease. . . . . . . . . . . . . . . . . . . 583 4.2 356 5.4 227 3.05 Influenza and Pneumonia. . . . . . . . . . . . . . . . . . . . . . . . . . . . . . . . . . . . 540 3.9 222 3.4 318 4.36 Cerebrovascular Diseases. . . . . . . . . . . . . . . . . . . . . . . . . . . . . . . . . . . . 473 3.4 206 3.1 267 3.67 Chronic Lower Respiratory Diseases. . . . . . . . . . . . . . . . . . . . . . . . . . . . 360 2.6 169 2.6 191 2.68 Essential Hypertension and Hypertensive Renal Disease. . . . . . . . . . . . 326 2.3 134 2.0 192 2.69 Assault (Homicide). . . . . . . . . . . . . . . . . . . . . . . . . . . . . . . . . . . . . . . . . 323 2.3 287 4.4 36 0.510 Accidents Except Poisoning by Psychoactive Substance. . . . . . . . . . . . . 216 1.5 146 2.2 70 0.9
All Other Causes. . . . . . . . . . . . . . . . . . . . . . . . . . . . . . . . . . . . . . . . . . 2,518 18.0 1,215 18.6 1,303 17.5Total. . . . . . . . . . . . . . . . . . . . . . . . . . . . . . . . . . . . . . . . . . . . . . . . . . . . . 14,006 100.0 6,541 100.0 7,465 100.0
Note: For each ethnic group, the ten leading causes of death for both sexes combined are arranged in decreasing order of frequency. * Decedents of other or multiple races, or with unknown ethnicities, are not shown.
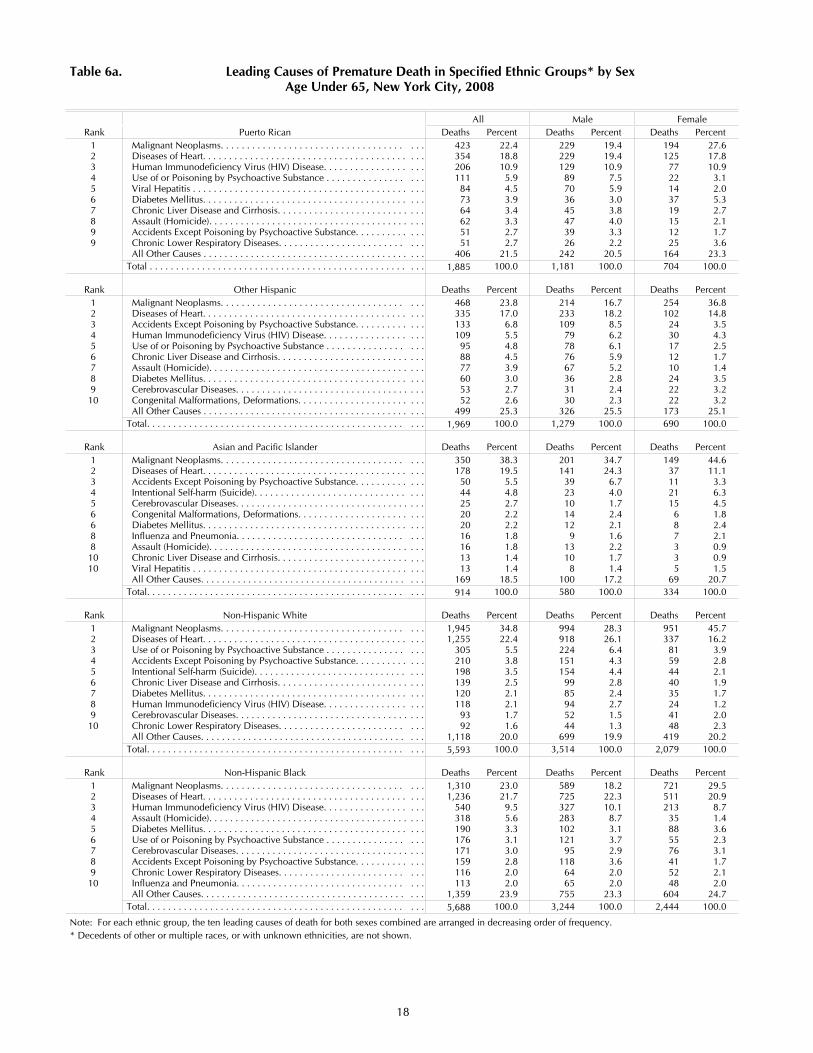
18
Table 6a. Leading Causes of Premature Death in Specified Ethnic Groups* by Sex Age Under 65, New York City, 2008
All Male Female
Rank Puerto Rican Deaths Percent Deaths Percent Deaths Percent1 Malignant Neoplasms. . . . . . . . . . . . . . . . . . . . . . . . . . . . . . . . . . . . . . . 423 22.4 229 19.4 194 27.62 Diseases of Heart. . . . . . . . . . . . . . . . . . . . . . . . . . . . . . . . . . . . . . . . . . 354 18.8 229 19.4 125 17.83 Human Immunodeficiency Virus (HIV) Disease. . . . . . . . . . . . . . . . . . . 206 10.9 129 10.9 77 10.94 Use of or Poisoning by Psychoactive Substance . . . . . . . . . . . . . . . . . . . 111 5.9 89 7.5 22 3.15 Viral Hepatitis . . . . . . . . . . . . . . . . . . . . . . . . . . . . . . . . . . . . . . . . . . . . 84 4.5 70 5.9 14 2.06 Diabetes Mellitus. . . . . . . . . . . . . . . . . . . . . . . . . . . . . . . . . . . . . . . . . . 73 3.9 36 3.0 37 5.37 Chronic Liver Disease and Cirrhosis. . . . . . . . . . . . . . . . . . . . . . . . . . . . 64 3.4 45 3.8 19 2.78 Assault (Homicide). . . . . . . . . . . . . . . . . . . . . . . . . . . . . . . . . . . . . . . . . 62 3.3 47 4.0 15 2.19 Accidents Except Poisoning by Psychoactive Substance. . . . . . . . . . . . . 51 2.7 39 3.3 12 1.79 Chronic Lower Respiratory Diseases. . . . . . . . . . . . . . . . . . . . . . . . . . . . 51 2.7 26 2.2 25 3.6
All Other Causes . . . . . . . . . . . . . . . . . . . . . . . . . . . . . . . . . . . . . . . . . . 406 21.5 242 20.5 164 23.3Total . . . . . . . . . . . . . . . . . . . . . . . . . . . . . . . . . . . . . . . . . . . . . . . . . . . . 1,885 100.0 1,181 100.0 704 100.0
Rank Other Hispanic Deaths Percent Deaths Percent Deaths Percent1 Malignant Neoplasms. . . . . . . . . . . . . . . . . . . . . . . . . . . . . . . . . . . . . . . 468 23.8 214 16.7 254 36.82 Diseases of Heart. . . . . . . . . . . . . . . . . . . . . . . . . . . . . . . . . . . . . . . . . . 335 17.0 233 18.2 102 14.83 Accidents Except Poisoning by Psychoactive Substance. . . . . . . . . . . . . 133 6.8 109 8.5 24 3.54 Human Immunodeficiency Virus (HIV) Disease. . . . . . . . . . . . . . . . . . . 109 5.5 79 6.2 30 4.35 Use of or Poisoning by Psychoactive Substance . . . . . . . . . . . . . . . . . . . 95 4.8 78 6.1 17 2.56 Chronic Liver Disease and Cirrhosis. . . . . . . . . . . . . . . . . . . . . . . . . . . . 88 4.5 76 5.9 12 1.77 Assault (Homicide). . . . . . . . . . . . . . . . . . . . . . . . . . . . . . . . . . . . . . . . . 77 3.9 67 5.2 10 1.48 Diabetes Mellitus. . . . . . . . . . . . . . . . . . . . . . . . . . . . . . . . . . . . . . . . . . 60 3.0 36 2.8 24 3.59 Cerebrovascular Diseases. . . . . . . . . . . . . . . . . . . . . . . . . . . . . . . . . . . . 53 2.7 31 2.4 22 3.210 Congenital Malformations, Deformations. . . . . . . . . . . . . . . . . . . . . . . . 52 2.6 30 2.3 22 3.2
All Other Causes . . . . . . . . . . . . . . . . . . . . . . . . . . . . . . . . . . . . . . . . . . 499 25.3 326 25.5 173 25.1Total. . . . . . . . . . . . . . . . . . . . . . . . . . . . . . . . . . . . . . . . . . . . . . . . . . . . . 1,969 100.0 1,279 100.0 690 100.0
Rank Asian and Pacific Islander Deaths Percent Deaths Percent Deaths Percent1 Malignant Neoplasms. . . . . . . . . . . . . . . . . . . . . . . . . . . . . . . . . . . . . . . 350 38.3 201 34.7 149 44.62 Diseases of Heart. . . . . . . . . . . . . . . . . . . . . . . . . . . . . . . . . . . . . . . . . . 178 19.5 141 24.3 37 11.13 Accidents Except Poisoning by Psychoactive Substance. . . . . . . . . . . . . 50 5.5 39 6.7 11 3.34 Intentional Self-harm (Suicide). . . . . . . . . . . . . . . . . . . . . . . . . . . . . . . . 44 4.8 23 4.0 21 6.35 Cerebrovascular Diseases. . . . . . . . . . . . . . . . . . . . . . . . . . . . . . . . . . . . 25 2.7 10 1.7 15 4.56 Congenital Malformations, Deformations. . . . . . . . . . . . . . . . . . . . . . . . 20 2.2 14 2.4 6 1.86 Diabetes Mellitus. . . . . . . . . . . . . . . . . . . . . . . . . . . . . . . . . . . . . . . . . . 20 2.2 12 2.1 8 2.48 Influenza and Pneumonia. . . . . . . . . . . . . . . . . . . . . . . . . . . . . . . . . . . . 16 1.8 9 1.6 7 2.18 Assault (Homicide). . . . . . . . . . . . . . . . . . . . . . . . . . . . . . . . . . . . . . . . . 16 1.8 13 2.2 3 0.910 Chronic Liver Disease and Cirrhosis. . . . . . . . . . . . . . . . . . . . . . . . . . . . 13 1.4 10 1.7 3 0.910 Viral Hepatitis . . . . . . . . . . . . . . . . . . . . . . . . . . . . . . . . . . . . . . . . . . . . 13 1.4 8 1.4 5 1.5
All Other Causes. . . . . . . . . . . . . . . . . . . . . . . . . . . . . . . . . . . . . . . . . . 169 18.5 100 17.2 69 20.7Total. . . . . . . . . . . . . . . . . . . . . . . . . . . . . . . . . . . . . . . . . . . . . . . . . . . . . 914 100.0 580 100.0 334 100.0
Rank Non-Hispanic White Deaths Percent Deaths Percent Deaths Percent1 Malignant Neoplasms. . . . . . . . . . . . . . . . . . . . . . . . . . . . . . . . . . . . . . . 1,945 34.8 994 28.3 951 45.72 Diseases of Heart. . . . . . . . . . . . . . . . . . . . . . . . . . . . . . . . . . . . . . . . . . 1,255 22.4 918 26.1 337 16.23 Use of or Poisoning by Psychoactive Substance . . . . . . . . . . . . . . . . . . . 305 5.5 224 6.4 81 3.94 Accidents Except Poisoning by Psychoactive Substance. . . . . . . . . . . . . 210 3.8 151 4.3 59 2.85 Intentional Self-harm (Suicide). . . . . . . . . . . . . . . . . . . . . . . . . . . . . . . . 198 3.5 154 4.4 44 2.16 Chronic Liver Disease and Cirrhosis. . . . . . . . . . . . . . . . . . . . . . . . . . . . 139 2.5 99 2.8 40 1.97 Diabetes Mellitus. . . . . . . . . . . . . . . . . . . . . . . . . . . . . . . . . . . . . . . . . . 120 2.1 85 2.4 35 1.78 Human Immunodeficiency Virus (HIV) Disease. . . . . . . . . . . . . . . . . . . 118 2.1 94 2.7 24 1.29 Cerebrovascular Diseases. . . . . . . . . . . . . . . . . . . . . . . . . . . . . . . . . . . . 93 1.7 52 1.5 41 2.010 Chronic Lower Respiratory Diseases. . . . . . . . . . . . . . . . . . . . . . . . . . . . 92 1.6 44 1.3 48 2.3
All Other Causes. . . . . . . . . . . . . . . . . . . . . . . . . . . . . . . . . . . . . . . . . . 1,118 20.0 699 19.9 419 20.2Total. . . . . . . . . . . . . . . . . . . . . . . . . . . . . . . . . . . . . . . . . . . . . . . . . . . . . 5,593 100.0 3,514 100.0 2,079 100.0
Rank Non-Hispanic Black Deaths Percent Deaths Percent Deaths Percent1 Malignant Neoplasms. . . . . . . . . . . . . . . . . . . . . . . . . . . . . . . . . . . . . . . 1,310 23.0 589 18.2 721 29.52 Diseases of Heart. . . . . . . . . . . . . . . . . . . . . . . . . . . . . . . . . . . . . . . . . . 1,236 21.7 725 22.3 511 20.93 Human Immunodeficiency Virus (HIV) Disease. . . . . . . . . . . . . . . . . . . 540 9.5 327 10.1 213 8.74 Assault (Homicide). . . . . . . . . . . . . . . . . . . . . . . . . . . . . . . . . . . . . . . . . 318 5.6 283 8.7 35 1.45 Diabetes Mellitus. . . . . . . . . . . . . . . . . . . . . . . . . . . . . . . . . . . . . . . . . . 190 3.3 102 3.1 88 3.66 Use of or Poisoning by Psychoactive Substance . . . . . . . . . . . . . . . . . . . 176 3.1 121 3.7 55 2.37 Cerebrovascular Diseases. . . . . . . . . . . . . . . . . . . . . . . . . . . . . . . . . . . . 171 3.0 95 2.9 76 3.18 Accidents Except Poisoning by Psychoactive Substance. . . . . . . . . . . . . 159 2.8 118 3.6 41 1.79 Chronic Lower Respiratory Diseases. . . . . . . . . . . . . . . . . . . . . . . . . . . . 116 2.0 64 2.0 52 2.110 Influenza and Pneumonia. . . . . . . . . . . . . . . . . . . . . . . . . . . . . . . . . . . . 113 2.0 65 2.0 48 2.0
All Other Causes. . . . . . . . . . . . . . . . . . . . . . . . . . . . . . . . . . . . . . . . . . 1,359 23.9 755 23.3 604 24.7Total. . . . . . . . . . . . . . . . . . . . . . . . . . . . . . . . . . . . . . . . . . . . . . . . . . . . . 5,688 100.0 3,244 100.0 2,444 100.0
Note: For each ethnic group, the ten leading causes of death for both sexes combined are arranged in decreasing order of frequency. * Decedents of other or multiple races, or with unknown ethnicities, are not shown.

19
Table 7. Deaths and Death Rates per 100,000 Population From Selected Causes by Ethnic Group and Sex, New York City, 2008
Ethnic Group* SexNon-Hispanic Non-Hispanic Asian and Other or
Total Hispanic White Black Pacific Islander Unknown Male Female
Cause of Death No.CrudeRate
Age-Adj.Rate No.
CrudeRate
Age-Adj.Rate No.
CrudeRate
Age-Adj.Rate No.
CrudeRate
Age-Adj.Rate No.
CrudeRate
Age-Adj.Rate No. No.
CrudeRate
Age-Adj.Rate No.
CrudeRate
Age-Adj.Rate
All Causes**. . . . . . . . . . . . . . . . . . . . . . . . . . . . . . . . . . . 54,193 6.5 6.1 9,329 4.0 5.3 27,131 9.2 6.2 14,006 7.1 7.5 2,971 3.0 3.7 756 26,342 6.6 7.4 27,851 6.4 5.2Diseases of Heart. . . . . . . . . . . . . . . . . . . . . . . . . . . . . . . . 21,192 253.4 235.5 2,775 120.0 170.5 12,339 416.9 259.4 4,802 244.4 263.2 1,002 100.3 131.6 274 9,587 240.0 278.2 11,605 265.7 202.9Malignant Neoplasms. . . . . . . . . . . . . . . . . . . . . . . . . . . . . 13,047 156.0 151.6 2,126 91.9 120.3 6,728 227.3 168.2 3,220 163.9 172.2 823 82.4 94.8 150 6,476 162.1 182.9 6,571 150.4 131.0Human Immunodeficiency Virus (HIV) Disease. . . . . . . . . 1,073 12.8 12.1 335 14.5 15.1 129 4.4 3.9 583 29.7 28.6 10 1.0 1.0 16 702 17.6 16.8 371 8.5 8.0Influenza and Pneumonia. . . . . . . . . . . . . . . . . . . . . . . . . . 2,300 27.5 25.5 414 17.9 26.1 1,150 38.9 23.7 540 27.5 29.9 163 16.3 22.3 33 1,044 26.1 30.8 1,256 28.8 21.9Cereborvascular Diseases. . . . . . . . . . . . . . . . . . . . . . . . . . 1,512 18.1 17.1 276 11.9 16.3 624 21.1 13.8 473 24.1 25.4 113 11.3 14.3 26 633 15.8 17.9 879 20.1 16.2Chronic Lower Respiratory Diseases . . . . . . . . . . . . . . . . . 1,605 19.2 18.4 288 12.4 17.4 865 29.2 19.7 360 18.3 19.5 76 7.6 10.5 16 704 17.6 20.5 901 20.6 16.9Chronic Liver Disease and Cirrhosis. . . . . . . . . . . . . . . . . . 542 6.5 6.2 212 9.2 10.7 197 6.7 5.5 104 5.3 5.2 19 1.9 1.9 10 366 9.2 9.2 176 4.0 3.7Diabetes Mellitus . . . . . . . . . . . . . . . . . . . . . . . . . . . . . . . 1,643 19.6 19.0 419 18.1 24.8 457 15.4 10.9 645 32.8 35.3 99 9.9 12.6 23 763 19.1 21.5 880 20.1 16.9Mental Disorders due to Substance Use andAccidental Drug Poisoning . . . . . . . . . . . . . . . . . . . . . . . . 736 8.8 8.4 215 9.3 9.5 313 10.6 9.9 188 9.6 9.1 5 0.5 0.5 15 548 13.7 13.1 188 4.3 4.1Accidents Except Poisoning by Psychoactive Substance. . . 1,044 12.5 12.1 254 11.0 12.4 465 15.7 12.6 216 11.0 11.1 91 9.1 10.3 18 673 16.8 17.5 371 8.5 7.5Intentional Self-harm (Suicide). . . . . . . . . . . . . . . . . . . . . . 473 5.7 5.5 88 3.8 3.9 252 8.5 7.7 65 3.3 3.3 56 5.6 5.5 12 348 8.7 8.7 125 2.9 2.7Assault (Homicide)***. . . . . . . . . . . . . . . . . . . . . . . . . . . . 558 6.7 6.7 144 6.2 6.0 57 1.9 2.0 323 16.4 16.7 18 1.8 1.7 16 477 11.9 11.7 81 1.9 1.9Events of Undetermined Intent. . . . . . . . . . . . . . . . . . . . . . 192 2.3 2.3 32 1.4 1.4 86 2.9 2.7 52 2.6 2.6 13 1.3 1.3 9 128 3.2 3.1 64 1.5 1.5
* Multiple races were introduced in January 2003 when New York City implemented a new death certificate form. See Technical Notes: Multiple Race.
** For All Causes rates are per 1,000 population and all other selected causes rates are per 100,000 population. Population data are from 2008 unchallenged vintage Census Bureau's estimates.
*** In 2002 and earlier years, deaths from legal interventions were included in Homicide. Since then, they are excluded from this table and are listed as a separate cause of death in Tables 4 and 16.

20
Table 8. Deaths and Death Rates* per 100,000 Population from Selected Causes by Community District of Residence, New York City, 2008
Chronic Chronic Mental DisordersInfluenza Cerebro- Lower Liver due to Substance Accidents Intentional Events of
All Causes Heart Malignant HIV and vascular Respiratory Disease & Diabetes Use & Accidental Except Self-harm Assault** Undetermined
(Rate per 1,000) Diseases Neoplasms Disease Pneumonia Diseases Diseases Cirrhosis Mellitus Poisoning Drug Poisoning (Suicide) (Homicide) Intent
Community District of ResidencePopulation
2008 Census No.CrudeRate
Age-Adjusted
Rate No.CrudeRate No.
CrudeRate No.
CrudeRate No.
CrudeRate No.
CrudeRate No.
CrudeRate No.
CrudeRate No.
CrudeRate No.
CrudeRate No.
CrudeRate No.
CrudeRate No.
CrudeRate No.
CrudeRate
ALL DEATH EVENTS 8,363,710 54,193 6.5 6.1 21,192 253.4 13,047 156.0 1,073 12.8 2,300 27.5 1,512 18.1 1,605 19.2 542 6.5 1,643 19.6 736 8.8 1,044 12.5 473 5.7 558 6.7 192 2.3
MANHATTAN 1,634,795 9,868 6.0 5.5 3,104 189.9 2,618 160.1 268 16.4 483 29.5 341 20.9 347 21.2 98 6.0 297 18.2 130 8.0 168 10.3 105 6.4 58 3.5 30 1.8Battery Park, Tribeca (01) 39,665 193 4.9 6.4 60 151.3 46 116.0 2 5.0 7 17.6 8 20.2 8 20.2 4 10.1 4 10.1 3 7.6 4 10.1 6 15.1 – – 1 2.5Greenwich Village, SOHO (02) 104,133 443 4.3 4.4 144 138.3 118 113.3 9 8.6 22 21.1 20 19.2 17 16.3 2 1.9 3 2.9 6 5.8 7 6.7 3 2.9 – – 1 1.0Lower East Side (03) 181,143 1,252 6.9 5.9 370 204.3 313 172.8 48 26.5 59 32.6 40 22.1 45 24.8 16 8.8 39 21.5 15 8.3 24 13.2 11 6.1 7 3.9 3 1.7Chelsea, Clinton (04) 97,502 580 5.9 5.8 178 182.6 152 155.9 15 15.4 32 32.8 23 23.6 28 28.7 8 8.2 13 13.3 10 10.3 19 19.5 12 12.3 2 2.1 3 3.1Midtown Business District (05) 48,406 247 5.1 5.4 65 134.3 67 138.4 13 26.9 11 22.7 8 16.5 11 22.7 2 4.1 2 4.1 7 14.5 5 10.3 8 16.5 1 2.1 – –Murray Hill (06) 150,763 784 5.2 4.4 256 169.8 244 161.8 8 5.3 41 27.2 22 14.6 34 22.6 7 4.6 9 6.0 8 5.3 14 9.3 7 4.6 – – 2 1.3Upper West Side (07) 231,103 1,368 5.9 5.2 452 195.6 386 167.0 26 11.3 85 36.8 57 24.7 41 17.7 8 3.5 24 10.4 13 5.6 19 8.2 20 8.7 6 2.6 4 1.7Upper East Side (08) 247,309 1,324 5.4 4.6 474 191.7 390 157.7 14 5.7 71 28.7 47 19.0 43 17.4 10 4.0 12 4.9 12 4.9 19 7.7 15 6.1 2 0.8 4 1.6Manhattanville (09) 108,456 659 6.1 6.3 210 193.6 146 134.6 28 25.8 33 30.4 23 21.2 21 19.4 6 5.5 33 30.4 12 11.1 7 6.5 4 3.7 7 6.5 4 3.7Central Harlem (10) 99,924 937 9.4 8.9 265 265.2 231 231.2 50 50.0 35 35.0 25 25.0 29 29.0 10 10.0 52 52.0 16 16.0 13 13.0 7 7.0 14 14.0 6 6.0East Harlem (11) 115,980 1,005 8.7 8.1 288 248.3 250 215.6 40 34.5 39 33.6 29 25.0 32 27.6 12 10.3 54 46.6 17 14.7 17 14.7 2 1.7 16 13.8 1 0.9Washington Heights (12) 203,087 1,029 5.1 4.9 326 160.5 263 129.5 15 7.4 44 21.7 38 18.7 37 18.2 13 6.4 45 22.2 11 5.4 20 9.8 10 4.9 3 1.5 1 0.5
BRONX 1,391,903 8,666 6.2 6.7 2,838 203.9 1,938 139.2 305 21.9 382 27.4 273 19.6 269 19.3 100 7.2 379 27.2 179 12.9 151 10.8 65 4.7 134 9.6 21 1.5Mott Haven (01) 90,614 546 6.0 7.5 145 160.0 103 113.7 29 32.0 23 25.4 19 21.0 17 18.8 5 5.5 21 23.2 16 17.7 11 12.1 4 4.4 17 18.8 – –Hunts Point (02) 51,418 259 5.0 6.4 71 138.1 60 116.7 16 31.1 9 17.5 8 15.6 8 15.6 8 15.6 13 25.3 8 15.6 2 3.9 3 5.8 2 3.9 1 1.9Morrisania (03) 74,307 455 6.1 8.4 109 146.7 101 135.9 38 51.1 13 17.5 9 12.1 17 22.9 9 12.1 22 29.6 15 20.2 10 13.5 6 8.1 15 20.2 2 2.7Concourse, Highbridge (04) 149,183 832 5.6 7.7 222 148.8 181 121.3 52 34.9 33 22.1 23 15.4 22 14.7 17 11.4 33 22.1 20 13.4 19 12.7 4 2.7 23 15.4 5 3.4University/Morris Heights (05) 134,941 545 4.0 6.5 131 97.1 118 87.4 44 32.6 21 15.6 24 17.8 14 10.4 8 5.9 36 26.7 18 13.3 14 10.4 6 4.4 12 8.9 2 1.5East Tremont (06) 81,885 415 5.1 6.5 104 127.0 86 105.0 21 25.6 23 28.1 20 24.4 8 9.8 7 8.5 19 23.2 18 22.0 8 9.8 1 1.2 11 13.4 – –Fordham (07) 147,182 725 4.9 6.2 243 165.1 170 115.5 14 9.5 24 16.3 20 13.6 32 21.7 7 4.8 34 23.1 12 8.2 19 12.9 11 7.5 12 8.2 2 1.4Riverdale (08) 99,149 1,060 10.7 6.8 437 440.8 210 211.8 9 9.1 71 71.6 30 30.3 30 30.3 6 6.1 44 44.4 11 11.1 12 12.1 8 8.1 1 1.0 1 1.0Unionport, Soundview (09) 179,762 1,016 5.7 6.3 341 189.7 239 133.0 34 18.9 43 23.9 37 20.6 26 14.5 14 7.8 48 26.7 20 11.1 21 11.7 9 5.0 11 6.1 3 1.7Throgs Neck (10) 115,027 1,076 9.4 6.7 405 352.1 289 251.2 9 7.8 42 36.5 30 26.1 37 32.2 6 5.2 40 34.8 19 16.5 11 9.6 7 6.1 5 4.3 2 1.7Pelham Parkway (11) 110,251 886 8.0 6.3 336 304.8 199 180.5 8 7.3 41 37.2 17 15.4 31 28.1 7 6.3 40 36.3 14 12.7 10 9.1 2 1.8 8 7.3 1 0.9Williamsbridge (12) 152,704 895 5.9 5.8 309 202.4 192 125.7 31 20.3 43 28.2 37 24.2 28 18.3 6 3.9 36 23.6 8 5.2 14 9.2 4 2.6 17 11.1 2 1.3
BROOKLYN 2,556,598 15,790 6.2 5.9 7,001 273.8 3,443 134.7 318 12.4 621 24.3 387 15.1 416 16.3 148 5.8 511 20.0 172 6.7 292 11.4 130 5.1 204 8.0 53 2.1Williamsburg, Greenpoint (01) 172,877 850 4.9 5.7 290 167.7 218 126.1 19 11.0 46 26.6 20 11.6 25 14.5 21 12.1 25 14.5 14 8.1 24 13.9 9 5.2 7 4.0 2 1.2Fort Greene, Brooklyn Heights (02) 101,371 670 6.6 6.6 290 286.1 156 153.9 11 10.9 41 40.4 14 13.8 12 11.8 6 5.9 24 23.7 5 4.9 13 12.8 4 3.9 4 3.9 4 3.9Bedford Stuyvesant (03) 144,801 1,052 7.3 7.5 364 251.4 214 147.8 56 38.7 49 33.8 30 20.7 37 25.6 11 7.6 54 37.3 16 11.0 14 9.7 13 9.0 26 18.0 2 1.4Bushwick (04) 109,736 522 4.8 6.4 131 119.4 109 99.3 18 16.4 25 22.8 19 17.3 22 20.0 8 7.3 35 31.9 15 13.7 11 10.0 3 2.7 11 10.0 2 1.8East New York (05) 177,511 1,066 6.0 7.1 382 215.2 228 128.4 37 20.8 38 21.4 31 17.5 27 15.2 19 10.7 52 29.3 10 5.6 17 9.6 13 7.3 20 11.3 4 2.3Park Slope (06) 108,498 628 5.8 6.8 252 232.3 135 124.4 9 8.3 35 32.3 11 10.1 16 14.7 7 6.5 21 19.4 4 3.7 12 11.1 10 9.2 6 5.5 4 3.7Sunset Park (07) 126,711 526 4.2 4.8 220 173.6 120 94.7 6 4.7 29 22.9 12 9.5 14 11.0 17 13.4 8 6.3 7 5.5 10 7.9 5 3.9 2 1.6 3 2.4Crown Heights North (08) 95,401 623 6.5 6.6 218 228.5 120 125.8 27 28.3 38 39.8 29 30.4 21 22.0 6 6.3 25 26.2 13 13.6 8 8.4 3 3.1 17 17.8 2 2.1Crown Heights South (09) 102,881 619 6.0 6.4 209 203.1 139 135.1 20 19.4 24 23.3 27 26.2 21 20.4 4 3.9 43 41.8 4 3.9 8 7.8 8 7.8 15 14.6 4 3.9Bay Ridge (10) 131,370 934 7.1 5.5 477 363.1 191 145.4 5 3.8 34 25.9 16 12.2 42 32.0 2 1.5 25 19.0 6 4.6 22 16.7 6 4.6 – – – –Bensonhurst (11) 187,874 1,289 6.9 5.2 678 360.9 306 162.9 1 0.5 42 22.4 11 5.9 35 18.6 4 2.1 20 10.6 12 6.4 27 14.4 15 8.0 9 4.8 4 2.1Borough Park (12) 197,616 1,014 5.1 4.7 556 281.4 219 110.8 – – 40 20.2 15 7.6 21 10.6 2 1.0 19 9.6 5 2.5 18 9.1 5 2.5 5 2.5 5 2.5Coney Island (13) 112,989 1,188 10.5 6.5 723 639.9 217 192.1 7 6.2 29 25.7 21 18.6 16 14.2 7 6.2 12 10.6 13 11.5 16 14.2 9 8.0 6 5.3 3 2.7Flatbush, Midwood (14) 171,171 932 5.4 5.4 449 262.3 192 112.2 19 11.1 39 22.8 16 9.3 12 7.0 5 2.9 20 11.7 9 5.3 16 9.3 12 7.0 12 7.0 3 1.8Sheepshead Bay (15) 171,932 1,292 7.5 5.2 732 425.7 301 175.1 4 2.3 40 23.3 19 11.1 24 14.0 7 4.1 16 9.3 11 6.4 23 13.4 9 5.2 6 3.5 3 1.7Brownsville (16) 84,993 619 7.3 8.8 210 247.1 118 138.8 37 43.5 13 15.3 20 23.5 23 27.1 8 9.4 28 32.9 13 15.3 10 11.8 – – 24 28.2 1 1.2East Flatbush (17) 161,958 798 4.9 5.2 276 170.4 193 119.2 25 15.4 25 15.4 38 23.5 21 13.0 5 3.1 43 26.6 5 3.1 19 11.7 1 0.6 14 8.6 1 0.6Canarsie (18) 196,909 1,167 5.9 5.9 543 275.8 267 135.6 17 8.6 34 17.3 38 19.3 27 13.7 9 4.6 41 20.8 10 5.1 24 12.2 5 2.5 20 10.2 6 3.0
Continued on next page.
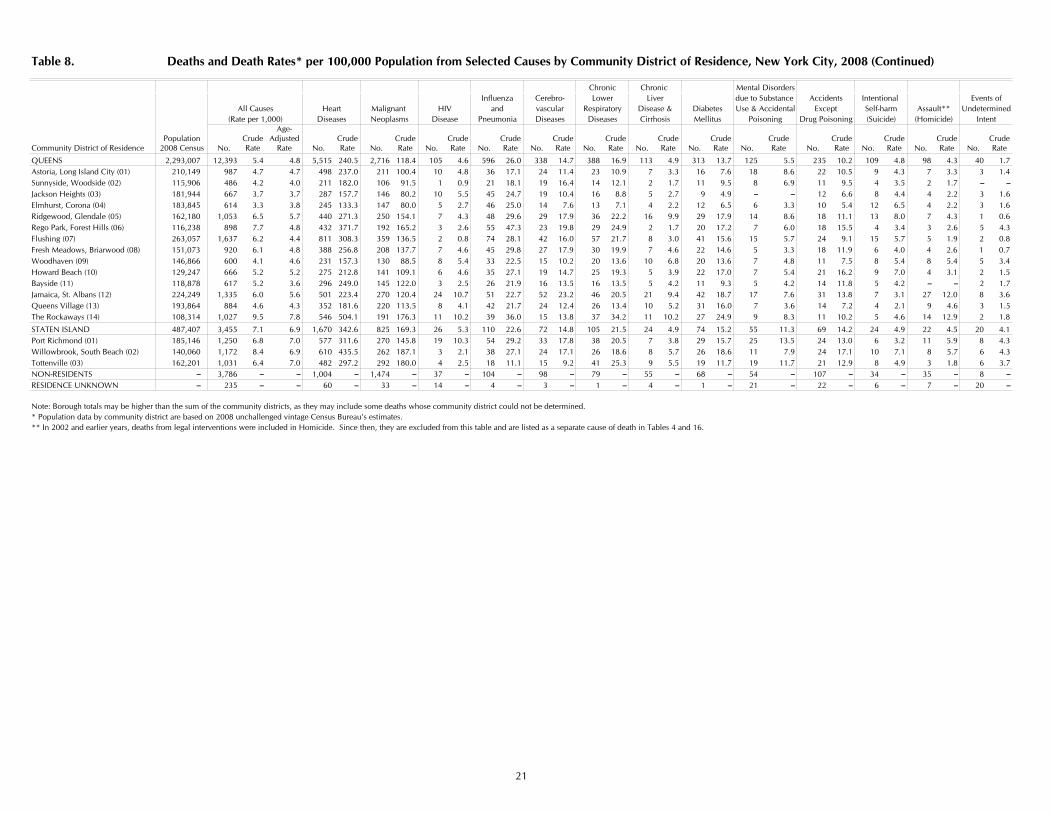
21
Table 8. Deaths and Death Rates* per 100,000 Population from Selected Causes by Community District of Residence, New York City, 2008 (Continued)
Chronic Chronic Mental DisordersInfluenza Cerebro- Lower Liver due to Substance Accidents Intentional Events of
All Causes Heart Malignant HIV and vascular Respiratory Disease & Diabetes Use & Accidental Except Self-harm Assault** Undetermined(Rate per 1,000) Diseases Neoplasms Disease Pneumonia Diseases Diseases Cirrhosis Mellitus Poisoning Drug Poisoning (Suicide) (Homicide) Intent
Community District of ResidencePopulation
2008 Census No.CrudeRate
Age-Adjusted
Rate No.CrudeRate No.
CrudeRate No.
CrudeRate No.
CrudeRate No.
CrudeRate No.
CrudeRate No.
CrudeRate No.
CrudeRate No.
CrudeRate No.
CrudeRate No.
CrudeRate No.
CrudeRate No.
CrudeRate
QUEENS 2,293,007 12,393 5.4 4.8 5,515 240.5 2,716 118.4 105 4.6 596 26.0 338 14.7 388 16.9 113 4.9 313 13.7 125 5.5 235 10.2 109 4.8 98 4.3 40 1.7Astoria, Long Island City (01) 210,149 987 4.7 4.7 498 237.0 211 100.4 10 4.8 36 17.1 24 11.4 23 10.9 7 3.3 16 7.6 18 8.6 22 10.5 9 4.3 7 3.3 3 1.4Sunnyside, Woodside (02) 115,906 486 4.2 4.0 211 182.0 106 91.5 1 0.9 21 18.1 19 16.4 14 12.1 2 1.7 11 9.5 8 6.9 11 9.5 4 3.5 2 1.7 – –Jackson Heights (03) 181,944 667 3.7 3.7 287 157.7 146 80.2 10 5.5 45 24.7 19 10.4 16 8.8 5 2.7 9 4.9 – – 12 6.6 8 4.4 4 2.2 3 1.6Elmhurst, Corona (04) 183,845 614 3.3 3.8 245 133.3 147 80.0 5 2.7 46 25.0 14 7.6 13 7.1 4 2.2 12 6.5 6 3.3 10 5.4 12 6.5 4 2.2 3 1.6Ridgewood, Glendale (05) 162,180 1,053 6.5 5.7 440 271.3 250 154.1 7 4.3 48 29.6 29 17.9 36 22.2 16 9.9 29 17.9 14 8.6 18 11.1 13 8.0 7 4.3 1 0.6Rego Park, Forest Hills (06) 116,238 898 7.7 4.8 432 371.7 192 165.2 3 2.6 55 47.3 23 19.8 29 24.9 2 1.7 20 17.2 7 6.0 18 15.5 4 3.4 3 2.6 5 4.3Flushing (07) 263,057 1,637 6.2 4.4 811 308.3 359 136.5 2 0.8 74 28.1 42 16.0 57 21.7 8 3.0 41 15.6 15 5.7 24 9.1 15 5.7 5 1.9 2 0.8Fresh Meadows, Briarwood (08) 151,073 920 6.1 4.8 388 256.8 208 137.7 7 4.6 45 29.8 27 17.9 30 19.9 7 4.6 22 14.6 5 3.3 18 11.9 6 4.0 4 2.6 1 0.7Woodhaven (09) 146,866 600 4.1 4.6 231 157.3 130 88.5 8 5.4 33 22.5 15 10.2 20 13.6 10 6.8 20 13.6 7 4.8 11 7.5 8 5.4 8 5.4 5 3.4Howard Beach (10) 129,247 666 5.2 5.2 275 212.8 141 109.1 6 4.6 35 27.1 19 14.7 25 19.3 5 3.9 22 17.0 7 5.4 21 16.2 9 7.0 4 3.1 2 1.5Bayside (11) 118,878 617 5.2 3.6 296 249.0 145 122.0 3 2.5 26 21.9 16 13.5 16 13.5 5 4.2 11 9.3 5 4.2 14 11.8 5 4.2 – – 2 1.7Jamaica, St. Albans (12) 224,249 1,335 6.0 5.6 501 223.4 270 120.4 24 10.7 51 22.7 52 23.2 46 20.5 21 9.4 42 18.7 17 7.6 31 13.8 7 3.1 27 12.0 8 3.6Queens Village (13) 193,864 884 4.6 4.3 352 181.6 220 113.5 8 4.1 42 21.7 24 12.4 26 13.4 10 5.2 31 16.0 7 3.6 14 7.2 4 2.1 9 4.6 3 1.5The Rockaways (14) 108,314 1,027 9.5 7.8 546 504.1 191 176.3 11 10.2 39 36.0 15 13.8 37 34.2 11 10.2 27 24.9 9 8.3 11 10.2 5 4.6 14 12.9 2 1.8
STATEN ISLAND 487,407 3,455 7.1 6.9 1,670 342.6 825 169.3 26 5.3 110 22.6 72 14.8 105 21.5 24 4.9 74 15.2 55 11.3 69 14.2 24 4.9 22 4.5 20 4.1Port Richmond (01) 185,146 1,250 6.8 7.0 577 311.6 270 145.8 19 10.3 54 29.2 33 17.8 38 20.5 7 3.8 29 15.7 25 13.5 24 13.0 6 3.2 11 5.9 8 4.3Willowbrook, South Beach (02) 140,060 1,172 8.4 6.9 610 435.5 262 187.1 3 2.1 38 27.1 24 17.1 26 18.6 8 5.7 26 18.6 11 7.9 24 17.1 10 7.1 8 5.7 6 4.3Tottenville (03) 162,201 1,031 6.4 7.0 482 297.2 292 180.0 4 2.5 18 11.1 15 9.2 41 25.3 9 5.5 19 11.7 19 11.7 21 12.9 8 4.9 3 1.8 6 3.7NON-RESIDENTS – 3,786 – – 1,004 – 1,474 – 37 – 104 – 98 – 79 – 55 – 68 – 54 – 107 – 34 – 35 – 8 –RESIDENCE UNKNOWN – 235 – – 60 – 33 – 14 – 4 – 3 – 1 – 4 – 1 – 21 – 22 – 6 – 7 – 20 –
Note: Borough totals may be higher than the sum of the community districts, as they may include some deaths whose community district could not be determined. * Population data by community district are based on 2008 unchallenged vintage Census Bureau's estimates.** In 2002 and earlier years, deaths from legal interventions were included in Homicide. Since then, they are excluded from this table and are listed as a separate cause of death in Tables 4 and 16.

22
Table 9. Deaths by Place* of DeathNew York City, 2002-2008
2002 2003 2004 2005 2006 2007 2008Place of Death Deaths % Deaths % Deaths % Deaths % Deaths % Deaths % Deaths %Total. . . . . . . . . . . . . . . . . . . . . . . . . . . 59,651 100.0 59,213 100.0 57,466 100.0 57,068 100.0 55,391 100.0 54,073 100.0 54,193 100.0Home. . . . . . . . . . . . . . . . . . . . . . . . . . 10,944 18.3 10,843 18.3 10,342 18.0 10,590 18.6 10,603 19.1 10,213 18.9 10,456 19.3Hospital Voluntary. . . . . . . . . . . . . . . . . . . . . . 33,565 56.3 33,307 56.2 32,630 56.8 32,022 56.1 30,575 55.2 29,859 55.2 29,575 54.6 Proprietary. . . . . . . . . . . . . . . . . . . . . 740 1.2 737 1.2 738 1.3 799 1.4 644 1.2 597 1.1 574 1.1 Municipal. . . . . . . . . . . . . . . . . . . . . . 5,362 9.0 5,277 8.9 4,931 8.6 4,715 8.3 4,635 8.4 4,737 8.8 4,621 8.5 Other Government. . . . . . . . . . . . . . . 715 1.2 689 1.2 632 1.1 560 1.0 575 1.0 606 1.1 586 1.1Nursing Home. . . . . . . . . . . . . . . . . . . . 6,735 11.3 6,790 11.5 6,659 11.6 6,748 11.8 6,644 12.0 6,370 11.8 6,479 12.0Other Specified Place. . . . . . . . . . . . . . 1,590 2.7 1,570 2.7 1,534 2.7 1,634 2.9 1,715 3.1 1,691 3.1 1,902 3.5
* Hospital includes residential units, hospices, and other special facilities within the hospital. Hospice care may be provided at any place. See Technical Notes: Geographic Units, Place of Death.
Table 10. Deaths by Ancestry* and Borough of Residence New York City, 2008
Borough of Residence Non- ResidenceAncestry Total Manhattan Bronx Brooklyn Queens Staten Island Residents UnknownTotal. . . . . . . . . . . . . . . . . . . . . . . . . . . . . . . . . . . 54,193 9,868 8,666 15,790 12,393 3,455 3,786 235
HispanicPuerto Rican. . . . . . . . . . . . . . . . . . . . . . . . . . . . . 4,945 1,035 1,897 1,242 462 136 154 19Dominican. . . . . . . . . . . . . . . . . . . . . . . . . . . . . . 1,445 531 445 221 205 6 37 –Colombian. . . . . . . . . . . . . . . . . . . . . . . . . . . . . . 246 27 14 20 165 6 14 –Ecuadorian. . . . . . . . . . . . . . . . . . . . . . . . . . . . . . 344 49 68 69 138 6 12 2Mexican. . . . . . . . . . . . . . . . . . . . . . . . . . . . . . . . 269 44 64 76 60 8 16 1Cuban. . . . . . . . . . . . . . . . . . . . . . . . . . . . . . . . . . 449 150 86 59 126 8 20 –Other Hispanic. . . . . . . . . . . . . . . . . . . . . . . . . . . 1,631 294 440 427 327 42 81 20
North, Central, and South AmericanAfrican American. . . . . . . . . . . . . . . . . . . . . . . . . 10,929 2,222 2,374 3,700 1,961 219 409 44American. . . . . . . . . . . . . . . . . . . . . . . . . . . . . . . 11,548 2,836 1,197 2,464 2,728 916 1,382 25Guyanese. . . . . . . . . . . . . . . . . . . . . . . . . . . . . . . 634 10 58 247 295 1 23 –Haitian. . . . . . . . . . . . . . . . . . . . . . . . . . . . . . . . . 547 33 18 327 137 4 28 –Jamaican. . . . . . . . . . . . . . . . . . . . . . . . . . . . . . . . 719 32 203 342 105 4 32 1Trinidadian. . . . . . . . . . . . . . . . . . . . . . . . . . . . . . 282 10 14 190 53 1 13 1All Other North, Central, and South American . . 984 84 148 553 137 18 44 –
EuropeanEnglish. . . . . . . . . . . . . . . . . . . . . . . . . . . . . . . . . 152 29 10 23 42 29 19 –German. . . . . . . . . . . . . . . . . . . . . . . . . . . . . . . . 954 172 102 107 383 106 81 3Irish. . . . . . . . . . . . . . . . . . . . . . . . . . . . . . . . . . . 2,082 213 230 389 656 334 259 1Italian. . . . . . . . . . . . . . . . . . . . . . . . . . . . . . . . . . 5,066 277 448 1,537 1,230 1,145 422 7Polish. . . . . . . . . . . . . . . . . . . . . . . . . . . . . . . . . . 965 103 87 325 306 65 79 –Russian. . . . . . . . . . . . . . . . . . . . . . . . . . . . . . . . . 756 70 40 434 164 26 21 1Other European. . . . . . . . . . . . . . . . . . . . . . . . . . 2,914 378 173 1,109 934 163 151 6
AsianAsian Indian. . . . . . . . . . . . . . . . . . . . . . . . . . . . . 224 16 9 25 125 14 35 –Bangladeshi. . . . . . . . . . . . . . . . . . . . . . . . . . . . . 88 4 13 27 41 1 2 –Chinese. . . . . . . . . . . . . . . . . . . . . . . . . . . . . . . . 1,780 580 31 533 544 24 66 2Filipino. . . . . . . . . . . . . . . . . . . . . . . . . . . . . . . . . 180 20 14 19 87 17 22 1Korean. . . . . . . . . . . . . . . . . . . . . . . . . . . . . . . . . 278 10 10 12 213 8 24 1Pakistani. . . . . . . . . . . . . . . . . . . . . . . . . . . . . . . . 104 2 5 34 42 4 14 3Other Asian. . . . . . . . . . . . . . . . . . . . . . . . . . . . . 465 83 22 122 161 21 54 2
OtherJewish or Hebrew. . . . . . . . . . . . . . . . . . . . . . . . . 1,499 161 130 813 231 17 144 3Other or Not Stated. . . . . . . . . . . . . . . . . .. . . . . . 1,714 393 316 344 335 106 128 92* See Technical Notes: Race, Ancestry, Ethnic Group and Birthplace.

23
Construction34.4%
Leisure & Hospitality6.7%
Education & Health4.4%
Professional/Business7.8%
Financial Activities4.4%
Trade, Transportation26.7%
Other Services7.8%
Other Industries7.8%
1997
1998
1999
2000
2001
2002
2003
2004
2005
2006
2007
2008
Year
0
20
40
60
80
100
120
140
Num
ber
ofD
eath
s
Male FemaleFigure 9. Fatal Occupational Injuries by Sex New York City, 1997-2008
Fatal occupational injuries fluctuated but have remained close to 100 deaths per year from 2001 through 2006. There were 90 fatal occupational injuries in 2008, an increase from 81 in 2007. Males have a much higher rate of fatal injuries than females, accounting for about 90% of all occupational injury deaths during the past five years.
World Trade Center (WTC) disaster deaths are homicides and are not included in this figure for the year 2001. See 2002 Annual Summary's Special Section on WTC deaths.
Figure 10. Fatal Occupational Injuries by Selected Industries New York City, 2008
In 2008, 34.4% of all fatal occupational injuries in New York City occurred in the construction industry, an increase of almost 5 percentage points from 2007. This industry continued to record the highest number of fatal work injuries among all industries in NYC and the nation. Of the 31 deaths in the construction industry, 16 (51.6%) were due to falls. Other industries in New York City that also had high numbers of fatal occupational injuries in 2008 were Trade, Transportation and Utilities with 26.7% of occupational deaths, and Professional and Business Services with 7.8%.
Table 11. Selected Characteristics of Deaths Due to Fatal Occupational Injuries New York City, 2008
Sex Age Group in YearsCharacteristic All Deaths Male Female <25 25-34 35-44 45-54 55+Total . . . . . . . . . . . . . . . . . . . . . . . . . . . . . . . . . 90 81 9 3 14 18 30 25Selected Events Transportation incident . . . . . . . . . . . . . . . . . 10 9 1 0 0 2 4 4 Assaults and violent acts . . . . . . . . . . . . . . . . 26 21 5 1 5 4 4 12 Homicide . . . . . . . . . . . . . . . . . . . . . . . . . 18 15 3 1 4 2 3 8 Shooting . . . . . . . . . . . . . . . . . . . . . . . . 10 10 0 1 3 1 0 5 Falls . . . . . . . . . . . . . . . . . . . . . . . . . . . . . . . 29 27 2 0 3 6 11 9Selected Industries * Construction . . . . . . . . . . . . . . . . . . . . . . . . . 31 31 0 0 8 6 11 6 Taxicabs . . . . . . . . . . . . . . . . . . . . . . . . . . . . 3 2 1 0 0 1 0 2 Grocery stores . . . . . . . . . . . . . . . . . . . . . . . . 1 0 1 0 1 0 0 0 Eating and drinking places . . . . . . . . . . . . . . . 5 5 0 1 0 1 1 2 Police and fire protection . . . . . . . . . . . . . . . 2 2 0 0 0 1 1 0Ethnic Group Non-Hispanic White . . . . . . . . . . . . . . . . . . . 47 44 3 2 5 11 16 13 Non-Hispanic Black . . . . . . . . . . . . . . . . . . . 12 11 1 0 4 1 5 2 Hispanic. . . . . . . . . . . . . . . . . . . . . . . . .. . . . 21 17 4 0 5 6 5 5 Asian and Pacific Islander. . . . . . . . . . . . . . . . 10 9 1 1 0 0 4 5* Beginning in 2003, coding for industries was changed from Standard Industrial Classification (SIC) to North American Industry Classification System (NAICS). See Technical Notes: Fatal Occupational Injuries. Data reported in Table 11 and Figures 9 and 10 include all fatal occupational injuries occuring in New York City, regardless of the residence of decedents or location of the deaths (i.e. whether deaths occurred inside or outside of NYC).

24
Table 12. Deaths by Birthplace and Borough of Residence New York City, 2008
Borough of Residence Non- ResidenceBirthplace* Total Manhattan Bronx Brooklyn Queens Staten Island Residents UnknownTotal. . . . . . . . . . . . . . . . . . . . . . . . . . . . . . . . . 54,193 9,868 8,666 15,790 12,393 3,455 3,786 235Bangladesh. . . . . . . . . . . . . . . . . . . . . . . . . . . . 97 4 14 29 47 1 2 –China. . . . . . . . . . . . . . . . . . . . . . . . . . . . . . . . . 1,568 529 24 466 473 22 51 3Colombia. . . . . . . . . . . . . . . . . . . . . . . . . . . . . . 245 27 17 20 163 6 12 –Cuba. . . . . . . . . . . . . . . . . . . . . . . . . . . . . . . . . 439 148 85 54 127 8 17 –Dominican Republic. . . . . . . . . . . . . . . . . . . . . 1,406 523 439 209 197 6 32 –Ecuador. . . . . . . . . . . . . . . . . . . . . . . . . . . . . . . 341 50 67 68 136 6 12 2El Salvador. . . . . . . . . . . . . . . . . . . . . . . . . . . . . 63 6 7 13 29 1 6 1Germany. . . . . . . . . . . . . . . . . . . . . . . . . . . . . . 444 132 49 54 154 18 37 –Guyana. . . . . . . . . . . . . . . . . . . . . . . . . . . . . . . 717 18 66 289 314 2 28 –Haiti. . . . . . . . . . . . . . . . . . . . . . . . . . . . . . . . . . 644 39 21 398 147 4 35 –Honduras. . . . . . . . . . . . . . . . . . . . . . . . . . . . . . 110 21 31 34 13 9 2 –India. . . . . . . . . . . . . . . . . . . . . . . . . . . . . . . . . 231 18 8 27 128 17 33 –Ireland. . . . . . . . . . . . . . . . . . . . . . . . . . . . . . . . 314 48 81 38 98 19 30 –Israel. . . . . . . . . . . . . . . . . . . . . . . . . . . . . . . . . 102 9 6 43 23 6 15 –Italy. . . . . . . . . . . . . . . . . . . . . . . . . . . . . . . . . . 1,165 59 153 389 322 156 85 1Jamaica . . . . . . . . . . . . . . . . . . . . . . . . . . . . . . . 1,089 59 294 462 219 6 47 2Korea. . . . . . . . . . . . . . . . . . . . . . . . . . . . . . . . . 270 8 10 11 209 7 24 1Mexico. . . . . . . . . . . . . . . . . . . . . . . .. . . . . . . . 233 37 57 66 49 7 16 1Pakistan. . . . . . . . . . . . . . . . . . . . . . . . . . . . . . . 91 2 5 29 38 3 12 2Philippines. . . . . . . . . . . . . . . . . . . . . . . . . . . . . 188 21 14 22 90 18 22 1Poland. . . . . . . . . . . . . . . . . . . . . . . . . . . . . . . . 850 107 79 370 214 27 53 –Puerto Rico. . . . . . . . . . . . . . . . . . . . . . . . . . . . 4,064 898 1,604 1,017 331 96 106 12Russia. . . . . . . . . . . . . . . . . . . . . . . . . . . . . . . . 524 62 30 292 105 14 18 3Trinidad and Tobago. . . . . . . . . . . . . . . . . . . . . 457 27 40 277 90 5 17 1Ukraine. . . . . . . . . . . . . . . . . . . . . . . . . . . . . . . 998 39 20 769 126 31 13 –United States. . . . . . . . . . . . . . . . . . . . . . . . . . . 31,267 5,968 4,584 8,271 6,908 2,750 2,716 70Other. . . . . . . . . . . . . . . . . . . . . . . . . . . . . . . . . 4,889 720 453 1,799 1,406 171 332 8Not Stated. . . . . . . . . . . . . . . . . . . . . . . . . . . . . 1,387 289 408 274 237 39 13 127
* Beginning in 2006, U.S. Virgin Islands and Guam are included in United States, a change from 1996-2005 when those two birthplaces were included in the "Other" category.
Table 13. Deaths by Birthplace and Age New York City, 2008
Age in YearsBirthplace* Total <15 15-24 25-34 35-44 45-54 55-64 65-74 75-84 85+Total. . . . . . . . . . . . . . . . . . . . . . . . . . . 54,193 951 589 1,033 1,951 4,561 7,246 8,978 13,157 15,727Bangladesh. . . . . . . . . . . . . . . . . . . . . . 97 – 3 5 7 19 20 28 11 4China. . . . . . . . . . . . . . . . . . . . . . . . . . 1,568 2 5 15 29 88 127 252 506 544Colombia. . . . . . . . . . . . . . . . . . . . . . . 245 – 1 3 8 29 37 55 58 54Cuba. . . . . . . . . . . . . . . . . . . . . . . . . . 439 – – 1 2 15 37 73 156 155Dominican Republic. . . . . . . . . . . . . . 1,406 2 10 44 67 147 245 285 343 263Ecuador. . . . . . . . . . . . . . . . . . . . . . . . 341 2 9 19 20 41 58 60 72 60El Salvador. . . . . . . . . . . . . . . . . . . . . . 63 – 1 5 2 16 7 10 11 11Germany. . . . . . . . . . . . . . . . . . . . . . . 444 – – 1 4 6 33 41 105 254Guyana. . . . . . . . . . . . . . . . . . . . . . . . 717 3 7 21 33 84 127 151 161 130Haiti. . . . . . . . . . . . . . . . . . . . . . . . . . . 644 – – 7 16 84 93 149 144 151Honduras. . . . . . . . . . . . . . . . . . . . . . . 110 – 3 1 10 3 24 27 21 21India. . . . . . . . . . . . . . . . . . . . . . . . . . . 231 1 – 6 9 27 47 52 55 34Ireland. . . . . . . . . . . . . . . . . . . . . . . . . 314 – – 2 3 10 24 47 95 133Israel. . . . . . . . . . . . . . . . . . . . . . . . . . 102 2 – 2 3 11 23 24 27 10Italy. . . . . . . . . . . . . . . . . . . . . . . . . . . 1,165 – – 2 5 24 69 173 362 530Jamaica . . . . . . . . . . . . . . . . . . . . . . . . 1,089 – 11 31 52 93 171 217 253 261Korea. . . . . . . . . . . . . . . . . . . . . . . . . . 270 – – 7 7 24 44 58 55 75Mexico. . . . . . . . . . . . . . . . . . . . . . . . . 233 3 20 41 57 42 26 19 15 10Pakistan. . . . . . . . . . . . . . . . . . . . . . . . 91 2 5 4 8 17 22 20 10 3Philippines. . . . . . . . . . . . . . . . . . . . . . 188 3 1 2 8 19 34 45 31 45Poland. . . . . . . . . . . . . . . . . . . . . . . . . 850 – – 4 14 43 68 52 153 516Puerto Rico. . . . . . . . . . . . . . . . . . . . . 4,064 1 11 27 82 257 763 964 1,028 931Russia. . . . . . . . . . . . . . . . . . . . . . . . . . 524 – 5 8 6 24 47 69 127 238Trinidad and Tobago. . . . . . . . . . . . . . 457 1 9 13 24 54 97 89 93 77Ukraine. . . . . . . . . . . . . . . . . . . . . . . . 998 – 4 6 17 21 79 146 336 389United States. . . . . . . . . . . . . . . . . . . . 31,267 918 438 623 1,221 2,796 4,055 4,801 7,402 9,013Other. . . . . . . . . . . . . . . . . . . . . . . . . . 4,889 8 44 95 158 364 589 778 1,252 1,601Not Stated. . . . . . . . . . . . . . . . . . . . . . 1,387 3 2 38 79 203 280 293 275 214
* Beginning in 2006, U.S. Virgin Islands and Guam are included in United States, a change from 1996-2005 when those two birthplaces were included in the "Other" category.

25
DEATHS DUE TO EXTERNAL CAUSES BY AGE AND SEX, NEW YORK CITY, 2008
Table 14. Accidents
0-4 5-9 10-14 15-19 20-24 25-34 35-44 45-54 55-64 65-74 75+Type All Ages Male Female Male Female Male Female Male Female Male Female Male Female Male Female Male Female Male Female Male Female Male Female
Total . . . . . . . . . . . . . . . . . . . . . . . . . . . . . . 1,651 22 10 11 3 9 4 31 6 64 18 165 39 179 53 250 99 171 69 91 51 128 178Motor vehicle except injury to pedal cyclist 299 - 1 4 1 3 1 10 2 22 10 43 12 24 5 21 12 24 17 21 23 18 25 Injury to pedestrian . . . . . . . . . . . . . . . . . 171 - - 2 1 3 1 3 1 6 4 10 6 7 3 14 7 18 12 19 19 14 21 Injury to occupant . . . . . . . . . . . . . . . . . 53 - - 1 - - - 4 1 6 1 19 2 11 1 5 - 1 1 - - - - Other motor vehicle accidents . . . . . . . . 75 - 1 1 - - - 3 - 10 5 14 4 6 1 2 5 5 4 2 4 4 4Pedal cyclist injured in transport accidents 23 - - 1 - 2 - - - 3 1 3 2 1 - 4 - 4 - 1 - 1 - Collision with motor vehicle . . . . . . . .. . 21 - - 1 - 2 - - - 3 1 3 1 1 - 4 - 3 - 1 - 1 - Other pedal cyclist accidents . . . . . . . . . 2 - - - - - - - - - - - 1 - - - - 1 - - - - -Railway (includes subway) . . . . . . . . . . . .. . 14 - - - - - - - - 1 - 3 - - 1 4 - 2 - 2 - 1 -Other land transport accidents . . . . . . . . . . 1 - - - - - - - - - - - - - 1 - - - - - - - -Water transport accidents . . . . . . . . . . . . . . 0 - - - - - - - - - - - - - - - - - - - - - -Air and space transport accidents . . . . . . . . 0 - - - - - - - - - - - - - - - - - - - - - -Other transport accidents or sequelae. . . . . . 14 - - - - - - - - 2 1 - - 1 - 5 1 2 - 1 1 - -Fall . . . . . . . . . . . . . . . . . . . . . . . . . . . . . . . 388 2 - 1 1 - - 3 1 5 - 14 2 16 3 31 8 34 11 35 12 92 117Firearm discharge . . . . . . . . . . . . . . . . . . . . 0 - - - - - - - - - - - - - - - - - - - - - -Drowning and submersion . . . . . . . . . . . . . 8 1 - 1 - - 1 1 1 1 - - - - - - 1 - - - - - 1Smoke, fire, and flames . . . . . . . . . . . . . . . . 75 1 2 3 1 3 1 - - 3 - 3 2 5 1 4 3 8 6 8 5 6 10Poisoning by noxious substances . . . . . . . . . 667 - - - - - - 15 2 22 5 86 18 121 39 157 72 81 24 13 6 4 2 Poisoning by psychoactive substances* . . 607 - - - - - - 12 2 16 5 79 18 114 36 139 69 73 22 13 5 2 2 Poisoning by other noxious substances . . 60 - - - - - - 3 - 6 - 7 - 7 3 18 3 8 2 - 1 2 -Exposure to excessive natural heat . . . . . . . 10 - - - - - - - - - - - 1 - - - - 1 1 - 2 3 2Exposure to excessive natural cold . . . . . . . 11 - - - - - - - - - - 1 - 1 - 2 - 2 - 3 2 - -Other nontransport accidents . . . . . . . . . . . 141 18 7 1 - 1 1 2 - 5 1 12 2 10 3 22 2 13 10 7 - 3 21
*See Technical Notes: Drug Related Deaths.
Table 15. Intentional Self-harm (Suicide)
0-4 5-9 10-14 15-19 20-24 25-34 35-44 45-54 55-64 65-74 75+Method All Ages Male Female Male Female Male Female Male Female Male Female Male Female Male Female Male Female Male Female Male Female Male Female
Total . . . . . . . . . . . . . . . . . . . . . . . . . . . . . . 473 - - - - - 2 12 4 23 4 57 28 65 28 84 23 48 13 40 13 19 10Poisoning by noxious substances . . . . . . . . . 80 - - - - - - - 1 2 - 9 3 6 10 22 6 8 2 6 3 1 1Hanging, strangulation, and suffocation . . . . 157 - - - - - 2 4 2 6 2 15 13 21 8 23 9 13 7 15 3 9 5Drowning and submersion . . . . . . . . . . . . . 17 - - - - - - - - 2 - 3 1 3 1 2 1 4 - - - - -Firearm discharge . . . . . . . . . . . . . . . . . . . . 77 - - - - - - 4 - 4 - 13 3 13 1 10 - 11 - 11 1 5 1Sharp or blunt object . . . . . . . . . . . . . . . . . . 16 - - - - - - - - - - - 1 3 1 4 1 3 - - 1 2 -Jumping from high place . . . . . . . . . . . . . . 93 - - - - - - 2 1 9 1 10 6 13 6 15 5 6 4 6 4 2 3Jumping or lying before moving object . . . . 26 - - - - - - 2 - - 1 5 - 4 1 7 1 3 - 1 1 - -Sequelae (Late effects) . . . . . . . . . . . . . . . . . 2 - - - - - - - - - - 1 1 - - - - - - - - - -Other and unspecified means . . . . . . . . . . . 5 - - - - - - - - - - 1 - 2 - 1 - - - 1 - - -
Continued on next page.

26
DEATHS DUE TO EXTERNAL CAUSES BY AGE AND SEX, NEW YORK CITY, 2008 (CONTINUED)
Table 16. Assault (Homicide) and Legal Intervention
0-4 5-9 10-14 15-19 20-24 25-34 35-44 45-54 55-64 65-74 75+Method All Ages Male Female Male Female Male Female Male Female Male Female Male Female Male Female Male Female Male Female Male Female Male Female
Total . . . . . . . . . . . . . . . . . . . . . . . . . . . . . . . . . . 567 9 6 1 1 4 3 55 7 102 5 158 22 86 13 41 12 15 8 9 3 6 1Poisoning by noxious substances . . . . . . . . . . . . 1 - - - 1 - - - - - - - - - - - - - - - - - -Hanging, strangulation, and suffocation . . . . . . . 22 1 - - - - 1 1 - 1 1 4 4 2 1 3 - - 2 - - 1 -Drowning and submersion . . . . . . . . . . . . . . . . . 1 - 1 - - - - - - - - - - - - - - - - - - - -Firearm discharge . . . . . . . . . . . . . . . . . . . . . . . . 304 - - - - 3 - 34 5 66 1 111 6 53 2 11 1 5 1 2 1 2 -Smoke, fire, and flames . . . . . . . . . . . . . . . . . . . . 6 - - - - - - - - 2 - 2 - - - - 1 - - 1 - - -Sharp or blunt object . . . . . . . . . . . . . . . . . . . . . 126 - 1 - - - 1 16 2 25 2 27 11 13 4 10 7 3 3 - - 1 -Pushing from high place . . . . . . . . . . . . . . . . . . . 0 - - - - - - - - - - - - - - - - - - - - - -Bodily force . . . . . . . . . . . . . . . . . . . . . . . . . . . . 1 - - - - - - - - - - - - - 1 - - - - - - - -Neglect, abandonment, & other maltreatment . . . 9 4 4 - - 1 - - - - - - - - - - - - - - - - -Sequelae (Late effects) . . . . . . . . . . . . . . . . . . . . 18 - - 1 - - - - - - - 3 - 5 - 5 - 2 1 - - 1 -Other and unspecified means . . . . . . . . . . . . . . . 70 4 - - - - 1 4 - 3 1 10 1 11 5 11 3 5 1 6 2 1 1
Legal intervention, all* . . . . . . . . . . . . . . . . . . . . 9 - - - - - - - - 5 - 1 - 2 - 1 - - - - - - -
* Eight legal intervention deaths are from firearm discharge and 1 from unspecified means. See Technical Notes: External Causes of Death - Homicide.
Table 17. Events of Undetermined Intent
0-4 5-9 10-14 15-19 20-24 25-34 35-44 45-54 55-64 65-74 75+Method All Ages Male Female Male Female Male Female Male Female Male Female Male Female Male Female Male Female Male Female Male Female Male Female
Total . . . . . . . . . . . . . . . . . . . . . . . . . . . . . . . . . . 192 21 23 - 1 - - 1 - 6 3 18 4 23 7 34 9 16 5 4 5 5 7Poisoning by noxious substances . . . . . . . . . . . . 23 - - - - - - - - - 3 2 2 3 - 5 2 3 2 - 1 - -Hanging, strangulation, and suffocation . . . . . . . 0 - - - - - - - - - - - - - - - - - - - - - -Drowning and submersion . . . . . . . . . . . . . . . . . 14 - - - - - - - - 2 - 4 1 4 - 2 - 1 - - - - -Firearm discharge . . . . . . . . . . . . . . . . . . . . . . . . 1 - - - - - - - - - - - - - - 1 - - - - - - -Smoke, fire, and flames . . . . . . . . . . . . . . . . . . . . 2 - - - - - - - - - - - - 1 - - - 1 - - - - -Falling from high place . . . . . . . . . . . . . . . . . . . . 6 - - - - - - - - 1 - - - 2 - - 1 - - - - 1 1Sequelae (Late effects) . . . . . . . . . . . . . . . . . . . . 3 - - - - - - - - - - - - - - 1 - 1 - - 1 - -Other and unspecified means . . . . . . . . . . . . . . . 143 21 23 - 1 - - 1 - 3 - 12 1 13 7 25 6 10 3 4 3 4 6
Table 18. Complications of Medical and Surgical Care
0-4 5-9 10-14 15-19 20-24 25-34 35-44 45-54 55-64 65-74 75+Method All Ages Male Female Male Female Male Female Male Female Male Female Male Female Male Female Male Female Male Female Male Female Male Female
Complications of medical and surgical care . . . . 59 - - 1 1 - 1 1 - - - 2 - 2 4 3 3 6 3 7 6 6 13
Table 19. Firearms (All Causes)
0-4 5-9 10-14 15-19 20-24 25-34 35-44 45-54 55-64 65-74 75+Method All Ages Male Female Male Female Male Female Male Female Male Female Male Female Male Female Male Female Male Female Male Female Male Female
Firearms (all causes) . . . . . . . . . . . . . . . . . . . . . . 390 - - - - 3 - 38 5 75 1 124 9 68 3 23 1 16 1 13 2 7 1

27
1989
1990
1991
1992
1993
1994
1995
1996
1997
1998
1999
2000
2001
2002
2003
2004
2005
2006
2007
2008
Year
0
500
1000
1500
2000
Num
b er o
f Dea
ths
Colorectal Cancer Diabetes MellitusFigure 11. Number of Deaths from Selected Natural Causes New York City, 1989-2008
Except for diabetes mellitus and some slight increases or leveling in 2008, deaths due to these selected causes have decreased over the past two decades. Colorectal cancer deaths declined by 23.1%, from 1,845 in 1989 to 1,419 in 2008. Breast Cancer – Approximately 1,500 women died annually between 1989 and 1996, followed by an annual decline in the number of these death to 1,095 in 2008. Prostate cancer deaths peaked in 1992 with 991 deaths and then declined to 720 in 2008. Chronic liver disease and cirrhosis deaths had declined steadily, to 453 deaths in 2007 and then increased to 542 in 2008. Diabetes Mellitus - After a surge in the early 1990s, diabetes mellitus deaths remained at around 1,800 deaths per year until 2006 and declined to around 1,600 per year in 2007 and 2008.
Breast Cancer, Female
1989
1990
1991
1992
1993
1994
1995
1996
1997
1998
1999
2000
2001
2002
2003
2004
2005
2006
2007
2008
Year
0
500
1000
1500
2000
2500
Num
b er o
f Dea
ths
Figure 12. Number of Deaths from Selected External Causes New York City, 1989-2008
The number of homicide (assault) deaths has declined more than 75% since 1990, when it peaked at 2,272. The rate of decline has slowed since 1998, and it has dropped from 675 to 558 deaths in 2008. Suicide deaths have decreased approximately 33% over the past two decades from peak of 703 deaths in 1989 to 473 in 2008. Motor vehicle accidents deaths decreased 55%, from 704 in 1990 to 320 in 2008. The surge in non-motor vehicle accidental deaths in 2001 was caused by the Flight 587 air crash. Two-hundred sixty-five deaths from the crash are included in the total 2001 accidental deaths.
The large surge in non-motor-vehicle accident deaths from 2006 to 2007 was a reault of correction in our coding process for deaths due to psychoactive substances. See Special Section: New York City Changes from Manual to Automated Cause-of-Death Coding in 2007 Summary of Vital Statistics.
All reported WTC disaster deaths are homicides and not included in this graph for the year 2001. See Special Sections in the 2002 and 2005 Summary of Vital Statistics and Technical Notes for detailed information on WTC disaster deaths.
Chronic Liver Disease & Cirrhosis
Homicide
Suicide
Accidents Excluding Motor Vehicle
Motor Vehicle Accidents
Prostate Cancer

28
Table 20. Deaths from HIV Disease by Sex, Age, and Ethnic Group*,
ALLAGE GROUP/ETHNIC GROUP 1983-1998 1999 2000 2001 2002** 2003 2004 2005 2006 2007 2008 1983-1998 1999 2000
ALL AGES Total . . . . . . . . . . . . . . . . . 62,439 2,020 1,961 1,774 1,713 1,656 1,451 1,419 1,209 1,115 1,073 48,887 1,372 1,333Puerto Rican . . . . . . . . . . . 11,461 404 413 369 359 323 300 289 220 224 217 8,568 265 285Other Hispanic . . . . . . . . . 5,647 137 166 121 144 167 113 129 111 103 118 4,697 98 123Asian & Pacific Islander . . 408 13 13 8 14 8 6 7 10 5 10 364 11 11Non-Hispanic White . . . . . 16,833 341 303 298 274 245 192 196 178 143 129 14,883 247 236Non-Hispanic Black . . . . . 24,702 1,032 1,008 911 872 846 793 769 660 625 583 17,648 674 629Other or Unknown . . . . . . 3,388 93 58 67 50 67 47 29 30 15 16 2,727 77 49
UNDER 1 Total . . . . . . . . . . . . . . . . . 307 1 3 1 1 1 – – – – – 155 1 1Puerto Rican . . . . . . . . . . . 42 – – – – – – – – – – 24 – –Other Hispanic . . . . . . . . . 28 – – 1 1 – – – – – – 15 – –Asian & Pacific Islander . . 1 – – – – – – – – – – 1 – –Non-Hispanic White . . . . . 48 – – – – – – – – – – 31 – –
` Non-Hispanic Black . . . . . 169 1 3 – – 1 – – – – – 76 1 1Other or Unknown . . . . . . 19 – – – – – – – – – – 8 – –
1-14 Total . . . . . . . . . . . . . . . . . 906 18 7 6 5 9 6 4 1 2 – 463 10 3Puerto Rican . . . . . . . . . . . 166 – 1 – – – 1 2 – – – 88 – –Other Hispanic . . . . . . . . . 94 3 – – 2 1 1 1 1 1 – 50 2 –Asian & Pacific Islander . . 6 – – – – – – – – – – 3 – –Non-Hispanic White . . . . . 146 4 2 1 – 1 – – – 1 – 77 2 2Non-Hispanic Black . . . . . 449 11 3 5 3 7 4 1 – – – 226 6 1Other or Unknown . . . . . . 45 – 1 – – – – – – – – 19 – –
15-24 Total . . . . . . . . . . . . . . . . . 956 21 22 24 20 18 15 22 22 19 17 591 7 8Puerto Rican . . . . . . . . . . . 219 2 2 3 6 1 2 4 1 7 3 129 – 1Other Hispanic . . . . . . . . . 112 1 2 2 3 4 – 2 5 4 – 82 – –Asian & Pacific Islander . . 6 – – – – 1 – – – – – 4 – –Non-Hispanic White . . . . . 150 1 1 1 2 – 1 1 1 – 1 102 – –Non-Hispanic Black . . . . . 405 17 17 18 9 12 11 15 13 8 13 237 7 7Other or Unknown . . . . . . 64 – – – – – 1 – 2 – – 37 – –
25-34 Total . . . . . . . . . . . . . . . . . 15,922 252 233 194 140 123 90 92 63 52 77 11,647 151 133Puerto Rican . . . . . . . . . . . 3,321 56 55 31 24 20 12 12 4 8 8 2,352 34 30Other Hispanic . . . . . . . . . 1,680 23 29 20 15 15 8 12 6 4 11 1,343 15 23Asian & Pacific Islander . . 86 2 1 1 1 – 1 – – 1 – 74 1 –Non-Hispanic White . . . . . 3,942 32 21 17 13 10 12 7 9 3 6 3,306 20 13Non-Hispanic Black . . . . . 6,029 132 120 117 83 75 56 59 44 35 52 3,917 76 62Other or Unknown . . . . . . 864 7 7 8 4 3 1 2 – 1 – 655 5 5
35-44 Total . . . . . . . . . . . . . . . . . 27,122 767 695 638 624 568 467 407 343 311 246 21,465 489 456Puerto Rican . . . . . . . . . . . 4,826 167 152 142 131 114 101 71 65 64 57 3,697 103 103Other Hispanic . . . . . . . . . 2,262 58 60 40 62 60 33 48 41 27 37 1,914 42 40Asian & Pacific Islander . . 166 3 6 4 4 3 2 3 4 2 3 155 3 6Non-Hispanic White . . . . . 7,569 152 121 118 101 85 71 45 45 46 34 6,724 104 95Non-Hispanic Black . . . . . 10,853 353 339 309 312 281 250 224 182 168 113 7,809 209 198Other or Unknown . . . . . . 1,446 34 17 25 14 25 10 16 6 4 2 1,166 28 14
45-54 Total . . . . . . . . . . . . . . . . . 12,397 669 706 629 641 640 594 586 502 448 425 10,462 474 499Puerto Rican . . . . . . . . . . . 2,186 133 140 133 125 127 127 140 99 84 89 1,732 88 102Other Hispanic . . . . . . . . . 1,012 29 55 32 41 58 45 49 40 43 46 892 22 44Asian & Pacific Islander . . 98 2 3 1 6 4 2 3 3 – 5 91 2 3Non-Hispanic White . . . . . 3,542 111 117 109 116 103 73 93 76 61 45 3,312 82 94Non-Hispanic Black . . . . . 4,869 357 367 329 327 322 322 294 272 256 231 3,823 250 234Other or Unknown . . . . . . 690 37 24 25 26 26 25 7 12 4 9 612 30 22
55 & OVER Total . . . . . . . . . . . . . . . . . 4,829 292 295 282 282 296 279 308 278 283 308 4,104 240 233Puerto Rican . . . . . . . . . . . 701 46 63 60 73 61 57 60 51 61 60 546 40 49Other Hispanic . . . . . . . . . 459 23 20 26 20 29 26 17 18 24 24 401 17 16Asian & Pacific Islander . . 45 6 3 2 3 – 1 1 3 2 2 36 5 2Non-Hispanic White . . . . . 1,436 41 41 52 42 46 35 50 47 32 43 1,331 39 32Non-Hispanic Black . . . . . 1,928 161 159 133 138 148 150 176 149 158 174 1,560 125 126Other or Unknown . . . . . . 260 15 9 9 6 12 10 4 10 6 5 230 14 8
Note: In 1983-1986, only AIDS was recognized as a cause of death and coded 279.1; from 1987 through 1998, AIDS as a cause of death was coded 042 and other HIV infectionsas a cause of death were coded 043-044. Under ICD-10, beginning in 1999, HIV disease as a cause of death is coded B20-B24. In 1982, 30 deaths were attributed to AIDS.Tables showing deaths due to AIDS alone for 1983-1996 can be found in the Vital Statistics Summaries for 1987-1996.* Multiple race categories were introduced in January 2003 when New York City implemented a new death certificate form. Beginning in 2003, multiple races are included in "Other or Unknown" category in this table. See Technical Notes: Multiple Race.**An HIV disease death was miscoded as a maternal cause in 2002. As a result of the correction, HIV disease deaths are increased by 1 in this table for the year of 2002.

29
New York City, 1983-2008
MALE FEMALE2001 2002 2003 2004 2005 2006 2007 2008 1983-1998 1999 2000 2001 2002** 2003 2004 2005 2006 2007 2008
1,166 1,138 1,100 943 949 818 711 702 13,552 648 628 608 575 556 508 470 391 404 371240 239 213 204 206 163 142 138 2,893 139 128 129 120 110 96 83 57 82 7995 104 113 79 100 78 76 84 950 39 43 26 40 54 34 29 33 27 347 11 8 5 6 8 3 7 44 2 2 1 3 – 1 1 2 2 3
219 207 181 146 143 139 103 104 1,950 94 67 79 67 64 46 53 39 40 25552 538 536 481 475 407 377 356 7,054 358 379 359 334 310 312 294 253 248 22753 39 49 28 19 23 10 13 661 16 9 14 11 18 19 10 7 5 31 – – – – – – – 152 – 2 – 1 1 – – – – –
– – – – – – – – 18 – – – – – – – – – –1 – – – – – – – 13 – – – 1 – – – – – –
– – – – – – – – 0 – – – – – – – – – – – – – – – – – – 17 – – – – – – – – – – – – – – – – – – 93 – 2 – – 1 – – – – – – – – – – – – – 11 – – – – – – – – – –
2 3 3 4 2 – 1 – 443 8 4 4 2 6 2 2 1 1 – – – – – 1 – – – 78 – 1 – – – 1 1 – – – – 2 – – – – – – 44 1 – – – 1 1 1 1 1 – – – – – – – – – 3 – – – – – – – – – –
1 – 1 – – – 1 – 69 2 – – – – – – – – –1 1 2 4 1 – – – 223 5 2 4 2 5 – – – – –
– – – – – – – – 26 – 1 – – – – – – – –9 11 7 8 14 12 9 7 365 14 14 15 9 11 7 8 10 10 10
– 3 1 1 4 1 3 – 90 2 1 3 3 – 1 – – 4 31 2 2 – 2 3 4 – 30 1 2 1 1 2 – – 2 – –
– – 1 – – – – – 2 – – – – – – – – – – – 2 – 1 1 – – 1 48 1 1 1 – – – – 1 – –
8 4 3 5 7 7 2 6 168 10 10 10 5 9 6 8 6 6 7 – – – 1 – 1 – – 27 – – – – – – – 1 – –
102 72 76 45 59 41 32 48 4,275 101 100 92 68 47 45 33 22 20 2915 10 12 5 6 2 3 5 969 22 25 16 14 8 7 6 2 5 317 10 12 6 9 4 4 10 337 8 6 3 5 3 2 3 2 – 11 1 – 1 – – – – 12 1 1 – – – – – – 1 –8 8 8 9 5 6 2 4 636 12 8 9 5 2 3 2 3 1 2
58 41 43 23 38 29 22 29 2,112 56 58 59 42 32 33 21 15 13 233 2 1 1 1 – 1 – 209 2 2 5 2 2 – 1 – – –
387 383 330 280 241 211 177 144 5,657 278 239 251 241 238 187 166 132 134 10284 83 65 65 46 47 41 30 1,129 64 49 58 48 49 36 25 18 23 2727 41 32 23 32 28 17 23 348 16 20 13 21 28 10 16 13 10 144 3 3 1 3 3 1 3 11 – – – 1 – 1 – 1 1 –
80 67 55 53 31 28 32 22 845 48 26 38 34 30 18 14 17 14 12171 179 156 134 120 100 83 65 3,044 144 141 138 133 125 116 104 82 85 4821 10 19 4 9 5 3 1 280 6 3 4 4 6 6 7 1 1 1
443 455 451 395 400 342 289 275 1,935 195 207 186 186 189 199 186 160 159 15098 86 91 91 101 74 58 56 454 45 38 35 39 36 36 39 25 26 3327 32 45 31 43 29 32 33 120 7 11 5 9 13 14 6 11 11 13 – 6 4 2 2 2 – 3 7 – – 1 – – – 1 1 – 286 93 77 53 69 65 40 37 230 29 23 23 23 26 20 24 11 21 8
211 215 216 203 180 164 156 139 1,046 107 133 118 112 106 119 114 108 100 9221 23 18 15 5 8 3 7 78 7 2 4 3 8 10 2 4 1 2
222 214 232 211 233 212 203 228 725 52 62 60 68 64 68 75 66 80 8043 57 44 42 48 39 37 47 155 6 14 17 16 17 15 12 12 24 1322 17 22 19 14 14 19 18 58 6 4 4 3 7 7 3 4 5 62 1 – 1 1 3 2 1 9 1 1 – 2 – – – – – 1
44 37 40 30 37 40 28 40 105 2 9 8 5 6 5 13 7 4 3103 98 116 112 129 107 114 117 368 36 33 30 40 32 38 47 42 44 57
8 4 10 7 4 9 3 5 30 1 1 1 2 2 3 – 1 3 –

30
1989
1990
1991
1992
1993
1994
1995
1996
1997
1998
1999
2000
2001
2002
2003
2004
2005
2006
2007
2008
Year
0.0
10.0
20.0
30.0
40.0
50.0
60.0
70.0
80.0
Mea
n A
ge a
t Dea
th
1983
1984
1985
1986
1987
1988
1989
1990
1991
1992
1993
1994
1995
1996
1997
1998
1999
2000
2001
2002
2003
2004
2005
2006
2007
2008
Year
0
500
1000
1500
2000
2500
Num
b er o
f Dea
ths
Hispanic males
Non-Hispanic White males
Non-Hispanic Black males
Hispanic females
Non-Hispanic White females
Non-Hispanic Black females
Figure 14. Mean Age at Death, All Deaths and HIV Disease Deaths by Sex
New York City, 1989-2008
Figure 13. Deaths Due to HIV Disease by Sex and Selected Ethnic Group New York City, 1983-2008
The number of deaths due to HIV disease decreased 3.8%, from 1,115 in 2007 to 1,073 in 2008. This is lower than the 1985 level for AIDS alone at 1,663. AIDS deaths peaked at 7,102 in 1994. The number of HIV disease deaths declined for both males and females from 2007 to 2008. The biggest decline was among Non-Hispanic white females, from 40 to 25, a 37.5% drop. The decline was also seen among Non-Hispanic black females, from 248 to 227, a 8.5% decrease. Non-Hispanic black males experienced a 5.6% decrease, from 377 to 356. HIV disease deaths increased slightly for other ethnic groups from 2007 to 2008.
See Comparability Ratio in Technical Notes for information about the effect of ICD9/ICD10 coding changes.
The mean age at death for men who died of HIV disease was 49.9 in 2008, an increase of 10.5 years from 1989. The mean age at death for women increased 13 years from 1989 to 2008. Both men and women are living longer with HIV and dying at older ages, in part due to the natural aging of the epidemic and in part due to improved survival resulting from the widespread use of highly active antiretroviral therapy. Although the increase in the mean age at death over the past 20 years was steeper for women who died of HIV disease, they lived 2.5 fewer years than their male counterparts in 2008. Among those who died of HIV disease, men lived an average of 17.7 fewer years and women lived an average of 28.2 fewer years compared with overall deaths in New York City in 2008.
All deaths, male
All deaths, female
HIV deaths, female
HIV deaths, male

31
Table 21. Deaths and Death Rates per 100,000 Population for Selected Causes by Ethnic Group, Sex, and Age, New York City, 2008
Ethnic Group* Sex Age in YearsNon-Hispanic Non-Hispanic Asian and Other or
Total Hispanic White Black Pacific Islander Unknown Male Female Under 20 65 or Over
Cause of Death No.Age-Adj.
Rate No.Age-Adj.
Rate No.Age-Adj.
Rate No.Age-Adj.
Rate No.Age-Adj.
Rate No. No.Age-Adj.
Rate No.Age-Adj.
Rate No.CrudeRate No.
CrudeRate
All Causes. . . . . . . . . . . . . . . . . . . . . . . . . . . . . . . . . . . . . . . 54,193 6.1 9,329 5.3 27,131 6.2 14,006 7.5 2,971 3.7 756 26,342 7.4 27,851 5.2 1,157 0.5 37,862 36.5Natural Causes. . . . . . . . . . . . . . . . . . . . . . . . . . . . . . . . . . . 51,249 580.2 8,616 500.0 25,981 588.6 13,177 709.4 2,784 349.0 691 24,229 686.5 27,020 500.9 907 42.3 37,258 3589.8 Cancer of Stomach. . . . . . . . . . . . . . . . . . . . . . . . . . . . . . 464 5.3 104 5.9 176 4.2 117 6.4 63 7.5 4 279 7.8 185 3.6 – – 303 29.2 Cancer of Colon, Rectum, and Anus. . . . . . . . . . . . . . . . . 1,419 16.4 242 14.1 705 17.0 356 19.1 100 11.6 16 713 20.2 706 13.7 – – 969 93.4 Cancer of Trachea, Bronchus, and Lung, Male. . . . . . . . . 1,593 45.2 225 31.8 866 51.2 338 48.2 141 36.8 23 1,593 45.2 N.A. N.A. 2 – 1,072 262.1 Cancer of Trachea, Bronchus, and Lung, Female. . . . . . . . 1,315 26.5 152 15.0 764 34.0 321 27.8 71 16.0 7 N.A. N.A. 1,315 26.5 – – 942 149.8 Cancer of Breast, Female. . . . . . . . . . . . . . . . . . . . . . . . . . 1,095 21.9 169 15.8 547 24.6 325 27.9 43 8.8 11 N.A. N.A. 1,095 21.9 – – 604 96.0 Cancer of Cervix Uteri . . . . . . . . . . . . . . . . . . . . . . . . . . . 138 2.8 31 2.8 36 1.7 58 4.9 13 2.5 – N.A. N.A. 138 2.8 – – 55 8.7 Cancer of Ovary . . . . . . . . . . . . . . . . . . . . . . . . . . . . . . . . 354 7.2 52 5.0 199 9.2 76 6.5 24 4.7 3 N.A. N.A. 354 7.2 – – 200 31.8 Cancer of Prostate . . . . . . . . . . . . . . . . . . . . . . . . . . . . . . 720 21.6 111 19.3 323 18.1 259 42.9 16 4.6 11 720 21.6 N.A. N.A. – – 644 157.5 Cancer of Pancreas . . . . . . . . . . . . . . . . . . . . . . . . . . . . . . 950 11.0 137 8.0 537 13.0 209 11.3 52 6.1 15 432 12.1 518 10.0 – – 683 65.8 Leukemia . . . . . . . . . . . . . . . . . . . . . . . . . . . . . . . . . . . . . 532 6.2 86 4.5 326 8.7 87 4.7 27 2.7 6 282 7.8 250 5.1 26 1.2 311 30.0 Hypertensive Heart Disease . . . . . . . . . . . . . . . . . . . . . . . 1,704 19.2 292 16.7 673 15.1 643 34.3 77 9.5 19 810 22.3 894 16.6 – – 1,139 109.7 Chronic Ischemic Heart Disease . . . . . . . . . . . . . . . . . . . . 15,475 171.4 1,849 115.1 9,579 199.3 3,126 172.5 724 96.0 197 6,998 205.0 8,477 146.6 – – 13,427 1293.7 Acute Myocardial Infarction . . . . . . . . . . . . . . . . . . . . . . . 2,609 29.2 409 25.4 1,387 29.4 642 35.3 130 17.2 41 1,156 33.4 1,453 25.7 – – 2,179 209.9 Essential Hypertension & Hypertensive Renal Disease . . . 889 10.0 174 10.6 316 7.0 326 17.7 63 8.3 10 404 11.6 485 8.9 1 – 684 65.9 Parkinson's Disease . . . . . . . . . . . . . . . . . . . . . . . . . . . . . 158 1.8 32 2.1 98 2.1 16 0.9 10 1.4 2 94 2.9 64 1.2 – – 154 14.8 Alzheimer's Disease . . . . . . . . . . . . . . . . . . . . . . . . . . . . . 374 4.0 76 5.1 209 4.0 78 4.4 7 1.0 4 93 2.8 281 4.6 – – 366 35.3 Mental & Behavior Disorders Due to Use of Alcohol . . . . 210 2.4 53 2.4 94 2.7 51 2.5 6 0.6 6 174 4.2 36 0.8 – – 31 3.0 Alcoholic Liver Disease . . . . . . . . . . . . . . . . . . . . . . . . . . 377 4.3 152 7.3 136 3.9 72 3.6 10 1.0 7 280 7.0 97 2.0 – – 71 6.8 Asthma . . . . . . . . . . . . . . . . . . . . . . . . . . . . . . . . . . . . . . 149 1.7 63 3.2 22 0.6 58 2.8 6 0.8 – 65 1.6 84 1.8 17 0.8 44 4.2External Causes. . . . . . . . . . . . . . . . . . . . . . . . . . . . . . . . . . . 2,944 34.3 713 32.3 1,150 34.0 829 42.1 187 19.8 65 2,113 52.8 831 17.6 250 11.7 604 58.2 Motor Vehicle Accidents. . . . . . . . . . . . . . . . . . . . . . . . . . 320 3.8 74 3.5 136 4.2 72 3.7 33 3.5 5 209 5.3 111 2.4 25 1.2 89 8.6 Accidental Falls . . . . . . . . . . . . . . . . . . . . . . . . . . . . . . . . 388 4.4 79 4.4 214 5.0 49 2.5 39 4.8 7 233 6.4 155 2.8 8 0.4 256 24.7 Other Accidents, Excluding Accidental Poisoning. . . . . . . 336 3.9 101 4.5 115 3.4 95 4.8 21 1.9 6 231 5.8 105 2.2 49 2.3 81 7.8
* Multiple races were introduced in January 2003 when New York City implemented a new death certificate form. See Technical Notes: Multiple Race.
** In 2002 and earlier years, deaths from legal interventions were included in Homicide. Since then, they are excluded from this table and are listed as a separate cause of death in Tables 4 and 16.
For all causes rates are per 1,000 population and all other selected causes rates are per 100,000 population. See Population in Technical Notes for information about population estimates. N.A.: Not applicable.

32
Table 22. Life Expectancy at Specified Ages by Sex and Ethnic Group, New York City, 1989-1991 and 1999-2001*
AllExact age 1989-1991 1999-2001**in Years Total Hispanic Non-Hispanic White Non-Hispanic Black Total Hispanic Non-Hispanic White Non-Hispanic Black
0 72.4 76.3 74.0 66.4 77.6 79.7 77.7 73.2 1 72.4 75.8 74.0 66.7 77.1 79.0 77.3 73.0 5 68.5 72.0 70.2 62.9 73.2 75.0 73.4 59.0
10 63.6 67.1 65.2 58.0 65.2 70.0 68.5 64.215 58.7 62.1 60.3 53.1 63.3 65.1 63.6 59.320 54.0 57.4 55.5 48.6 58.4 60.2 58.7 54.525 49.4 52.9 50.7 44.2 53.6 55.4 53.9 49.930 44.9 48.6 46.0 40.0 48.8 50.5 49.0 45.235 40.7 44.6 41.5 36.1 44.1 45.8 44.3 40.740 36.6 40.7 37.2 32.7 39.5 41.2 39.6 36.345 32.6 36.8 33.0 29.1 35.0 36.7 35.1 32.150 28.5 32.8 28.8 25.4 30.7 32.4 30.7 28.255 24.6 28.9 24.7 22.0 26.6 28.2 26.5 24.460 20.9 25.0 20.9 18.7 22.6 24.1 22.4 20.865 17.4 21.3 17.3 15.7 18.8 20.2 18.6 17.570 14.1 17.8 13.9 13.0 15.3 16.7 15.1 14.575 11.1 14.6 10.9 10.5 12.1 13.3 11.8 11.380 8.4 11.4 8.2 8.2 9.2 10.4 8.9 9.385 6.1 8.6 5.9 6.2 6.7 7.7 6.4 7.1
MaleExact age 1989-1991 1999-2001**in Years Total Hispanic Non-Hispanic White Non-Hispanic Black Total Hispanic Non-Hispanic White Non-Hispanic Black
0 67.7 70.5 70.0 60.0 74.5 76.1 74.9 69.1 1 67.6 70.0 70.1 60.3 74.0 75.4 74.5 69.0 5 63.8 66.2 66.2 56.5 70.1 71.4 70.6 65.1
10 58.8 61.2 61.3 51.6 65.2 66.5 65.7 60.215 53.9 56.3 56.4 46.7 60.2 61.5 60.8 55.320 49.4 51.7 51.6 42.4 55.4 56.6 55.9 50.625 45.0 47.4 46.9 38.3 50.7 51.9 51.2 46.130 40.7 43.4 42.3 34.4 46.0 47.1 46.4 41.635 36.7 39.8 38.1 30.9 41.3 42.5 41.7 37.240 33.1 36.5 34.1 28.0 36.8 37.9 37.1 32.945 29.4 33.2 30.1 25.0 32.4 33.6 32.7 28.850 25.7 29.6 26.2 21.8 28.3 29.5 28.5 25.255 22.1 26.1 22.3 18.8 24.4 25.6 24.4 21.860 18.6 22.5 18.7 15.9 20.6 21.8 20.5 18.465 15.4 19.1 15.3 13.2 17.0 18.2 16.9 15.370 12.4 16.1 12.2 10.9 13.8 14.9 13.6 12.675 9.7 13.2 9.5 8.8 10.8 12.0 10.6 10.280 7.3 10.5 7.1 7.0 8.2 9.4 7.9 8.285 5.5 8.2 5.2 5.4 6.1 7.3 5.7 6.6
FemaleExact age 1989-1991 1999-2001**in Years Total Hispanic Non-Hispanic White Non-Hispanic Black Total Hispanic Non-Hispanic White Non-Hispanic Black
0 77.0 81.7 77.9 72.2 80.2 82.6 80.4 76.5 1 76.9 81.2 77.9 72.5 79.7 81.9 79.9 76.2 5 73.1 77.4 74.0 68.7 75.8 77.9 76.0 72.3
10 68.1 72.4 69.1 63.9 70.8 72.9 71.1 67.415 63.2 67.5 64.1 58.9 65.9 68.0 66.1 62.420 58.3 62.6 59.2 54.1 61.0 63.0 61.2 57.525 53.5 57.9 54.3 49.4 56.1 58.1 56.4 52.730 48.8 53.2 49.5 44.8 51.2 53.2 51.4 47.935 44.2 48.7 44.8 40.6 46.4 48.4 46.6 43.340 39.8 44.2 40.1 36.5 41.7 43.7 41.8 38.845 35.3 39.6 35.5 32.4 37.1 39.1 37.2 34.450 30.9 35.2 31.0 28.3 32.6 34.5 32.6 30.355 26.6 30.9 26.6 24.3 28.3 30.0 28.2 26.360 22.6 26.6 22.6 20.6 24.1 25.7 23.9 22.465 18.8 22.6 18.7 17.3 20.1 21.5 19.9 18.870 15.2 18.8 15.1 14.2 16.4 17.7 16.1 15.575 12.0 15.3 11.8 11.4 12.9 14.1 12.6 12.580 9.0 11.9 8.7 8.8 9.7 10.8 9.4 9.885 6.4 8.8 6.2 6.5 7.0 7.9 6.7 7.3
Note: Table 22 presents decennial life tables and three-year (1999-2001) death data are used to estimate life expectancy to smooth the outcome. Life expectancy figures for 1989-1991 are calculated using same methodology as 1999-2001. See Technical Notes: Life Expectancy. * Census population data for 1990 and 2000 are used to calculate 1989-1991 and 1999-2001 life expectancy, respectively. See Technical Notes: Population.
** World Trade Center (WTC) disaster deaths are not included. See Special Section in 2002 Summary of Vital Statistics, Table WTC10 for the impact of WTC deaths on life expectancy in New York City.

33
Table 23. Life Expectancy at Specified Ages by Sex, New York City, 1999-2007*
TotalExact age in years 1999 2000 2001** 2002 2003 2004 2005 2006 2007
0 77.2 77.7 77.8 78.0 78.2 78.6 78.7 79.0 79.41 76.7 77.2 77.2 77.4 77.6 78.1 78.1 78.5 78.85 72.8 73.2 73.3 73.5 73.7 74.1 74.2 74.5 74.9
10 67.9 68.3 68.4 68.6 68.7 69.2 69.2 69.6 69.915 62.9 63.3 63.4 63.6 63.8 64.2 64.3 64.6 64.920 58.1 58.5 58.6 58.7 58.9 59.4 59.4 59.7 60.125 53.3 53.7 53.8 53.9 54.1 54.6 54.6 54.9 55.230 48.5 48.9 49.0 49.1 49.3 49.7 49.8 50.1 50.435 43.8 44.2 44.2 44.3 44.5 44.9 45.0 45.3 45.640 39.2 39.5 39.6 39.7 39.9 40.2 40.2 40.6 40.845 34.7 35.1 35.2 35.2 35.4 35.7 35.7 36.0 36.250 30.4 30.8 30.9 30.9 31.1 31.3 31.3 31.6 31.855 26.3 26.6 26.8 26.8 26.9 27.2 27.2 27.4 27.660 22.3 22.6 22.8 22.8 23.0 23.3 23.3 23.6 23.765 18.5 18.8 19.0 19.1 19.2 19.4 19.5 19.8 20.070 15.1 15.4 15.5 15.5 15.6 15.8 15.9 16.1 16.375 11.9 12.1 12.2 12.2 12.3 12.3 12.4 12.6 12.880 9.1 9.3 9.2 9.2 9.3 9.3 9.3 9.4 9.585 6.7 6.8 6.7 6.7 6.8 6.9 6.8 6.8 6.9
MaleExact age in years 1999 2000 2001** 2002 2003 2004 2005 2006 2007
0 74.1 74.5 74.8 74.9 75.1 75.7 75.7 75.9 76.31 73.7 74.0 74.2 74.4 74.6 75.2 75.1 75.4 75.75 69.8 70.1 70.3 70.5 70.7 71.2 71.2 71.5 71.8
10 64.8 65.1 65.4 65.5 65.7 66.3 66.3 66.5 66.815 59.9 60.2 60.4 60.6 60.8 61.4 61.3 61.5 61.920 55.1 55.4 55.6 55.7 56.0 56.5 56.5 56.7 57.025 50.4 50.7 50.9 51.0 51.2 51.8 51.8 52.0 52.330 45.7 46.0 46.2 46.3 46.5 47.0 47.0 47.3 47.535 41.0 41.3 41.5 41.6 41.8 42.3 42.3 42.5 42.740 36.5 36.8 37.0 37.0 37.2 37.6 37.6 37.8 38.045 32.2 32.4 32.6 32.6 32.8 33.1 33.1 33.3 33.550 28.1 28.3 28.5 28.5 28.6 28.9 28.9 29.1 29.255 24.1 24.4 24.6 24.5 24.7 25.0 25.0 25.1 25.260 20.3 20.6 20.8 20.8 20.9 21.3 21.3 21.5 21.565 16.7 17.0 17.2 17.2 17.4 17.7 17.7 17.9 18.070 13.5 13.8 13.9 13.9 14.0 14.3 14.3 14.5 14.675 10.7 10.8 10.9 11.0 10.9 11.0 11.1 11.2 11.280 8.1 8.3 8.3 8.3 8.3 8.3 8.2 8.3 8.285 6.0 6.1 6.1 6.2 6.2 6.2 6.1 5.9 6.0
FemaleExact age in years 1999 2000 2001** 2002 2003 2004 2005 2006 2007
0 79.9 80.4 80.4 80.6 80.7 81.1 81.3 81.7 82.01 79.4 79.9 79.8 80.1 80.2 80.5 80.6 81.1 81.45 75.5 76.0 75.9 76.1 76.3 76.5 76.7 77.1 77.4
10 70.5 71.0 70.9 71.2 71.3 71.6 71.7 72.2 72.515 65.6 66.0 66.0 66.2 66.4 66.6 66.8 67.2 67.520 60.7 61.1 61.1 61.3 61.5 61.7 61.9 62.3 62.625 55.8 56.2 56.2 56.4 56.5 56.8 57.0 57.4 57.730 50.9 51.4 51.3 51.5 51.6 51.9 52.1 52.5 52.835 46.1 46.6 46.5 46.7 46.8 47.1 47.2 47.6 47.940 41.4 41.9 41.8 42.0 42.1 42.3 42.4 42.8 43.145 36.8 37.3 37.2 37.4 37.5 37.7 37.8 38.2 38.450 32.3 32.8 32.8 32.9 33.0 33.2 33.3 33.7 33.855 28.0 28.4 28.4 28.6 28.6 28.8 28.9 29.3 29.460 23.8 24.1 24.3 24.4 24.4 24.7 24.8 25.1 25.365 19.8 20.1 20.3 20.4 20.5 20.7 20.7 21.1 21.370 16.1 16.4 16.5 16.6 16.7 16.8 16.9 17.2 17.475 12.7 12.9 12.9 13.0 13.1 13.2 13.2 13.5 13.780 9.7 9.8 9.8 9.7 9.8 9.9 9.8 10.0 10.285 7.0 7.1 7.0 7.0 7.1 7.2 7.2 7.3 7.4
Note: Three-year (1999-2001) death data are used to estimate 2000 life expectancy in Table 22, while single-year death data are used in this Table. Life expectancyfor year 2008 is not presented since national data are required and are not yet available. * Census 2000 population data are used for all years. See Technical Notes: Population.** Calculations exclude World Trade Center disaster deaths.

34
Table 24. Years of Potential Life Lost (YPLL) Before Age 75 by Sex and Selected Causes of Death, New York City, 2008
All Male FemaleCause of Death YPLL % YPLL % YPLL %Total 488,239 100.0 299,719 100.0 188,520 100.0Malignant neoplasms . . . . . . . . . . . . . . . . . . . . . . . . . . . . . 115,625 23.7 57,762 19.3 57,863 30.7 Trachea, bronchus, and lung . . . . . . . . . . . . . . . . . . . . . . 21,273 4.4 12,335 4.1 8,938 4.7 Colon, rectum, and anus . . . . . . . . . . . . . . . . . . . . . . . . . 11,560 2.4 5,995 2.0 5,565 3.0 Breast . . . . . . . . . . . . . . . . . . . . . . . . . . . . . . . . . . . . . . . 12,012 2.5 77 0.0 11,935 6.3 Prostate . . . . . . . . . . . . . . . . . . . . . . . . . . . . . . . . . . . . . . 2,033 0.4 2,033 0.7 - - Cervix uteri . . . . . . . . . . . . . . . . . . . . . . . . . . . . . . . . . . . 1,984 0.4 - - 1,984 1.1Diseases of heart . . . . . . . . . . . . . . . . . . . . . . . . . . . . . . . . . 86,585 17.7 57,262 19.1 29,323 15.6HIV disease . . . . . . . . . . . . . . . . . . . . . . . . . . . . . . . . . . . . . 27,932 5.7 17,658 5.9 10,274 5.4Assault (Homicide) . . . . . . . . . . . . . . . . . . . . . . . . . . . . . . . 24,221 5.0 20,921 7.0 3,300 1.8Accidents except poisoning by psychoactive substance . . . . 23,106 4.7 17,662 5.9 5,444 2.9 Motor vehicle . . . . . . . . . . . . . . . . . . . . . . . . . . . . . . . . . 9,216 1.9 6,803 2.3 2,413 1.3Use of or poisoning by psychoactive substance . . . . . . . . . . 21,970 4.5 16,589 5.5 5,381 2.9Intentional self-harm (Suicide) . . . . . . . . . . . . . . . . . . . . . . . 13,589 2.8 9,924 3.3 3,665 1.9Diabetes mellitus . . . . . . . . . . . . . . . . . . . . . . . . . . . . . . . . 12,203 2.5 7,175 2.4 5,028 2.7Cerebrovascular diseases . . . . . . . . . . . . . . . . . . . . . . . . . . 10,513 2.2 5,907 2.0 4,606 2.4Chronic liver disease and cirrhosis . . . . . . . . . . . . . . . . . . . 9,221 1.9 6,576 2.2 2,645 1.4Influenza and pneumonia . . . . . . . . . . . . . . . . . . . . . . . . . . 8,522 1.7 5,038 1.7 3,484 1.8Chronic lower respiratory diseases . . . . . . . . . . . . . . . . . . . 8,310 1.7 4,357 1.5 3,953 2.1Viral Hepatitis. . . . . . . . . . . . . . . . . . . . . . . . . . . . . . . . . . . 6,111 1.3 4,504 1.5 1,607 0.9Mental and behavioral disorders due to use of alcohol . . . . 4,542 0.9 3,785 1.3 757 0.4All other causes . . . . . . . . . . . . . . . . . . . . . . . . . . . . . . . . . . 115,789 23.7 64,599 21.6 51,190 27.2
See Technical Notes: Years of Potential Life Lost for detailed calculation.

Figure 16. Years of Potential Life Lost (YPLL) Before Age 75 by Sex, Selected Causes New York City, 2008
35
Malignant Neoplasms
Diseases of Heart
HIV Disease
Assault (Homicide)
Accidents Except Poisoning by Substance
Use of or Poisoning by Psychoactive Substance
Intentional Self-harm (Suicide)
Diabetes Mellitus
Cerebrovascular Diseases
Chronic Liver Disease and Cirrhosis
Influenza and Pneumonia
Chronic Lower Respiratory Diseases
Viral Hepatitis
Mental and Behavioral Disorders Due to Alcohol
0 10 20 30 40 50 60
Years in Thousands
Male Female
The overall YPLL before age 75 increased slightly from 486,268 in 2007 to 488,239 in 2008 in New York City.
Malignant neoplasms (cancers) and diseases of the heart, the two leading causes of death, were responsible for approximately 40% of YPLL in NYC. Cancer, the second leading cause of death, was responsible for the greatest number of YPLL, 115,625 in 2008, slightly decreased from 116,880 in 2007; while diseases of the heart, the first leading cause of death, accounted for 86,585 YPLL, almost the same as 2007.
Cancer was responsible for similar numbers of YPLL in men and women. However, compared to women, men lost fewer years from reproductive cancers but more years from cancer of the trachea, bronchus, lung, colon, rectum and anus. The top five causes of cancers account for 42% of cancer YPLL.
For many of the most frequent causes of death, more than twice the number of YPLL were to men than women. Sixty-six percent of the 86,585 YPLL due to diseases of the heart were to men (57,262 YPLL) vs. 34% to women (29,323 YPLL). Sixty-three percent of YPLL to AIDS were to men vs. 37% to women; 76% of YPLL to use of or poisoning by psychoactive substance were to men vs. 24% to women; 86% of YPLL to assault (homicide) were to men vs. 14% to women; 76% of YPLL to accidents except poisoning by psychoactive substance (includes motor vehicle accidents) were to men vs. 24% to women; 73% of YPLL to intentional self-harm (suicide) were to men vs. 27% to women; 71% of YPLL to chronic liver disease and cirrhosis were to men vs. 29% to women; 74% of YPLL to viral hepatitis were to men vs. 26% to women; and 83% of YPLL to mental and behavioral disorders due to use of alcohol were to men vs. 17% to women.
0 15 25 45 65 85
Age
0
1
2
3
4
5
6
7
Cha
n ge
in L
ife E
xpec
tanc
y (Y
ears
), 19
90 a
nd 2
000
NYC MalesUS MalesNYC FemalesUS Females
Figure 15. Changes in Life Expectancy at Selected Ages by Sex, 1990 and 2000 New York City and United States
In contrast to the prior decade, life expectancy for male New York City residents at birth aged 0, 15, and 25 increased substantially between 1990 and 2000. The increases were 6.8, 6.3, and 5.7 years, respectively. Contributing factors include declines in infant mortality, HIV, cardiovascular diseases and homicide deaths. Life expectancy for all United States males at these ages also increased but at lower rates, between 1.9 and 2.3 years. Life expectancy for New York City females also increased more than for all United States females. At selected older ages, New York City male residents also showed greater increases in life expectancy than did males nationwide, although these differences were smaller than for younger ages. Nationwide, females had a small increase in life expectancy at all ages.Note: Calculations exclude World Trade Center disaster deaths.

36
Table 25. Deaths and Crude Death Rates* per 100,000 Population from
ANNUAL 1901- 1906- 1911- 1916- 1921- 1926- 1931- 1936- 1941- 1946- 1949- 1952-
Cause (ICD-10 Codes (1) 1905 1910 1915 1920 1925 1930 1935 1940 1945 1948 1951 1955Infant deaths (under 1 year). . . . . . . . . . . . . . . . . . . . . . . . . . . . 15,611 16,609 14,060 12,004 8,895 7,662 5,521 4,079 3,828 4,298 3,882 4,021 Rate per 1,000 live births. . . . . . . . . . . . . . . . . . . . . . . . . . . 120.8 115.2 100.0 88.2 68.9 61.0 52.0 39.8 30.3 26.8 24.5 24.6Neonatal deaths (under 28 days). . . . . . . . . . . . . . . . . . . . . . . . ** ** 5,143 4,894 4,309 3,892 3,152 2,631 2,764 3,298 2,989 3,032 Rate per 1,000 live births. . . . . . . . . . . . . . . . . . . . . . . . . . . 37.4 36.0 33.0 31.0 29.7 25.7 21.9 20.5 18.9 18.5Early neonatal deaths (under 7 days). . . . . . . . . . . . . . . . . . . . . ** ** ** ** ** ** ** 2,110 2,338 2,845 2,604 2,713 Rate per 1,000 live births. . . . . . . . . . . . . . . . . . . . . . . . . . . 20.5 18.5 17.7 16.4 16.6Fetal deaths 28 weeks gestation & over. . . . . . . . . . . . . . . . . . . ** ** ** ** ** ** ** 2,589 2,709 2,902 2,441 2,310 Ratio per I ,000 live births. . . . . . . . . . . . . . . . . . . . . . . . . . . 25.3 21.4 18.1 15.4 14.1 Perinatal mortality ratio (2) . . . . . . . . . . . . . . . . . . . . . . . . ** ** ** ** ** ** ** 44.7 39.1 35.1 31.3 30.2Pregnancy, childbirth, and the puerperium (O00-O99) . . . . . . . ** ** ** ** ** ** ** ** ** ** ** ** Rate per 100,000 live births. . . . . . . . . . . . . . . . . . . . . . . . .Maternal causes *** (A34, O00-O95, O98-O99) . . . . . . . . . . . 694 745 694 664 689 651 608 372 255 178 115 102 Rate per 100,000 live births. . . . . . . . . . . . . . . . . . . . . . . . . 538.0 517.4 493.7 487.9 528.1 518.4 572.6 363.2 201.6 110.8 72.6 62.3Respiratory tuberculosis (A16). . . . . . . . . . . . . . . . . . . . . . . . . . 8,154 8,832 8,745 7,915 4,937 4,574 4,068 3,680 3,281 2,932 2,173 1,178 Rate. . . . . . . . . . . . . . . . . . . . . . . . . . . . . . . . . . . . . . . . . . . . 215.4 197.5 173.2 144.1 80.0 68.2 57.3 50.0 43.2 37.7 27.4 15.0Other forms of tuberculosis (A17-A19). . . . . . . . . . . . . . . . . . . . ** ** ** ** ** ** ** ** ** 225 174 97 Rate. . . . . . . . . . . . . . . . . . . . . . . . . . . . . . . . . . . . . . . . . . . . 2.9 2.2 1.2Human immunodeficiency virus disease (B20-B24) (3) . . . . . . . ** ** ** ** ** ** ** ** ** ** ** ** Rate . . . . . . . . . . . . . . . . . . . . . . . . . . . . . . . . . . . . . . . . . . . Malignant neoplasms (C00-C97). . . . . . . . . . . . . . . . . . . . . . . . 2,621 3,334 4,256 4,993 6,229 7,637 9,062 11,257 13,169 14,627 15,556 16,553 Rate. . . . . . . . . . . . . . . . . . . . . . . . . . . . . . . . . . . . . . . . . . . . 69.2 74.5 84.3 90.9 100.9 113.9 127.6 152.9 173.3 188.2 196.0 210.6 Trachea, bronchus, and lung, male (C33-C34). . . . . . . . . . . . ** ** ** ** ** ** ** ** ** 828 847 1,021 Rate. . . . . . . . . . . . . . . . . . . . . . . . . . . . . . . . . . . . . . . . . . 21.9 22.2 27.0 Trachea, bronchus, and lung, female (C33-C34). . . . . . . . . . . ** ** ** ** ** ** ** ** ** 220 179 228 Rate. . . . . . . . . . . . . . . . . . . . . . . . . . . . . . . . . . . . . . . . . . 5.5 4.4 5.6 Colon, rectum, and anus (C18-C21). . . . . . . . . . . . . . . . . . . . ** ** ** ** ** ** ** ** ** ** ** ** Rate. . . . . . . . . . . . . . . . . . . . . . . . . . . . . . . . . . . . . . . . . . Breast, female (C50). . . . . . . . . . . . . . . . . . . . . . . . . . . . . . . . ** ** ** ** ** ** ** ** ** 1,429 1,476 1,517 Rate. . . . . . . . . . . . . . . . . . . . . . . . . . . . . . . . . . . . . . . . . . 35.9 36.4 37.3Diabetes mellitus (E10-E14). . . . . . . . . . . . . . . . . . . . . . . . . . . . 520 690 916 1,063 1,284 1,624 2,140 2,787 3,131 3,423 1,583 1,644 Rate. . . . . . . . . . . . . . . . . . . . . . . . . . . . . . . . . . . . . . . . . . . . 13.7 15.4 18.1 19.4 20.8 24.2 30.1 37.9 41.2 44.0 19.9 20.9Major cardiovascular diseases (I00-I78). . . . . . . . . . . . . . . . . . . 5,954 9,148 12,699 14,792 18,114 21,815 23,706 25,711 30,886 32,539 36,206 37,724 Rate. . . . . . . . . . . . . . . . . . . . . . . . . . . . . . . . . . . . . . . . . . . . 157.3 204.5 251.5 269.3 293.3 325.5 333.8 349.2 406.6 418.7 456.3 479.9 Cerebrovascular disease (I60-I69). . . . . . . . . . . . . . . . . . . . . . 2,593 1,790 970 834 719 723 1,333 3,846 3,611 3,710 5,099 5,688 Rate. . . . . . . . . . . . . . . . . . . . . . . . . . . . . . . . . . . . . . . . . . . . 68.4 40.0 19.2 15.2 11.6 10.8 20.2 52.2 47.5 47.7 64.3 72.4Influenza & Pneumonia (J10-J18). . . . . . . . . . . . . . . . . . . . . . . . 10,425 10,985 10,528 17,136 8,935 9,989 8,205 5,337 3,453 3,014 2,469 2,664 Rate. . . . . . . . . . . . . . . . . . . . . . . . . . . . . . . . . . . . . . . . . . . . 275.4 245.6 208.5 312.0 144.7 149.0 115.5 72.5 45.5 38.8 31.2 33.9Other respiratory (J00-J06, J20-J99). . . . . . . . . . . . . . . . . . . . . . . 3,224 2,307 1,458 1,407 689 622 594 536 492 424 450 461 Rate. . . . . . . . . . . . . . . . . . . . . . . . . . . . . . . . . . . . . . . . . . . . 85.2 51.6 38.9 25.6 11.2 9.3 8.4 7.3 6.5 5.5 5.7 5.9Chronic liver disease & cirrhosis (K70, K73-K74). . . . . . . . . . . . 814 1,076 900 500 338 413 584 922 1,052 1,500 1,500 1,440 Rate. . . . . . . . . . . . . . . . . . . . . . . . . . . . . . . . . . . . . . . . . . . . 21.5 24.1 17.8 9.1 5.5 6.2 8.2 12.5 13.8 17.5 19.2 18.3Nephritis,nephrosis,etc. (N00-N07, N17-N19, N25-N27). . . . . 5,752 5,600 5,499 5,676 4,108 3,411 3,608 3,675 3,081 2,574 570 556 Rate. . . . . . . . . . . . . . . . . . . . . . . . . . . . . . . . . . . . . . . . . . . . 151.9 125.2 108.9 103.4 50.9 50.8 50.9 40.6 40.6 33.1 7.2 7.1Use of psychoactive substance (F11-F16, F18-F19). . . . . . . . . . ** ** ** ** ** ** ** ** ** ** ** 81 Rate. . . . . . . . . . . . . . . . . . . . . . . . . . . . . . . . . . . . . . . . . . . . 1.0Accidental drug poisoning (X40-X42, X44) . . . . . . . . . . . . . . . . ** ** ** ** ** ** ** ** ** ** ** ** Rate. . . . . . . . . . . . . . . . . . . . . . . . . . . . . . . . . . . . . . . . . . . . Motor vehicle accidents (6) . . . . . . . . . . . . . . . . . . . . . . . . . . . ** ** 253 658 929 1,175 1,167 920 728 635 600 634 Rate. . . . . . . . . . . . . . . . . . . . . . . . . . . . . . . . . . . . . . . . . . . . 5.0 12.0 15.0 17.5 16.4 12.5 9.6 8.2 7.6 8.1Home accidents. . . . . . . . . . . . . . . . . . . . . . . . . . . . . . . . . . . . . ** ** ** ** ** ** ** 1,546 1,823 1,941 1,699 1,568 Rate. . . . . . . . . . . . . . . . . . . . . . . . . . . . . . . . . . . . . . . . . . . . 21.0 24.0 25.0 21.4 19.9Other accidents (Rest of V01-X59, Y85-Y86). . . . . . . . . . . . . . . 3,521 3,549 3,516 3,426 3,138 3,574 3,205 3,107 3,091 3,255 2,707 2,450 Rate. . . . . . . . . . . . . . . . . . . . . . . . . . . . . . . . . . . . . . . . . . . . 93.0 79.3 69.3 62.4 50.8 53.3 45.1 42.2 40.7 41.9 34.3 31.2Intentional self-harm (Suicide) (X60-X84, Y87.0). . . . . . . . . . . . 761 825 686 742 842 1,163 1,369 1,191 907 930 863 649 Rate. . . . . . . . . . . . . . . . . . . . . . . . . . . . . . . . . . . . . . . . . . . . 20.1 18.4 17.2 13.5 13.6 17.4 19.3 16.2 11.9 12.0 10.9 8.3Assault (Homicide) (X85-Y09, Y87.1). . . . . . . . . . . . . . . . . . . . . 143 247 293 271 334 405 522 351 265 362 318 340 Rate. . . . . . . . . . . . . . . . . . . . . . . . . . . . . . . . . . . . . . . . . . . . 3.8 5.5 5.8 4.9 5.4 6.0 7.4 4.5 3.5 4.7 4.0 4.3Events of undetermined intent (Y10-Y34, Y87.2, Y89.9) . . . . . . ** ** ** ** ** ** ** ** ** ** ** ** Rate. . . . . . . . . . . . . . . . . . . . . . . . . . . . . . . . . . . . . . . . . . . . Alzheimer's disease (G30) . . . . . . . . . . . . . . . . . . . . . . . . . . . . . ** ** ** ** ** ** ** ** ** ** ** ** Rate . . . . . . . . . . . . . . . . . . . . . . . . . . . . . . . . . . . . . . . . . . .Asthma (J45-J46) . . . . . . . . . . . . . . . . . . . . . . . . . . . . . . . . . . . . ** ** ** ** ** ** ** ** ** ** ** ** Rate . . . . . . . . . . . . . . . . . . . . . . . . . . . . . . . . . . . . . . . . . . .
(1) Codes following causes in parenthesis are the International Classification of Diseases, Tenth Revision. (2) Perinatal mortality ratio: see section titled "Rates and Ratios Defined" for definition. (3) AIDS was first reported as a cause of death in 1982. See the Technical Notes: HIV and AIDS Mortality for definition changes in 1987 and 1999 under different ICD revisions.(4) Data for 1982-1985.(5) Rate less than 0.05.(6) Motor vehicle accident codes are listed in Table 4.# World Trade Center (WTC) disaster deaths are not included in 2001. See Special Section on WTC deaths in the 2002 Summary of Vital Statistics for detailed statistics.## Beginning January 2007, causes of death coding was changed. See the 2007 Summary Special Section for detailed description.* Rates for intercensal years are not adjusted for intercensal population changes before 2000. 2001-2006 population data are from U.S. Census Bureau's annual estimates as of Octobe 2007. Population data for 2007 are from U.S Census bureau's anual estimates as of September 2008. See Technical Notes: Population.** Data are not available or not applicable.*** See Technical Notes: Maternal Death and Maternal Mortality.
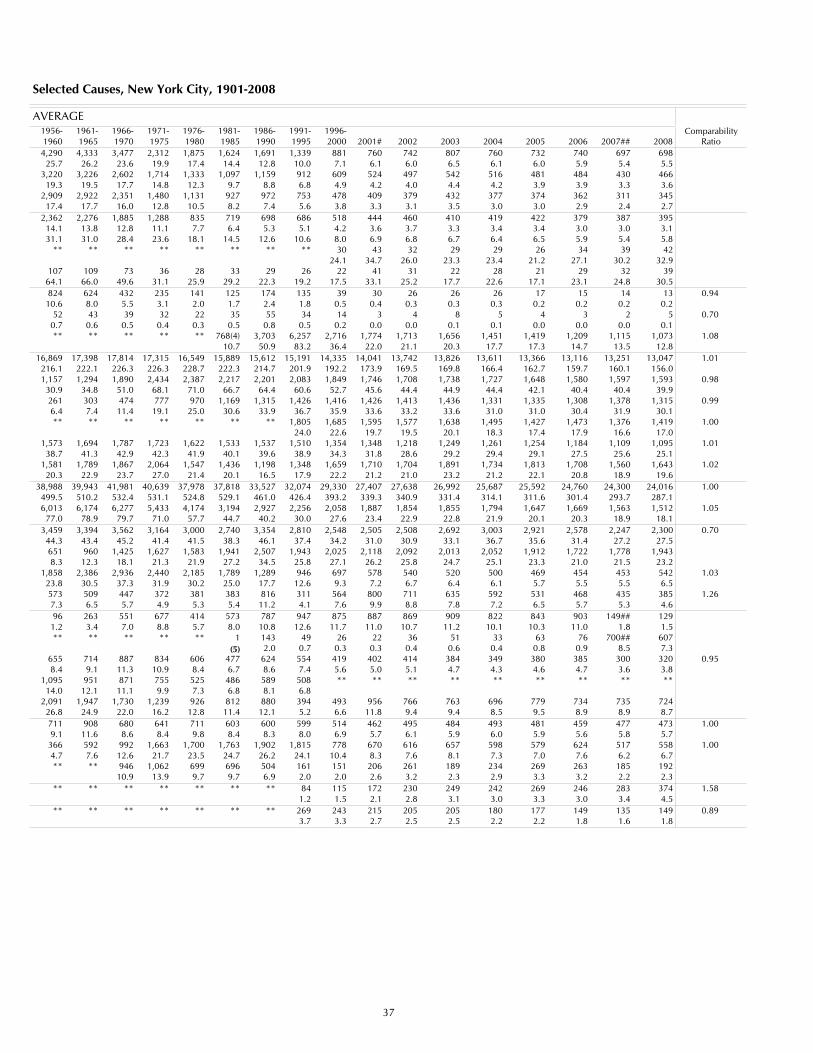
37
Selected Causes, New York City, 1901-2008
AVERAGE1956- 1961- 1966- 1971- 1976- 1981- 1986- 1991- 1996- Comparability1960 1965 1970 1975 1980 1985 1990 1995 2000 2001# 2002 2003 2004 2005 2006 2007## 2008 Ratio4,290 4,333 3,477 2,312 1,875 1,624 1,691 1,339 881 760 742 807 760 732 740 697 698
25.7 26.2 23.6 19.9 17.4 14.4 12.8 10.0 7.1 6.1 6.0 6.5 6.1 6.0 5.9 5.4 5.53,220 3,226 2,602 1,714 1,333 1,097 1,159 912 609 524 497 542 516 481 484 430 466
19.3 19.5 17.7 14.8 12.3 9.7 8.8 6.8 4.9 4.2 4.0 4.4 4.2 3.9 3.9 3.3 3.62,909 2,922 2,351 1,480 1,131 927 972 753 478 409 379 432 377 374 362 311 345
17.4 17.7 16.0 12.8 10.5 8.2 7.4 5.6 3.8 3.3 3.1 3.5 3.0 3.0 2.9 2.4 2.72,362 2,276 1,885 1,288 835 719 698 686 518 444 460 410 419 422 379 387 395
14.1 13.8 12.8 11.1 7.7 6.4 5.3 5.1 4.2 3.6 3.7 3.3 3.4 3.4 3.0 3.0 3.131.1 31.0 28.4 23.6 18.1 14.5 12.6 10.6 8.0 6.9 6.8 6.7 6.4 6.5 5.9 5.4 5.8
** ** ** ** ** ** ** ** 30 43 32 29 29 26 34 39 4224.1 34.7 26.0 23.3 23.4 21.2 27.1 30.2 32.9
107 109 73 36 28 33 29 26 22 41 31 22 28 21 29 32 3964.1 66.0 49.6 31.1 25.9 29.2 22.3 19.2 17.5 33.1 25.2 17.7 22.6 17.1 23.1 24.8 30.5824 624 432 235 141 125 174 135 39 30 26 26 26 17 15 14 13 0.9410.6 8.0 5.5 3.1 2.0 1.7 2.4 1.8 0.5 0.4 0.3 0.3 0.3 0.2 0.2 0.2 0.2
52 43 39 32 22 35 55 34 14 3 4 8 5 4 3 2 5 0.700.7 0.6 0.5 0.4 0.3 0.5 0.8 0.5 0.2 0.0 0.0 0.1 0.1 0.0 0.0 0.0 0.1** ** ** ** ** 768(4) 3,703 6,257 2,716 1,774 1,713 1,656 1,451 1,419 1,209 1,115 1,073 1.08
10.7 50.9 83.2 36.4 22.0 21.1 20.3 17.7 17.3 14.7 13.5 12.816,869 17,398 17,814 17,315 16,549 15,889 15,612 15,191 14,335 14,041 13,742 13,826 13,611 13,366 13,116 13,251 13,047 1.01
216.1 222.1 226.3 226.3 228.7 222.3 214.7 201.9 192.2 173.9 169.5 169.8 166.4 162.7 159.7 160.1 156.01,157 1,294 1,890 2,434 2,387 2,217 2,201 2,083 1,849 1,746 1,708 1,738 1,727 1,648 1,580 1,597 1,593 0.98
30.9 34.8 51.0 68.1 71.0 66.7 64.4 60.6 52.7 45.6 44.4 44.9 44.4 42.1 40.4 40.4 39.9261 303 474 777 970 1,169 1,315 1,426 1,416 1,426 1,413 1,436 1,331 1,335 1,308 1,378 1,315 0.996.4 7.4 11.4 19.1 25.0 30.6 33.9 36.7 35.9 33.6 33.2 33.6 31.0 31.0 30.4 31.9 30.1** ** ** ** ** ** ** 1,805 1,685 1,595 1,577 1,638 1,495 1,427 1,473 1,376 1,419 1.00
24.0 22.6 19.7 19.5 20.1 18.3 17.4 17.9 16.6 17.01,573 1,694 1,787 1,723 1,622 1,533 1,537 1,510 1,354 1,348 1,218 1,249 1,261 1,254 1,184 1,109 1,095 1.01
38.7 41.3 42.9 42.3 41.9 40.1 39.6 38.9 34.3 31.8 28.6 29.2 29.4 29.1 27.5 25.6 25.11,581 1,789 1,867 2,064 1,547 1,436 1,198 1,348 1,659 1,710 1,704 1,891 1,734 1,813 1,708 1,560 1,643 1.02
20.3 22.9 23.7 27.0 21.4 20.1 16.5 17.9 22.2 21.2 21.0 23.2 21.2 22.1 20.8 18.9 19.638,988 39,943 41,981 40,639 37,978 37,818 33,527 32,074 29,330 27,407 27,638 26,992 25,687 25,592 24,760 24,300 24,016 1.00
499.5 510.2 532.4 531.1 524.8 529.1 461.0 426.4 393.2 339.3 340.9 331.4 314.1 311.6 301.4 293.7 287.16,013 6,174 6,277 5,433 4,174 3,194 2,927 2,256 2,058 1,887 1,854 1,855 1,794 1,647 1,669 1,563 1,512 1.05
77.0 78.9 79.7 71.0 57.7 44.7 40.2 30.0 27.6 23.4 22.9 22.8 21.9 20.1 20.3 18.9 18.13,459 3,394 3,562 3,164 3,000 2,740 3,354 2,810 2,548 2,505 2,508 2,692 3,003 2,921 2,578 2,247 2,300 0.70
44.3 43.4 45.2 41.4 41.5 38.3 46.1 37.4 34.2 31.0 30.9 33.1 36.7 35.6 31.4 27.2 27.5651 960 1,425 1,627 1,583 1,941 2,507 1,943 2,025 2,118 2,092 2,013 2,052 1,912 1,722 1,778 1,9438.3 12.3 18.1 21.3 21.9 27.2 34.5 25.8 27.1 26.2 25.8 24.7 25.1 23.3 21.0 21.5 23.2
1,858 2,386 2,936 2,440 2,185 1,789 1,289 946 697 578 540 520 500 469 454 453 542 1.0323.8 30.5 37.3 31.9 30.2 25.0 17.7 12.6 9.3 7.2 6.7 6.4 6.1 5.7 5.5 5.5 6.5573 509 447 372 381 383 816 311 564 800 711 635 592 531 468 435 385 1.267.3 6.5 5.7 4.9 5.3 5.4 11.2 4.1 7.6 9.9 8.8 7.8 7.2 6.5 5.7 5.3 4.696 263 551 677 414 573 787 947 875 887 869 909 822 843 903 149## 1291.2 3.4 7.0 8.8 5.7 8.0 10.8 12.6 11.7 11.0 10.7 11.2 10.1 10.3 11.0 1.8 1.5** ** ** ** ** 1 143 49 26 22 36 51 33 63 76 700## 607
(5) 2.0 0.7 0.3 0.3 0.4 0.6 0.4 0.8 0.9 8.5 7.3655 714 887 834 606 477 624 554 419 402 414 384 349 380 385 300 320 0.958.4 9.1 11.3 10.9 8.4 6.7 8.6 7.4 5.6 5.0 5.1 4.7 4.3 4.6 4.7 3.6 3.8
1,095 951 871 755 525 486 589 508 ** ** ** ** ** ** ** ** **14.0 12.1 11.1 9.9 7.3 6.8 8.1 6.8
2,091 1,947 1,730 1,239 926 812 880 394 493 956 766 763 696 779 734 735 72426.8 24.9 22.0 16.2 12.8 11.4 12.1 5.2 6.6 11.8 9.4 9.4 8.5 9.5 8.9 8.9 8.7711 908 680 641 711 603 600 599 514 462 495 484 493 481 459 477 473 1.009.1 11.6 8.6 8.4 9.8 8.4 8.3 8.0 6.9 5.7 6.1 5.9 6.0 5.9 5.6 5.8 5.7
366 592 992 1,663 1,700 1,763 1,902 1,815 778 670 616 657 598 579 624 517 558 1.004.7 7.6 12.6 21.7 23.5 24.7 26.2 24.1 10.4 8.3 7.6 8.1 7.3 7.0 7.6 6.2 6.7** ** 946 1,062 699 696 504 161 151 206 261 189 234 269 263 185 192
10.9 13.9 9.7 9.7 6.9 2.0 2.0 2.6 3.2 2.3 2.9 3.3 3.2 2.2 2.3** ** ** ** ** ** ** 84 115 172 230 249 242 269 246 283 374 1.58
1.2 1.5 2.1 2.8 3.1 3.0 3.3 3.0 3.4 4.5** ** ** ** ** ** ** 269 243 215 205 205 180 177 149 135 149 0.89
3.7 3.3 2.7 2.5 2.5 2.2 2.2 1.8 1.6 1.8

38
Table 25a. Average Yearly Age-Sex-Specific Death Rates per 1,000 Population, New York City, 1909-2001 See Note
1909-1911 1919-1920 1929-1931 1939-1941 1949-1951 1959-1961 1969-1971 1979-1981 1989-1991 1999-2001*Age (Years) Male Female Male Female Male Female Male Female Male Female Male Female Male Female Male Female Male Female Male Female
0-4 50.2 43.2 32.4 26.5 19.4 15.4 11.3 8.8 7.6 6.0 8.2 6.4 6.6 5.3 4.1 3.4 3.8 3.1 1.9 1.55-9 4.2 3.9 3.8 3.1 2.5 2.0 1.0 0.8 0.6 0.5 0.7 0.5 0.6 0.4 0.4 0.2 0.2 0.2 0.2 0.110-14 2.4 2.3 2.4 2.2 1.7 1.3 0.9 0.7 0.6 0.4 0.5 0.3 0.5 0.3 0.3 0.2 0.3 0.2 0.2 0.215-19 3.9 3.1 4.0 3.7 2.6 2.2 1.3 1.1 0.9 0.6 0.9 0.5 1.8 0.7 1.3 0.5 1.7 0.4 0.7 0.320-24 5.3 4.6 5.8 5.4 3.4 3.2 1.7 1.6 1.3 0.9 1.5 0.7 2.9 0.9 2.4 0.7 2.5 0.7 1.2 0.425-29 6.9 5.9 6.5 6.9 3.8 3.4 2.2 2.0 1.4 1.2 1.7 1.0 2.8 1.1 2.7 0.8 3.2 1.0 1.2 0.530-34 9.6 7.6 7.7 7.0 5.1 4.1 3.1 2.4 2.0 1.6 2.4 1.6 3.3 1.7 3.1 1.1 5.0 1.8 1.6 0.835-39 13.0 9.3 9.2 7.3 7.0 5.0 4.5 3.2 3.2 2.2 3.5 2.3 4.8 2.5 3.7 1.6 7.4 2.4 2.4 1.440-44 16.5 11.2 10.9 9.0 10.1 6.9 7.0 4.8 5.5 3.6 5.6 3.5 6.7 3.6 5.2 2.5 8.4 2.6 3.9 2.145-49 20.8 14.3 15.2 12.1 14.8 10.5 11.7 7.4 8.9 5.3 8.6 5.0 9.5 5.3 7.8 3.9 9.0 3.5 6.1 3.150-54 26.5 19.1 20.6 16.3 22.0 15.0 17.2 11.5 14.5 8.3 13.7 7.2 13.5 7.3 11.0 5.8 11.1 5.3 8.1 4.255-59 37.0 28.8 30.1 24.8 32.0 23.4 25.9 17.5 22.6 12.8 19.7 9.8 19.8 9.9 15.6 8.4 14.5 7.6 11.2 6.360-64 51.4 44.1 40.8 33.8 44.7 35.3 37.9 26.8 32.9 20.5 30.0 15.8 28.3 13.4 23.2 12.7 20.1 11.6 15.6 9.465-69 68.5 58.9 60.1 55.0 62.0 50.2 55.0 40.8 46.2 29.7 43.4 24.2 41.1 20.3 33.4 17.8 28.5 16.9 23.5 14.570-74 89.6 81.2 85.1 79.5 84.3 73.3 78.9 62.5 68.0 49.7 61.1 40.7 57.3 32.6 49.9 27.3 41.9 25.3 34.4 21.275-79 127.3 114.4 116.2 107.6 120.7 109.2 111.4 93.3 95.9 77.0 87.7 65.6 83.1 55.3 71.0 42.7 60.6 37.8 52.3 33.980-84 167.4 159.6 162.6 143.6 170.9 151.2 149.8 141.5 134.0 121.2 138.9 117.1 120.3 91.7 109.9 75.9 95.9 62.1 80.6 55.385 & Over 257.4 232.3 224.8 210.2 242.8 227.5 230.5 222.2 202.8 183.8 206.6 198.3 167.0 155.6 185.2 154.2 169.6 142.9 150.9 130.2
Note: Rates for 1979-1981, 1989-1991, and 1999-2001 are based on deaths to New York City residents only, regardless of place of death, while those for previous years included all events in New York City, regardless of the residence of the decedents. See Technical Notes: Life Expectancy, Age Specific and Adjusted Death Rates. Data are presented in every ten years when census population data are available.
*World Trade Center disaster deaths are not included. See Technical Notes: World Trade Center Deaths.
Table 25b. Average Yearly Age-Sex-Race-Adjusted Death Rates for Selected Causes per 100,000 Population New York City, 1901-2001
See Note See Note
Cause of Death 1901-1903 1909-1911 1919-1920 1929-1931 1939-1941 1949-1951 1959-1961 1969-1971 1979-1981 1989-1991 1999-2001*
All Causes . . . . . . . . . . . . . . . . . . . . . . . . . . . . . . . . . 2,324.2 1,934.1 1,691.4 1,449.0 1,128.1 885.8 813.3 771.1 549.3 606.6 799.6Influenza and Pneumonia . . . . . . . . . . . . . . . . . . . . . 302.8 260.8 301.7 178.6 60.3 30.7 36.4 29.0 15.2 22.2 33.2Malignant Neoplasms . . . . . . . . . . . . . . . . . . . . . . . . 116.8 124.8 134.3 156.0 176.9 170.6 162.9 161.2 126.0 128.0 178.4 Colon, Rectum, and Anus . . . . . . . . . . . . . . . . . . . ** ** ** ** ** ** ** ** ** ** 21.3 Trachea, Bronchus, and Lung . . . . . . . . . . . . . . . . . ** ** ** ** ** ** ** ** ** ** 40.8 Breast . . . . . . . . . . . . . . . . . . . . . . . . . . . . . . . . . . . ** ** ** ** ** ** ** ** ** ** 16.7 Prostate . . . . . . . . . . . . . . . . . . . . . . . . . . . . . . . . . ** ** ** ** ** ** ** ** ** ** 10.7Diabetes Mellitus. . . . . . . . . . . . . . . . . . . . . . . . . . . . 23.3 25.4 26.5 35.8 43.6 17.0 14.8 15.9 10.3 7.1 22.9Nephritis, Nephrotic Syndrome, and Nephrosis . . . . . 244.8 181.9 141.6 63.3 52.6 6.7 5.5 3.5 2.3 4.9 11.1Major Cardiovascular Diseases . . . . . . . . . . . . . . . . . . 258.6 383.2 427.7 506.7 421.1 404.8 355.8 306.6 239.1 228.7 372.9Chronic Liver Disease and Cirrhosis . . . . . . . . . . . . . . ** ** ** ** ** ** ** ** 23.5 11.8 7.8Chronic Lower Respiratory Diseases . . . . . . . . . . . . . ** ** ** ** ** ** ** ** 9.3 13.1 23.0HIV Disease . . . . . . . . . . . . . . . . . . . . . . . . . . . . . . . . ** ** ** ** ** ** ** ** ** 56.6 23.6Total Accidents . . . . . . . . . . . . . . . . . . . . . . . . . . . . . 108.2 87.8 73.8 81.3 55.9 38.4 28.1 22.7 18.2 21.6 20.6Motor Vehicle Accidents . . . . . . . . . . . . . . . . . . . . . . ** ** 14.9 22.6 12.8 7.3 7.7 11.0 8.4 9.4 3.4Other Accidents . . . . . . . . . . . . . . . . . . . . . . . . . . . . . ** ** 58.9 58.7 43.1 31.0 20.3 11.6 9.8 12.1 17.2Intentional Self-Harm (Suicide) . . . . . . . . . . . . . . . . . . 26.8 21.2 14.1 21.3 14.3 9.7 9.2 6.4 9.4 9.0 5.4Assault (Homicide) . . . . . . . . . . . . . . . . . . . . . . . . . . . 3.6 5.1 6.2 8.0 4.4 4.0 5.3 14.0 21.8 22.6 8.3
Note: Rates for 1979-1981, 1989-1991, and 1999-2001 are based on deaths to New York City residents only, regardless of place of death, while those for previous years included all events in New York City, regardless of the residence of the decedents. For 1901-1903 and 1909-1911, rates are adjusted for age and sex. For years before 1999, rates are adjusted for age, sex and race (white and others). The standard is the United States population, 1940. * For 1999-2001 rates are adjusted only for age. A 2000 US standard population is used to calculate age-adjusted death rates. See Technical Notes: Life Expectancy, Age Specific and Adjusted Rates. World Trade Center Deaths are not included. See Technical Notes: World Trade Center Deaths.
** Data are not available or not applicable.

!!
!!
!
!
!
!
! !! ! ! ! ! !!
!!
!
!
! !
!
0
5
10
15
20
25
30
35
Num
ber
of E
vent
s in
Tho
usan
ds
1991
1992
1993
1994
1995
1996
1997
1998
1999
2000
2001
2002
2003
2004
2005
2006
2007
2008
0.0
2.0
4.0
6.0
8.0
10.0
12.0
Rate
per
1, 0
00 L
ive
Birt
hs
Early Neonatal (Under 7 Days) 6.5 5.8 5.8 4.9 5.0 4.2 3.7 3.8 3.8 3.6 3.3 3.1 3.5 3.0 3.0 2.9 2.4 2.7
Late Neonatal (7-27 Days) 1.4 1.2 1.1 1.1 1.2 1.0 1.2 1.0 1.1 1.0 0.9 0.9 0.9 1.1 0.9 1.0 0.9 0.9
Post-neonatal (28 Days-1 Year) 3.5 3.3 3.4 3.0 2.6 2.6 2.2 2.0 2.0 2.0 1.9 2.0 2.1 2.0 2.1 2.0 2.1 1.8
Infant Mortality (Under 1 Year) 11.4 10.2 10.2 9.0 8.8 7.8 7.1 6.8 6.9 6.7 6.1 6.0 6.5 6.1 6.0 5.9 5.4 5.5
Under 7 Days
28 Days-1 Year
7-27 Days
Infant Mortality Rate
Spontaneous Terminations
Induced Terminations
Live Births
Figure 17. Live Births, Induced Terminations, and Spontaneous Terminations of Pregnancy
by Age of Woman, New York City, 2008
Over 229,000 pregnancy outcomes were reported in New York City in 2008. Approximately 56% were live births, 39% were induced terminations, and 5% were spontaneous terminations (fetal deaths). The proportion of pregnancies ending in an induced termination is the highest among younger women, and is about 30% at age 30. For women under the age of 25, more pregnancies end in induced termination than in a live birth or spontaneous termination.All induced and spontaneous terminations, regardless of gestational age or weight, are required to be reported. However, the number reported varies with amount of Health Department outreach done to reporting sites, which varies from year to year depending on available resources.
Figure 18. Infant, Neonatal, and Post-neonatal Mortality Rates,
New York City, 1991-2008
The 2008 infant mortality rate (IMR) of 5.5 infant deaths (under one year of age) per 1,000 live births, remained very close to its 2007 historical low with a statistically insignificant 1.9% increase from 5.4 in 2007. Early neonatal (under seven days) mortality rates increased from 2.4 in 2007 to 2.7 per 1000 live births while late neonatal (7-27 days) mortality rates remained stable at 0.9 deaths per 1,000 births and post-neonatal (28 days to 1 year) mortality rates decreased from 2.1 in 2007 to 1.8 per 1,000 live births.From 1991 to 2008, the rate of early neonatal deaths declined by more than half, the rate of post-neonatal deaths declined by 49 percent, and the rate of late neonatal deaths declined by about 36 percent.Note: See Table 53 and Figure 28 on the Perinatal Periods of Risk (PPOR) approach to understanding fetal-infant mortality (page 68).
39
15-1
7
Und
e r 1
5
1 8- 1
9
20-2
4
25-2
9
30-3
4
35-3
9
40 &
Ove
r
Age of Woman

40
Figure 20. Percent and Rate of Live Births to Teenagers by Borough of Residence,
New York City, 2006-2008
5.4
11.8
6.85.9 5.6
27.8
44.7
30.7
23.6
19.0
Manhattan Bronx Brooklyn Queens Staten Island
Borough of Residence
0.0
2.0
4.0
6.0
8.0
10.0
12.0
14.0
Perc
e nt o
f Liv
e Bi
rths
to T
eena
gers
0.0
10.0
20.0
30.0
40.0
50.0
Rate per 1,000 Wom
en Aged 15-19
Percent, Left Y-Axis Rate, Right Y-Axis
Citywide Percent 6.7
In 2006-2008, 11.8% of all live births in the Bronx were to teenagers (age under 20), the highest of the five boroughs of New York City. This was about two times higher than the percent of live births to teenagers in Manhattan, at 5.4%; Queens, at 5.9%; and Staten Island, at 5.6%. The percent of live births to teens in Brooklyn was 6.8% during this period. Citywide, the percent of all live births to teenagers was 6.7% in 2006-2008, much lower than the U.S. figure of 10.4% for 2006, the latest year for which data were available.The birth rate to teenagers aged 15-19 had the same pattern, with the Bronx having the highest rate, 44.7 per 1000 women, and Staten Island having the lowest, 19.0 per 1,000 women. The citywide birth rate to mothers aged 15-19 was 31.3 per 1,000 women in 2006-2008. See Demographics, Population in Technical Notes for information about population estimates used.
1989
1990
1991
1992
1993
1994
1995
1996
1997
1998
1999
2000
2001
2002
2003
2004
2005
2006
2007
2008
Year
0
50
100
150
200
250
300
Thou
sand
s
Figure 19. Number of Live Births, Induced Terminations, and Spontaneous Terminations, New York City, 1989-2008
Total NYC pregnancies (the sum of reported live births, spontaneous and induced terminations) appears to have decreased since 1992. The number of live births increased in the 1980s and reached its current peak in 1990. (The historic peak was 168,393 in 1961.) Between 1991 and 2005, the number of births decreased incrementally to a low of 122,725. The number of spontaneous and induced terminations also declined through 2004 and 2005 respectively. The number of spontaneous terminations continues to hover near 12,000 per year and induced terminations near 90,000 per year.
Note: See Technical Note for information about Spontaneous and Induced Terminations
Induced Terminations
Spontaneous Terminations
Live Births
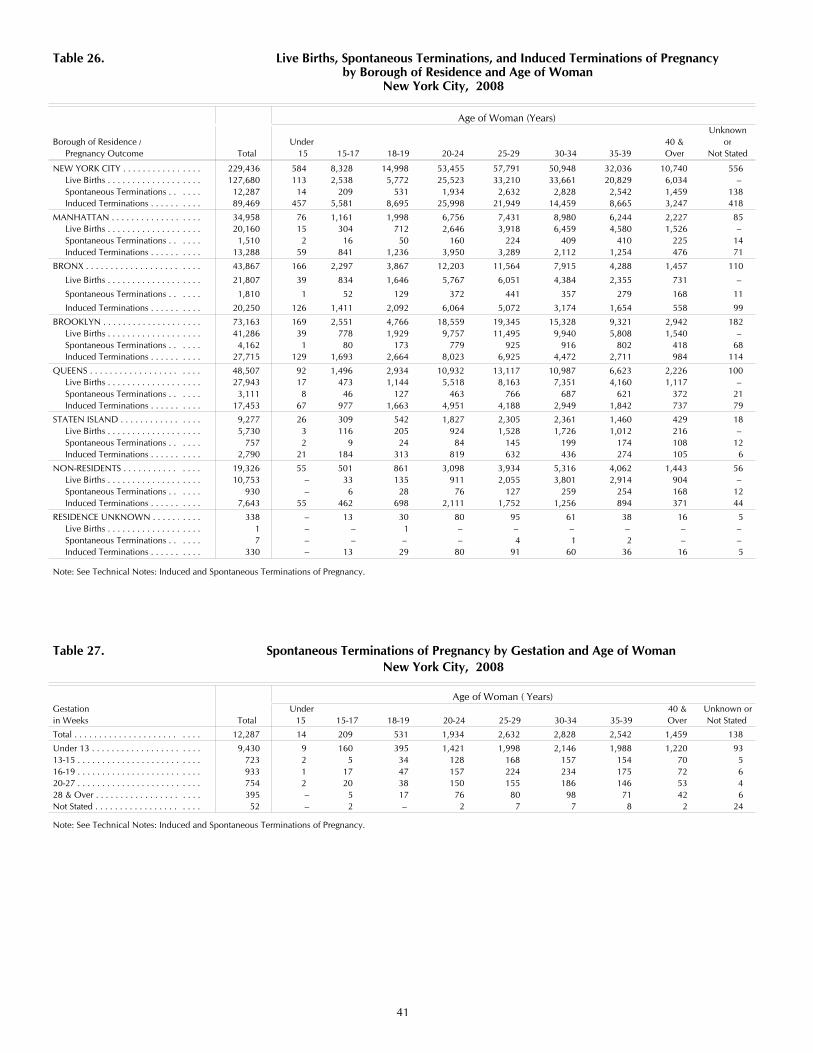
41
Table 26. Live Births, Spontaneous Terminations, and Induced Terminations of Pregnancy by Borough of Residence and Age of Woman
New York City, 2008
Age of Woman (Years)Unknown
Borough of Residence / Under 40 & or Pregnancy Outcome Total 15 15-17 18-19 20-24 25-29 30-34 35-39 Over Not Stated
NEW YORK CITY . . . . . . . . . . . . . . . . 229,436 584 8,328 14,998 53,455 57,791 50,948 32,036 10,740 556 Live Births . . . . . . . . . . . . . . . . . . . 127,680 113 2,538 5,772 25,523 33,210 33,661 20,829 6,034 – Spontaneous Terminations . . . . . . 12,287 14 209 531 1,934 2,632 2,828 2,542 1,459 138 Induced Terminations . . . . . . . . . . 89,469 457 5,581 8,695 25,998 21,949 14,459 8,665 3,247 418
MANHATTAN . . . . . . . . . . . . . . . . . . 34,958 76 1,161 1,998 6,756 7,431 8,980 6,244 2,227 85 Live Births . . . . . . . . . . . . . . . . . . . 20,160 15 304 712 2,646 3,918 6,459 4,580 1,526 – Spontaneous Terminations . . . . . . 1,510 2 16 50 160 224 409 410 225 14 Induced Terminations . . . . . . . . . . 13,288 59 841 1,236 3,950 3,289 2,112 1,254 476 71
BRONX . . . . . . . . . . . . . . . . . . . . . . . 43,867 166 2,297 3,867 12,203 11,564 7,915 4,288 1,457 110
Live Births . . . . . . . . . . . . . . . . . . . 21,807 39 834 1,646 5,767 6,051 4,384 2,355 731 –
Spontaneous Terminations . . . . . . 1,810 1 52 129 372 441 357 279 168 11
Induced Terminations . . . . . . . . . . 20,250 126 1,411 2,092 6,064 5,072 3,174 1,654 558 99
BROOKLYN . . . . . . . . . . . . . . . . . . . . 73,163 169 2,551 4,766 18,559 19,345 15,328 9,321 2,942 182 Live Births . . . . . . . . . . . . . . . . . . . 41,286 39 778 1,929 9,757 11,495 9,940 5,808 1,540 – Spontaneous Terminations . . . . . . 4,162 1 80 173 779 925 916 802 418 68 Induced Terminations . . . . . . . . . . 27,715 129 1,693 2,664 8,023 6,925 4,472 2,711 984 114
QUEENS . . . . . . . . . . . . . . . . . . . . . . 48,507 92 1,496 2,934 10,932 13,117 10,987 6,623 2,226 100 Live Births . . . . . . . . . . . . . . . . . . . 27,943 17 473 1,144 5,518 8,163 7,351 4,160 1,117 – Spontaneous Terminations . . . . . . 3,111 8 46 127 463 766 687 621 372 21 Induced Terminations . . . . . . . . . . 17,453 67 977 1,663 4,951 4,188 2,949 1,842 737 79
STATEN ISLAND . . . . . . . . . . . . . . . . 9,277 26 309 542 1,827 2,305 2,361 1,460 429 18 Live Births . . . . . . . . . . . . . . . . . . . 5,730 3 116 205 924 1,528 1,726 1,012 216 – Spontaneous Terminations . . . . . . 757 2 9 24 84 145 199 174 108 12 Induced Terminations . . . . . . . . . . 2,790 21 184 313 819 632 436 274 105 6
NON-RESIDENTS . . . . . . . . . . . . . . . 19,326 55 501 861 3,098 3,934 5,316 4,062 1,443 56 Live Births . . . . . . . . . . . . . . . . . . . 10,753 – 33 135 911 2,055 3,801 2,914 904 – Spontaneous Terminations . . . . . . 930 – 6 28 76 127 259 254 168 12 Induced Terminations . . . . . . . . . . 7,643 55 462 698 2,111 1,752 1,256 894 371 44
RESIDENCE UNKNOWN . . . . . . . . . . 338 – 13 30 80 95 61 38 16 5 Live Births . . . . . . . . . . . . . . . . . . . 1 – – 1 – – – – – – Spontaneous Terminations . . . . . . 7 – – – – 4 1 2 – – Induced Terminations . . . . . . . . . . 330 – 13 29 80 91 60 36 16 5
Note: See Technical Notes: Induced and Spontaneous Terminations of Pregnancy.
Table 27. Spontaneous Terminations of Pregnancy by Gestation and Age of Woman New York City, 2008
Age of Woman ( Years)Gestation Under 40 & Unknown orin Weeks Total 15 15-17 18-19 20-24 25-29 30-34 35-39 Over Not Stated
Total . . . . . . . . . . . . . . . . . . . . . . . . . 12,287 14 209 531 1,934 2,632 2,828 2,542 1,459 138
Under 13 . . . . . . . . . . . . . . . . . . . . . . 9,430 9 160 395 1,421 1,998 2,146 1,988 1,220 9313-15 . . . . . . . . . . . . . . . . . . . . . . . . . 723 2 5 34 128 168 157 154 70 516-19 . . . . . . . . . . . . . . . . . . . . . . . . . 933 1 17 47 157 224 234 175 72 620-27 . . . . . . . . . . . . . . . . . . . . . . . . . 754 2 20 38 150 155 186 146 53 428 & Over . . . . . . . . . . . . . . . . . . . . . 395 – 5 17 76 80 98 71 42 6Not Stated . . . . . . . . . . . . . . . . . . . . . 52 – 2 – 2 7 7 8 2 24
Note: See Technical Notes: Induced and Spontaneous Terminations of Pregnancy.

42
Table 27a. Selected Characteristics of Spontaneous Terminations of Pregnancy,28 Weeks Gestation and Over by Age of Woman, New York City, 2008
Age of Woman (Years) Under 40 & Not
Total 15 15-17 18-19 20-24 25-29 30-34 35-39 Over StatedSpontaneous Terminations of Pregnancy, 28 Weeks & Over
Total . . . . . . . . . . . . . . . . . . . . . . . . . . . . . . . . . . . . . . . . . . . 395 0 5 17 76 80 98 71 42 6Sex Male . . . . . . . . . . . . . . . . . . . . . . . . . . . . . . . . . . . . . . . . . 202 – 2 8 37 40 50 42 21 2 Female . . . . . . . . . . . . . . . . . . . . . . . . . . . . . . . . . . . . . . . . 174 – 2 8 36 35 41 27 21 4 Undetermined . . . . . . . . . . . . . . . . . . . . . . . . . . . . . . . . . . 19 – 1 1 3 5 7 2 – –Weight at Delivery in Grams Under 500 . . . . . . . . . . . . . . . . . . . . . . . . . . . . . . . . . . . . . 11 – – – 2 4 2 2 – 1 500-999 . . . . . . . . . . . . . . . . . . . . . . . . . . . . . . . . . . . . . . . 30 – – 1 5 8 9 6 1 – 1000-1499 . . . . . . . . . . . . . . . . . . . . . . . . . . . . . . . . . . . . . 63 – 1 6 10 10 16 9 10 1 1500-1999 . . . . . . . . . . . . . . . . . . . . . . . . . . . . . . . . . . . . . 52 – – 2 7 12 12 8 10 1 2000-2499 . . . . . . . . . . . . . . . . . . . . . . . . . . . . . . . . . . . . . 62 – 1 3 15 9 17 13 3 1 2500 & Over . . . . . . . . . . . . . . . . . . . . . . . . . . . . . . . . . . . 139 – 2 4 31 26 33 26 16 1 Not Stated . . . . . . . . . . . . . . . . . . . . . . . . . . . . . . . . . . . . . 38 – 1 1 6 11 9 7 2 1
Note: See Technical Notes: Induced and Spontaneous Terminations of Pregnancy.
Table 27b. Selected Characteristics of Spontaneous Terminations of Pregnancy,28 Weeks Gestation and Over by Ethnic Group of Woman, New York City, 2008
Ethnic Group of WomanPuerto Other Asian & Non-Hispanic Non-Hispanic Not
Total Rican Hispanic Pacific Islander White Black Other StatedSpontaneous Terminations of Pregnancy, 28 Weeks & Over Total . . . . . . . . . . . . . . . . . . . . . . . . . . . . . . . . . . . . . . . . . 395 16 92 41 90 145 2 9 Sex Male . . . . . . . . . . . . . . . . . . . . . . . . . . . . . . . . . . . . . . . 202 6 43 20 52 75 2 4 Female . . . . . . . . . . . . . . . . . . . . . . . . . . . . . . . . . . . . . 174 9 44 20 36 63 – 2 Undetermined . . . . . . . . . . . . . . . . . . . . . . . . . . . . . . . 19 1 5 1 2 7 – 3 Weight at Delivery in Grams Under 500 . . . . . . . . . . . . . . . . . . . . . . . . . . . . . . . . . . 11 – 1 1 7 2 – – 500-999 . . . . . . . . . . . . . . . . . . . . . . . . . . . . . . . . . . . . 30 3 6 3 7 10 1 – 1,000-1,499 . . . . . . . . . . . . . . . . . . . . . . . . . . . . . . . . . 63 5 12 10 11 24 – 1 1,500-1,999 . . . . . . . . . . . . . . . . . . . . . . . . . . . . . . . . . 52 2 13 4 12 20 – 1 2,000-2,499 . . . . . . . . . . . . . . . . . . . . . . . . . . . . . . . . . 62 1 16 5 12 27 – 1 2,500 & Over . . . . . . . . . . . . . . . . . . . . . . . . . . . . . . . 139 3 34 13 36 47 – 6 Not Stated . . . . . . . . . . . . . . . . . . . . . . . . . . . . . . . . . . . 38 2 10 5 5 15 1 –Note: See Technical Notes: Induced and Spontaneous Terminations of Pregnancy.

43
Table 28. Live Births, Spontaneous Terminations of 28 Weeks Gestation and Over, and Induced Terminations of Pregnancy by Borough of Residence and Occurrence, New York City, 2008
Borough of Residence / Borough of Occurrence
Pregnancy Outcome Total Manhattan Bronx Brooklyn Queens Staten Island
NEW YORK CITY . . . . . . . . . . . . . . . . . . . . . . . . . . . . 217,544 82,102 30,186 55,866 43,254 6,136 Live Births . . . . . . . . . . . . . . . . . . . . . . . . . . . . . . . 127,680 46,125 17,454 33,383 24,835 5,883 Spontaneous Terminations . . . . . . . . . . . . . . . . . . . 395 123 63 120 74 15 Induced Terminations . . . . . . . . . . . . . . . . . . . . . . . 89,469 35,854 12,669 22,363 18,345 238
MANHATTAN . . . . . . . . . . . . . . . . . . . . . . . . . . . . . . . 33,493 30,607 1,298 1,081 489 18 Live Births . . . . . . . . . . . . . . . . . . . . . . . . . . . . . . . 20,160 19,418 404 200 120 18 Spontaneous Terminations . . . . . . . . . . . . . . . . . . . 45 45 – – – – Induced Terminations . . . . . . . . . . . . . . . . . . . . . . . 13,288 11,144 894 881 369 –
BRONX . . . . . . . . . . . . . . . . . . . . . . . . . . . . . . . . . . . . 42,139 13,996 26,827 584 723 9 Live Births . . . . . . . . . . . . . . . . . . . . . . . . . . . . . . . 21,807 5,425 16,027 182 165 8 Spontaneous Terminations . . . . . . . . . . . . . . . . . . . 82 19 62 – – 1 Induced Terminations . . . . . . . . . . . . . . . . . . . . . . . 20,250 8,552 10,738 402 558 –
BROOKLYN . . . . . . . . . . . . . . . . . . . . . . . . . . . . . . . . 69,150 17,012 330 47,257 3,626 925 Live Births . . . . . . . . . . . . . . . . . . . . . . . . . . . . . . . 41,286 9,242 100 29,789 1,240 915 Spontaneous Terminations . . . . . . . . . . . . . . . . . . . 149 28 – 110 7 4 Induced Terminations . . . . . . . . . . . . . . . . . . . . . . . 27,715 7,742 230 17,358 2,379 6
QUEENS . . . . . . . . . . . . . . . . . . . . . . . . . . . . . . . . . . . 45,477 8,519 354 3,461 33,105 38 Live Births . . . . . . . . . . . . . . . . . . . . . . . . . . . . . . . 27,943 5,215 132 1,896 20,663 37 Spontaneous Terminations . . . . . . . . . . . . . . . . . . . 81 15 – 6 60 – Induced Terminations . . . . . . . . . . . . . . . . . . . . . . . 17,453 3,289 222 1,559 12,382 1
STATEN ISLAND. . . . . . . . . . . . . . . . . . . . . . . . . . . . . 8,532 1,420 46 2,086 123 4,857 Live Births . . . . . . . . . . . . . . . . . . . . . . . . . . . . . . . 5,730 320 15 735 38 4,622 Spontaneous Terminations . . . . . . . . . . . . . . . . . . . 12 1 – – 1 10 Induced Terminations . . . . . . . . . . . . . . . . . . . . . . . 2,790 1,099 31 1,351 84 225
NON-RESIDENTS . . . . . . . . . . . . . . . . . . . . . . . . . . . . 18,422 10,384 1,300 1,330 5,119 289 Live Births . . . . . . . . . . . . . . . . . . . . . . . . . . . . . . . 10,753 6,504 776 581 2,609 283 Spontaneous Terminations . . . . . . . . . . . . . . . . . . . 26 15 1 4 6 – Induced Terminations . . . . . . . . . . . . . . . . . . . . . . . 7,643 3,865 523 745 2,504 6
RESIDENCE UNKNOWN . . . . . . . . . . . . . . . . . . . . . . 331 164 31 67 69 – Live Births . . . . . . . . . . . . . . . . . . . . . . . . . . . . . . . 1 1 – – – – Spontaneous Terminations . . . . . . . . . . . . . . . . . . . – – – – – – Induced Terminations . . . . . . . . . . . . . . . . . . . . . . . 330 163 31 67 69 –
Note: See Technical Notes: Induced and Spontaneous Terminations of Pregnancy.

44
Table 28a. Teen Births and Pregnancy Rates* by Ethnic Group and Borough of Residence, New York City, 2008
PregnancyAge of Woman Spontaneous Induced Population Birth Rate per Rate per
in Years Live Births Terminations Terminations (Women) 1,000 Women 1,000 WomenNew York City ** 15-17 2,538 209 5,581 160,036 15.9 52.0
18-19 5,772 531 8,695 112,539 51.3 133.3Age 15-19 8,310 740 14,276 272,575 30.5 85.6
Ethnic Group**Hispanic 15-17 1,510 99 2,185 53,670 28.1 70.7
18-19 3,192 218 3,225 37,666 84.7 176.2Age 15-19 4,702 317 5,410 91,336 51.5 114.2
Asian and Pacific Islander 15-17 41 4 172 15,363 2.7 14.118-19 159 10 349 11,167 14.2 46.4
Age 15-19 200 14 521 26,530 7.5 27.7Non-Hispanic White 15-17 109 10 334 40,219 2.7 11.3
18-19 477 50 654 31,111 15.3 38.0Age 15-19 586 60 988 71,330 8.2 22.9
Non-Hispanic Black 15-17 840 77 2,757 48,042 17.5 76.518-19 1,844 203 4,248 30,600 60.3 205.7
Age 15-19 2,684 280 7,005 78,642 34.1 126.8ResidenceNYC Events to NYC Residents*** 15-17 2,505 203 5,106 160,036 15.7 48.8
18-19 5,636 503 7,968 112,539 50.1 125.4Age 15-19 8,141 706 13,074 272,575 29.9 80.4
Manhattan 15-17 304 16 841 19,366 15.7 60.018-19 712 50 1,236 19,600 36.3 101.9
Age 15-19 1,016 66 2,077 38,966 26.1 81.1 Bronx 15-17 834 52 1,411 34,011 24.5 67.5
18-19 1,646 129 2,092 23,443 70.2 165.0Age 15-19 2,480 181 3,503 57,454 43.2 107.3
Brooklyn 15-17 778 80 1,693 54,281 14.3 47.018-19 1,929 173 2,664 35,240 54.7 135.2
Age 15-19 2,707 253 4,357 89,521 30.2 81.7 Queens 15-17 473 46 977 41,681 11.3 35.9
18-19 1,144 127 1,663 27,720 41.3 105.8Age 15-19 1,617 173 2,640 69,401 23.3 63.8
Staten Island 15-17 116 9 184 10,697 10.8 28.918-19 205 24 313 6,536 31.4 82.9
Age 15-19 321 33 497 17,233 18.6 49.4NYC Events to Non-NYC Residents 15-17 33 6 462 – N.A. N.A.
18-19 135 28 698 – N.A. N.A.Age 15-19 168 34 1,160 – N.A. N.A.
* Population data used to calculate rates are from 2008 Census Bureau's pre-challenged estimates. See Technical Notes: Population. ** Includes all events occurring in NYC regardless of residence; other/unknown ethnicities are not presented.*** Numbers and rates are limited to events occurring in NYC to NYC residents only.N.A.: Not applicable.

45
Table 29. Induced Terminations of Pregnancy by Selected Characteristics and Age of Woman,New York City, 2008
Age of Woman in Years Under 40 & Not
Total 15 15-17 18-19 20-24 25-29 30-34 35-39 Over Stated
Induced Termination of Pregnancy, All . . . . . . 89,469 457 5,581 8,695 25,998 21,949 14,459 8,665 3,247 418Ethnic Group
Hispanic . . . . . . . . . . . . . . . . . . . . . . . . . . . . 28,921 183 2,185 3,225 8,941 7,194 4,083 2,236 730 144Asian and Pacific Islander . . . . . . . . . . . . . . . 5,557 7 172 349 1,245 1,392 1,160 855 352 25Non-Hispanic White . . . . . . . . . . . . . . . . . . . 10,451 28 334 654 2,834 2,691 1,896 1,339 623 52Non-Hispanic Black . . . . . . . . . . . . . . . . . . . 41,857 225 2,757 4,248 12,282 10,013 6,838 3,922 1,406 166Other . . . . . . . . . . . . . . . . . . . . . . . . . . . . . . 396 2 19 36 98 91 63 53 32 2Unknown . . . . . . . . . . . . . . . . . . . . . . . . . . . 2,287 12 114 183 598 568 419 260 104 29
Marital Status Married . . . . . . . . . . . . . . . . . . . . . . . . . . . . . 12,667 15 80 240 1,736 3,194 3,387 2,683 1,261 71Not Married . . . . . . . . . . . . . . . . . . . . . . . . . 74,489 429 5,398 8,260 23,656 18,196 10,658 5,735 1,874 283Unknown . . . . . . . . . . . . . . . . . . . . . . . . . . . 2,313 13 103 195 606 559 414 247 112 64
Gestational Age in Weeks 6 or Less . . . . . . . . . . . . . . . . . . . . . . . . . . . . 30,335 79 1,228 2,180 8,430 8,237 5,532 3,248 1,253 1487 - 8 . . . . . . . . . . . . . . . . . . . . . . . . . . . . . . . 27,007 110 1,480 2,436 7,594 6,785 4,607 2,864 999 1329 - 10 s . . . . . . . . . . . . . . . . . . . . . . . . . . . . . 13,082 76 1,011 1,485 3,914 3,021 2,010 1,101 407 5711 - 12 . . . . . . . . . . . . . . . . . . . . . . . . . . . . . 6,644 54 594 859 2,110 1,441 863 496 202 2513 - 15 . . . . . . . . . . . . . . . . . . . . . . . . . . . . . 4,487 41 444 620 1,462 938 514 330 112 2616 - 20 . . . . . . . . . . . . . . . . . . . . . . . . . . . . . 4,705 52 519 716 1,553 882 504 334 131 1421 or Mores . . . . . . . . . . . . . . . . . . . . . . . . . 2,102 42 250 317 646 375 240 153 72 7Unknown . . . . . . . . . . . . . . . . . . . . . . . . . . . 1,107 3 55 82 289 270 189 139 71 9
Type of Termination Procedure Suction Curettage . . . . . . . . . . . . . . . . . . . . . 67,389 290 3,917 6,160 19,155 16,861 11,392 6,813 2,504 297Sharp Curettage / D+C . . . . . . . . . . . . . . . . . 1,856 7 82 151 463 430 322 251 128 22Dilatation and Evacuation . . . . . . . . . . . . . . . 10,629 131 1,155 1,587 3,462 2,049 1,158 760 284 43Intrauterine Instillation . . . . . . . . . . . . . . . . . 15 – – – 2 3 4 4 1 1Hysterotomy / Hysterectomy . . . . . . . . . . . . . 3 – – – – 1 2 – – –Medical (Non-Surgical) . . . . . . . . . . . . . . . . . 8,619 22 373 719 2,656 2,333 1,437 746 284 49Other . . . . . . . . . . . . . . . . . . . . . . . . . . . . . . 8 – – 1 – 2 3 – 2 –Unknown . . . . . . . . . . . . . . . . . . . . . . . . . . . 950 7 54 77 260 270 141 91 44 6
See Technical Notes: Induced and Spontaneous Terminations of Pregnancy.
Table 29a. Induced Terminations of Pregnancy by Woman's Marital Status, Age, and Ethnic GroupNew York City, 1999-2008
1999 2000 2001 2002 2003 2004 2005 2006 2007 2008Marital Status (percent) Married . . . . . . . . . . . . . . . . . . 17.9 16.4 15.8 15.8 15.9 14.7 14.3 14.2 13.9 14.2 Not Married . . . . . . . . . . . . . . . 79.3 81.0 81.6 82.2 82.1 82.1 83.0 83.6 83.6 83.3 Unknown . . . . . . . . . . . . . . . . 2.9 2.6 2.6 2.0 2.0 3.2 2.7 2.2 2.5 2.6Age of Woman in Years <15 . . . . . . . . . . . . . . . . . . . . 672 601 564 506 518 550 524 472 470 457 15 - 19 . . . . . . . . . . . . . . . . . . . 16,525 15,497 14,999 14,706 14,487 14,917 14,838 15,058 14,844 14,276 20 - 24 . . . . . . . . . . . . . . . . . . . 29,857 27,799 27,100 27,076 26,815 27,159 25,905 26,105 26,529 25,998 25 - 29 . . . . . . . . . . . . . . . . . . . 24,758 22,502 21,549 21,790 21,748 22,038 21,483 22,303 22,389 21,949 30 - 34 . . . . . . . . . . . . . . . . . . . 17,337 15,735 15,376 15,285 14,833 14,692 14,036 14,183 14,171 14,459 35 - 39 . . . . . . . . . . . . . . . . . . . 9,875 9,193 8,981 8,989 8,930 8,893 8,594 8,538 8,802 8,665 40+ . . . . . . . . . . . . . . . . . . . . . 3,138 2,953 2,922 3,126 3,166 3,148 3,156 3,119 3,242 3,247 Unknown . . . . . . . . . . . . . . . . 172 186 301 322 323 276 355 379 423 418Ethnic Group Hispanic . . . . . . . . . . . . . . . . . 32,826 31,118 29,684 30,098 29,953 27,946 27,210 29,678 28,896 28,921 Asian and Pacific Islander . . . . 4,969 4,873 4,977 5,097 5,341 4,811 4,354 4,959 5,444 5,557 Non-Hispanic White . . . . . . . . 11,833 10,438 10,220 9,903 9,779 9,426 9,804 9,781 10,221 10,451 Non-Hispanic Black . . . . . . . . . 48,245 45,150 44,213 43,912 41,961 39,847 40,227 42,289 42,814 41,857 Other . . . . . . . . . . . . . . . . . . . . 749 532 603 526 597 646 541 635 518 396 Unknown . . . . . . . . . . . . . . . . 3,712 2,355 2,095 2,264 3,189 8,997 6,755 2,815 2,977 2,287Total . . . . . . . . . . . . . . . . . . . . . . 102,334 94,466 91,792 91,800 90,820 91,673 88,891 90,157 90,870 89,469
See Technical Notes: Induced and Spontaneous Terminations of Pregnancy.

46
Table 30. Live Births by Ancestry of Mother and Borough of Residence, New York City, 2008
Borough of ResidenceStaten Non- Residence
Ancestry of Mother Total Manhattan Bronx Brooklyn Queens Island Residents Unknown
Total . . . . . . . . . . . . . . . . . . . . . . . . . . . . . . . . . . . . . . . 127,680 20,160 21,807 41,286 27,943 5,730 10,753 1
Puerto Rican . . . . . . . . . . . . . . . . . . . . . . . . . . . . . . . . . 10,351 1,293 4,509 2,443 1,198 505 402 1Dominican . . . . . . . . . . . . . . . . . . . . . . . . . . . . . . . . . . 10,716 2,570 4,553 1,601 1,477 92 423 –Colombian . . . . . . . . . . . . . . . . . . . . . . . . . . . . . . . . . . 1,317 113 74 130 843 38 119 –Ecuadorian . . . . . . . . . . . . . . . . . . . . . . . . . . . . . . . . . . 3,535 244 475 607 2,050 51 108 –Mexican . . . . . . . . . . . . . . . . . . . . . . . . . . . . . . . . . . . . 8,662 959 1,975 2,608 2,477 544 99 –Cuban . . . . . . . . . . . . . . . . . . . . . . . . . . . . . . . . . . . . . 346 75 87 49 64 15 56 –Other Hispanic . . . . . . . . . . . . . . . . . . . . . . . . . . . . . . . 5,453 562 1,108 1,376 1,863 159 385 –
African American . . . . . . . . . . . . . . . . . . . . . . . . . . . . . 15,077 1,596 3,477 6,691 2,180 490 643 –American . . . . . . . . . . . . . . . . . . . . . . . . . . . . . . . . . . . 10,070 2,275 393 3,801 1,389 654 1,558 –Guyanese . . . . . . . . . . . . . . . . . . . . . . . . . . . . . . . . . . . 1,689 20 148 483 962 11 65 –Haitian . . . . . . . . . . . . . . . . . . . . . . . . . . . . . . . . . . . . . 1,653 72 35 1,012 382 16 136 –Jamaican . . . . . . . . . . . . . . . . . . . . . . . . . . . . . . . . . . . 2,159 50 520 860 596 13 120 –Trinidadian . . . . . . . . . . . . . . . . . . . . . . . . . . . . . . . . . . 842 21 38 491 249 13 30 –Other North, Central, and South American . . . . . . . . . 2,084 186 267 1,034 419 31 147 –
English . . . . . . . . . . . . . . . . . . . . . . . . . . . . . . . . . . . . . 919 435 19 248 67 12 138 –German . . . . . . . . . . . . . . . . . . . . . . . . . . . . . . . . . . . . 1,108 444 31 210 146 51 226 –Irish . . . . . . . . . . . . . . . . . . . . . . . . . . . . . . . . . . . . . . . 2,316 597 92 425 346 243 613 –Italian . . . . . . . . . . . . . . . . . . . . . . . . . . . . . . . . . . . . . . 4,184 577 167 842 543 1,161 894 –Polish . . . . . . . . . . . . . . . . . . . . . . . . . . . . . . . . . . . . . . 1,398 186 15 404 516 103 174 –Russian . . . . . . . . . . . . . . . . . . . . . . . . . . . . . . . . . . . . . 1,788 341 34 723 329 141 220 –Other European . . . . . . . . . . . . . . . . . . . . . . . . . . . . . . 4,847 1,164 313 1,485 916 316 653 –
Asian Indian . . . . . . . . . . . . . . . . . . . . . . . . . . . . . . . . . 2,191 325 95 200 1,092 50 429 –Bangladeshi . . . . . . . . . . . . . . . . . . . . . . . . . . . . . . . . . 1,541 50 204 371 881 11 24 –Chinese . . . . . . . . . . . . . . . . . . . . . . . . . . . . . . . . . . . . 8,291 1,672 104 3,557 2,413 134 411 –Filipino . . . . . . . . . . . . . . . . . . . . . . . . . . . . . . . . . . . . . 943 137 61 129 407 61 148 –Korean . . . . . . . . . . . . . . . . . . . . . . . . . . . . . . . . . . . . . 1,194 285 19 107 582 29 172 –Pakistani. . . . . . . . . . . . . . . . . . . . . . . . . . . . . . . . . . . . 1,323 56 67 591 436 64 109 –Other Asian . . . . . . . . . . . . . . . . . . . . . . . . . . . . . . . . . 4,634 895 243 1,593 1,311 208 384 –
Jewish or Hebrew. . . . . . . . . . . . . . . . . . . . . . . . . . . . . 7,188 642 88 5,189 352 135 782 –Other or Not Stated . . . . . . . . . . . . . . . . . . . . . . . . . . . 9,861 2,318 2,596 2,026 1,457 379 1,085 –
Note: See Technical Notes: Race, Ancestry, Ethnic Group, and Birthplace.
Table 31. Live Births by Mother's Ethnic Group and Age New York City, 2008
Age of Mother in Years Under 40 &
Ethnic Group Total 15 15-17 18-19 20-24 25-29 30-34 35-39 Over Not Stated
Total . . . . . . . . . . . . . . . . . . . . . . . . . . . . . . . 127,680 113 2,538 5,772 25,523 33,210 33,661 20,829 6,034 0
Puerto Rican . . . . . . . . . . . . . . . . . . . . . . . . . 10,351 18 519 1,125 3,038 2,646 1,835 916 254 –Other Hispanic. . . . . . . . . . . . . . . . . . . . . . . . 30,029 48 991 2,067 7,632 8,366 6,449 3,520 956 –Asian and Pacific Islander . . . . . . . . . . . . . . . 18,204 – 41 159 2,459 5,840 5,783 3,216 706 –Non-Hispanic White. . . . . . . . . . . . . . . . . . . . 38,383 2 109 477 5,116 8,367 12,752 8,861 2,699 –Non-Hispanic Black. . . . . . . . . . . . . . . . . . . . 27,917 43 840 1,844 6,770 7,295 6,079 3,789 1,257 –Non-Hispanic Other. . . . . . . . . . . . . . . . . . . . 493 – 11 21 112 143 120 61 25 –Non-Hispanic of Two or More Races . . . . . . . 2,055 2 23 65 345 494 587 415 124 –Not Stated . . . . . . . . . . . . . . . . . . . . . . . . . . . 248 – 4 14 51 59 56 51 13 –
Note: See Technical Notes: Births, Changes to Items Reported in the Summary.
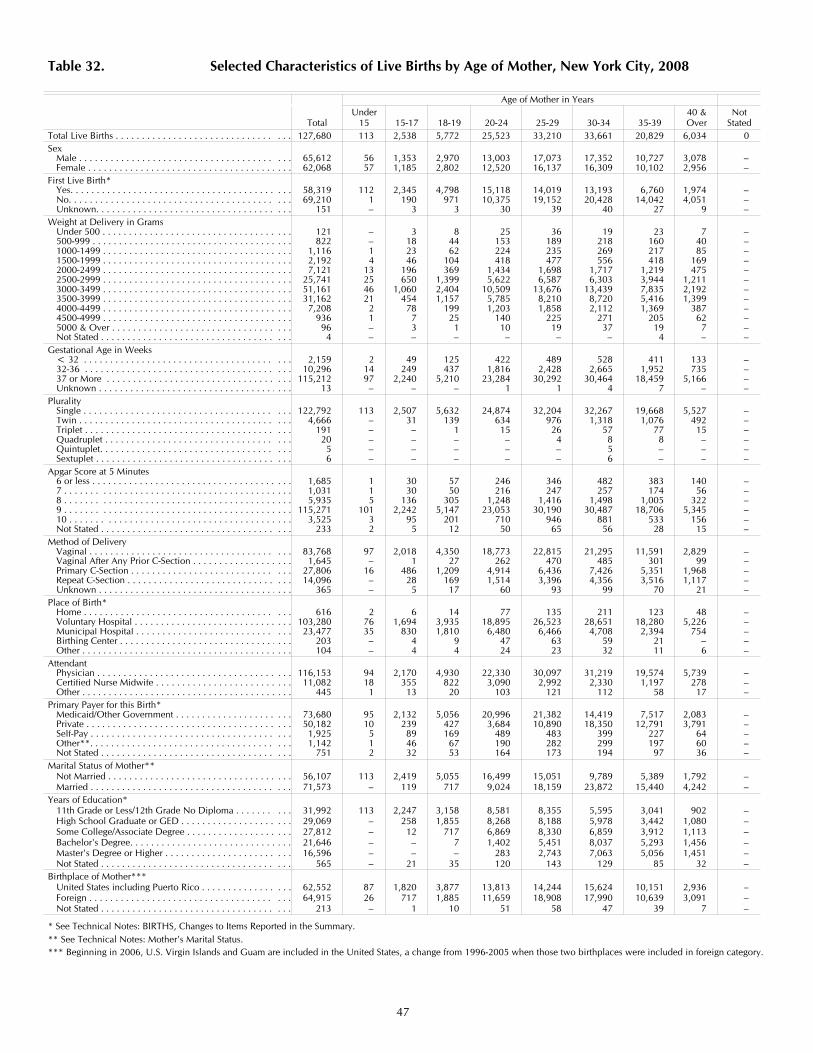
47
Table 32. Selected Characteristics of Live Births by Age of Mother, New York City, 2008
Age of Mother in Years Under 40 & Not
Total 15 15-17 18-19 20-24 25-29 30-34 35-39 Over StatedTotal Live Births . . . . . . . . . . . . . . . . . . . . . . . . . . . . . . . . . 127,680 113 2,538 5,772 25,523 33,210 33,661 20,829 6,034 0Sex
Male . . . . . . . . . . . . . . . . . . . . . . . . . . . . . . . . . . . . . . . . 65,612 56 1,353 2,970 13,003 17,073 17,352 10,727 3,078 –Female . . . . . . . . . . . . . . . . . . . . . . . . . . . . . . . . . . . . . . . 62,068 57 1,185 2,802 12,520 16,137 16,309 10,102 2,956 –
First Live Birth* Yes. . . . . . . . . . . . . . . . . . . . . . . . . . . . . . . . . . . . . . . . . . 58,319 112 2,345 4,798 15,118 14,019 13,193 6,760 1,974 –No. . . . . . . . . . . . . . . . . . . . . . . . . . . . . . . . . . . . . . . . . . 69,210 1 190 971 10,375 19,152 20,428 14,042 4,051 –Unknown. . . . . . . . . . . . . . . . . . . . . . . . . . . . . . . . . . . . . 151 – 3 3 30 39 40 27 9 –
Weight at Delivery in Grams Under 500 . . . . . . . . . . . . . . . . . . . . . . . . . . . . . . . . . . . . 121 – 3 8 25 36 19 23 7 –500-999 . . . . . . . . . . . . . . . . . . . . . . . . . . . . . . . . . . . . . . 822 – 18 44 153 189 218 160 40 –1000-1499 . . . . . . . . . . . . . . . . . . . . . . . . . . . . . . . . . . . . 1,116 1 23 62 224 235 269 217 85 –1500-1999 . . . . . . . . . . . . . . . . . . . . . . . . . . . . . . . . . . . . 2,192 4 46 104 418 477 556 418 169 –2000-2499 . . . . . . . . . . . . . . . . . . . . . . . . . . . . . . . . . . . . 7,121 13 196 369 1,434 1,698 1,717 1,219 475 –2500-2999 . . . . . . . . . . . . . . . . . . . . . . . . . . . . . . . . . . . . 25,741 25 650 1,399 5,622 6,587 6,303 3,944 1,211 –3000-3499 . . . . . . . . . . . . . . . . . . . . . . . . . . . . . . . . . . . . 51,161 46 1,060 2,404 10,509 13,676 13,439 7,835 2,192 –3500-3999 . . . . . . . . . . . . . . . . . . . . . . . . . . . . . . . . . . . . 31,162 21 454 1,157 5,785 8,210 8,720 5,416 1,399 –4000-4499 . . . . . . . . . . . . . . . . . . . . . . . . . . . . . . . . . . . . 7,208 2 78 199 1,203 1,858 2,112 1,369 387 –4500-4999 . . . . . . . . . . . . . . . . . . . . . . . . . . . . . . . . . . . . 936 1 7 25 140 225 271 205 62 –5000 & Over . . . . . . . . . . . . . . . . . . . . . . . . . . . . . . . . . . 96 – 3 1 10 19 37 19 7 –Not Stated . . . . . . . . . . . . . . . . . . . . . . . . . . . . . . . . . . . . 4 – – – – – – 4 – –
Gestational Age in Weeks < 32 . . . . . . . . . . . . . . . . . . . . . . . . . . . . . . . . . . . . . . . 2,159 2 49 125 422 489 528 411 133 –32-36 . . . . . . . . . . . . . . . . . . . . . . . . . . . . . . . . . . . . . . . 10,296 14 249 437 1,816 2,428 2,665 1,952 735 –37 or More . . . . . . . . . . . . . . . . . . . . . . . . . . . . . . . . . . . 115,212 97 2,240 5,210 23,284 30,292 30,464 18,459 5,166 –Unknown . . . . . . . . . . . . . . . . . . . . . . . . . . . . . . . . . . . . . 13 – – – 1 1 4 7 – –
PluralitySingle . . . . . . . . . . . . . . . . . . . . . . . . . . . . . . . . . . . . . . . . 122,792 113 2,507 5,632 24,874 32,204 32,267 19,668 5,527 –Twin . . . . . . . . . . . . . . . . . . . . . . . . . . . . . . . . . . . . . . . . 4,666 – 31 139 634 976 1,318 1,076 492 –Triplet . . . . . . . . . . . . . . . . . . . . . . . . . . . . . . . . . . . . . . . 191 – – 1 15 26 57 77 15 –Quadruplet . . . . . . . . . . . . . . . . . . . . . . . . . . . . . . . . . . . 20 – – – – 4 8 8 – –Quintuplet. . . . . . . . . . . . . . . . . . . . . . . . . . . . . . . . . . . . 5 – – – – – 5 – – –Sextuplet . . . . . . . . . . . . . . . . . . . . . . . . . . . . . . . . . . . . . 6 – – – – – 6 – – –
Apgar Score at 5 Minutes6 or less . . . . . . . . . . . . . . . . . . . . . . . . . . . . . . . . . . . . . . 1,685 1 30 57 246 346 482 383 140 –7 . . . . . . . . . . . . . . . . . . . . . . . . . . . . . . . . . . . . . . . . . . . 1,031 1 30 50 216 247 257 174 56 –8 . . . . . . . . . . . . . . . . . . . . . . . . . . . . . . . . . . . . . . . . . . . 5,935 5 136 305 1,248 1,416 1,498 1,005 322 –9 . . . . . . . . . . . . . . . . . . . . . . . . . . . . . . . . . . . . . . . . . . . 115,271 101 2,242 5,147 23,053 30,190 30,487 18,706 5,345 –10 . . . . . . . . . . . . . . . . . . . . . . . . . . . . . . . . . . . . . . . . . . 3,525 3 95 201 710 946 881 533 156 –Not Stated . . . . . . . . . . . . . . . . . . . . . . . . . . . . . . . . . . . . 233 2 5 12 50 65 56 28 15 –
Method of DeliveryVaginal . . . . . . . . . . . . . . . . . . . . . . . . . . . . . . . . . . . . . . 83,768 97 2,018 4,350 18,773 22,815 21,295 11,591 2,829 –Vaginal After Any Prior C-Section . . . . . . . . . . . . . . . . . . . 1,645 – 1 27 262 470 485 301 99 –Primary C-Section . . . . . . . . . . . . . . . . . . . . . . . . . . . . . . . 27,806 16 486 1,209 4,914 6,436 7,426 5,351 1,968 –Repeat C-Section . . . . . . . . . . . . . . . . . . . . . . . . . . . . . . . 14,096 – 28 169 1,514 3,396 4,356 3,516 1,117 –Unknown . . . . . . . . . . . . . . . . . . . . . . . . . . . . . . . . . . . . . 365 – 5 17 60 93 99 70 21 –
Place of Birth* Home . . . . . . . . . . . . . . . . . . . . . . . . . . . . . . . . . . . . . . . 616 2 6 14 77 135 211 123 48 –Voluntary Hospital . . . . . . . . . . . . . . . . . . . . . . . . . . . . . . 103,280 76 1,694 3,935 18,895 26,523 28,651 18,280 5,226 –Municipal Hospital . . . . . . . . . . . . . . . . . . . . . . . . . . . . . . 23,477 35 830 1,810 6,480 6,466 4,708 2,394 754 –Birthing Center . . . . . . . . . . . . . . . . . . . . . . . . . . . . . . . . . 203 – 4 9 47 63 59 21 – –Other . . . . . . . . . . . . . . . . . . . . . . . . . . . . . . . . . . . . . . . . 104 – 4 4 24 23 32 11 6 –
Attendant Physician . . . . . . . . . . . . . . . . . . . . . . . . . . . . . . . . . . . . . 116,153 94 2,170 4,930 22,330 30,097 31,219 19,574 5,739 –Certified Nurse Midwife . . . . . . . . . . . . . . . . . . . . . . . . . . 11,082 18 355 822 3,090 2,992 2,330 1,197 278 –Other . . . . . . . . . . . . . . . . . . . . . . . . . . . . . . . . . . . . . . . . 445 1 13 20 103 121 112 58 17 –
Primary Payer for this Birth* Medicaid/Other Government . . . . . . . . . . . . . . . . . . . . . . 73,680 95 2,132 5,056 20,996 21,382 14,419 7,517 2,083 –Private . . . . . . . . . . . . . . . . . . . . . . . . . . . . . . . . . . . . . . . 50,182 10 239 427 3,684 10,890 18,350 12,791 3,791 –Self-Pay . . . . . . . . . . . . . . . . . . . . . . . . . . . . . . . . . . . . . . 1,925 5 89 169 489 483 399 227 64 –Other**. . . . . . . . . . . . . . . . . . . . . . . . . . . . . . . . . . . . . . 1,142 1 46 67 190 282 299 197 60 –Not Stated . . . . . . . . . . . . . . . . . . . . . . . . . . . . . . . . . . . . 751 2 32 53 164 173 194 97 36 –
Marital Status of Mother** Not Married . . . . . . . . . . . . . . . . . . . . . . . . . . . . . . . . . . . 56,107 113 2,419 5,055 16,499 15,051 9,789 5,389 1,792 –Married . . . . . . . . . . . . . . . . . . . . . . . . . . . . . . . . . . . . . . 71,573 – 119 717 9,024 18,159 23,872 15,440 4,242 –
Years of Education* 11th Grade or Less/12th Grade No Diploma . . . . . . . . . . . 31,992 113 2,247 3,158 8,581 8,355 5,595 3,041 902 –High School Graduate or GED . . . . . . . . . . . . . . . . . . . . . 29,069 – 258 1,855 8,268 8,188 5,978 3,442 1,080 –Some College/Associate Degree . . . . . . . . . . . . . . . . . . . . 27,812 – 12 717 6,869 8,330 6,859 3,912 1,113 –Bachelor's Degree. . . . . . . . . . . . . . . . . . . . . . . . . . . . . . . 21,646 – – 7 1,402 5,451 8,037 5,293 1,456 –Master's Degree or Higher . . . . . . . . . . . . . . . . . . . . . . . . 16,596 – – – 283 2,743 7,063 5,056 1,451 –Not Stated . . . . . . . . . . . . . . . . . . . . . . . . . . . . . . . . . . . . 565 – 21 35 120 143 129 85 32 –
Birthplace of Mother***United States including Puerto Rico . . . . . . . . . . . . . . . . . 62,552 87 1,820 3,877 13,813 14,244 15,624 10,151 2,936 –Foreign . . . . . . . . . . . . . . . . . . . . . . . . . . . . . . . . . . . . . . 64,915 26 717 1,885 11,659 18,908 17,990 10,639 3,091 –Not Stated . . . . . . . . . . . . . . . . . . . . . . . . . . . . . . . . . . . . 213 – 1 10 51 58 47 39 7 –
* See Technical Notes: BIRTHS, Changes to Items Reported in the Summary.** See Technical Notes: Mother's Marital Status.*** Beginning in 2006, U.S. Virgin Islands and Guam are included in the United States, a change from 1996-2005 when those two birthplaces were included in foreign category.
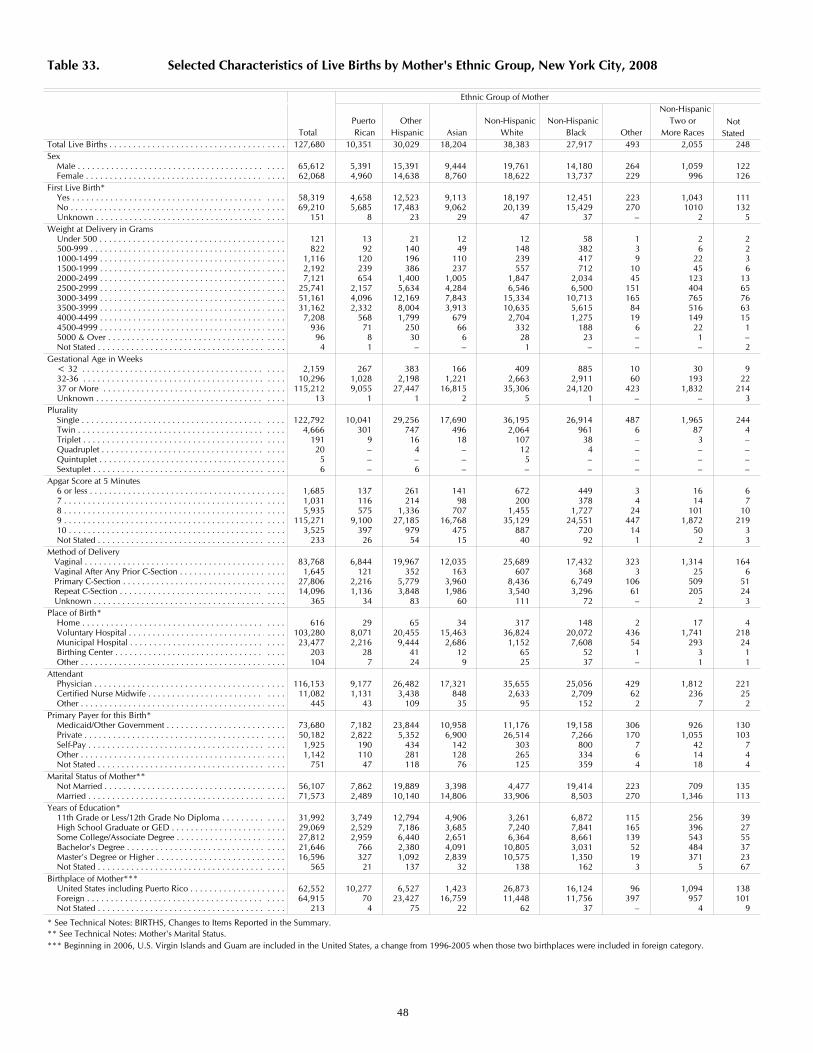
48
Table 33. Selected Characteristics of Live Births by Mother's Ethnic Group, New York City, 2008
Ethnic Group of Mother Non-Hispanic
Puerto Other Non-Hispanic Non-Hispanic Two or NotTotal Rican Hispanic Asian White Black Other More Races Stated
Total Live Births . . . . . . . . . . . . . . . . . . . . . . . . . . . . . . . . . . . . . 127,680 10,351 30,029 18,204 38,383 27,917 493 2,055 248Sex Male . . . . . . . . . . . . . . . . . . . . . . . . . . . . . . . . . . . . . . . . . . . 65,612 5,391 15,391 9,444 19,761 14,180 264 1,059 122 Female . . . . . . . . . . . . . . . . . . . . . . . . . . . . . . . . . . . . . . . . . . 62,068 4,960 14,638 8,760 18,622 13,737 229 996 126First Live Birth* Yes . . . . . . . . . . . . . . . . . . . . . . . . . . . . . . . . . . . . . . . . . . . . 58,319 4,658 12,523 9,113 18,197 12,451 223 1,043 111 No . . . . . . . . . . . . . . . . . . . . . . . . . . . . . . . . . . . . . . . . . . . . . 69,210 5,685 17,483 9,062 20,139 15,429 270 1010 132 Unknown . . . . . . . . . . . . . . . . . . . . . . . . . . . . . . . . . . . . . . . 151 8 23 29 47 37 – 2 5Weight at Delivery in Grams Under 500 . . . . . . . . . . . . . . . . . . . . . . . . . . . . . . . . . . . . . . . 121 13 21 12 12 58 1 2 2 500-999 . . . . . . . . . . . . . . . . . . . . . . . . . . . . . . . . . . . . . . . . . 822 92 140 49 148 382 3 6 2 1000-1499 . . . . . . . . . . . . . . . . . . . . . . . . . . . . . . . . . . . . . . . 1,116 120 196 110 239 417 9 22 3 1500-1999 . . . . . . . . . . . . . . . . . . . . . . . . . . . . . . . . . . . . . . . 2,192 239 386 237 557 712 10 45 6 2000-2499 . . . . . . . . . . . . . . . . . . . . . . . . . . . . . . . . . . . . . . . 7,121 654 1,400 1,005 1,847 2,034 45 123 13 2500-2999 . . . . . . . . . . . . . . . . . . . . . . . . . . . . . . . . . . . . . . . 25,741 2,157 5,634 4,284 6,546 6,500 151 404 65 3000-3499 . . . . . . . . . . . . . . . . . . . . . . . . . . . . . . . . . . . . . . . 51,161 4,096 12,169 7,843 15,334 10,713 165 765 76 3500-3999 . . . . . . . . . . . . . . . . . . . . . . . . . . . . . . . . . . . . . . . 31,162 2,332 8,004 3,913 10,635 5,615 84 516 63 4000-4499 . . . . . . . . . . . . . . . . . . . . . . . . . . . . . . . . . . . . . . . 7,208 568 1,799 679 2,704 1,275 19 149 15 4500-4999 . . . . . . . . . . . . . . . . . . . . . . . . . . . . . . . . . . . . . . . 936 71 250 66 332 188 6 22 1 5000 & Over . . . . . . . . . . . . . . . . . . . . . . . . . . . . . . . . . . . . . 96 8 30 6 28 23 – 1 – Not Stated . . . . . . . . . . . . . . . . . . . . . . . . . . . . . . . . . . . . . . . 4 1 – – 1 – – – 2Gestational Age in Weeks < 32 . . . . . . . . . . . . . . . . . . . . . . . . . . . . . . . . . . . . . . . . . . 2,159 267 383 166 409 885 10 30 9 32-36 . . . . . . . . . . . . . . . . . . . . . . . . . . . . . . . . . . . . . . . . . . 10,296 1,028 2,198 1,221 2,663 2,911 60 193 22 37 or More . . . . . . . . . . . . . . . . . . . . . . . . . . . . . . . . . . . . . . 115,212 9,055 27,447 16,815 35,306 24,120 423 1,832 214 Unknown . . . . . . . . . . . . . . . . . . . . . . . . . . . . . . . . . . . . . . . 13 1 1 2 5 1 – – 3Plurality Single . . . . . . . . . . . . . . . . . . . . . . . . . . . . . . . . . . . . . . . . . . 122,792 10,041 29,256 17,690 36,195 26,914 487 1,965 244 Twin . . . . . . . . . . . . . . . . . . . . . . . . . . . . . . . . . . . . . . . . . . . 4,666 301 747 496 2,064 961 6 87 4 Triplet . . . . . . . . . . . . . . . . . . . . . . . . . . . . . . . . . . . . . . . . . . 191 9 16 18 107 38 – 3 – Quadruplet . . . . . . . . . . . . . . . . . . . . . . . . . . . . . . . . . . . . . . 20 – 4 – 12 4 – – – Quintuplet . . . . . . . . . . . . . . . . . . . . . . . . . . . . . . . . . . . . . . . 5 – – – 5 – – – – Sextuplet . . . . . . . . . . . . . . . . . . . . . . . . . . . . . . . . . . . . . . . . 6 – 6 – – – – – –Apgar Score at 5 Minutes 6 or less . . . . . . . . . . . . . . . . . . . . . . . . . . . . . . . . . . . . . . . . . 1,685 137 261 141 672 449 3 16 6 7 . . . . . . . . . . . . . . . . . . . . . . . . . . . . . . . . . . . . . . . . . . . . . . 1,031 116 214 98 200 378 4 14 7 8 . . . . . . . . . . . . . . . . . . . . . . . . . . . . . . . . . . . . . . . . . . . . . . 5,935 575 1,336 707 1,455 1,727 24 101 10 9 . . . . . . . . . . . . . . . . . . . . . . . . . . . . . . . . . . . . . . . . . . . . . . 115,271 9,100 27,185 16,768 35,129 24,551 447 1,872 219 10 . . . . . . . . . . . . . . . . . . . . . . . . . . . . . . . . . . . . . . . . . . . . . 3,525 397 979 475 887 720 14 50 3 Not Stated . . . . . . . . . . . . . . . . . . . . . . . . . . . . . . . . . . . . . . . 233 26 54 15 40 92 1 2 3Method of Delivery Vaginal . . . . . . . . . . . . . . . . . . . . . . . . . . . . . . . . . . . . . . . . . . 83,768 6,844 19,967 12,035 25,689 17,432 323 1,314 164 Vaginal After Any Prior C-Section . . . . . . . . . . . . . . . . . . . . . . 1,645 121 352 163 607 368 3 25 6 Primary C-Section . . . . . . . . . . . . . . . . . . . . . . . . . . . . . . . . . . 27,806 2,216 5,779 3,960 8,436 6,749 106 509 51 Repeat C-Section . . . . . . . . . . . . . . . . . . . . . . . . . . . . . . . . . . . 14,096 1,136 3,848 1,986 3,540 3,296 61 205 24 Unknown . . . . . . . . . . . . . . . . . . . . . . . . . . . . . . . . . . . . . . . . 365 34 83 60 111 72 – 2 3Place of Birth* Home . . . . . . . . . . . . . . . . . . . . . . . . . . . . . . . . . . . . . . . . . . 616 29 65 34 317 148 2 17 4 Voluntary Hospital . . . . . . . . . . . . . . . . . . . . . . . . . . . . . . . . . 103,280 8,071 20,455 15,463 36,824 20,072 436 1,741 218 Municipal Hospital . . . . . . . . . . . . . . . . . . . . . . . . . . . . . . . . 23,477 2,216 9,444 2,686 1,152 7,608 54 293 24 Birthing Center . . . . . . . . . . . . . . . . . . . . . . . . . . . . . . . . . . . 203 28 41 12 65 52 1 3 1 Other . . . . . . . . . . . . . . . . . . . . . . . . . . . . . . . . . . . . . . . . . . . 104 7 24 9 25 37 – 1 1Attendant Physician . . . . . . . . . . . . . . . . . . . . . . . . . . . . . . . . . . . . . . . . 116,153 9,177 26,482 17,321 35,655 25,056 429 1,812 221 Certified Nurse Midwife . . . . . . . . . . . . . . . . . . . . . . . . . . . . . 11,082 1,131 3,438 848 2,633 2,709 62 236 25 Other . . . . . . . . . . . . . . . . . . . . . . . . . . . . . . . . . . . . . . . . . . . 445 43 109 35 95 152 2 7 2Primary Payer for this Birth* Medicaid/Other Government . . . . . . . . . . . . . . . . . . . . . . . . . 73,680 7,182 23,844 10,958 11,176 19,158 306 926 130 Private . . . . . . . . . . . . . . . . . . . . . . . . . . . . . . . . . . . . . . . . . . 50,182 2,822 5,352 6,900 26,514 7,266 170 1,055 103 Self-Pay . . . . . . . . . . . . . . . . . . . . . . . . . . . . . . . . . . . . . . . . . 1,925 190 434 142 303 800 7 42 7 Other . . . . . . . . . . . . . . . . . . . . . . . . . . . . . . . . . . . . . . . . . . . 1,142 110 281 128 265 334 6 14 4 Not Stated . . . . . . . . . . . . . . . . . . . . . . . . . . . . . . . . . . . . . . . 751 47 118 76 125 359 4 18 4Marital Status of Mother** Not Married . . . . . . . . . . . . . . . . . . . . . . . . . . . . . . . . . . . . . . 56,107 7,862 19,889 3,398 4,477 19,414 223 709 135 Married . . . . . . . . . . . . . . . . . . . . . . . . . . . . . . . . . . . . . . . . . 71,573 2,489 10,140 14,806 33,906 8,503 270 1,346 113Years of Education* 11th Grade or Less/12th Grade No Diploma . . . . . . . . . . . . . 31,992 3,749 12,794 4,906 3,261 6,872 115 256 39 High School Graduate or GED . . . . . . . . . . . . . . . . . . . . . . . . 29,069 2,529 7,186 3,685 7,240 7,841 165 396 27 Some College/Associate Degree . . . . . . . . . . . . . . . . . . . . . . . 27,812 2,959 6,440 2,651 6,364 8,661 139 543 55 Bachelor's Degree . . . . . . . . . . . . . . . . . . . . . . . . . . . . . . . . . 21,646 766 2,380 4,091 10,805 3,031 52 484 37 Master's Degree or Higher . . . . . . . . . . . . . . . . . . . . . . . . . . . 16,596 327 1,092 2,839 10,575 1,350 19 371 23 Not Stated . . . . . . . . . . . . . . . . . . . . . . . . . . . . . . . . . . . . . . . 565 21 137 32 138 162 3 5 67Birthplace of Mother*** United States including Puerto Rico . . . . . . . . . . . . . . . . . . . . 62,552 10,277 6,527 1,423 26,873 16,124 96 1,094 138 Foreign . . . . . . . . . . . . . . . . . . . . . . . . . . . . . . . . . . . . . . . . . 64,915 70 23,427 16,759 11,448 11,756 397 957 101 Not Stated . . . . . . . . . . . . . . . . . . . . . . . . . . . . . . . . . . . . . . . 213 4 75 22 62 37 – 4 9
* See Technical Notes: BIRTHS, Changes to Items Reported in the Summary.** See Technical Notes: Mother's Marital Status.*** Beginning in 2006, U.S. Virgin Islands and Guam are included in the United States, a change from 1996-2005 when those two birthplaces were included in foreign category.
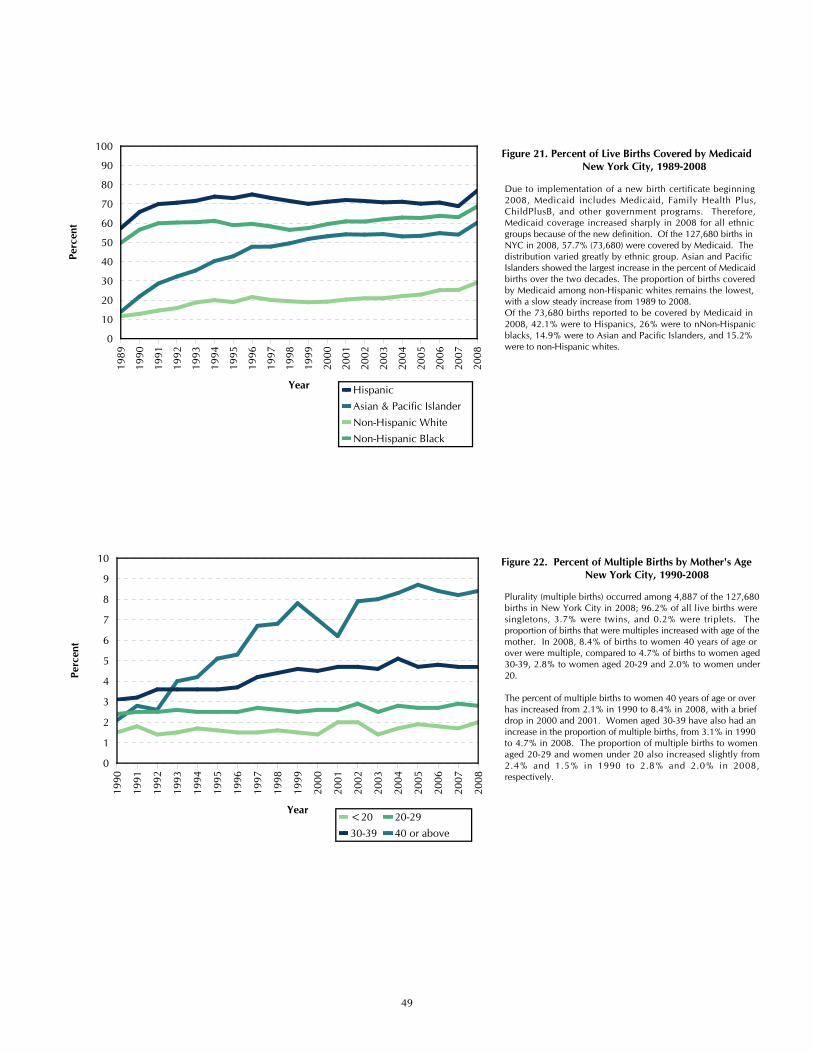
49
Figure 21. Percent of Live Births Covered by Medicaid New York City, 1989-2008
1989
1990
1991
1992
1993
1994
1995
1996
1997
1998
1999
2000
2001
2002
2003
2004
2005
2006
2007
2008
Year
0
10
20
30
40
50
60
70
80
90
100
Perc
e nt
Hispanic
Asian & Pacific Islander
Non-Hispanic WhiteNon-Hispanic Black
Figure 22. Percent of Multiple Births by Mother's Age New York City, 1990-2008
1990
1991
1992
1993
1994
1995
1996
1997
1998
1999
2000
2001
2002
2003
2004
2005
2006
2007
2008
Year
0
1
2
3
4
5
6
7
8
9
10
Perc
e nt
<20 20-29
30-39 40 or above
Due to implementation of a new birth certificate beginning 2008, Medicaid includes Medicaid, Family Health Plus, ChildPlusB, and other government programs. Therefore, Medicaid coverage increased sharply in 2008 for all ethnic groups because of the new definition. Of the 127,680 births in NYC in 2008, 57.7% (73,680) were covered by Medicaid. The distribution varied greatly by ethnic group. Asian and Pacific Islanders showed the largest increase in the percent of Medicaid births over the two decades. The proportion of births covered by Medicaid among non-Hispanic whites remains the lowest, with a slow steady increase from 1989 to 2008.Of the 73,680 births reported to be covered by Medicaid in 2008, 42.1% were to Hispanics, 26% were to nNon-Hispanic blacks, 14.9% were to Asian and Pacific Islanders, and 15.2% were to non-Hispanic whites.
Plurality (multiple births) occurred among 4,887 of the 127,680 births in New York City in 2008; 96.2% of all live births were singletons, 3.7% were twins, and 0.2% were triplets. The proportion of births that were multiples increased with age of the mother. In 2008, 8.4% of births to women 40 years of age or over were multiple, compared to 4.7% of births to women aged 30-39, 2.8% to women aged 20-29 and 2.0% to women under 20.
The percent of multiple births to women 40 years of age or over has increased from 2.1% in 1990 to 8.4% in 2008, with a brief drop in 2000 and 2001. Women aged 30-39 have also had an increase in the proportion of multiple births, from 3.1% in 1990 to 4.7% in 2008. The proportion of multiple births to women aged 20-29 and women under 20 also increased slightly from 2.4% and 1.5% in 1990 to 2.8% and 2.0% in 2008, respectively.

50
Table 34. Live Births by Selected Characteristics and Infant Deaths by Health Center District of Residence, New York City, 2008
Percent of Total Live Births with Specified Characteristics Infant NeonatalForeign- First Under Mother Pre- Mortality Mortality
Live Hispanic Born Live 2,500 Preterm Not On pregnancy (Under 1 Year) (Under 28 Days)Health Center District of Residence Births Mother Mother* Birth Grams Birth** Married Medicaid*** Obesity*** Number Rate # Number Rate #NEW YORK CITY EVENTS . . . . . . . . . . . . . . . 127,680 35.5 50.9 45.7 8.9 9.8 43.9 58.0 16.4 698 5.5 466 3.6MANHATTAN . . . . . . . . . . . . . . . . . . . . . . . . 20,160 33.0 43.7 55.7 8.7 8.8 35.8 39.8 11.4 93 4.6 67 3.3Central Harlem . . . . . . . . . . . . . . . . . . . . . . . 1,972 28.8 36.0 44.4 11.7 12.3 66.3 67.5 25.8 12 6.1 6 3.0East Harlem . . . . . . . . . . . . . . . . . . . . . . . . . . 2,003 50.9 39.3 48.0 9.9 11.1 56.3 59.6 20.5 12 6.0 6 3.0Kips Bay-Yorkville . . . . . . . . . . . . . . . . . . . . . 2,970 7.9 34.8 63.0 8.1 7.7 6.1 4.7 2.3 8 2.7 7 2.4Lower East Side . . . . . . . . . . . . . . . . . . . . . . . 2,894 21.1 55.0 55.8 6.9 7.6 34.8 54.5 8.7 14 4.8 10 3.5Lower West Side . . . . . . . . . . . . . . . . . . . . . . 4,148 11.7 40.2 64.5 9.0 8.5 15.2 13.7 4.1 15 3.6 11 2.7Riverside . . . . . . . . . . . . . . . . . . . . . . . . . . . . 2,450 23.9 33.8 56.5 8.3 7.7 23.7 24.0 8.5 16 6.5 13 5.3Washington Heights . . . . . . . . . . . . . . . . . . . 3,723 78.9 58.8 49.7 8.0 8.3 63.7 70.9 18.6 16 4.3 14 3.8BRONX . . . . . . . . . . . . . . . . . . . . . . . . . . . . . 21,807 62.9 49.1 43.4 10.1 10.5 70.6 76.9 23.0 138 6.3 97 4.4Fordham-Riverdale . . . . . . . . . . . . . . . . . . . . 4,123 68.4 52.1 44.5 8.8 10.0 62.5 71.1 19.9 27 6.5 21 5.1Morrisania . . . . . . . . . . . . . . . . . . . . . . . . . . . 3,412 64.4 48.2 38.9 11.3 11.2 76.8 82.9 24.8 27 7.9 18 5.3Mott Haven . . . . . . . . . . . . . . . . . . . . . . . . . . 2,536 73.5 43.6 40.2 9.6 9.9 80.6 86.5 23.7 18 7.1 12 4.7Pelham Bay . . . . . . . . . . . . . . . . . . . . . . . . . . 3,043 33.9 51.2 49.4 11.3 11.4 67.5 69.7 24.8 18 5.9 10 3.3Tremont . . . . . . . . . . . . . . . . . . . . . . . . . . . . 4,438 71.3 52.7 41.5 9.6 10.2 76.6 83.3 23.2 28 6.3 18 4.1Westchester . . . . . . . . . . . . . . . . . . . . . . . . . . 4,255 61.7 45.2 45.5 10.5 10.6 63.5 70.6 22.6 20 4.7 18 4.2BROOKLYN . . . . . . . . . . . . . . . . . . . . . . . . . 41,286 25.4 48.7 42.6 8.6 9.8 42.3 65.6 17.4 220 5.3 140 3.4Bay Ridge . . . . . . . . . . . . . . . . . . . . . . . . . . . 4,314 22.9 63.8 43.9 6.8 8.5 25.1 62.0 10.7 13 3.0 11 2.5Bedford . . . . . . . . . . . . . . . . . . . . . . . . . . . . . 3,607 14.1 40.4 42.8 12.0 12.8 60.9 72.6 25.9 24 6.7 19 5.3Brownsville . . . . . . . . . . . . . . . . . . . . . . . . . . 4,901 18.0 44.6 43.1 12.0 13.8 70.9 74.2 28.5 55 11.2 34 6.9Bushwick . . . . . . . . . . . . . . . . . . . . . . . . . . . 3,459 65.9 52.7 39.6 9.3 10.9 71.6 81.8 25.1 19 5.5 13 3.8Flatbush . . . . . . . . . . . . . . . . . . . . . . . . . . . . 8,040 16.0 53.9 40.6 9.5 10.5 40.5 61.2 19.4 41 5.1 23 2.9Fort Greene . . . . . . . . . . . . . . . . . . . . . . . . . . 2,508 21.9 28.7 50.4 8.6 9.9 43.4 49.8 16.6 21 8.4 10 4.0Gravesend . . . . . . . . . . . . . . . . . . . . . . . . . . . 3,836 20.7 63.9 44.3 8.2 9.4 32.1 60.3 13.2 15 3.9 10 2.6Red Hook-Gowanus . . . . . . . . . . . . . . . . . . . 1,711 18.4 27.2 60.7 7.5 8.4 22.9 22.4 9.0 8 4.7 5 2.9Sunset Park . . . . . . . . . . . . . . . . . . . . . . . . . . 5,615 30.3 57.7 39.4 5.3 5.9 26.9 76.8 8.4 14 2.5 9 1.6Williamsburg-Greenpoint . . . . . . . . . . . . . . . 3,295 34.5 21.1 36.2 5.9 6.6 22.9 65.9 13.2 10 3.0 6 1.8QUEENS . . . . . . . . . . . . . . . . . . . . . . . . . . . . 27,943 37.4 70.0 46.0 8.2 9.2 44.6 64.8 14.8 133 4.8 88 3.1Astoria-Long Island City . . . . . . . . . . . . . . . . . 3,051 38.1 67.2 52.0 7.2 8.3 37.2 58.1 13.3 14 4.6 12 3.9Corona . . . . . . . . . . . . . . . . . . . . . . . . . . . . . 6,179 66.5 85.9 43.5 7.3 8.1 55.3 82.0 12.6 21 3.4 15 2.4Flushing . . . . . . . . . . . . . . . . . . . . . . . . . . . . 4,808 18.9 74.4 45.7 6.9 8.2 26.7 56.8 8.5 23 4.8 16 3.3Jamaica East . . . . . . . . . . . . . . . . . . . . . . . . . 4,545 17.3 59.4 44.9 11.1 12.7 58.0 66.5 23.0 37 8.1 23 5.1Jamaica West . . . . . . . . . . . . . . . . . . . . . . . . . 5,716 36.7 62.2 44.6 9.4 10.0 50.0 66.5 18.4 27 4.7 16 2.8Maspeth-Forest Hills . . . . . . . . . . . . . . . . . . . 3,644 35.8 65.2 49.3 6.3 7.6 31.0 47.4 12.4 11 3.0 6 1.6RICHMOND . . . . . . . . . . . . . . . . . . . . . . . . . 5,730 26.1 35.9 41.1 8.3 9.8 34.0 39.9 18.8 17 3.0 11 1.9NEW YORK CITY RESIDENTS . . . . . . . . . . . . 116,926 37.0 52.4 45.7 8.8 9.6 46.6 61.9 16.9 601 5.1 403 3.4NON-RESIDENTS . . . . . . . . . . . . . . . . . . . . . 10,753 17.6 34.9 45.6 10.4 11.5 15.1 16.8 10.7 93 8.6 60 5.6RESIDENCE UNKNOWN . . . . . . . . . . . . . . . 1 – – – – – – – – 4 – 3 –Note: Borough totals may be higher than the sum of the health center districts, as they may include some live births whose health center district could not be determined.* Beginning in 2006, U.S. Virgin Islands and Guam are included in the United States, a change from 1996-2005 when those two birthplaces were included in foreign category. ** Clinical gestational age less than 37 completed weeks. *** See Technical Notes: BIRTHS, Changes to Items Reported in Summary.# Rate per 1,000 live births.
Table 35. Live Births by Selected Characteristics and Mother's Ancestry, New York City, 2008Percent of Total Live Births with Specified Characteristics
Foreign- First Under Pre- TeenageLive Born* Live 2,500 Preterm Mother On pregnancy Mother
Ancestry of Mother Births Mother Birth Grams Birth** Not Married Medicaid*** Obesity*** (Under 20)Total. . . . . . . . . . . . . . . . . . . . . . . . . . . . . . . . . . . . . . . . . 127,680 50.9 45.7 8.9 9.8 43.9 58.0 16.4 6.6Puerto Rican. . . . . . . . . . . . . . . . . . . . . . . . . . . . . . . . . . . . 10,351 0.7 45.0 10.8 12.5 76.0 69.7 28.0 16.1Dominican. . . . . . . . . . . . . . . . . . . . . . . . . . . . . . . . . . . . . 10,716 70.8 45.9 7.7 8.8 68.0 77.3 18.8 11.3Colombian. . . . . . . . . . . . . . . . . . . . . . . . . . . . . . . . . . . . . 1,317 74.4 50.8 6.5 8.0 49.1 57.6 12.4 7.8Ecuadorian. . . . . . . . . . . . . . . . . . . . . . . . . . . . . . . . . . . . . 3,535 85.0 37.5 5.6 7.7 56.3 82.3 15.0 7.9Mexican. . . . . . . . . . . . . . . . . . . . . . . . . . . . . . . . . . . . . . . 8,662 91.2 35.9 6.0 7.6 75.6 93.0 18.0 12.0Cuban. . . . . . . . . . . . . . . . . . . . . . . . . . . . . . . . . . . . . . . . 346 18.5 49.7 8.7 8.4 44.8 39.6 15.8 7.5Other Hispanic. . . . . . . . . . . . . . . . . . . . . . . . . . . . . . . . . . 5,453 72.5 42.9 9.0 10.5 59.7 69.6 18.7 8.2African American. . . . . . . . . . . . . . . . . . . . . . . . . . . . . . . . 15,077 16.9 45.3 13.8 14.1 75.9 68.2 30.8 12.4American. . . . . . . . . . . . . . . . . . . . . . . . . . . . . . . . . . . . . . 10,044 5.5 49.8 8.8 9.6 26.2 30.2 13.2 4.3Guyanese. . . . . . . . . . . . . . . . . . . . . . . . . . . . . . . . . . . . . . 1,689 93.7 43.9 14.6 14.7 44.3 61.5 16.3 5.4Haitian. . . . . . . . . . . . . . . . . . . . . . . . . . . . . . . . . . . . . . . . 1,653 80.9 45.6 11.1 13.4 45.9 63.7 25.0 3.0Jamaican. . . . . . . . . . . . . . . . . . . . . . . . . . . . . . . . . . . . . . 2,159 92.8 43.8 10.7 13.2 67.4 67.2 25.2 6.3Trinidadian. . . . . . . . . . . . . . . . . . . . . . . . . . . . . . . . . . . . . 842 95.1 49.8 12.6 14.5 60.3 70.5 22.7 4.8Other North, Central, and South American. . . . . . . . . . . . . 2,084 89.6 48.9 11.5 11.6 51.1 62.5 21.1 3.5English. . . . . . . . . . . . . . . . . . . . . . . . . . . . . . . . . . . . . . . . 919 26.6 63.6 7.0 7.8 10.2 7.7 5.2 0.2German. . . . . . . . . . . . . . . . . . . . . . . . . . . . . . . . . . . . . . . 1,108 23.1 61.8 7.7 8.1 12.4 7.6 5.4 0.1Irish. . . . . . . . . . . . . . . . . . . . . . . . . . . . . . . . . . . . . . . . . . 2,316 10.4 56.3 7.9 9.5 14.7 11.4 9.7 1.0Italian. . . . . . . . . . . . . . . . . . . . . . . . . . . . . . . . . . . . . . . . . 4,184 5.7 52.1 8.6 10.7 17.5 15.4 16.3 1.9Polish. . . . . . . . . . . . . . . . . . . . . . . . . . . . . . . . . . . . . . . . . 1,398 69.3 58.6 5.4 7.0 16.0 41.6 5.5 0.9Russian. . . . . . . . . . . . . . . . . . . . . . . . . . . . . . . . . . . . . . . . 1,788 74.7 54.2 6.2 6.0 19.0 31.3 6.5 0.7Other European. . . . . . . . . . . . . . . . . . . . . . . . . . . . . . . . . 4,847 61.0 53.8 6.8 7.6 13.2 27.4 7.5 0.8Asian Indian. . . . . . . . . . . . . . . . . . . . . . . . . . . . . . . . . . . . 2,191 89.5 53.6 10.8 9.8 10.5 37.7 7.1 1.2Bangladeshi. . . . . . . . . . . . . . . . . . . . . . . . . . . . . . . . . . . . 1,541 99.2 38.2 13.6 9.2 11.3 83.0 7.9 1.3Chinese. . . . . . . . . . . . . . . . . . . . . . . . . . . . . . . . . . . . . . . 8,291 93.4 50.9 5.3 6.0 24.7 71.3 1.9 0.7Filipino. . . . . . . . . . . . . . . . . . . . . . . . . . . . . . . . . . . . . . . 943 81.1 52.4 8.3 9.3 19.5 25.5 6.7 1.2Korean. . . . . . . . . . . . . . . . . . . . . . . . . . . . . . . . . . . . . . . . 1,194 85.8 57.2 5.1 5.3 10.0 34.6 1.5 0.2Pakistani. . . . . . . . . . . . . . . . . . . . . . . . . . . . . . . . . . . . . . . 1,323 94.1 37.4 8.7 9.2 5.6 76.6 13.3 2.3Other Asian. . . . . . . . . . . . . . . . . . . . . . . . . . . . . . . . . . . . 4,634 87.6 47.6 7.4 7.4 13.4 49.7 7.6 3.2Jewish or Hebrew. . . . . . . . . . . . . . . . . . . . . . . . . . . . . . . . 7,188 17.6 30.0 6.7 6.7 3.7 51.1 8.6 1.5Other or Not Stated. . . . . . . . . . . . . . . . . . . . . . . . . . . . . . 9,887 50.3 43.7 9.7 10.3 35.5 50.9 16.3 3.8Note: See Technical Notes: Race, Ancestry, Ethnic Group, and Birthplace.* Beginning in 2006, U.S. Virgin Islands and Guam are included in the United States, a change from 1996-2005 when those two birthplaces were included in foreign category. ** Clinical gestational age less than 37 completed weeks. .*** See Technical Notes: BIRTHS, Changes to Items Reported in Summary.

51
Table 36. Live Births by Selected Characteristics and Infant Deaths by Community District of Residence, New York City, 2008
Percent of Total Live Births With Specified Characteristics Infant Neonatal
Mortality MortalityForeign- First Under Mother Pre- (Under 1 Year) (Under 28 Days)
Live Hispanic Born Live 2,500 Preterm Not On pregnancyCommunity District of Residence Births Rate* Mother Mother ** Birth Grams Birth *** Married Medicaid# Obesity# Number Rate ## Number Rate ##NEW YORK CITY . . . . . . . . . . . . . . . 127,680 15.3 35.5 50.9 45.7 8.9 9.8 43.9 58.0 16.4 698 5.5 466 3.6MANHATTAN . . . . . . . . . . . . . . . . . . 20,040 12.3 32.7 43.7 55.8 8.7 8.7 35.6 39.6 11.3 93 4.6 67 3.3Battery Park, Tribeca (01). . . . . . . . . . 881 22.2 9.9 39.4 65.2 9.4 10.1 9.8 4.1 2.4 1 1.1 1 1.1Greenwich Village, SOHO (02). . . . . 890 8.5 6.4 40.3 64.7 8.4 7.9 14.5 14.3 1.4 7 7.9 6 6.7Lower East Side (03). . . . . . . . . . . . . . 2,215 12.2 23.5 62.1 52.2 6.7 7.9 42.8 71.3 10.2 14 6.3 10 4.5Chelsea, Clinton (04). . . . . . . . . . . . . 938 9.6 21.8 38.8 66.2 9.9 8.8 26.3 25.7 8.5 2 2.1 2 2.1Midtown Business District (05). . . . . . 564 11.7 7.8 44.8 65.9 8.0 8.7 13.5 11.0 3.8 3 5.3 2 3.5Murray Hill (06). . . . . . . . . . . . . . . . . 1,329 8.8 10.9 40.8 65.7 8.2 7.1 8.7 5.3 2.9 3 2.3 3 2.3Upper West Side (07). . . . . . . . . . . . . 2,789 12.1 16.8 32.6 59.3 8.5 7.4 15.0 13.7 5.8 9 3.2 6 2.2Upper East Side (08). . . . . . . . . . . . . . 2,762 11.2 8.1 33.2 62.1 7.9 7.7 6.8 5.9 2.6 7 2.5 4 1.4Manhattanville (09). . . . . . . . . . . . . . . 1,448 13.4 58.8 52.9 48.6 9.3 9.4 61.2 64.4 18.5 15 10.4 12 8.3Central Harlem (10). . . . . . . . . . . . . . 1,755 17.6 27.2 37.2 45.0 11.6 12.0 65.5 66.6 25.3 12 6.8 6 3.4East Harlem (11). . . . . . . . . . . . . . . . . 1,766 15.2 58.4 37.2 43.6 10.6 12.2 70.0 74.2 26.1 10 5.7 6 3.4Washington Heights (12). . . . . . . . . . 2,703 13.3 82.0 59.9 50.9 7.4 7.7 60.9 69.5 17.5 10 3.7 9 3.3BRONX . . . . . . . . . . . . . . . . . . . . . . . 21,927 15.8 63.0 49.1 43.4 10.1 10.5 70.6 76.9 23.0 138 6.3 97 4.4Mott Haven (01). . . . . . . . . . . . . . . . . 1,742 19.2 72.5 43.5 39.4 10.3 9.9 81.1 87.0 24.2 17 9.8 11 6.3Hunts Point (02). . . . . . . . . . . . . . . . . 990 19.3 75.2 39.7 38.9 9.6 11.0 81.0 86.1 22.9 4 4.0 3 3.0Morrisania (03). . . . . . . . . . . . . . . . . . 1,421 19.1 62.2 40.9 39.6 11.5 10.8 77.1 82.5 25.9 13 9.1 8 5.6Concourse, Highbridge (04). . . . . . . . 2,788 18.7 67.1 58.9 39.6 10.0 10.5 74.9 83.0 22.9 20 7.2 12 4.3University/Morris Heights (05). . . . . . 2,540 18.8 71.6 54.7 42.9 9.4 10.6 76.0 84.0 23.9 16 6.3 11 4.3East Tremont (06). . . . . . . . . . . . . . . . 1,478 18.0 70.3 40.8 39.3 11.2 11.1 78.8 84.2 23.2 12 8.1 10 6.8Fordham (07). . . . . . . . . . . . . . . . . . . 2,452 16.7 71.5 55.9 43.9 9.1 10.4 68.4 77.9 21.4 14 5.7 12 4.9Riverdale (08). . . . . . . . . . . . . . . . . . . 1,220 12.3 62.5 45.0 48.7 6.4 7.5 46.0 49.6 16.5 4 3.3 2 1.6Unionport, Soundview (09). . . . . . . . 2,730 15.2 64.6 45.0 45.3 10.5 10.5 70.5 77.2 23.8 8 2.9 7 2.6Throgs Neck (10). . . . . . . . . . . . . . . . 1,008 8.8 50.6 37.8 44.8 10.9 11.0 50.8 52.3 22.5 4 4.0 3 3.0Pelham Parkway (11). . . . . . . . . . . . . 1,475 13.4 50.0 52.4 46.6 10.1 10.3 55.7 65.7 20.1 8 5.4 8 5.4Williamsbridge (12). . . . . . . . . . . . . . 2,079 13.6 30.2 52.5 50.8 11.8 12.1 71.6 72.7 26.2 18 8.7 10 4.8BROOKLYN . . . . . . . . . . . . . . . . . . . 41,286 16.1 25.4 48.7 42.6 8.6 9.8 42.3 65.6 17.4 220 5.3 140 3.4Williamsburg, Greenpoint (01). . . . . . 3,295 19.1 34.5 21.1 36.2 5.9 6.6 22.9 65.9 13.2 10 3.0 6 1.8Fort Greene, Brooklyn Heights (02) . . 1,326 13.1 14.6 29.3 59.7 7.8 8.9 29.2 27.4 10.3 9 6.8 4 3.0Bedford Stuyvesant (03). . . . . . . . . . . 2,443 16.9 25.4 27.3 41.6 11.5 12.5 65.0 73.7 27.0 19 7.8 12 4.9Bushwick (04). . . . . . . . . . . . . . . . . . . 1,990 18.1 75.9 56.7 37.3 8.3 10.5 73.4 83.6 23.9 11 5.5 8 4.0East New York (05). . . . . . . . . . . . . . . 2,937 16.5 38.7 44.6 42.9 11.5 12.5 72.0 79.1 26.2 29 9.9 16 5.4Park Slope (06). . . . . . . . . . . . . . . . . . 1,672 15.4 17.4 26.0 59.9 7.1 8.4 22.4 20.2 8.8 9 5.4 6 3.6Sunset Park (07). . . . . . . . . . . . . . . . . 2,994 23.6 38.2 78.5 47.2 6.0 6.7 42.8 80.1 8.9 7 2.3 5 1.7Crown Heights North (08). . . . . . . . . 1,459 15.3 14.2 38.8 47.3 11.1 12.6 59.8 63.5 24.2 10 6.9 7 4.8Crown Heights South (09). . . . . . . . . 1,710 16.6 11.7 52.3 44.5 9.3 9.6 45.4 68.2 19.7 9 5.3 5 2.9Bay Ridge (10). . . . . . . . . . . . . . . . . . 1,736 13.2 21.1 60.6 46.8 7.9 8.9 22.1 52.4 11.0 5 2.9 4 2.3Bensonhurst (11). . . . . . . . . . . . . . . . . 2,308 12.3 22.5 73.2 45.7 6.3 8.8 28.9 63.2 11.1 10 4.3 8 3.5Borough Park (12). . . . . . . . . . . . . . . . 5,126 25.9 19.3 41.5 31.2 5.5 6.0 14.8 72.7 9.5 11 2.1 6 1.2Coney Island (13). . . . . . . . . . . . . . . . 1,211 10.7 29.0 61.3 46.0 9.4 9.9 47.1 70.6 16.4 4 3.3 3 2.5Flatbush, Midwood (14). . . . . . . . . . . 2,707 15.8 23.1 58.6 40.8 9.4 11.0 41.5 63.7 18.3 16 5.9 8 3.0Sheepshead Bay (15). . . . . . . . . . . . . 1,969 11.5 12.9 61.6 42.5 8.3 9.1 22.5 51.5 11.4 10 5.1 7 3.6Brownsville (16). . . . . . . . . . . . . . . . . 1,508 17.7 19.7 32.6 42.1 13.6 14.9 79.7 80.8 31.9 17 11.3 14 9.3East Flatbush (17). . . . . . . . . . . . . . . . 2,301 14.2 7.5 64.1 45.7 11.8 13.1 67.1 72.4 29.9 16 7.0 12 5.2Canarsie (18). . . . . . . . . . . . . . . . . . . 2,592 13.2 10.0 50.6 41.2 10.5 13.1 45.1 53.6 23.4 18 6.9 9 3.5QUEENS . . . . . . . . . . . . . . . . . . . . . . 27,943 12.2 37.4 70.0 46.0 8.2 9.2 44.6 64.8 14.8 133 4.8 88 3.1Astoria, Long Island City (01). . . . . . . 2,044 9.7 34.4 62.5 51.6 7.8 9.0 37.3 57.5 15.5 10 4.9 10 4.9Sunnyside, Woodside (02). . . . . . . . . 1,526 13.2 44.4 77.7 51.1 6.2 7.3 38.0 63.0 9.0 6 3.9 4 2.6Jackson Heights (03). . . . . . . . . . . . . . 2,845 15.6 75.6 83.4 42.9 7.6 8.5 58.7 82.2 12.7 12 4.2 9 3.2Elmhurst, Corona (04). . . . . . . . . . . . . 2,919 15.9 60.6 89.4 43.4 7.2 7.6 54.1 83.3 12.9 8 2.7 4 1.4Ridgewood, Glendale (05). . . . . . . . . 2,227 13.7 47.5 61.5 46.0 6.2 8.0 38.7 57.8 15.4 6 2.7 5 2.2Rego Park, Forest Hills (06). . . . . . . . 1,241 10.7 14.6 70.6 54.5 6.5 7.0 17.6 28.7 7.3 3 2.4 - -Flushing (07). . . . . . . . . . . . . . . . . . . . 2,736 10.4 21.0 81.2 47.0 6.5 7.6 30.6 66.6 7.1 9 3.3 7 2.6Fresh Meadows, Briarwood (08). . . . . 1,732 11.5 19.6 68.3 44.4 7.9 9.2 27.4 50.1 11.5 14 8.1 9 5.2Woodhaven (09). . . . . . . . . . . . . . . . . 2,038 13.9 48.0 72.7 46.8 8.0 8.5 47.1 69.2 16.4 8 3.9 4 2.0Howard Beach (10). . . . . . . . . . . . . . . 1,567 12.1 28.4 67.1 46.4 10.6 10.9 45.5 61.6 16.5 8 5.1 5 3.2Bayside (11). . . . . . . . . . . . . . . . . . . . 676 5.7 13.8 66.6 46.7 5.5 6.8 16.7 39.1 7.9 2 3.0 1 1.5Jamaica, St. Albans (12). . . . . . . . . . . 3,113 13.9 23.4 58.4 44.7 11.4 12.2 61.9 71.5 23.5 26 8.4 17 5.5Queens Village (13). . . . . . . . . . . . . . 1,848 9.5 12.9 62.9 45.4 10.9 13.1 49.9 57.8 21.7 14 7.6 8 4.3The Rockaways (14). . . . . . . . . . . . . . 1,422 13.1 28.4 35.7 38.2 9.8 11.7 58.9 66.5 24.6 7 4.9 5 3.5STATEN ISLAND . . . . . . . . . . . . . . . . 5,730 11.8 26.1 35.9 41.1 8.3 9.8 34.0 39.9 18.8 17 3.0 11 1.9Port Richmond (01). . . . . . . . . . . . . . 2,561 13.8 39.0 42.1 40.7 8.4 10.6 51.2 55.2 22.3 10 3.9 7 2.7Willowbrook, South Beach (02). . . . . 1,492 10.7 20.2 42.8 42.9 8.2 8.6 25.8 36.7 16.0 3 2.0 2 1.3Tottenville (03). . . . . . . . . . . . . . . . . . 1,661 10.2 10.8 20.3 40.0 8.4 9.7 15.1 19.2 15.8 4 2.4 2 1.2
Note: Borough totals may be higher than the sum of the community districts, as they may include some live births whose community district could not be determined.* Rate per 1,000 population. For population information, see Technical Notes: Demographics, Population.** Beginning in 2006, U.S. Virgin Islands and Guam are included in the United States, a change from 1996-2005 when those two birthplaces were included in foreign category.*** Clinical gestational age less than 37 completed weeks. # See Technical Notes: BIRTHS, Changes to Items Reported in Summary.## Rate per 1,000 live births.

52
Nearly forty-four percent of births in New York City in 2008 were to women who were not married. The distribution among New York City boroughs was 70.6% in the Bronx, 44.6% in Queens, 42.3% in Brooklyn, 35.6% in Manhattan, and 34.0% in Staten Island.
Community districts in the highest quintile of births to non-married women were Mott Haven at 81.1%, fol-lowed by Hunts Point at 81.0%, Brownsville at 79.7%, East Tremont at 78.8%, Morrisania at 77.1%, University Heights, Morris Heights at 76.0%, Concourse, High-bridge at 74.9%, Bushwick at 73.4%, East New York at 72.0%, and Williamsbridge at 71.6%.
Only three community districts had less than 10% of their births to non-married mothers: Upper East Side at 6.8%, Murray Hill at 8.7%, and Battery Park, Tribeca at 9.8%.
See Table 36 on page 51 for additional rates.
Map 1. Percent of Live Births to Non-married Mothers by Community District of Residence
New York City, 2008% Live Births toNon-married Mothersby Community DistrictNew York City, 2008
70.1 - 81.154.2 - 70.041.6 - 54.122.5 - 41.56.8 - 22.4
Fifty-one percent of live births in New York City in 2008 were to foreign-born women. The distribution among New York City boroughs was 70.0% in Queens, 49.1% in the Bronx, 48.7% in Brooklyn, 43.7% in Manhattan, and 35.9% in Staten Island.
Community districts in the highest quintile of births to foreign-born women were Elmhurst, Corona at 89.4%, followed by Jackson Heights at 83.4%, Flushing at 81.2%, Sunset Park at 78.5%, Sunnyside, Woodside at 77.7%, Bensonhurst at 73.2%, Woodhaven at 72.7%, Rego Park, Forest Hills at 70.6%, Fresh Meadows, Briar-wood at 68.3%, Howard Beach at 67.1%, and Bayside at 66.6%.
Five community districts had less than 30% of their births to foreign-born women: Tottenville at 20.3%, Williamsburg, Greenpoint at 21.1%, Park Slope at 26.0%, Bedford Stuyvesant at 27.3%, and Fort Greene at 29.3%.
See Table 36 on page 51 for additional rates.
Map 2. Percent of Live Births to Foreign-born Mothers by Community District of Residence
New York City, 2008% Live Births toForeign-born Mothersby Community DistrictNew York City, 2008
64.2 - 89.456.8 - 64.143.6 - 56.737.9 - 43.520.3 - 37.8

53
1989
1990
1991
1992
1993
1994
1995
1996
1997
1998
1999
2000
2001
2002
2003
2004
2005
2006
2007
2008
Year
0
20
40
60
80
100
120
140
160
Thou
s and
s
1989
1990
1991
1992
1993
1994
1995
1996
1997
1998
1999
2000
2001
2002
2003
2004
2005
2006
2007
2008
Year
0
10
20
30
40
50
60
Perc
e nt
On Medicaid Non-Married MotherBirths to Teenagers Foreign-Born MotherLow Birth Weight Preterm
Non Hispanic Black
Non Hispanic White
Asian & Pacific Islander
Hispanic
Other or Unknown
Figure 24. Percent of Live Births with Specified Characteristics, New York City, 1989-2008
The percent of live births to foreign-born mothers has increased steadily in the past two decades, from 40% in 1989 to 50.9% in 2008, reflecting the inflow of new immigrants. The percent of mothers giving birth on Medicaid surged during the late 1980s and early 1990s, leveled from 1997 to 1999, then gradually increased through 2007. The large increase in Medicaid in 2008 is likely due to the implementation of the new birth certificate as Medicaid reporting now includes other government insurances like Family Plus and Child PlusB. The percent of low birthweight babies has remained stable for the past 20 years. The percent of mothers who were not married when they delivered a baby increased from 1988 through 1996. The abrupt decrease in 1997 is an artifact of a new method used to compute mother’s marital status (See Technical Notes: Births, Mother’s Marital Status). The percent of non-married mothers decreased slightly since 1999, largely due to the decline of teenage mothers, who are more likely to not be married. Percent of live births born preterm, less than 37 completed weeks gestation, has been stable for the past 20 years at about 10%.
Figure 23. Live Births by Mother's Ethnic Group New York City, 1989-2008
The number of live births registered in New York City reached 139,630 in 1990, the highest number since 1970. After 1990, live births declined about 10% and stabilized between 123,000 and 126,000 from 1997 to 2005. Live births then increased to 128,691 in 2007 and decreased to 127,680 in 2008. Over the last 20 years, the numbers of births to non-Hispanic black women and Asian and Pacific Islanders have changed dramatically. Since 1989, births declined 35% among non-Hispanic black mothers to 27,917 in 2008 and increased 51% among Asian and Pacific Islanders to 998,600 in 2008. On the other hand, births to non-Hispanic white women and Hispanics have remained relatively stable with a 2% and 4.5% decline, respectively, since 1989.Note: Other or Unknown – Other includes two or more races. See Technical Notes: Births, Changes to Birth Items Reported in the Summary Due to Data Quality Concerns.
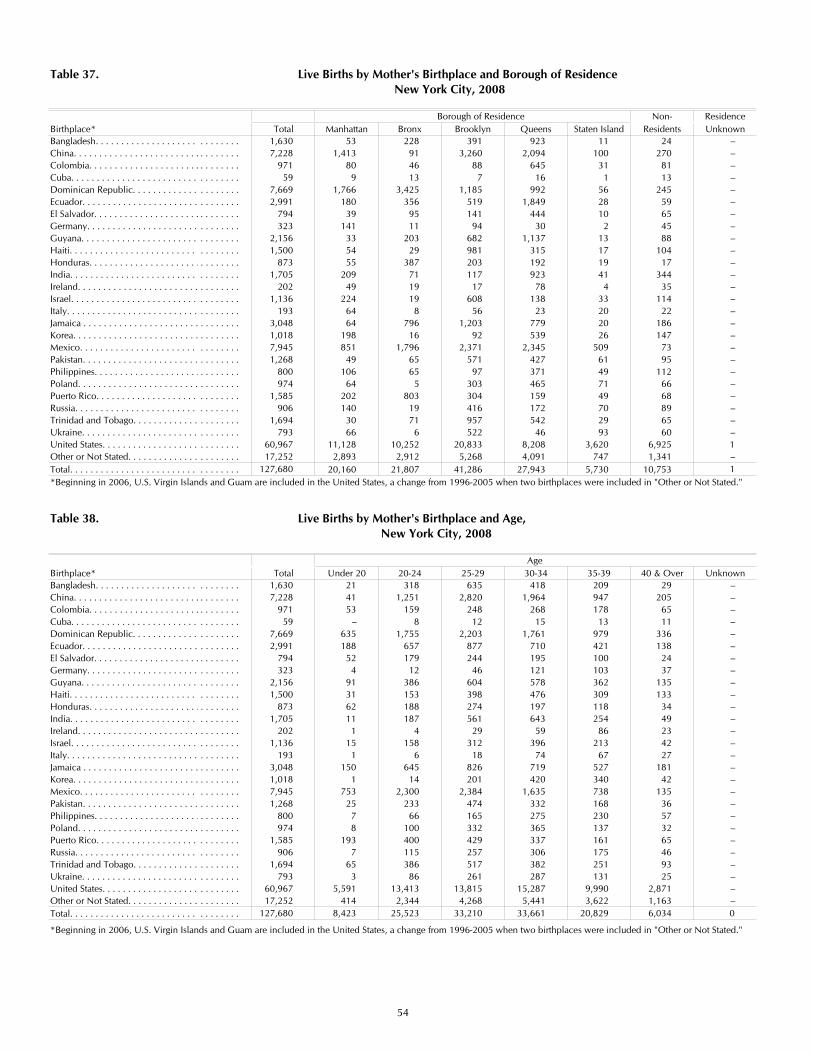
54
Table 37. Live Births by Mother's Birthplace and Borough of Residence New York City, 2008
Borough of Residence Non- ResidenceBirthplace* Total Manhattan Bronx Brooklyn Queens Staten Island Residents UnknownBangladesh. . . . . . . . . . . . . . . . . . . . . . . . . . . . 1,630 53 228 391 923 11 24 –China. . . . . . . . . . . . . . . . . . . . . . . . . . . . . . . . . 7,228 1,413 91 3,260 2,094 100 270 –Colombia. . . . . . . . . . . . . . . . . . . . . . . . . . . . . . 971 80 46 88 645 31 81 –Cuba. . . . . . . . . . . . . . . . . . . . . . . . . . . . . . . . . 59 9 13 7 16 1 13 –Dominican Republic. . . . . . . . . . . . . . . . . . . . . 7,669 1,766 3,425 1,185 992 56 245 –Ecuador. . . . . . . . . . . . . . . . . . . . . . . . . . . . . . . 2,991 180 356 519 1,849 28 59 –El Salvador. . . . . . . . . . . . . . . . . . . . . . . . . . . . . 794 39 95 141 444 10 65 –Germany. . . . . . . . . . . . . . . . . . . . . . . . . . . . . . 323 141 11 94 30 2 45 –Guyana. . . . . . . . . . . . . . . . . . . . . . . . . . . . . . . 2,156 33 203 682 1,137 13 88 –Haiti. . . . . . . . . . . . . . . . . . . . . . . . . . . . . . . . . . 1,500 54 29 981 315 17 104 –Honduras. . . . . . . . . . . . . . . . . . . . . . . . . . . . . . 873 55 387 203 192 19 17 –India. . . . . . . . . . . . . . . . . . . . . . . . . . . . . . . . . 1,705 209 71 117 923 41 344 –Ireland. . . . . . . . . . . . . . . . . . . . . . . . . . . . . . . . 202 49 19 17 78 4 35 –Israel. . . . . . . . . . . . . . . . . . . . . . . . . . . . . . . . . 1,136 224 19 608 138 33 114 –Italy. . . . . . . . . . . . . . . . . . . . . . . . . . . . . . . . . . 193 64 8 56 23 20 22 –Jamaica . . . . . . . . . . . . . . . . . . . . . . . . . . . . . . . 3,048 64 796 1,203 779 20 186 –Korea. . . . . . . . . . . . . . . . . . . . . . . . . . . . . . . . . 1,018 198 16 92 539 26 147 –Mexico. . . . . . . . . . . . . . . . . . . . . . . .. . . . . . . . 7,945 851 1,796 2,371 2,345 509 73 –Pakistan. . . . . . . . . . . . . . . . . . . . . . . . . . . . . . . 1,268 49 65 571 427 61 95 –Philippines. . . . . . . . . . . . . . . . . . . . . . . . . . . . . 800 106 65 97 371 49 112 –Poland. . . . . . . . . . . . . . . . . . . . . . . . . . . . . . . . 974 64 5 303 465 71 66 –Puerto Rico. . . . . . . . . . . . . . . . . . . . . . . . . . . . 1,585 202 803 304 159 49 68 –Russia. . . . . . . . . . . . . . . . . . . . . . . . . . . . . . . . 906 140 19 416 172 70 89 –Trinidad and Tobago. . . . . . . . . . . . . . . . . . . . . 1,694 30 71 957 542 29 65 –Ukraine. . . . . . . . . . . . . . . . . . . . . . . . . . . . . . . 793 66 6 522 46 93 60 –United States. . . . . . . . . . . . . . . . . . . . . . . . . . . 60,967 11,128 10,252 20,833 8,208 3,620 6,925 1Other or Not Stated. . . . . . . . . . . . . . . . . . . . . . 17,252 2,893 2,912 5,268 4,091 747 1,341 –Total. . . . . . . . . . . . . . . . . . . . . . . . . . . . . . . . . 127,680 20,160 21,807 41,286 27,943 5,730 10,753 1*Beginning in 2006, U.S. Virgin Islands and Guam are included in the United States, a change from 1996-2005 when two birthplaces were included in "Other or Not Stated."
Table 38. Live Births by Mother's Birthplace and Age, New York City, 2008
Age Birthplace* Total Under 20 20-24 25-29 30-34 35-39 40 & Over UnknownBangladesh. . . . . . . . . . . . . . . . . . . . . . . . . . . . 1,630 21 318 635 418 209 29 –China. . . . . . . . . . . . . . . . . . . . . . . . . . . . . . . . . 7,228 41 1,251 2,820 1,964 947 205 –Colombia. . . . . . . . . . . . . . . . . . . . . . . . . . . . . . 971 53 159 248 268 178 65 –Cuba. . . . . . . . . . . . . . . . . . . . . . . . . . . . . . . . . 59 – 8 12 15 13 11 –Dominican Republic. . . . . . . . . . . . . . . . . . . . . 7,669 635 1,755 2,203 1,761 979 336 –Ecuador. . . . . . . . . . . . . . . . . . . . . . . . . . . . . . . 2,991 188 657 877 710 421 138 –El Salvador. . . . . . . . . . . . . . . . . . . . . . . . . . . . . 794 52 179 244 195 100 24 –Germany. . . . . . . . . . . . . . . . . . . . . . . . . . . . . . 323 4 12 46 121 103 37 –Guyana. . . . . . . . . . . . . . . . . . . . . . . . . . . . . . . 2,156 91 386 604 578 362 135 –Haiti. . . . . . . . . . . . . . . . . . . . . . . . . . . . . . . . . . 1,500 31 153 398 476 309 133 –Honduras. . . . . . . . . . . . . . . . . . . . . . . . . . . . . . 873 62 188 274 197 118 34 –India. . . . . . . . . . . . . . . . . . . . . . . . . . . . . . . . . 1,705 11 187 561 643 254 49 –Ireland. . . . . . . . . . . . . . . . . . . . . . . . . . . . . . . . 202 1 4 29 59 86 23 –Israel. . . . . . . . . . . . . . . . . . . . . . . . . . . . . . . . . 1,136 15 158 312 396 213 42 –Italy. . . . . . . . . . . . . . . . . . . . . . . . . . . . . . . . . . 193 1 6 18 74 67 27 –Jamaica . . . . . . . . . . . . . . . . . . . . . . . . . . . . . . . 3,048 150 645 826 719 527 181 –Korea. . . . . . . . . . . . . . . . . . . . . . . . . . . . . . . . . 1,018 1 14 201 420 340 42 –Mexico. . . . . . . . . . . . . . . . . . . . . . . .. . . . . . . . 7,945 753 2,300 2,384 1,635 738 135 –Pakistan. . . . . . . . . . . . . . . . . . . . . . . . . . . . . . . 1,268 25 233 474 332 168 36 –Philippines. . . . . . . . . . . . . . . . . . . . . . . . . . . . . 800 7 66 165 275 230 57 –Poland. . . . . . . . . . . . . . . . . . . . . . . . . . . . . . . . 974 8 100 332 365 137 32 –Puerto Rico. . . . . . . . . . . . . . . . . . . . . . . . . . . . 1,585 193 400 429 337 161 65 –Russia. . . . . . . . . . . . . . . . . . . . . . . . . . . . . . . . 906 7 115 257 306 175 46 –Trinidad and Tobago. . . . . . . . . . . . . . . . . . . . . 1,694 65 386 517 382 251 93 –Ukraine. . . . . . . . . . . . . . . . . . . . . . . . . . . . . . . 793 3 86 261 287 131 25 –United States. . . . . . . . . . . . . . . . . . . . . . . . . . . 60,967 5,591 13,413 13,815 15,287 9,990 2,871 –Other or Not Stated. . . . . . . . . . . . . . . . . . . . . . 17,252 414 2,344 4,268 5,441 3,622 1,163 –Total. . . . . . . . . . . . . . . . . . . . . . . . . . . . . . . . . 127,680 8,423 25,523 33,210 33,661 20,829 6,034 0
*Beginning in 2006, U.S. Virgin Islands and Guam are included in the United States, a change from 1996-2005 when two birthplaces were included in "Other or Not Stated."

55
Table 39. Live Births to Teenagers (Age Under 20) by Selected Characteristics and Infant Deaths by Health Center District of Residence, New York City, 2008
Percent of Teenage Live Births With Specified Characteristics Live Percent Infant Neonatal
Births of Total Foreign- First Under Mother Pre- Mortality Mortality to Live Hispanic Born Live 2,500 Preterm Not On pregnancy (Under 1 Year) (Under 28 Days)
Health Center District of Residence Teenagers Births Mother Mother* Birth Grams Birth** Married Medicaid*** Obesity*** Number Rate# Number Rate#NEW YORK CITY EVENTS . . . . . . . . 8,423 6.6 59.6 31.2 86.2 10.6 10.4 90.1 87.4 14.7 64 7.6 38 4.5MANHATTAN . . . . . . . . . . . . . . . . . 1,031 5.1 69.0 30.2 86.2 11.4 11.2 94.2 90.8 16.9 5 4.8 3 2.9Central Harlem . . . . . . . . . . . . . . . . 202 10.2 36.1 17.4 84.2 13.9 14.9 95.0 86.2 19.8 2 9.9 1 5.0East Harlem . . . . . . . . . . . . . . . . . . . 206 10.3 69.4 20.4 85.4 16.0 14.6 92.7 91.6 16.7 – – – –Kips Bay-Yorkville . . . . . . . . . . . . . . 20 0.7 25.0 10.0 95.0 10.0 – 100.0 85.0 10.0 – – – –Lower East Side . . . . . . . . . . . . . . . . 100 3.5 69.1 24.0 82.0 8.0 9.0 94.0 93.9 19.0 – – – –Lower West Side . . . . . . . . . . . . . . . 53 1.3 61.5 20.8 84.9 5.7 7.5 94.3 88.5 12.0 1 18.9 1 18.9Riverside . . . . . . . . . . . . . . . . . . . . . 92 3.8 65.1 22.8 89.1 13.0 12.0 97.8 90.0 21.7 2 21.7 1 10.9Washington Heights . . . . . . . . . . . . . 358 9.6 91.8 49.2 88.0 8.9 8.7 93.3 92.9 14.8 – – – –BRONX . . . . . . . . . . . . . . . . . . . . . . 2,519 11.6 73.3 26.8 85.4 10.3 9.7 93.5 88.6 15.1 21 8.3 11 4.4Fordham-Riverdale . . . . . . . . . . . . . . 392 9.5 83.1 31.0 86.5 8.4 8.7 91.1 87.7 14.2 2 5.1 – –Morrisania . . . . . . . . . . . . . . . . . . . . 413 12.1 74.7 25.2 83.8 9.4 9.2 95.6 89.3 15.2 5 12.1 4 9.7Mott Haven . . . . . . . . . . . . . . . . . . . 360 14.2 76.3 22.6 83.1 10.8 11.7 96.1 91.1 14.0 4 11.1 2 5.6Pelham Bay . . . . . . . . . . . . . . . . . . . 333 10.9 41.0 23.4 90.7 12.3 10.5 92.8 84.7 15.9 4 12.0 1 3.0Tremont . . . . . . . . . . . . . . . . . . . . . . 592 13.3 82.7 31.4 83.4 9.0 8.8 93.6 88.0 15.4 5 8.4 3 5.1Westchester . . . . . . . . . . . . . . . . . . . 429 10.1 72.1 24.3 86.5 12.8 10.3 91.8 90.2 15.5 1 2.3 1 2.3BROOKLYN . . . . . . . . . . . . . . . . . . . 2,746 6.7 44.4 29.4 86.4 10.5 10.7 86.3 89.7 15.2 22 8.0 11 4.0Bay Ridge . . . . . . . . . . . . . . . . . . . . . 158 3.7 57.0 48.7 84.8 9.5 9.5 65.8 89.2 14.2 – – – –Bedford . . . . . . . . . . . . . . . . . . . . . . 301 8.3 20.3 18.9 82.9 15.3 16.6 94.7 89.0 18.8 2 6.6 1 3.3Brownsville . . . . . . . . . . . . . . . . . . . 574 11.7 24.5 19.5 88.7 9.6 9.9 95.6 88.8 17.8 8 13.9 3 5.2Bushwick . . . . . . . . . . . . . . . . . . . . . 406 11.7 70.0 31.0 84.2 9.4 9.1 94.3 90.8 18.9 1 2.5 – –Flatbush . . . . . . . . . . . . . . . . . . . . . . 413 5.1 30.5 40.0 89.6 12.6 13.3 86.9 86.1 12.4 4 9.7 2 4.8Fort Greene . . . . . . . . . . . . . . . . . . . 204 8.1 42.1 19.1 89.2 7.8 6.4 87.7 88.1 16.6 1 4.9 – –Gravesend . . . . . . . . . . . . . . . . . . . . 228 5.9 50.7 40.5 78.9 11.4 11.0 75.9 94.2 10.1 3 13.2 3 13.2Red Hook-Gowanus . . . . . . . . . . . . . 61 3.6 55.0 11.5 95.1 6.6 13.1 88.5 82.0 11.5 – – – –Sunset Park . . . . . . . . . . . . . . . . . . . 244 4.3 79.6 46.3 86.1 8.2 7.4 68.9 95.5 7.4 2 8.2 1 4.1Williamsburg-Greenpoint . . . . . . . . . 157 4.8 67.4 12.2 87.9 10.2 10.2 74.5 91.1 16.6 1 6.4 1 6.4QUEENS . . . . . . . . . . . . . . . . . . . . . 1,634 5.8 60.7 43.8 86.9 9.7 9.7 89.5 84.7 11.9 13 8.0 11 6.7Astoria-Long Island City . . . . . . . . . . 151 4.9 71.7 40.7 89.4 7.9 9.3 88.1 86.7 16.2 1 6.6 1 6.6Corona . . . . . . . . . . . . . . . . . . . . . . . 451 7.3 90.5 67.0 86.3 8.6 8.9 92.2 91.7 8.9 3 6.7 3 6.7Flushing . . . . . . . . . . . . . . . . . . . . . . 121 2.5 61.3 46.3 86.8 6.6 10.7 87.6 75.8 14.0 1 8.3 1 8.3Jamaica East . . . . . . . . . . . . . . . . . . . 358 7.9 23.3 29.4 85.8 10.1 10.3 92.2 82.5 14.6 6 16.8 4 11.2Jamaica West . . . . . . . . . . . . . . . . . . 419 7.3 47.7 34.1 87.4 11.9 9.5 87.4 80.7 11.3 1 2.4 1 2.4Maspeth-Forest Hills . . . . . . . . . . . . . 134 3.7 77.9 35.1 88.1 9.7 11.2 82.8 85.8 9.9 1 7.5 1 7.5RICHMOND . . . . . . . . . . . . . . . . . . 324 5.7 53.4 28.4 84.3 12.3 12.0 93.2 72.0 15.5 2 6.2 1 3.1NEW YORK CITY RESIDENTS . . . . . 8,254 7.1 59.9 31.5 86.1 10.5 10.3 90.4 87.8 14.7 63 7.6 34 4.1NON-RESIDENTS . . . . . . . . . . . . . . . 168 1.6 41.7 18.5 92.3 16.1 14.3 74.4 64.4 12.9 1 6.0 1 6.0RESIDENCE UNKNOWN . . . . . . . . . 1 – – – – – – – – – – – – –
Note: Borough totals may be higher than the sum of the health center districts, as they may include some live births whose health center district could not be determined.* Beginning in 2006, U.S. Virgin Islands and Guam are included in the United States, a change from 1996-2005 when those two birthplaces were included in the foreign category.** Clinical gestational age less than 37 completed weeks. *** See Technical Notes: BIRTHS, Changes to Items Reported in Summary.# Rate per 1,000 live births to teenagers.
Table 40. Live Births to Teenagers (Age Under 20) by Selected Characteristics, New York City, 1995-2008
Year 1995 1996 1997 1998 1999 2000 2001 2002 2003 2004 2005 2006 2007 2008
Total Live Births . . . . . . . . . . . . . . . . . . 131,009 126,901 123,313 124,252 123,739 125,563 124,023 122,937 124,345 124,099 122,725 125,506 128,961 127,680Percent to Teenagers . . . . . . . . . . . . . . . 10.5 10.3 9.6 9.5 9.0 8.6 8.4 7.5 7.1 7.0 7.0 6.9 6.6 6.6Population* (Female Age 15-19) . . . . . . 246,159 247,972 249,798 251,637 253,490 255,356 245,567 240,565 240,656 241,094 249,546 267,830 271,349 272,575Birth Rate** (Age 15-19) . . . . . . . . . . . . 54.5 51.2 46.3 46.0 43.1 41.5 41.5 37.8 36.2 35.5 33.8 32.1 31.3 30.5Births to Teenagers . . . . . . . . . . . . . . . . 13,713 13,020 11,793 11,789 11,145 10,800 10,386 9,240 8,831 8,702 8,579 8,695 8,569 8,423Percent of Births with Specified Characteristics: Hispanic . . . . . . . . . . . . . . . . . . . . . 51.7 50.6 50.2 51.9 53.0 53.4 54.1 53.3 55.2 56.4 56.6 56.9 58.1 59.6 Foreign-Born Mother . . . . . . . . . . . . . 31.1 31.5 32.6 32.1 33.6 35.1 36.7 36.5 36.5 36.0 36.2 34.0 33.2 31.2 First Live Birth . . . . . . . . . . . . . . . . . . 78.2 80.2 81.5 81.8 82.2 82.9 84.4 84.0 84.4 84.8 84.8 85.8 85.7 86.2 Under 2,500 Grams . . . . . . . . . . . . . 10.6 9.7 10.8 10.3 10.3 9.7 10.1 10.4 9.7 10.2 10.1 10.5 10.2 10.6 Preterm***. . . . . . . . . . . . . . . . . . . . 11.4 10.2 10.9 10.5 10.4 10.6 11.2 10.8 9.8 11.4 10.5 10.4 10.2 10.4 Not Married . . . . . . . . . . . . . . . . . . . 89.3 90.7 87.3 88.6 89.0 89.1 88.1 88.4 88.6 88.5 88.7 89.0 89.5 90.1 On Medicaid# . . . . . . . . . . . . . . . . . . 80.6 82.8 81.6 80.2 78.7 79.9 82.0 80.2 80.6 81.7 80.2 80.8 80.1 87.4 Pre-pregnancy Obesity# . . . . . . . . . . – – – – – – – – – – – – – 14.7
Infant Mortality Rate##. . . . . . . . . . . . . . 12.3 9.4 9.5 7.5 8.5 8.3 7.4 9.2 8.5 9.9 6.1 7.4 6.8 7.6
* For denominator information, see Technical Notes: Population.** Per 1,000 women aged 15-19.*** Clinical gestational age less than 37 completed weeks. # See Technical Notes: BIRTHS, Changes to Items Reported in Summary.## Infant mortality rate per 1,000 live births to teenagers.

56
Three-year averages were used in this map because of the relatively small number of births per year to teenage mothers in some community districts.
The community districts with the highest percent of births to teenagers were Mott Haven at 15.4%, Hunts Point at 15.2%, East Tremont at 14.5%, Brownsville at 14.4%, Morrisania at 13.9%, University Heights, Morris Heights at 13.4%, East Harlem at 13.1%, Bushwick and East New York at 12.5%, Williamsbridge at 12.0%, and Bedford Stuyvesant at 11.9%.
Seven community districts had less than 2% of their births to teenagers: Battery Park, Tribeca and Green-wich Village, SOHO at 0.3%, Murray Hill at 0.4%, Upper East Side at 0.9%, Bayside at 1.1%, Rego Park, Forest Hills at 1.2% and Tottenville at 1.4%.
See Table 41 on page 59 for additional rates.
Map 3. Percent of Live Births to Teenagers (Age <20) by Community District of Residence
New York City, 2006-2008% Live Births to Teenagersby Community DistrictNew York City, 2006-2008
11.6 - 15.4
7.8 - 11.5
5.5 - 7.7
3.0 - 5.4
0.3 - 2.9
The community district with the highest percent of pre-pregnancy obesity was Brownsville at 31.9%. Other community districts in the highest quintile were East Flatbush at 29.9%, Bedford Stuyvesant at 27.0%, East New York and Williamsbridge at 26.2%, East Harlem at 26.1%, Morrisania at 25.9%, Central Harlem at 25.3%, The Rockaways at 24.6%, and Mott Haven and Crown Heights North at 24.2%.
The community district with the lowest percent of pre-pregnancy obesity was Greenwich Village, SOHO at 1.4%. Other community districts with less than 5% pre-pregancy obesity include Battery Park, Tribeca at 2.4%, Upper East Side at 2.6%, Murray Hill at 2.9%, and Midtown Business District at 3.8%
See Table 36 on page 51 for additional rates.
Map 4. Percent Pre-pregnancy Obesity by Community District of Residence
New York City, 2008% Pre-pregnancy Obesityby Community DistrictNew York City, 2008
24.0 - 31.9
20.2 - 23.9
15.5 - 20.1
9.0 - 15.4
1.4 - 8.9

57
The community district with the highest Infant Mortal-ity Rate in 2008 was Brownsville at 11.3 infant deaths per 1,000 live births. Other community districts in the highest quintile are Manhattanville at 10.4, East New York at 9.9, Mott Haven at 9.8, Morrisania at 9.1, Wil-liamsbridge at 8.7, Jamaica, St. Albans at 8.4, East Trem-ont and Fresh Meadows, Briarwood at 8.1, Greenwich Village, SOHO at 7.9, and Bedford Stuyvesant at 7.8.
Twenty-seven community districts met the Healthy People 2010 goal of 4.5 infant deaths per 1,000 live births. These include all in the two lowest quintiles as well as Bensonhurst and Jackson Heights. Two ad-ditional community districts met the “Take Care New York” (TCNY) 2012 goal of 5.0 deaths per 1,000 live births. They include The Rockaways and Astoria, Long Island City.
See Table 36 on page 51 for additional rates.
Map 5. Infant Mortality Rate by Community District of Residence
New York City, 2008Infant Mortality Rateby Community DistrictNew York City, 2008
7.7 - 11.3
5.6 - 7.64.1 - 5.5
3.0 - 4.01.1 - 2.9
The health center district with the highest Infant Mortal-ity Rate in 2008 was Brownsville at 11.2 infant deaths per 1,000 live births. Other health center districts in the highest quintile were Fort Greene at 8.4, Jamaica East at 8.1, Morrisania at 7.9, Mott Haven at 7.1, and Bedford at 6.7.
Health center districts that met the Healthy People 2010 goal of 4.5 include all those in the lowest quintile as well as Corona, Lower West Side, Gravesend and Washington Heights. Health center districts that met the TCNY 2012 goal of 5.0 infant deaths per 1,000 live births include all in the two lowest quintiles as well as Flushing and Lower East Side.
See Table 34 on page 50 for additional rates.
Map 6. Infant Mortality Rate by Health Center District of Residence
New York City, 2008Infant Mortality RateBy Health Center DistrictNew York City, 2008
6.6 - 11.25.6 - 6.54.8 - 5.5
3.1 - 4.72.5 - 3.0

Infant Mortality RateNew York City, 1898-2008
58
1898 '10 '20 '30 '40 '50 '60 '70 '80 '90 '00 2008
Year
0
20
40
60
80
100
120
140
160
IMR
per
1,0 0
0 Li
ve B
irth
s
Figure 25.
The Infant Mortality Rate (IMR) was first estimated for New York City in 1898 when its boundaries were extended to include all five boroughs. That year the IMR was estimated to be 140.9 deaths under one year of age per 1,000 live births. (Because of incomplete reporting of early neonatal deaths, this is almost certainly an underestimate.) Improvements in food and water safety in the earlier part of the twentieth century, and advances in access to medical care in recent years, have contributed to a decline to 5.4 deaths per 1,000 live births in 2007. The 2008 IMR of 5.5 infant deaths (under one year of age) per 1,000 live births, remained very close to its 2007 historical low with a statistically insignificant 1.9% increase from 5.4.
6.6
4.8
3.2 3.3
10.2
5.5
Puer
to R
ican
Oth
e r H
ispa
n ic
Asi
a n &
Pac
if ic
Isla
nde r
Non
-His
pani
c W
hite
Non
-His
pani
c Bl
ack
New
Yor
k C
it y
Ethnic Group
0
2
4
6
8
10
12
IMR
per
1,00
0 Li
ve B
i rth
s
Figure 26. Infant Mortality Rate by Ethnic Group New York City, 2008
Healthy People 2010 Goal: 4.5
The “Take Care New York” (TCNY) 2012 target and the Healthy People 2010 goal for IMR are 5.0 and 4.5 infant deaths per 1,000 live births, respectively. This graph shows the IMR varies greatly by ethnic group. Non-Hispanic whites, Asian and Pacific Islanders and Other Hispanics have already met the TCNY goal in 2008 with IMRs of 3.3, 3.2, and 4.8 deaths per 1,000 live births, respectively. However, IMRs remain high among Puerto Ricans at 6.6 deaths per 1,000 live births and Non-Hispanic blacks at 10.2 deaths per 1,000 live births. The citywide infant mortality rate in 2008 was 5.5 infant deaths per 1,000 live births.
TCNY 2012 Target: 5.0

59
Table 41. Live Births to Teenagers (Age Under 20) by Selected Characteristics and Infant Deaths by Community District of Residence, New York City, 2006-2008*
Percent of Total Live Births with Specified Characteristics Infant Neonatal
Mortality MortalityPercent of Mother's Foreign First Under Mother (Under 1 Year) (Under 28 Days)
Live Total Live Ancestry Born** Live 2,500 Preterm Not OnCommunity District of Residence Births Births Hispanic Mother Birth Grams Birth*** Married Medicaid# Number Rate## Number Rate##NEW YORK CITY . . . . . . . . . . . . . . . 25,687 6.7 58.2 32.8 85.9 10.4 10.3 89.5 82.7 186 7.2 114 4.4MANHATTAN . . . . . . . . . . . . . . . . . . 3,251 5.4 67.8 30.6 86.2 10.8 10.6 92.5 90.4 23 7.1 13 4.0Battery Park, Tribeca (01). . . . . . . . . . 8 0.3 25.0 37.5 75.0 – – 87.5 62.5 – – – –Greenwich Village, SOHO (02). . . . . 9 0.3 50.0 33.3 100.0 – – 100.0 66.7 – – – –Lower East Side (03). . . . . . . . . . . . . . 317 4.5 69.6 20.9 85.8 9.8 10.7 90.2 91.1 2 6.3 2 6.3Chelsea, Clinton (04). . . . . . . . . . . . . 75 2.8 64.9 15.7 92.0 9.3 12.0 92.0 82.4 – – – –Midtown Business District (05). . . . . . 33 2.1 42.4 25.0 75.8 9.1 12.1 93.9 84.8 1 30.3 1 30.3Murray Hill (06). . . . . . . . . . . . . . . . . 17 0.4 52.9 23.5 100.0 11.8 – 94.1 82.4 – – – –Upper West Side (07). . . . . . . . . . . . . 168 2.0 66.0 21.7 85.1 12.5 10.7 92.3 84.3 1 6.0 1 6.0Upper East Side (08). . . . . . . . . . . . . . 76 0.9 30.3 9.2 90.8 10.5 7.9 93.4 81.6 1 13.2 – –Manhattanville (09). . . . . . . . . . . . . . . 445 10.4 75.0 42.7 87.4 11.0 9.2 93.5 91.9 5 11.2 2 4.5Central Harlem (10). . . . . . . . . . . . . . 563 10.8 33.3 19.4 86.0 13.0 12.4 94.1 88.1 3 5.3 1 1.8East Harlem (11). . . . . . . . . . . . . . . . . 702 13.1 66.1 20.7 84.3 13.7 13.0 92.6 91.0 8 11.4 6 8.5Washington Heights (12). . . . . . . . . . 838 9.9 93.3 48.7 86.8 7.4 8.5 91.5 94.0 2 2.4 – –BRONX . . . . . . . . . . . . . . . . . . . . . . . 7,670 11.8 70.8 28.1 85.3 10.5 9.7 93.5 81.6 51 6.6 31 4.0Mott Haven (01). . . . . . . . . . . . . . . . . 790 15.4 73.2 22.8 82.8 10.5 8.7 95.6 86.9 12 15.2 7 8.9Hunts Point (02). . . . . . . . . . . . . . . . . 424 15.2 78.9 24.1 83.7 10.8 10.8 92.9 87.7 2 4.7 2 4.7Morrisania (03). . . . . . . . . . . . . . . . . . 576 13.9 65.5 16.6 85.8 12.7 12.0 96.2 72.6 5 8.7 3 5.2Concourse, Highbridge (04). . . . . . . . 978 11.5 76.4 39.3 85.3 8.5 9.5 93.3 77.9 6 6.1 5 5.1University/Morris Heights (05). . . . . . 1,025 13.4 78.7 33.3 84.8 10.1 10.2 94.4 73.1 7 6.8 3 2.9East Tremont (06). . . . . . . . . . . . . . . . 628 14.5 74.2 19.9 82.8 9.1 8.8 94.9 74.3 2 3.2 2 3.2Fordham (07). . . . . . . . . . . . . . . . . . . 828 11.2 82.0 33.0 85.1 11.0 9.8 92.0 84.4 9 10.9 6 7.2Riverdale (08). . . . . . . . . . . . . . . . . . . 218 6.1 81.9 36.1 88.1 10.1 9.6 90.4 85.2 2 9.2 – –Unionport, Soundview (09). . . . . . . . 932 11.5 71.1 25.1 84.9 10.9 9.3 92.6 87.3 1 1.1 1 1.1Throgs Neck (10). . . . . . . . . . . . . . . . 208 6.8 61.9 19.2 91.8 12.5 7.7 91.3 82.7 – – – –Pelham Parkway (11). . . . . . . . . . . . . 323 7.6 58.8 29.3 87.0 9.3 9.9 87.3 86.1 1 3.1 1 3.1Williamsbridge (12). . . . . . . . . . . . . . 739 12.0 37.6 27.9 88.9 11.6 9.1 95.0 88.1 4 5.4 1 1.4BROOKLYN . . . . . . . . . . . . . . . . . . . 8,330 6.8 43.9 31.2 86.2 10.7 10.9 86.4 86.6 56 6.7 35 4.2Williamsburg, Greenpoint (01). . . . . . 470 4.8 65.5 15.8 89.6 9.4 8.1 71.1 83.8 2 4.3 1 2.1Fort Greene, Brooklyn Heights (02) . . 191 5.0 35.1 13.6 88.5 9.9 9.9 91.1 88.4 1 5.2 – –Bedford Stuyvesant (03). . . . . . . . . . . 845 11.9 31.5 16.2 85.2 12.0 12.1 92.4 87.3 4 4.7 2 2.4Bushwick (04). . . . . . . . . . . . . . . . . . . 776 12.5 79.0 36.5 83.1 8.8 9.7 94.8 92.0 3 3.9 2 2.6East New York (05). . . . . . . . . . . . . . . 1,085 12.5 44.2 25.9 86.3 12.4 12.5 94.7 80.9 15 13.8 10 9.2Park Slope (06). . . . . . . . . . . . . . . . . . 201 4.1 57.1 15.0 89.6 8.5 9.0 93.0 86.6 – – – –Sunset Park (07). . . . . . . . . . . . . . . . . 555 6.2 84.2 53.3 84.1 6.8 7.7 84.5 92.1 3 5.4 2 3.6Crown Heights North (08). . . . . . . . . 375 8.5 16.8 22.9 85.0 11.5 12.5 95.2 85.6 2 5.3 1 2.7Crown Heights South (09). . . . . . . . . . 300 5.9 18.3 35.0 91.7 13.0 13.0 95.3 87.8 2 6.7 1 3.3Bay Ridge (10). . . . . . . . . . . . . . . . . . 177 3.4 48.0 57.7 82.5 9.0 5.1 62.1 79.7 – – – –Bensonhurst (11). . . . . . . . . . . . . . . . . 249 3.6 56.5 51.4 82.7 11.6 11.2 73.9 87.9 – – – –Borough Park (12). . . . . . . . . . . . . . . . 462 3.1 69.3 41.4 89.4 9.7 9.5 50.6 88.7 5 10.8 3 6.5Coney Island (13). . . . . . . . . . . . . . . . 337 9.5 56.2 30.0 87.8 9.8 11.0 82.2 86.3 1 3.0 1 3.0Flatbush, Midwood (14). . . . . . . . . . . 454 5.5 42.7 49.4 87.0 7.3 11.5 86.3 87.8 2 4.4 1 2.2Sheepshead Bay (15). . . . . . . . . . . . . 259 4.3 32.2 50.2 78.0 11.2 10.4 57.1 85.3 3 11.6 3 11.6Brownsville (16). . . . . . . . . . . . . . . . . 630 14.4 22.4 13.4 84.8 12.9 12.1 97.6 87.2 5 7.9 4 6.3East Flatbush (17). . . . . . . . . . . . . . . . 534 7.7 10.9 40.5 88.9 13.3 12.4 94.2 86.7 4 7.5 2 3.7Canarsie (18). . . . . . . . . . . . . . . . . . . 430 5.5 15.4 23.3 88.6 11.9 12.6 89.3 83.4 4 9.3 2 4.7QUEENS . . . . . . . . . . . . . . . . . . . . . . 4,938 5.9 58.9 46.2 86.3 9.5 9.9 88.1 77.7 38 7.7 25 5.1Astoria, Long Island City (01). . . . . . . 345 5.4 59.5 37.8 85.5 10.1 11.9 87.0 82.8 2 5.8 2 5.8Sunnyside, Woodside (02). . . . . . . . . 172 3.8 82.4 63.4 85.5 5.2 9.4 81.4 84.8 – – – –Jackson Heights (03). . . . . . . . . . . . . . 717 8.3 92.0 70.1 84.9 8.6 8.0 88.7 90.1 6 8.4 4 5.6Elmhurst, Corona (04). . . . . . . . . . . . . 577 6.5 90.3 68.6 84.2 6.1 9.7 90.6 87.8 2 3.5 2 3.5Ridgewood, Glendale (05). . . . . . . . . 332 5.1 78.8 39.2 86.4 9.9 11.4 87.0 86.4 3 9.0 3 9.0Rego Park, Forest Hills (06). . . . . . . . . 46 1.2 43.6 60.9 91.3 6.5 6.5 60.9 58.7 – – – –Flushing (07). . . . . . . . . . . . . . . . . . . . 233 2.8 66.2 51.5 89.7 11.6 12.9 83.3 73.6 – – – –Fresh Meadows, Briarwood (08). . . . . 155 2.9 45.9 40.0 92.9 7.7 6.5 80.0 72.8 5 32.3 4 25.8Woodhaven (09). . . . . . . . . . . . . . . . . 437 7.2 66.7 48.9 86.7 8.5 5.9 80.5 63.2 1 2.3 – –Howard Beach (10). . . . . . . . . . . . . . . 247 5.5 37.7 48.2 89.9 10.9 11.3 83.4 62.2 2 8.1 – –Bayside (11). . . . . . . . . . . . . . . . . . . . 22 1.1 59.1 18.2 95.5 9.1 9.1 86.4 54.5 – – – –Jamaica, St. Albans (12). . . . . . . . . . . 865 9.3 30.7 32.8 84.5 10.3 9.7 92.0 70.8 12 13.9 8 9.2Queens Village (13). . . . . . . . . . . . . . 328 6.1 15.3 28.4 89.3 11.0 11.3 92.7 70.7 2 6.1 1 3.0The Rockaways (14). . . . . . . . . . . . . . 462 11.0 31.3 19.1 86.1 13.6 13.2 94.8 78.8 3 6.5 1 2.2STATEN ISLAND . . . . . . . . . . . . . . . . 980 5.6 51.5 30.6 83.9 9.5 11.0 89.5 71.0 13 13.3 6 6.1Port Richmond (01). . . . . . . . . . . . . . 746 9.6 56.7 33.0 82.4 10.3 11.4 90.6 73.4 12 16.1 6 8.0Willowbrook, South Beach (02). . . . . 160 3.7 39.9 28.1 86.9 8.1 10.6 85.6 68.2 – – – –Tottenville (03). . . . . . . . . . . . . . . . . . 72 1.4 23.9 12.7 91.7 4.2 8.3 87.5 53.5 1 13.9 – –
Note: Borough totals may be higher than the sum of the community districts, as they may include some live births whose community district could not be determined. Map of percent of live births to teenagers by community district of residence is presented on page 56 (Map 3).*Three years data were combined because of the relatively small number of infant deaths per year for teenage mothers. ** Beginning in 2006, U.S. Virgin Islands and Guam are included in the United States, a change from 1996-2005 when those two birthplaces were included in foreign category.*** Clinical gestational age less than 37 completed weeks. # See Technical Notes: BIRTHS, Changes to Items Reported in Summary.## Rate per 1,000 live births.
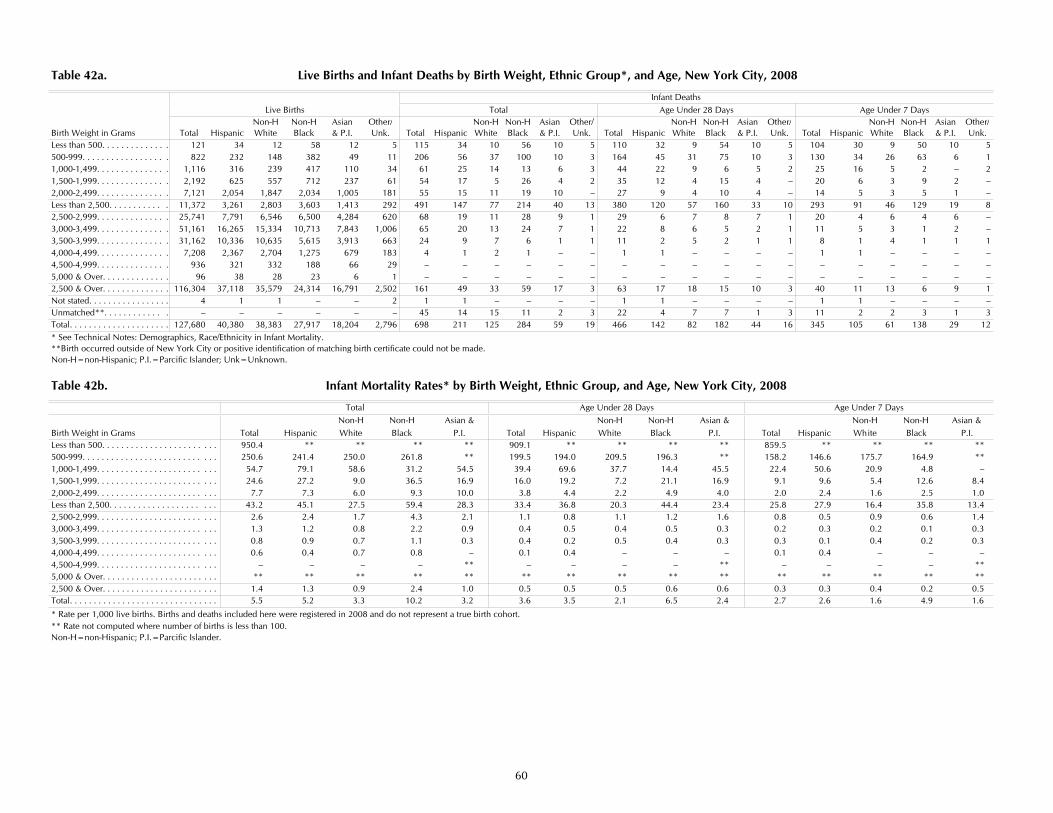
60
Table 42a. Live Births and Infant Deaths by Birth Weight, Ethnic Group*, and Age, New York City, 2008
Infant DeathsLive Births Total Age Under 28 Days Age Under 7 Days
Non-H Non-H Asian Other/ Non-H Non-H Asian Other/ Non-H Non-H Asian Other/ Non-H Non-H Asian Other/Birth Weight in Grams Total Hispanic White Black & P.I. Unk. Total Hispanic White Black & P.I. Unk. Total Hispanic White Black & P.I. Unk. Total Hispanic White Black & P.I. Unk.Less than 500. . . . . . . . . . . . . . 121 34 12 58 12 5 115 34 10 56 10 5 110 32 9 54 10 5 104 30 9 50 10 5500-999. . . . . . . . . . . . . . . . . . 822 232 148 382 49 11 206 56 37 100 10 3 164 45 31 75 10 3 130 34 26 63 6 11,000-1,499. . . . . . . . . . . . . . . 1,116 316 239 417 110 34 61 25 14 13 6 3 44 22 9 6 5 2 25 16 5 2 – 21,500-1,999. . . . . . . . . . . . . . . 2,192 625 557 712 237 61 54 17 5 26 4 2 35 12 4 15 4 – 20 6 3 9 2 –2,000-2,499. . . . . . . . . . . . . . . 7,121 2,054 1,847 2,034 1,005 181 55 15 11 19 10 – 27 9 4 10 4 – 14 5 3 5 1 –Less than 2,500. . . . . . . . . . . . 11,372 3,261 2,803 3,603 1,413 292 491 147 77 214 40 13 380 120 57 160 33 10 293 91 46 129 19 82,500-2,999. . . . . . . . . . . . . . . 25,741 7,791 6,546 6,500 4,284 620 68 19 11 28 9 1 29 6 7 8 7 1 20 4 6 4 6 –3,000-3,499. . . . . . . . . . . . . . . 51,161 16,265 15,334 10,713 7,843 1,006 65 20 13 24 7 1 22 8 6 5 2 1 11 5 3 1 2 –3,500-3,999. . . . . . . . . . . . . . . 31,162 10,336 10,635 5,615 3,913 663 24 9 7 6 1 1 11 2 5 2 1 1 8 1 4 1 1 14,000-4,499. . . . . . . . . . . . . . . 7,208 2,367 2,704 1,275 679 183 4 1 2 1 – – 1 1 – – – – 1 1 – – – –4,500-4,999. . . . . . . . . . . . . . . 936 321 332 188 66 29 – – – – – – – – – – – – – – – – – –5,000 & Over. . . . . . . . . . . . . . 96 38 28 23 6 1 – – – – – – – – – – – – – – – – – –2,500 & Over. . . . . . . . . . . . . . 116,304 37,118 35,579 24,314 16,791 2,502 161 49 33 59 17 3 63 17 18 15 10 3 40 11 13 6 9 1Not stated. . . . . . . . . . . . . . . . . 4 1 1 – – 2 1 1 – – – – 1 1 – – – – 1 1 – – – –Unmatched**. . . . . . . . . . . . . . – – – – – – 45 14 15 11 2 3 22 4 7 7 1 3 11 2 2 3 1 3Total. . . . . . . . . . . . . . . . . . . . . 127,680 40,380 38,383 27,917 18,204 2,796 698 211 125 284 59 19 466 142 82 182 44 16 345 105 61 138 29 12* See Technical Notes: Demographics, Race/Ethnicity in Infant Mortality.**Birth occurred outside of New York City or positive identification of matching birth certificate could not be made. Non-H=non-Hispanic; P.I.=Parcific Islander; Unk=Unknown.
Table 42b. Infant Mortality Rates* by Birth Weight, Ethnic Group, and Age, New York City, 2008
Total Age Under 28 Days Age Under 7 Days Non-H Non-H Asian & Non-H Non-H Asian & Non-H Non-H Asian &
Birth Weight in Grams Total Hispanic White Black P.I. Total Hispanic White Black P.I. Total Hispanic White Black P.I.Less than 500. . . . . . . . . . . . . . . . . . . . . . . . 950.4 ** ** ** ** 909.1 ** ** ** ** 859.5 ** ** ** **500-999. . . . . . . . . . . . . . . . . . . . . . . . . . . . 250.6 241.4 250.0 261.8 ** 199.5 194.0 209.5 196.3 ** 158.2 146.6 175.7 164.9 **1,000-1,499. . . . . . . . . . . . . . . . . . . . . . . . . 54.7 79.1 58.6 31.2 54.5 39.4 69.6 37.7 14.4 45.5 22.4 50.6 20.9 4.8 –1,500-1,999. . . . . . . . . . . . . . . . . . . . . . . . . 24.6 27.2 9.0 36.5 16.9 16.0 19.2 7.2 21.1 16.9 9.1 9.6 5.4 12.6 8.42,000-2,499. . . . . . . . . . . . . . . . . . . . . . . . . 7.7 7.3 6.0 9.3 10.0 3.8 4.4 2.2 4.9 4.0 2.0 2.4 1.6 2.5 1.0Less than 2,500. . . . . . . . . . . . . . . . . . . . . . 43.2 45.1 27.5 59.4 28.3 33.4 36.8 20.3 44.4 23.4 25.8 27.9 16.4 35.8 13.42,500-2,999. . . . . . . . . . . . . . . . . . . . . . . . . 2.6 2.4 1.7 4.3 2.1 1.1 0.8 1.1 1.2 1.6 0.8 0.5 0.9 0.6 1.43,000-3,499. . . . . . . . . . . . . . . . . . . . . . . . . 1.3 1.2 0.8 2.2 0.9 0.4 0.5 0.4 0.5 0.3 0.2 0.3 0.2 0.1 0.33,500-3,999. . . . . . . . . . . . . . . . . . . . . . . . . 0.8 0.9 0.7 1.1 0.3 0.4 0.2 0.5 0.4 0.3 0.3 0.1 0.4 0.2 0.34,000-4,499. . . . . . . . . . . . . . . . . . . . . . . . . 0.6 0.4 0.7 0.8 – 0.1 0.4 – – – 0.1 0.4 – – –4,500-4,999. . . . . . . . . . . . . . . . . . . . . . . . . – – – – ** – – – – ** – – – – **5,000 & Over. . . . . . . . . . . . . . . . . . . . . . . . ** ** ** ** ** ** ** ** ** ** ** ** ** ** **2,500 & Over. . . . . . . . . . . . . . . . . . . . . . . . 1.4 1.3 0.9 2.4 1.0 0.5 0.5 0.5 0.6 0.6 0.3 0.3 0.4 0.2 0.5Total. . . . . . . . . . . . . . . . . . . . . . . . . . . . . . . 5.5 5.2 3.3 10.2 3.2 3.6 3.5 2.1 6.5 2.4 2.7 2.6 1.6 4.9 1.6
* Rate per 1,000 live births. Births and deaths included here were registered in 2008 and do not represent a true birth cohort. ** Rate not computed where number of births is less than 100.Non-H=non-Hispanic; P.I.=Parcific Islander.

61
Table 42c. Live Births and Infant Deaths by Gestational Age, Ethnic Group*, and Age, New York City, 2008
Infant DeathsLive Births Total Age Under 28 Days Age Under 7 Days
Non-H Non-H Asian Other/ Non-H Non-H Asian Other/ Non-H Non-H Asian Other/ Non-H Non-H Asian Other/Gestational Age in Weeks Total Hispanic White Black & P.I. Unk. Total Hispanic White Black & P.I. Unk. Total Hispanic White Black & P.I. Unk. Total Hispanic White Black & P.I. Unk.Extreme preterm (<28) . . . . . . . . . . 913 264 150 425 59 15 320 90 48 154 20 8 272 78 42 125 19 8 233 65 36 111 15 628-31 . . . . . . . . . . . . . . . . . . . . . . . 1,246 386 259 460 107 34 69 25 14 25 3 2 45 20 7 14 3 1 29 15 5 8 – 1Very preterm (<32) . . . . . . . . . . . . 2,159 650 409 885 166 49 389 115 62 179 23 10 317 98 49 139 22 9 262 80 41 119 15 732-33 . . . . . . . . . . . . . . . . . . . . . . . 1,576 490 365 512 162 47 29 10 4 10 3 2 20 7 3 7 2 1 10 3 2 4 – 134-36 . . . . . . . . . . . . . . . . . . . . . . . 8,720 2,736 2,298 2,399 1,059 228 60 19 8 20 12 1 32 9 3 13 7 – 17 6 2 6 3 –32-36 . . . . . . . . . . . . . . . . . . . . . . . 10,296 3,226 2,663 2,911 1,221 275 89 29 12 30 15 3 52 16 6 20 9 1 27 9 4 10 3 1Preterm (<37). . . . . . . . . . . . . . . . . 12,455 3,876 3,072 3,796 1,387 324 478 144 74 209 38 13 369 114 55 159 31 10 289 89 45 129 18 837 or more . . . . . . . . . . . . . . . . . . . 115,212 36,502 35,306 24,120 16,815 2,469 174 53 36 64 18 3 74 24 20 16 11 3 44 14 14 6 9 1Not stated. . . . . . . . . . . . . . . . . . . . 13 2 5 1 2 3 1 – – – 1 – 1 – – – 1 – 1 – – – 1 –Unmatched**. . . . . . . . . . . . . . . . . – – – – – – 45 14 15 11 2 3 22 4 7 7 1 3 11 2 2 3 1 3Total. . . . . . . . . . . . . . . . . . . . . . . . 127,680 40,380 38,383 27,917 18,204 2,796 698 211 125 284 59 19 466 142 82 182 44 16 345 105 61 138 29 12
* See Technical Notes: Demographics, Race/Ethnicity in Infant Mortality.**Birth occurred outside of New York City or positive identification of matching birth certificate could not be made. Non-H=non-Hispanic; P.I.=Parcific Islander; Unk=Unknown.
Table 42d. Infant Mortality Rates* by Gestational Age, Ethnic Group, and Age, New York City, 2008
Total Age Under 28 Days Age Under 7 Days Non-H Non-H Asian & Non-H Non-H Asian & Non-H Non-H Asian &
Gestational Age in Weeks Total Hispanic White Black P.I. Total Hispanic White Black P.I. Total Hispanic White Black P.I.Extreme preterm (<28) . . . . . . . . . . . . . . . . 350.5 340.9 320.0 362.4 ** 297.9 295.5 280.0 294.1 ** 255.2 246.2 240.0 261.2 **28-31 . . . . . . . . . . . . . . . . . . . . . . . . . . . . . . 55.4 64.8 54.1 54.3 28.0 36.1 51.8 27.0 30.4 28.0 23.3 38.9 19.3 17.4 –Very preterm (<32). . . . . . . . . . . . . . . . . . . 180.2 176.9 151.6 202.3 138.6 146.8 150.8 119.8 157.1 132.5 121.4 123.1 100.2 134.5 90.432-33 . . . . . . . . . . . . . . . . . . . . . . . . . . . . . . 18.4 20.4 11.0 19.5 18.5 12.7 14.3 8.2 13.7 12.3 6.3 6.1 5.5 7.8 –34-36 . . . . . . . . . . . . . . . . . . . . . . . . . . . . . . 6.9 6.9 3.5 8.3 11.3 3.7 3.3 1.3 5.4 6.6 1.9 2.2 0.9 2.5 2.832-36 . . . . . . . . . . . . . . . . . . . . . . . . . . . . . . 8.6 9.0 4.5 10.3 12.3 5.1 5.0 2.3 6.9 7.4 2.6 2.8 1.5 3.4 2.5Preterm (<37). . . . . . . . . . . . . . . . . . . . . . . 38.4 37.2 24.1 55.1 27.4 29.6 29.4 17.9 41.9 22.4 23.2 23.0 14.6 34.0 13.037 or more . . . . . . . . . . . . . . . . . . . . . . . . . . 1.5 1.5 1.0 2.7 1.1 0.6 0.7 0.6 0.7 0.7 0.4 0.4 0.4 0.2 0.5Total. . . . . . . . . . . . . . . . . . . . . . . . . . . . . . . 5.5 5.2 3.3 10.2 3.2 3.6 3.5 2.1 6.5 2.4 2.7 2.6 1.6 4.9 1.6
* Rate per 1,000 live births. Births and deaths included here were registered in 2008 and do not represent a true birth cohort.
** Rate not computed where number of births is less than 100.Non-H=non-Hispanic; P.I.=Parcific Islander.
Table 43. Infant Deaths by Ethnic Group*, Sex, and Age, New York City, 2008
Age Under 7 Days Age 7 to 27 Days Age 28 Days and Over
Non-H Non-H Asian & Other/ Non-H Non-H Asian & Other/ Non-H Non-H Asian & Other/Sex Total Total Hispanic White Black P.I. Unknown Total Hispanic White Black P.I. Unknown Total Hispanic White Black P.I. UnknownMale . . . . . . . . . . . . . . . . . . . . . . . . . . . . . . . 394 198 63 31 79 16 9 65 22 12 21 6 4 131 45 25 56 5 –Female . . . . . . . . . . . . . . . . . . . . . . . . . . . . . 304 147 42 30 59 13 3 56 15 9 23 9 – 101 24 18 46 10 3Total . . . . . . . . . . . . . . . . . . . . . . . . . . . . . . . 698 345 105 61 138 29 12 121 37 21 44 15 4 232 69 43 102 15 3* See Technical Notes: Demographics, Race/Ethnicity in Infant Mortality.Non-H=non-Hispanic; P.I.=Parcific Islander; Unk=Unknown.

62
Table 44. Infant Deaths by Cause, Sex, and Age, New York City, 2008
ICD10/ICD9 Male FemaleComparability
Ratio* TotalUnder 7
Days7 to 27Days
28 Days &Over
Under 7Days
7 to 27Days
28 Days &Over
Total. . . . . . . . . . . . . . . . . . . . . . . . . . . . . . . . . . . . . . . . . . . . . . . . . . . . . . . . . . . 698 198 65 131 147 56 101Cause of Death (ICD-10 Codes) # Diseases of the Circulatory System (I00-I99). . . . . . . . . . . . . . . . . . . . . . . . . . 0.66 13 1 2 5 1 – 4 # Influenza and Pneumonia (J10-J18). . . . . . . . . . . . . . . . . . . . . . . . . . . . . . . . . 0.73 5 – – 3 – – 2 # Newborn Affected by Maternal Complications of Pregnancy (P01). . . . . . . . . 1.05 9 5 – – 3 – 1 # Newborn Affected by Complications of Placenta, Cord and Membranes (P . . 1.02 19 10 – – 7 1 1 # Short Gestation and Low Birth Weight (P07). . . . . . . . . . . . . . . . . . . . . . . . . . 1.11 114 48 4 5 49 4 4 # Intrauterine Hypoxia and Birth Asphyxia (P20-P21). . . . . . . . . . . . . . . . . . . . 1.32 8 4 1 – 2 1 – # Respiratory Distress of Newborn (P22) . . . . . . . . . . . . . . . . . . . . . . . . . . . . . . 0.87 41 23 6 – 10 1 1 # Pulmonary Hemorrhage Originating in the Perinatal Period (P26). . . . . . . . . 1.53 9 5 1 – 3 – – # Atelectasis (P28.0-P28.1) . . . . . . . . . . . . . . . . . . . . . . . . . . . . . . . . . . . . . . . . 2.22 6 4 1 – 1 – – ##Other Respiratory Conditions Originating in the Perinatal Period (P23-P28 . . 11 4 2 3 1 – 1 ##Cardiovascular Disorders Originating in the Perinatal Period (P29) . . . . . . . . 96 42 8 – 35 11 – ##Infections Specific to the Perinatal Period (P35-P39) . . . . . . . . . . . . . . . . . . . 1.15 12 5 2 1 – 4 – # Neonatal Hemorrhage (P50-P52, P54) . . . . . . . . . . . . . . . . . . . . . . . . . . . . . . 1.31 6 2 1 – 2 – 1 # Necrotizing Enterocolitis of Newborn (P77) . . . . . . . . . . . . . . . . . . . . . . . . . . 1.19 17 1 5 2 2 7 – Remainder of Conditions Originating in the Perinatal Period (Rest of P00-P99) . . . . . . . . . . . . . . . . . . . . . . . . . . . . . . . . . . . . . . . . . . . . 22 5 2 2 7 5 1 # Congenital Malformations, Deformations (Q00-Q99). . . . . . . . . . . . . . . . . . . 0.93 151 34 22 31 21 19 24 Congenital Malformations of Heart (Q20-Q24). . . . . . . . . . . . . . . . . . . . . . 1.01 55 9 9 18 2 6 11 # Sudden Infant Death Syndrome (R95) . . . . . . . . . . . . . . . . . . . . . . . . . . . . . . 1.06 12 – 1 3 – – 8 All Other Diseases (Rest of A00-R99) . . . . . . . . . . . . . . . . . . . . . . . . . . . . . . . 78 1 4 45 3 3 22 ##External Causes (V01-Y89). . . . . . . . . . . . . . . . . . . . . . . . . . . . . . . . . . . . . . . 1.00 69 4 3 31 – – 31
* See Technical Notes: Cause of Death, Comparability Ratio. # Eligible to be ranked as leading causes nationally and in New York City. ## Contain causes eligible to be ranked as a leading cause nationally but infrequent in New York City; these created groups permit recognition of important causes of infant deaths.
Table 45. Infant Mortality Rate* by Mother's Birthplace, New York City, 2002-2008
Birthplace 2002 2003 2004 2005 2006 2007 2008Guyana . . . . . . . . . . . . . . . . . . . . . . . . . . . . . . . . . 8.5 7.8 7.4 9.2 8.2 7.5 10.7Haiti . . . . . . . . . . . . . . . . . . . . . . . . . . . . . . . . . . . 12.9 8.7 14.3 9.2 8.9 5.3 8.0Trinidad and Tobago . . . . . . . . . . . . . . . . . . . . . . . 6.3 4.7 8.6 6.0 9.5 4.8 7.7Jamaica . . . . . . . . . . . . . . . . . . . . . . . . . . . . . . . . . 7.6 10.3 8.3 7.8 9.4 5.1 7.2Pakistan . . . . . . . . . . . . . . . . . . . . . . . . . . . . . . . . . 7.5 6.3 8.6 6.2 8.6 6.8 7.1Nigeria . . . . . . . . . . . . . . . . . . . . . . . . . . . . . . . . . 4.2 2.6 5.6 8.9 7.9 3.5 5.2Guatemala . . . . . . . . . . . . . . . . . . . . . . . . . . . . . . . ** ** ** 3.9 1.8 5.4 5.1Mexico . . . . . . . . . . . . . . . . . . . . . . . . . . . . . . . . . 5.2 3.8 4.7 4.4 3.7 3.5 5.0Honduras . . . . . . . . . . . . . . . . . . . . . . . . . . . . . . . . 9.2 4.8 2.4 5.0 3.6 1.1 4.6Ghana . . . . . . . . . . . . . . . . . . . . . . . . . . . . . . . . . . 9.0 9.3 12.2 11.3 5.9 10.0 4.4Poland . . . . . . . . . . . . . . . . . . . . . . . . . . . . . . . . . . 5.7 2.6 1.2 7.4 0.0 2.0 4.1Dominican Republic . . . . . . . . . . . . . . . . . . . . . . . 3.8 5.8 4.1 5.1 4.1 3.4 3.8Ukraine . . . . . . . . . . . . . . . . . . . . . . . . . . . . . . . . . 1.5 2.7 6.8 1.4 0.0 3.8 3.8Canada . . . . . . . . . . . . . . . . . . . . . . . . . . . . . . . . . ** ** 7.1 3.8 3.3 0.0 3.5United Kingdom . . . . . . . . . . . . . . . . . . . . . . . . . . 4.7 9.4 3.2 6.9 6.3 1.6 3.4Ecuador . . . . . . . . . . . . . . . . . . . . . . . . . . . . . . . . . 3.2 3.4 2.6 3.5 3.5 5.2 3.0El Salvador . . . . . . . . . . . . . . . . . . . . . . . . . . . . . . . 4.0 4.0 0.0 6.2 8.2 3.8 2.5India . . . . . . . . . . . . . . . . . . . . . . . . . . . . . . . . . . . 1.8 3.1 4.9 5.6 4.4 3.1 2.3China . . . . . . . . . . . . . . . . . . . . . . . . . . . . . . . . . . . 1.4 3.6 2.6 1.8 2.1 1.6 2.2Yemen Arab Republic . . . . . . . . . . . . . . . . . . . . . . ** ** ** ** ** ** 2.0Bangladesh . . . . . . . . . . . . . . . . . . . . . . . . . . . . . . 2.7 4.0 4.5 2.6 2.4 4.2 1.8Philippines . . . . . . . . . . . . . . . . . . . . . . . . . . . . . . . 2.6 4.7 3.6 2.6 3.7 2.4 1.3Russia . . . . . . . . . . . . . . . . . . . . . . . . . . . . . . . . . . 1.1 2.0 4.1 4.7 4.3 0.0 1.1Colombia . . . . . . . . . . . . . . . . . . . . . . . . . . . . . . . . 0.8 7.8 3.4 0.9 3.8 0.0 1.0Korea . . . . . . . . . . . . . . . . . . . . . . . . . . . . . . . . . . . 2.4 0.0 2.0 2.2 2.1 2.6 1.0Israel . . . . . . . . . . . . . . . . . . . . . . . . . . . . . . . . . . . 4.7 1.8 5.4 0.8 2.6 2.4 0.0Peru . . . . . . . . . . . . . . . . . . . . . . . . . . . . . . . . . . . . 1.7 3.3 3.4 3.5 7.2 5.5 **Puerto Rico . . . . . . . . . . . . . . . . . . . . . . . . . . . . . . 9.0 8.3 4.6 7.4 12.0 6.6 6.9United States # . . . . . . . . . . . . . . . . . . . . . . . . . . . 6.7 6.8 6.6 5.9 6.3 6.2 6.1New York City Total . . . . . . . . . . . . . . . . . . . . . . . 6.0 6.5 6.1 6.0 5.9 5.4 5.5Note: The foreign countries listed are according to the descending order of infant mortality rates in most current year.* Infant mortality rate per 1,000 live births. ** Live births are less than 500 in that year. For each year, only countries with 500 or more live births are listed.# Beginning in 2006, U.S. Virgin Islands and Guam are included in the United States.

63
Table 46. Live Births, Infant Mortality, and Maternal Mortality by Mother's Ethnic Group New York City, 1992-2008
Mother's Ethnic Group* 1992 1993 1994 1995 1996 1997 1998 1999 2000 2001 2002** 2003 2004 2005 2006 2007 2008
Live Births, Total . . . . . . . . . . . . . . . . . . . . . . . 136,002 133,583 133,662 131,009 126,901 123,313 124,252 123,739 125,563 124,023 122,937 124,345 124,099 122,725 125,506 128,961 127,680 Puerto Rican . . . . . . . . . . . . . . . . . . . . . . . . 17,856 16,568 15,182 13,895 12,925 12,947 13,056 12,184 11,615 10,846 10,678 10,172 10,140 9,922 10,111 10,229 10,351 Other Hispanic . . . . . . . . . . . . . . . . . . . . . . 25,556 26,571 28,298 29,717 28,114 26,108 26,793 27,887 28,695 29,310 29,229 29,587 29,658 29,619 30,300 30,483 30,029 Asian and Pacific Islander . . . . . . . . . . . . . . 12,688 10,742 11,268 11,647 12,782 13,226 13,132 13,768 15,106 14,662 15,396 16,577 16,736 16,407 17,356 19,291 18,204 Non-Hispanic White . . . . . . . . . . . . . . . . . 37,102 38,403 38,203 36,711 37,215 37,006 36,957 36,369 36,752 36,581 36,445 38,018 37,659 37,340 38,231 39,351 38,383 Non-Hispanic Black . . . . . . . . . . . . . . . . . 40,662 39,768 39,195 37,217 34,798 33,500 33,675 32,960 32,879 32,123 30,690 29,646 29,449 28,935 29,077 29,268 27,917 Other or Unknown . . . . . . . . . . . . . . . . . . 2,138 1,531 1,516 1,822 1,067 526 639 571 516 501 499 345 457 502 431 339 2,796
Infant Deaths (under 1 year)*** Total . . . . . . . 1,390 1,366 1,207 1,155 992 881 843 848 839 760 742 807 760 732 740 697 698 Puerto Rican . . . . . . . . . . . . . . . . . . . . . . . . 194 178 120 146 112 96 85 95 98 74 83 81 76 66 94 64 68 Other Hispanic . . . . . . . . . . . . . . . . . . . . . . 170 196 174 197 164 141 129 156 140 151 150 164 133 135 129 130 143 Asian and Pacific Islander . . . . . . . . . . . . . . 73 61 57 57 56 51 49 55 59 46 39 58 69 61 62 59 59 Non-Hispanic White . . . . . . . . . . . . . . . . . 227 244 223 204 197 189 201 167 165 154 148 146 131 178 145 155 125 Non-Hispanic Black . . . . . . . . . . . . . . . . . 676 646 598 522 448 385 363 350 366 322 311 336 342 282 304 287 284 Other or Unknown . . . . . . . . . . . . . . . . . . 50 41 35 29 15 19 16 25 11 13 11 22 9 10 6 2 19
Infant Mortality Rate # Total . . . . . . . . . . . . . 10.2 10.2 9.0 8.8 7.8 7.1 6.8 6.9 6.7 6.1 6.0 6.5 6.1 6.0 5.9 5.4 5.5 Puerto Rican . . . . . . . . . . . . . . . . . . . . . . . . 10.9 10.7 7.9 10.5 8.7 7.4 6.5 7.8 8.4 6.8 7.8 8.0 7.5 6.7 9.3 6.3 6.6 Other Hispanic . . . . . . . . . . . . . . . . . . . . . . 6.7 7.4 6.1 6.6 5.8 5.4 4.8 5.6 4.9 5.2 5.1 5.5 4.5 4.6 4.3 4.3 4.8 Asian and Pacific Islander . . . . . . . . . . . . . . 5.8 5.7 5.1 4.9 4.4 3.9 3.7 4.0 3.9 3.1 2.5 3.5 4.1 3.7 3.6 3.1 3.2 Non-Hispanic White . . . . . . . . . . . . . . . . . 6.1 6.4 5.8 5.6 5.3 5.1 5.4 4.6 4.5 4.2 4.1 3.8 3.5 4.8 3.8 3.9 3.3 Non-Hispanic Black . . . . . . . . . . . . . . . . . 16.6 16.2 15.3 14.0 12.9 11.5 10.8 10.6 11.1 10.0 10.1 11.3 11.6 9.7 10.5 9.8 10.2
Neonatal Deaths (under 28 days) Total . . . . . . 941 917 804 811 656 605 593 606 583 524 497 542 516 481 484 430 466 Puerto Rican . . . . . . . . . . . . . . . . . . . . . . . . 138 108 67 113 72 60 60 74 59 54 59 51 47 42 54 37 43 Other Hispanic . . . . . . . . . . . . . . . . . . . . . . 120 136 122 143 113 107 92 113 94 112 106 110 92 93 91 82 99 Asian and Pacific Islander . . . . . . . . . . . . . . 50 38 42 44 35 37 34 39 45 29 26 43 45 42 41 39 44 Non-Hispanic White . . . . . . . . . . . . . . . . . 157 177 158 146 139 130 139 120 119 102 100 99 89 129 105 93 82 Non-Hispanic Black . . . . . . . . . . . . . . . . . 436 425 389 342 283 257 252 236 257 215 196 221 237 166 190 177 182 Neonatal Mortality Rate # Total. . . . . . . . . . . . 6.9 6.9 6.0 6.2 5.2 4.9 4.8 4.9 4.6 4.2 4.0 4.4 4.2 3.9 3.9 3.3 3.6 Puerto Rican . . . . . . . . . . . . . . . . . . . . . . . . 7.7 6.5 4.4 8.1 5.6 4.6 4.6 6.1 5.1 5.0 5.5 5.0 4.6 4.2 5.3 3.6 4.2 Other Hispanic . . . . . . . . . . . . . . . . . . . . . . 4.7 5.1 4.3 4.8 4.0 4.1 3.4 4.1 3.3 3.8 3.6 3.7 3.1 3.1 3.0 2.7 3.3 Asian and Pacific Islander . . . . . . . . . . . . . . 3.9 3.5 3.7 3.8 2.7 2.8 2.6 2.8 3.0 2.0 1.7 2.6 2.7 2.6 2.4 2.0 2.4 Non-Hispanic White . . . . . . . . . . . . . . . . . 4.2 4.6 4.1 4.0 3.7 3.5 3.8 3.3 3.2 2.8 2.7 2.6 2.4 3.5 2.7 2.4 2.1 Non-Hispanic Black . . . . . . . . . . . . . . . . . 10.7 10.7 9.9 9.2 8.1 7.7 7.5 7.2 7.8 6.7 6.4 7.5 8.0 5.7 6.5 6.0 6.5
Maternal Deaths ## Total . . . . . . . . . . . . . . . . 30 20 29 26 22 17 16 24 30 41 31 22 28 21 29 32 39 Puerto Rican . . . . . . . . . . . . . . . . . . . . . . . . 2 2 4 3 1 1 1 1 – 2 – 1 – – 3 2 4 Other Hispanic . . . . . . . . . . . . . . . . . . . . . . 3 2 5 7 4 2 2 3 7 7 6 1 8 5 3 5 5 Asian and Pacific Islander . . . . . . . . . . . . . . 1 – 2 1 1 1 1 1 1 – – 1 4 1 5 3 3 Non-Hispanic White . . . . . . . . . . . . . . . . . 6 – 6 – 4 2 2 6 2 4 7 3 1 2 – 2 4 Non-Hispanic Black . . . . . . . . . . . . . . . . . 16 14 12 14 11 11 10 12 20 27 17 16 15 13 18 20 22 Maternal Mortality Ratio ### Total . . . . . . . . . 22.1 15.0 21.7 19.8 17.3 13.8 12.9 19.4 23.9 33.1 25.2 17.7 22.6 17.1 23.1 24.8 30.5 Puerto Rican . . . . . . . . . . . . . . . . . . . . . . . . 11.2 12.1 26.3 21.6 7.7 7.7 7.7 8.2 – 18.4 – 9.8 – – 29.7 19.6 38.6 Other Hispanic . . . . . . . . . . . . . . . . . . . . . . 11.7 7.5 17.7 23.6 14.2 7.7 7.5 10.8 24.4 23.9 20.5 3.4 27.0 16.9 9.9 16.4 16.7 Asian and Pacific Islander . . . . . . . . . . . . . . 7.9 – 17.7 8.6 7.8 7.6 7.6 7.3 6.6 – – 6.0 23.9 6.1 28.8 15.6 16.5 Non-Hispanic White . . . . . . . . . . . . . . . . . 16.2 – 15.7 – 10.7 5.4 5.4 16.5 5.4 10.9 19.2 7.9 2.7 5.4 – 5.1 10.4 Non-Hispanic Black . . . . . . . . . . . . . . . . . 39.3 35.2 30.6 37.6 31.6 32.8 29.7 36.4 60.8 84.1 55.4 54.0 50.9 44.9 61.9 68.3 78.8 . * See Technical Notes: Race, Ancestry, Ethnic Group, and Birthplace.** A cause-of-death coding error was found for 2002. As a result, death of maternal cause was reduced by one and HIV disease death increased by one.*** See Technical Notes: Demographics, Race/Ethnicity in Infant Mortality.# Rate per 1,000 live births.## See Rates and Ratios Defined and Technical Notes: Maternal Death and Maternal Mortality. ### Ratio per 100,000 live births.

64
Table 47. Number of Selected Reportable Diseases, New York City, 1940-2008
Syphilis
Year Tuberculosis Measles RubellaWest Nile
Virus* PertussisMeningococcal
Meningitis Encephalitis Hepatitis A** Hepatitis B** TotalPrimary &Secondary Gonorrhea
1940 9,005 10,496 988 5,775 48 28 30,178 3,113 14,639
1941-1945 8,608 24,890 7,360 5,706 705 42 25,773 4,124 13,955
1946-1950 7,862 17,348 2,442 2,574 145 55 24,144 2,686 21,522
1951-1955 7,002 20,025 3,956 1,726 135 256 22,046 685 12,468
1956-1960 5,472 18,170 3,893 966 73 197 15,124 1,242 13,270
1961-1965 4,427 12,279 5,744 253 58 172 19,052 3,259 23,005
1966-1970 3,194 3,508 1,402 164 78 72 12,529 2,587 32,640
1971-1975 2,224 1,210 353 65 40 17 8,839 3,453 42,881
1976 2,151 497 163 43 51 20 6,832 2,494 40,5891977 1,605 804 336 47 64 20 566 670 4,749 1,881 39,3021978 1,307 405 152 54 88 30 499 493 5,567 2,060 40,2081979 1,530 859 290 44 91 17 386 488 6,680 2,552 40,0341980 1,514 1,210 105 30 110 15 364 562 5,906 2,387 43,6991981 1,582 108 55 25 91 20 606 879 6,878 2,568 45,8591982 1,594 49 36 53 104 21 689 1,117 7,296 2,602 46,9601983 1,651 72 87 61 89 14 507 1,327 6,822 2,473 46,1171984 1,629 113 111 20 75 9 560 1,528 6,796 2,285 48,0321985 1,843 181 184 26 70 18 N.A. N.A. 6,947 2,157 58,5321986 2,223 944 2 10 81 21 N.A. N.A. 6,465 2,111 69,9981987 2,197 449 3 15 57 8 172 1,213 10,472 4,452 84,0221988 2,317 57 7 11 66 6 368 1,307 11,966 5,042 52,4041989 2,545 135 16 19 50 9 502 1,418 13,748 4,362 40,5331990 3,520 1,108 4 21 79 12 791 674 16,195 4,265 35,2361991 3,673 1,909 2 22 30 5 1,283 440 14,895 3,133 28,9451992 3,811 68 0 24 28 9 883 439 13,439 2,246 21,7091993 3,235 19 22 116 40 5 1,028 472 10,476 1,129 18,4771994 2,995 15 1 223 40 11 942 544 7,640 626 19,2461995 2,445 5 6 36 54 8 1,008 494 7,577 362 16,3611996 2,053 12 5 62 56 4 619 495 5,670 138 12,9981997 1,730 13 25 42 57 14 920 460 4,889 97 14,5561998 1,558 0 17 12 35 14 575 415 4,503 82 12,1001999 1,460 3 6 47 7 59 143 412 305 3,682 130 12,2072000 1,332 13 8 14 11 46 178 550 571 2,661 117 11,6692001 1,261 7 6 9 6 42 172 454 666 3,267 282 12,6142002 1,084 6 2 29 5 31 211 469 721 3,444 434 12,8112003 1,140 5 2 32 28 45 169 448 211 3,767 531 13,4682004 1,039 5 2 5 61 31 183 354 163 3,674 621 10,8602005 984 6 1 14 40 27 214 277 134 3,182 616 10,5962006 953 3 2 12 112 58 106 120 120 3,719 578 10,2992007 914 5 2 18 156 22 177 156 122 4,195 913 10,3102008 895 28 1 15 114 28 249 113 114 4,675 1,065 10,483
Note: Figures for single years from 1941 to 1975 appear in the Annual Summaries for 2007 and earlier. Scarlet fever is no longer reportable in 2008 and it is taken out from this table.* Includes cases of West Nile neuroinvasive disease and West Nile fever.** Accurate diagnosis of Hepatitis A&B based on laboratory testing became available in 1977. Clinically defined cases of Hepatitis reported earlier appear in the 1998 Annual Summary and earlier. The method of counting Hepatitis B beginning 2003 was changed so that cases represent newly acquired cases of Hepatitis B. The numbers are probable or definite new cases.Data source: Bureaus of Communicable Disease, Immunization, and Tuberculosis Control, New York City Department of Health and Mental Hygiene.
Table 48. Incidence of AIDS By Sex, Major Risk Group, and Year of Diagnosis, New York City, 1981-2008
Sex/Risk Group 1981-1995 1996 1997 1998 1999 2000 2001 2002 2003 2004 2005 2006 2007 2008 Male
Sex with Men 32,024 2,063 1,514 1,162 1,168 1,322 1,225 1,080 1,342 1,197 1,194 1,143 1,058 1,018Injection Drug Use (IDU) History 33,536 2,683 1,953 1,389 1,285 1,230 932 658 719 584 482 407 358 269
Heterosexual Transmission 1,319 422 373 339 322 395 410 368 323 283 260 245 203 180Perinatal 890 75 28 26 24 20 21 21 21 28 26 25 20 18
Other 417 41 24 32 9 15 9 * * * * * * 0Unknown/Under Investigation 5,277 1,434 1,223 937 931 1,243 1,211 1,078 1,196 894 895 792 743 727
Total 73,463 6,718 5,115 3,885 3,739 4,225 3,808 3,205 3,601 2,986 2,857 2,612 2,382 2,212 FemaleInjection Drug Use (IDU) History 11,096 1,059 833 589 526 559 407 279 293 269 215 155 147 123
Heterosexual Transmission 6,475 1,078 973 761 709 757 700 614 680 560 595 629 621 521Perinatal 899 52 55 20 18 19 37 22 21 25 27 25 20 22
Other 256 37 27 18 13 8 * 7 * * * * 0 *Unknown/Under Investigation 1,422 431 408 386 380 611 673 612 739 554 470 332 290 247
Total 20,148 2,657 2,296 1,774 1,646 1,954 1,817 1,534 1,733 1,408 1,307 1,141 1,078 913Note: Beginning in 2003, risk groups "Perinatal" and "Unknown/Under Investigation" were separated from "Other" category. Beginning in 2005, "Probable Heterosexuals" were taken outfrom "Male Heterosexual Transmission" and included in "Unknown/Under Investigation" category. To be classified as having AIDS, an HIV-infected person must meet CDC case-surveillance criteria. These include the presence of opportunistic illness or CD4+ lymphocyte count below200. For further information, call the HIV Epidemiology Program, (212) 442-3388. Figures include reports through September 30, 2008. Data for recent years are incomplete due to reporting lag. Data source: HIV Epidemiology and Field Service Program, Bureau of HIV/AIDS, New York City Department of Health and Mental Hygiene.
* Cells represents 1-5 person(s).

65
Table 49. Marriages, Births, Deaths, and Infant Deaths by Month and Average per Day New York City, 2008
Number Average Per DayInfant Infant
Months Marriages Births Deaths Deaths Marriages Births Deaths DeathsJanuary . . . . . . . . 4,390 10,886 4,877 60 142 351 157 1.9February . . . . . . . 4,850 10,002 4,874 62 167 345 168 2.1March . . . . . . . . . 5,169 10,470 5,163 73 167 338 167 2.4April . . . . . . . . . . 5,751 10,201 4,471 44 192 340 149 1.5May . . . . . . . . . . . 6,068 10,772 4,447 60 196 347 143 1.9June . . . . . . . . . . . 6,290 10,569 4,310 53 210 352 144 1.8July . . . . . . . . . . . 6,581 10,929 4,307 54 212 353 139 1.7August . . . . . . . . . 6,645 11,032 4,246 54 214 356 137 1.7September . . . . . . 5,844 10,962 4,100 59 195 365 137 2.0October . . . . . . . . 5,599 11,015 4,403 68 181 355 142 2.2November . . . . . . 4,363 10,103 4,305 46 145 337 144 1.5December . . . . . . 5,120 10,739 4,690 65 165 346 151 2.1Total . . . . . . . . . . 66,670 127,680 54,193 698 182 349 148 1.9
Data source: Number of marriages is provided by New York City Office of City Clerk.
Table 50. Most Popular Baby Names by Sex New York City, Selected Years
GirlsRank 1898 1928 1948 1980 1985 1990 1995 2000 2005 2006 2007 2008
1 Mary Mary Linda Jennifer Jennifer Stephanie Ashley Ashley Emily Ashley Isabella* Sophia2 Catherine Marie Mary Jessica Jessica Jessica Jessica Samantha Ashley Emily Sophia* Isabella3 Margaret Annie Barbara Melissa Christina Ashley Amanda Kayla Kayla Isabella Emily Emily4 Annie Margaret Patricia Nicole Stephanie Jennifer Samantha Emily Sarah Sarah Ashley Olivia5 Rose Catherine Susan Michelle Melissa Amanda Stephanie Brianna Isabella Kayla Sarah Sarah6 Marie Gloria Kathleen Elizabeth Nicole Samantha Jennifer Sarah Samantha Sophia Kayla Madison 7 Esther Helen Carol Lisa Elizabeth Nicole Nicole Jessica Sophia Mia Mia Ashley8 Sarah Teresa Nancy Christina Amanda Christina Sarah Nicole Nicole Madison Olivia Mia9 Frances Joan Margaret Tiffany Danielle Melissa Michelle Michelle Olivia Brianna* Samantha Samantha
10 Ida Barbara Diane Maria Lauren Michelle Emily Amanda Rachel Samantha* Rachel Emma
BoysRank 1898 1928 1948 1980 1985 1990 1995 2000 2005 2006 2007 2008
1 John John Robert Michael Michael Michael Michael Michael Michael Michael Daniel Jayden2 William William John David Christopher Christopher Christopher Justin Daniel Daniel Jayden Daniel3 Charles Joseph James Jason Daniel Jonathan Kevin Christopher Joshua Matthew Michael Michael4 George James Michael Joseph David Anthony Daniel Matthew David Joshua Matthew Matthew5 Joseph Richard William Christopher Anthony David Jonathan Daniel Justin Justin Justin David6 Edward Edward Richard Anthony Joseph Daniel Joseph Anthony Matthew David Joshua Joshua7 James Robert Joseph John Jonathan Joseph Anthony Joshua Anthony Christopher David Justin8 Louis Thomas Thomas Daniel Jason Matthew Matthew David Christopher Joseph Anthony Anthony9 Francis George Stephen Robert John John David Joseph Joseph Anthony Christopher Christopher
10 Samuel Louis David James Robert Andrew Justin Kevin Nicholas Jayden Joseph Ethan*Ryan*
* Tied ranks.
Table 51. Most Popular Baby Names by Sex and Mother's Ethnic Group New York City, 2008
Girls BoysRank Hispanic NH-Black NH-White Asian & P.I. Hispanic NH-Black NH-White Asian & P.I.
1 Ashley Madison Olivia Sophia Jayden Jayden Daniel Ryan 2 Isabella Kayla Esther Chloe Justin Joshua Joseph Eric3 Emily Makayla Sarah Emily Angel Elijah Michael Jason*4 Brianna Nevaeh Sophia Tiffany Anthony Jeremiah David Matthew*5 Mia Jada Rachel Fiona Christopher Christian Matthew Daniel6 Samantha Brianna Emma Isabella Daniel Michael Alexander Ethan7 Sophia Chloe Chaya Olivia Joshua Justin Jacob Kevin8 Melanie Destiny Ava Sarah Kevin Daniel Nicholas Justin9 Genesis Alyssa Leah Angela* Brandon* Ethan* Jack Ivan
10 Kimberly Gabrielle* Miriam Vivian* David* Tyler* Samuel VincentImani*
* Tied ranks.Note: Mothers of Hispanic ethnicity may be of any race. NH=non-Hispanic; P.I.=Parcific Islander. Mothers of other or unknown ethnicities not shown. See Technical Notes: Race, Ancestry, Ethnic Group, and Birthplace.

66
Table 52. Live Births by Borough and Institution, New York City, 2008
Borough and Institution BirthsManhattan
Allen Pavilion . . . . . . . . . . . . . . . . . . . . . . . . . . . . . . . . . . . . . . . . . . . . . . . . . 2,374Bellevue Hospital Center . . . . . . . . . . . . . . . . . . . . . . . . . . . . . . . . . . . . . . . . 1,892Beth Israel Medical Center . . . . . . . . . . . . . . . . . . . . . . . . . . . . . . . . . . . . . . . 3,794Columbia Presbyterian Medical Center . . . . . . . . . . . . . . . . . . . . . . . . . . . . . 4,526Harlem Hospital Center . . . . . . . . . . . . . . . . . . . . . . . . . . . . . . . . . . . . . . . . . 1,194Lenox Hill Hospital . . . . . . . . . . . . . . . . . . . . . . . . . . . . . . . . . . . . . . . . . . . . 3,682Metropolitan Hospital Center . . . . . . . . . . . . . . . . . . . . . . . . . . . . . . . . . . . . . 1,747Mount Sinai Hospital . . . . . . . . . . . . . . . . . . . . . . . . . . . . . . . . . . . . . . . . . . . 6,094New York Downtown Hospital . . . . . . . . . . . . . . . . . . . . . . . . . . . . . . . . . . . 2,360New York Weill Cornell Medical Center . . . . . . . . . . . . . . . . . . . . . . . . . . . . 5,496NYU Hospital Center - Tisch Hospital . . . . . . . . . . . . . . . . . . . . . . . . . . . . . . 4,785St. Luke's - Roosevelt Hospital Center / Roosevelt Hospital Division. . . . . . . . 6,203St. Vincent's Hospital Manhattan . . . . . . . . . . . . . . . . . . . . . . . . . . . . . . . . . . 1,556Places other than a hospital or home*. . . . . . . . . . . . . . . . . . . . . . . . . . . . . . . 25Home** . . . . . . . . . . . . . . . . . . . . . . . . . . . . . . . . . . . . . . . . . . . . . . . . . . . . . 397
BronxBronx Lebanon Hospital Center . . . . . . . . . . . . . . . . . . . . . . . . . . . . . . . . . . . 2,793Jack D. Weiler Hospital of the Albert Einstein College of Medicine . . . . . . . . 5,121Jacobi Medical Center . . . . . . . . . . . . . . . . . . . . . . . . . . . . . . . . . . . . . . . . . . 2,322Lincoln Medical and Mental Health Center . . . . . . . . . . . . . . . . . . . . . . . . . . 2,381North Central Bronx Hospital . . . . . . . . . . . . . . . . . . . . . . . . . . . . . . . . . . . . . 1,748Montefiore Medical Center, North Division #. . . . . . . . . . . . . . . . . . . . . . . . . 1,892St. Barnabas Hospital . . . . . . . . . . . . . . . . . . . . . . . . . . . . . . . . . . . . . . . . . . . 1,023Women's Health & Birthing Pavilion . . . . . . . . . . . . . . . . . . . . . . . . . . . . . . . 90Places other than a hospital or home*. . . . . . . . . . . . . . . . . . . . . . . . . . . . . . . 26Home** . . . . . . . . . . . . . . . . . . . . . . . . . . . . . . . . . . . . . . . . . . . . . . . . . . . . . 58
BrooklynBrookdale University Hospital and Medical Center . . . . . . . . . . . . . . . . . . . . 1,674Brooklyn Birthing Center . . . . . . . . . . . . . . . . . . . . . . . . . . . . . . . . . . . . . . . . 105Brooklyn Hospital Center . . . . . . . . . . . . . . . . . . . . . . . . . . . . . . . . . . . . . . . . 2,643Coney Island Hospital . . . . . . . . . . . . . . . . . . . . . . . . . . . . . . . . . . . . . . . . . . 1,291Interfaith Medical Center. . . . . . . . . . . . . . . . . . . . . . . . . . . . . . . . . . . . . . . . . 1Kings County Hospital Center . . . . . . . . . . . . . . . . . . . . . . . . . . . . . . . . . . . . . 2,645Long Island College Hospital . . . . . . . . . . . . . . . . . . . . . . . . . . . . . . . . . . . . . 2,090Lutheran Medical Center . . . . . . . . . . . . . . . . . . . . . . . . . . . . . . . . . . . . . . . . 4,566Maimonides Medical Center . . . . . . . . . . . . . . . . . . . . . . . . . . . . . . . . . . . . . . 7,378New York Methodist Hospital . . . . . . . . . . . . . . . . . . . . . . . . . . . . . . . . . . . . 5,308University Hospital of Brooklyn . . . . . . . . . . . . . . . . . . . . . . . . . . . . . . . . . . . 1,770Woodhull Medical and Mental Health Center . . . . . . . . . . . . . . . . . . . . . . . . 2,135Wyckoff Heights Medical Center . . . . . . . . . . . . . . . . . . . . . . . . . . . . . . . . . . 1,635Places other than a hospital or home*. . . . . . . . . . . . . . . . . . . . . . . . . . . . . . . 32Home** . . . . . . . . . . . . . . . . . . . . . . . . . . . . . . . . . . . . . . . . . . . . . . . . . . . . . 110
QueensElmhurst Hospital Center . . . . . . . . . . . . . . . . . . . . . . . . . . . . . . . . . . . . . . . . 3,980Flushing Hospital Medical Center . . . . . . . . . . . . . . . . . . . . . . . . . . . . . . . . . . 2,518Forest Hills Hospital . . . . . . . . . . . . . . . . . . . . . . . . . . . . . . . . . . . . . . . . . . . . 2,025Jamaica Hospital Medical Center . . . . . . . . . . . . . . . . . . . . . . . . . . . . . . . . . . 2,846Long Island Jewish Medical Center . . . . . . . . . . . . . . . . . . . . . . . . . . . . . . . . . 5,346Mary Immaculate Hospital. . . . . . . . . . . . . . . . . . . . . . . . . . . . . . . . . . . . . . . 1Mount Sinai Hospital of Queens. . . . . . . . . . . . . . . . . . . . . . . . . . . . . . . . . . . 2New York Hospital Medical Center of Queens . . . . . . . . . . . . . . . . . . . . . . . . 3,838Queens Hospital Center . . . . . . . . . . . . . . . . . . . . . . . . . . . . . . . . . . . . . . . . . 2,142St. John's Episcopal Hospital . . . . . . . . . . . . . . . . . . . . . . . . . . . . . . . . . . . . . . 848St. John's Queens Hospital . . . . . . . . . . . . . . . . . . . . . . . . . . . . . . . . . . . . . . . 1,225Places other than a hospital or home*. . . . . . . . . . . . . . . . . . . . . . . . . . . . . . . 16Home** . . . . . . . . . . . . . . . . . . . . . . . . . . . . . . . . . . . . . . . . . . . . . . . . . . . . . 48
Staten IslandRichmond University Medical Center . . . . . . . . . . . . . . . . . . . . . . . . . . . . . . . 2,960Staten Island University Hospital . . . . . . . . . . . . . . . . . . . . . . . . . . . . . . . . . . 2,915Places other than a hospital or home*. . . . . . . . . . . . . . . . . . . . . . . . . . . . . . . 5Home** . . . . . . . . . . . . . . . . . . . . . . . . . . . . . . . . . . . . . . . . . . . . . . . . . . . . . 3
New York City Total . . . . . . . . . . . . . . . . . . . . . . . . . . . . . . . . . . . . . . . . . . . . . . . . 127,680* Known Places include ambulance, taxi, airplane, etc.** Home births reported in this table excludes home births that are filed by a medical institution.# The institution name was changed from Our Lady of Mercy Medical Center in July 2008.
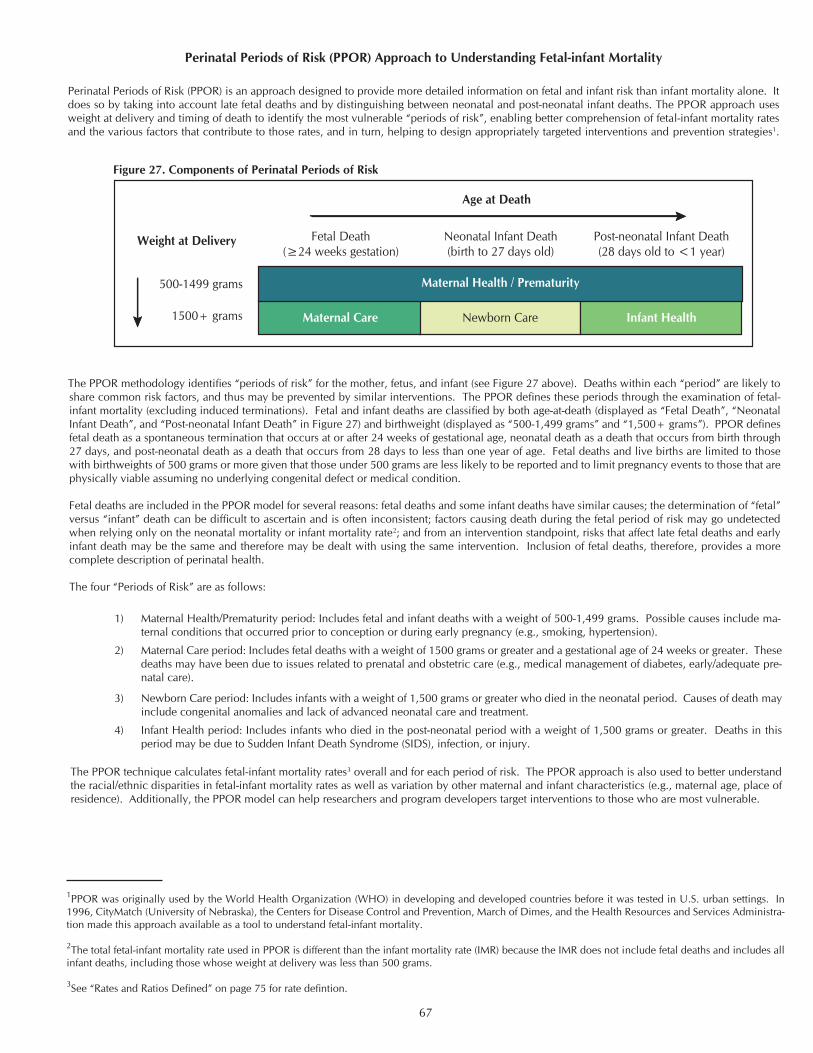
67
Perinatal Periods of Risk (PPOR) Approach to Understanding Fetal-infant Mortality
Perinatal Periods of Risk (PPOR) is an approach designed to provide more detailed information on fetal and infant risk than infant mortality alone. It does so by taking into account late fetal deaths and by distinguishing between neonatal and post-neonatal infant deaths. The PPOR approach uses weight at delivery and timing of death to identify the most vulnerable “periods of risk”, enabling better comprehension of fetal-infant mortality rates and the various factors that contribute to those rates, and in turn, helping to design appropriately targeted interventions and prevention strategies1.
Figure 27. Components of Perinatal Periods of Risk
Maternal Care Newborn Care Infant Health
Maternal Health / Prematurity
Fetal Death(≥24 weeks gestation)
Neonatal Infant Death(birth to 27 days old)
Post-neonatal Infant Death(28 days old to <1 year)
Age at Death
Weight at Delivery
500-1499 grams
1500+ grams
The PPOR methodology identifi es “periods of risk” for the mother, fetus, and infant (see Figure 27 above). Deaths within each “period” are likely to share common risk factors, and thus may be prevented by similar interventions. The PPOR defi nes these periods through the examination of fetal-infant mortality (excluding induced terminations). Fetal and infant deaths are classifi ed by both age-at-death (displayed as “Fetal Death”, “Neonatal Infant Death”, and “Post-neonatal Infant Death” in Figure 27) and birthweight (displayed as “500-1,499 grams” and “1,500+ grams”). PPOR defi nes fetal death as a spontaneous termination that occurs at or after 24 weeks of gestational age, neonatal death as a death that occurs from birth through 27 days, and post-neonatal death as a death that occurs from 28 days to less than one year of age. Fetal deaths and live births are limited to those with birthweights of 500 grams or more given that those under 500 grams are less likely to be reported and to limit pregnancy events to those that are physically viable assuming no underlying congenital defect or medical condition.
Fetal deaths are included in the PPOR model for several reasons: fetal deaths and some infant deaths have similar causes; the determination of “fetal” versus “infant” death can be diffi cult to ascertain and is often inconsistent; factors causing death during the fetal period of risk may go undetected when relying only on the neonatal mortality or infant mortality rate2; and from an intervention standpoint, risks that affect late fetal deaths and early infant death may be the same and therefore may be dealt with using the same intervention. Inclusion of fetal deaths, therefore, provides a more complete description of perinatal health.
The four “Periods of Risk” are as follows:
Maternal Health/Prematurity period: Includes fetal and infant deaths with a weight of 500-1,499 grams. Possible causes include ma-ternal conditions that occurred prior to conception or during early pregnancy (e.g., smoking, hypertension).
Maternal Care period: Includes fetal deaths with a weight of 1500 grams or greater and a gestational age of 24 weeks or greater. These deaths may have been due to issues related to prenatal and obstetric care (e.g., medical management of diabetes, early/adequate pre-natal care).
Newborn Care period: Includes infants with a weight of 1,500 grams or greater who died in the neonatal period. Causes of death may include congenital anomalies and lack of advanced neonatal care and treatment.
Infant Health period: Includes infants who died in the post-neonatal period with a weight of 1,500 grams or greater. Deaths in this period may be due to Sudden Infant Death Syndrome (SIDS), infection, or injury.
The PPOR technique calculates fetal-infant mortality rates3 overall and for each period of risk. The PPOR approach is also used to better understand the racial/ethnic disparities in fetal-infant mortality rates as well as variation by other maternal and infant characteristics (e.g., maternal age, place of residence). Additionally, the PPOR model can help researchers and program developers target interventions to those who are most vulnerable.
1PPOR was originally used by the World Health Organization (WHO) in developing and developed countries before it was tested in U.S. urban settings. In 1996, CityMatch (University of Nebraska), the Centers for Disease Control and Prevention, March of Dimes, and the Health Resources and Services Administra-tion made this approach available as a tool to understand fetal-infant mortality.
2The total fetal-infant mortality rate used in PPOR is different than the infant mortality rate (IMR) because the IMR does not include fetal deaths and includes all infant deaths, including those whose weight at delivery was less than 500 grams.
3See “Rates and Ratios Defi ned” on page 75 for rate defi ntion.
1)
2)
3)
4)

68
1999 2000 2001 2002 2003 2004 2005 2006 2007 2008
Year
0
2
4
6
8
10
Rate
per
1,00
0B
irths
and
Feta
lDea
ths
Infant Health
Total Fetal-infant Mortality
Maternal Health/Prematurity
Maternal Care
Newborn Care
Figure 28. Fetal-infant Mortality Rates per 1,000Births and Fetal Deaths,
New York City, 1999-2008
Infant Heal th: Includes infants who died in the post-neonatal period with a weight of 1,500 grams or greater. Deaths in this period may be due to Sudden Infant Death Syndrome (SIDS), infection, or injury.
Newborn Care: Includes infants with a weight of 1,500 grams or greater who died in the neonatal period. Causes of death may include congenital anomalies and lack of advanced neonatal care and treatment.
Maternal Care: Includes fetal deaths with a weight of 1,500 grams or greater and a gestational age of 24 weeks or greater. These deaths may have been due to issues related to prenatal and obstetric care (e.g., medical management of diabetes, early/adequate prenatal care).
Maternal Health/Prematurity: Includes fetal and infant deaths with a weight of 500-1,499 grams. Possible causes include maternal conditions that occurred prior to conception or during early pregnancy (e.g., smoking, hypertension).
When applying the PPOR approach in New York City (Table 53), a decline in the overall fetal-infant mortality rate is observed from 2004 to 2008. The highest rates for these years occurred in the Maternal Health/Prematurity period. The bottom half of Table 53 provides fetal-infant mortality by ethnic group. Non-Hispanic blacks had the highest total fetal-infant mortality rate at 12.8, followed by Puerto Ricans at 7.6, Other Hispanics at 6.5, and Non-Hispanic whites and Asian and Pacifi c Islanders at 5.0. For all ethnic groups, the Maternal Health/Prematurity period contributes the most to the overall fetal-infant mortality rate. Using the principles of the PPOR model, interventions to further reduce fetal and infant mortality in New York City may need to focus on improving women’s health before pregnancy, including access to primary and precon-ception care, particularly among minority women.
Table 53a on the next page provides fetal-infant mortality by NYC borough and community district of residence and indicates that the Bronx had the highest total fetal-infant mortality rate at 9.1, followed by Brooklyn at 8.0, Queens at 6.3, Manhattan at 5.7, and Staten Island at 5.5. Community districts that have a fetal-infant mortality rate greater than 10 include Bedford Stuyvesant at 12.6, Brownsville at 12.5, Morrisania at 12.0, East New York at 11.5 , East Flatbush at 11.4, Mott Haven and Williamsbridge at 11.3, Crown Heights South at 10.4, and Crown Heights North at 10.2.
A comparison between the different “periods of risk” within a community district, as well as between community districts for a specifi c “period of risk”, may enable interventions to be targeted to the most appropriate period of vulnerability in those districts with the most need. For example, in East New York, Brooklyn, the rate in the Maternal Health/Prematurity period is relatively high compared to the other “periods of risk” for the same area. Thus, this district may benefi t most from interventions that focus on preconception health, unintended pregnancy, and specialized perinatal care. The district of Brownsville experienced the highest fetal-infant mortality rate in the Maternal Care period; thus, focus-ing efforts in this district on prenatal care and good medical management of diabetes, seizures, and other medical problems, may be the best way to reduce its fetal-infant mortality rate. The rate in the Infant Health period in the Midtown Business District continues to be high relative to both other districts and other periods of risk in Midtown, signaling a need to focus on interventions for infant health such as SIDS prevention, breastfeeding, health care access, and injury prevention in this district.
For further information on PPOR, see www.citymatch.org.
Table 53. Fetal-infant Mortality Rate per 1,000 Births and Fetal Deaths by Perinatal Period of Risk, Year, and Ethnic Group, New York City, 2004-2008
Births & FetalDeaths*
Maternal Health/Prematurity Maternal Care Newborn Care Infant Health
Total Fetal-infantMortality
Year Number Number Rate Number Rate Number Rate Number Rate Number Rate
2004 . . . . . . . . . . . . . . . . . . . . . . . . . . . 124,353 479 3.9 225 1.8 136 1.1 137 1.1 977 7.92005 . . . . . . . . . . . . . . . . . . . . . . . . . . . 122,976 451 3.7 222 1.8 122 1.0 140 1.1 935 7.62006 . . . . . . . . . . . . . . . . . . . . . . . . . . . 125,735 444 3.5 218 1.7 121 1.0 152 1.2 935 7.42007 . . . . . . . . . . . . . . . . . . . . . . . . . . . 129,227 470 3.6 199 1.5 112 0.9 153 1.2 934 7.22008 . . . . . . . . . . . . . . . . . . . . . . . . . . . 127,920 426 3.3 206 1.6 125 1.0 145 1.1 902 7.1Mother's Ethnic Group, 2004-2008Puerto Rican . . . . . . . . . . . . . . . . . . . . . 50,805 197 3.9 63 1.2 42 0.8 86 1.7 388 7.6Other Hispanic . . . . . . . . . . . . . . . . . . . 150,451 440 2.9 287 1.9 135 0.9 118 0.8 980 6.5Asian and Pacific Islander . . . . . . . . . . . 90,480 200 2.2 102 1.1 81 0.9 67 0.7 450 5.0Non-Hispanic white . . . . . . . . . . . . . . . 191,253 419 2.2 238 1.2 162 0.8 135 0.7 954 5.0Non-Hispanic black . . . . . . . . . . . . . . . . 145,021 982 6.8 364 2.5 193 1.3 319 2.2 1,858 12.8Other or unknown . . . . . . . . . . . . . . . . 2,201 32 14.5 16 7.3 3 1.4 2 0.9 53 24.1New York City . . . . . . . . . . . . . . . . . . . . 630,211 2,270 3.6 1,070 1.7 616 1.0 727 1.2 4,683 7.4* Limited to fetal deaths and live births of birthweight 500 grams or more and fetal deaths with gestation of at least 24 weeks.

69
Table 53a. Fetal-infant Mortality Rate per 1,000 Births and Fetal Deaths by Perinatal Period of Riskand Community District of Residence, New York City, 2004-2008
Births & FetalDeaths*
Maternal Health/Prematurity Maternal Care Newborn Care Infant Health
Total Fetal-infantMortality
Community District of Residence Number Number Rate Number Rate Number Rate Number Rate Number RateManhattan 100,880 273 2.7 134 1.3 77 0.8 91 0.9 575 5.7Battery Park, Tribeca (01). . . . . . . . . . 3,746 6 1.6 2 0.5 1 0.3 1 0.3 10 2.7Greenwich Village, SOHO (02). . . . . . 4,400 9 2.0 3 0.7 2 0.5 3 0.7 17 3.9Lower East Side (03). . . . . . . . . . . . . . 11,537 30 2.6 14 1.2 11 1.0 8 0.7 63 5.5Chelsea, Clinton (04). . . . . . . . . . . . . 4,449 11 2.5 3 0.7 0 0.0 1 0.2 15 3.4Midtown Business District (05). . . . . . 2,527 7 2.8 3 1.2 2 0.8 5 2.0 17 6.7Murray Hill (06). . . . . . . . . . . . . . . . . 6,443 17 2.6 10 1.6 4 0.6 5 0.8 36 5.6Upper West Side (07). . . . . . . . . . . . . 14,381 27 1.9 18 1.3 8 0.6 12 0.8 65 4.5Upper East Side (08). . . . . . . . . . . . . . 14,117 23 1.6 19 1.3 13 0.9 5 0.4 60 4.3Manhattanville (09). . . . . . . . . . . . . . . 7,419 31 4.2 12 1.6 8 1.1 16 2.2 67 9.0Central Harlem (10). . . . . . . . . . . . . . 8,619 42 4.9 13 1.5 7 0.8 15 1.7 77 8.9East Harlem (11). . . . . . . . . . . . . . . . . 8,891 38 4.3 17 1.9 7 0.8 10 1.1 72 8.1Washington Heights (12). . . . . . . . . . . 14,343 32 2.2 20 1.4 14 1.0 10 0.7 76 5.3Bronx 107,162 487 4.5 223 2.1 112 1.0 157 1.5 979 9.1Mott Haven (01). . . . . . . . . . . . . . . . . 8,376 47 5.6 16 1.9 14 1.7 18 2.1 95 11.3Hunts Point (02). . . . . . . . . . . . . . . . . 4,572 19 4.2 14 3.1 5 1.1 3 0.7 41 9.0Morrisania (03). . . . . . . . . . . . . . . . . . 6,729 34 5.1 14 2.1 12 1.8 21 3.1 81 12.0Concourse, Highbridge (04). . . . . . . . 14,337 59 4.1 37 2.6 14 1.0 19 1.3 129 9.0University/Morris Heights (05). . . . . . 12,637 52 4.1 30 2.4 16 1.3 21 1.7 119 9.4East Tremont (06). . . . . . . . . . . . . . . . 7,148 42 5.9 9 1.3 5 0.7 11 1.5 67 9.4Fordham (07). . . . . . . . . . . . . . . . . . . 12,381 48 3.9 20 1.6 10 0.8 9 0.7 87 7.0Riverdale (08). . . . . . . . . . . . . . . . . . . 5,765 14 2.4 7 1.2 2 0.3 8 1.4 31 5.4Unionport, Soundview (09). . . . . . . . . 13,269 70 5.3 26 2.0 8 0.6 13 1.0 117 8.8Throgs Neck (10). . . . . . . . . . . . . . . . 4,891 26 5.3 10 2.0 2 0.4 5 1.0 43 8.8Pelham Parkway (11). . . . . . . . . . . . . 7,050 25 3.5 20 2.8 6 0.9 5 0.7 56 7.9Williamsbridge (12). . . . . . . . . . . . . . 10,001 51 5.1 20 2.0 18 1.8 24 2.4 113 11.3Brooklyn 201,826 793 3.9 350 1.7 206 1.0 264 1.3 1613 8.0Williamsburg, Greenpoint (01). . . . . . 16,038 43 2.7 21 1.3 20 1.2 16 1.0 100 6.2Fort Greene, Brooklyn Heights (02). . . 6,023 24 4.0 4 0.7 5 0.8 5 0.8 38 6.3Bedford Stuyvesant (03). . . . . . . . . . . 11,657 69 5.9 31 2.7 22 1.9 25 2.1 147 12.6Bushwick (04). . . . . . . . . . . . . . . . . . . 10,419 45 4.3 14 1.3 14 1.3 11 1.1 84 8.1East New York (05). . . . . . . . . . . . . . . 14,372 94 6.5 25 1.7 11 0.8 35 2.4 165 11.5Park Slope (06). . . . . . . . . . . . . . . . . . 7,859 25 3.2 6 0.8 7 0.9 10 1.3 48 6.1Sunset Park (07). . . . . . . . . . . . . . . . . 14,061 31 2.2 21 1.5 9 0.6 9 0.6 70 5.0Crown Heights North (08). . . . . . . . . . 7,387 41 5.6 16 2.2 6 0.8 12 1.6 75 10.2Crown Heights South (09). . . . . . . . . . 8,546 46 5.4 19 2.2 12 1.4 12 1.4 89 10.4Bay Ridge (10). . . . . . . . . . . . . . . . . . 8,447 20 2.4 11 1.3 7 0.8 3 0.4 41 4.9Bensonhurst (11). . . . . . . . . . . . . . . . . 11,214 25 2.2 15 1.3 13 1.2 6 0.5 59 5.3Borough Park (12). . . . . . . . . . . . . . . . 24,346 39 1.6 37 1.5 22 0.9 22 0.9 120 4.9Coney Island (13). . . . . . . . . . . . . . . . 5,919 33 5.6 6 1.0 9 1.5 7 1.2 55 9.3Flatbush, Midwood (14). . . . . . . . . . . 13,831 61 4.4 31 2.2 14 1.0 20 1.4 126 9.1Sheepshead Bay (15). . . . . . . . . . . . . . 9,911 23 2.3 13 1.3 9 0.9 7 0.7 52 5.2Brownsville (16). . . . . . . . . . . . . . . . . 7,277 36 4.9 26 3.6 9 1.2 20 2.7 91 12.5East Flatbush (17). . . . . . . . . . . . . . . . 11,701 70 6.0 30 2.6 9 0.8 24 2.1 133 11.4Canarsie (18). . . . . . . . . . . . . . . . . . . 12,786 68 5.3 24 1.9 8 0.6 20 1.6 120 9.4Queens 138,413 398 2.9 200 1.4 126 0.9 152 1.1 876 6.3Astoria, Long Island City (01). . . . . . . 10,924 33 3.0 19 1.7 9 0.8 9 0.8 70 6.4Sunnyside, Woodside (02). . . . . . . . . 7,519 14 1.9 11 1.5 4 0.5 6 0.8 35 4.7Jackson Heights (03). . . . . . . . . . . . . . 14,192 34 2.4 26 1.8 12 0.8 14 1.0 86 6.1Elmhurst, Corona (04). . . . . . . . . . . . . 14,827 27 1.8 16 1.1 15 1.0 12 0.8 70 4.7Ridgewood, Glendale (05). . . . . . . . . 10,696 20 1.9 15 1.4 11 1.0 4 0.4 50 4.7Rego Park, Forest Hills (06). . . . . . . . . 6,283 13 2.1 10 1.6 3 0.5 4 0.6 30 4.8Flushing (07). . . . . . . . . . . . . . . . . . . 13,098 21 1.6 9 0.7 11 0.8 15 1.1 56 4.3Fresh Meadows, Briarwood (08). . . . . 8,874 26 2.9 9 1.0 10 1.1 11 1.2 56 6.3Woodhaven (09). . . . . . . . . . . . . . . . . 10,123 28 2.8 21 2.1 15 1.5 10 1.0 74 7.3Howard Beach (10). . . . . . . . . . . . . . . 7,483 30 4.0 7 0.9 1 0.1 7 0.9 45 6.0Bayside (11). . . . . . . . . . . . . . . . . . . 3,500 6 1.7 3 0.9 2 0.6 3 0.9 14 4.0Jamaica, St. Albans (12). . . . . . . . . . . . 15,160 75 4.9 23 1.5 17 1.1 30 2.0 145 9.6Queens Village (13). . . . . . . . . . . . . . 8,917 38 4.3 19 2.1 8 0.9 14 1.6 79 8.9The Rockaways (14). . . . . . . . . . . . . . 6,775 33 4.9 12 1.8 8 1.2 12 1.8 65 9.6Staten Island 28,817 86 3.0 27 0.9 18 0.6 28 1.0 159 5.5Port Richmond (01). . . . . . . . . . . . . . . 12,748 47 3.7 11 0.9 5 0.4 19 1.5 82 6.4Willowbrook, South Beach (02). . . . . 7,268 15 2.1 12 1.7 5 0.7 4 0.6 36 5.0Tottenville (03). . . . . . . . . . . . . . . . . . 8,691 24 2.8 4 0.5 8 0.9 5 0.6 41 4.7* Limited to fetal deaths and live births of birthweight 500 grams or more and fetal deaths with gestation of at least 24 weeks.Note: Borough totals may be higher than the sum of the community districts, as they may include some live births whose community district could not be determined.

70
Table 54. Smoking-Attributable Deaths, Age-Adjusted Death Rates* and
2003 2004 2005Age-Adjusted Rates Age-Adjusted Rates Age-Adjusted Rates
Deaths (Per 100,000) Deaths (Per 100,000) Deaths (Per 100,000)
Disease Category Male Female Total Male Female Total Male Female Total Male Female Total Male Female Total Male Female Total
Total 4,915 3,605 8,520 307.3 141.0 207.1 4,751 3,385 8,136 292.2 130.6 195.2 4,772 3,324 8,096 285.8 125.7 189.9
Malignant NeoplasmsLip, Oral Cavity, Pharynx 96 28 124 5.6 1.2 3.0 111 35 146 6.3 1.4 3.5 100 34 134 5.6 1.4 3.2
Esophagus 143 55 198 8.5 2.3 4.9 141 51 192 8.3 2.1 4.7 161 52 213 9.3 2.0 5.1
Stomach 71 29 100 4.4 1.2 2.5 66 28 94 4.1 1.1 2.3 75 24 99 4.5 0.9 2.3
Pancreas 81 97 178 4.9 3.9 4.4 81 103 184 4.8 4.1 4.4 83 91 174 4.8 3.6 4.1
Larynx 84 18 102 5.0 0.7 2.5 95 12 107 5.5 0.5 2.6 81 16 97 4.7 0.6 2.3
Trachea, Lung, Bronchus 1,500 998 2,498 92.3 41.6 62.0 1,483 904 2,387 90.6 37.2 58.6 1,426 904 2,330 85.3 37.1 56.5
Cervix Uteri 0 18 18 0.0 0.8 0.4 0 14 14 0.0 0.6 0.3 0 15 15 0.0 0.6 0.4
Kidney and Renal Pelvis 52 2 54 3.2 0.1 1.3 51 4 55 3.1 0.2 1.3 46 1 47 2.7 0.0 1.1
Urinary Bladder 80 27 107 5.3 1.1 2.6 85 27 112 5.5 1.0 2.7 84 29 113 5.4 1.1 2.7
Acute Myeloid Leukemia 26 8 34 1.6 0.3 0.8 24 11 35 1.5 0.5 0.9 27 9 36 1.6 0.4 0.9
Subtotal 2,133 1,280 3,413 130.8 53.2 84.4 2,137 1,189 3,326 129.7 48.7 81.3 2,083 1,175 3,258 123.9 47.7 78.6
Cardiovascular DiseasesIschemic Heart Disease 1,618 1,343 2,961 101.3 50.1 70.7 1,485 1,184 2,669 90.6 43.5 62.7 1,576 1,189 2,765 93.2 42.5 63.1
Other Heart Disease 108 80 188 6.9 3.0 4.5 106 70 176 6.7 2.6 4.2 103 63 166 6.2 2.3 3.8
Cerebrovascular Disease 135 113 248 7.6 4.7 5.9 127 101 228 7.1 4.1 5.4 107 102 209 5.9 4.1 4.8
Atherosclerosis 23 6 29 1.5 0.2 0.7 13 6 19 0.9 0.2 0.4 22 5 27 1.4 0.2 0.6
Aortic Aneurysm 80 43 123 4.9 1.7 3.0 88 40 128 5.3 1.6 3.1 105 48 153 6.1 1.8 3.6
Other Arterial Disease 7 9 16 0.4 0.3 0.4 8 12 20 0.5 0.5 0.5 7 9 16 0.4 0.3 0.4
Subtotal 1,971 1,594 3,565 122.6 60.0 85.2 1,827 1,413 3,240 111.1 52.5 76.3 1,920 1,416 3,336 113.2 51.2 76.3
Respiratory DiseasesPneumonia, Influenza 240 174 414 16.1 6.4 9.9 258 192 450 16.9 7.0 10.6 269 175 444 17.1 6.2 10.1
Bronchitis, Emphysema 76 59 135 4.8 2.4 3.3 68 55 123 4.3 2.1 3.0 64 52 116 3.9 1.9 2.7
Chronic Airway Obstruction 495 498 993 33.0 19.0 24.3 461 536 997 30.2 20.3 24.0 436 506 942 27.7 18.7 22.2
Subtotal 811 731 1,542 53.9 27.8 37.5 787 783 1,570 51.4 29.4 37.6 769 733 1,502 48.7 26.8 35.0
Notes:
Smoking prevalence rates are from NYC Community Health Survey and calculated by the Bureau of Epidemiology Services, New York City Department of Health and Mental Hygiene.Number does not include burn or second hand smoke deaths.See Technical Notes: Smoking- and Alcohol-Attributable Mortality for methodology.
* 2002-2005 population data are from U.S. Census Bureau's annual estimates as of December 2006. 2006-2008 population data are from U.S. Census Bureau'sannual pre-challenged estimates. See Technical Notes: Population.

71
Their Changes, Age 35 Years and Older, New York City, 2003-2008
2006 2007 2008 Change from 2003 to 2008Age-Adjusted Rates Age-Adjusted Rates Age-Adjusted Rates Age-Adjusted Rates
Deaths (Per 100,000) Deaths (Per 100,000) Deaths (Per 100,000) Deaths (Per 100,000)
Male Female Total Male Female Total Male Female Total Male Female Total Male Female Total Male Female TotalNumberChange
%Change
RateChange
% Changeof Rate
4,433 3,311 7,744 262.4 124.9 180.6 4,418 3,020 7,438 254.7 112.4 169.8 4,251 3,318 7,569 239.0 119.6 168.6 -951 -11.2% -38.5 -18.6%
91 20 111 5.0 0.8 2.6 97 23 120 5.2 0.9 2.7 90 24 114 4.8 0.9 2.6 -10 -8.1% -0.4 -13.3%
126 63 189 7.2 2.5 4.5 153 40 193 8.7 1.6 4.5 137 50 187 7.5 2.0 4.2 -11 -5.6% -0.7 -14.3%
67 24 91 4.0 1.0 2.2 58 23 81 3.3 0.9 1.9 66 22 88 3.7 0.8 2.0 -12 -12.0% -0.5 -20.0%
78 105 183 4.4 4.1 4.3 78 94 172 4.3 3.6 3.9 77 117 194 4.2 4.4 4.4 16 9.0% 0.0 0.0%
78 12 90 4.6 0.5 2.1 75 14 89 4.1 0.5 2.1 72 16 88 4.0 0.6 2.0 -14 -13.7% -0.5 -20.0%
1,359 912 2,271 80.0 36.8 54.3 1,371 912 2,283 79.5 36.2 53.6 1,353 906 2,259 76.1 35.1 51.8 -239 -9.6% -10.2 -16.5%
0 13 13 0.0 0.5 0.3 0 14 14 0.0 0.6 0.3 0 13 13 0.0 0.5 0.3 -5 -27.8% -0.1 -25.0%
48 4 52 2.8 0.2 1.2 52 1 53 2.9 0.0 1.2 43 2 45 2.4 0.1 1.0 -9 -16.7% -0.3 -23.1%
93 29 122 5.8 1.1 2.9 93 27 120 5.6 1.0 2.8 85 29 114 5.1 1.1 2.6 7 6.5% 0.0 0.0%
17 12 29 1.0 0.5 0.7 25 8 33 1.4 0.3 0.8 23 10 33 1.3 0.4 0.8 -1 -2.9% 0.0 0.0%
1,957 1,194 3,151 114.8 48.0 75.1 2,002 1,156 3,158 115.0 45.6 73.8 1,946 1,189 3,135 109.1 45.9 71.7 -278 -8.1% -12.7 -15.0%
1,483 1,228 2,711 86.7 44.0 61.7 1,444 1,031 2,475 82.2 36.1 54.9 1,366 1,177 2,543 75.3 39.9 54.8 -418 -14.1% -15.9 -22.5%
97 64 161 5.9 2.3 3.7 95 58 153 5.5 2.1 3.4 80 58 138 4.5 2.0 3.0 -50 -26.6% -1.5 -33.3%
114 99 213 6.1 3.9 4.8 104 85 189 5.4 3.3 4.2 90 88 178 4.6 3.3 3.9 -70 -28.2% -2.0 -33.9%
13 7 20 0.8 0.2 0.5 21 4 25 1.2 0.1 0.6 18 7 25 1.0 0.2 0.5 -4 -13.8% -0.2 -28.6%
78 42 120 4.5 1.6 2.8 83 41 124 4.7 1.6 2.9 51 27 78 2.9 1.0 1.8 -45 -36.6% -1.2 -40.0%
9 7 16 0.5 0.3 0.4 7 7 14 0.4 0.3 0.3 6 6 12 0.3 0.2 0.3 -4 -25.0% -0.1 -25.0%
1,794 1,447 3,241 104.5 52.3 73.9 1,754 1,226 2,980 99.4 43.5 66.3 1,611 1,363 2,974 88.6 46.6 64.3 -591 -16.6% -20.9 -24.5%
225 184 409 14.3 6.5 9.4 204 126 330 12.5 4.4 7.4 194 155 349 11.5 5.2 7.6 -65 -15.7% -2.3 -23.2%
55 50 105 3.3 1.9 2.5 49 68 117 2.8 2.6 2.7 67 68 135 3.9 2.6 3.1 0 0.0% -0.2 -6.1%
402 436 838 25.5 16.2 19.7 409 444 853 25.0 16.3 19.6 433 543 976 25.9 19.3 21.9 -17 -1.7% -2.4 -9.9%
682 670 1,352 43.1 24.6 31.6 662 638 1,300 40.3 23.3 29.7 694 766 1,460 41.3 27.1 32.6 -82 -5.3% -4.9 -13.1%

72
Table 55. Alcohol-Attributable Deaths, Age 20 Years and Older, New York City, 2003-2008
2003 2004 2005 2006* 2007 2008Male Female Total Male Female Total Male Female Total Male Female Total Male Female Total Male Female Total
Total for All Causes 1,250 446 1,696 1,193 413 1,606 1,194 418 1,612 1,174 389 1,563 1,265 414 1,680 1,254 449 1,703Chronic CausesAcute pancreatitis 8 5 13 6 7 13 6 6 12 7 6 13 6 6 12 9 7 16Alcohol abuse 12 2 14 39 6 45 39 7 46 57 12 69 44 13 57 59 13 72Alcohol cardiomyopathy 11 0 11 6 1 7 4 2 6 7 0 7 5 0 5 5 0 5Alcohol dependence syndrome 231 47 278 185 44 229 206 23 229 162 35 197 146 29 175 109 23 132Alcohol polyneuropathy 0 0 0 0 0 0 0 0 0 0 0 0 0 0 0 0 0 0Alcohol-induced chronic pancreatitis 11 3 14 15 3 18 11 8 19 3 0 3 1 0 1 2 1 3Alcoholic gastritis 0 0 0 0 0 0 0 0 0 0 0 0 0 0 0 0 0 0Alcoholic liver disease 262 78 340 247 80 327 235 76 311 241 65 306 258 65 323 280 97 377Alcoholic myopathy 0 0 0 0 0 0 0 0 0 0 0 0 1 0 1 0 0 0Alcoholic psychosis 1 0 1 0 0 0 3 1 4 3 0 3 3 1 4 6 0 6Breast cancer (females only) 0 11 11 0 10 10 0 10 10 0 10 10 0 8 8 0 9 9Cholelithiases 0 0 0 0 0 0 0 0 0 0 0 0 0 0 0 0 0 0Chronic hepatitis 0 0 0 <1 0 <1 0 0 0 0 <1 <1 0 0 0 0 0 0Chronic pancreatitis 0 2 2 1 0 1 2 2 3 3 1 4 5 1 6 3 1 3Degeneration of nervous system due to alcohol 0 0 0 0 0 0 2 0 2 0 0 0 0 0 0 1 0 1Epilepsy 2 1 3 2 3 5 2 2 4 2 2 3 2 2 4 2 1 3Esophageal cancer 6 2 8 6 2 7 7 2 8 5 2 7 9 1 10 5 1 6Esophageal varices 0 0 0 0 0 0 0 0 0 0 0 0 0 0 0 0 0 0Fetal alcohol syndrome 1 0 1 0 0 0 0 0 0 0 0 0 0 0 0 0 0 0Fetus and newborn affected by maternal use of alcohol 0 0 0 0 0 0 0 0 0 0 0 0 0 0 0 0 0 0Gastroesophageal hemorrhage <1 1 2 0 0 0 <1 0 <1 <1 <1 1 <1 0 <1 1 0 1Hypertension 23 25 48 23 24 47 26 25 50 26 25 51 39 21 60 24 27 52Ischemic heart disease 16 14 30 14 12 26 14 12 27 14 11 26 20 10 30 11 11 22Laryngeal cancer 5 1 6 5 1 6 5 1 6 5 1 5 6 1 7 4 1 4Liver cancer 15 7 23 17 7 23 18 7 25 18 7 25 26 6 32 15 6 21Liver cirrhosis unspecified 50 38 89 53 34 87 48 32 80 46 31 76 30 31 60 40 39 79Low birth weight prematurity IUGR death 2 2 4 2 1 3 2 1 3 2 2 3 2 1 3 1 2 3Oropharyngeal cancer 5 1 6 6 2 8 5 1 7 5 1 5 8 1 9 4 1 5Portal hypertension 1 0 1 0 <1 <1 <1 <1 1 <1 0 <1 0 <1 <1 < 1 0 < 1Prostate cancer (males only) 5 0 5 4 0 4 4 0 4 4 0 4 5 0 5 3 0 3Psoriasis 0 0 0 0 0 0 0 0 0 0 <1 <1 <1 <1 <1 < 1 0 < 1Spontaneous abortion (females only) 0 0 0 0 0 0 0 0 0 0 0 0 0 0 0 0 0 0Stroke hemorrhagic 24 6 30 21 5 27 18 5 23 22 5 27 22 4 26 15 3 18Stroke ischemic 3 1 4 3 1 4 3 1 4 2 1 3 4 1 5 3 1 4Superventricular cardiac dysrthymia 1 1 2 1 1 2 1 1 2 1 1 2 1 1 3 1 1 2Subtotal 695 250 945 655 244 899 660 225 885 636 215 851 643 202 846 602 246 849Acute CausesAir-space transport 0 0 0 0 0 0 <1 <1 1 <1 0 <1 0 0 0 0 0 0Alcohol poisoning 5 1 6 11 1 12 10 2 12 4 2 6 6 1 7 50 8 58Aspiration 3 2 5 2 1 3 3 1 4 3 1 4 3 2 5 2 2 4Child maltreatment 2 3 5 2 1 3 3 1 4 2 4 5 2 2 4 2 2 4Drowning 3 1 4 5 1 6 5 1 5 3 2 5 2 2 4 1 1 2Excessive blood alcohol level 0 0 0 0 0 0 0 0 0 0 0 0 0 0 0 0 0 0Fall injuries 74 56 130 79 57 136 80 70 149 82 57 139 78 53 132 74 49 123Fire injuries 18 22 41 13 15 28 18 13 31 11 11 22 16 14 29 16 11 27Firearm injuries <1 0 <1 <1 0 <1 0 0 0 <1 0 <1 1 0 1 0 0 0Homicide 246 49 295 230 42 272 217 44 261 240 37 277 198 33 231 217 33 251Hypothermia 10 1 11 2 2 4 5 2 7 3 1 4 8 3 11 4 1 5Motor-vehicle nontraffic crashes 1 <1 1 1 0 1 1 <1 1 <1 <1 <1 1 0 1 < 1 < 1 < 1Motor-vehicle traffic crashes 93 23 115 89 14 103 94 21 115 91 21 113 72 17 90 69 20 89Occupational and machine injuries 2 0 2 1 <1 1 1 0 1 1 0 1 1 0 1 2 < 1 2Other road vehicle crashes 4 <1 5 5 1 6 4 1 5 3 1 4 4 1 5 4 1 5Poisoning (not alcohol)** 13 6 19 8 4 12 13 8 21 14 10 24 152 53 204 131 46 177Suicide 80 31 111 83 26 110 82 28 109 79 26 105 79 30 109 80 28 108Suicide by and exposure to alcohol 0 0 0 7 3 10 0 0 0 1 0 1 0 0 0 0 0 0Water transport 2 <1 2 0 0 0 <1 0 <1 1 0 1 1 0 1 0 0 0Subtotal 555 196 751 538 169 708 534 193 727 538 174 711 622 212 834 651 202 854Note: 2003-2005 and 2007-2008 alcohol prevalence data are provided by the Bureau of Epidemiology Services. See Technical Notes: Smoking and Alcohol-Attributable Mortality for methodology.
* 2006 alcohol consumption data were not collected in New York City Community Health Survey and therefore 2006 alcohol-attributable deaths were calculated based on 2005 alcohol prevalence data. ** The big increase of attributable poisoning (not alcohol) deaths in 2007 was due to the correction of cause of death coding and a shift from manual to automated coding. See Special Section: New York City Changes from Manual to Automated Cause-of-Death Coding.IUGR=Intrauterine growth restriction.
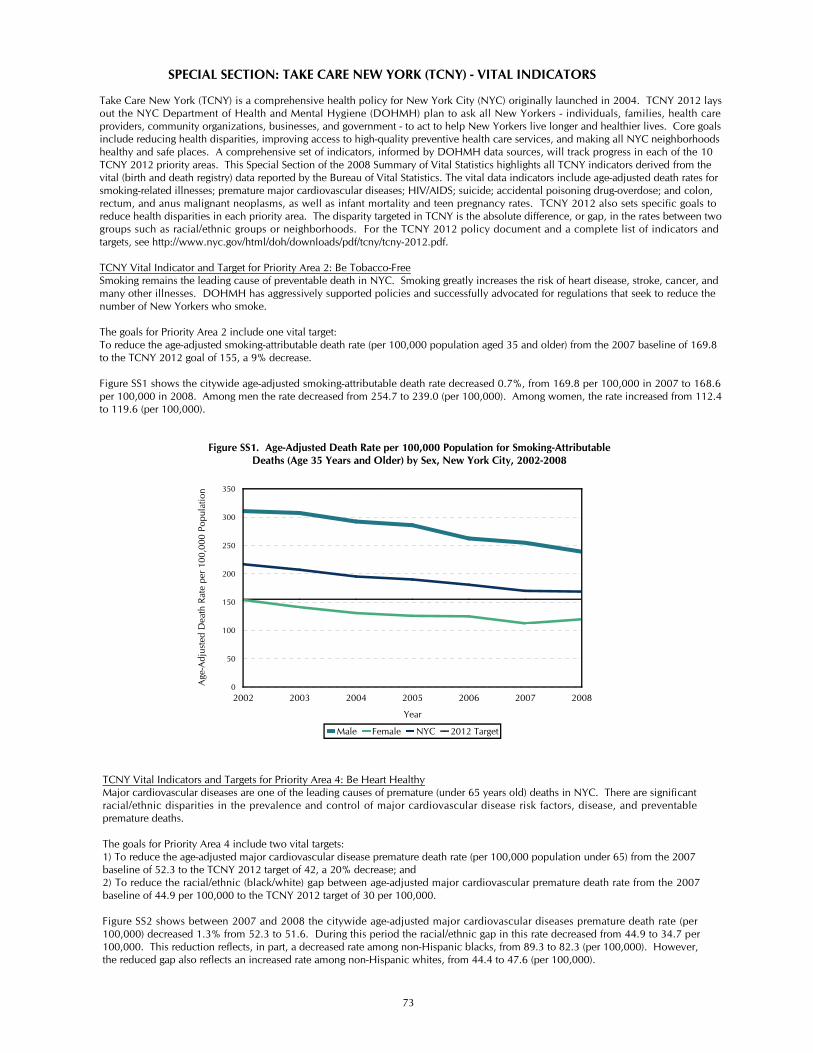
73
2002 2003 2004 2005 2006 2007 2008
Year
0
50
100
150
200
250
300
350
Age
-Adj
uste
d D
e ath
Rat
e pe
r 10
0,00
0 P o
pula
tion
Male Female NYC 2012 Target
Figure SS1. Age-Adjusted Death Rate per 100,000 Population for Smoking-Attributable Deaths (Age 35 Years and Older) by Sex, New York City, 2002-2008
SPECIAL SECTION: TAKE CARE NEW YORK (TCNY) - VITAL INDICATORS
Take Care New York (TCNY) is a comprehensive health policy for New York City (NYC) originally launched in 2004. TCNY 2012 lays out the NYC Department of Health and Mental Hygiene (DOHMH) plan to ask all New Yorkers - individuals, families, health care providers, community organizations, businesses, and government - to act to help New Yorkers live longer and healthier lives. Core goals include reducing health disparities, improving access to high-quality preventive health care services, and making all NYC neighborhoods healthy and safe places. A comprehensive set of indicators, informed by DOHMH data sources, will track progress in each of the 10 TCNY 2012 priority areas. This Special Section of the 2008 Summary of Vital Statistics highlights all TCNY indicators derived from the vital (birth and death registry) data reported by the Bureau of Vital Statistics. The vital data indicators include age-adjusted death rates for smoking-related illnesses; premature major cardiovascular diseases; HIV/AIDS; suicide; accidental poisoning drug-overdose; and colon, rectum, and anus malignant neoplasms, as well as infant mortality and teen pregnancy rates. TCNY 2012 also sets specific goals to reduce health disparities in each priority area. The disparity targeted in TCNY is the absolute difference, or gap, in the rates between two groups such as racial/ethnic groups or neighborhoods. For the TCNY 2012 policy document and a complete list of indicators and targets, see http://www.nyc.gov/html/doh/downloads/pdf/tcny/tcny-2012.pdf.
TCNY Vital Indicator and Target for Priority Area 2: Be Tobacco-FreeSmoking remains the leading cause of preventable death in NYC. Smoking greatly increases the risk of heart disease, stroke, cancer, and many other illnesses. DOHMH has aggressively supported policies and successfully advocated for regulations that seek to reduce the number of New Yorkers who smoke.
The goals for Priority Area 2 include one vital target:To reduce the age-adjusted smoking-attributable death rate (per 100,000 population aged 35 and older) from the 2007 baseline of 169.8 to the TCNY 2012 goal of 155, a 9% decrease.
Figure SS1 shows the citywide age-adjusted smoking-attributable death rate decreased 0.7%, from 169.8 per 100,000 in 2007 to 168.6 per 100,000 in 2008. Among men the rate decreased from 254.7 to 239.0 (per 100,000). Among women, the rate increased from 112.4 to 119.6 (per 100,000).
TCNY Vital Indicators and Targets for Priority Area 4: Be Heart HealthyMajor cardiovascular diseases are one of the leading causes of premature (under 65 years old) deaths in NYC. There are significant racial/ethnic disparities in the prevalence and control of major cardiovascular disease risk factors, disease, and preventable premature deaths.
The goals for Priority Area 4 include two vital targets:1) To reduce the age-adjusted major cardiovascular disease premature death rate (per 100,000 population under 65) from the 2007 baseline of 52.3 to the TCNY 2012 target of 42, a 20% decrease; and2) To reduce the racial/ethnic (black/white) gap between age-adjusted major cardiovascular premature death rate from the 2007 baseline of 44.9 per 100,000 to the TCNY 2012 target of 30 per 100,000.
Figure SS2 shows between 2007 and 2008 the citywide age-adjusted major cardiovascular diseases premature death rate (per 100,000) decreased 1.3% from 52.3 to 51.6. During this period the racial/ethnic gap in this rate decreased from 44.9 to 34.7 per 100,000. This reduction reflects, in part, a decreased rate among non-Hispanic blacks, from 89.3 to 82.3 (per 100,000). However, the reduced gap also reflects an increased rate among non-Hispanic whites, from 44.4 to 47.6 (per 100,000).

74
1994
1995
1996
1997
1998
1999
2000
2001
2002
2003
2004
2005
2006
2007
2008
Year
0
20
40
60
80
100
120
140
Age
-Adj
uste
d D
e ath
Rat
e pe
r 10
0,00
0 P o
pula
tion
Hispanic Asian and P.I. White NH Black NH NYC 2012 Target
Figure SS2. Age-Adjusted Premature Death Rate per 100,000 Population for Major Cardiovascular by Race/Ethnicity, New York City, 1994-2008
TCNY Vital Indicators and Targets for Priority Area 5: Stop the Spread of HIV and Other Sexually Transmitted InfectionsHIV/AIDS-related deaths in NYC continue to decline, both in counts and age-adjusted death rates, from their peaks in the mid-1990s. Although HIV/AIDS-related death rates have declined in all racial/ethnic groups, substantial disparities exist.
The goals for Priority Area 5 include two vital targets:1) To reduce the age-adjusted HIV/AIDS death rate (per 100,000 population) from the 2007 baseline of 12.8 to the TCNY 2012 target of 10, a 22% decrease; and2) To reduce the racial/ethnic (black/white) gap between age-adjusted HIV/AIDS death rates from the 2007 baseline of 26.6 per 100,000 to the TCNY 2012 target of 21 per 100,000.
Figure SS3 shows the citywide age-adjusted HIV/AIDS death rate (per 100,000) decreased 5.5% from 12.8 in 2007 to 12.1 in 2008. The racial/ethnic (black/white) gap decreased from 26.6 per 100,000 in 2007 to 24.7 per 100,000 in 2008, reflecting a greater absolute decrease in the rate (per 100,000) among non-Hispanic blacks, from 30.9 in 2007 to 28.6 per 100,000 in 2008, than the absolute decrease in the rate (per 100,000) among non-Hispanic whites, from 4.3 in 2007 to 3.9 in 2008.
1994
1995
1996
1997
1998
1999
2000
2001
2002
2003
2004
2005
2006
2007
2008
Year
0
50
100
150
200
Age
-Adj
uste
d D
e ath
Rat
e pe
r 10
0,00
0 P o
pula
tion
Hispanic Asian and P.I. White NH Black NH NYC 2012 Target
Figure SS3. Age-Adjusted Death Rate per 100,000 Population for HIV by Race/Ethnicity,New York City, 1994-2008
TCNY Vital Indicator and Target for Priority Area 6: Recognize and Treat DepressionEach year, major depression affects more than 8% of adult New Yorkers, yet only one in three of these individuals receives treatment. Promoting awareness, detection, and treatment of depression is an important public health approach to suicide prevention.
The goals for Priority Area 6 include one vital target:To reduce the age-adjusted death rate (per 100,000 population) due to suicide from the 2007 baseline of 5.6 to the 2012 TCNY target of 5.3, a 5% decrease.

75
1994
1995
1996
1997
1998
1999
2000
2001
2002
2003
2004
2005
2006
2007
2008
Year
0
2
4
6
8
10
12
14
Age
-Adj
uste
d D
e ath
Rat
e pe
r 10
0,00
0 P o
pula
tion
Male Female NYC 2012 Target
Figure SS4. Age-Adjusted Suicide Death Rate per 100,000 Population by Sex,New York City, 1994-2008
2000
2001
2002
2003
2004
2005
2006
2007
2008
Year
0
5
10
15
20
25
Age
-Adj
. Dea
th R
ate
per
100 ,
000
Popu
l atio
n
High Poverty Area Low Poverty Area NYC
Figure SS5. Age-Adjusted Death Rate per 100,000 Population for Unintentional Poisoning/Drug Overdose by Poverty Area, Age 15 and Over, New York City, 2000-2008
Figure SS4 shows the citywide age-adjusted death rates (per 100,000) due to suicide decreased 1.8%, from 5.6 in 2007 to 5.5 in 2008. Among women, the rate decreased from 2.9 per 100,000 in 2007 to 2.7 per 100,000 in 2008. Among men, the rate was unchanged, remaining at 8.7 per 100,000.
TCNY Vital Indicators for Priority Area 7: Reduce Risky Alcohol Use and Drug DependenceUnintentional drug overdoses and alcohol-related deaths are among the leading causes of premature death for adult New Yorkers. In NYC, illicit drug use occurs across many racial and ethnic groups and at all income levels, but drug-related illness and death rates are persistently highest in NYC's poorest neighborhoods.
The goals for Priority Area 7 include two vital targets. Due to the recent change in the definition for unintentional poisoning/drug-overdose death rates , the TCNY 2012 target will be reported in subsequent TCNY 2012 progress reports. Current goals include the following: 1) To reduce the age-adjusted unintentional poisoning/drug-overdose death rate per 100,000 population; and 2) To reduce the high- vs. low-income neighborhood gap in age-adjusted unintentional poisoning/drug-overdose death rates per 100,000. Due to the recent change in the definition for unintentional poisoning/drug-overdose death rates, the TCNY 2012 target will be reported in subsequent TCNY 2012 progress reports.
Figure SS5 shows that the citywide age-adjusted unintentional poisoning/drug-overdose death rates for the 15 and older population decreased 12.6% between 2007 and 2008, from 11.1 to 9.7 (per 100,000). The gap in the rates (per 100,000) between high- and low-poverty neighborhoods decreased from 11.6 in 2007 to 7.6 in 2008. The reduction in the gap reflects a larger absolute decrease in high-poverty neighborhoods, where the rate (per 100,000) decreased from 19 in 2007 to 14.2 in 2008, than in low-poverty neighborhoods, where the rate (per 100,000) decreased from 7.4 in 2007 to 6.6 in 2008.
1 The indicator "Unintentional Drug-related Overdose Deaths" was derived as a result of an in-depth study of drug-related death case files conducted by the Department. This definition is used for the TCNY 2012 indicator Priority Area 7, Reduce Risky Alcohol Use and Drug Dependence. Four modifications were made to the usual definition to better capture unintentional/accidental dug overdose: (i) Exclusion of the ".2" extension of the F codes, because this extension refers to a drug "dependence syndrome;" (ii) Inclusion of X43, because this code captures drugs acting on the autonomic nervous system; (iii) Inclusion of cases in which X40-X44 are contributing causes of death; and, (iv) constraining the manner of death to accidental for all deaths that meet these criteria."

76
1994
1995
1996
1997
1998
1999
2000
2001
2002
2003
2004
2005
2006
2007
2008
Year
0
5
10
15
20
25
30
Age
-Adj
uste
d D
e ath
Rat
e pe
r 10
0,00
0 P o
pula
tion
Hispanic Asian and P.I. White NH Black NH NYC 2012 Target
Figure SS6. Age-Adjusted Colorectal Death Rate per 100,000 Population by Race/Ethnicity, New York City, 1994-2008
1994
1995
1996
1997
1998
1999
2000
2001
2002
2003
2004
2005
2006
2007
2008
Year
0
2
4
6
8
10
Infa
nt M
orta
lity
R ate
per
1,0
0 0 L
ive
Birth
s
NYC 2012 Target
Figure SS7. Infant Mortality Rate per 1,000 Live Births, New York City, 1994-2008
TCNY Vital Indicators and Targets for Priority Area 8: Prevent and Detect CancerCancer is the second leading cause of death in NYC. Colorectal cancer is one of the most prevalent cancers among NYC residents. While important achievements in reducing colorectal screening disparities have been realized in NYC, significant racial/ethnic disparities in colorectal cancer death rates persist.
The goals for Priority Area 8 include two vital targets:1) To reduce the age-adjusted colorectal cancer death rate (per 100,000 population) from the 2007 baseline of 16.3 to the 2012 TCNY target of 14, a 14% decrease; and2) To reduce the racial/ethnic (black/white) gap in age-adjusted colorectal cancer death rates (per 100,000 population) from the 2007 baseline of 3.6 to the TCNY 2012 target of 2.
Figure SS6 shows citywide age-adjusted colorectal cancer death rates (per 100,000 population) remained constant at 16.3 (<0.1% increase) between 2007 and 2008. The racial/ethic gap in this rate (per 100,000) decreased from 3.6 in 2007 to 2.1 in 2008. The reduced gap reflects, in part, a decreased rate (per 100,000) among non-Hispanic blacks, from 20.2 in 2007 to 19.1 to 2008. However, the reduction also reflects an increased rate (per 100,000) among non-Hispanic whites, from 16.6 in 2007 to 17.0 in 2008.
TCNY Vital Indicator and Targets for Priority Area 9: Raise Healthy ChildrenChildren's health is affected by complex factors and conditions. Two of the most significant racial and ethnic health disparities in NYC are the infant mortality and teen pregnancy rates.
The goals in this area include four vital targets, two focused on infant mortality and two on teen pregnancy:1) To reduce the citywide infant mortality rate (per 1,000 births) from the 2007 baseline of 5.4 to the TCNY 2012 target of 5, a 7% decrease; 2) To reduce the racial/ethnic (black/white) gap in the infant mortality rate (per 10,000 births) due to Injuries and SIDS from the 2007 baseline of 10.5 to the TCNY 2012 target of 9; 3) To reduce the teen pregnancy rate (per 1000 females age 15-19) from the 2007 baseline of 83.2 to the TCNY 2012 target of 70, a 16% decrease; and 4) To reduce the racial/ethnic (black/white) gap in teen pregnancy rates (per 1,000 females age 15-19) from the 2007 baseline of 101.3 to the TCNY 2012 target of 82.
Figure SS7 shows the citywide infant mortality rate (per 1,000 births) remained very close to its 2007 historical low with a statistically insignificant 1.9% increase from 5.4 to 5.5 between 2007 and 2008.

77
1999
2000
2001
2002
2003
2004
2005
2006
2007
2008
Year
0
20
40
60
80
100
120
140
160
Teen
Pre
gnan
cy R
ate
per 1
,000
Wom
en
White Black NYC 2012 Target
Figure SS9. Teen Pregnancy Rate per 1,000 Women by Race/Ethnicity, New York City Residents, 1999-2008
Figure SS8. Infant Mortality Rate per 10,000 Live Births due to Injuries and SIDS by Race/Ethnicity,New York City, 1999-2008
1999
2000
2001
2002
2003
2004
2005
2006
2007
2008
Year
0
5
10
15
20
IMR
t o In
jurie
s/SI
DS
per 1
0,0 0
0 Li
ve B
ir ths
White Black NYC
Figure SS8 shows that the racial/ethnic gap in the rates of infant mortality due to injuries and SIDS per 10,000 births increased from 10.5 per 10,000 in 2007 to 13.1 per 10,000 in 2008. Among non-Hispanic blacks the rate (per 10,000) increased from 13.3 to 16.1 between 2007 and 2008. Among non-Hispanic whites, the rate (per 10,000) increased from 2.8 to 3.1 between 2007 and 2008.
Figure SS9 shows that the teen pregnancy rates (per 1,000 females aged 15 through 19 years) decreased 3.4%, from 83.2 to 80.4, between 2007 and 2008. The racial/ethnic gap in teen pregnancy rate (per 1,000) decreased from 101.3 in 2007 to 100.2 in 2008. Among non-Hispanic blacks, the rate (per 1,000) decreased 2.6% from 122.1 in 2007 to 118.9 in 2008. Among non-Hispanic whites, the rate (per 1,000) decreased 10.1%, from 20.8 in 2007 to 18.7 in 2008.
78
Rates and Ratios Defined
The numerators of the rates in these tables are events occurring in New York City and reported during the year, unless otherwise specified. The denominator is theresident population figure, including all ages and both sexes, unless otherwise specified.
Live Birth Rate - The number of live births per 1,000 population. Perinatal Mortality Ratio - The number of fetal deaths of 28 weeks gestation and Live Births x 1,000 greater plus the number of early neonatal (under seven days) deaths per 1,000 fetal Population deaths of 28 weeks gestation and greater plus live births.
( Fetal Deaths 28 Weeks and Over + Infant Deaths Under 7 Days ) x 1,000Marriage Rate - The number of marriages per 1,000 population. Fetal Deaths 28 Weeks and Over + Live Births Marriages x 1,000 Population Death Rate, all causes - The number of deaths per 1,000 population.
Deaths All Causes x 1,000Infant Mortality Rate - The number of infant (under one year of age) deaths Populationper 1,000 live births.Neonatal Mortality Rate - The number of neonatal (under 28 days) deaths per Death Rate, specified causes The number of deaths due to a specified cause1,000 live births. per 100,000 population.Post-neonatal Mortality Rate - The number of post-neonatal (28 days to under Death Rate, age and sex specific The number of deaths of persons of specifiedone year of age) deaths per 1,000 live births. age and sex per 1,000 population of the specified age and sex. Infant Deaths x 1,000 Death Rate, age, sex and race adjusted - The number of deaths per 100,000 standard Live Births population. Age, sex and race specific death rates are applied to a standard population
eliminating the effect of differences in population composition, and allowingFetal Death Ratio - The number of fetal deaths of 28 weeks gestation and comparisons over time or between geographic areas.over per 1,000 live births. Maternal Mortality Ratio - The number of deaths due to complications of pregnancy, Fetal Deaths 28 Weeks and Over x 1,000 childbirth and the puerperium occurring within 42 days of delivery per 100,000 live Live Births births.
Fertility Rate - Live births per 1,000 women aged 15-44 years. Fetal-infant Mortality Rate The number of fetal deaths of 24 weeks gestation and Live Births x 1,000 greater plus infant deaths per 1,000 live births and fetal deaths, excluding weight at Female Population Aged 15-44 delivery less than 500 grams.
(Fetal Deaths 24 Weeks and Over+Infant Deaths) x 1,000 (Fetal Deaths 24 Weeks and Over+Live Births)

TECHNICAL NOTES, 2008
79
DATA COLLECTION Counts of births, deaths, and induced and spontaneous terminations of pregnancy are based on certificates filed with the Office of Vital Records, New York City Department of Health and Mental Hygiene (DOHMH). Birth certificates are created and filed using the Electronic Birth Registration System (EBRS). Death certificates are processed on paper or via the Electronic Death Registration System (EDRS). All induced and spontaneous terminations, regardless of gestational age or weight, are required to be reported and are filed on paper. For more specific information about Births, Deaths, and Induced and Spontaneous Terminations of Pregnancy data items, please see those sections below. VITAL EVENT COUNTS • Vital event data are based on year of occurrence in New York City to both residents and non-residents. Few, if any, birth and death events are registered after the files are closed (typically closure occurs between March and May annually); these events are excluded from this report. Due to a relatively large volume of late Induced and Spontaneous Terminations of Pregnancy reporting, certificates received after the respective annual file is closed will continue to be added to the following year’s data. As a result, the 2008 spontaneous termination of pregnancy reports include 293 certificates from 2007 or earlier; the 2008 induced termination of pregnancy reports include 453 certificates from 2007 or earlier. Tables that include a geographic breakdown for residents show non-resident and residence-unknown data separately. Where there is no geographic breakdown, all New York City occurrences reported are included. • 2008 events to NYC residents occurring outside of NYC are not included in this report. Tables 22, 23, 25a, 25b, and Figure 15 rely on measures utilizing prior year’s data that include deaths to NYC residents occurring outside of NYC. These data are provided by the National Center for Health Statistics (NCHS). See third bullet under Life Expectancy below. •For public health purposes, demographic and medical information on vital event certificates is coded in general agreement with standards developed by NCHS. •Because New York City law prohibits recording mother’s marital status on the birth certificate, it is calculated using other information. (See Mother’s Marital Status below.) •The number of marriages shown in Table 1 and in Table 49 is the number of marriage licenses issued by the Office of the City Clerk.
DEMOGRAPHICS POPULATION The total New York City population was 8,008,278 in 2000 by decennial enumeration, and was 8,363,710 in 2008 by post-censal estimation. An example of the effect of using different measures of New York City population is the citywide birth rate; it was 15.3 per 1,000 population using the 2008 population estimate, and 15.9 using the 2000 census population as the denominator. Citywide population estimates and vital rates – 2008 Summary Beginning in the 2008 Summary, all tables requiring 2001-2008 city-wide population data except Table 23 use their respective years city-wide pre-challenged US Census Bureau’s population estimates. Prior to 2008, some tables use the Census 2000 estimates while others use post-censal estimates. Citywide rates are affected, and may differ across tables. The population figures for census years 1960, 1970, 1980, 1990, and 2000 are census counts; for intercensal counts through 1989, straight-line interpolations are used, while the interpolation from 1990 to 2000 uses an exponential formula, which assumes that the growth rate was the same throughout the decade: pop(t1)/pop(t0)=e^rt (where r is a constant growth rate and t is the time interval). Smaller geographical area population estimates – 2008 Summary •Prior to 2008, tables with breakdowns smaller than borough use 2000 census data only, as do those with life expectancy calculations that require population totals by single-year age groups. In 2008 Summary, 2008 and prior year Community District population estimates were produced by the NYC Department of Health and Mental Hygiene, based on the US Census Bureau Population Estimate Program and housing unit data obtained from the NYC Department of City Planning (DCP). For each year, the vintage (unchallenged) estimates released by the US Census Bureau are used to obtain totals for the city by borough by Community District (CD) for 22 age groups, sex and race/ethnicity (see Effect of Census Bureau’s Modified Race File). A ”housing unit method” is then used to update the previous year’s estimates by allocating population to CDs. The housing unit method takes the estimated number of households for a given area and multiplies it by an estimate of the population per household (PPH). In the intercensal context, the housing unit growth as measured by housing permit data determines the location of growth. Because these estimates are calibrated to equal U.S. Census borough-specific population totals, the borough PPH is fixed. New population estimates are then derived from by use of the iterative
proportional fitting procedure (IPFP) implemented in SAS (a statistical software). While vacancy rates, housing unit loss rates, percentage of permits actually constructed and time to completion of construction are all important to the validity of housing unit data, they were assumed to be consistent at the borough level and thus have no affect on the allocation of growth. However, the method is sensitive to the quality of the housing permit data, which misses residential conversions to multiple units. In addition, demographic characteristics were allocated by inheriting those at the location of growth. Therefore, this approach does not capture demographic change at the neighborhood level. This approach also does not capture change in the population generated by migration. •Population estimates for Health Center District (HCD) were not computed in time for the release of this report. As a result, Health Center District tables present rates are either replaced (Table 7) or do not present rates (Table 34). Effect of Census Bureau’s Modified Race File (Census 2000 Modified Race Data [MR (31)-CO.txt]). In 2002, the Census Bureau produced a modified race file. In 2002-2005 Annual Summaries, Table 2 was changed by using modified race population data. The major effect was a reduction of 65% in the total for “Other and Multiple Race” and increases of 3%, 3%, and 6% for “Non-Hispanic White”, “Non-Hispanic Black”, and “Asian and Pacific Islander”, respectively. There was no change for Hispanic population. Variations in population estimates by Vital Statistics Summary years - Population data in the 2000 -2004 Annual Summaries are based on data provided by the New York City Department of City Planning (DCP) from the U. S. Census enumeration as of April 1, 2000. The 2005-2007 Annual Summaries use pre-challenged post-censal estimates for current year and post-challenged estimates for earlier years in addition to Census 2000 data. The U.S. Census Bureau uses its modified race file for the Census 2000, described above, as the base for its post-censal estimates. These estimates, calculated for 2001-2008, were only available for broad measures such as county (borough), 5-year age groups, ethnic group and sex. They are not available for smaller geographic units, such as Health Center and Community Districts and single-year age groups. In 2005-2007 Annual Summaries, 2000 census data were used in Tables 7, 8, 22, 23, 28a, 34, and 36, and Figure 20; 2001-2007 estimates are used in Tables 1, 3 and 25, Figures 6a, 6b and 7. As a result, 2001-2006 estimates and rates resulting from estimates found in earlier versions of the summary may differ slightly
TECHNICAL NOTES, 2008
80
from those found in the 2008 Summary Table 1. RACE, ANCESTRY, ETHNIC GROUP, AND
BIRTHPLACE Race in the 2000 Census - The 2000 Census permitted respondents to describe themselves and household members as being of more than one race, selecting from six race categories: White, Black, American Indian and Alaska Native, Asian, Native Hawaiian and Other Pacific Islander, and some other race. These categories yield 63 possible combinations. Respondents were also asked if they were of Hispanic origin. The resulting responses could be organized into 64 groups, referred to by the Department of City Planning (DCP) as "mutually exclusive race/Hispanic categories." DCP combined these groups into seven categories: Hispanic origin, non-Hispanic white, non-Hispanic black, non-Hispanic Asian or Pacific Islander, non-Hispanic American Indian and Alaska Native, non-Hispanic of some other race, and non-Hispanic of two or more races. These categories are equivalent to the vital statistics variable “ethnic group” (see below), except for the group of two or more races. Multiple-race data are available for death data beginning 2003 and birth data beginning 2008. In Table 2, population data are presented using DCP terminology, “mutually exclusive race and Hispanic origin”, with the last three categories combined; the death data presented in Table 3 use the term “ethnic group.” See Race, Ancestry, and Ethnic Groupings. Multiple Race - Beginning January 1, 2003 and January 1, 2008, the New York City death certificate and birth certificate respectively expanded the number of decedent race categories, allowing multiple races to be selected. This change was implemented based on changes to the U.S. 2000 Census and to comply with NCHS recommended changes in the U.S. Standard Certificates. For death data, the change resulted in an increase in Hispanic, Asian and Pacific Islander ethnicities, while non-Hispanic white and non-Hispanic black ethnicities declined. The number of unknown ethnicities also increased. For birth, the impact of this change combined with the introduction of the Electronic Birth Registration System (EBRS) resulted in a high proportion of missing data. Please see the BIRTH section of the technical notes for more detailed information. In general, care should be taken when comparing 2003 or later race and ethnicity death data and 2008 or later race and ethnicity birth data with that from previous years. Race, Ancestry, and Ethnic Groupings - Race
and ancestry are separate items on the certificates, reported usually by a parent on the birth certificate, and by a relative of the decedent through the funeral director on the death certificate. Responses are coded in general conformance to NCHS rules. • In 1992, five additional codes for Asian and Pacific Islander races were added, following their introduction by NCHS: Asian Indian, Guamanian, Korean, Samoan, and Vietnamese. Codes already in use included Chinese, Filipino, Hawaiian, Japanese, and other. • The ordered selection rules used to define ethnic group first assigns Puerto Rican or other Hispanic ethnicities based on ancestry, regardless of race. Then, those of other or unknown ancestries are classified by race as Asian, non-Hispanic white, non-Hispanic black, other or unknown. •Ancestry is defined by NCHS as the nationality, lineage, or country where the subject's ancestors were born before their arrival in the United States. If a religious group is reported, NCHS instructions are to ask for the country of origin or nationality. In New York City, enough certificates with ancestry reported as Jewish or Hebrew are received to warrant inclusion in these tables, notwithstanding the religious meaning of the terms. An increase in 1999 of about 2,000 in the number of mothers reporting Hebrew or Jewish ancestry resulted from quality assurance discussions with several hospitals that included clarification of the meaning of ancestry. These hospitals replaced the general term American with individual information provided by the patients. •Persons whose race is black and whose ancestry is American are classified as being of African-American ancestry. Race/Ethnicity in Infant Mortality – Ethnic group is defined by mother’s information on the infant’s birth certificate. However, in the absence of a matching birth certificate for an infant death, the information on the death certificate is used to assign a maternal ethnic group (Table 42a, c, 43) GEOGRAPHICAL UNITS PLACE OF DEATH In reporting Place of Death in Table 9, the term hospital includes residential units, hospices and other special facilities within the hospital. Nursing home includes only sites licensed as Extended Care Facilities by the State of New York. Home refers to the decedent’s residence, and includes private houses and apartments, group quarters for special populations, homes for adults, and other long-term residential sites.
PLACE OF BIRTH Home Births in Tables 32 and 33 includes all events in which the Type of Place was checked as Home – regardless of whether the certificate was filed through a hospital or not. Home Births in Table 52 only includes those Home births that were not filed by an institution; these are typically filed by who ever attended to the birth at home. Prior to 1996, all reports of home births included only events filed outside the hospital (similar to Table 52). BOROUGH OF RESIDENCE Borough of residence and other geographic classifications are based on the usual residence reported on the certificate. Since 1985, assignment to geographic areas smaller than borough, such as health center district and community district, is made through the Geosupport Program, developed and maintained by the Department of City Planning. COMMUNITY DISTRICTS (CD) AND HEALTH
CENTER DISTRICTS (HCD) In this 2008 Summary, CD rates are presented and HCD rates are not; HCD population estimates are not yet available (Please see Technical Notes: DEMOGRAPHICS - POPULATION for more specific information concerning smaller geographic area population estimates). Community Districts (CD) - There are 59 community districts, referred to by their borough and sequence numbers. Names were included beginning with the 2003 Annual Summary. The fifty-nine community districts were established by City Charter in 1969 for the delivery of city services. Population figures for these districts are compiled by the DCP from census tract and census block data. Borough boundaries are not always followed. As a result, the sum of the community district populations in each borough does not equal the borough population or the citywide population. A description of the construction of community district geography can be found in the Department of City Planning, Demographic Profiles, DCP # 92-32-Revised, pp. 293-297. Health Center District (HCD) There are 30 health center districts, which have neighborhood names. The thirty health center districts were established in 1927 by a joint commission (including the Health Department) as the administrative units for carrying out public health services. The HCD was formed out of the health area, which is based on census tract, and originally numbered 270. The health area was designed
TECHNICAL NOTES, 2008
81
to be a unit for public health data collection. While the configuration of health areas changes with each census, the configuration for HCD does not. Vital statistics by HCD and health area have been published by the Office of Vital Statistics since 1929. Note, Table 34 does not report rates by HCD due to the unavailability of estimated population for Health Center District (See DEMOGRAPHICS- Smaller geographical area population estimates – 2008 Summary. It is important to note that there is no relationship between HCD and CD, and therefore no translation from one system to the other. The most obvious example is that the northernmost Manhattan neighborhood of Marble Hill is in Manhattan under the health center district organization and in the Bronx under the community district system. As a result, the numbers of births and deaths to Manhattan and Bronx residents differ between health center district tables and community district tables. Similarly, the population of Rikers Island, site of New York City Department of Correction facilities, is in the Bronx for health center district purposes and in Queens in the community district system. The small number of vital events to residents has been assigned to Queens in both systems. Care must be taken when comparing counts of births and deaths using HCD and CD. The number of districts in each system, by borough, Borough
HCD
CD
Manhattan
7
12 Bronx
6
12
Brooklyn
10
18 Queens
6
14
Staten Island
1
3 TOTAL 30 59 DEATHS CAUSE OF DEATH REPORTING The cause of death on the death certificate is completed by a physician or medical examiner, who is also a physician. The physician is required to provide the complete sequence of events and/or medical conditions leading to the death, including: the immediate cause – the specific condition that directly preceded the death; the intermediate cause(s) – the significant condition(s) that preceded and gave rise to the immediate cause of death; and the underlying cause – the disease or condition that set off the chain of events leading to death. (For further information on how cause of death should be documented, please see: http://www.nyc.gov/html/doh/ media/video/icdr/index.html or http://www. nyc.gov/html/doh/downloads/pdf/chi/chi27-9.pdf). The reported conditions are all coded
using a National Center for Health Statistics administered software package (SuperMICAR) programmed to administer the International Statistical Classification of Diseases (ICD) rules for classifying conditions. A single underlying cause based on the plausible chain of events leading to death is also selected. These rules are published by the World Health Organization (WHO). Reporting aggregate counts and rates of these standardized underlying cause codes allows for comparisons on a national and international scale. CAUSE OF DEATH •The information presented as cause of death is the underlying cause of death, selected using rules issued by NCHS, and codes of the International Classification of Diseases (ICD) 10th revision, issued by the World Health Organization. ICD-10 was implemented in the United States on January 1, 1999. Earlier ICD revisions and the year their codes were implemented are - the Fifth, 1939; Sixth, 1949; Seventh, 1959; Eighth, 1969; and Ninth, 1979. Long term trends in causes of death should be interpreted with caution because of possible changes in causes and groupings with each revision. •For Table 4, the NCHS List of 113 Selected Causes of Death is the base list for tabulating deaths. For Table 44, the NCHS List of 130 Selected Causes of Infant Death is the base list for tabulation infant deaths. From these lists, some causes are dropped due to small numbers or added due to their importance in New York City. Comparability Ratio -Comparability ratios indicated in Tables 4 and 44 are used to measure the discontinuities in trend data for the cause of death when a new version of the ICD is implemented. They are presented in this Summary in Tables 4, 25, and 44 to compare the changes in cause specific deaths due to changes from ICD 9 to ICD10 coding system. In the case of ICD-10, the comparability ratio for cause “i” is defined as: Deaths from cause “i” under ICD-10 Deaths from cause “i” under ICD-9 Therefore, comparability ratios measure the net effect of ICD-10 by cause of death. Using more than 2.3 million 1996 U.S. mortality records, NCHS calculated and presented comparability ratios for selected causes of death by NCHS. Due to complications of coding and calculation, the procedure was split into two phases: preliminary and final. The preliminary comparability ratios were based on about 1.8 million death records and used in 1999-2002 Summaries of Vital Statistics. Finalized comparability ratios are updated in Tables 4, 25, and 44 of the Summaries of Vital Statistics 2003 through
present. A detailed description of the comparability ratio (ICD-9 to ICD-10) can be found on the NCHS website at the following link: http://www.cdc.gov/nchs/data/nvsr/ nvsr49/ nvsr49_02.pdf. HIV and AIDS Mortality - In ICD-10, deaths due to HIV disease are not divided into AIDS deaths and deaths due to other HIV infections, but are characterized by the resulting disease or condition. HIV disease deaths (ICD-10 codes B20-B24) are shown in Tables 4, 5, 6, 7, 8, and 20 and Figures 13 and 14. •From 1983 through 1986, only AIDS was a recognized cause of death and was coded as 279.1. In 1987, NCHS introduced code 042 for AIDS and 043-044 for other HIV disease deaths, and they were reported this way in Table 3 through 1998. Beginning in 1999, Table 25 includes HIV disease, B20-B24. •A fuller discussion of the history of HIV coding can be found in the 1997 and 1998 Annual Summaries. •The incidence data in Table 48 are provided by the New York City HIV Epidemiology and Field Service Program. Their active surveillance system identifies persons diagnosed with AIDS, a reportable disease in New York State. Drug Related Deaths. Two definitions for drug-related deaths, excluding homicides, suicides, and undetermined deaths, are used by DOHMH and presented in this report. •“Mental and Behavioral Disorders due to Use of or Accidental Poisoning by Psychoactive Substance excluding Alcohol and Tobacco”, one definition, combines underlying chronic drug-use ICD codes (F11-F16, F18-F19) and accidental drug-poisoning ICD-10 codes (X40-X42, and X44). This definition is found in Tables 4, 5, 5a, 6, 6a, 7, 8, and 24 in this report. “Accidental poisoning by psychoactive substances, excluding alcohol and tobacco”, the “accidental” subset of underlying codes (X40-X42, and X44) are found in Tables 4 and 14; the “Mental and Behavioral Disorders due to the Use of Psychoactive Substance”, the “chronic” subset of underlying codes F11-F16, F18-F19) is found in Table 4. •“Unintentional Drug-related Overdose Deaths”. This definition is presented as a TCNY 2012 indicator in Priority Area 7, Reduce Risky Alcohol Use and Drug Dependence, in the Special Section of this report, Figure SS5. Four modifications were made to the usual definition to better capture unintentional/accidental drug overdose: (i) Exclusion of the ".2" extension of the F codes, because this extension refers to a drug "dependence syndrome;" (ii) Inclusion of X43, because this code captures drugs acting on the autonomic nervous system; (iii) Inclusion of cases in which X40-X44 are

TECHNICAL NOTES, 2008
82
contributing causes of death; and, (iv) constraining the manner of death to accidental for all deaths that meet these criteria. This second definition was derived as a result of an in-depth study conducted by the Department examining drug-related death case files, and more accurately specifies unintentional/accidental drug-related overdose deaths. •Please see the 2007 Vital Statistics Summary Special Section, which presents information on the impact of manual vs. automated ICD coding on these two subgroups of NYC’s drug-related deaths. Additional discussion on drug death coding appears in the Annual Summaries of 1989 through 1998. Deaths due to alcohol are reported separately. Deaths due to tobacco are reported under “All Other Natural Causes”. See Smoking and Alcohol-attributable Mortality below. •The ranking of deaths due to accidents, excluding drug poisoning deaths, appears in Tables 5 and 6. Maternal Death and Maternal Mortality- In ICD-10, the chapter “Pregnancy, childbirth, and the puerperium” (codes O00-O99) includes codes for deaths occurring more than 42 days after the termination of the pregnancy, which did not exist in ICD-9. However, the World Health Organization’s definition of "maternal mortality", used by this Summary, does not include these later deaths: included are “deaths of a woman while pregnant or within 42 days of termination of pregnancy ... from any cause related to or aggravated by the pregnancy or its management ..." This includes ICD-10 codes O00-O95, O98-O99 and A34, obstetrical tetanus. Note also that the denominator of the maternal mortality rate is live births. Since the 2000 Annual Summary, new lines have been inserted in Table 4 and Table 25 to distinguish between all causes of death due to pregnancy, childbirth and puerperium and the smaller group of “maternal” deaths. In Table 4, Deaths by Cause, all deaths due to pregnancy, childbirth and the puerperium are shown (and are rankable) followed by "maternal" deaths. In Table 25, Deaths and Crude Death Rates, historical data from 1901 through 2002 are correctly relabeled "maternal causes" and a new category based on the ICD-10 - pregnancy, childbirth and the puerperium - is shown beginning in 1999. Table 46, Live Births, only includes “maternal” deaths. An error in 1999 data in Table 46 was corrected in the 2000 Annual Summary. External Causes of Death - External causes of death include accidents, intentional self-harm (suicide), assault (homicide), legal intervention, events of undetermined intent, operations of war and their sequelae, and
complications of medical and surgical care. Beginning in 1999, these causes are shown separately in Table 4. •All death certificates for external causes are reported by the Office of Chief Medical Examiner. If there are deaths for which a cause has not been determined by the time the statistical file is closed, they are shown separately as ‘pending final determination’ in Table 4; some of these pending deaths will later be determined to be due to natural causes. • The number of deaths classified as events of undetermined intent should be considered in analysis of deaths due to external causes. Homicide - A homicide is the action of one person causing the death of another regardless of intent (e.g., whether self-defense or justifiable legal intervention). Annual counts of homicides reported by the New York City Police Department (NYPD) differ from DOHMH Vital Statistics for a number of reasons, described below. However, reported trends are similar. • The NYPD reports homicides as counts of Murder and Non-Negligent Manslaughter using the Federal Bureau of Investigation’s Uniform Crime Reporting System (UCR) rules and procedures. The count includes deaths determined to be both criminal and satisfying the UCR guidelines. Some homicides are judged to be justifiable by the NYPD and are reported separately to the FBI. These homicides include justifiable events involving law enforcement officers and/or civilians. Vital Statistics reports a death as a homicide using the ICD-10 system. All homicides are medical examiner (ME) cases. Legal intervention is defined in the ICD-10 as “including injuries inflicted by police or other law-enforcing agents...in the course of arresting or attempting to arrest... and other legal action.” Since 2003, the number of deaths from legal intervention has been reported separately in Tables 4 and 16. They are excluded in the homicide counts of Tables 7, 8, and 21. • NYPD Murder and Non-Negligent Manslaughter statistics count all murders that are known to have been committed in NYC regardless of where the death may have occurred. DOHMH Vital Statistics reports all homicide deaths that occur in NYC regardless of where the crime occurred. • NYPD, in their annual count, includes homicides known to have occurred within that calendar year by the second week of January of the following year. Any death determined to be a criminal murder outside of that time period will be counted in the year that the determination is made. DOHMH Vital Statistics reports homicide by the date of the death. DOHMH Vital Statistics closes its count of deaths approximately 10 months after the year end and includes all late homicide determinations through that period from the Medical Examiner.
• Sometimes death resulting from a crime occurs many years after the crime was committed. Other times, deaths that occur in the past may need to be re-evaluated by the ME. In either situation, the death may be determined by the ME to be a homicide. The NYPD will evaluate the case and may classify or re-classify the death as a criminal homicide. If classified as a criminal homicide, NYPD will count the death in the year that the determination is made. Vital Statistics will report the homicide by the date of death. However, in the situation that the reclassification of the death occurs after the Vital Statistics files have closed, this death will be recorded as a homicide on the certificate of death but the reported homicides for the year of death will not change nor will this death show up in the year in which the determination was made. Accident - Complications of medical and surgical care were included with accidents in ICD-9, but are not in ICD-10 and are therefore shown separately since 1999. •The site of accidents, home and public place, has been dropped since 1999 because reporting was not reliable. •Motor vehicle accident deaths or other traffic fatalities reported by Vital Statistics sometimes do not agree with the numbers released by the Department of Transportation/New York City Police Department (DOT/NYPD). There are two major differences in the methodology used to calculate the number of traffic fatalities. First, DOT/NYPD does not include deaths resulting from illness while operating a motor vehicle in their traffic fatality count, while the Annual Summary does. Second, in cases where serious injury suffered during a motor vehicle accident results in subsequent death (e.g., one month later), the fatality will be counted by DOT/NYPD for the month in which the accident occurred. However, the Office of Vital Statistics always reports deaths by date of death. World Trade Center Deaths – Starting in 2008, all late effect WTC deaths occurring post 2001 will be reported in the year of the confirmed death report and listed in the corresponding Vital Statistics Summary report Table 4 under Assault (homicide): ICD-10 Code U02. The current total, based on death certificates filed through December 24, 2009, is 2,752. In the 2001 Annual Summary, 2,740 World Trade Center (WTC) deaths were reported as preliminary, based on death certificates filed through February 1, 2003 with the Office of Vital Records. These deaths were generally not included in the Summary tables and figures due to the effect this large figure would have on year-to-year trends. In 2002, in the Special Section of the Annual Summary, the number of WTC deaths was updated from 2,740 to 2,749. This sum included 6 additional death certificates filed

TECHNICAL NOTES, 2008
83
through October 31, 2003 and 3 deaths that occurred outside of New York City. In 2007, a 2002 death was determined to be a WTC death; in 2008 a 2001 death was determined to be a WTC death and also in 2008, the New York State Supreme court ruled that a specified missing person be added to the list of victims. FATAL OCCUPATIONAL INJURIES The data presented in Table 11 and Figures 9 and 10 include all fatal injuries occurring in New York City regardless of the residence of decedents or location of the deaths, i.e., deaths can occur inside or outside of New York City. Autopsy and other reports for deaths due to external causes are reviewed to determine if the injury occurred at work. Definitions and terminology are those of the Bureau of Labor Statistics, U.S. Department of Labor, which may differ from those generally used in vital statistics. Beginning in 2003, coding for industries was changed from Standard Industrial Classification (SIC) to the North American Industry Classification System (NAICS). Because of the substantial differences between SIC and NAICS, comparisons by industry with previous years are not encouraged. SMOKING- AND ALCOHOL-ATTRIBUTABLE MORTALITY Smoking- and alcohol-attributable deaths represent the number of NYC deaths that were attributed to exposure to smoking and alcohol, respectively. These statistics were computed using similar methodologies. Smoking-attributable mortality (SAM) was derived by CDC’s Adult SAMMEC (Smoking-Attributable Mortality, Morbidity, and Economic Costs) program using an attributable fraction formula. SAMMEC used NYC sex-specific smoking prevalences, estimated from the DOHMH Community Health Survey (CHS) and computed by the Bureau of Epidemiology, and the relative risks (RR) of death for current and former smokers ≥35 years of age for 19 smoking-related diseases, estimated from American Cancer Society's Cancer Prevention Study, to compute the smoking-attributable fraction (SAF) for each smoking-related disease and sex using the following formula:
SAF = [(p0 + p1(RR1) + p2(RR2)) - 1] / [p0 + p1(RR1) + p2(RR2)],
where p0 is percentage of adult never-smokers in NYC; p1 is percentage of adult current smokers in NYC; p2 is the percentage of adult former-smokers in NYC; RR1 is the relative risk of death for adult current smokers relative to adult never-smokers; and RR2 is the relative risk of death for adult former-smokers relative to adult never-smokers. To estimate the SAM, Adult SAMMEC
multiplied the age- and sex-specific SAFs by the number of deaths for each smoking-related disease. Specifically, the number of deaths for each sex and 5-year age category was multiplied by the SAF:
SAM = Number of deaths x SAF Summing across age categories provides the sex-specific estimate of SAM for each disease. Total SAM is the sum of the sex-specific SAM estimates. A detailed description of the methodology is available at http://apps .nccd.cdc.gov/sammec. Alcohol-attributable mortality (AAM) was derived by the Alcohol-Related Disease Impact (ARDI) program using an alcohol-attributable fraction (AAF), which is defined as the proportion of deaths from a specific condition due to alcohol. For conditions that are by definition caused by alcohol use, the AAF was set to be 1.0. For other conditions, especially injuries, ARDI directly estimated the AAF based on direct observations about the relationship between alcohol and a given health outcome. For most chronic conditions, the AAF was indirectly estimated using NYC alcohol prevalence data from the CHS combined with pooled risk estimates from large meta-analyses using the following formula:
AAF = [ p * (RR – 1)] / [1+ (p * (RR – 1)], where p is the percentage of NYC men and women age 20 years and older who consume alcohol at a specified level of average daily alcohol consumption within a given year, and RR is the likelihood of death from a particular condition at a specified level of average daily alcohol consumption. To estimate AAM, AAFs were multiplied by the number of NYC deaths for specific causes defined by CDC’s National Center for Chronic Disease Prevention and Health Promotion. Detailed description of the methodology is available at http://apps.nccd.cdc.gov/ardi/ HomePage.aspx AGE OF DECEDENT For ages greater than one year, decedent’s age is based on age at last birthday. For infants, actual age is used in minutes, hours, days or months. In previous editions of the Annual Summary, if age was unknown, it was coded to 65. Beginning with the 2001 Annual Summary, unknown ages are not recoded. LIFE EXPECTANCY, AGE SPECIFIC AND ADJUSTED
DEATH RATES Life expectancy tables summarize the effect of mortality rates prevailing at a specific time on persons being born or living at that time. Tables may be computed for population subgroups, most often males, females, and
race groups. The components required are counts and mortality figures for the desired subgroups. Life expectancy tables for New York City are generally presented for census years, when accurate population data are available (Table 22). The mortality experience for the census year, the year before, and the year after is used to smooth statistical variation and reduce the large effect an unusual event in a single year can have, such as a flu epidemic. The World Trade Center disaster deaths are not included in calculation of life expectancy in Table 22. See the Special Section in 2002 Summary for the impact of WTC deaths to life expectancy. • Beginning in 2005, a new table, Table 23 (Table 22a in 2004), provides annual life expectancy by age and sex so the viewer can see trend data between census years. Life expectancy here is estimated using single year death data. This results in slightly different life expectancy estimates for 2000 in Tables 22 and 23. Table 23 does not include life expectancy for 2008 because national data are required and not yet available. • Average yearly age-sex and age-sex-race adjusted death rates for 1990 in Tables 25a and 25b, respectively, used 1990 census MARS (modified for age, race and sex) population and 1989 and 1991 mortality data. Average yearly age-adjusted death rates for 2000 in Tables 25a and 25b used 2000 population data and 1999-2001 mortality data. Adjustment allows comparisons between rates to be made over time or between geographic areas by eliminating the effects of differences in the composition of the populations. For 1999-2001, cause-specific rates are adjusted for only age to avoid losing too much information from crude death rates. A new 2000 U.S. standard population is used to calculate cause-specific age-adjusted death rates, while for earlier years the 1940 standard U.S. population was used. Since the Census Bureau has not produced MR (modified for race) 2000 data by single year of age, there is no change for life expectancy calculation and age-adjusted death rates. • Tables 25a/b: A change in the data used for the 1980 and 1990 calculations is noted in Tables 25a and 25b by a line separating these rates from those for earlier years. The calculations for 1980 and 1990 used information on all deaths occurring to New York City residents regardless of place of occurrence, which was obtained from the New York State Department of Health (NYS DOH), whereas previous computations used all deaths occurring in New York City regardless of residence of the decedent. Mortality data for 2000 includes all New York City residents regardless of place of occurrence; however mortality data were obtained from NCHS as opposed to NYS

TECHNICAL NOTES, 2008
84
DOH. As a result, 2000 mortality data may include more non-New York City occurrences than previous years. Another line is drawn in Table 25b to show that a different data source and standard population were used for the 1999-2001 period than for earlier years. • Beginning in 2000, life expectancy was estimated by ethnic groups instead of race to ascertain differences among Hispanics, non-Hispanic whites and non-Hispanic blacks. To enable comparison, life expectancy for 1990 was recalculated by ethnic group. • Historical data on Hispanic ancestry and estimates of life expectancy should be used with caution. Before 1993, ancestry of decedents, which may indicate decedents’ Hispanic ethnicity, was obtained from the medical certifier. Under-reporting of all ancestries, including Hispanic, was therefore possible. To overcome this problem, death certificates were revised in June 1993 to require funeral directors to provide the ancestry information, presumably from decedents’ family members. Hispanic life expectancy may be overestimated because of the age distribution of Hispanics and because of immigration patterns. The age distribution of Hispanics is different from non-Hispanic whites and non-Hispanic blacks, with fewer Hispanics in the older age groups than other ethnic groups. This would cause an underestimate of Hispanic death rates and hence overestimate of Hispanic life expectancy. An overestimate of Hispanic life expectancy would also occur if Hispanics moved out of the U.S. to die at a greater rate than other ethnic groups. YEARS OF POTENTIAL LIFE LOST Years of potential life lost (YPLL) measures years lost due to premature death. In contrast to mortality measures, YPLL emphasizes the processes underlying premature mortality in a population. YPLL is often calculated using a cutoff age, 65 or 75, as follows: YPLL=Σ[(cutoff age - i )] x di where i is the midpoint of the grouped year of age at death and di is the number of deaths at grouped year of age i. YPLL can be calculated for specified causes of death. In the Annual Summary’s presentation of YPLL (Table 24), age 75 is used as the cut-off age and single year of age is used in calculation. Therefore i is single year of age under 75. INFANT MORTALITY The infant mortality rate consists of the number of infant deaths in New York City in a specified year divided by the number of live births in the city in the same year; some infants in the numerator were born in the preceding year, and some in the denominator will die in the following year. The same definition applies to geographic subdivisions
included in some tables. •In the Annual Summary, all characteristics of infant deaths are drawn from the death certificate except in Tables 42a-d, 43 and 46, which use the ethnic group of the mother from the child’s birth certificate. In Tables 42a-d and 43, birth weight and gestational age are based on the birth certificate. BIRTHS DATA PRESENTATION Starting in the 2007 summary, items with unknown/not stated values are not included in the denominator when calculating percentages. This affects the following tables: 34, 35, 36, 39, 40, 41; Maps: 1, 2, 3, 4. 2008 REVISED NYC BIRTH CERTIFICATE – January 1, 2008, NYC initiated the use of a Board of Health approved revised birth certificate conforming to 2003 U.S. Standard Certificate of birth recommendations (http://www.cdc.gov/nchs/data/dvs/birth11-03final-ACC.pdf). Variables were added to the certificate, changed, and removed (See pages 84-85 for the NYC 2008 revised birth certificate). •New data items (only some of which are reported in the Vital Summary) – Parents’ length of time in U.S.; Mother’s height; Mother’s weight at delivery; Date of last pre-natal care visit; Total number of previous live births; Number previous preterm births; Number previous low birth weight live births; Whether mother (age≥35) was offered genetic testing; Whether delivery with forceps/vacuum attempted; Indications for vacuum/forceps use; If cesarean whether trial of labor attempted; If birth weight <1,250 grams reason for delivery at less than level III hospital; How infant is being fed; and Whether Hepatitis B inoculation was administered. •Revised data items – (only some of which are reported in the Vital Summary) Parents’ education item changed from highest year of education to highest level completed; Parents’ ancestry item changed to specify origin for non-Hispanic parents in addition to Hispanic parents; Parents’ race item has been revised to include the option of selecting multiple races from list defined by US Census; WIC item and cigarette smoking are now collected on the mother’s worksheet as opposed to the facility worksheet; Illicit and other drug use during this pregnancy item has been moved from a subset of questions under “other risk factors for this pregnancy” to a separate item on the birth certificate and now includes methamphetamine among specific drug options; Type of place (of birth) item changed to distinguish between home delivery planned, unplanned, or unknown and to include clinic/doctor’s office; Primary payer item replaced “Primary Financial Coverage” and includes Medicaid and other government
insurance (Family Health Plus, Child PlusB), Private Insurance, Military Insurance (CHAMPUS/TRICARE), Self-pay, other and unknown options; Total number of prenatal care visits for this pregnancy item has replaced Total number of visits to all providers item; Primary prenatal care provider type item has been changed from All provider types giving care item and options have changed to MD/DO; C(N)M/NP/PA/Other Midwife, clinic, no provider, no information, other; Total number of other pregnancy outcomes/ number of spontaneous terminations <20 weeks, ≥20 weeks/number of induced terminations of pregnancy items have been changed to collect less detailed information; Risk factors for this pregnancy item has been revised from Medical risk factors for this pregnancy item and now includes information on infertility treatments, previous cesarean section, previous poor pregnancy outcomes, more specific information on cardiac disease, and asthma. Infections present and/or treated during this pregnancy item is now listed as separate from “Medial risk factors for this pregnancy” item and includes infections not previously listed as options; Obstetric procedures item has been revised to include new options; Fetal presentation at birth and final route and method of delivery items now exist has two separate questions; Indications for C-section item now gives the facility a list of choices rather than requiring specifying in their own words; Other procedures performed at delivery item now gives the facility a list of choices rather than a blank for writing in their own words; Anesthesia item offers a list of options, is now separate from Complications of Labor and/or Delivery, and collects information on complications of anesthetics; Maternal morbidity item has been revised as separate from “Complications of labor and/or delivery” item and offers a list of options; Infant transferred item now collects whether transfer occurred before or after 24 hours of delivery; Apgar score item now requires a 10 minute score if the five minute score was <6; Abnormal conditions item offers a shorter list of options; Congenital anomalies item has been expanded to document whether anomalies were detected prenatally, and with what diagnostic method. •Removed Data Items – Radiation exposure during pregnancy item; Type of analgesia used item; Mother’s blood group and Rh item; and whether mother was patient of private physician or general service item. New Items Reported in the Summary: •Tables 34-36 and 39-40 added Pre-pregnancy Obesity as a Selected Characteristic of the mother. Obesity is defined by BMI > 30. •Tables 31 and 33 report a new category for ethnicity, “Non-Hispanic, two or more races” as the Electronic Birth Registration system allows birth clerks to enter multiple race

TECHNICAL NOTES, 2008
85
when the mother reports this on the worksheet (See Multiple Race under Race, Ancestry, Ethnic group and Birth Place in Technical Notes). •Map 4, Percent Pre-pregnancy Obesity by Community District of Residence, replaced Percent Late or No Prenatal Care by Community District of Residence. Changes to Birth Items Reported in the Summary Due to Data Quality Concerns: A combination of poor data quality and hospital staff adaptation to the new data entry system and worksheets affected data quality resulting in changes to items presented in the 2008 Summary. In Tables 31 and 33 and Figure 23, the number of women categorized with ethnicity “not stated” resulted from a 2-fold increase in reporting race “unknown” on the birth certificate. In Tables 30 and 35, the number of women categorized as reporting “other” ancestry has increased two-fold due to data entry errors; this slightly affected the overall distribution of live births by ancestry. In Tables 32 and 33 – Mother’s Total Live Births Including This One is reported dichotomously as First Live Birth Yes/No instead of categorically and First Date of Prenatal Care is not reported. MOTHER’S MARITAL STATUS New York City is prohibited by local law from recording mother’s marital status on the record or report of birth. It is computed for
purposes of statistical analysis and reporting. As a result, this statistic should be analyzed cautiously. • Prior to 1996, it was computed using an algorithm developed by NCHS. • In 1996, a review of marital status results indicated that the number of non-marital births was being overestimated. • In 1997, a new method was implemented which uses only the presence or absence of a father’s name on the birth certificate and the filing of an Acknowledgment of Paternity to estimate marital status. This procedure is consistent with that used by New York State. See Special Note in 1997 Vital Statistics Summary for more detailed information. •A complete discussion of the 1996 review of marital status can be found in the Special Note on Mother’s Marital Status in the 1997 Annual Summary. TEEN BIRTH RATE Counts of teen births include all births occurring to women under the age of 20 (see tables 39, 40, 41); teen birth rates are limited to those teens between the ages of 15 and 19 (Tables 28a and 40), for which population denominators can be appropriately applied to compute a reliable rate. GESTATIONAL AGE Gestational age is defined as the best obstetric estimate of the infant’s gestation in completed weeks based on the birth attendant’s final
estimate of gestation. It is also referred to as the clinical estimate of gestation. Beginning in 2007, characteristics of live births and/or infant deaths in Tables 32-36, 39-41, 42c-d and Figure 24 include either gestational age categories or a dichotomous indicator of preterm (<37 weeks gestation) birth. INDUCED AND SPONTANEOUS TERMINATIONS OF PREGNANCY The number of induced and spontaneous terminations reported depends to some extent on active surveillance, notwithstanding that all terminations, not just those of a certain gestational age or weight, are required to be reported. Active surveillance caused an increase in the number of spontaneous terminations reported beginning in 1992. An additional result is that some events from earlier years are included in subsequent year’s Vital Statistics Summary. In 1997, one facility was found to have failed to submit reports for over 11,000 1996 procedures. These reports, and about 500 from several other facilities, were reported in revised tables for 1996 pregnancy outcomes in the 1997 Vital Statistics Summary. A discussion of the revised tables and the corrected data for all pregnancy outcomes can be found in the Technical Notes, 1997.

86
New York City Certificates of Birth, Death, Spontaneous Termination of Pregnancy and Induced Termination of Pregnancy
New York City data on births, deaths and spontaneous and induced terminations of pregnancy are derived from the certificates filed with Vital Records. Samples are displayed on the pages that follow. Birth and termination of pregnancy certificates are required to be filed regardless of gestational age.
Birth Certificate – Birth certificates must be filed within five business days of the event. Over 99% of NYC births occur in hospitals and birthing facilities. The birth certificate is comprised of two parts: the certificate of birth and the confidential medical report of birth.
The certificate of birth is the legal record. It is signed by the medical provider (physician or midwife) or an official representing the medical provider and filed with the DOHMH both on paper and electronically. The confidential medical report, used for the compilation of public health statistics and scientific purposes, collects parents’ demographic information, mother’s prenatal history and care, information on financial coverage, maternal morbidity, labor and delivery, and condition and treatment of the infant at and immediately after birth. These data are collected from the mother, the mother’s and infant’s medical records, and medical providers. Since 1997, almost all confidential medical reports have been completed electronically.
Death Certificate – Death certificates must be filed within 72 hours of death or finding the body. There are two forms, one for natural causes and one for medical examiner cases.
Natural cause practitioner certificates - Most (85%) of deaths are due to natural causes and are completed by the attending physician or his or her authorized medical associate. Medical examiner certificate of death - When the cause of death is an accident, homicide, suicide, unattended or due to certain other circumstances (approximately 15% of deaths), the NYC Office of Chief Medical Examiner (OCME) completes the medical examiner certificate of death and supplementary report.
The two forms are similar. Both collect important information pertaining to the fact of death (person, place and time of death). Both collect ‘personal particulars’ which include items such as decedent’s Social Security number, address, birth place, education, marital status, informant’s information and place of disposition. The personal particulars are typically provided by the family of the decedent through the funeral home. Both collect cause of death which is completed by the physician or a medical examiner. On the natural cause certificate, the cause of death is on the confidential medical report; on the OCME certificate, it is on the certificate itself. In addition to cause of death, the OCME certificate collects information on the circumstances of external causes of death. The OCME certificate indicates manner of death: natural, accident, homicide, suicide or undetermined. The confidential medical report information is for the compilation of public health statistics and scientific purposes.
Spontaneous Termination of Pregnancy Certificate – Data collection on spontaneous terminations of pregnancy events is required to be completed on all fetal deaths regardless of gestational age and filed with the DOHMH within 72 hours of the event. Similar to the birth certificate, the spontaneous termination of pregnancy certificate has two parts, the certificate and the confidential medical report. The certificate is available to the mother. The confidential medical report information is collected for the compilation of public health statistics and scientific purposes.
Certificate of Induced Termination of Pregnancy – Data collection for induced terminations of pregnancy are required to be completed and filed with the DOHMH within 5 days of the event. The certificate does not contain the woman’s name or identifying information. It is confidential and only collected for the compilation of public health statistics and scientific purposes.

87
� Hospital � Freestanding Birthing Center � Clinic/Doctor’s Office
� Other-specify: ______________________________________________________
4a. DATE OFCHILD'SBIRTH
CERTIFICATE OF BIRTH
CERTIFICATE NO.
DATE FILED
1. NAMEOFCHILD
First Middle Last
(Month) (Day) (Year - yyyy) 4b. Time2. SEX 3a. NUMBER DELIVEREDof this pregnancy
3b. If more than one, number of this child in order of delivery
5. PLACEOFBIRTH
5c.TYPEOFPLACE
5a. NEW YORK CITY BOROUGH 5b. Name of Hospital or other facility (if not facility, street address)
6a. MOTHER'S MAIDEN NAME (Prior to first marriage)First Middle Last
6b. MOTHER'S DATE OF BIRTH(Month) (Day) (Year - yyyy)
6c. MOTHER'S BIRTHPLACECity & State or foreign country
7. MOTHER'S USUAL RESIDENCEa. State b. County
7c. City or town 7d. Street and number Apt. No. ZIP Code
8a. FATHER'S NAMEFirst Middle Last
9a. NAME OF ATTENDANT AT DELIVERY
8b. FATHER'S DATE OF BIRTH (Month) (Day) (Year - yyyy)
8c. FATHER'S BIRTHPLACECity and State or foreign country
� M.D. � Other Midwife� D.O. � R.N.� C.N.M./C.M.� Other-Specify ________________
9b. I CERTIFY THAT THIS CHILD WAS BORN ALIVEAT THE PLACE, DATE AND TIME GIVEN
Signed
Name of Signer
Address
Date Signed , Year - yyyy
(Type or Print)
Mother’s Current First Middle LastLegalName
Address Apt.
City State ZIP
VR 6 (Rev. 01/08)
TH
IS C
ER
TIF
ICA
TE
NO
T V
ALI
D U
NLE
SS
FIL
ED
IN T
HE
DE
PAR
TM
EN
T O
F H
EA
LTH
AN
D M
EN
TAL
HY
GIE
NE
Typ
ewrit
e or
prin
t w
ith b
lack
fine
poi
nt in
k. C
ertif
icat
es c
onta
inin
g al
tera
tions
or
omis
sion
s ar
e un
acce
pta
ble
.
Ple
ase
com
ple
te t
he fo
llow
ing:
Has
mot
her
app
rove
d a
ssig
nmen
t of
SS
N fo
r ch
ild?
Mot
her'
s S
SN
:Fa
ther
's S
SN
:
YE
S�
NO
�
Die
d: D
ate:
P
lace
:
Cer
t. N
o. � AM
� PM
7e. Inside citylimits of 7c?
Yes � No �
THE CITY OF NEW YORK – DEPARTMENT OF HEALTH AND MENTAL HYGIENE
� Home Delivery: Planned to deliver at home?
� M.D. � Other Midwife� D.O. � R.N.� Hosp. Admin.� C.N.M./C.M.� Other-Specify _________________
� Yes� No� Unknown
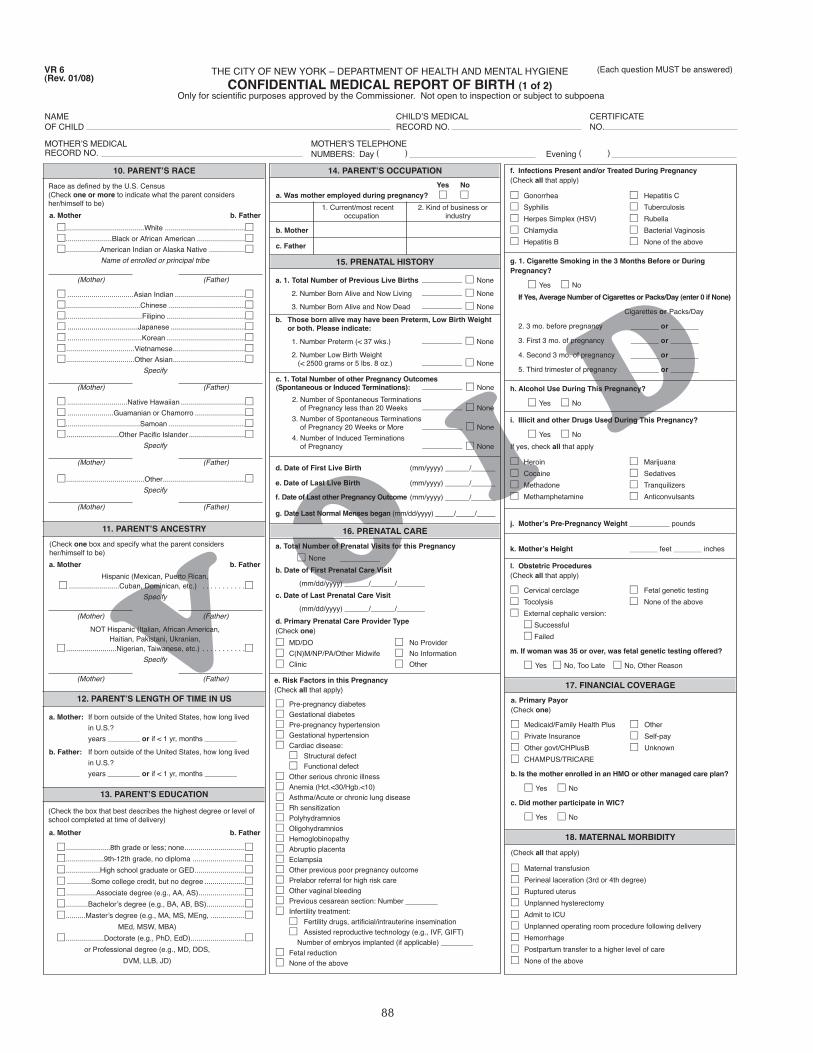
88
10. PARENTʼS RACE
Race as defined by the U.S. Census(Check one or more to indicate what the parent considers her/himself to be)
a. Mother b. Father
�.......................................White ........................................��.......................Black or African American ........................��.................American Indian or Alaska Native ..................�
Name of enrolled or principal tribe
(Mother) (Father)
� .................................Asian Indian ...................................��.....................................Chinese ......................................��......................................Filipino .......................................�� ...................................Japanese .....................................�� .....................................Korean .......................................��..................................Vietnamese....................................��..................................Other Asian....................................�
Specify
(Mother) (Father)
� ..............................Native Hawaiian ................................�� .......................Guamanian or Chamorro .........................��.....................................Samoan ......................................�� ..........................Other Pacific Islander ............................�
Specify
(Mother) (Father)
�.......................................Other.........................................�Specify
(Mother) (Father)
15. PRENATAL HISTORY
a. 1. Total Number of Previous Live Births __________ � None
2. Number Born Alive and Now Living __________ � None
3. Number Born Alive and Now Dead __________ � None
b. Those born alive may have been Preterm, Low Birth Weight or both. Please indicate:
1. Number Preterm (< 37 wks.) __________ � None
2. Number Low Birth Weight(< 2500 grams or 5 lbs. 8 oz.) __________ � None
(Check the box that best describes the highest degree or level ofschool completed at time of delivery)
a. Mother b. Father
� ......................8th grade or less; none..............................��...................9th-12th grade, no diploma ..........................��.................High school graduate or GED.........................�� ............Some college credit, but no degree ....................�� ...............Associate degree (e.g., AA, AS).......................��...........Bachelorʼs degree (e.g., BA, AB, BS)...................��..........Masterʼs degree (e.g., MA, MS, MEng, .................�
MEd, MSW, MBA)
�...................Doctorate (e.g., PhD, EdD)...........................�or Professional degree (e.g., MD, DDS,
DVM, LLB, JD)
12. PARENTʼS LENGTH OF TIME IN US
13. PARENTʼS EDUCATION
(Check one box and specify what the parent considers her/himself to be)
a. Mother b. Father
Hispanic (Mexican, Puerto Rican,� .........................Cuban, Dominican, etc.) . . . . . . . . . . .�
Specify
(Mother) (Father)
NOT Hispanic (Italian, African American,Haitian, Pakistani, Ukranian,
� .........................Nigerian, Taiwanese, etc.) . . . . . . . . . . .�Specify
(Mother) (Father)
a. Mother: If born outside of the United States, how long lived
in U.S.?
years ________ or if < 1 yr, months ________
b. Father: If born outside of the United States, how long lived
in U.S.?
years ________ or if < 1 yr, months ________
11. PARENTʼS ANCESTRY
d. Date of First Live Birth (mm/yyyy) ______/______
e. Date of Last Live Birth (mm/yyyy) ______/______
f. Date of Last other Pregnancy Outcome (mm/yyyy) ______/______
g. Date Last Normal Menses began (mm/dd/yyyy) ____/____/____
16. PRENATAL CARE
a. Total Number of Prenatal Visits for this Pregnancy
� None __________
b. Date of First Prenatal Care Visit
(mm/dd/yyyy) ______/______/_______
c. Date of Last Prenatal Care Visit
(mm/dd/yyyy) ______/______/_______
d. Primary Prenatal Care Provider Type(Check one)
� MD/DO � No Provider
� C(N)M/NP/PA/Other Midwife � No Information
� Clinic � Other
e. Risk Factors in this Pregnancy(Check all that apply)
� Pre-pregnancy diabetes� Gestational diabetes� Pre-pregnancy hypertension� Gestational hypertension� Cardiac disease:
� Structural defect� Functional defect
� Other serious chronic illness � Anemia (Hct.<30/Hgb.<10)� Asthma/Acute or chronic lung disease � Rh sensitization � Polyhydramnios� Oligohydramnios� Hemoglobinopathy� Abruptio placenta � Eclampsia� Other previous poor pregnancy outcome � Prelabor referral for high risk care � Other vaginal bleeding � Previous cesarean section: Number ________ � Infertility treatment:
� Fertility drugs, artificial/intrauterine insemination� Assisted reproductive technology (e.g., IVF, GIFT)
Number of embryos implanted (if applicable) ________ � Fetal reduction� None of the above
f. Infections Present and/or Treated During Pregnancy(Check all that apply)
g. 1. Cigarette Smoking in the 3 Months Before or DuringPregnancy?
� Yes � No
If Yes, Average Number of Cigarettes or Packs/Day (enter 0 if None)
Cigarettes or Packs/Day
2. 3 mo. before pregnancy _______ or _______
3. First 3 mo. of pregnancy _______ or _______
4. Second 3 mo. of pregnancy _______ or _______
5. Third trimester of pregnancy _______ or _______
� Gonorrhea � Hepatitis C
� Syphilis � Tuberculosis
� Herpes Simplex (HSV) � Rubella
� Chlamydia � Bacterial Vaginosis
� Hepatitis B � None of the above
l. Obstetric Procedures(Check all that apply)
� Cervical cerclage � Fetal genetic testing
� Tocolysis � None of the above
� External cephalic version:
� Successful
� Failed
m. If woman was 35 or over, was fetal genetic testing offered?
� Yes � No, Too Late � No, Other Reason
� Heroin � Marijuana
� Cocaine � Sedatives
� Methadone � Tranquilizers
� Methamphetamine � Anticonvulsants
h. Alcohol Use During This Pregnancy?
� Yes � No
j. Motherʼs Pre-Pregnancy Weight __________ pounds
k. Motherʼs Height _______ feet _______ inches
i. Illicit and other Drugs Used During This Pregnancy?
� Yes � No
If yes, check all that apply
� Medicaid/Family Health Plus � Other
� Private Insurance � Self-pay
� Other govt/CHPlusB � Unknown
� CHAMPUS/TRICARE
b. Is the mother enrolled in an HMO or other managed care plan?
� Yes � No
c. Did mother participate in WIC?
� Yes � No
a. Primary Payor(Check one)
� Maternal transfusion
� Perineal laceration (3rd or 4th degree)
� Ruptured uterus
� Unplanned hysterectomy
� Admit to ICU
� Unplanned operating room procedure following delivery
� Hemorrhage
� Postpartum transfer to a higher level of care
� None of the above
(Check all that apply)
THE CITY OF NEW YORK – DEPARTMENT OF HEALTH AND MENTAL HYGIENE
CONFIDENTIAL MEDICAL REPORT OF BIRTH (1 of 2)Only for scientific purposes approved by the Commissioner. Not open to inspection or subject to subpoena
VR 6 (Rev. 01/08)
(Each question MUST be answered)
NAME CHILDʼS MEDICAL CERTIFICATEOF CHILD RECORD NO. NO.
MOTHERʼS MEDICAL MOTHERʼS TELEPHONE RECORD NO. NUMBERS: Day ( ) Evening ( )
c. 1. Total Number of other Pregnancy Outcomes(Spontaneous or Induced Terminations): __________ � None
2. Number of Spontaneous Terminationsof Pregnancy less than 20 Weeks __________ � None
3. Number of Spontaneous Terminationsof Pregnancy 20 Weeks or More __________ � None
4. Number of Induced Terminationsof Pregnancy __________ � None
18. MATERNAL MORBIDITY
17. FINANCIAL COVERAGE
14. PARENTʼS OCCUPATION
Yes Noa. Was mother employed during pregnancy? � �
1. Current/most recent 2. Kind of business oroccupation industry
b. Mother
c. Father

89
19. LABOR AND DELIVERY
a. If birth occured in hospital, was mother transferred in before giving birth?
If yes, name of facility transferred from
� Yes ____________________________________________________
� No
b. Motherʼs Weight at Delivery
________ pounds
c. Onset of Labor(Check all that apply)
� Prolonged rupture of membranes � Prolonged labor(12 hours or more) (20 hours or more)
� Premature rupture of membranes � None of the above(prior to labor)
� Precipitous labor (less than 3 hours)
d. Characteristics of Labor & Delivery(Check all that apply)
� Induction of Labor-AROM � Chorioamnionitis
� Induction of Labor-Medicinal � Febrile (>100.4F or 38C)
� Augmentation of Labor � Meconium staining
� Placenta previa � Fetal intolerance
� Other excessive bleeding � External electronic fetal monitor
� Steroids � Internal electronic fetal monitor
� Antibiotics � None of the above
e. 1. Anesthesia(Check all that apply)
� Epidural � Paracervical
� General inhalation � Pudendal
� General intravenous � Local
� Spinal � None of the above
2. Complications from any of the above?
� Yes � No
Method of Delivery
f. Fetal Presentation at Birth
� Cephalic � Other
� Breech
g. Final route and method of delivery (Check one)
� Vaginal/Spontaneous � Vaginal/Vacuum
� Vaginal/Forceps � Cesarean
1. If cesarean, was trial of labor attempted?
� Yes � No
2. Indications for C-Section � Unknown
(Select all that apply) � Maternal condition-not pregnancy related
� Failure to progress � Maternal condition-pregnancy related
� Malpresentation � Refused VBAC
� Previous C-Section � Elective
� Fetus at risk/NFS � Other
3. Was delivery with forceps attempted but unsuccessful?
� Yes � No
4. Indications for Forceps � Unknown
(Select all that apply) � Fetus at Risk
� Failure to progress � Other
5. Was delivery with vacuum extraction attempted but unsuccessful?
� Yes � No
6. Indications for Vacuum � Unknown
(Select all that apply) � Fetus at Risk
� Failure to progress � Other
h. Other Procedures Performed at Delivery (Check all that apply)
� Episiotomy & repair � Repair of lacerations
� Sterilization � None of the above
b. If birth weight < 1250 grams (2 lbs. 12 oz.), reason(s) fordelivery at a less than level III hospital: (Only if applicable)
� None � Unknown at this time
(Select all that apply)
� Rapid/Advanced Labor � Severe pre-eclampsia
� Bleeding � Woman Refused Transfer
� Fetus at Risk � Other-specify ___________
a. Birthweight
_________ _________ or _________Pounds Ounces Grams
THE CITY OF NEW YORK – DEPARTMENT OF HEALTH AND MENTAL HYGIENE
CONFIDENTIAL MEDICAL REPORT OF BIRTH (2 of 2)Only for scientific purposes approved by the Commissioner. Not open to inspection or subject to subpoena
VR 6 (Rev. 01/08)
(Each question MUST be answered)
NAME CERTIFICATEOF CHILD NO.
d. Clinical Estimate of Gestation
Completed Weeks: _____________
e. Infant Transferred
Within 24 hours of Delivery After 24 hours Not Transferred
� � �
c. Apgar Score at
1. 1 minute 2. 5 minutes 3. 10 minutes
___________ ___________ ___________
Congenital Anomalies
k. Select all that apply
g. Abnormal Conditions of the Newborn(Check all that apply)
� Assisted ventilation required immediately following delivery
� Assisted ventilation required for more than six hours
� NICU admission
� Newborn given surfactant replacement therapy
� Antibiotics received by the newborn for suspected neonatal sepsis
� Seizure or serious neurologic dysfunction
� Significant birth injury (skeletal fracture(s), peripheral nerve injury, and/or soft tissue/solid organ hemorrhage which requires intervention)
� None of the above
h. Hepatitis B Inoculation
1. Immunization administered?
� Yes Date: (mm/dd/yyyy) _____/_____/_________
� No
2. Immunoglobulin administered?
� Yes Date: (mm/dd/yyyy) _____/_____/_________
� No
i. Is infant living at time of report?
� Yes � No
j. How is infant being fed? (Check one)
� Breast milk � Both
� Formula � Neither
20. INFANT
Yes No
� �
Yes No
� �
Yes No
� �
Yes No
� �
Yes No
� �
Yes No
� �
Yes No
� �
Yes No
� �
Yes No
� �
Yes No
� �
Yes No
� �
Yes No
� �
Yes No
� �
� Level II Ultrasound � MSAFP/Triple Screen
� Amniocentesis � Other � Unknown1. Anencephaly
Yes No
� �
� Level II Ultrasound � MSAFP/Triple Screen
� Amniocentesis � Other � Unknown2. Meningomyelocele/
Spina Bifida
Yes No
� �
� Level II Ultrasound
� Other � Unknown
3. Cyanotic Congenital
Heart Disease
Yes No
� �
� Level II Ultrasound
� Other � Unknown4. Congenital Diaphragmatic
Hernia
Yes No
� �
� Level II Ultrasound
� Other � Unknown5. Omphalocele
Yes No
� �
� Level II Ultrasound
� Other � Unknown6. Gastroschisis
Yes No
� �
� Level II Ultrasound
� Other � Unknown7. Limb Reduction Defect
Yes No
� �
� Level II Ultrasound
� Other � Unknown8. Cleft lip with or without
Cleft Palate
Yes No
� �
� Level II Ultrasound
� Other � Unknown9. Cleft Palate alone
Yes No
� �
� Level II Ultrasound � MSAFP/Triple Screen
� CVS � Amniocentesis
� Other � Unknown
10. Down Syndrome
� Karyotype confirmed
� Karyotype pending
Yes No
� �
� Level II Ultrasound � MSAFP/Triple Screen
� CVS � Amniocentesis
� Other � Unknown
11. Other Chromosomal Disorder
� Karyotype confirmed
� Karyotype pending
Yes No
� �
� Level II Ultrasound
� Other � Unknown12. Hypospadias
13. None of those listed above �
l. DiagnosedPrenatally? m. If Yes, please indicate all methods used:
f. If transferred, name of facility transferred to:
______________________________________________

5. Date last attended by a Physician
mm dd yyyy
6. Certifier: I certify that death occurred at the time, date and place indicated and that to the best of my knowledge traumatic injury or poisoning DID NOT play any part in causing death, and that death did not occur in any unusual manner and was due entirely to NATURAL CAUSES. See instructions on reverse of certificate.
Name of Physician Signature
Address License No. Date
D.O.M.D.
CERTIFICATE OF DEATH
1. DECEDENTʼSLEGAL NAME
(First Name) (Middle Name) (Last Name)
THE CITY OF NEW YORK – DEPARTMENT OF HEALTH AND MENTAL HYGIENE
Certificate No.
DATE FILED
(Type or Print)
8. Date of Birth (Month) (Day) (Year-yyyy) 9. Age at last birthday(years)
Under 1 Year Under 1 Day
Months Days Hours Minutes
10. Social Security No.
11a. Usual Occupation (Type of work done during most of working life. Do not use “retired”)
11b. Kind of business or industry 12. Aliases or AKAs
13. Birthplace (City & State or Foreign Coun-try)
18. Fatherʼs Name (First, Middle, Last)
20a. Informantʼs Name
19. Motherʼs Maiden Name (Prior to first marriage) (First, Middle, Last)
20b. Relationship to Decedent 20c. Address (Street and Number Apt. No. City & State ZIP Code)
22a. Funeral Establishment 22b. Address (Street and Number City & State ZIP Code)
14. Education (Check the box that best describes the highest degree or level of school completed at the time of death)
1 � 8th grade or less; none 4 � Some college credit, but no degree 7 � Masterʼs degree (e.g., MA, MS, MEng, MEd, MSW, MBA)
2 � 9th – 12th grade; no diploma 5 � Associate degree (e.g., AA, AS) 8 � Doctorate (e.g., PhD, EdD) or
3 � High school graduate or GED 6 � Bachelorʼs degree (e.g., BA, AB, BS) Professional degree (e.g., MD, DDS, DVM, LLB, JD)
Place
Of
Death
2a. New York City
2b. Borough
2d. Name of hospital or other facility (if not facility, street address)2c. Type of Place 4 � Nursing Home/Long Term Care Facility1 � Hospital Inpatient 5 � Hospice Facility2 � Emergency Dept./Outpatient 6 � Decedentʼs Residence3 � Dead on Arrival 7 � Other Specify
7a. Usual Residence State 7b. County 7c. City or Town 7e. Inside City Limits?
1 � Yes 2 � No
7d. Street and Number Apt. No. ZIP Code
15. Ever in U.S. Armed Forces?
1 � Yes 2 � No
17. Surviving Spouseʼs Name (If wife, name prior to first marriage) (First, Middle, Last)16. Marital Status at Time of Death1 � Married 3 � Married, but separated 5 � Widowed2 � Divorced 4 � Never married 6 � Unknown
21a. Method of Disposition1 � Burial 2 � Cremation 3 � Entombment 4 � City Cemetery
5 � Other Specify
21c. Location of Disposition (City & State or Foreign Country)
21b. Place of Disposition (Name of cemetery, crematory, other place)
Date and Time of Death
3a. (Month) (Day) (Year-yyyy) 3b. Time � AM
� PM
4. Sex
21d. Date of mm dd yyyyDisposition
1 2 3 4 5
VR 15 (Rev. 11/04)
ME
DIC
AL
CE
RT
IFIC
AT
E O
F D
EA
TH
(To
be fi
lled
in b
y th
e P
hysi
cian
) P
ER
SO
NA
L PA
RT
ICU
LA
RS
(To
be fi
lled
in b
y F
uner
al D
irect
or o
r, in
cas
e of
City
Bur
ial,
by P
hysi
cian
)
AUT
MANNER
RESIDENCE
ANC
ICD
CODE
BOR
INST
NH
ANC
H
BP
LDIS
DOHMHUSE ONLY
TH
IS C
ER
TIF
ICA
TE
NO
T V
AL
ID U
NL
ES
S F
ILE
D IN
TH
E D
EPA
RT
ME
NT
OF
HE
ALT
H A
ND
ME
NTA
L H
YG
IEN
E
90
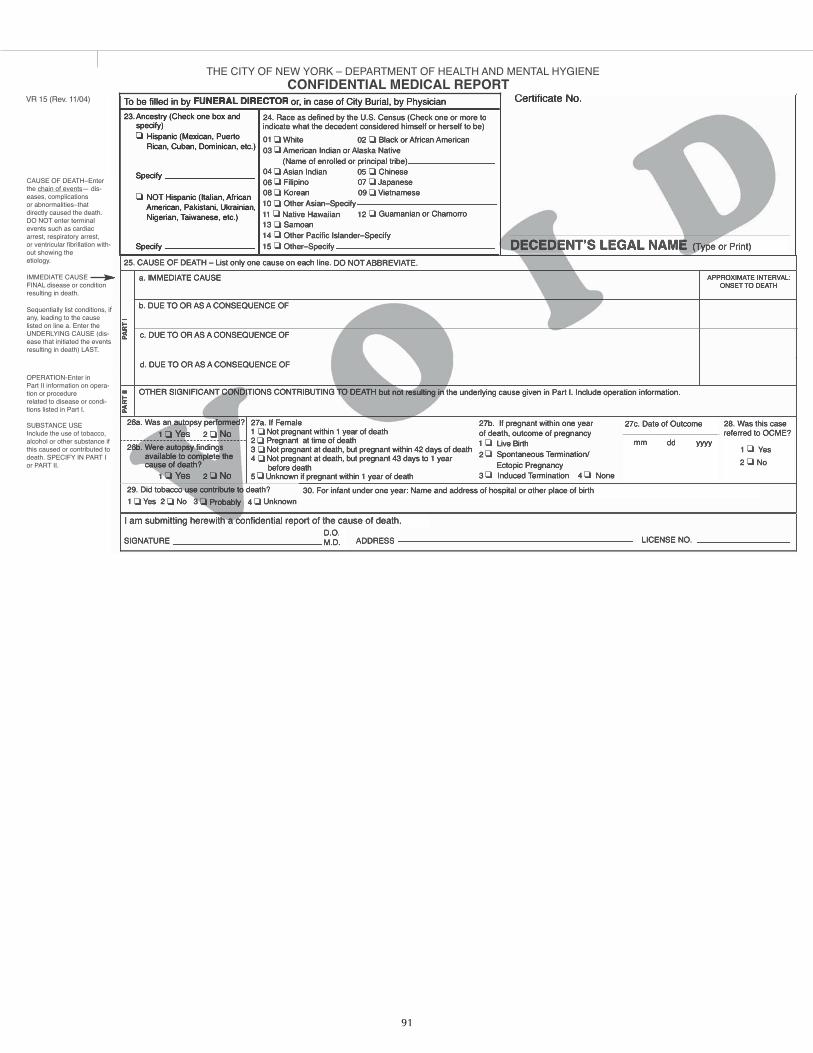
CONFIDENTIAL MEDICAL REPORTVR 15 (Rev. 11/04)
I am submitting herewith a confidential report of the cause of death.
24. Race as defined by the U.S. Census (Check one or more toindicate what the decedent considered himself or herself to be)
01 � White 02 � Black or African American03 � American Indian or Alaska Native
(Name of enrolled or principal tribe) 04 � Asian Indian 05 � Chinese06 � Filipino 07 � Japanese08 � Korean 09 � Vietnamese10 � Other Asian–Specify11 � Native Hawaiian 12 � Guamanian or Chamorro13 � Samoan14 � Other Pacific Islander–Specify15 � Other–Specify
23.Ancestry (Check one box and specify)� Hispanic (Mexican, Puerto
Rican, Cuban, Dominican, etc.)
Specify
� NOT Hispanic (Italian, AfricanAmerican, Pakistani, Ukrainian,Nigerian, Taiwanese, etc.)
Specify
APPROXIMATE INTERVAL:ONSET TO DEATH
27b. If pregnant within one yearof death, outcome of pregnancy1 � Live Birth2 � Spontaneous Termination/
Ectopic Pregnancy 3 � Induced Termination 4 � None
26a. Was an autopsy performed?
1 � Yes 2 � No26b. Were autopsy findings
available to complete the cause of death?
1 � Yes 2 � No
27a. If Female1 � Not pregnant within 1 year of death2 � Pregnant at time of death 3 � Not pregnant at death, but pregnant within 42 days of death4 � Not pregnant at death, but pregnant 43 days to 1 year
before death5 � Unknown if pregnant within 1 year of death
29. Did tobacco use contribute to death?
1 � Yes 2 � No 3 � Probably 4 � Unknown
28. Was this casereferred to OCME?
1 � Yes
2 � No
30. For infant under one year: Name and address of hospital or other place of birth
SIGNATURED.O.M.D. ADDRESS LICENSE NO.
To be filled in by FUNERAL DIRECTOR or, in case of City Burial, by Physician
THE CITY OF NEW YORK – DEPARTMENT OF HEALTH AND MENTAL HYGIENE
Certificate No.
DECEDENTʼS LEGAL NAME (Type or Print)
IMMEDIATE CAUSE FINAL disease or conditionresulting in death.
CAUSE OF DEATH–Enterthe chain of events— dis-eases, complications or abnormalities–that directly caused the death. DO NOT enter terminalevents such as cardiacarrest, respiratory arrest, or ventricular fibrillation with-out showing the etiology.
Sequentially list conditions, ifany, leading to the causelisted on line a. Enter theUNDERLYING CAUSE (dis-ease that initiated the eventsresulting in death) LAST.
OPERATION-Enter in Part II information on opera-tion or procedure related to disease or condi-tions listed in Part I.
SUBSTANCE USEInclude the use of tobacco,alcohol or other substance ifthis caused or contributed todeath. SPECIFY IN PART Ior PART II.
a. IMMEDIATE CAUSE
b. DUE TO OR AS A CONSEQUENCE OF
c. DUE TO OR AS A CONSEQUENCE OF
d. DUE TO OR AS A CONSEQUENCE OF
OTHER SIGNIFICANT CONDITIONS CONTRIBUTING TO DEATH but not resulting in the underlying cause given in Part I. Include operation information.
25. CAUSE OF DEATH – List only one cause on each line. DO NOT ABBREVIATE.
PAR
T I
PAR
T II
27c. Date of Outcome
mm dd yyyy
91

CERTIFICATE OF DEATH
Place
Of
Death
2a. New York City
2b. Borough
2d. Name of hospital or other facility (if not facility, street address)
Date and Time of Deathor Found Dead
3a. (Month) (Day) (Year-yyyy) 3b. Time � AM � PM
4. Sex 5. OCME Case No.
6. CAUSEOFDEATH
AP
PR
OX
IMAT
E IN
TER
VAL:
O
NS
ET
TO D
EAT
HPA RT
I
PART II
a. Immediate cause
b. Due to or as aconsequence of
c. Due to or as aconsequence of
7a. Injury Date (mm dd yyyy) 7b. Time� AM
� PM
7c. At Work1 � Yes
2 � No
7d. Place of Injury – At home, factory, street, etc.
7e. Location
7f. How Injury Occurred
7g. If Transportation Injury Specify
� Driver/Operator � Pedestrian
� Passenger
� Other Specify
9. Autopsy
� Yes
� No AutopsyPursuant to Law
� No Autopsy
8. Manner of Death� Pending further study� Natural � Homicide� Accident � Suicide � Undetermined
10. On the basis of examination and/or investigation, in my opinion, death occurred due to the causes and manner as stated:
Certifier Signature M.D. Date
Certifier Name (Print)(Medical Investigator) (Deputy Chief) (Chief) (Medical Examiner)
THE CITY OF NEW YORK – DEPARTMENT OF HEALTH AND MENTAL HYGIENE
Certificate No.
DATE FILED
� New
� Corr/Amend
� Replacement
1. DECEDENTʼSLEGAL NAME
(First Name) (Middle Name) (Last Name)
Other significant conditions contributing to death but not resulting in the underlying cause given in Part I. Include operation information.
12. Date of Birth (Month) (Day) (Year-yyyy) 13. Age at last birthday(years)
Under 1 Year Under 1 DayMonths Days Hours Minutes
14. Social Security No.
15a. Usual Occupation (Type of work done during most of working life. Do not use “retired”)
15b. Kind of business or industry 16. Aliases or AKAs
17. Birthplace (City & State or Foreign Country)
22. Fatherʼs Name (First, Middle, Last)
24a. Informantʼs Name
23. Motherʼs Maiden Name (Prior to first marriage) (First, Middle, Last)
24b. Relationship to Decedent 24c. Address (Street and Number Apt. No. City & State ZIP Code)
26a. Funeral Establishment 26b. Address (Street and Number City & State ZIP Code)
11a. Usual Residence State 11b. County 11c. City or Town 11e. Inside City Limits?
1 � Yes 2 � No
11d. Street and Number Apt. No. ZIP Code
19. Ever in U.S. Armed Forces?
1 � Yes 2 � No
21. Surviving Spouseʼs Name (If wife, name prior to first marriage) (First, Middle, Last)20. Marital Status at Time of Death1 � Married 3 � Married, but separated 5 � Widowed2 � Divorced 4 � Never married 6 � Unknown
25c. Location of Disposition (City & State or Foreign Country)
25b. Place of Disposition (Name of cemetery, crematory, other place)
25d. Date of mm dd yyyyDisposition
2c. Type of Place 4 � Nursing Home/Long Term Care Facility1 � Hospital Inpatient 5 � Hospice Facility2 � Emergency Dept./Outpatient 6 � Decedentʼs Residence3 � Dead on Arrival 7 � Other Specify
1 2 3 4 5
18. Education (Check the box that best describes the highest degree or level of school completed at the time of death)1 � 8th grade or less; none 4 � Some college credit, but no degree 7 � Masterʼs degree (e.g., MA, MS, MEng, MEd, MSW, MBA)
2 � 9th – 12th grade; no diploma 5 � Associate degree (e.g., AA, AS) 8 � Doctorate (e.g., PhD, EdD) or
3 � High school graduate or GED 6 � Bachelorʼs degree (e.g., BA, AB, BS) Professional degree (e.g., MD, DDS, DVM, LLB, JD)
25a. Method of Disposition1 � Burial 2 � Cremation 3 � Entombment 4 � City Cemetery
5 � Other Specify
VR 16 (Rev. 01/03)
ME
DIC
AL
CE
RT
IFIC
AT
E O
F D
EA
TH
(To
be fi
lled
in b
y th
e O
CM
E)
PE
RS
ON
AL
PAR
TIC
UL
AR
S(T
o be
fille
d in
by
Fun
eral
Dire
ctor
or,
in c
ase
of C
ity B
uria
l, by
OC
ME
)
AUT
MANNER
RESIDENCE
ANC
ICD
CODE
BOR
INST
NH
ANC
H
BP
LDIS
DOHMHUSE ONLY
TH
IS C
ER
TIF
ICA
TE
NO
T V
AL
ID U
NL
ES
S F
ILE
D IN
TH
E D
EPA
RT
ME
NT
OF
HE
ALT
H A
ND
ME
NTA
L H
YG
IEN
E
92

I certify that I personally examined the body on
at
SIGNATURE:
I did not personally examine the body after death.
SIGNATURE:
Cleared For CremationIf Family Requests
M.E. Signature
(Medical Investigator) (Deputy Chief) (Chief) (Medical Examiner)
(Deputy Chief) (Chief) (Medical Examiner)
(Date) (Location)
or
29c. Date of Outcome
mm dd yyyy
MEDICAL EXAMINERʼS SUPPLEMENTARY REPORTVR 16 (Rev. 01/03) Certificate No.
DECEDENTʼS LEGAL NAME (Type or Print)
To be filled in by FUNERAL DIRECTOR or, in case of City Burial, by OCME
THE CITY OF NEW YORK – DEPARTMENT OF HEALTH AND MENTAL HYGIENE
29a. If Female1 � Not pregnant within 1 year of death2 � Pregnant at time of death 3 � Not pregnant at death, but pregnant within 42 days of death4 � Not pregnant at death, but pregnant 43 days to 1 year before death5 � Unknown if pregnant within 1 year of death
30. Did tobacco use contribute to death?
1 � Yes 2 � No 3 � Probably 4 � Unknown
31. For infant under one year: Name and address of hospital or other place of birth
28. Race as defined by the U.S. Census (Check one or more toindicate what the decedent considered himself or herself to be)
01 � White 02 � Black or African American
03 � American Indian or Alaska Native(Name of enrolled or principal tribe)
04 � Asian Indian 05 � Chinese
06 � Filipino 07 � Japanese
08 � Korean 09 � Vietnamese
10 � Other Asian–Specify
11 � Native Hawaiian 12 � Guamanian or Chamorro
13 � Samoan
14 � Other Pacific Islander–Specify
15 � Other–Specify
27.Ancestry (Check one box and specify)� Hispanic (Mexican, Puerto
Rican, Cuban, Dominican, etc.)
Specify
� NOT Hispanic (Italian, AfricanAmerican, Pakistani, Ukrainian,Nigerian, Taiwanese, etc.)
Specify
29b. If pregnant within one year of death, outcome of pregnancy
1 � Live Birth
2 � Spontaneous Termination / Ectopic Pregnancy
3 � Induced Termination 4 � None
93

� AM
� PM
4c. TYPE OF PLACE
� Hospital � Home
� Birthing Center � Other
3. DATE OFDELIVERYOR OPERATIONFOR DELIVERY
CERTIFICATE OF SPONTANEOUS TERMINATION OF PREGNANCY
Certificate No.
DATE FILED
1. SEX OF FETUS� Male � Female
� Undetermined
(Month) (Day) (Year–yyyy) 3a. Hour2a. NUMBER DELIVEREDthis pregnancy
2b. If more than one, numberin order of delivery
4. PLACEOFDELIVERY
4a. NEW YORK CITYBOROUGH OF
4b. Name of HOSPITAL (if not in institution street address)
5a. MOTHER'S FULL MAIDEN NAME 5b. MOTHER'S DATE OF BIRTH(Month) (Day) (Year–yyyy)
5c. MOTHER'S BIRTHPLACECity & State or foreign country
6. MOTHER'S USUAL RESIDENCEa. State b. County c. City, town, or location d. Street and house number Apt. Zip
e. Inside citylimits of 6c?
Yes � No �
7a. FATHER'S FULL NAME
9. NAME OF ATTENDANT (AT) (AFTER) DELIVERY
7b. FATHER'S DATE OF BIRTH (Month) (Day) (Year–yyyy)
7c. FATHER'S BIRTHPLACECity & State or foreign country
R.N.C.N.M.Other MidwifeD.O.M.D.
Signature
Name ofPhysician
(Type or Print)
Did heart beat after delivery? Was there movement of voluntary muscle?Such cases must be reported by filing a certificate of birth and a certificate of death
8. I HEREBY CERTIFY THAT THIS DELIVERY OCCURRED AT THE HOUR AND ON THE DATE STATED ABOVE, THAT ALL THEFACTS STATED IN THIS CERTIFICATE ARE TRUE TO THE BEST OF MY KNOWLEDGE, INFORMATION AND BELIEF.
R.N.C.N.M.Other MidwifeD.O.M.D.
Date , Year–yyyy Address
FUNERAL DIRECTOR'S CERTIFICATE
I hereby certify that I have been employed as Funeral Director herein by
of This statement is made to obtain a permit for the
disposition of this fetus
Funeral Establishment Registration No. Address
PLACE OF BURIAL OR CREMATION DATE OF BURIAL OR CREMATION
VITAL RECORDS DEPARTMENT OF HEALTH AND MENTAL HYGIENE THE CITY OF NEW YORK
THIS
CE
RTI
FIC
ATE
NO
T VA
LID
UN
LES
S F
ILE
D IN
TH
E D
EPA
RTM
EN
T O
F H
EA
LTH
AN
D M
EN
TAL
HY
GIE
NE
1. T
ypew
rite
or p
rint w
ith b
lack
fine
poi
nt in
k.2.
Cer
tific
ates
con
tain
ing
alte
ratio
ns o
r om
issi
ons
are
unac
cept
able
.3.
Item
s "D
ate
filed
," "
Cer
tific
ate
No.
" an
d th
is s
pace
, res
erve
d fo
r D
epar
tmen
t of H
ealth
and
M
enta
l Hyg
iene
use
onl
y.
� I
CE
RT
IFY
TH
AT
I H
AV
E IN
MY
PO
SS
ES
SIO
N A
N A
FF
IDA
VIT
OF
AU
TH
OR
IZA
TIO
N F
OR
CR
EM
AT
ION
___
____
_
VR 17 (REV. 11/04)
(Address)
(Signature of Funeral Director) (State License No.)
FD
Initi
als
94

CONFIDENTIAL MEDICAL REPORTOnly for scientific purposes approved by the Commissioner. Not open to inspection or subject to subpoena
SURNAME OF MOTHER: ____________________________________________________________ CERTIFICATE NO.
16. Last NormalMenses BeganMo./Day/Yr-yyyy
a. Total PreviousPregnancies
Number ____None �
b. Now LivingNumber ____None �
c. Now DeadNumber ____None �
d. Under 13 WksNumber ____None �
g. Under 13 WksNumber ____None �
e. 13 to 19 WksNumber ____None �
h. 13 to 19 WksNumber ____None �
f. 20 Wks or moreNumber ____None �
i. 20 Wks or moreNumber ____None �
17. Previous Pregnancies (Complete all sections)
Born Alive Spontaneous Terminations Induced Terminations
18. Weight at Delivery
_______lbs _______ ozs (1)
OR______________ grams (2)
� Not Weighed (3)
19. Autopsy performed
1 � Yes 2 � No
20. Clinical Estimate of Gestation
________________Weeks
21. Fetus Died:
Before During At UnknownLabor Labor Delivery
1 � 2 � 3 � 4 �
22. This Termination of Pregnancy was caused by Fetal or Maternal
a. Immediate Cause
b. Due to
c. Due to
PART 2. Other significant conditions of conceptus or mother
PART
1
FOR GESTATION OF 20 WEEKS OR MORE REMAINDER OF CERTIFICATE MUST BE COMPLETED
MEDICAL RISK FACTORSFOR THIS PREGNANCY
(Check all that apply)
01 � Anemia (Hct. < 30/Hgb. < 10)02 � Cardiac disease03 � Acute or chronic lung disease
Diabetes04 � Gestational05 � Chronic06 � Genital herpes07 � Other STD08 � Hydramnios/Oligohydramnios09 � Hemoglobinopathy10 � Hepatitis
Hypertension11 � Chronic12 � Pregnancy-associated13 � Preeclampsia14 � Eclampsia15 � Incompetent cervix16 � Previous infant 4000 + grams17 � Previous preterm or small-for-
gestational-age infant18 � Renal disease19 � Rh sensitization
Uterine bleeding21 � Trimester – 122 � Trimester – 223 � Trimester – 300 � None24 � Other
OTHER RISK FACTORSFOR THIS PREGNANCY
(Check all that apply)
a. Tobacco use during pregnancy 1 � Yes � No
Average number of cigarettes per day
Alcohol use during pregnancy 2 � Yes � No
Average number of drinks per week
Heroin 3 � Yes � NoCocaine 4 � Yes � NoMethadone 5 � Yes � NoMarijuana 6 � Yes � NoSedatives, Tranquilizers,AnticonvulsantsSpecify 7Other DrugsSpecify 8
0 � None of the above
b. Weight
Prepregnancy Weight
Weight gained during pregnancy
c. Radiation exposure during pregnancy?
0 � No 1 � Yes
If yes specify Trimester and Type
COMPLICATIONS OF LABORAND/OR DELIVERY(Check all that apply)
01 � Anesthetic complications02 � Abruptio placenta03 � Placenta previa04 � Other excessive bleeding05 � Cord Prolapse06 � Conditions of Cord07 � Fetal distress08 � Cephalopelvic disproportion09 � Chorioamnionitis10 � Meconium staining11 � Premature rupture of
membranes (> 12 hours)12 � Seizures during labor13 � Precipitous labor (< 3 hours)14 � Prolonged labor (> 20 hours)15 � Failure to Progress16 � Breech/Malpresentation17 � Febrile (> 100°F. or > 38°C)00 � None18 � OtherSpecify
OBSTETRIC PROCEDURES(Check all that apply)
a. Amniocentesis01 � Genetic02 � Maturity03 � Stress Test04 � Non Stress Test
Electronic Fetal Monitoring05 � Internal06 � External07 � Scalp Sampling08 � Tocolysis09 � Other
Specify ________________________00 � None
01 � b. Induction02 � Stimulation03 � Both00 � Neither
Indication for Induction or StimulationSpecify ________________________
c. Ultrasonography exams
Number ______
0 � None
39 Other Procedures Performed at Delivery
Specify __________________________
0 � None
METHOD OF DELIVERY(Check all that apply)
01 � Vaginal02 � Vaginal after any prior C-section03 � Primary C-section04 � Repeat C-section05 � Breech Extraction06 � Mid Forceps07 � Low Forceps08 � Vacuum09 � Other, Specify
34. Prior C-section
0 � No 1 � Yes
37. Indication for C-sectionSpecify
31. Was Hospital Of This Delivery a:
1 � Prelabor Referral for High Risk2 � Emergency Transfer Prior To Delivery
Specify Transfer From0 � Neither
25. Mother'sBloodGroupand Rh
c. Total NumberOf Visits toAll Providers
0 � NONE
b. ProvidersCheck all that apply
1 � Hosp. 4 � SHF2 � MIC 5 � Pvt Phy
6 � Other3 � Other Clinic
a. DateFirst VisitTo Any Provider
Month Day Year-yyyy
30. Mother Was
1 � Private Physician's Patient
2 � General Services Patient
29. During This Pregnancy Did MotherParticipate in:1 � WIC 4 � AFDC2 � PCAP 5 � Other3 � MOMS Specify
0 � None
28. Primary FinancialCoverage This Pregnancy1 � Medicaid2 � HMO3 � Other 3rd Party4 � Self
23. Pregnancy History DateMonth Year-yyyy
a. First Live Birth
b. Last Live Birth
c. Last Other Termination
26. Congenital Anomalies Spec-ify
27a. Type of Anesthesia Specify
b. Type of Analgesia Specify
Prenatal Care24.
32. 33. 35.
38.
36.
VR 17 (REV. 11/04)
10. Race-White, Black,American Indian,Chinese, AsianIndian, Other specify
13. Occupation:Mother, most recentFather, usual
14. Kind ofbusiness orindustry
15. EmployedDuringThis Pregnancy
11. Ancestry (African -AmericanChinese, Cuban, GermanItalian, Puerto Rican etc.)
12. Education (Record highestyear completed)
Elem/Secondary0 - 12
College1-4 or 5 +
MOTHER
FATHER
10a.
10b.
11a.
11b.
12a.
12b.
13a.
13b.
14a.
14b.
15a. 1 � Yes0 � No
95
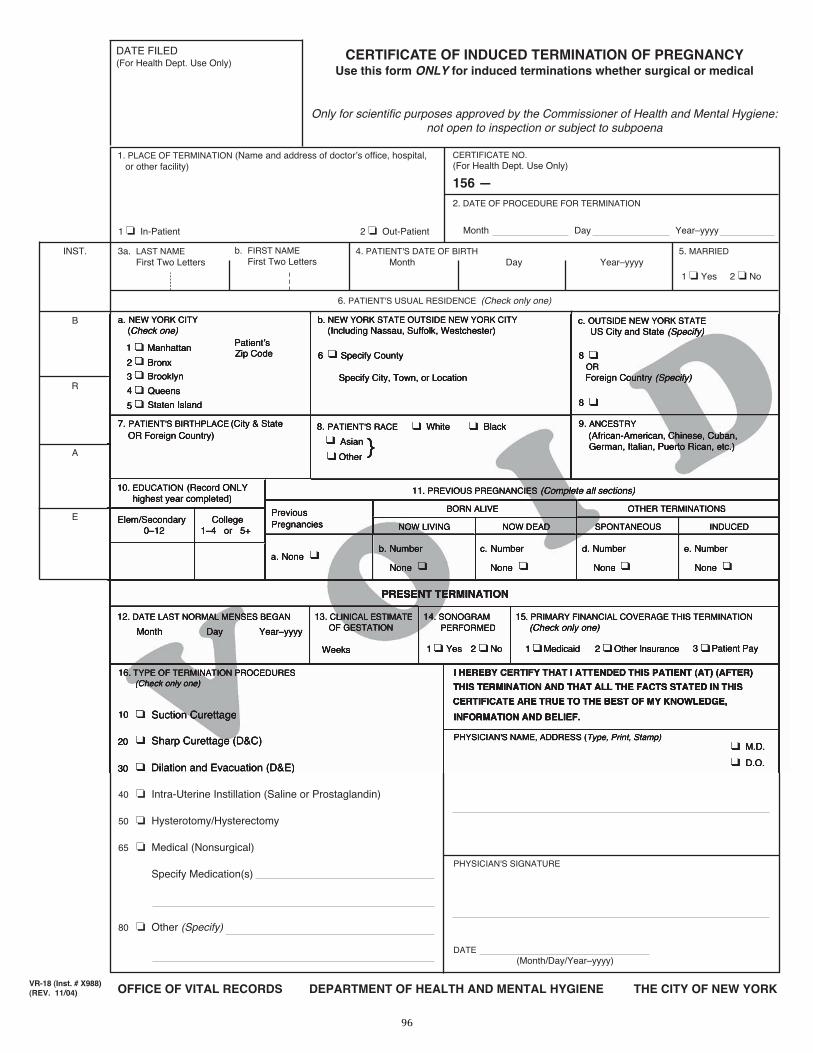
INST.
B
R
A
E
1. PLACE OF TERMINATION (Name and address of doctorʼs office, hospital,or other facility)
11. PREVIOUS PREGNANCIES (Complete all sections)
4. PATIENT'S DATE OF BIRTHMonth Day Year–yyyy
3a. LAST NAMEFirst Two Letters
6. PATIENT'S USUAL RESIDENCE (Check only one)
a. NEW YORK CITY(Check one)
1 � Manhattan
2 � Bronx
3 � Brooklyn
4 � Queens
5 � Staten Island
12. DATE LAST NORMAL MENSES BEGAN
Month Day Year–yyyy
13. CLINICAL ESTIMATE OF GESTATION
Weeks
14. SONOGRAM PERFORMED
1 � Yes 2 � No
15. PRIMARY FINANCIAL COVERAGE THIS TERMINATION (Check only one)
1 � Medicaid 2 � Other Insurance 3 � Patient Pay
PRESENT TERMINATION
BORN ALIVE OTHER TERMINATIONSPrevious Pregnancies
a. None �
NOW LIVING
b. Number
None �
NOW DEAD
c. Number
None �
SPONTANEOUS
d. Number
None �
INDUCED
e. Number
None �
10. EDUCATION (Record ONLY highest year completed)
Elem/Secondary College0–12 1–4 or 5+
9. ANCESTRY (African-American, Chinese, Cuban,German, Italian, Puerto Rican, etc.)
7. PATIENT'S BIRTHPLACE (City & State OR Foreign Country)
5. MARRIED
1 � Yes 2 � No
8. PATIENT'S RACE � White � Black
� Asian
� Other
b. NEW YORK STATE OUTSIDE NEW YORK CITY(Including Nassau, Suffolk, Westchester)
6 � Specify County
Specify City, Town, or Location
c. OUTSIDE NEW YORK STATEUS City and State (Specify)
8 �ORForeign Country (Specify)
8 �
PatientʼsZip Code
2. DATE OF PROCEDURE FOR TERMINATION
Month Day Year–yyyy
CERTIFICATE NO.(For Health Dept. Use Only)
156 —
1 � In-Patient 2 � Out-Patient
16. TYPE OF TERMINATION PROCEDURES(Check only one)
10 � Suction Curettage
20 � Sharp Curettage (D&C)
30 � Dilation and Evacuation (D&E)
40 � Intra-Uterine Instillation (Saline or Prostaglandin)
50 � Hysterotomy/Hysterectomy
65 � Medical (Nonsurgical)
Specify Medication(s)
80 � Other (Specify)
PHYSICIAN'S NAME, ADDRESS (Type, Print, Stamp)
DATE
PHYSICIAN'S SIGNATURE
I HEREBY CERTIFY THAT I ATTENDED THIS PATIENT (AT) (AFTER)
THIS TERMINATION AND THAT ALL THE FACTS STATED IN THIS
CERTIFICATE ARE TRUE TO THE BEST OF MY KNOWLEDGE,
INFORMATION AND BELIEF.
b. FIRST NAMEFirst Two Letters
CERTIFICATE OF INDUCED TERMINATION OF PREGNANCYUse this form ONLY for induced terminations whether surgical or medical
Only for scientific purposes approved by the Commissioner of Health and Mental Hygiene:not open to inspection or subject to subpoena
DATE FILED (For Health Dept. Use Only)
OFFICE OF VITAL RECORDS DEPARTMENT OF HEALTH AND MENTAL HYGIENE THE CITY OF NEW YORKVR-18 (Inst. # X988)(REV. 11/04)
}
� M.D.
� D.O.
(Month/Day/Year–yyyy)
96

RICHMOND
FLUSHING
JAMAICA WEST
FLATBUSH
JAMAICAEAST
CORONA
PELHAM BAY
WESTCHESTER
GRAVESEND
ASTORIA LONG ISLAND CITY
BROWNSVILLE
BAY RIDGE
MASPETHFOREST HILLS
FORDHAMRIVERDALE
SUNSET PARK
BEDFORDBUSHWICK
LOWERWESTSIDE
MOTTHAVEN
TREMONT
FORTGREENE
RIVERSIDE
MORRISANIA
WILLIAMSBURGGREENPOINT
RED HOOKGOWANUS
WASHINGTONHEIGHTS
LOWEREASTSIDE
KIPS BAYYORKVILLE
EAST HARLEM
CENTRALHARLEM
Map 7. Health Center Districts and Boroughs, New York City
97

SI03
SI02
SI01
QN13
QN07
QN12
QN11
BK18
QN05
QN08
QN10
QN14
BK05
BX12
BX10
QN01
QN02
BK01
BK15
BX09
BK10
BK07
QN09
BK11
BX11
BK12BK17
BX08
BK13
BK06
QN03
QN06
BK14
BK02
MN12
BK03
QN04
BX01 BX02
BK04
BX04
BX07
MN07
BK16
MN04
MN08
MN03
BK08
BK09
BX03
MN05
MN11
BX06
MN09MN10
MN06
BX05
MN02
MN01
Map 8. Community Districts and Boroughs, New York City
98

DEPARTMENT OF HEALTH AND MENTAL HYGIENE Bureau of Vital Statistics Michael R. Bloomberg, Mayor Thomas A. Farley, M.D., M.P.H., Commissioner http://www.nyc.gov/health January 2010