summary of the medium term expenditure …
TRANSCRIPT
SUMMARY OF THE MEDIUM TERM EXPENDITURE
FRAMEWORK AND FISCAL TERM PAPER (MTEF)
2019-2021
1
The Federal Government recently released the draft of its multi-year plan from which the
2019- 2021 budget will be derived. In 2019, the government plans to spend N10.16tn - up from
the expansive 2018 budget of N9.12tn.

MACRO ECONOMIC INDICATORS
GDP
2.11% 1.50% 3.0% 3.60% 3.90%
2017 2018* 2019 2020 2021
Gross Domestic Product
Inflation
15.37% 11.23% 9.98% 9.43% 9.58%
2017 2018 2019 2020 2021
Inflation
2
N
*GDP as at Q2

MACRO ECONOMIC INDICATORS
N305 N305 N305 N305 N305
2017 2018 2019 2020 2021
Exchange Rate
1.86m 1.9m 2.3m 2.44m 2.62m
2017 2018 2019 2020 2021Oil Production (Benchmark)
3
N197
2016
2016
1.74mBarrels Barrels Barrels Barrels Barrels Barrels
N
Federal government’s assumptions for 2019 put a t 2 . 3 m b p d . T h e o i l production as at end of 2017 stood at 1.86mbpd a g a i n s t 2 . 2 m b p d projected for 2017.

MACRO ECONOMIC INDICATORS
$44.5Per Barrel
$71.9Per Barrel
$60Per Barrel
$56.5 Per Barrel
$56.5 Per Barrel
2017 2018 2019 2020 2021Oil Price (Benchmark)
4
$38Per Barrel
2016
The Federal government is projecting Oil price at $60 per barrel for 2019 on the assumed oil production of 2.3m barrel per day, with the exchange rate put at N305/$1.
$60

REVENUE
5
N1.13tn N2.99tn N3.6tn N3.33tn 3.88tn
2017 2018* 2019 2020 2021Oil Revenue
2016
N697.8bn
Federal Government’s actual oil-related revenue projection of N3.6tn for 2019. The FG share of oil revenue had improved to N1.125tr in 2017. When compared with the budget target of N2.2 trillion.
N3.6tn
*2018 Budget as Passed

NON OIL REVENUE
6
N543.3bn N794.7bn N799.5bn N1.14tn 1.29tn
2017 2018* 2019 2020 2021
FG’s Actual Share of Company Income Tax
2016
N457.9bn
Federal Government is expecting N799.5bn as its share of company income tax in 2019. FG’s Actual share of company income tax receipt for 2017 fiscal year was N543.34bn as against the budget target of N808.00bn.
N799.5bn
CIT
*2018 Budget as Passed
NON OIL REVENUE
7
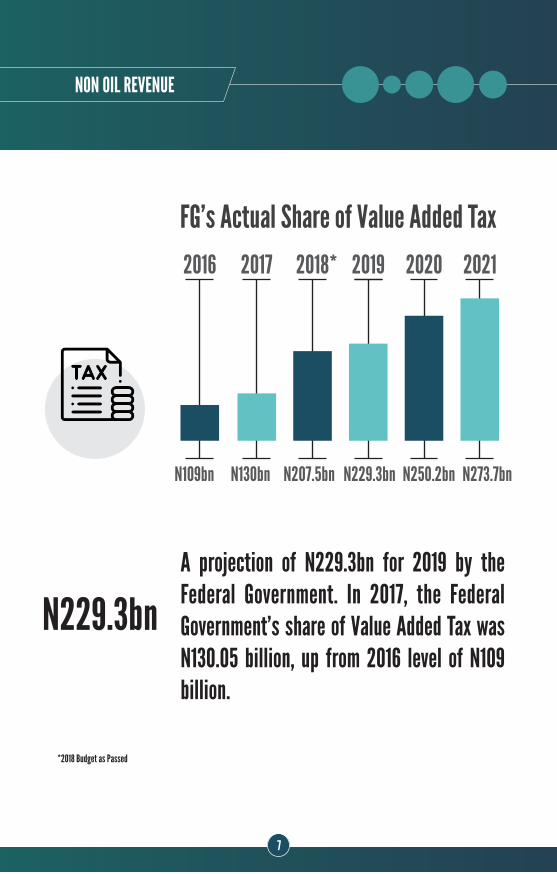
N130bn N207.5bn N229.3bn N250.2bn N273.7bn
2017 2018* 2019 2020 2021
FG’s Actual Share of Value Added Tax2016
N109bn
A projection of N229.3bn for 2019 by the Federal Government. In 2017, the Federal Government’s share of Value Added Tax was N130.05 billion, up from 2016 level of N109 billion.
*2018 Budget as Passed
N229.3bn

NON OIL REVENUE
8
FG’s Actual Share of Independent Revenue
The Federal Government Independent Revenue was N295.29 In 2017, despite the target of N808 billion for the fiscal year, the projection for the 2019 budget stood at N624.5bn.
N295.3bn N847.9bn N624.5bn N636.7bn N738.3bn
2017 2018* 2019 2020 20212016
N237.8bn
*2018 Budget as Passed
N624.5bn

NON OIL REVENUE
9
FG Actual Share of Customs’ and Excise Duties
Federal government’s projected share of revenue from Customs and Excise duties is in 2019 is approximately N302bn. Considering the actual revenue from Customs and Excise duties in 2017 which stood at N261.1bn.
N261.4bn N324.9bn N302.5bn N329.2bn N358.2bn
2017 2018* 2019 2020 20212016
N228.6bn
*2018 Budget as Passed
N302.5bn
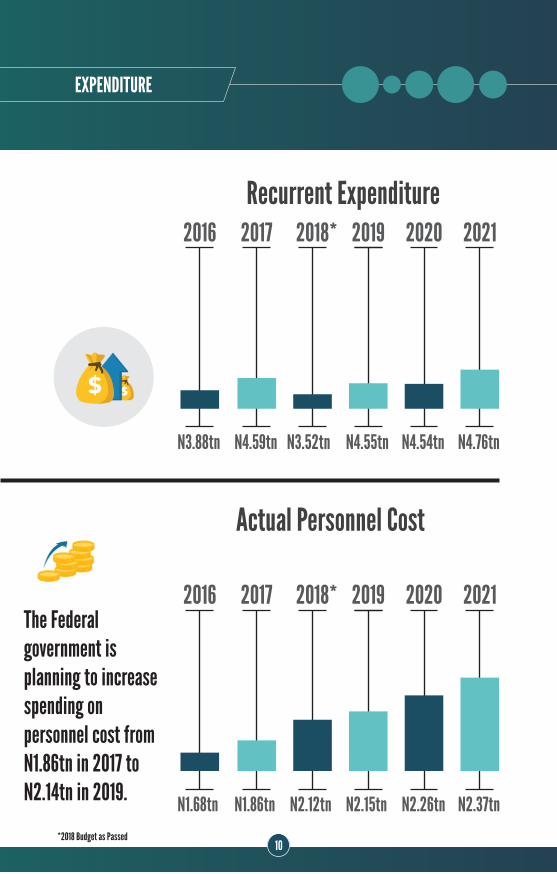
Recurrent Expenditure
10
N4.59tn N3.52tn N4.55tn N4.54tn N4.76tn
2017 2018* 2019 2020 20212016
N3.88tn
Actual Personnel Cost
N1.86tn N2.12tn N2.15tn N2.26tn N2.37tn
2017 2018* 2019 2020 20212016
N1.68tn
The Federal government is planning to increase spending on personnel cost from N1.86tn in 2017 to N2.14tn in 2019.
*2018 Budget as Passed
EXPENDITURE
11
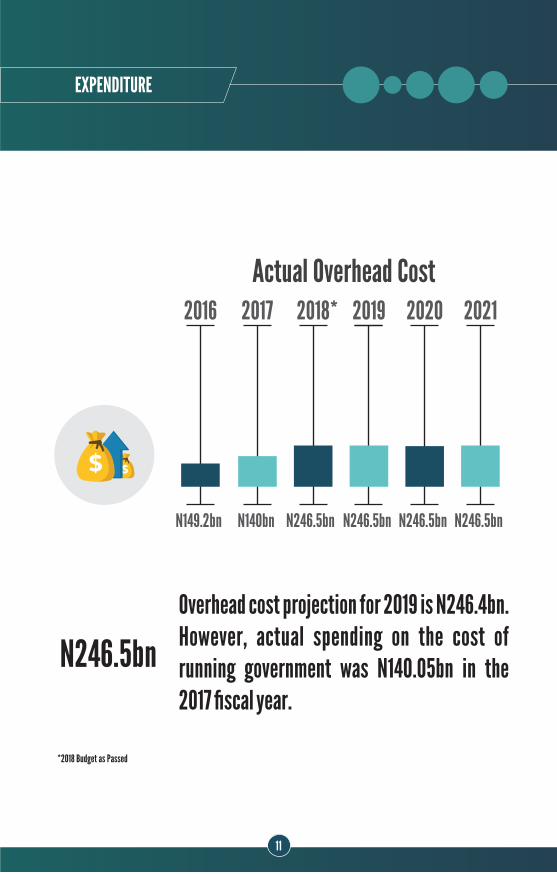
Actual Overhead Cost
N140bn N246.5bn N246.5bn N246.5bn N246.5bn
2017 2018* 2019 2020 20212016
N149.2bn
Overhead cost projection for 2019 is N246.4bn. However, actual spending on the cost of running government was N140.05bn in the 2017 fiscal year.
N246.5bn
*2018 Budget as Passed
EXPENDITURE

Capital Expenditure
12
N1.43tn N3.13tn N3.07tn N2.38tn N2.57tn
2017 2018* 2019 2020 20212016
N173.1bn
Total capital expenditure was significantly low in 2016. A total sum of N1.43trn was spent in 2017. The Federal government is projecting the total sum of N3.07tn of capital spendings in 2019.
N3.07tn
*2018 Budget as Passed
EXPENDITURE
Debt
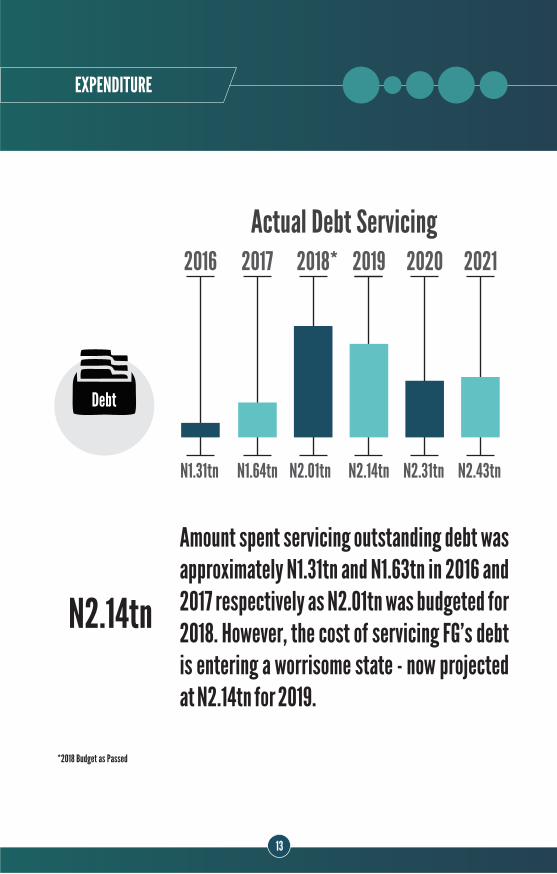
Actual Debt Servicing
N1.64tn N2.01tn N2.14tn N2.31tn N2.43tn
2017 2018* 2019 2020 20212016
N1.31tn
Amount spent servicing outstanding debt was approximately N1.31tn and N1.63tn in 2016 and 2017 respectively as N2.01tn was budgeted for 2018. However, the cost of servicing FG’s debt is entering a worrisome state - now projected at N2.14tn for 2019.
13
*2018 Budget as Passed
EXPENDITURE
N2.14tn

14
Statutory Transfers
N434.1bn N530.4bn N506.9bn N509.5bn N540.5bn
2017 2018* 2019 2020 20212016
N344bn
*2018 Budget as Passed
EXPENDITURE

www.yourbudgit.com
SIMPLIFYING THE NIGERIAN BUDGET At BudgIT, we believe it is the RIGHT of every citizen to have access to, and also understand public budgets. We also believe budgets must be efficiently implemented for the GOOD of the people.