summary of quantifiable benefits and costs related to ... · pdf filesummary of quantifiable...
TRANSCRIPT

Summary of Quantifiable Benefits and Costs Related to Select Targeted Infrastructure Replacement Programs
Craig Aubuchon and Paul Hibbard1 Analysis Group, Inc.
January, 2013
1. Introduction
In recent years and across a number of states, natural gas local distribution companies (LDC) have proposed and/or implemented programs for the accelerated replacement of aging natural gas distribution system infrastructure, and have sought recovery of associated capital costs between rate cases. These programs, often called Targeted Infrastructure Replacement Fund programs – or TIRF, are primarily driven by the interest of LDCs, residents, businesses, and state officials and policymakers to reduce the incidence of, and risks associated with, explosions due to natural gas leaks in or near houses and buildings. Public Utility Commissions (PUCs) are increasingly approving TIRF programs and allowing cost recovery to address such accident risks, but have also recognized certain quantifiable benefits that derive from accelerated replacement, tied to reduced natural gas supply costs (from reducing unaccounted-for gas), and reduced emissions of greenhouse gases (“GHG”).
In this Report, we review the additional impacts of TIRF programs (that is, those above and beyond the public safety benefits), and present a model to calculate and compare quantifiable TIRF program benefits and costs. The model we describe focuses on the LDC ratepayer benefits of lowered unaccounted-for gas, and the societal benefits of reduced emissions of methane – a potent greenhouse gas. We compare these to the costs incurred by LDCs – and transferred to ratepayers – to implement TIRF programs, and calculate benefit cost ratios based only on these non-public safety benefits. While we recognize that the most significant benefit of accelerated replacement (and justification for incurring the cost) is likely the reduced incidence and risk of explosions, we do not try to quantify those reduced risks as part of our analysis here.
Our analysis is based on a model we developed for calculating quantifiable benefits of TIRF programs under various assumptions, and comparing them to TIRF program costs, to determine benefit-cost ratios. Such analysis can supplement the review of public safety benefits in the consideration of appropriate TIRF program designs and levels based on all costs and benefits. Based on our analysis, we find that even ignoring the public safety rational for TIRF programs, the benefits associated with other quantifiable impacts is significant under a wide range of modeling assumptions.
Using the most widely accepted assumptions from the EPA for gas leak rates, global warming potential and the social cost of carbon, we find that:
• In the initial program year, 2010, TIRF programs for the five utilities described below led to total ratepayer benefits of $1.9 million.2
• Over the full program life, the TIRF programs of the three Massachusetts Utilities leads to total benefits of $156 million (Net Present Value, $2010).3
1 Craig Aubuchon is an Associate, and Paul Hibbard is a Vice President, with Analysis Group Inc., a Boston-based economic and strategy consulting firm. The authors would like to thank the Barr Foundation for funding this study, and Andrea Okie of Analysis Group for assistance with the analysis. 2 As explained throughout the body of this report, we assumed: O&M reductions for steel and cast iron mains, Leaked Gas from EPA Emissions Factor data, average NYMEX gas prices, global warming potential of 25x (IPCC, 4th Annual Report), and the EPA Interagency Working Group Social Cost of Carbon at a 3% discount rate.

TIRF Benefits and Costs Aubuchon and Hibbard
January, 2013
2
2. Overview
In this Report, we document the data sources, methodologies, and assumptions used to develop a benefit-cost analysis of select TIRF programs used by Natural Gas Utilities in Massachusetts, Rhode Island, and Ohio. As noted above, we take as a given the public safety rationale for such program, and focus on noted knowledge gaps in total resource accounting around such programs – reduced supply costs and lowered emissions of GHG. We carry out benefit-cost analysis both from two different perspectives: (1) a single TIRF program year (that is, the costs incurred in a single year, and the benefits that accrue over time due to leak reductions resulting from that single year’s repairs), and (2) a TIRF program projected lifetime (that is, the costs and benefits associated with the repairs across the full expected lifetime of accelerated replacement programs). From a modeling perspective, we review benefit-cost results under a wide range of assumptions regarding levels of Lost and Unaccounted for Gas (“LUAF”) and the societal value of avoided GHG emissions.
Specifically, this report considers the TIRF programs for:
• Bay State Gas d/b/a Columbia Gas (Operator ID 1209) • Boston Gas Company d/b/a National Grid MA (Operator ID 1640) • Colonial Gas Company d/b/a National Grid MA (Operator ID 11856) • New England Gas Company (Operator ID 31770) • Columbia Gas – OH (Operator ID 2596) • National Grid – RI (Operator ID 13480)
This report finds that for the year 2010, the carbon price where the quantifiable non-safety benefits of reducing natural gas leaks equal ratepayer costs range from approximately $1,000 per ton to $30 per ton, depending on assumptions. Likewise, over the life of the full project the net present value ($2010) of gross accumulated reductions in GHG emissions ranges from $40 to $1,603 million. 4
These results vary as a function of a number of key assumptions related to the calculation of LUAF, the Natural Gas price, the Global Warming Potential of methane (expressed in terms of carbon equivalence), the social cost of carbon price, and various discount rates for multi-year calculations. By altering these inputs, one may evaluate the sensitivity of calculations to various model parameters in an intuitive and transparent fashion.
We do not purport to calculate the ‘correct’ value of these benefits, but rather, our goal is to illustrate uncertainties with each data parameter and allow interested parties to make more reasoned and transparent judgments for themselves. To this end, we have included a wide range of assumptions. It should be noted that in many cases, upper bound assumptions may not have consensus among policy makers as to their efficacy. These values do however, come from peer reviewed and publicly available sources and warrant reasoned consideration.
3 Assuming global warming potential of 25x (IPCC, 4th Annual Report), EPA Interagency Working Group Social Cost of Carbon at a 3% discount rate, Leaked Gas from EPA Emissions Factor data, average NYMEX gas prices, and a 3% discount rate. 4 Full program-life calculations were only carried out for the three Massachusetts utilities studied. As described below, we assume that project benefits from reductions in leaked gas accrue for 20 years. This implicitly assumes that the minimum life of the new infrastructure is 20 years long.

TIRF Benefits and Costs Aubuchon and Hibbard
January, 2013
3
Key assumptions in the analysis include the following:
• We do not calculate any associated safety benefits, which are likely significant. Benefit Cost Ratios should not be viewed as definitive statements of a programs value.
• LUAF is calculated two ways: (1) using EPA Emission Factors (“EF”) by pipe type, and (2) using reported LUAF.
o When using EPA EF data, it is assumed that all pipes are replaced with protected steel services, and the net EF is used as the difference between unprotected and protected mains and services.
• Program benefits accrue over a 20 year period, from 2010 to 2030. It is assumed that reductions in leaked gas are permanent and therefore accumulate over the program life. A pipe replaced in 2010 maintains a constant (and lower) leak rate through 2030. This implicitly assumes that a pipe replaced in 2010 has a 20 year life, which is likely a conservative assumption. Values for reductions in leaked gas for years 2021 through 2030 are equal to the 2020 values (at the end of companies’ infrastructure replacement programs).
• Over the program life (2010 to 2020), the relevant PUC orders only identify schedules for miles of main replacements. In order to estimate the number of services replaced in each year, we assume that services are replaced at rate proportional to the 2009 services/main replacement rate.
• We do not calculate benefits as a change from the current or baseline pre-TIRF replacement schedules.
The rest of this Report proceeds as follows: Section 3 presents relevant context for the analysis. For this purpose, we provide as an example the rationale used by the Massachusetts Department of Public Utilities (DPU) on TIRF program value and on the price to place on avoided greenhouse gases in the context of utility energy efficiency programs. In addition, we summarize the relevant background information and data on TIRF programs in all three states (Massachusetts, Rhode Island and Ohio). Section 4 provides a summary of the analytic framework used; and Sections 5 and 6 present the relevant data sources, assumptions, and results.

4
3. State Proceedings a. Massachusetts DPU establishes Targeted Infrastructure Replacement (TIRF)
Programs
Prior to the creation of a dedicated TIRF program, capital expenses related to the replacement of unprotected steel and cast iron pipes were recovered through general rate cases. Unprotected steel and cast iron pipes are more susceptible to corrosion and other material failures that can lead to gas leaks. Local Distribution Companies are required to replace known and hazardous leaks, but companies have argued that it would be more cost-effective and appropriate to replace all suspect infrastructure in a more timely and organized manner., However, to do so would require a dedicated capital tracker to recover the associated capital costs from ratepayers between rate cases.
The first TIRF was established in Massachusetts for Bay State Gas d/b/a Columbia Gas in DPU Order 09-30 on October 30, 2009. The DPU had previously denied two other requests by BSG for a TIRF in 2005 and 2008. In its analysis and findings, the commission stated that:
“The Department recognizes the public safety, service reliability, and environmental issues… all else being equal, approval of the TIRF is likely to provide an incentive for more aggressive replacement of such aging infrastructure. Further, we conclude that more aggressive replacement of bare steel is appropriate and desirable from a public policy perspective given the potential benefits to public safety, service reliability, and the environment.”i
In general, the established TIRF programs allow utilities to recover, on an annual basis, capital expenses related to infrastructure spending for steel and cast iron mains and services. Utilities file a reconciliation with the DPU by May 1 for the spending of the previous year, net of taxes, depreciation, and allowed O&M offsets. The reconciliation includes the amount that they seek to include in the rate base and a proposed dollar per therm ($/therm) adjustment charge that, if approved, goes into effect on November 1 of the same year. Table 1 presents a timeline of the adoption and filing of select TIRF programs in MA, RI, and OH, while Table 2 presents actual and forecasted replacement schedules and expenditures by company.
b. Massachusetts Department of Public Utilities (DPU) opens an investigation into Updating its Energy Efficiency Guidelines in Order 11-120.
In order to translate leaked methane into GHG reduction benefits, we need to place a value on the avoided methane in terms of CO2 equivalence and find the dollar value of avoided CO2. In DPU 11-120, the Massachusetts Commission set out to consider how energy efficiency benefits are included in a cost-effectiveness determination, and in this context has reviewed the value of avoided CO2. The Commission recognizes the ‘Total Resource Cost’ methodology and considers the net costs and benefits to the energy system and to all program participants. The commission also considers the costs and benefits to these stakeholders separately, as specified in the guidelines established in DPU 98-100, §§3.2, 3.3, 3.4.3.ii In particular, the commission guidelines recognize resource and non-resource benefits to program participants, including avoided costs due to lower demand, reduced costs for operations and maintenance (O&M), reduced environmental and safety costs, and benefits to low-income customers.
Of note, the commission explicitly set out to examine:
“the method used to calculate reasonably anticipated environmental compliance costs, in particular those associated with the emission of carbon dioxide (“CO2”). In identifying these issues, it is not our objective to signal that a change to our long-standing treatment of these benefits is either necessary or appropriate at this time. Instead, it is our objective to solicit comment from interested

5
persons on these topics in order to determine whether such changes are necessary and, if so, when and how such changes should be incorporated into the measure of cost-effectiveness.”iii
At present, the benefits of reduced CO2 emissions are calculated based on the costs associated with purchasing CO2 allowances through the Regional Greenhouse Gas Initiative (RGGI). The Commission suggested that this may ‘understate the actual benefits and, therefore, understate the cost-effectiveness of energy efficiency programs’ because of the recent implementation of the Global Warming Solutions Act (GWSA) and the MA Clean Energy and Climate Plan for 2020.iv
c. Regulatory History and Program Details
Tables 1 and 2 below summarize TIRF programs details across the three states.

6
Table 1: Timeline of Select Target Infrastructure Replacement Programs
Company 2009 2010 2011 2012
Bay State Gas TIRF Filed on April 16; TIRF Established (DPU 09-30) on October 30
Reconciliation Filed (DPU 10-52) on April 30 [Pending Approval]; LDAC Adjustment in Effect November 1 (Proposed)
Rates 11-37 Filed on April 29 seeking 2010 TIRF reconciliation [Pending Approval] - includes 2009 additions filed in DPU 10-52; LDAC Adjustment in effect [proposed] November 1
Rates 12-25 Filed on April 12 seeking Increase to General Rate Base [Pending Approval]
New England Gas Company
TIRF Established (DPU 10-114) on March 31; Rates 11-42 Filed on May 9 seeking 2010 TIRF reconciliation [Pending Approval]; LDAC Adjustment in effect [proposed] November 1
Rates 12-37 Filed on May 1 seeking 2011 TIRF Reconciliation [Pending Approval]; DPU 10-114B filed September 7 extends TIRF to all replacements, independent of leak-prone main replacement projects
National Grid - MA
TIRF Established (DPU 10-55) on Nov 2
Rates 11-36 Filed on May 2 seeking 2010 TIRF reconciliation [Pending Approval]; LDAC Adjustment in effect [proposed] November 1
Rates 12-38 Filed on May 1 seeking 2011 TIRF reconciliation [Pending Approval]
National Grid - RI
Jan29 - Docket 3943 Order 19563 approves Capital Tracker and Accelerated Replacement Program; April 1 - Docket 4034 Order 19611 Approves FY2010 ARP spending; July 16 - Docket 3943 Order 19710 Adjusts approved Rate Base for Capital Tracker; Nov 20 - Docket 4077 Order 19833 Approves DAC credit effective Nov 1, 2009
April 30 - Docket 4034 Order 19991 Approves FY2011 ARP spending; December 21 - Docket 4196 Order 20231 Approves 2010 DAC for FY10 ending March 31 2010 effective November 1
November 1 - Docket 4269 Order 20581 Approves 2011 DAC for FY11
Columbia Gas - OH*
February 27 - First IRP Rider reconciliation filed (based on CY 2008 investments); June 24 - PUC Order approving and implementing rider for 2008 expenses issued, effective July 2009
Feb 26 - 2nd IRP Rider reconciliation filed (based on CY 2009 investments); April 28 - PUC Order approving and implementing rider for 2009 expenses issued, effective May 2010
February 29 - Third IRP Rider reconciliation filed (based on CY 2010 investments); April 27 - PUC Order approving and implementing rider for 2010 expenses issued, effective May 2011
February 28 - Fourth IRP Rider reconciliation filed (based on CY 2011 investments); April 25 - PUC Order approving and implementing rider for 2011 expenses issued, effective May 2012
*The Ohio PUC approved the Infrastructure Replacement Program Rider as part of a General Rate Case in Docket 08-72-GA-AIR.

7
Table 2: Proposed Replacement Schedule by Company* Company
2008 2009 2010 2011 2012 2013 2014 2015 2016 2017 2018 2019 2020
Bay State Gas
BS Mains [1]
16 [2] 12 [9] 40 40 40 40 40 40 40 40 40 Expenditures
($mil) [1]
$14.2 [2] $10.3 [9] $34.7 $34.7 $34.7 $34.7 $34.7 $34.7 $34.7 $34.7 $34.7
New England
Gas Company
BS and CI Mains (miles) [5]
7 3.97 [10] 7.71 [11] 7 7 7 7 7 7 7 7 7
Expenditures ($mil) [5]
$3.8 $3.6 [10] $4.4 [11] $3.0 $3.0 $3.0 $3.0 $3.0 $3.0 $3.0 $3.0 $3.0
National Grid (MA)
BS Mains (miles) [6]
50 50 50 50 50 50 50 50 50 50
CI Mains (miles) [6]
77.8 + 12.5 [12]
77.7 + 46.4 [13] 125 150 170 190 190 190 190 190 190
Expenditures ($mil) [6]
$80 + $3.6 [12]
$87.5+ $16.4 [13] $193.9 $219.8 $240.5 $261.2 $261.6 $261.7 $261.7 $261.7 $261.7
Columbia Gas of Ohio
BS Mains (miles)
81.07
[17] 97.78
[18] 60.10 [19] 204.58
[20] CI Mains
(miles) 10.37
[17] 2.33 [18] 3.04 [19] 11.87 [20] Plastic Mains 7.14 [17] 10.17 [18] 7.46 [19]
39.01 [20]
Expenditures ($mil)
$39.3
[17] $34 [18] $31.4 [19] $107.5
[20]
National Grid (RI)
BS Mains (miles)
18 18 18 18 18
CI Mains (miles)
5 5 5 5 5
Expenditures ($mil) [7] $21.5 $25.1 $25.1 $26.7 $26.7
*Notes:

8
[1] Assume linear replacement schedule 2010-2019, see DPU 09-30, at 118-19 specifies program totals [2] Actual replacement, see Schedule BSG-1, filed under DPU 10-52 [3] See 2010 Annual Report, page 43 [4] See Department of Transportation, Pipeline and Hazardous Materials Safety Administration, Form F7100-1-1 [5] See DPU 10-114, at 34 n.25 and 26; NEGC forecast expenditures to 2014; 2015 to 2023 are a linear extrapolation. [6] See DPU 10-55, at 68 [7] See the testimony of Susan Fleck, NG-SLF-1, at 25, in RIPUC Docket 3943 [8] See the testimony of Richer, page 520, in RIPUC Docket 4077; Total Sales originally reported as 34,535,470 mcf. [9] See Rates 11-37 BSG, Exh CMA/JTG-1 at 1 and 7. Note that the totals reported in 11-37 include 2009 additions. [10] See NEGC CY2010 TIRF Filing, DPU 11-42 Exh NEGC-JMS-2, at 1 and 7 [11] See DPU 112-37 Exh NEGC-JMS-2, at 1 and 7 [12] For Boston Gas and Colonial Gas, respectively; See DPU 11-36, NG-MR-2, at 2 and NG-MR-3, at 2. [13] For Boston Gas and Colonial Gas, respectively; See DPU 11-37, NG-MR-2, at 2 and NG-MR-3 at 2. [14] See NG-JFN-6 at 4, in 4269-Ngrid-DACFiling(8-1-11) [15] See DPU NG 10-GAF-P5, National Grid Peak Adjustment Factor, at Att. B page 9. [16] See DPU BSG 10-GAF-P1, at Section 3, page 3 of 7 [17] Prepared Direct Testimony of David A. Roy on Behalf of Columbia Gas of Ohio, Case No. 09-0006-GA-UNC, February 27, 2009. [18] Prepared Direct Testimony of David A. Roy on Behalf of Columbia Gas of Ohio, Case No. 09-1036-GA-RDR, February 26, 2010. [19]Prepared Direct Testimony of Eric T. Belle on Behalf of Columbia Gas of Ohio, Case No.10-2353-GA-RDR, February 28, 2011. [20]Prepared Direct Testimony of Eric T. Belle on Behalf of Columbia Gas of Ohio, Case No.11-5803-GA-RDR, February 28, 2012.

9
4. Analytic Framework
To accurately consider benefits and costs to the energy system and the program participants, our analysis begins with a distributional accounting framework.v Within a distributional accounting framework, benefits and costs are recognized as program inputs and outputs to the relevant stakeholders. Inputs and outputs are defined as the actual physical entities or behavioral changes that result from a program. To compare different program inputs and outputs, these outcomes are expressed in dollars.
In contrast, actual exchanges of money are considered transfers between stakeholders because they net to zero across all stakeholders. Rate payments are an excellent example of a transfer payment from a program participant (customer) to an energy system (utility). It is important to note that transfers do not net to zero within each stakeholder’s column and are included in the calculation of net benefits to each stakeholder. Table 3 presents the structure of a distributional accounting framework. The final column illustrates that transfers net to zero from the perspective of the ratemaking agency (the joint benefits of program participants and energy systems), and the final row illustrates that transfers are included in the net calculation for each stakeholder individually.
Table 3: Distributional Accounting Framework, where Transfer is a payment for services from the Customer to the Utility Customers Utility Net
Benefits B B
Transfers* -T + T 0
Costs -C -C
Net B-T T-C B-C
*Here, Transfer is a payment for services from the Customer to the Utility.
Thus, for a TIRF:
• Program Inputs are the actual mains and services that are installed. These program inputs are expressed as the total capital cost in dollars. This cost is borne by the utility-energy system.
• Program Outputs are ‘public safety, service reliability, and the environment’ as expressed in DPU 09-30. The current report illustrates one method for expressing this environmental benefit in terms of dollars.
• Reconciliation Filings that seek rate adjustments are a transfer between rate payers and the utility. Specifically, this includes a reduction in expected O&M costs, a reduction in gas pass through costs, and an increase in rates for approved infrastructure spending.
Tables 4a and 4b summarize the relevant TIRF program inputs, outputs and transfers. This report assumes that the net benefits of the TIRF program are positive from the Utility perspective, since they have initiated the programs. Instead, at issue are the net benefits to consumers and to society. This report calculates net benefits to rate payers for TIRF programs in the year 2010, and calculates the net present value of total net benefits to society for the proposed duration (2010-2020) of TIRF programs related to reduced emissions of greenhouse gases.

10
Table 4A. Short Term Benefit - Cost Framework for Changes implemented during the 2010 Fiscal Year, Net Impacts by Stakeholder and to Society
Stakeholder Rate Payers Utility Net
Benefit Reduction in GHG (+ $) Positive
Reduction in Accidents (+$)
Transfer
Rate Increase for Approved TIRF Spending (-$) Rate Increase for Approved TIRF Spending (+$)
Positive Reduction in TIRF Increase for O&M Offset (+$) Reduction in TIRF Increase for O&M Offset (-$)
Rate Decrease for Gas Pass Through (+$)
Cost Infrastructure Spending (-$) Negative
Net to Stakeholder Varies (See Table 12-14) Positive (?)

11
Table 4B. Long Term Benefit - Cost Framework of Accelerated Infrastructure Replacements, Net Present Value Stakeholder Rate Payers / Society Utility Net
Benefit Reduction in GHG (+ $) Positive Reduction in Accidents (+$)
Transfer
Rate Increase for Approved TIRF Spending (-$) Rate Increase for Approved TIRF Spending (+$)
Positive Reduction in TIRF Increase for O&M Offset (+$) Reduction in TIRF Increase for O&M Offset (-$)
Rate Decrease for Gas Pass Through (+$)
Cost Infrastructure Spending (-$) Negative
Net Present Value (?) Positive Varies (See Tables 16-18)

12
5. Data Sources and Model Assumptions a. Net Benefits to Rate Payers, 2010 Calendar Year
Lost and Unaccounted for Gas: Department of Transportation Pipeline and Hazardous Materials Safety Administration
LDCs report the miles of main by type, the number of services by type, and the total amount of unaccounted for gas (UAF) on Form F7100 1-1vi.
To maintain consistency in reporting between utilities, this report used the DOT PHMSA data whenever possible for the relevant operator codes for each utility (see Overview). The total miles of unprotected steel mains (bare and coated) and cast/wrought iron mains and the total number of services for the same categories were obtained for 2009 and 2010. The amount of replaced infrastructure was calculated as the difference between 2010 and 2009.
UAF is reported as a percent, calculated as [(Total Gas Purchases – Total Gas Sales) / Total Gas Purchases] for June of the report year.
Table 5: 2009 UAF (%), total Infrastructure, and Infrastructure Replacement 2009 -2010 UAF 2009 (%) Total Steel
and Cast Iron Mains (miles)
Total Replaced Mains (miles)
Total Steel Services (number)
Total Replaced Services (number)
Bay State Gas d/b/a Columbia 1.47 1166 20 56,599 1,831
National Grid MA – Boston Gas Co.
1.6 3637 109.6 126,422 6,118
National Grid MA – Colonial Gas Co.
0.71 205 9.4 6,956 280
Columbia Gas - OH 0.50 3722 53 158,084 3,458
National Grid RI 5.72 1559 89.1 62,462 2,662 New England Gas Company 3.16 278 6.7 9,905 474

13
Lost and Unaccounted For Gas (LUAF) This report only considered the benefit from avoided GHG emissions due to infrastructure replacement. Specifically, we focused on the replacement of unprotected (bare and coated) steel mains and services and cast iron mains. Note that each TIRF contains slightly different language regarding covered infrastructure; for the purposes of our analysis, we calculate LUAF relative to replacement of unprotected (bare and coated) steel mains and services and cast iron mains because they represent the greatest potential losses of GHG. A key uncertainty underlying the avoided GHG benefit is the amount of LUAF that leaks into the atmosphere per mile of pipe.
We calculated avoided emissions from LUAF two ways.
• First, LUAF was calculated by multiplying the amount of replaced infrastructure (see Table 5) by the relevant net emission factors provided by the EPA in Table W-7 of Subpart W – Default Methane Emission Factors for Natural Gas Distribution.vii All values were converted into MCF per year. We assume that all unprotected (steel and cast iron) mains and services were replaced with protected steel mains and services. The net EF is used to calculate LUAF, since new pipe also leaks, albeit at a lower rate.
Table 6: EPA Methane Emission Factors Unprotected Steel Mains
12.58 Scf CH4 / hr-mile EPA, Table 7
Cast Iron Mains 27.25 Scf CH4 /hr-mile EPA, Table 8 Unprotected Steel Services
0.19 Scf CH4 /hr-component
EPA, Table 10
Protected Steel Mains
0.35 Scf CH4 / hr-mile EPA, Table 7
Protected Steel Services
0.02 Scf CH4 /hr-component
EPA, Table 10
• Second,LUAF was calculated as the assumed amount of total UAF that is attributable to unprotected steel and cast iron mains and services. First, the total UAF in MCF was derived for the year 2009 from the percent UAF and reported sales. Reported Sales were obtained from SNL Financial and the DOT PHMSA data. UAF (%) and Miles of Mains are from DOT PHMSA. Avoided UAF was then calculated as: UAF in 2009 (mcf) * [ (Replaced Steel and CI Mains / Total Steel and CI Mains) + (Replaced Steel Services / Total Steel Services)]. We then apply an assumption of what proportion of UAF is due to leaks from Steel and Cast Iron, and vary that assumption between 25%, 50%, 75%, and 100%. Thus, the report considers avoided UAF from infrastructure replacement to be: Total UAF in 2009 * UAF due to leaks * Proportion of TIRF Eligible Infrastructure Replacement to Total TIRF Eligible Infrastructure.
Using these methods, we find that the LUAF calculated from EPA EF is roughly equivalent to assuming 25% of LUAF is due to leaks. This suggests that the EPA EF may be a conservative estimate with respect to LUAF.

14
Table 7: 2009 Reported Sales (MCF), UAF (%), and Calculated UAF (MCF) UAF 2009
(%) Total Sales 2009
Total UAF (MCF)
Total Steel and Cast Iron Mains (miles)
Total Replaced Mains (miles)
Avoided UAF – 100% due to leaks (mcf)
Bay State Gas d/b/a Columbia
1.47 33,025,647 492,720 1166 20 24,391
National Grid MA – Boston Gas Co.
1.6 85,983,097 1,398,099 3637 109.6 109,776
National Grid MA – Colonial Gas Co.
0.71 27,907,301 199,558 205 9.4 17,231
Columbia Gas - OH
0.50 80,779,079 405,925 3722 53 14,660
National Grid RI
5.72 35,467,928viii 2,151,851 1559 89.1 214,728
New England Gas Company
3.16 5,088,044 166,027 278 6.7 11,946

15
Transfers • Rate Increase for TIRF Spending is the amount that each company included in its 2010
reconciliation filing to add to the rate base excluding adjustments for O&M. This is typically the total infrastructure spending (cost to the utility) minus depreciation and taxes.ix
Table 8: TIRF Reconciliation Filings Revenue Requirement Utility Value Source Bay State Gas d/b/a Columbia $ 2,172,698 BSG 10-52, Schedule BSG-1 National Grid MA – Boston Gas Co. $ 6,140,599 DPU 11-36 Exh NG-MR-2, at 2
of 5, line 53 National Grid MA – Colonial Gas Co.
$ 251,679 DPU 11-36 Exh NG-MR-3, at 2 of 5, line 53
Columbia Gas - OH $14,655,413 OH PUC Case No. 10-2353-GA-RDR
National Grid RI $ 2,214,734 3943-NGrid-LaFlamme(4-1-08), Att. NG-MDL-5, at 1of 2, line 37
New England Gas Company $ 528,729 NEGC 11-42, Initial Filing, Exh NEGC-JMS-2 at 1 of 8, line 20
• Rate Decrease for Gas Pass Through was calculated as the amount of leaked gas (calculated at either the EPA emission factors or the proportion of LUAF) multiplied by the New York Mercantile Exchange (NYMEX) Natural Gas Futures Contracts ($/MMBTU). Gas pass through is a transfer that only accrues to consumers. While the Utility receives the gas pass through cost from the Consumer, it also passes (transfers) this payment back to the wholesale natural gas distributor. From the utility perspective, and within the framework of Table 4a and 4b, the gas pass through nets to zero. As a sensitivity analysis, we carried out estimates assuming the minimum ($3.60 per MMBTU), maximum ($5.60 per MMBTU), and mean ($4.53 per MMBTU) price of all four reported futures contracts between January and December 2010.x This report assumed that 1 MCF = 1 MMBTU. Most utilities recover the cost of UAF through the Peak and Off-Peak Gas Adjustment Factor (GAF). The GAF typically reflects the gas futures price listed on the NYMEX. For example, see DPU NG 10-GAF-P5, National Grid Peak Adjustment Factor, at Att. B page 9 or DPU BSG 10-GAF-P1, at Section 3, page 3 of 7. Finally, we also estimated results using variations on assumed futures value of Natural Gas prices, at $6, $8, $10 and $12 per MMBTU. This allows for a consideration of the impact on results of potential gas price variability over the program life.
• Rate Decrease for Reduced Operations and Maintenance expenses. This is typically a separate line item in utility reconciliation filings, and this ‘rate decrease’ is subtracted from recoverable TIRF expenses before being added into the rate base and the distribution adjustment clause. The O&M offset is often a source of contention during TIRF rate applications (for example, within DPU 09-30, see RR AG-6-21, RR AG-6-22, RR AG-6-25, and RR AG-6-28). The O&M offset included in the applicable TIRF is calculated as some average leak repair cost per mile over a test year or test years. Note that only the MA programs include a defined O&M offset to be applied ex post of infrastructure replacements.

16
To maintain consistency across all utilities, we separated out the avoided O&M benefit to ratepayers. The total benefit is calculated as the O&M offset per mile (see table 9) by the miles of replaced steel or miles of replaced steel and cast iron mains, as calculated from PHSMA data for 2009 and 2010.
Table 9: O&M Offset by Utility Utility O&M Offset per mile Description Source Bay State Gas d/b/a Columbia $2,077
Average Leak repair cost per mile for unprotected steel mains, 2005-2008
DPU 09-30
National Grid MA – Boston Gas Co. $4,557 Weighted Average of
main leak repairs by region, 2009 test year
data
DPU 10-55 National Grid MA – Colonial Gas Co. $2,518
Columbia Gas - OH $1,645
Weighted Average, Total O&M Savings
relative to 2008 baseline divided by
Total miles of completed projects in
2010 and 2011
Case No.10-2353-GA-RDR
National Grid RI $3,537 Average of NG-MA New England Gas Company $3,959
Weighted average of main replacement costs, 2007-2009
DPU 10-114
Benefits The economic value of avoided GHG from TIRF replacements depends on two key assumptions:
• The Global Warming Potential (“GWP”) of Methane (CH4) on a CO2 equivalent basis. Leaked Methane (in MCF) was converted to Tonnes of CO2 by multiplying by the density of Methane (44.8 lbs/mcf), tonnes/lb, and the GWP factor from table 10.
• The value of avoided CO2 emissions on a $/ton basis. See table 11 and associated discussion regarding the Social Cost of Carbon.

17
Table 10: Global Warming Potential of CH4 on a CO2-eq basis Global Warming Potential of CH4: Time frame Source
21x 100 year IPCC (1995), Second Annual Report
25x 100 year IPCC (2007), Fourth Annual Reportxi
33x 100 year Shindel et al. (2009)xii 72x 20 year IPCC (2007) 105x 20 year Shindell et al. (2009)
Social Cost of Carbon
A key consideration in applying a dollar per ton estimate of the avoided GHG emissions on a CO2-equivalent basis is the time horizon of those benefits. A permanent reduction in emissions today provides benefits associated with a lower probability of climate induced damages both today and into the future. While the benefits accrue over a period of years (a decade or century or more), the costs associated with these GHG reductions are often paid for in a single year or a few years. To accurately compare costs and benefits, the net present value of the future benefit stream is considered at the same point in time as its associated costs.
With respect to carbon, the range of potential benefits is diverse, and can include impacts to agriculture, coastal areas, human health, changes in energy use by industrial sectors, outdoor recreation, and ecosystems.xiii A common method to express these benefits in present value terms is to use the Social Cost of Carbon (“SCC”). The SCC is defined as:
“The net present value of global climate-related damages over one or two centuries of one additional ton of greenhouse gases emitted to the atmosphere at a particular point in time. .. it increases as the concentration of atmospheric CO2 rises. SCC estimates can be used to represent the benefits of avoided CO2 emissions in CBA of mitigation policies.”xiv
The key distinction is that the SCC includes, for a given year, the net present value of benefits accruing from a reduction in GHG in that same year. Carbon prices rise in the future because the marginal value of carbon increases as current levels approach ‘damage thresholds’ and because a reduction in the future is discounted over a shorter future time window.
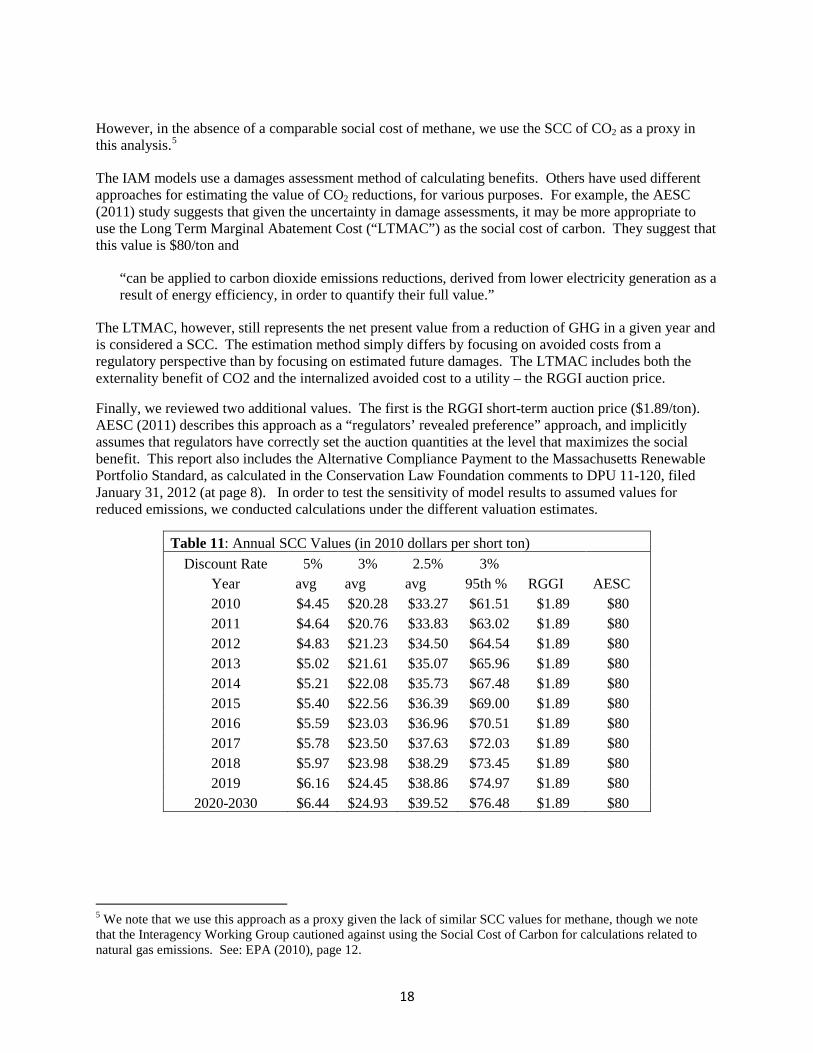
In 2010, an interagency Working Groupxv estimated the SCC from three different Integrated Assessment Models (“IAM”).xvi Results, in $2010 per short ton, are presented in the table below. These models require, among other parameters, assumptions for the appropriate discount rate and the distribution of climate effects. It should be noted that the Interagency Working Group cautioned against using the SCC for calculations related to natural gas:
”Transforming gases into CO2-equivalents using GWP, and then multiplying the carbon-equivalents by the SCC, would not result in accurate estimates of the social costs of non-CO2 gases.”xvii
18
However, in the absence of a comparable social cost of methane, we use the SCC of CO2 as a proxy in this analysis.5
The IAM models use a damages assessment method of calculating benefits. Others have used different approaches for estimating the value of CO2 reductions, for various purposes. For example, the AESC (2011) study suggests that given the uncertainty in damage assessments, it may be more appropriate to use the Long Term Marginal Abatement Cost (“LTMAC”) as the social cost of carbon. They suggest that this value is $80/ton and
“can be applied to carbon dioxide emissions reductions, derived from lower electricity generation as a result of energy efficiency, in order to quantify their full value.”
The LTMAC, however, still represents the net present value from a reduction of GHG in a given year and is considered a SCC. The estimation method simply differs by focusing on avoided costs from a regulatory perspective than by focusing on estimated future damages. The LTMAC includes both the externality benefit of CO2 and the internalized avoided cost to a utility – the RGGI auction price.
Finally, we reviewed two additional values. The first is the RGGI short-term auction price ($1.89/ton). AESC (2011) describes this approach as a “regulators’ revealed preference” approach, and implicitly assumes that regulators have correctly set the auction quantities at the level that maximizes the social benefit. This report also includes the Alternative Compliance Payment to the Massachusetts Renewable Portfolio Standard, as calculated in the Conservation Law Foundation comments to DPU 11-120, filed January 31, 2012 (at page 8). In order to test the sensitivity of model results to assumed values for reduced emissions, we conducted calculations under the different valuation estimates.
Table 11: Annual SCC Values (in 2010 dollars per short ton) Discount Rate 5% 3% 2.5% 3%
Year avg avg avg 95th % RGGI AESC 2010 $4.45 $20.28 $33.27 $61.51 $1.89 $80 2011 $4.64 $20.76 $33.83 $63.02 $1.89 $80 2012 $4.83 $21.23 $34.50 $64.54 $1.89 $80 2013 $5.02 $21.61 $35.07 $65.96 $1.89 $80 2014 $5.21 $22.08 $35.73 $67.48 $1.89 $80 2015 $5.40 $22.56 $36.39 $69.00 $1.89 $80 2016 $5.59 $23.03 $36.96 $70.51 $1.89 $80 2017 $5.78 $23.50 $37.63 $72.03 $1.89 $80 2018 $5.97 $23.98 $38.29 $73.45 $1.89 $80 2019 $6.16 $24.45 $38.86 $74.97 $1.89 $80
2020-2030 $6.44 $24.93 $39.52 $76.48 $1.89 $80
5 We note that we use this approach as a proxy given the lack of similar SCC values for methane, though we note that the Interagency Working Group cautioned against using the Social Cost of Carbon for calculations related to natural gas emissions. See: EPA (2010), page 12.

19
b. Data Sources and Model Assumptions – Net Benefits to Society, Program Duration 2010-2020
In order to explore results over full TIRF program timeframes, we estimate the net benefits to society over the 2010-2030 timeframe, using the three Massachusetts Distribution Companies, given their term of program duration.xviii. To calculate the total net benefits to society over the 2010-2030 timeframe, we made the following assumptions:
• Each company meets its forecasted replacement schedule and total expenditures as outlined in its
respective initial TIRF Filing. These schedules are outlined in table 2. This includes unprotected steel mains and services for Bay State Gas, and unprotected steel and cast iron mains and services for National Grid – MA and New England Gas Company.
• The avoided GHG emissions are solely based on the EPA emissions factor criteria.
• It is assumed that reductions in leaked gas are permanent and therefore accumulate over the program life through the year 2030. A pipe replaced in 2010 maintains a constant (and lower) leak rate through 2030. This implicitly assumes that a pipe replaced in 2010 has only a 20 year life. Values for reductions in leaked gas for years 2021 through 2030 are equal to the 2020 values, equal to accumulated reductions at the end of the infrastructure replacement program period.
• Over the program life (2010 to 2020), the relevant DPU orders only identify schedules for the miles of main replacement; service replacements are not identified. We assume that services are replaced at a rate proportional to the ratio of services to mains in service during 2009. .
• Future values were discounted to the present. Several discount rates were used as a sensitivity analysis, respectively, for GHG emissions and TIRF expenditures.
o GHG Emissions were discounted by 1, 2, 2.5, 3, 4, or 5%. These values are consistent with the Interagency Commission discount rates for the SCC, and these values were assumed to be consistent with the Commission’s belief that environmental benefits are valuable to future society and support the 2020 GWSA.
o TIRF Expenditures were discounted by 7, 8, or 9%. These rates were assumed to be consistent with the Weighted-Cost of Capital for a public utility as identified in the 2010 Ibbotson’s cost of capital.
• As illustrated in table 4b and explained in the 2010 methodology, transfers for the gas pass
through were calculated as a net benefit within the current framework..
• GWP and Carbon prices were modeled as presented in Section 5.

20
6. Results
The following tables present the range of results of our analysis under “Lower Bound” assumptions (that is, assumptions that are most likely to undervalue TIRF program benefits) and “Upper Bound” assumptions (that is, assumptions that are most likely to overvalue TIRF program benefits). Assumptions that go into each set of results are presented below.
Net Benefits to Ratepayers for the 2010 program year:
Table 12 - Evaluated at Lower Bound Assumptions:
• Avoided O&M only applies to steel main replacements • Avoided Leaked Gas is calculated From EPA Emission Factors • Gas Pass Through Costs are indexed to minimum NYMEX futures price • GWP of CH4 is 21x CO2 over a 100 year time frame, from IPCC (1995) • Carbon is valued as the RGGI 2011 short term auction price of $1.89/ton
Table 13 – Evaluated at Mid-Point Assumptions:
• Avoided O&M applies to steel and cast iron main replacements • Avoided Leaked Gas is calculated From EPA Emission Factors • Gas Pass Through Costs are indexed to average NYMEX futures price • GWP of CH4 is 25x CO2 over a 100 year time frame, from IPCC (2007) • Carbon is valued as the SCC at a 3% discount rate ($20.28/ton)
Table 14 - Evaluated at Upper Bound Assumptions:
• Avoided O&M applies to steel and cast iron main replacements • Avoided Leaked Gas is calculated from DOT PHMSA UAF data, assuming 100% of LUAF is
due to leaks • Gas Pass Through Costs are indexed to maximum NYMEX futures price • GWP of CH4 is 105x CO2 over a 20 year time frame, from Shindell (2009) • Carbon is valued as the ACP RPS price of $112/ton
Net Benefits to Society for the 2010-2020 Program Duration
Table 15 – Net Present Value of TIRF Program costs, at Discount Rates of 7, 8, and 9%
Table 16, 17 and 18 – Lower Bound, Mid-Point and Upper Bound calculated using the GWP and Carbon Price assumptions stated above.

21
Table 12: Benefit Cost Analysis of 2010 Replacements from the Rate Payer Perspective, Lower Bound [1]
Utility
Reduction in TIRF Increase
for O&M Offset
Rate Decrease for Gas Pass
Through Reduction in
GHG ($)
Rate Increase for TIRF Spending
Benefit/Cost Ratio
Required Carbon Price ($/ton) for B/C
= 1 Bay State Gas d/b/a Columbia Gas $24,924 $21,231 $4,314
$2,172,698
0.02 $932
National Grid MA - Boston Gas Company $261,827 $99,161 $20,147
$6,140,599
0.06 $542 Columbia Gas OH $80,647 $40,831 $8,296
$14,655,413
0.01 $3,311
National Grid MA - Colonial Gas Company $14,068 $6,924 $1,407
$251,679
0.09 $310
National Grid RI $288,688 $52,117 $10,589
$2,214,734
0.16 $334 New England Gas Company $21,616 $5,690 $1,156
$528,729
0.05 $820
Total Benefits (Lower Bound) $691,771 $225,954 $45,908
$25,963,852
0.04 $1,031 Net Benefits to Stakeholders $990,412 [1] Lower Bound Assumptions: O&M applies to steel mains only; LUAF is calculated using EPA Emissions Factors; Gas costs are the minimum NYMEX futures price, 2010; Global Warming Potential of Natural Gas is 21x during a 100 year time frame; the cost of carbon is the 2011 RGGI short-term auction price ($1.89/ton)

22
Table 13: Benefit Cost Analysis of 2010 Replacements from the Rate Payer Perspective, Mid-Point Assumptions [1]
Utility
Reduction in TIRF Increase
for O&M Offset
Rate Decrease for Gas Pass
Through Reduction in
GHG ($)
Rate Increase for TIRF Spending
Benefit/Cost Ratio
Required Carbon Price ($/ton) for B/C
= 1 Bay State Gas d/b/a Columbia Gas $41,540 $26,733 $55,102
$2,172,698
0.06 $775
National Grid MA - Boston Gas Company $499,269 $124,858 $257,357
$6,140,599
0.14 $435 Columbia Gas OH $87,231 $51,412 $105,970
$14,655,413
0.02 $2,778
National Grid MA - Colonial Gas Company $23,767 $8,718 $17,969
$251,679
0.20 $247
National Grid RI $315,255 $65,623 $135,262
$2,214,734
0.23 $275 New England Gas Company $26,486 $7,165 $14,769
$528,729
0.09 $680
Total Benefits (Mid-Point) $993,548 $284,508 $586,430
$25,963,852
0.07 $854
Net Benefits to Stakeholders $1,896,367
[1] Mid-Point Assumptions: O&M applies to steel and cast iron mains; LUAF is calculated using EPA Emissions Factors; Gas costs are the average NYMEX futures price, 2010; Global Warming Potential of Natural Gas is 25x during a 100 year time frame; the cost of carbon is the SCC at 3% Discount Rate ($20.28/ton)

23
Table 14: Benefit Cost Analysis of 2010 Replacements from the Rate Payer Perspective, Upper Bound [1]
Utility
Reduction in TIRF Increase
for O&M Offset
Rate Decrease for Gas Pass
Through Reduction in
GHG ($)
Rate Increase for TIRF Spending
Benefit/Cost Ratio
Required Carbon Price ($/ton) for B/C
= 1 Bay State Gas d/b/a Columbia Gas $41,540 $136,566 $5,286,038
$2,172,698
2.51 $42
National Grid MA - Boston Gas Company $499,269 $614,633 $23,790,509
$6,140,599
4.06 $24 Columbia Gas OH $87,231 $82,079 $3,177,026
$14,655,413
0.23 $511
National Grid MA - Colonial Gas Company $23,767 $96,475 $3,734,245
$251,679
15.32 $4
National Grid RI $315,255 $1,202,262 $46,535,764
$2,214,734
21.7 $2 New England Gas Company $26,486 $66,885 $2,588,912
$528,729
5.07 $19
Total Benefits (Upper Bound) $993,548 $2,198,901 $85,112,495
$25,963,852
3.40 $30 Net Benefits to Stakeholders $89,142,770 [1] Upper Bound Assumptions: O&M applies to steel and cast iron mains; LUAF is assumed to be 100% due to leaks and is calculated as a percentage of 2009 UAF; Gas costs are the maximum NYMEX futures price, 2010; Global Warming Potential of Natural Gas is 105x during a 20 year time frame; the cost of carbon is the 2011 MA RPS ACP ($112/ton)

24
Table 15: Net Present Value of TIRF Costs ($2010 mil), period 2010-2020
Discount Rate Total Proposed Replacement Schedule (miles of pipe) Nominal 7% 8% 9%
Bay State Gas d/b/a Columbia Gas 397 $357 $254 $243 $233 National Grid MA - Boston Gas Company (unprotected steel) [1] 2,246 $2,411 $1,664 $1,586 $1,514
New England Gas Company 95 $35 $26 $25 $24
Net Present Value ($2010), Program Years 2010-2020 $2,803 $1,944 $1,854 $1,771 [1] We assume that all National Grid - MA costs are spent on Boston Gas pipe replacements. DPU 10-55 projected totals are presented in aggregate for Boston, Colonial, and Essex Gas. The total proposed replacement schedule includes 565 miles of unprotected steel and 1,681 miles of cast iron mains.

25
Table 16: Net Present Value of TIRF Benefits ($2010 mil), period 2010-2030, Lower Bound [1] Net Present Value of Benefits
Nominal Reduction
in GHG
Nominal Rate Decrease for Gas
Pass Through 1% Discount
Rate 2% Discount
Rate 3% Discount
Rate Bay State Gas d/b/a Columbia Gas $1.47 $7.22 $8.48 $8.29 $8.12 National Grid MA - Boston Gas Company (unprotected steel) [2] $1.60 $7.88 $9.25 $9.04 $8.85 National Grid MA - Boston Gas Company (cast iron) [2] $4.39 $21.60 $25.38 $24.83 $24.33 New England Gas Company $0.26 $1.28 $1.50 $1.47 $1.44
Net Present Value ($2010), Program Years 2010-2020
$45 $44 $43
[1] Lower bound assumes a Global Warming Potential of 21x on a 100 year time frame; NYMEX gas costs are the minimum futures price, 2010; and the cost of carbon is equal to the RGGI 2011 short term auction price ($1.89/ton). Benefits are assumed to accrue for 20 years. [2] We assume that all National Grid - MA costs are spent on Boston Gas pipe replacements. DPU 10-55 projected totals are presented in Aggregate for Boston, Colonial, and Essex Gas.

26
Table 17: Net Present Value of TIRF Benefits ($2010 mil), period 2010-2030, Mid-point Assumptions [1] Net Present Value of Benefits
Nominal Reduction
in GHG
Nominal Rate Decrease for Gas
Pass Through 1% Discount
Rate 2% Discount
Rate 3% Discount
Rate Bay State Gas d/b/a Columbia Gas $22.57 $9.09 $30.92 $30.24 $29.62 National Grid MA - Boston Gas Company (unprotected steel) [2] $24.52 $9.92 $33.63 $32.88 $32.19 National Grid MA - Boston Gas Company (cast iron) [2] $67.67 $27.20 $92.70 $90.72 $88.90 New England Gas Company $3.94 $1.61 $5.45 $5.33 $5.21
Net Present Value ($2010), Program Years 2010-2020
$163 $159 $156
[1] Mid-point assumes a Global Warming Potential of 25x on a 100 year time frame; NYMEX gas costs are the average futures price, 2010; and the cost of carbon is equal to the SCC at a 3% discount rate from EPA (2010). Benefits are assumed to accrue for 20 years. [2] This worksheet assumes that all National Grid - MA costs are spent on Boston Gas pipe replacements. DPU 10-55 projected totals are presented in Aggregate for Boston, Colonial, and Essex Gas.

27
Table 18: Net Present Value of TIRF Benefits ($2010 mil), period 2010-2030, Upper Bound [2] Net Present Value of Benefits
Nominal Reduction
in GHG
Nominal Rate Decrease for Gas
Pass Through 1% Discount
Rate 2% Discount
Rate 3% Discount
Rate Bay State Gas d/b/a Columbia Gas $310.52 $11.23 $314.12 $307.14 $300.72 National Grid MA - Boston Gas Company (unprotected steel) [2] $338.80 $12.25 $342.62 $334.89 $327.78 National Grid MA - Boston Gas Company (cast iron) [2] $928.73 $33.59 $940.00 $919.58 $900.86 New England Gas Company $55.10 $1.99 $55.70 $54.41 $53.23
Net Present Value ($2010), Program Years 2010-2020
$1,652 $1,616 $1,583
[1] Upper bound assumes a Global Warming Potential of 105x on a 21 year time frame; NYMEX gas costs are the maximum futures price, 2010; and the cost of carbon is equal to the Long Term Marginal Abatement Cost from AESC (2011) ($80/ton). Benefits are assumed to accrue for 20 years. [2] This worksheet assumes that all National Grid - MA costs are spent on Boston Gas pipe replacements. DPU 10-55 projected totals are presented in Aggregate for Boston, Colonial, and Essex Gas.

28
References EPA Emissions Factors. 2011. 40 CFR Part 98: Mandatory Reporting of Greenhouse Gases: Technical
Revisions to the Petroleum and Natural Gas Systems Category of the Greenhouse Gas Reporting Rule, issued December 23, 2011 in volume 76 no. 247
EPA (2010). Technical Support Document: Social Cost of Carbon for Regulatory Impact Analysis – Under Executive Order 12866. Interagency Working Group on Social Cost of Carbon, United States Government, page 2.
Forster, P., V. Ramaswamy, P. Artaxo, T. Berntsen, R. Betts, D.W. Fahey, J. Haywood, J. Lean, D.C. Lowe, G. Myhre, J. Nganga, R. Prinn, G. Raga, M. Schulz and R. Van Dorland, 2007: Changes in Atmospheric Constituents and in Radiative Forcing. In: Climate Change 2007: The Physical Science Basis. Contribution of Working Group I to the Fourth Assessment Report of the Intergovernmental Panel on Climate Change [Solomon, S., D. Qin, M. Manning, Z. Chen, M. Marquis, K.B. Averyt, M.Tignor and H.L. Miller (eds.)]. Cambridge University Press, Cambridge, United Kingdom and New York, NY, USA. Cited as IPCC, 2007.
Krutilla, K., 2005. Using the Kaldor-Hicks Tableau Format for Cost-Benefit Analysis and Policy Evaluation. Journal of Policy Analysis and Management: Curriculum and Case Notes, 24(4), pp. 864-875.
PEW Center on Global Climate Change (2010). Workshop Proceedings: Assessing the Benefits of Avoided Climate Change: Cost-Benefit Analysis and Beyond
Shindell DT, Faluvegi G, Koch DM, Schmidt GA, Unger N, Bauer SE (2009) Improved attribution of climate forcing to emissions. Science 326:716–718
i See DPU 09-30, at 133 ii See DPU 11-120, at 4 iii See DPU 11-120, at 3 iv See DPU 11-120, at 14 v This is sometimes referred to as a Kaldor-Hicks Tableau (Krutilla, 2005). vi See http://www.phmsa.dot.gov/portal/site/PHMSA/menuitem.ebdc7a8a7e39f2e55cf2031050248a0c/?vgnextoid=a872dfa122a1d110VgnVCM1000009ed07898RCRD&vgnextchannel=3430fb649a2dc110VgnVCM1000009ed07898RCRD&vgnextfmt=print for publicly available data. vii See EPA Emissions Factors (2011). viii SNL Financial Energy Database did not contain information on total sales for National Grid-RI. Instead, the report assumed 2009 sales equal to the 2010 sales as identified in the testimony of Richer, page 520, in RIPUC Docket 4077. This is a conservative assumption because the majority of Utilities reported greater sales in 2009 than 2010. ix See: MA DPU at: http://www.mass.gov/eea/grants-and-tech-assistance/guidance-technical-assistance/agencies-and-divisions/dpu/ RI PUC at: http://www.ripuc.org/ OH PUC at: http://www.puco.ohio.gov/puco/index.cfm x See http://www.eia.gov/naturalgas/data.cfm#prices for publicly available data. xi All IPCC values can be found in (IPCC, 2007), 2nd Chapter of the 4th Report, Table 2.14. xii Shindell et al. (2009). xiii EPA (2010). xiv PEW (2010).

29
xv Specifically, the Working Group included contributions from:
Council of Economic Advisors Council on Environmental Quality Department of Agriculture Department of Commerce Department of Energy Department of Transportation Environmental Protection Agency National Economic Council Office of Energy and Climate Change Office of Management and Budget Office of Science and Technology Policy Department of the Treasury
xvi An IAM combines climate processes, economic growth projections, and associated feedbacks into one single modeling framework. The working group specifically considers the DICE, PAGE, and FUND models, which are well represented in the peer review literature, including the IPCC reports. xvii EPA (2010), page 12. xviii Specifically, the report considered Bay State Gas d/b/a Columbia Gas, Boston Gas d/b/a National Grid, and New England Gas Company. In DPU 10-55, National Grid did not distinguish its proposed expenditures and replacements by regional company (Boston, Colonial, or Essex). This report assumed that all replacements occurred on the largest system, Boston Gas.