summary of housing and renewable energy studies in … · how taunton ’s homes are heated and...
TRANSCRIPT
3 St Peter’s Court
Bedminster Parade
Bristol
BS3 4AQ
We are a national charitythat helps people changethe way they think andact on energy.
0117 934 1400
www.cse.org.uk
charity 298740
Summary of housing andrenewable energy studies in Taunton
Prepared for Taunton Transition Town by the Centre for Sustainable Energy, March 2012
Local energy assessment report


Introduction
In December 2011, the Government announced the launch of the LocalEnergy Assessment Fund (LEAF), a £10 million funding package to supportcommunities seeking to investigate energy efficiency and renewable energyprojects in their area.
LEAF funding was available to not-for-profit groups such as parish councils,co-operatives and community interest companies, and was designed to helpthem benefit from low-carbon policies such as the Green Deal andRenewable Heat Incentive.
Taunton Transition Town made a successful application to the Local EnergyAssessment Fund and commissioned the Centre for Sustainable Energy(CSE) to carry out a series of studies designed to give a clearer picture of theoptions available for local renewable energy and energy efficiency projectsat the community level in the Taunton area.
These studies were undertaken early in 2012 and presented to TauntonTransition Town in March 2012. This document is a summary of the mainfindings of the studies.
Housing stock assessment modelling page 3
Assessment of potential for generating solar energy page 19
Assessment of potential for generating biomass energy page 25
Assessment of local heat demand page 37
Report to Taunton Transition Town by Centre for Sustainable Energy 1
Cover image: Grigoriy Lukyanov / istock.com

2 Report to Taunton Transition Town by Centre for Sustainable Energy
Phot
o: C
SE

Report to Taunton Transition Town by Centre for Sustainable Energy 3
1 | A summary of housing stockassessment modelling in Taunton
This is a summary of the housing stock assessment modelling carried out for Taunton
Transition Town in February 2012 by the Centre for Sustainable Energy.
This assessment of the local housing stock is based on a computer modelling tool
developed by CSE. The tool draws on a variety of reliable data sources to generate a full
dataset for the area and produce a baseline assessment of household energy
consumption, CO2 emissions, fuel costs and SAP rating. Calculations are then made on
the best combinations of energy efficiency and renewable energy measures that could be
applied across the housing stock, including the potential for improving energy efficiency
levels and reducing CO2 emissions and household fuel costs.
CSE has extensive experience in housing stock modelling and analysis, and has developed
a comprehensive housing stock assessment tool to analyse combinations of measures,
scenarios and fuel poverty and carbon impact. Recent key projects include modelling
Bristol’s housing stock (across all tenures) and Somer Housing Group’s stock for energy
efficiency, and co-developing the scoping study for DECC’s national household model.
4 Report to Taunton Transition Town by Centre for Sustainable Energy
Background
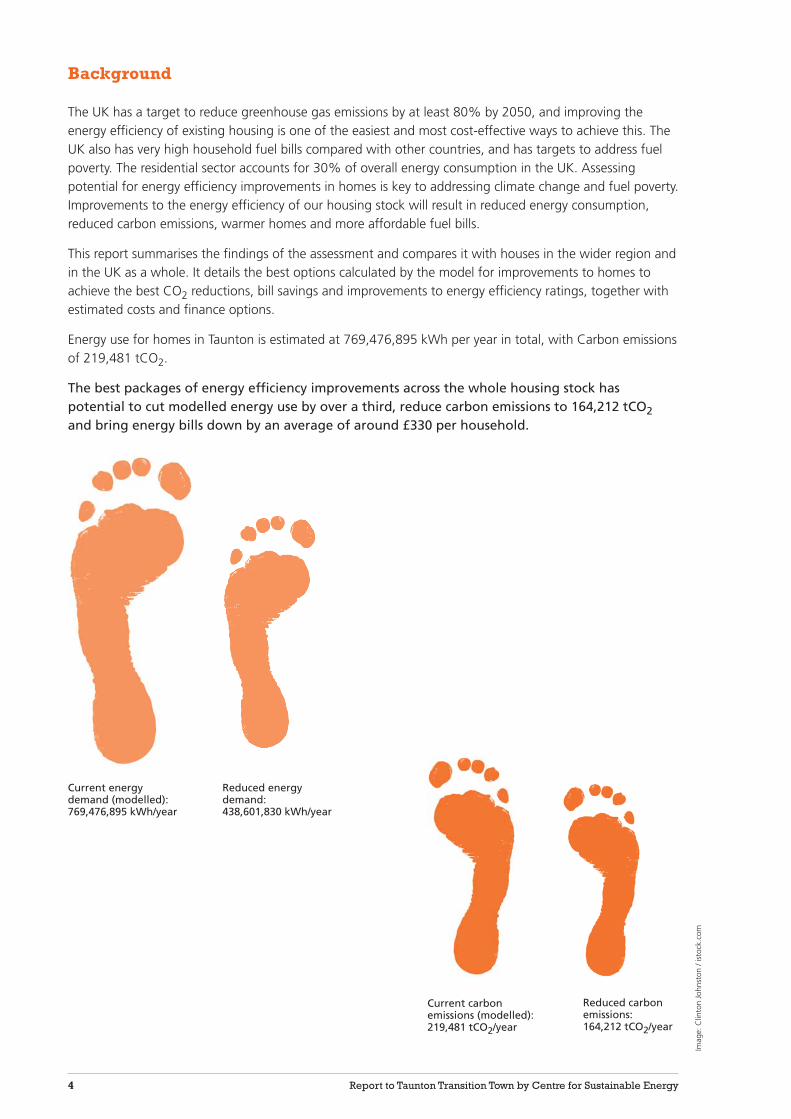
The UK has a target to reduce greenhouse gas emissions by at least 80% by 2050, and improving theenergy efficiency of existing housing is one of the easiest and most cost-effective ways to achieve this. TheUK also has very high household fuel bills compared with other countries, and has targets to address fuelpoverty. The residential sector accounts for 30% of overall energy consumption in the UK. Assessingpotential for energy efficiency improvements in homes is key to addressing climate change and fuel poverty.Improvements to the energy efficiency of our housing stock will result in reduced energy consumption,reduced carbon emissions, warmer homes and more affordable fuel bills.
This report summarises the findings of the assessment and compares it with houses in the wider region andin the UK as a whole. It details the best options calculated by the model for improvements to homes toachieve the best CO2 reductions, bill savings and improvements to energy efficiency ratings, together withestimated costs and finance options.
Energy use for homes in Taunton is estimated at 769,476,895 kWh per year in total, with Carbon emissionsof 219,481 tCO2.
The best packages of energy efficiency improvements across the whole housing stock haspotential to cut modelled energy use by over a third, reduce carbon emissions to 164,212 tCO2and bring energy bills down by an average of around £330 per household.
Current carbon emissions (modelled):219,481 tCO2/year
Reduced carbon emissions: 164,212 tCO2/year
Current energy demand (modelled): 769,476,895 kWh/year
Reduced energy demand: 438,601,830 kWh/year
Imag
e: C
linto
n Jo
hnst
on /
isto
ck.c
om

Report to Taunton Transition Town by Centre for Sustainable Energy 5
Assessment methodology and area
CSE used the Housing Assessment Model to analyse data about the housing stock in Taunton.
Information on housing tenure; dwelling type; property age; number of bedrooms; gas connection; andsocio-economic category was purchased and processed to establish a household level dataset. Data wasthen modelled to calculate household energy consumption levels, CO2 emissions, fuel costs and SAPratings, and the best packages of energy efficiency and renewable energy measures to makeimprovements.
Recommended improvements were calculated based on three scenarios: greatest improvement in SAPrating; greatest reduction in energy bills; and greatest reduction in CO2 emissions. The approximate cost ofcarrying out these improvements is also given.
In addition to this modelling, 107 surveys were completed by local householders in order to gain moredetailed information on individual houses. This was modelled as a sub-set of data for comparison butrepresents a small percentage of the total housing stock. Survey data was used to inform local case studies.
Map of Taunton
6 Report to Taunton Transition Town by Centre for Sustainable Energy
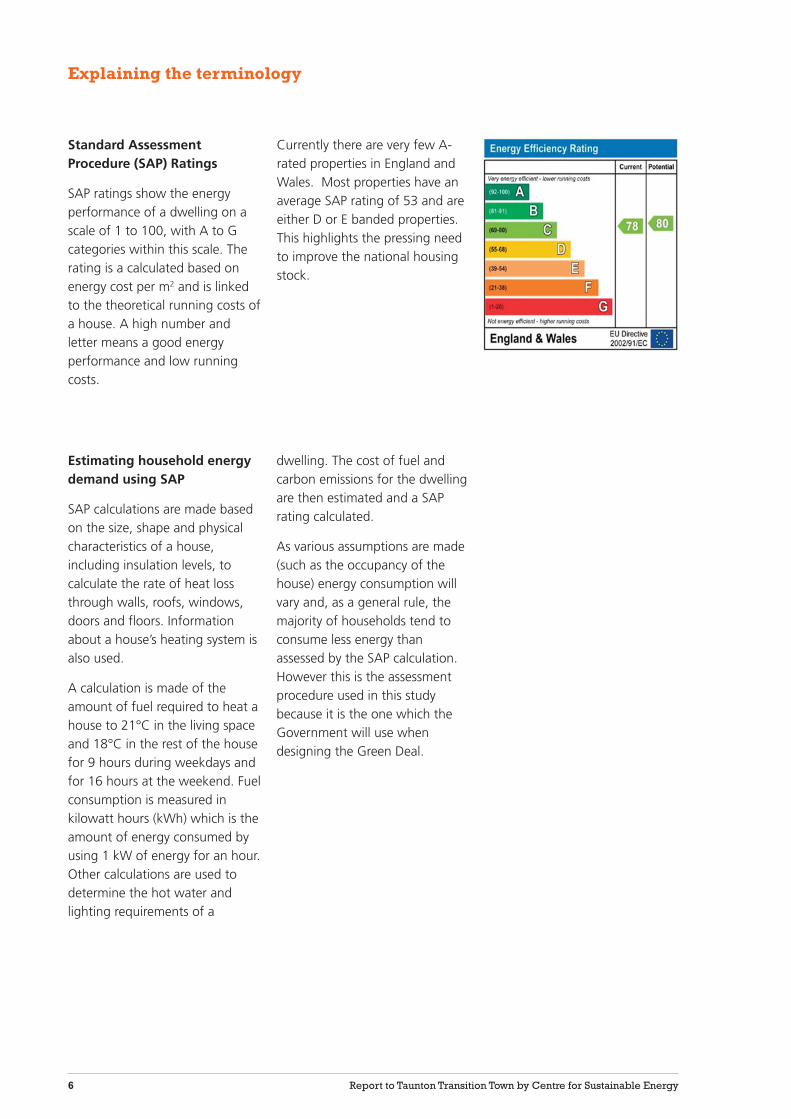
Explaining the terminology
Estimating household energydemand using SAP
SAP calculations are made basedon the size, shape and physicalcharacteristics of a house,including insulation levels, tocalculate the rate of heat lossthrough walls, roofs, windows,doors and floors. Informationabout a house’s heating system isalso used.
A calculation is made of theamount of fuel required to heat ahouse to 21°C in the living spaceand 18°C in the rest of the housefor 9 hours during weekdays andfor 16 hours at the weekend. Fuelconsumption is measured inkilowatt hours (kWh) which is theamount of energy consumed byusing 1 kW of energy for an hour.Other calculations are used todetermine the hot water andlighting requirements of a
dwelling. The cost of fuel andcarbon emissions for the dwellingare then estimated and a SAPrating calculated.
As various assumptions are made(such as the occupancy of thehouse) energy consumption willvary and, as a general rule, themajority of households tend toconsume less energy thanassessed by the SAP calculation.However this is the assessmentprocedure used in this studybecause it is the one which theGovernment will use whendesigning the Green Deal.
Standard AssessmentProcedure (SAP) Ratings
SAP ratings show the energyperformance of a dwelling on ascale of 1 to 100, with A to Gcategories within this scale. Therating is a calculated based onenergy cost per m2 and is linkedto the theoretical running costs ofa house. A high number andletter means a good energyperformance and low runningcosts.
Currently there are very few A-rated properties in England andWales. Most properties have anaverage SAP rating of 53 and areeither D or E banded properties.This highlights the pressing needto improve the national housingstock.

Report to Taunton Transition Town by Centre for Sustainable Energy 7
The housing stock in Taunton
The survey assessed 25,605 households in the area. CSE’s model showed:
• The range of age and type of properties is similar to the regional and national averages, although theproportion of semi-detached and terraced properties is slightly higher than average.
• 57% of homes were built between 1920 and 1979.
• 24% of properties were built between 1920 and 1945, and are likely to have cavity walls.
• 58% of the properties are owner occupied, which is lower than regional and national averages.
• There is almost double the amount of social housing than the regional average. Social housingtypically has higher levels of energy efficiency than private dwellings.
Housing stock in Taunton by dwelling type, age of property and tenure
Households Local area % Regional % National %
Dwelling type
Detached 4,122 16% 20% 17%
Semi-detached 7,286 28% 24% 26%
Bungalow 1,185 5% 14% 9%
Terraced 9,072 35% 26% 29%
Flat 3,940 15% 16% 19%
Total 25,605 100% 100% 100%
Age of property
pre-1870 1,258 5% 10% 5%
1871-1919 2,906 11% 13% 17%
1920-1945 6,102 24% 12% 17%
1946-1954 2,287 9% 5% 7%
1955-1979 6,111 24% 31% 30%
post-1980 6,941 27% 29% 23%
Total 25,605 100% 100% 100%
Tenure
Owner occupied 14,863 58% 72% 68%
Privately rented 5,073 20% 16% 15%
LA/housing association 5,669 22% 12% 17%
Total 25,605 100% 100% 100%
Phot
o: S
omer
set
Cou
ncil

8 Report to Taunton Transition Town by Centre for Sustainable Energy
How Taunton ’s homes are heated and insulated
• The majority of households in the Taunton area have mains gas central heating (79%). One fifth ofhomes rely on alternative (and more expensive) heating fuels, usually electric storage heating - and inmost cases these are flats.
• Just under one fifth (19%) of the local housing stock has solid walls which are hard to insulate. Thiscorresponds with the age profile of the housing stock.
• 57% of Taunton’s housing stock is expected to have uninsulated cavity walls, mainly homes builtbetween 1946 and 1979. The majority of newer properties appear to have insulated cavities.
• There may be also be significant scope for top-up loft insulation, with 79% of properties deemed tohave less than the recommended amount, although it should be noted that the model is weaker inpredicting loft insulation levels, than other modelled variables.
100%
80%
60%
40%
20%
0%Mains gas LPG Oil Solid fuel CommunityElectricity
local area regional national
Main heating fuel
60%
50%
40%
30%
20%
10%
0%
Uninsulated cavity wall Insulated cavity wall Solid wall /other
local area regional national
Wall type

Report to Taunton Transition Town by Centre for Sustainable Energy 9
Hard-to-treat properties
‘Hard-to-treat’ properties are defined as those having no mains gas heating system and/or being a solidwalled property. This means these properties have limited access to the most cost-effective energy efficiencymeasures and may be more expensive to heat.
• Just over one third (34%) of the local housing stock is considered ‘hard-to-treat’. This is lower thanthe regional and national profile.
• Within this there are roughly equal proportions of solid wall and non-mains gas heated properties inthe area, but few appear to be both solid wall and off gas (6%).
The map below indicates the distribution of postcodes of hard-to-treat properties.
Map showing hard-to-treat properties in Taunton
0 0.5 1.0 miles
À
Hard to treat
Not hard to treat
H
1:34,000 | Contains Ordnance Survey data © Crown copyright and database right

10 Report to Taunton Transition Town by Centre for Sustainable Energy
Carbon Footprint and energy demand of Taunton ’s housing stock
Total annual energy demand 769,476,895 kWh
Total annual CO2 emissions 219,481 tCO2
How does Taunton compare?
Local area Regional National
Average annual household energy demand (kWh) 30,052 29,756 29,019
Average annual household CO2 emissions (tCO2) 8.6 9.1 8.5
Average annual household energy bill (£) 1,564 1,682 1,585
The average SAP rating of a dwelling in the local area is estimated to be 50, or SAP band E. The majority ofproperties in Taunton fall into band D or E as shown below:
50%
45%
40%
35%
30%
25%
20%
15%
10%
5%
0%
A B C D E F G
local area regional national
SAP band (baseline)
In general, the modelled energy demand, CO2 emissions and energy bills of the housing stock in Tauntonare similar to the regional and national averages.
The values shown here are based on modelled energy demand (using energy demand assumptions set bygovernment), rather than actual consumption. In reality consumption will usually be lower and thereforepotential savings will also be less.

Report to Taunton Transition Town by Centre for Sustainable Energy 11
What improvements can be made?
The Housing Assessment Model calculates the best packages of improvements based on three scenarios:
1) Measures which would result in the greatest improvement in SAP rating at the lowest cost
2) Measures resulting in the greatest reduction in energy bills
3) Measures resulting in the greatest reduction in CO2 emissions
A number of energy efficiency measures were considered for improving the housing stock. These includedloft and wall insulation, heating upgrades and controls, and a number of renewable energy technologies.
The costs of some measures, particularly wall insulation and heating systems, will vary depending on thetype and size of dwelling. For example, the cost of insulating the four external walls of a large detachedhouse is considerably higher than the cost of insulating a small terraced house. The table below representsthe highest cost that each measure might be, taking into account that many householders will require aprofessional installer, even though in reality some measures can be installed DIY for a lower cost.
It was found that:
• Over half of the properties could benefit from cavity wall insulation and almost a fifth from solid wallinsulation. These are identified as key measures to improve the local housing stock under all threescenarios.
• Heating controls are also identified as a key measure to reduce fuel bills. They are predicted to make adifference to around two thirds of properties in the area and can be installed at low cost to thehouseholder.
• There also appears considerable scope for loft insulation, particularly top-up, and hot water tankinsulation. This may not be on the scale suggested by the modelled results because as previously noted,the model is weaker at predicting loft insulation levels.
• In 10% of the housing stock there may be some opportunity for upgrading gas or oil boilers.
• In terms of renewable energy, around a third of properties have potential for solar photovoltaic panels,some may have potential for air source heat pumps, and a handful for micro-wind - particularly in therural parts of the area. Solar water heating appears a highly favourable option to reduce householdenergy bills in some properties.
Measure Cost (£)
Cavity wall insulation 429
Internal solid wall insulation 7,404
Loft insulation (full) 286
Loft insulation (top-up) 240
External solid wall insulation 13,099
Hot water cylinder insulation (80mm jacket) 70
Time and temperature zone controls 675
Air source heat pump (9.5 kW) 7,462
Biomass boiler (15 kW) 7,579
Measure Cost (£)
Gas condensing boiler (15 kW) 2,571
Ground source heat pump (5 kW) 9,061
Log stove (5 kW) 1,683
Oil condensing boiler (15 kW) 7,649
Solar water heating (2 kW) 4,636
Micro wind turbine (1.5 kW) 2,463
1kW solar PV system 4,506
2kW solar PV system 8,822
Energy efficiency options and sample costs

12 Report to Taunton Transition Town by Centre for Sustainable Energy
Number of households modelled as being suitable for key measures under each scenario
Scenario 1: Best SAP Scenario 2: Lowest bills Scenario 3: Lowest CO2
Insulation
Cavity wall insulation 14,001 14,470 14,470
Solid wall insulation 4,795 4,813 4,813
Loft insulation 20,280 21,732 21,732
Hot water tank insulation 2,696 5,803 6,264
Heating & controls
Gas condensing boiler 2,016 2,016 2,016
Oil condensing boiler 444 457 444
Biomass boiler 0 0 29
Heating controls (full zone) 15,782 18,623 18,842
Renewables
Air source heat pump 4,690 4,705 4,700
Ground source heat pump 13 18 7
Solar water heating 0 408 279
Micro-wind turbine 102 200 200
Photovoltaics (1kW) 1,885 1,936 1,936
Photovoltaics (2kW) 7,688 7,795 7,795
If all of the measures identified were to be installed:
• The total cost would range from £166 million to £185 million.
• The average cost per dwelling would be between around £6,500 and £7,250.
• The average SAP rating of Taunton’s housing stock could rise from 50 (band E) to 72 (band C).
• The average household annual energy demand could drop from 30,000kWh to 17,000kWh.
• The average household annual fuel bill could drop to around £1,230, a reduction of £330.
• Scenario 3 would achieve the greatest reduction in carbon emissions and fuel bills.
• Scenario 1 is the most cost effective option as it offers the best value in terms of £ spent per tonne ofcarbon saved, despite fewer measures being installed.
Key figures for each scenario modelled
Scenario 1: Best SAP Scenario 2: Lowest bills Scenario 3: Lowest CO2
Totals
Total measures 74,392 82,976 83,527
Total cost of measures (£m) £166.1 £185.3 £184.4
Average cost per dwelling £6,486 £7,236 £7,203
£ per tCO2 saved £3,134 £3,363 £3,337
Potential change from current averages after energy efficiency improvements
Current average Scenario 1: Scenario 2: Scenario 3: Best SAP Lowest bills Lowest CO2
Household energy demand (kWh) 30,052 -12,451 -12,871 -12,889
Household energy bill (£) £1,564 -£325 -£338 -£338
Household CO2 emissions (tCO2) 8.6 -2.1 -2.2 -2.2
SAP Rating 50 +21 +22 +22
The number of households suitable for each measure is shown in the table below:

Report to Taunton Transition Town by Centre for Sustainable Energy 13
Financing improvements
Green Deal, ECO and Customer Contributions
From late 2012, the Green Deal and the Energy Company Obligation (ECO) will be the main Governmentpolicies used to drive and fund domestic energy efficiency improvements. Although the final details ofthese policies are yet to be published, the Department of Energy and Climate Change have producedguidance which has been used in this report to calculate how the residents of Taunton may be able tobenefit.
Through the Green Deal, a household energy assessment is carried out to assess the potentialimprovements to a property and the savings which could be made on the energy bill. Finance is then madeavailable to cover the cost of the measures, which is paid back monthly via the customers energy bill over aset period of time. The monthly repayments should be lower than the monthly saving made as a result ofthe measures installed, so that the household is financially better off, as well as more comfortable in theirhome.
Some costly measures, such as solid wall insulation, will not result in large enough savings to cover the costthrough energy bills alone, in which case the customer may need to contribute. The ECO will provide helpto pay for these higher cost measures for the most vulnerable households.
On average, just under half (44%) of the cost of improvement measures identified could be covered byGreen Deal finance and 17% funded under the ECO. The average customer contribution required to makeup the shortfall is 39% of the total cost of measures, and ranges from around £2,500 to £3,000. There willhowever be significant variation on these figures on a house-by-house basis, as not all homes will be ableto access the same level of finance or require the same number or type of measures.
Financing measures - average cost per household across the three scenarios
Scenario 1: Best SAP Scenario 2: Lowest bills Scenario 3: Lowest CO2
Green Deal finance received £2,839 £3,153 £3,145
ECO finance available £1,096 £1,149 £1,155
Customer contribution required £2,550 £2,934 £2,902
Cost of measures £6,486 £7,236 £7,203
For renewable energy measures, the Feed-in Tariff (FIT) and Renewable Heat Incentive (RHI) will providefurther financial contribution. For more information see the information sheets on FIT and RHI availableonline here: www.cse.org.uk/adviceleaflets

14 Report to Taunton Transition Town by Centre for Sustainable Energy
Survey data
Householders in Taunton have completed 107 household surveys which were input into the computermodel. While this number isn’t a large enough proportion of the housing stock to make a significantdifference to the results, it is useful to compare some of the answers given by householders to thecalculations that the computer model made. The results given by some of the households have been usedas case studies.
• The surveys covered 0.4% of the total housing in the area.
• Over 50% of the properties surveyed were terraced houses, whilst another 25% were detached and15% were semi-detached properties.
• Most of properties surveyed were older homes, 50% built before 1919. Just under 15% of thesurveyed properties were built after 1955.
• The majority of those surveyed owned their own homes and only 8% of those surveyed rent theirhome.
• 10% had some form of renewable energy installation, with the two most popular being solar PVsystems and log stoves.
• The most commonly suggested measures for the surveyed properties include wall insulation, loftinsulation and boiler upgrades. These are similar to those recommended by the modelled data.
• The model has also identified several houses which would benefit from air source heat pumps andsolar PV systems.
Case studies
The three case studies that follow describe typical house types in Taunton and represent the majority of thehousing stock in the community. They also illustrate the kind of improvements which householders may beable to make, along with the typical cost and the expected impacts of the improvements in terms of SAPrating, energy bills and carbon emissions.
Report to Taunton Transition Town by Centre for Sustainable Energy 15
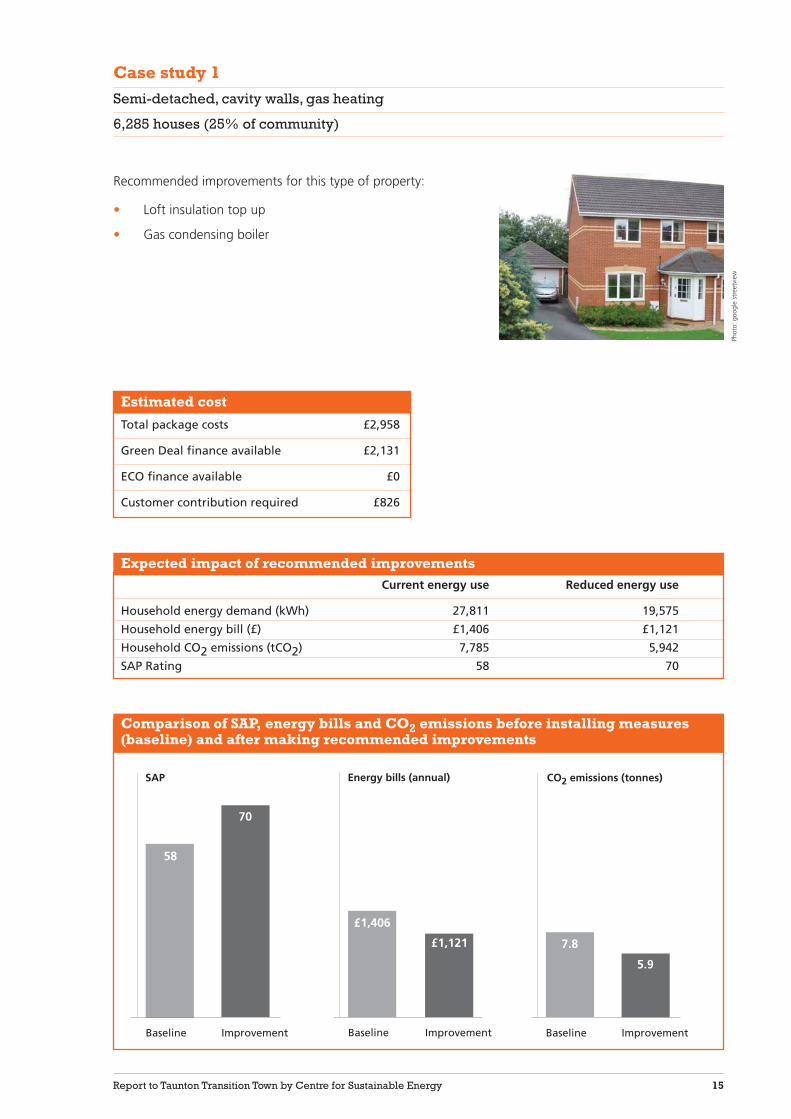
Case study 1
Semi-detached, cavity walls, gas heating
6,285 houses (25% of community)
Current energy use Reduced energy use
Household energy demand (kWh) 27,811 19,575
Household energy bill (£) £1,406 £1,121
Household CO2 emissions (tCO2) 7,785 5,942
SAP Rating 58 70
Estimated cost
Total package costs £2,958
Green Deal finance available £2,131
ECO finance available £0
Customer contribution required £826
Baseline Improvement Baseline Improvement Baseline Improvement
SAP Energy bills (annual) CO2 emissions (tonnes)
58
70
£1,406
£1,121 7.8
5.9
Expected impact of recommended improvements
Comparison of SAP, energy bills and CO2 emissions before installing measures(baseline) and after making recommended improvements
Recommended improvements for this type of property:
• Loft insulation top up
• Gas condensing boiler
Phot
o: g
oogl
e st
reet
view

16 Report to Taunton Transition Town by Centre for Sustainable Energy
Case study 2
Terraced, cavity walls, gas heating
5,449 houses (21% of community)
Current energy use Reduced energy use
Household energy demand (kWh) 22,362 15,788
Household energy bill (£) £1,112 £957
Household CO2 emissions (tCO2) 6,265 4,794
SAP Rating 66 75
Estimated cost
Total package £2,753
Green Deal finance available £2,005
ECO finance available £0
Customer contribution required £747
Baseline Improvement Baseline Improvement Baseline Improvement
SAP Energy bills (annual) CO2 emissions (tonnes)
66
75
£1,112£957 6.3
4.8
Expected impact of recommended improvements
Comparison of SAP, energy bills and CO2 emissions before installing measures(baseline) and after making recommended improvements
Recommended improvements for this type of property:
• Internal solid wall insulation
• Loft insulation top-up
• Oil condensing boiler
• 2kW Solar PV system
Phot
o: C
SE

Report to Taunton Transition Town by Centre for Sustainable Energy 17
Case study 3
Detached, cavity walls, gas heating
3,288 houses (13% of community)
Current energy use Reduced energy use
Household energy demand (kWh) 55,408 24,370
Household energy bill (£) £2,423 £1,349
Household CO2 emissions (tCO2) 14,178 7,232
SAP Rating 38 72
Estimated cost
Total package £3,528
Green Deal finance available £3,528
ECO finance available £0
Customer contribution required £0
Baseline Improvement Baseline Improvement Baseline Improvement
SAP Energy bills (annual) CO2 emissions (tonnes)
38
72
£2,423
£1,349
14.2
7.2
Expected impact of recommended improvements
Comparison of SAP, energy bills and CO2 emissions before installing measures(baseline) and after making recommended improvements
Recommended improvements for this type of property:
• Cavity wall insulation
• Loft insulation
• Gas condensing boiler

18 Report to Taunton Transition Town by Centre for Sustainable Energy
Phot
o: F
erna
ndo
Alo
nso
Her
rero
/ is
tock
.com

Report to Taunton Transition Town by Centre for Sustainable Energy 19
2 | A summary of solar energy potentialin Taunton
This is a summary of the resource asssessment modelling carried out for Taunton
Transition Town in February 2012 by the Centre for Sustainable Energy.
Solar PV potential was mapped using a combination of aerial photography analysis and
LIDAR 3D modelling data to provide an accurate assessment of solar PV potential at the
individual household level. Analysis of the proportion of suitable roofs that are most
appropriate for PV or solar thermal was carried out. The results were overlaid with
MOSAIC data which gives information on likely income levels and pre-disposition to
engaging in the purchase of ‘green’ technologies, in order to rank the streets where bulk-
purchase opportunities are likely to be most successful.
CSE has extensive experience in resource mapping and data analysis of low carbon
technologies to develop a policy evidence base for regions and specific sites. Past projects
include solar resource assessment for Bristol, Teignbridge, Plymouth and West Sussex
councils.

20 Report to Taunton Transition Town by Centre for Sustainable Energy
Introduction to solar power
There are two types of solar panel:
1) Solar photovoltaic (PV) panels, which generate electricity
2) Solar thermal panels, which provide hot water
Solar photovoltaic (PV) panels convert the energy in sunlight into electricity. As light hits the panels anelectrical current is produced and this is effectively free electricity (once the cost of buying and installing thepanels has been made back, of course). The electricity generated by a domestic system is automaticallyused directly by appliances operating in the household, with any surplus being exported to the electricitygrid. However, when the sun isn’t shining, or when the household is using more electricity than the panelsare producing, the extra electricity needed will be imported from the national grid in the normal way, andthe household will be charged for it by their energy supplier at their normal rate.
A typical 2.2kW (2,200W) household array of solar panels will produce 2.2kW under optimum conditions –but not all the time. It depends on the orientation of the panels (i.e. the direction the roof faces and itsslope), whether they experience any shading and how sunny it is at the time.
Solar thermal panels absorb heat from the sun and transfer it indirectly to a hot water storage tank insidethe property. The water they heat can be used for showers, baths, washing up etc. A boiler will usually stillbe required to further raise the temperature of the pre-heated water in the tank so fuel savings areassociated with the work the boiler doesn’t have to do, due to the heat already provided for free by thepanels.
Left, solar PV panels; top, solarthermal (evacuated tubes); below,solar thermal (flat plate collectors)Ph
oto:
Ral
ph12
5, B
en W
hitt
le, A
dam
Tom
asik
. All
from
isto
ckco
m

Report to Taunton Transition Town by Centre for Sustainable Energy 21
Methodology
CSE has assessed the potential for generating energy from solar power using Bluesky maps andspreadsheets. These are built from a database of all the domestic and non-domestic roofs in the UK. Foreach address, the database contains information on roof orientation and geometry. It accounts for thepresence of features such as dormer windows and skylights in its calculations of usable roof area, and alsoestimates the impact of any shading at each site. The results are displayed in map form. See below for anexample of how the Bluesky solar maps look.
CSE has taken the raw information provided by the Bluesky SolAR (Solar Assessment of Roofs) databaseand performed a series of additional calculations to provide an indication of payback and carbon savings.CSE has also provided summary information on the overall financial benefits and carbon savings that couldpotentially be generated by both PV and solar thermal systems in the area.

22 Report to Taunton Transition Town by Centre for Sustainable Energy
The potential for solar energy generation and the benefits to thecommunity
In Taunton the majority of properties were found to be suitable for some form of solar technology. Thepotential for generating energy, money and carbon savings in Taunton via solar power is summarised in thetables below.
(tonnes)
Yield (kWh) across area adjusted for shade (25 years) 1,420,710,825
Sum of total CO2 savings (tonnes) across area (25 years) 542,928
Average financial benefit per household (25 years) £16,250
Average financial benefit across area (25 years) £404,462,500
Average payback (years) 11.77
Average kg CO2 saved per £1 spent on system 2.9
Table 2: Solar photovoltaic figures and savings if all available roof space used forsolar PV systems
Number of addresses
Suitable addresses (sufficient roof space, reasonable pitch and orientation) 24,890
Unsuitable addresses (insufficient roof space, inappropriate pitch and orientation) 1,359
Total number of properties* 26,249
Table 1: Overall suitable roof space for solar systems
Yield (kWh) across area (20 years) 463,931,660
Sum of total CO2 savings (tonnes) across area (20 years) 96,622
Average financial benefit per household (20 years) £2,660
Average financial benefit across area (20 years) £66,207,400
Average payback (years) 27
Average kg CO2 saved per £ spent on system 1.08
Table 3: Solar thermal figures and savings if all available roof space used forsolar thermal systems
Note that for solar thermal systems the average payback exceeds the expected life-span (20 years) of the system. This is inpart due to the conservative estimates of savings applied in the study. Many households that are off gas will find that thepayback period is in fact shorter than the lifespan of the system and will make a financial return on the investment.
* Some properties have more than one suitable roof space. Where this is the case, they have been counted twice.
Report to Taunton Transition Town by Centre for Sustainable Energy 23
Deciding between solar PV or solar thermal panels will depend greatly on the circumstances of ahousehold. A property which is situated in an off-gas area may find that the payback time of a solarthermal system is quicker than that of a solar PV system as their heating costs are likely to be higher thanthose of an on-gas property. Therefore a system which reduces the cost of heating hot water will makemore difference to energy bills than a PV array which will be producing electricity. This is the case evenwhere a property is heated by electricity as the main heat demand will be during the evening in winterwhen a PV array will not be producing much, if any, electricity. Heating hot water with an immersion tank(using electricity) is very costly so a solar thermal system is likely to lead to greater savings than a PV system.
If lowering fuel bills is the biggest motivation of a household, it’s worth taking into account that ahousehold where people are at home during the day would find it easier to make use of the free electricityfrom a solar PV system than a household in which no one is at home during the day.
Financial support for solar systems
The Feed-in Tariff is a payment incentive to encourage people to invest in systems which generate electricityfrom renewable technologies. Solar PV panels are eligible for the Feed-in Tariff. The owner of the systemreceives a payment not only for any unused electricity (which is fed back into the National Electricity Grid),but also for every unit of electricity generated, whether or not it’s used within the household. From the 1stof April 2012 the level of tariff paid on new installations will be dependent on the Energy PerformanceCertificate rating of a property (which takes into account energy efficiency measures such as cavity wall andloft insulation) in order to show that a household’s energy demand has been minimised prior to installingsolar panels. Visit www.decc.gov.uk/fits for the most up to date information on the Feed-in Tariff.
The Renewable Heat Incentive is a payment scheme designed to encourage people to invest in systemswhich generate heat from renewable technologies. Solar thermal panels are eligible for the scheme. Theowner of the system receives an annual payment reflecting the amount of heat that has been generated byit. Details have not been finalised yet for Phase 2 of this scheme (which covers domestic properties and isdue to launch in Autumn 2012), but it is likely that energy efficiency measures such as loft and cavity wallinsulation will need to have been installed in the property where appropriate, in order to minimise its heatdemand, for the system owner to be eligible for the payments. See the Centre for Sustainable EnergyBeginner’s guide to the Renewable Heat Incentive to learn more about the scheme (www.cse.org.uk/rhi)visit www.decc.gov.uk/rhi for the most up to date information on the scheme.
Next steps
For both PV and solar thermal systems, it may be that buying in bulk (e.g. for a whole street or even acrossa whole community) will result in a significant discount on the cost of the panels, which may be relevant toa street where a few neighbours are looking to install solar systems, or to a community group looking toinstall renewable energy systems in a number of locations. If the latter community bulk buy scheme issomething that Taunton is going to investigate as a viable project it is very important that adequatecommunity consultation is undertaken to ensure that the community as a whole will support and accessthis sort of scheme. For more information on carrying out community consultation see the Plan LoCalresources here: www.planlocal.org.uk. The main solar report highlights the most promising areas tobegin investigating for a bulk buy solar scheme.

24 Report to Taunton Transition Town by Centre for Sustainable Energy
Phot
o: C
arla
Fin
ley
(rep
rodu
ced
unde
r cr
eativ
e co
mm
ons)

Report to Taunton Transition Town by Centre for Sustainable Energy 25
4 | A summary of biomass energypotential in Taunton
This is a summary of the Biomass Resource Assessment carried out for Taunton
Transition Town in February 2012 by the Centre for Sustainable Energy.
The assessment sought to identify the potential for sourcing and growing woodfuel and
energy crops in and around the local area. This includes fuelstock sourced both from
woodland and from energy crops grown on agricultural land, specifically miscanthus (also
known as elephant grass) and short rotation coppice (SRC).
The study included the mapping of the area to pinpoint promising pieces of woodland
and farmland. It also identifed the owners of key aforested areas and looked at the
transportation issues that would arise from exploiting this resource.
CSE has extensive experience in resource mapping and data analysis of low carbon
technologies to develop a policy evidence base for regions and specific sites. Past projects
include assessment of energy crops (including woodfuel and miscanthus) for Bristol,
Devon, Dorset and West Sussex. Our biomass assessments also link to our mapping of
heat demand assessment (e.g. the national heat map we have created for DECC).
26 Report to Taunton Transition Town by Centre for Sustainable Energy
Introduction to biomass
Biomass is organic material that can be used as an energy source. In an energy context, ‘biomass’ refers toburnable material derived from wood or other plants. As long as the overall system from which biomassfuels are extracted is managed sustainably, they are considered to be renewable because the amount ofcarbon dioxide emitted when they are burnt is re-captured by the fresh growth of new crops or trees.
Biomass is commonly used to refer to two different forms of fuel – woodland residues and energy crops.By-products and waste products such as sawdust or wood chippings from saw-mills or wheat straw fromfarms can sometimes also be used to provide a source of biomass fuel.
• Woodland residues are woodfuel products from the management of existing woodlands (or streettrees in urban areas).
• Energy crops are dedicated fast-growing ‘woody’ crops or tall grasses that are grown specifically to beused for fuel.
Biomass fuels can be used as a ‘raw’, unprocessed product (e.g. wood logs or miscanthus straw), or can gothrough different levels of processing to make a fuel product that can be transported or burned more easilyand efficiently (e.g. woodchip, wood pellets, sawdust or briquettes).
Logs Woodchips Wood pelletsPh
otos
, L t
o R:
Tim
Wei
ssel
berg
, jak
erom
e, K
evin
Lin
dega
ard

Report to Taunton Transition Town by Centre for Sustainable Energy 27
An overview of the biomass energy chain from crop to heat
In the UK some power stations burn large volumes of biomass to generate electricity for the national gridvia a technology known as a combined heat and power plant (CHP). At the other end of the scale, biomassis also used to provide heat in domestic housing using open fires, wood stoves or boilers supplied by woodpellets or chips. In between are medium scale biomass systems such as those used to heat community hallsor small businesses, or to heat and supply hot water to several different buildings that share a districtheating system.
A biomass-fuelled CHP plant in inAmel, Belgium
A medium-scale boiler suitable for acommunity building or school
Domestic stove/boiler
Phot
os L
to
R: ©
MW
Pow
er; C
SE, u
nkno
wn
28 Report to Taunton Transition Town by Centre for Sustainable Energy
Part 1: Woodland potential within Taunton
Key points
• The immediate Taunton area contains 180 hectares of woodland, of which 64 hectares arebroadleaved, 23 hectares are coniferous, and 87 hectares are unspecified in nature. The woodland isconcentrated in a few medium sized areas of different forest types.
• Within a 20km radius of the border of Taunton there is a much larger total woodland area of nearly13,200 hectares.
Phot
o: T
im W
eiss
elbe
rg
Sustainable woodland management
Woodfuel can be produced from a managed forest in quite large quantities and with predictable regularity,without affecting the overall sustainability or appearance of the forest. Creating a demand for woodfuellocally can actually result in better forest management in the local area as it encourages timely thinning andthe removal of diseased and damaged trees and branches.
At a very basic level, removing timber at a rate that is not replaced by planting or natural regeneration isessentially an unsustainable form of woodland management. But sustainable woodland management ismore than just a basic equation of timber removed versus timber planted and growing. Other issues thatneed to be taken into account include the overall species richness and diversity of plant, animal andinvertebrate species present, management of extraction processes to prevent soil damage andsedimentation of water courses, and management of public access arrangements. Taking these factors intoaccount means that any sustainable management plan will differ greatly from forest to forest.

Report to Taunton Transition Town by Centre for Sustainable Energy 29
Typical yield factors for managed woodlands
Type Yield: tonnes per hectare at 30% moisture
Broadleaved 1.93
Coniferous 6.43
Coppice 3.86
Coppice with standards 3.86
Mixed 3.86
NFI dataset 3.86
Methodology
Two Forestry Commission datasets were used to analyse the potential for woodfuel within the local area.The National Inventory of Woodland and Trees (NIWT) is produced by using satellite images to identify andclassify areas of woodland. It classifies areas of woodland into the following categories:
• Broadleaved
• Coniferous
• Coppice
• Coppice with standards
• Mixed
• Shrub
• Young trees
• Felled
• Ground prepared for planting
This was supplemented by the National Forest Inventory data, which identifies potential areas of woodlandbut does not classify them by type.
The available resource from the sustainable management of woodland was calculated by using assumptionsabout the sustainable yield that can be obtained based on the size and type of woodland present. Theanalysis uses the following sustainable yield factors for tonnes of wood per hectare at 30% moisture:
30 Report to Taunton Transition Town by Centre for Sustainable Energy
Woodland within the Taunton area based on woodland type
Table 1: Areas of woodland within the study area, by type
Type Area (hectares) Yield factor Total potential yieldper ha/per year (tonnes)
Broadleaved 64 1.93 124
Coniferous 23 6.43 148
Felled 4 n/a n/a
Mixed 0 3.86 0
Shrub 0 n/a n/a
Young trees 3 n/a n/a
Woodland (not specified) 87 3.86 336
Total 180 608
The table below summarises how the woodland in Taunton is split between different types.
Taking the total potential yield of 608 tonnes per year and using some assumptions about averageconsumption means it is possible to calculate the number of domestic biomass boilers or stoves that couldbe provided for using woodfuel from within the local area. One tonne of wood (at 30% moisture content)produces approximately 3,500 kWh heat energy, and 5 tonnes of wood per year are roughly required tofuel a domestic biomass boiler in a 3-4 bedroom house of average efficiency. This means that the total yieldfigure from within Taunton would be enough to supply a maximum of 133 homes, assuming no timber isused for other uses.
The geographical spread of woodlands is shown below.

Report to Taunton Transition Town by Centre for Sustainable Energy 31
Woodland within a 20km radius of the study area, with the ten most promisingareas circled
Woodland potential in a 20km radius of the local area
To identify the largest areas of woodland with potential for providing fuel for biomass boilers and stoves inTaunton, the analysis was expanded to an area with a radius of 20km outside of the immediate study area– a distance within which biomass cultivation and transportation is still assumed to be sustainable.
Within a 20km radius of the border of Taunton there is a total woodland area of nearly 13,200 hectares.This is mostly small patches of mixed and coniferous woodland lying along hedgerows and shelterbeltsmany of which appear to be narrow areas bordering streams and roads and are likely to be unmanagedpatches.
Ten areas of woodland were identified which look promising for further investigation within this boundary.They could provide a total potential yield of around 12,567 tonnes per year from 2,769 hectares, whichcould provide around 44 GWh of heat energy annually, enough for 2,749 homes.
The promising areas of woodland are circled on the map below. The woodlands appear to be a mixture ofpublic and private ownership and there may be an opportunity to supply a biomass project from thesewoodlands, but contact needs to be made with the landowners to ascertain to what end uses any timber iscurrently put, whether there are plans to utilise it locally, and what potential there is to create long-termsupply contracts.

32 Report to Taunton Transition Town by Centre for Sustainable Energy
Miscanthus grassShort rotation coppice willow
Part 2: Biomass from energy crops
Key points
• In Taunton there are 2,806 hectares of land of a suitable agricultural grade to theoretically grow ShortRotation Coppice and/or Miscanthus crops.
• If all 2,806 hectares were cultivated for energy crops, the yield would be between 28,060 to 42,090oven-dried tonnes of crop fuel annually, depending on the mixture of SRC and Miscanthus cropsgrown. This is enough to fuel between 8,768-13,153 domestic biomass boilers.
• As much of this land is likely already under cultivation, a more realistic assumption of 5% of the landbeing used for energy crops would yield 1,403 – 2,105 tonnes on 140 hectares, enough to fuel 438 -657 homes with domestic biomass boilers.
• If 1% of the land was used, this could fuel 87 - 131 domestic boilers.
Energy crops are biomass fuels produced on agricultural land. Whereas woodfuel sourced from forestryoperations tends to take a long time to grow, energy crops are managed as dedicated agricultural cropsand have faster growing periods. Planting energy crops is beneficial as they can bring undermanaged landinto management, create local employment and support the rural economy.
Short rotation coppice and miscanthus are likely to be the most suitable energy crops for community scalebiomass schemes and are also the energy crops that currently attract grants, therefore these are the twocrops which are analysed for potential local production.
Short rotation coppice (SRC) is where densely planted, high yielding tree species (willow and occasionallypoplar) are planted closely as stem cuttings and harvested every three years. The rootstock or stool is left inthe ground and after each harvest new shoots emerge (similar to a traditional woodland coppice). SRCplantations should be viable for up to 30 years before they need to be replanted.
Miscanthus, or elephant grass, refers to a set of 15 species of perennial grasses which originated insouth east Asia and were initially imported to Europe as an ornamental plant. Miscanthus is now grown inmonocultures as an energy crop. It grows to 3-4 m in height in one season so the woody stems and leavescan be harvested annually. It is a perennial plant that is propagated by underground rhizomes with anestimated productive life of about 15 years. Miscanthus is not a suitable crop to be grown within areas thatfrequently experience high wind speeds.
Both
pic
ture
s: C
SE

Report to Taunton Transition Town by Centre for Sustainable Energy 33
As with most crops, energy crops produce their best yields on the best land. Yield is usually measured inodt/ha/yr (oven dry tonnes per hectare per year). Each hectare planted with a crop will yield a certaintonnage of wood fuel annually. Multiplying the land area available by this yield factor gives a total yield forthe land area.
Yield can vary depending on land and weather conditions, but typical yield factors for miscanthus and SRCare shown in the table below:
Typical yield factors for energy miscanthus and shortrotation coppice
Crop Yield (oven-dried tonnes per hectare)
Miscanthus 15
Short rotation coppice 10
Methodology
The total technical potential resource for energy crops was assessed by looking at the total amount ofsuitable agricultural land within the study area. Suitable land is land classified as grades 1-3 arable land bythe Department for the Environment, Food and Rural affairs (DEFRA), and this land was mapped andanalysed within the local area.
Constraints were applied to exclude areas of agricultural land where energy crops are unlikely to be grown.These include:
• Windy areas: Miscanthus does not grow well in exposed areas, which for the purposes of this resourceassessment are defined as areas where the wind speed is above 7 meters per second at 10m aboveground level.
• Protected land and woodland such as lowland heathland, upland heathland, lowland meadows,coastal and floodplain grazing marsh, lowland dry acid grassland, lowland calcareous grassland,ancient woodland.
• Heritage sites
• Parks and Gardens
• Areas of housing
Potential for energy crops in the local area
No areas were found with wind speeds too high for the cultivation of Miscanthus. The area of agriculturalland of suitable grade for the growth of energy crops is represented on the map overleaf.

34 Report to Taunton Transition Town by Centre for Sustainable Energy
Areas of suitable agricultural land in Taunton for energy crop cultivation
As most agricultural land will currently be in use, either for other crops or as set-aside, the establishment ofenergy crops would require farmers to make a decision to switch to energy crops from whatever they arecurrently growing on their land. It is unlikely that a large proportion of the agricultural land wouldimmediately be switched to energy crops, at least in the short to medium term, and so small percentages ofthe land are used as examples to give a more realistic assessment of energy crop potential.
The table below shows expected yields and the number of domestic biomass boilers that could besupported if energy crops were grown on specific proportions of the suitable land. The total energypotential figures are based on the biomass having a moisture content of 0% which would mean 5,000kWhof heat energy could be produced per tonne of fuel.
It is also important to consider additional factors when thinking about planting energy crops. These includewhether there is sufficient water available in the area and what the potential (positive and negative)impacts will be on local biodiversity and protected landscapes
Percentage of Hectares Yield (oven-dried tonnes) Total energy (MWh) Number of domestic available land boilers
Miscanthus SRC Miscanthus SRC Miscanthus SRC
100% 2,806 42,090 28,060 210,450 140,300 13,153 8,768
5% 140 2,105 1,403 10,523 7,015 657 438
2% 56 842 561 4,209 2,806 263 175
1% 28 421 281 2,105 1,403 131 87
Energy crop production under different land utilisation scenarios

Report to Taunton Transition Town by Centre for Sustainable Energy 35
Applying these results
Large scale biomass systems
The analysis of potential for district heating, presented separately, has identified an area in the centre ofTaunton within which opportunities for district heating are most likely to be found, which means that adistrict heating system using a proportion of locally sourced biomass could be feasible in the area. The heatdemand of this area is approximately 67.7 GWh annually, but only a small proportion of the heat loads inthis area will be suitable for connection to district heating; further investigation is needed to see if thisproject could be viable.
Small scale biomass projects
The woodland resource within the area is characterised by a mixture of broadleaf and coniferous forestconcentrated in the rural areas outside of the immediate Taunton area. It is likely that the larger areas ofwoodland identified in the area are already under active management.
There are 10 areas of woodland identified in the local area, which among them offer a theoretical yield ofaround 12,567 tonnes per annum, which could be enough to provide fuel for around 2,500 homes (if 5tonnes per annum is taken as a rough rule of thumb for woodchip demand for a 3-4 bedroom house ofaverage efficiency). This could potentially be enough woodfuel to go forward with a community biomassprogram that involves bulk-purchasing domestic boilers for individual homes, or using the local woodresource to fuel a set of biomass boilers to heat community buildings.
Domestic–scale biomass boilers and room stoves are more economically viable in off-gas areas, so a goodplace to begin is by surveying home owners in those areas to get an understanding of any concerns abouthigh heating costs and their likely attitude to participating in a bulk-purchase scheme for biomass boilers.
It is also possible that farmers within the wider area surrounding Taunton may wish to consider plantingenergy crops on their land, and our estimates show that if 5% of suitable land within the area weredevoted to the production of energy crops, between 438-657 homes could be heated by the volume offuel produced.
Next steps
• Assess energy demand (e.g. who has / is planning to install a wood burner or biomass boiler) via acommunity wide survey, concentrating on any off-gas areas where biomass boilers will be moreeconomical.
• Contact local forest owners and farmers to ascertain interest in selling existing timber as woodfuel,managing previously un-managed woodland to produce woodfuel, or using a small percentage ofagricultural land for energy crop production.
• Run a community consultation to ascertain broader interest in, and potential for:
Local woodland management
Purchasing or leasing land for energy crops
Local purchase agreements for woodfuel
Bulk purchase of boilers & stoves
Construction of any centralised storage or distribution of fuel within the town

36 Report to Taunton Transition Town by Centre for Sustainable Energy
Phot
o: V
elo
Stev
e (r
epro
duce
d un
der
crea
tive
com
mon
s)
Report to Taunton Transition Town by Centre for Sustainable Energy 37
4 | A summary of local heat demandmodelling in Taunton
This is a summary of the local heat demand modelling carried out for Taunton
Transition Town in February 2012 by the Centre for Sustainable Energy.
In this assessment, low-carbon heat supply analysis was undertaken using CSE’s
bespoke national heat map, which identified the potential for low-carbon heating
(including district heating etc), and assessed the overall heat demand for a the
area being surveyed.
CSE is a leading expert in heat demand assessment, using address-level data and
GIS mapping. We have developed the national heat map for DECC, as well as local
and regional mapping for London, the South West, East Midlands and others.

38 Report to Taunton Transition Town by Centre for Sustainable Energy
Methodology
The Centre for Sustainable Energy (CSE) has produced the National Heat Map for the Department of Energyand Climate Change. Behind the heat map is a database of modelled heat demand for every address in thecountry (and actual heat demand for buildings which have Display Energy Certificates). This enables usersto locate and investigate areas of high heat demand which may be suitable for district heating. TheNational Heat Map was used to provide modelled data on the heat demand of Taunton with a view to lookinto the suitability of a district heating system for the area.
A district heating system is typically made up of an energy centre connected to a buried network ofinsulated pipes which feed a series of heat exchangers (with heat meters) in the individual buildings whichare being supplied with heat. The energy centre may generate heat only, or it may be a combined heat andpower (CHP) plant. Some district heating systems also include cooling.
District heating can range in scale from a biomass boiler supplying a few homes, to schemes serving entirecity centres. A wide variety of heat sources can be used including; gas boilers, biomass boilers, CHP systemsor waste heat from power stations.
Analysis
The purpose of this report is to analyse heat demand in the Taunton Transition Town area and identify anarea or areas which would be most suitable for district heating and could be investigated further. At thislevel of analysis, it is not possible to give a definitive conclusion as to whether district heating would befeasible in the areas identified, and it is important that the results are not interpreted in this way.
The first step in the analysis was to create a heat demand density map of the whole of the TauntonTransition Town area and this is shown below.
Heat density map for Taunton

Report to Taunton Transition Town by Centre for Sustainable Energy 39
From this wider Taunton area it was necessary to find an area to carry out more in depth analysis. Thepriority area was identified by finding areas which satisfied three conditions relating to the overall heatdemand, the presence of potential anchor loads (buildings that have a relatively high and stable heatdemand) and groups of dwellings with high heat demand. These three conditions are defined morespecifically as the following:
• Areas must be within the 10% of land area with the highest heat demand density.
• Areas must be within 250m of residential buildings with an annual heat demand of more than100,000kWh per year (these could in theory be single dwellings but in practice only blocks of flatstend to have heat demand this high).
• Areas must be within 250m of potential anchor loads. Anchor loads are defined as the following typesof buildings, which are likely to have relatively high and stable heat demands and/or be in sectorsmore likely to participate in heat distribution projects. These categories of building from the NationalHeat Map are likely to be suitable anchor loads:
Hotels
Health (hospitals, health centres, etc)
Education (schools, colleges)
Government buildings (e.g. local authority offices)
Public buildings (buildings with a floor area of over 1,000m2 that are occupied, in part or in whole, bypublic authorities or institutions providing public services, which are frequently visited by the public andmust therefore have a Display Energy Certificate. This includes local authority-owned leisure centres).
By taking all three conditions into account an area around the centre of the city was identified as suitablefor further investigation and this area is shown below.
Map of heat demand from non-residential buildings and large domestic blocks,with potential anchor loads and large residential blocks shown

40 Report to Polperro United Renewable Energy by Centre for Sustainable Energy
The priority area in Taunton is quite large and the initial analysis of this area resulted in the following keypoints regarding heat demand and suitability for district heating in the area:
• Covers an area of 72 hectares.
• Total annual modelled heat demand of 67.7GWh.
• Contains over 1,000 business premises and around 1,500 dwellings.
• Average heat density of 94kWh per m2 per year.
To find the best places for district heating we have taken heat demand from non-residential sources andlarge domestic blocks only, and created a density map which is shown in Figure 2. By focussing on the areaswith the highest 10% of heat demand it has been possible to narrow down the analysis further to identifypotential anchor loads in these parts of the western half of the priority area:
• Around County Hall to the south west there are several large public sector heat loads and some largecommercial buildings.
• The central area around the library contains some of the town centre's largest shops.
• The north Taunton swimming pool and The Deane House, the main borough council offices.
There are large residential blocks scattered throughout the priority area, but there are several which areclose to the identified potential anchor loads, in particular Ladysmith House, Hunts Court, Vivary Gate,Wessex House, and Belvedere Gardens.
Some of the public sector buildings are likely be rented rather than owned by the organisation whichoccupies them. This means that involving them in a district heating system would require the cooperationof both the tenant (the public sector organisation) and the landlord. Often the landlord is not interested inthis as they will bear the cost of the capital works while the tenant gets the benefit of cheaper heating. Thislandlord / tenant issue is very common and also applies to most commercial sector properties. Howevernone of the buildings should be discounted until the individual situation has been ascertained.
Next steps
The purpose of this study has been to use the National Heat Map to search the Taunton area for the mostpromising locations for a district heating system. These areas must be investigated in more detail in order tomore strongly define areas and identify further participants. It is not suggested that all buildings in thepriority area would be connected to a district heating system. This area could be searched further to findcandidate buildings.
Linear heat density is unlikely to be sufficiently high to support a district heating system throughout thewhole priority area. However, smaller systems could be established in different parts of the priority area andit may be feasible to join these systems up at a later stage.
The National Heat Map provides modelled data which is based on the building type and usage. To gofurther, actual data must be gathered from the building owners about annual consumption and loadprofiles (level of consumption at different times of the day, week or year).
Following that, a pre-feasibility assessment needs to be made of whether, with the actual heat demand andload profile of the buildings which could participate, a pipe network could be designed with high enoughlinear heat density to make a system economically viable.