summary of ensr report findings & recommendations€¦ · analysis of prior studies, ... alum,...
TRANSCRIPT

Summary of ENSR Report Findings & Recommendations
Robert P. Hart, January 18, 2007

22
Presentation Contents
Overall ENSR Program 2001 to 20052001/2002 Study Year/Report2002/2003 Study Year/Report2003/2004 Study Year/Report2004/2005 Study Year/Report2005/2006 Study Year/Presentation
33
Overall ENSR Program 2001 to 2005
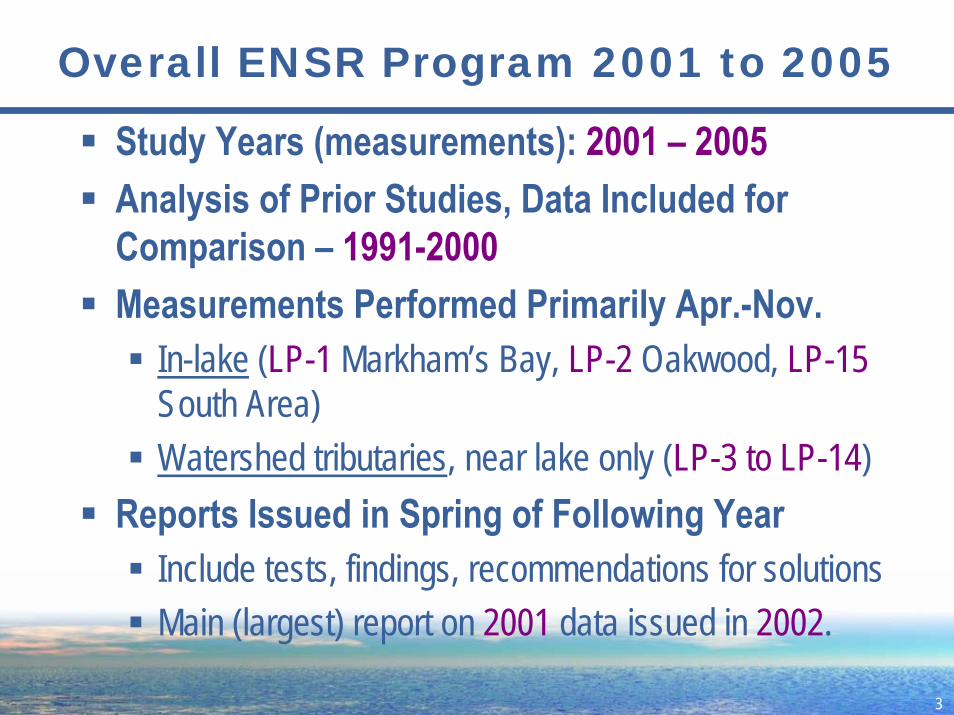
Study Years (measurements): 2001 – 2005Analysis of Prior Studies, Data Included for Comparison – 1991-2000Measurements Performed Primarily Apr.-Nov.
In-lake (LP-1 Markham’s Bay, LP-2 Oakwood, LP-15South Area)Watershed tributaries, near lake only (LP-3 to LP-14)
Reports Issued in Spring of Following YearInclude tests, findings, recommendations for solutionsMain (largest) report on 2001 data issued in 2002.

44

55
Presentation Contents
Overall ENSR Program 2001 to 20052001/2002 Study Year/Report2002/2003 Study Year/Report2003/2004 Study Year/Report2004/2005 Study Year/Report2005/2006 Study Year/Presentation

66
2001 Study Year Prior Studies
Analysis of Prior StudiesFrink and Norvell (1984) – Covers 1973-74, 1979-80
Total Phosphorous (TP) – 21 μg/L (73-74), 25 μg/L (79-80)Secchi Disk Transparency (SDT) – 12 feet
Fugro-McClelland (1993) – Covers 1977, 1987-931977 – Mild Anabaena bloom and small fish kill (~50 perch)1987-89 – Baker Hill Condo Dev lake pollution1988 – Diatom algae bloom (reported as “oil slick”)1990 – Severe Anabaena algae bloom late summer

77
2001 Study Year Prior Studies
Analysis of Prior Studies, continued…Fugro-McClelland (1993) – continued…
1992-93 Study – Ext. P-Loading 1263 lbs, Internal 1099 lbsRecommend Algacide, Alum, Aeration, Biomanipulation, Watershed Management as set forth by AHLAC
WMC Consulting Engineers (1995)Stormwater Renovation and Management Study - $3M+drainage systems renovations, 76 specific improvements

88
2001 Study Year Prior Studies
Analysis of Prior Studies, continued…Ad Hoc Lake Advisory Committee (AHLAC) (1995)
3 Reports“Land Use and Phosphorous Input to Lake Pocotopaug”
Models transparency from P-loading and trends from changing land use, suggests land use changesExternal P-Loading 1289 lbs/yr; Watershed 791 lbs/yr(61%); atmosphere & waterfowl 498 lbs/yr (39%)
“Taxes and Water Quality”Town tax policy encourages development; recommend watershed tax relief policy change

99
2001 Study Year Prior Studies
Analysis of Prior Studies, continued…Ad Hoc Lake Advisory Committee (AHLAC) (1995), continued…
“Lake Pocotopaug Management Recommendations”Establish a permanent Lake Advisory CommitteeReduce external nutrient and sediment inputs from watershed; reduce internal nutrient recyclingImplement land use controls to reduce inputs
1010
2001 Study Year Major Event History
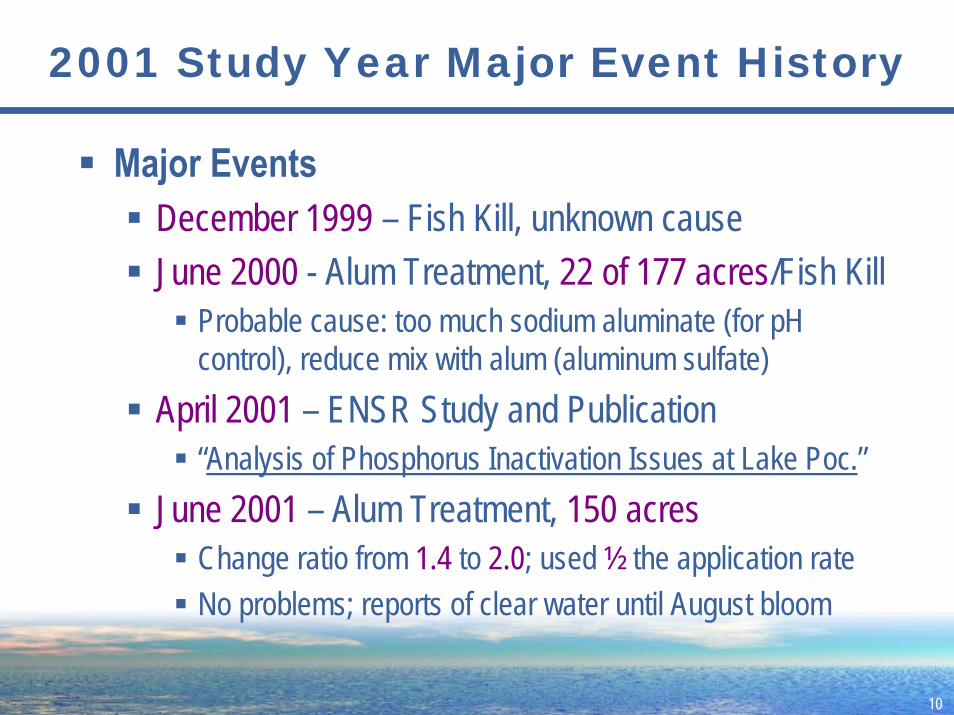
Major EventsDecember 1999 – Fish Kill, unknown causeJune 2000 - Alum Treatment, 22 of 177 acres/Fish Kill
Probable cause: too much sodium aluminate (for pH control), reduce mix with alum (aluminum sulfate)
April 2001 – ENSR Study and Publication“Analysis of Phosphorus Inactivation Issues at Lake Poc.”
June 2001 – Alum Treatment, 150 acresChange ratio from 1.4 to 2.0; used ½ the application rateNo problems; reports of clear water until August bloom

1111
2001 Study Year Major Event History
Major Events, continued…January 2002 – Fish Schooling
White & yellow perch in thousands in Christopher and Hales Brooks, shortly after ice formed; fish did not appear stressedWater sample tests (Jan. 3, 2002) showed no water problems

1212
2001 Study Year Major Event History
Major Events, continued…1992-2001 – Volunteer Lake Study Group Publications
Annual in-lake water sampling 1991-2000Minimum Secchi Disk Transparencies – 1.3 to 5.6 feetAverage Secchi Disk Transparencies - 3.9 to 9.0 feetMax. Surface Phosphorus – 18 to 36 μg/LLate Summer Bloom Duration – 4 to 13 weeks

1313
2001 Study Year System Features
Watershed & Lake FeaturesWatershed Area – 2381 acres; Lake Area – 512 acres
4.7 to 1 ratio (low)Approx. 172 acres experience summer thermal stratification
Lake Water Volume – 7.1 Million cubic metersAvg Input (all sources) – 9 Mil m3, yields 1.3/yr flushing rate
Depth Average – 11 feetDeep Spots: LP1 - Markham’s Bay (30 ft); LP2 - Oakwood (36 ft)

1414
36’
30’
21’

1515
2001 Study Year Findings
Primary 2001 FindingsIn-Lake Water Quality (see graphs)
“Lake Pocotopaug exhibits lower SDT than predicted based on TP concentrations. Either SDT is limited by non-algal turbidity and/or phytoplankton are present in moderate to high densities even with limited phosphorus availability.”
Lower SDT (water clarity) than predicted from TP levels.Either due to non-algal turbidity or unusually low nutrient requirement by algae.

1616

1717

1818
2001 Study Year Findings
Primary 2001 FindingsIn-Lake Biology - Zooplankton
Feed on algae; eaten by small fishLevels best in spring, very low in summerSizes too small to eat large filamentous algae (Anabaena)
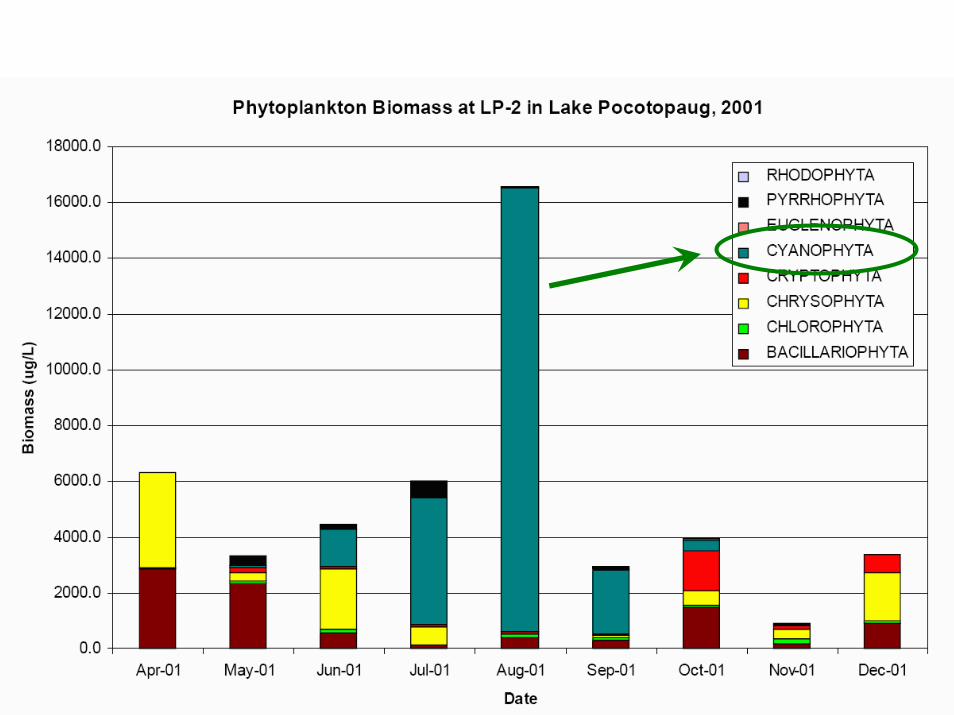
In-Lake Biology – Phytoplankton (see graph)
1919

2020
2001 Study Year Findings
Primary 2001 FindingsTributary and Storm Drain Water Quality
Some test locations show very high phosphorus levels, mostly under wet weather conditions (see tables)
LP-6 Candlewood BrookLP-9 Storm drains, end of Hawthorne and Emerson Rd.LP-10 O'Neil’s BrookLP-12 Storm drain bottom of Mohican, Wangonk TrailLP-13 Storm drainage swale, end of Park Street

2121

2222

2323

2424
2001 Study Year Findings
Primary 2001 FindingsAttempt to relate precipitation levels to problems
No significant relationship between precipitation and all measured parameters, including phosphorus and water clarity, except for chlorophyll-a during summer only.

2525
2001 Study Year Findings
Primary 2001 FindingsPhosphorus Loading Summary
Varies with weather from 620 to 1900 lbs/yrWatershed: 50 to 73%Ground water & precipitation: 9 to 17%Waterfowl: 6 to 11%Internal loading: 12 to 22%

2626
2001 Study Year Findings
Primary 2001 FindingsDiagnostic Summary
“Nutrient levels are generally low, and are typically below the level below at which algal blooms are generally found. However, Lake Pocotopaug is unusual in this regard. Algal blooms are present even under this relatively low phosphorus condition. Reducing the surface water phosphorus concentration by 60%, about the maximum it is reasonable to expect, is predicted to result in phosphorus concentrations between 7 – 11 ug/L (as opposed to the current 10-22 ug/L), a level at which blooms may still occur in Lake Pocotopaug.”
Low nutrient levels, less than normally cause blooms - Lake Pocotopaug unusual in this regardA 60% reduction of TP from 10-22 to 7-11 ug/L is still likely to allow blooms

2727
2001 Study Year Findings
Primary 2001 FindingsDiagnostic Summary, continued…
“There is no “smoking gun” in the watershed. Excessive nutrient concentrations are found in all tributaries and storm drains, although runoff from developed areas tends to provide the highest values. …the major tributaries are suspect due to the higher portion of the load they contribute.”
“There is no “smoking gun” in the watershed.”Most nutrients from developed area tributaries and storm drains, especially major tributaries

2828
2001 Study Year Findings
Primary 2001 FindingsDiagnostic Summary, continued…
“Disturbance of sediments in the shallow basin could influence whole lake water clarity, could provide nutrients to support algal growth, and should be investigated as a potential source.”
Investigate shallow basin sediment disturbance as potential nutrient source

2929
2002 Report Recommendations
ENSR 2002 Recommendations“Watershed management is the crux of controlling incoming sediment and nutrients. This should include
both source controls and transport mitigation techniques, with the objective of reducing inputs to the maximum degree possible. In-lake techniques may be necessary to abate past inputs, as with the 2001 alum treatment. Additional in-lake measures may aid achievement of the desired conditions, including additional alum treatment (if warranted by further investigation) and adjusting the fish community to foster larger and more zooplankton to more effectively graze available algae.”
Watershed management to reduce incoming sediment and nutrients using both source controls and transport mitigationIn-Lake techniques needed to abate past inputs
Additional alum treatmentWalleye stocking

3030
2002 Report Recommendations
ENSR 2002 Recommendations Management Options For Control Of Algae
18 suggested control techniques are described (but not necessarily recommended)
Physical Controls (8)Chemical Controls (6)Biological Controls (4)
3131
2002 Report Recommendations
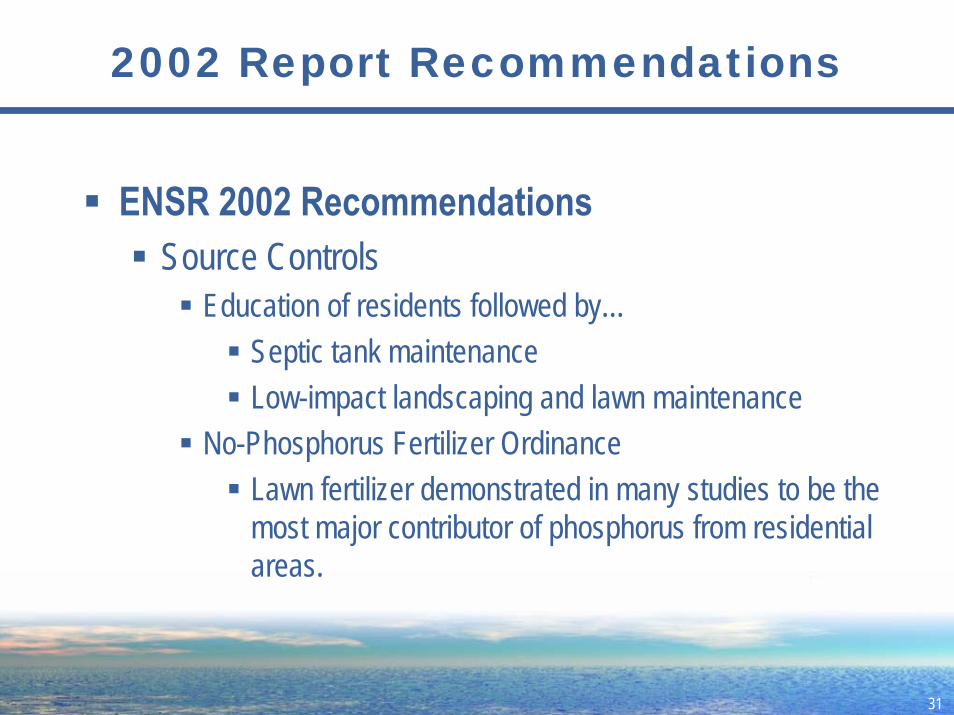
ENSR 2002 RecommendationsSource Controls
Education of residents followed by…Septic tank maintenanceLow-impact landscaping and lawn maintenance
No-Phosphorus Fertilizer OrdinanceLawn fertilizer demonstrated in many studies to be the most major contributor of phosphorus from residential areas.

3232
2002 Report Recommendations
ENSR 2002 RecommendationsTransport Mitigation
Installation of deeper, larger catch basins as roads are re-workedMaintenance of all coarse sediment and debris trapsExpansion of existing and new detention systemsUse of wetland features, establishment of infiltration chambersIncreasing frequency of street sweeping and catch basin cleaning, emphasis on early spring cleaning
3333
2002 Report Recommendations
ENSR 2002 RecommendationsIn-Lake Actions
Further alum treatment, if other untreated areas turn out to be significant sources of phosphorusMonitor zooplankton and walleye populations and sizes and if needed, continue walleye stockingContinued Monitoring Program
In-lake and watershed water qualityAlgal and fish monitoring and assaysAssociated analysis and reporting

3434
Presentation Contents
Overall ENSR Program 2001 to 20052001/2002 Study Year/Report2002/2003 Study Year/Report2003/2004 Study Year/Report2004/2005 Study Year/Report2005/2006 Study Year/Presentation

3535
2002 Study Year Tests
Test Types PerformedIn-Lake – June to September
LP2 (Oakwood), LP15 (South area)Nutrients, SDT, etc.Temperature & D.O. profilesPhytoplankton
Attempt to find onset of bloom for copper treatmentZooplankton
Laboratory Algal Assay

3636
2002 Study Year Findings
Primary 2002 FindingsIn-Lake
D.O. (dissolved oxygen) and temperature profiles track and show mild thermal stratificationNitrogen nutrients low to medium, minor differences from prior yearsTP 20 ug/L, higher than 2001, 13 ug/LSDT from 3.0 to 6.5 ft, compares to 2001 min 3.3 ft

3737
2002 Study Year Findings
Primary 2002 FindingsIn-Lake, continued…
Phytoplankton – see 2003 findings (similar)Zooplankton – see 2003 findings (similar)

3838
2002 Study Year Study Findings
Primary 2002 FindingsLaboratory Algal Assay
Algal assay with Lake Pocotopaug water to determine if algal growth could be minimized by reducing phosphorus concentrations through dilutionTotal of 40 tests – 2 water types x 5 mixtures x 4 replicatesSurface waters promoted algal (Anabaena) growth unless diluted by very large amount (>10 to 1)Bottom waters did not support algal growth, regardless of dilution

3939
2003 Report Recommendations
ENSR 2003 Recommendations“Alternatives are limited at this time.”
Alum treatment to further inactivate P in sediment - highly speculative, expensiveAeration of the bottom waters, very expensiveContinuing biomanipulation using walleye to control panfish, encourage zooplankton
Not likely to provide consistent and strong control of this algal species
“The copper treatment is therefore recommended.”
4040
Presentation Contents
Overall ENSR Program 2001 to 20052001/2002 Study Year/Report2002/2003 Study Year/Report2003/2004 Study Year/Report2004/2005 Study Year/Report2005/2006 Study Year/Presentation

4141
2003 Study Year Tests
Test Types PerformedIn-Lake – April to September
LP2 Only (Oakwood)Nutrients, SDT, etc.Temperature & D.O. profilesPhytoplankton
Attempt to find onset of bloom for copper treatmentZooplankton

4242
2003 Study Year Tests
Test Types Performed, continued…Watershed Tributaries – September
Dry weather nutrients - LP-3, 5, 10Wet (first flush) weather nutrients - LP-3, 4, 5, 10Post-wet weather nutrients - LP-3, 5, 7, 10, 11Efficacy of new Stormceptors® (2)
Lake Drive, bottom of Clark Hill & Ola Ave.

4343
2003 Study Year Findings
Primary 2003 FindingsIn-Lake
D.O. (dissolved oxygen) and temperature profiles track as expected (see graph)Nitrogen nutrients low to medium (not high)TP 24 ug/L, similar to 2002, 22 ug/L, higher than prior years (see graph)SDT from 2.8 to 8.0 ft, compares to 2002 min 3.0 ft (see graph)

4444

4545

4646

4747
2003 Study Year Findings
Primary 2003 FindingsIn-Lake, continued…
Attempt at finding onset of Anabaena bloom for copper treatment failed
4848
2003 Study Year Findings
Primary 2003 FindingsIn-Lake, continued…
PhytoplanktonSummer transition from a diatom-dominated community (good algae) to one with abundant Anabaena aphanizomenoides (bad blue-green algae)
ZooplanktonTested in April, May, June only.Present but not abundant, declined by June.Small to medium sized, no large formsWalleye having no effect yet (only 2 years)

4949
2003 Study Year Findings
Primary 2003 FindingsWatershed Tributaries
High levels of wet-weather nutrientsClark Hill storm drain worst
5050
2004 Report Recommendations
ENSR 2004 Recommendations“2004 phytoplankton sampling of the lake should proceed in an effort to determine the onset of an algal bloom.” (for copper treatment)
Lengthy discussion on copper sulfate treatment in report: why, how, good effects, adverse effects, etc.

5151
2004 Report Recommendations
ENSR 2004 Recommendations“Alternatives are limited at this time.”
Alum treatment to further inactivate P in sediment - highly speculative, expensiveAeration of the bottom waters, very expensiveContinuing biomanipulation using walleye to control panfish, encourage zooplankton
Not likely to provide consistent and strong control of this algal species
“The copper treatment is therefore recommended.”

5252
2004 Report Recommendations
ENSR 2004 Recommendations“…more attention should be paid to watershed inputs.”
Modified “first flush” effectMost external phosphorus loading occurs during peak storm periods and is likely from near-lake developed areasVery wet 2003 summer could explain lake nutrient increaseNeed to address multiple small sources entering lake to reduce earliest runoffStormceptors® may help, but may have inadequate capacity at two current locations
5353
2004 Report Recommendations
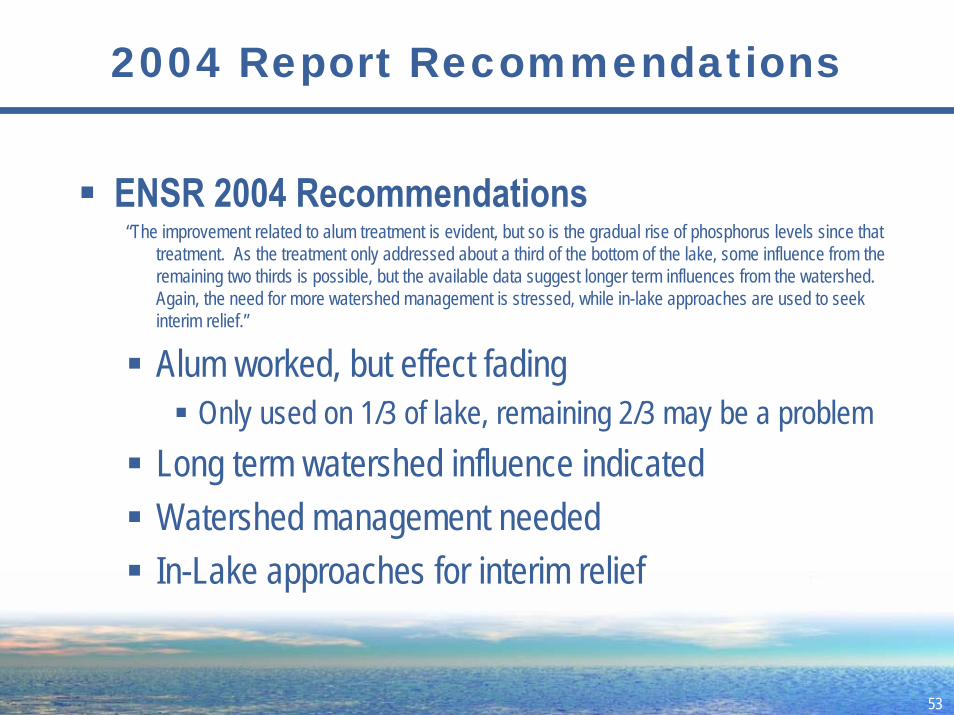
ENSR 2004 Recommendations“The improvement related to alum treatment is evident, but so is the gradual rise of phosphorus levels since that
treatment. As the treatment only addressed about a third of the bottom of the lake, some influence from the remaining two thirds is possible, but the available data suggest longer term influences from the watershed. Again, the need for more watershed management is stressed, while in-lake approaches are used to seek interim relief.”
Alum worked, but effect fadingOnly used on 1/3 of lake, remaining 2/3 may be a problem
Long term watershed influence indicatedWatershed management neededIn-Lake approaches for interim relief

5454
Presentation Contents
Overall ENSR Program 2001 to 20052001/2002 Study Year/Report2002/2003 Study Year/Report2003/2004 Study Year/Report2004/2005 Study Year/Report2005/2006 Study Year/Presentation
5555
2004 Study Year Tests
Test Types PerformedSimilar to 2003

5656
2004 Study Year Findings
Primary 2004 FindingsIn-Lake – Similar to 2003
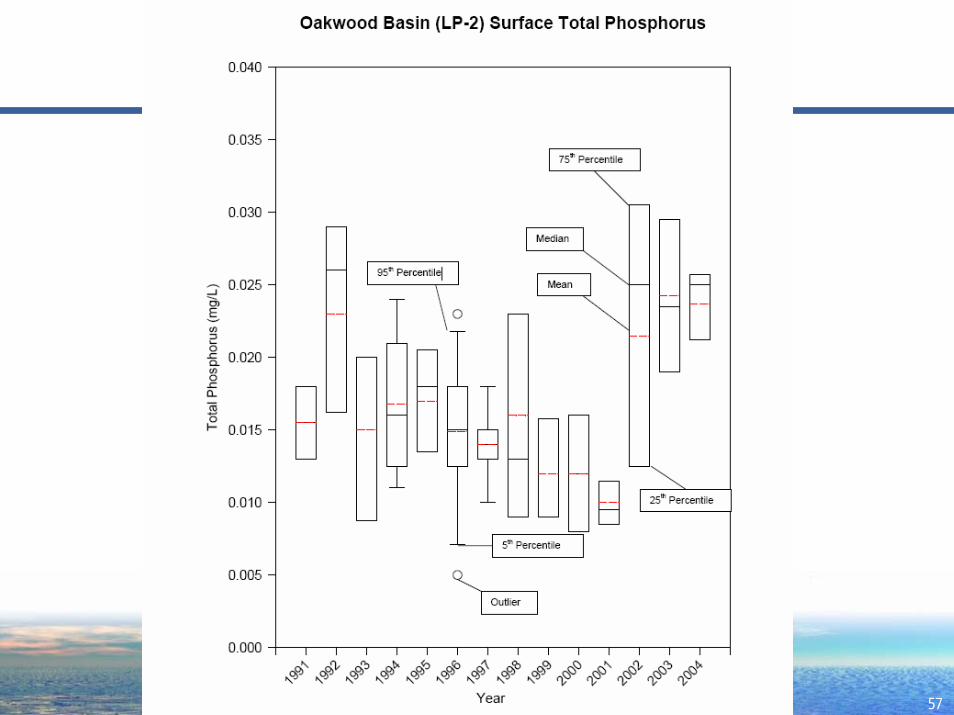
D.O. (dissolved oxygen) and temperature profiles track as expectedNitrogen nutrients low to medium (not high)TP 24 ug/L, same as 2003, similar to 2002, 22 ug/L, higher than prior years (see graph)SDT from 2.5 to 9.5 ft, compares to 2003 min 2.8 ft (see graph)
5757

5858

5959
2004 Study Year Findings
Primary 2004 FindingsIn-Lake – Similar to 2003
PhytoplanktonSimilar slow transition from diatoms to cyanophytes during summerAgain, could not identify start of Anabaena bloom for application of copper treatment
ZooplanktonGenerally low levels, small size for a New England lake, but some larger sizes were present compared to 2003
Walleye, getting larger, may be having an effect

6060
2004 Study Year Findings
Primary 2004 FindingsIn-Lake, continued…
Stable, relatively low nitrogen levels; phosphorus limits algal growth
Favors nitrogen-fixing cyanophytes like AnabaenaNo long term water clarity trend, except possibly in August, getting worse from 1990’s to early 2000’s
“Internal loading of phosphorus was strongly curtailed by the 2001 alum treatment, but has increased back to pre-treatment levels since (although the 2004 values were among the lowest observed).”
2001 alum treatment worked, now back to pre-treat P levelsHowever, 2004 P levels among lowest observed!?

6161
2004 Study Year Findings
Primary 2004 FindingsWatershed Tributaries – Similar to 2003
High levels of wet-weather nutrientsLoading due primarily to nearby lawn fertilizer, impervious surface pollutants
Clark Hill storm drain worst but all tributaries contribute to loadingWeather dependent - inputs low during dry years

6262
2005 Report Recommendations
ENSR 2005 RecommendationsSimilar to 2004 – Pay attention to the nearby watershed inputs, lawn fertilizer, etc.
Reduce first flush nutrient loading by 50%Concern that alum effect is wearing off in bottom sediments of deep areas

6363
2005 Report Recommendations
ENSR 2005 RecommendationsInterim in-lake measures are needed
Alum treatment - costlyIncreasing oxygen levels in the bottom waters of deep areas (172 acres)Mixing of surface waters – whole lake surface
Recommends limited SolarBee trialUse of algaecides
GreenClean alternative to copper – expensive (10x)

6464
2005 Report Recommendations
ENSR 2005 RecommendationsContinued Testing

6565
Presentation Contents
Overall ENSR Program 2001 to 20052001/2002 Study Year/Report2002/2003 Study Year/Report2003/2004 Study Year/Report2004/2005 Study Year/Report2005/2006 Study Year/Presentation

6666
2005 Tests & Studies
Slide Presentation Only (no report)Tests
Upstream/downstream storm water assessmentDetailed results not shown
DatabaseAssimilation of historical data into database
AnalyticalExternal loading estimations…
6767
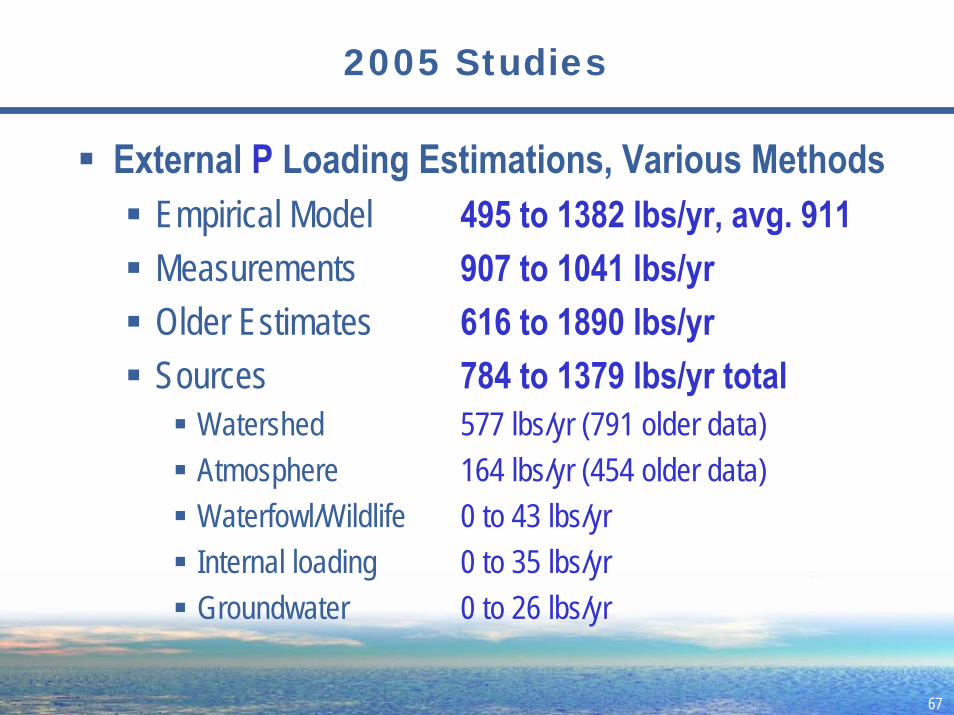
2005 Studies
External P Loading Estimations, Various MethodsEmpirical Model 495 to 1382 lbs/yr, avg. 911Measurements 907 to 1041 lbs/yrOlder Estimates 616 to 1890 lbs/yrSources 784 to 1379 lbs/yr total
Watershed 577 lbs/yr (791 older data)Atmosphere 164 lbs/yr (454 older data)Waterfowl/Wildlife 0 to 43 lbs/yrInternal loading 0 to 35 lbs/yrGroundwater 0 to 26 lbs/yr

6868
2006 Recommendations
ENSR 2006 RecommendationsRecommend 10 ug/L TP In-Lake Surface Waters Concentration
Best possible targetBut…level at which blooms have occurred in the past and may still occur in the future.
To Reach Target, Models Say External P Loading Must Be Reduced as Follows…
6969
2006 Recommendations
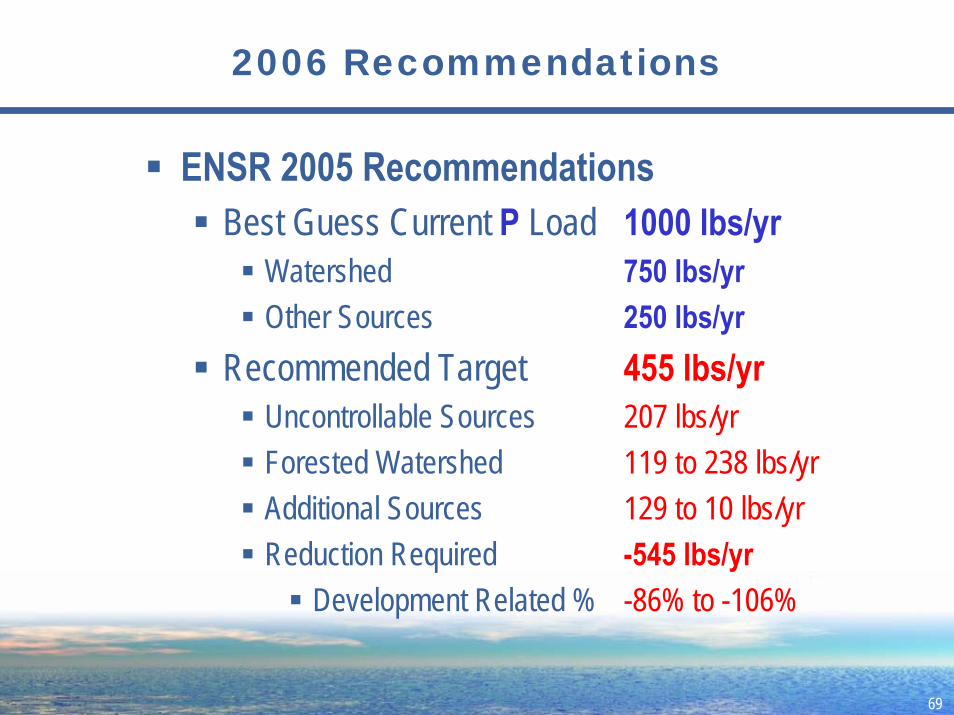
ENSR 2005 RecommendationsBest Guess Current P Load 1000 lbs/yr
Watershed 750 lbs/yrOther Sources 250 lbs/yr
Recommended Target 455 lbs/yrUncontrollable Sources 207 lbs/yrForested Watershed 119 to 238 lbs/yrAdditional Sources 129 to 10 lbs/yrReduction Required -545 lbs/yr
Development Related % -86% to -106%

7070
Summary of ENSR Report Findings & Recommendations
End