summary - dyna-mac holdings limited
TRANSCRIPT

2/24/2015
1
Fourth Quarter and Full Year2014Financial Results
24 February 2015
2/24/2015
Introduction
Financial Highlights & Review
Business Review
Market Outlook
Positioning for Sustainable Growth
Summary
Scope of Briefing

2/24/2015
2
Revenue 4.6% to $62.9m 18.3% to $318.6m
Net Profit 63.7% to $ 3.8m 14.4% to $ 26.2m
Operating Profit 57.5% to $ 4.8m 12.8% to $ 31.3m
Gross Profit 13.0% to $19.7m 9.1% to $ 71.9m
Pre-tax Profit 63.2% to $ 4.1m 17.1% to $ 29.5m
EPS 56.2% to 0.39cts 13.6% to 2.42cts
EBITDA 21.5% to $10.6m 4.3% to $ 46.0m
Dividend (first &final) 25.0% to 1.5cts
4Q 2014 & FY 2014 Financial Highlights
4Q 2014 FY 2014
Year 4Q 4Q % FY FY %
Description ($m) 2014 2013 Change 2014 2013 Change
Revenue 62.9 65.9 ( 4.6) 318.6 269.4 18.3
Gross Profit 19.7 17.5 13.0 71.9 65.9 9.1
EBITDA 10.6 13.5 (21.5) 46.0 44.1 4.3
Operating Profit 4.8 11.3 (57.5) 31.3 35.9 (12.8)
Pre-tax Profit 4.1 11.2 (63.2) 29.5 35.6 (17.1)
Net Profit 3.8 10.5 (63.7) 26.2 30.7 (14.4)
EPS, basic (cents) 0.39 0.89 (56.2) 2.42 2.80 (13.6)
NAV (cents) 19.58 19.01 3.0 15.74 14.23 10.6
Financial Highlights

2/24/2015
3
23.5
60.178.9
57.8
76.6
97.4
59.8
66.8
79.4
74.2
65.9
62.9
118.6
0
20
40
60
80
100
120
140
160
180
200
220
240
260
280
300
320
2011 2012 2013 2014
1Q 2Q 3Q 4Q FY 2011
Financial Review : Quarterly Turnover (2011 to 2014)
$’m
215.3
269.4
+18.3%
118.6
318.6
- 4.6%
3.3
6.7 8.0
6.1
7.56.7
10.2
5.97.8
8.810.5
3.8
18.1
0
2
4
6
8
10
12
14
16
18
20
22
24
26
28
30
32
34
36
2011 2012 2013 2014
1Q 2Q 3Q 4Q FY 2011
Quarterly Net Profit (2011 to 2014)
$’m
28.4
30.7
14.7
-14.4%
18.1
-63.7% 26.2
2/24/2015
4
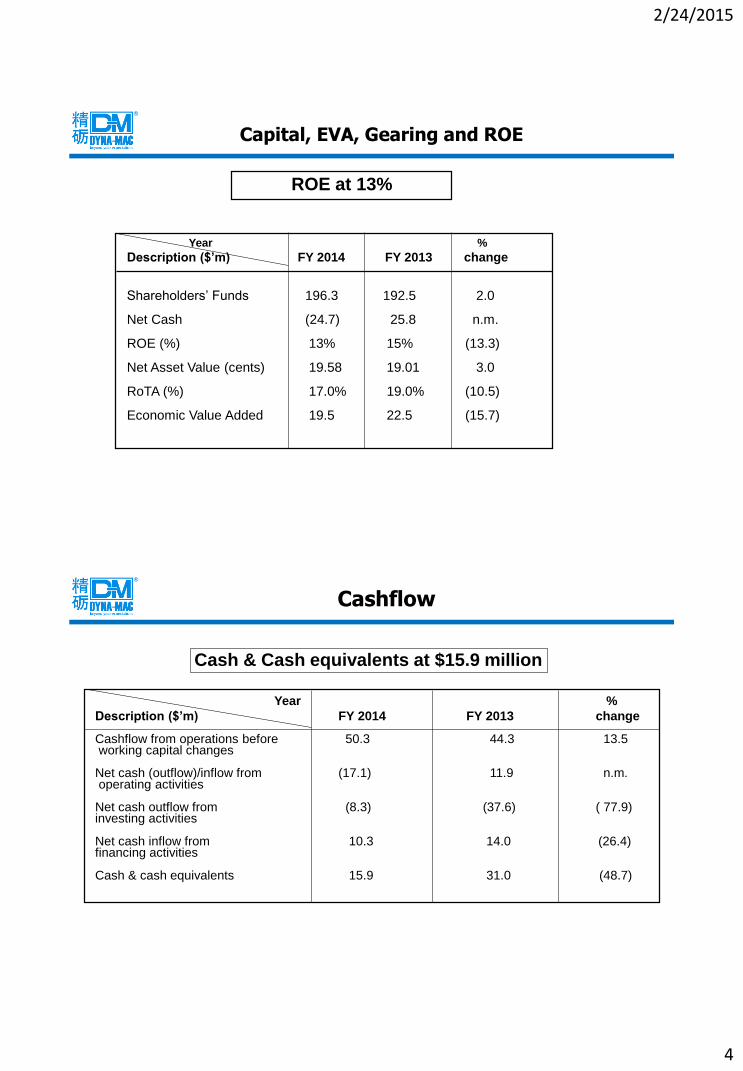
Year %
Description ($’m) FY 2014 FY 2013 change
Shareholders’ Funds 196.3 192.5 2.0
Net Cash (24.7) 25.8 n.m.
ROE (%) 13% 15% (13.3)
Net Asset Value (cents) 19.58 19.01 3.0
RoTA (%) 17.0% 19.0% (10.5)
Economic Value Added 19.5 22.5 (15.7)
Capital, EVA, Gearing and ROE
ROE at 13%
Year %
Description ($’m) FY 2014 FY 2013 change
Cashflow from operations before 50.3 44.3 13.5working capital changes
Net cash (outflow)/inflow from (17.1) 11.9 n.m.operating activities
Net cash outflow from (8.3) (37.6) ( 77.9)investing activities
Net cash inflow from 10.3 14.0 (26.4) financing activities
Cash & cash equivalents 15.9 31.0 (48.7)
Cashflow
Cash & Cash equivalents at $15.9 million

2/24/2015
5
Capex
Year Actual Actual
Description ($’m) FY 2014 FY 2013
Buildings & Land Enhancement 0.3 12.1
Site Equipment and Tools 2.8 3.5
Others 2.2 2.4
Sub-total 5.3 18.0
Singapore Yard 0.9 1.5
Johor Yard 6.9 6.0
China Yard 4.0 1.5
Philippines Yard - 0.1
Grand Total 17.1 27.1
FY 2014 Capex at $17.1 million
Shareholder Value : rewarding shareholders
2.0 2.0
1.5
2.0
62
71
62
72
0.0
0.5
1.0
1.5
2.0
2.5
2011 2012 2013 2014
56
58
60
62
64
66
68
70
72
74
Dividend
Dividend payout
Cents %

2/24/2015
6
20.5
22.522.2
31.4
22.0
17.6
26.5
28.8
30.2
17.7
24.4
23.1
33.0
17.0
6.1
9.810.1
6.9
15.9
10.5
14.2
8.8
9.8
11.211.8
7.9
0
5
10
15
20
25
30
35
4Q 11 1Q 12 2Q 12 3Q 12 4Q 12 1Q 13 2Q 13 3Q 13 4Q 13 1Q 14 2Q 14 3Q 14 4Q 14
Gross Profit Margin
Net Profit Margin
Percentage
Quarterly Gross & Net Profit Margin
26.5
24.4
26.3
22.6
8.2
11.4
13.2
11.3
0
5
10
15
20
25
30
2011* 2012 2013 2014
Gross Profit Margin
Net Profit Margin
Percentage
Yearly Gross & Net Profit Margin
* Based on change in financial year end from 31st May to 31st December
2/24/2015
7
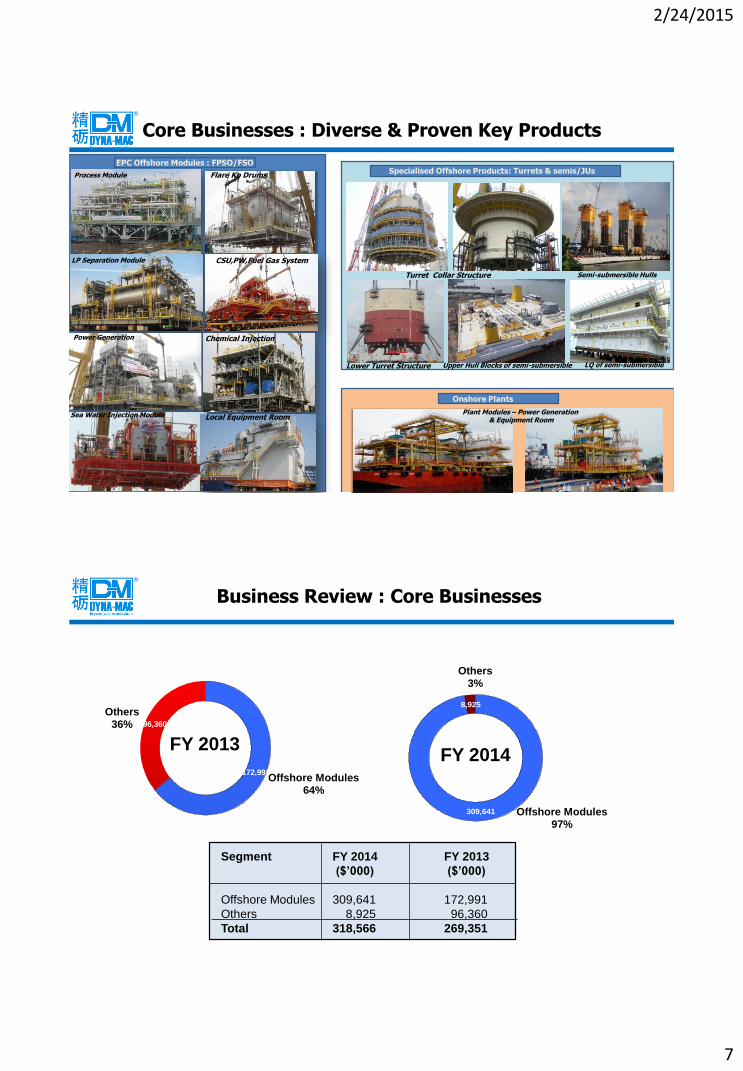
Core Businesses : Diverse & Proven Key Products
Process Module
LP Separation Module
Power Generation
Turret Collar Structure
LQ of semi-submersible
Sea Water Injection Module
Flare Ko Drums
CSU,PW,Fuel Gas System
Chemical Injection
Semi-submersible Hulls
EPC Offshore Modules : FPSO/FSOSpecialised Offshore Products: Turrets & semis/JUs
Onshore Plants
Lower Turret Structure
Local Equipment Room
Upper Hull Blocks of semi-submersible
Plant Modules – Power Generation& Equipment Room
172,991
96,360
309,641
8,925
Business Review : Core Businesses
FY 2013FY 2014
Offshore Modules64%
Others36%
Offshore Modules97%
Others3%
Segment FY 2014 FY 2013
($’000) ($’000)
Offshore Modules 309,641 172,991
Others 8,925 96,360
Total 318,566 269,351

2/24/2015
8
Types No. of Units
FPSO Topsides ModulesFPSO Cluster 7 3FPSO Cidade De Marica 13FPSO Cidade De Saquarema 13FPSO Stones 8
Total No. of FPSO Modules 37
Non-FPSO ModulesMalampaya Phase 3 5Malampaya – Bridge landing & Pipe Rack 1Ten Tullow Pipe Racks 6Fuel Gas Skid/utility module 1Malampaya – in fill structure 1
Total No 14
OthersB356 Mobile Offshore Drilling unit 1B363 Mobile Offshore Drilling unit 1
Total No 2
Grand Total 53
Record Deliveries & Completions in 2014
Business Review: Deliveries & Completions in 2014
Shell MalampayaInstallation in place at site
FPSO Cluster 7 -Export Gas Compressor, Fuel Gas & Gas Metering
Cidade De Marica – Injection Compression, TS267 Manifold D, TS266 Manifold C
0
20
40
60
80
100
120
140
160
180
200
220
240
260
280
300
320
340
2011 2012 2013 2014 2015 (Feb)
Contracts secured 2011 to 2015 (to-date)
S$’m
178
132
316
92
149

2/24/2015
9
0
20
40
60
80
100
120
140
160
180
200
220
240
260
280
300
320
340
360
1Q201
2
2Q201
2
3Q201
2
4Q201
2
1Q201
3
2Q201
3
3Q201
3
4Q201
3
1Q201
4
2Q201
4
3Q201
4
4Q201
4
Net Order Book
$’m
201 203215
134
113
246
346
324
342
266
223
The Group expects to grow order book
353.7
0
20
40
60
80
100
120
140
160
J-04 J N A S F J D M O M A
J-09 J N A S F J D M O M A
J14 J N
Feb-16
US$ per barrel
Market Outlook
$134/bbl
$40/bbl
$117/bbl$125/bbl
$95/bbl
$102/bbl$109/bbl$111/bbl
$72/bbl
$83/bbl
$50/bbl
$55/bbl
Long-term fundamentals intact despite lower oil prices
$47bbl
$58bbl
$61/bbl
2/24/2015
10
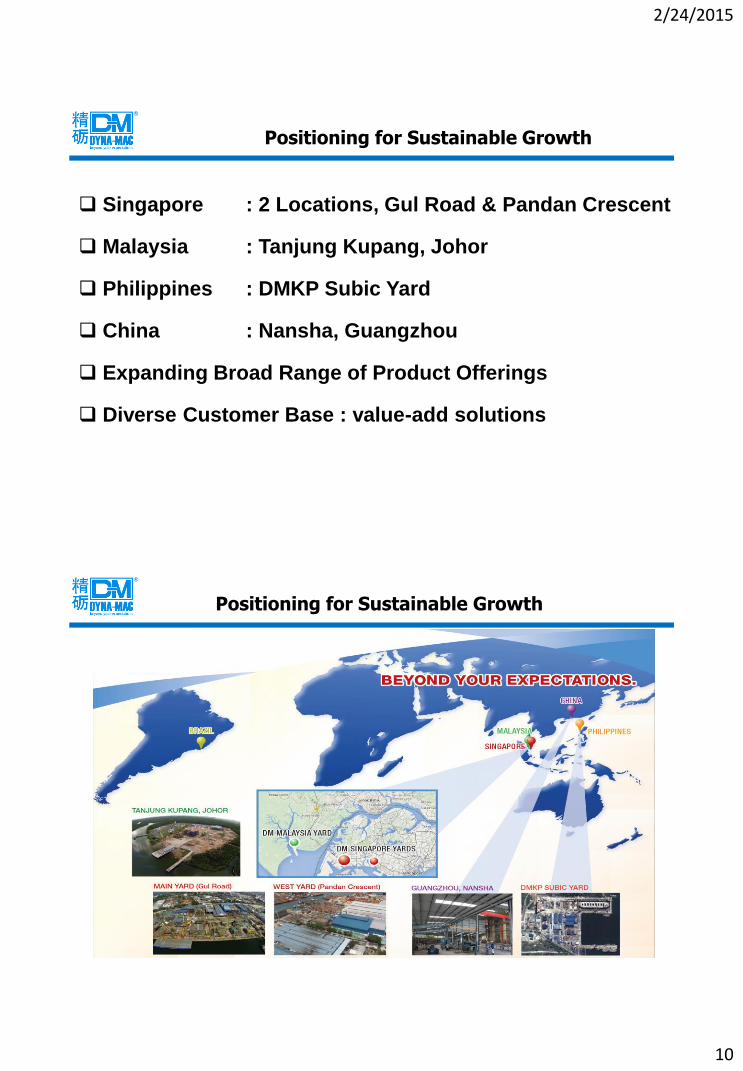
Positioning for Sustainable Growth
Singapore : 2 Locations, Gul Road & Pandan Crescent
Malaysia : Tanjung Kupang, Johor
Philippines : DMKP Subic Yard
China : Nansha, Guangzhou
Expanding Broad Range of Product Offerings
Diverse Customer Base : value-add solutions
Positioning for Sustainable Growth

2/24/2015
11
Location Gul Road
Total Land Area 110,300 sqm
Water Depth 7.8 m
Wharf Length 300 m
Max. Load-out Capacity 27,000 mt
Activities:
Onshore & offshore projects of up to
25,000 tonnes annually
Topside modules for FPSOs & FSOs,
Pipe Spools, Semi-submersibles &
Subsea products
Singapore Yard Facilities : Main Yard
Singapore Yard Facilities : West Yard
Location Pandan Crescent
Total Land Area 30,100 sqm
Water Depth 4 m - 6 m
Wharf Length 97.8 m
Load-out Jetty Area 1,380 sqm
Activities:
Exotic piping fabrication including duplex
and super duplex stainless pipe spools
air-conditioned facility controls the environment
and prevents contamination from dust and other
ferrous particles

2/24/2015
12
Malaysia Yard Facilities : Tanjung Kupang, Johor(progressive development)
Location Tanjung Kupang
Johor (Malaysia)
45 minutes by car (20km)
Total Land Area 211,000 sqm
Water Depth 14 m
Wharf Length 142 m
Max. Structure Capacity 28,000 mt/yr
Activities :
• FPSO Topside Modules & Semi-submersible Unit
• CPP/WHP/LQ Platform
• On-shore Plant Modules
DM Malaysia
Yard
DM Singapore Yard
Philippines Yard Facilities : Leveraging on Partnership
Location : Keppel Subic Shipyard is situated in the Special Economic Zone of Subic, Zambales, in central Luzon, and has one of the largest drydocks in Philippines, which is capable of co-drydockings.
Activities : Construction of Topside Modules
2/24/2015
13
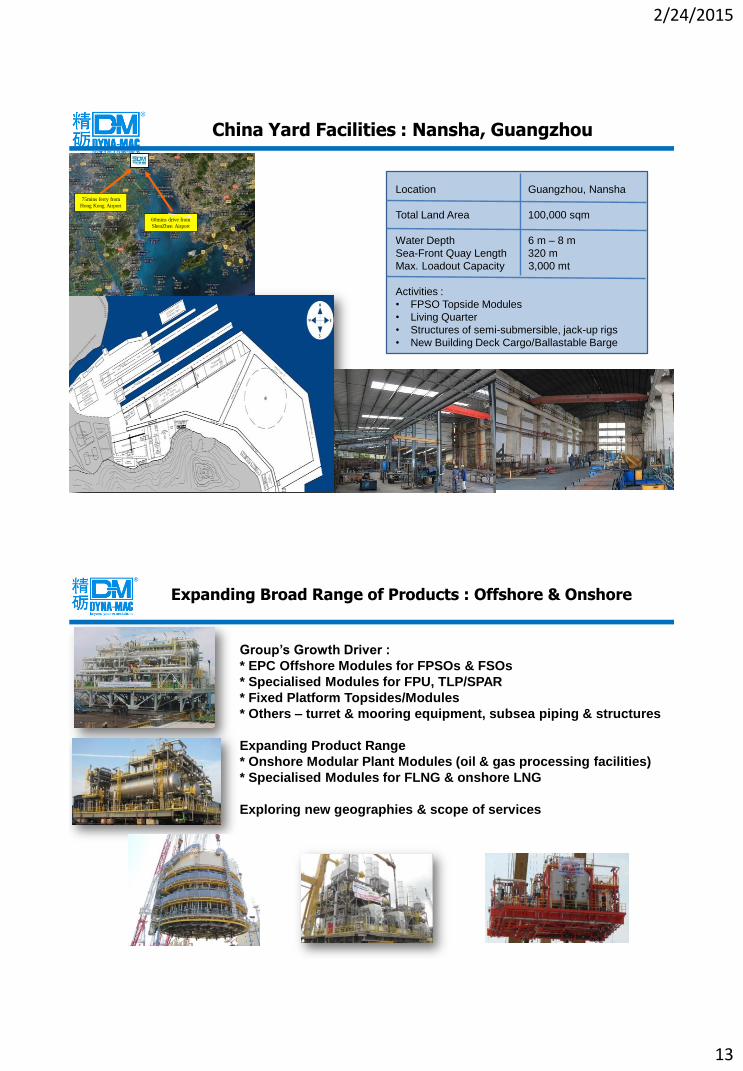
China Yard Facilities : Nansha, Guangzhou
Location Guangzhou, Nansha
Total Land Area 100,000 sqm
Water Depth 6 m – 8 m
Sea-Front Quay Length 320 m
Max. Loadout Capacity 3,000 mt
Activities :
• FPSO Topside Modules
• Living Quarter
• Structures of semi-submersible, jack-up rigs
• New Building Deck Cargo/Ballastable Barge
60mins drive from
ShenZhen Airport
75mins ferry from
Hong Kong Airport
Expanding Broad Range of Products : Offshore & Onshore
Group’s Growth Driver :
* EPC Offshore Modules for FPSOs & FSOs
* Specialised Modules for FPU, TLP/SPAR
* Fixed Platform Topsides/Modules
* Others – turret & mooring equipment, subsea piping & structures
Expanding Product Range
* Onshore Modular Plant Modules (oil & gas processing facilities)
* Specialised Modules for FLNG & onshore LNG
Exploring new geographies & scope of services

2/24/2015
14
Diverse Customer Base : developing value-add solutions
Customers are among the world’s largest owners & operators of FPSOs and FSOs
Multinational engineering companies in the marine and oil and gas industries
Summary
Net Order book at $353.7 million as at 2015 to-date with
completions & deliveries extending into 2016
Balance Sheet position
Long-term fundamentals for offshore & onshore oil and gas
industries remain intact despite sharp dip in oil prices
Positioning yards for sustainable growth
Expanding diverse range of products & customer base

2/24/2015
15
This release may contain certain forward-looking statements which are subject to risks and
uncertainties that could cause actual results to differ materially from such statements. Such
risks and uncertainties include industry and economic conditions, competition, and legal,
governmental and regulatory changes. The forward-looking statements reflect the current
views of Management on future trends and developments.