summary brief napa county conservation policy existing ... · napa county conservation policy....
TRANSCRIPT

Prepared by Amber Manfree, PhD, for Growers/Vintners for Responsible Agriculture. ©2019 1
Summary Brief
Napa County Conservation Policy
Existing Conditions and Proposed Policy Impacts March 22, 2019 Amber Manfree Consulting Napa County, California, currently has over 50,000 acres of productive agricultural land, mostly planted in premium wine grapes. The Napa Valley floor has been essentially built-out following replanting of other crops to vineyard over the past few decades. This has resulted in economic and social pressures to expand vineyard acreage by converting wildlands. Overarching contemporary issues of climate change and biodiversity loss call this practice into question, as Napa County wine grape production is expected to be negatively impacted by climate change, and as the region is a biodiversity hotspot by virtue of its California Floristic Province location. In order to inform the discussion of how to best respond to this situation, estimates have been made of developable area under existing policies and under several suggested policy alternatives in order to compare possible outcomes. Scientific research shows that leaving wildlands intact is an effective way to retain carbon, protect water supplies, and support biodiversity. Policies that achieve this goal are recommended. Key Findings
1. Mitigating on slopes. The most significant policy factor affecting the ratio of conservation to development is whether or not conservation credit (“mitigation” or “retention”) is allowed on lands not at risk of development (undevelopable lands; e.g., with slopes greater than 30%). Recommendation: Increase effective conservation by requiring that mitigation be done on site and on land that is at risk of development.
2. Tree Canopy. County-wide analysis of land cover and developable area on a per-parcel basis estimates suggests:
• A 3:1 mitigation policy where mitigation is allowed on undevelopable land would
increase county-wide canopy protection by 4% over current conditions, leaving more than 27,800 acres of canopy - predominantly oaks - at-risk of deforestation.
• A 2:1 mitigation policy without mitigation on undevelopable land would increase canopy protection by 12% over current conditions, leaving about 14,600 acres of canopy at risk of deforestation.
• A 3:1 mitigation policy without mitigation on undevelopable land would increase canopy protection by 14% over current conditions, leaving about 10,900 acres of canopy at-risk of deforestation.
Recommendation: For all canopy, require at least 3:1 mitigation on-site, with no mitigation on undevelopable areas.

Prepared by Amber Manfree, PhD, for Growers/Vintners for Responsible Agriculture. ©2019 2
3. Shrubland. County-wide 40% shrubland retention will have virtually no conservation benefit if
conservation credit is allowed in undevelopable land. This is because most parcels with development potential contain significant area with slopes over 30% and/or streams, which is already precluded from development by the Hillside Ordinance. Recommendation: Require that all shrubland retention be done on developable areas.
4. Water supply. Increased tree canopy retention will offer improvement in water security. In several sensitive domestic water supply drainages, grass and shrub are extensive land cover types, so canopy protections alone will not dramatically change development patterns. At least four of seven reservoirs have had, or currently have, sediment loading issues due to sources more than 500 feet away, and algae issues related to nutrient loading are an emerging concern. Linear setbacks (buffers) proposed for water supply reservoirs are unlikely to protect water supplies, because pollutant delivery is a function of the rate of a waterway’s energy dissipation against its bed and banks of per unit downstream length, not linear distance across a landscape.
Recommendation: In addition to maximizing tree protection, retain shrub and grasslands in water supply watersheds. Hydrologic analysis and ongoing monitoring is needed to ensure water quality objectives are met. A hydrologic model, informed by field data, is the established method for evaluating watershed development impacts.
5. Urgency. The Intergovernmental Panel on Climate Change states that “rapid, far-reaching and
unprecedented changes in all aspects of society” will be required to limit global warming to 1.5°C. Preventing further loss of wildlands is a key short-term climate stabilization strategy, one of numerous actions needed to buffer the worst climate change impacts.
Recommendation: Retaining more natural resources by limiting the conversion of wildland to other uses keeps climate management options open.
1
Napa County Conservation Policy Existing Conditions and Proposed Policy Impacts Analysis prepared for Napa Growers / Vintners for Responsible Agriculture By Amber Manfree, PhD [email protected] ©Amber Manfree March 2019
“…wine׳s future is tied inextricably to a vital Earth and a vital population. Grape growers and winemakers
must understand both the dire condition of the planet and the small, but significant, role their industry
holds in the human matrix. They must seek, therefore, in a responsible manner, their proper and effective
role in the adaptation to and the mitigation of global climate change. The future of the wine industry is
dependent upon an effective course of action. The Romans declared, “Vino veritas,” or “in wine there is
truth (Jones and Webb, 2010).” The simple, yet tragic, truth is the Earth׳s climate is changing. How the
wine industry responds will determine if the industry is to survive.”
- Michelle Renée Mozell 2014

2
This page intentionally left blank
3
Contents Executive Summary ........................................................................................................................... 5
Introduction ....................................................................................................................................... 7
Section 1 - Quick Reference & Existing Conditions ...............................................................................8
Land Cover and Land Use .............................................................................................................. 9
Farmland Type by Land Use Zone ................................................................................................. 10
Land Cover Type by Land Use Zone .............................................................................................. 11
Section 2 - Results of Policy Proposal Options Analysis ...................................................................... 14
Existing Conditions Model Base .................................................................................................... 14
Modeling Existing 2:1 and 60/40 Policy .......................................................................................... 19
Existing 60/40 Rule Constraints ................................................................................................. 20
Comparing Policy Outcomes ......................................................................................................... 26
Reservoir Setbacks ....................................................................................................................... 28
Wetland Setbacks......................................................................................................................... 31
Developable Area and Parcel Size ................................................................................................. 32
Small Parcels Quick Reference .................................................................................................. 33
Small parcels are clustered in towns, valleys, and along roads; large parcels are common on ridgetops and in remote areas (Data: County of Napa 2019). ...................................................... 34
Developable Area Farmland Quality and Land Cover ...................................................................... 35
Section 3 - Methods.......................................................................................................................... 38
Slope ........................................................................................................................................... 38
Existing Vineyard.......................................................................................................................... 39
Vegetation Types ......................................................................................................................... 39
Streams ....................................................................................................................................... 39
Stream Setback Buffers ................................................................................................................ 39
Conservation Lands ...................................................................................................................... 39
Farmland ..................................................................................................................................... 39
Soils ............................................................................................................................................. 40
Wetlands...................................................................................................................................... 40
Parcels ......................................................................................................................................... 40
60/40 Rule Deed Restrictions and Conservation Easements ............................................................ 40
Ratio and Percentage-based Policy Proposals ................................................................................ 40

4
Small Areal Discrepancies ............................................................................................................. 40
Analysis Steps .............................................................................................................................. 42
Section 4 - Discussion ....................................................................................................................... 45
References ....................................................................................................................................... 49
Geospatial References ...................................................................................................................... 51
Appendices ...................................................................................................................................... 53
Appendix 1. California Department of Conservation Farmland Mapping and Monitoring Program ... 53
Appendix 2. Napa County/ James Thorne - Vegetation Map of Napa County ................................... 55
Appendix 3. Amber Manfree Curriculum Vitae ............................................................................... 59

5
Executive Summary Napa County, California, currently has over 50,000 acres of productive agricultural land, mostly planted in premium wine grapes. The Napa Valley has been essentially built-out following conversions of other crops to vineyard over the past few decades, resulting in economic and social pressure to expand vineyard acreage by converting wildlands. Overarching contemporary issues of climate change and biodiversity loss call this practice into question, as Napa County wine grape production is expected to be negatively impacted by climate change, and as the region is a biodiversity hotspot by virtue of its California Floristic Province location. In order to inform the discussion of how to best respond to this situation, estimates have been made of developable area under existing policy and under several policy alternatives to compare possible outcomes. Scientific research shows that leaving wildlands intact is an effective way to retain carbon, protect water supplies, and support biodiversity, so policies that achieve this goal are recommended. Key Findings
1. Mitigating on slopes. The most significant policy factor affecting the ratio of conservation to development is whether or not conservation credit (“mitigation” or “retention”) is allowed on lands not at risk of development (undevelopable lands; e.g., with slopes greater than 30%). Recommendation: Increase effective conservation by requiring that mitigation be completed on site and on land that is at risk of development.
1. Tree Canopy. County-wide analysis of land cover and developable area, which estimated
outcomes on a per-parcel basis, suggest:
• A 3:1 mitigation policy where mitigation is allowed on undevelopable land would increase county-wide canopy protection by 4% over current conditions, leaving more than 27,800 acres of canopy - predominantly oaks - at-risk of deforestation.
• A 2:1 mitigation policy without mitigation on undevelopable land would increase canopy protection by 12% over current conditions, leaving about 14,600 acres of canopy at risk of deforestation.
• A 3:1 mitigation policy without mitigation on undevelopable land would increase canopy protection by 14% over current conditions, leaving about 10,900 acres of canopy at-risk of deforestation.
Recommendation: For all canopy, require 3:1 mitigation on-site, with no mitigation on undevelopable areas.
2. Shrubland. County-wide 40% shrubland retention will have virtually no conservation benefit if
conservation credit is allowed in undevelopable land. This is because most parcels with development potential contain significant area with slopes over 30% and/or streams, which is already precluded from development by the Hillside Ordinance.

6
Recommendation: Require that all shrubland retention be done on developable areas.
2. Water supply. Increased tree canopy retention will offer improvement in water security. In several sensitive domestic water supply drainages, grass and shrub are extensive land cover types, so canopy protections alone will not dramatically change development patterns. At least four of seven reservoirs have had, or currently have, sediment loading issues due to sources more than 500 feet away, and algae issues related to nutrient loading are an emerging concern. Linear setbacks (buffers) proposed for water supply reservoirs are unlikely to protect water supplies, because pollutant delivery is a function of the rate of a waterway’s energy dissipation against its bed and banks of per unit downstream length, not linear distance across a landscape. Recommendation: In addition to maximizing tree protection, retain shrub and grasslands in water supply watersheds. Hydrologic analysis and ongoing monitoring is needed to ensure water quality objectives are met. A hydrologic model, informed by field data, is the established method for evaluating watershed development impacts.
3. High-value agriculture. Climate change is predicted to shift premium grape growing regions toward the coast and northward away from Napa.
Recommendation: Storing carbon in trees and soil to slow climate change impacts is one step toward protecting existing high-value crops. Transition Napa’s winegrowing industry from a growth mode to a sustainability mode.
4. Urgency. The Intergovernmental Panel on Climate Change states that “rapid, far-reaching and
unprecedented changes in all aspects of society” will be required to limit global warming to 1.5°C. Preventing further loss of forest and shrublands is a key short-term climate stabilization strategy; one of numerous actions needed to buffer the worst climate change impacts.
Recommendation: Retaining more natural resources by limiting the conversion of wildland to other uses keeps climate management options open.
7
Introduction Napa County’s pleasant Mediterranean climate and robust economy attract residents and tourists, and the economic potential of its agriculture continues to compel developers to convert wildlands to agriculture and sprawling estates. The County’s wildlands possess tremendous biodiversity and natural beauty and they provide valuable ecological services such as clean drinking water, clean air, and carbon storage. For all these reasons, wildlands merit conservation and preservation. Many acres of wildlands have already been converted to vineyard and other uses. Symptoms of extensive land conversion and poor management, such as reduced aquatic ecosystem function, persist even after massive restoration efforts and nearly 30 years of well-intentioned local conservation policies. The pressures of preservation and wise use of resources are in constant tension, and projected climate change impacts elevate the need for thoughtful science-based decision-making. The purpose of this study is to explore potential land-availability scenarios. County-wide land use and land cover are paired with a mathematical model to clarify current land availability and explore future availability under different policies. Differences in required conservation and allowed development under various constraints are estimated with existing and custom data. A base model was developed which describes the maximum area currently available for agricultural or other permitted development. The base model answers the question, “What could be developed given current land cover constraints and policy?” Total estimated county-wide developable1 land area is about 85,500 acres before considering 2:1 Mitigation and sixty-forty “60/40” retention policies, and about 75,900 acres after considering them (section 2). The base estimate is qualified by dividing it into categories of soil quality, vegetation cover type, and Land Use Zoning. Figures presented in this report are estimates. The model does not assess development likelihood or practical limitations such as water supply, remoteness, or climate. This report is a starting point for policy discussion, and should be considered in tandem with contextual information, such as climate change literature, biodiversity literature, etc. The conservation summary provided in Center for Biological Diversity comments to the Napa County Board of Supervisors (2019) is a helpful reference. Economic impacts of policies, interactions with policies other than 2:1 Mitigation requirements and 60/40 retention, and assessments of habitat value should be considered as well.
1. The term “developable” is used in this report to signify areas that are not precluded from conversion to agriculture or other Land Use Zone-appropriate use by an existing use or existing policy. Lands which are precluded from development are referred to as “undevelopable.”

8
Section 1 - Quick Reference & Existing Conditions Quick reference. Approximate areas of conditions for all of Napa County are listed below. All figures are in acres. Napa County (Napa County 2004)
Total area 507,440 Land area 481,320
Model Estimates (Manfree 2019)
Base developable area 85,500 Developable area less 2:1 policy 76,500 Developable area less 2:1 and 60/40 75,900
Slope (Napa County 2002)
Total area < 30% slope 276,540 Land area < 30% slope 250,880 Land area < 30% slope, less estuarine wetlands 240,040 Land area > 30% slope 230,440
Reserves (fee title) (GreenInfo Network 2018)
Federal 42,996 State 43,260 County 920 City 10,082 Special District 5,534 Non-profit 9,438 Total reserve area 133,116 Land area of reserves 112,229
Easements Napa Land Trust (wildlands) 24,805 Other 4,196
Farmland Type (CDC 2016)
Farmland 75,570 Grazing land 179,330 Other undeveloped 204,830
Vegetation - countywide (Thorne 2004)
Oak woodlands 148,828 Broadleaf (non-oak) 20,248 Conifer 38,601 Total canopy 207,677 Shrubland 61,244 Grassland 51,762
Other land cover (Manfree 2018, Napa County 2016)
Existing vineyard 50,680 Stream setbacks 26,650 Lake Berryessa 19,080 Other water bodies 16,293 Roads 17,321 Railroad 332

9
Land Cover and Land Use Tables detailing countywide existing vineyard (table 1), farmland type (table 2), and land cover (vegetation) (table 3) provide an overview of existing conditions. For an explanation of the minor discrepancies in total areas between tables, see the methods section and appendices. Current vineyard acreage is concentrated in the Agricultural Preserve zone, particularly on the floor of Napa Valley (figure 1). Table 1. Countywide Existing Vineyard per Land Use Zone (Data: Manfree 2018, Napa County 2013; 2016)
Land Use Zone
Zone Total Acres
Vineyard Acres
Percent Vineyard
Agricultural Watershed 422,905 24,196 6% Agricultural Preserve 31,594 20,587 65% Agricultural Watershed, Airport Compatibility 19,305 3,611 19% Municipal/ urban 21,285 1,708 8% Residential Country 3,263 486 15% Residential 953 23 2% Industrial Park, Airport Compatibility 1,092 16 1% Residential Country, Urban Reserve 103 12 11% Agricultural Preserve, Historic Restaurant 16 10 63% Residential, Urban Reserve 319 3 1% Planned Devel, Affordable Housing, Airport Compatibility 46 3 6% Public Lands 29 3 10% Local Commercial 127 2 2% Airport 833 1 0% Commercial Neighborhood 81 0 0% Local Commercial, other 3 0 6% Planned Development 1,868 0 0% Other Zones 2,770 0 0%
Total: 506,592 50,661 10%
10
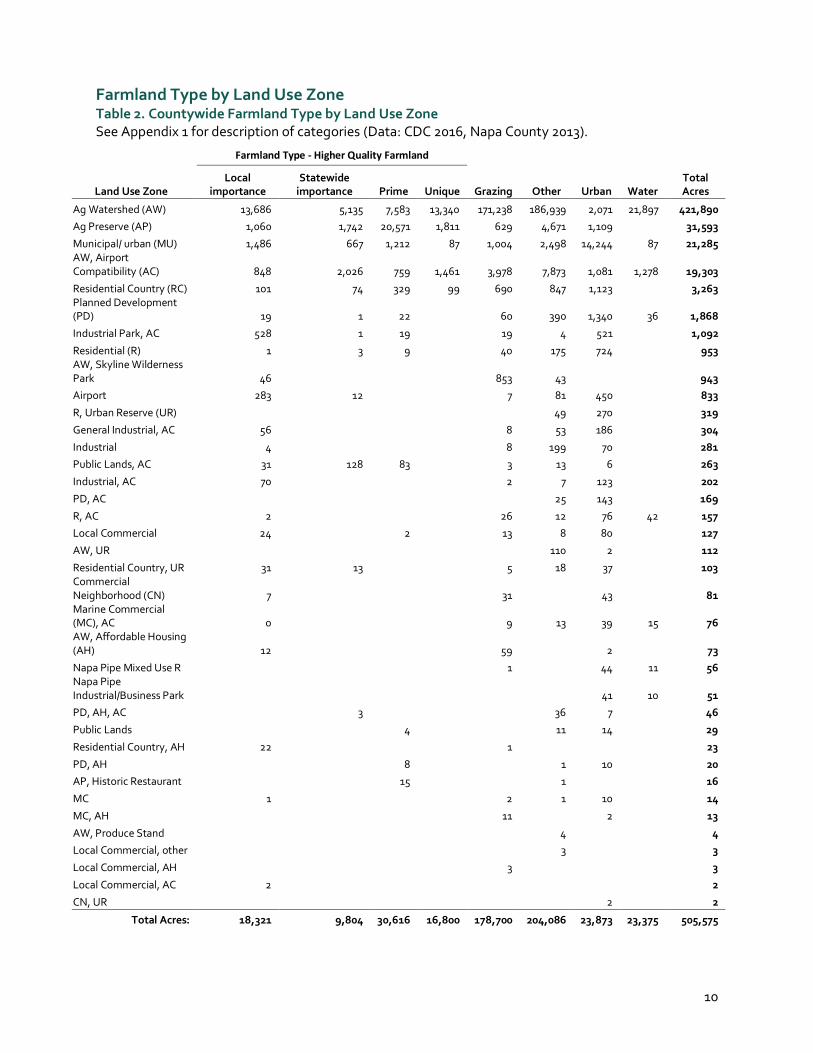
Farmland Type by Land Use Zone Table 2. Countywide Farmland Type by Land Use Zone See Appendix 1 for description of categories (Data: CDC 2016, Napa County 2013).
Farmland Type - Higher Quality Farmland
Land Use Zone Local
importance Statewide
importance Prime Unique Grazing Other Urban Water Total Acres
Ag Watershed (AW) 13,686 5,135 7,583 13,340 171,238 186,939 2,071 21,897 421,890 Ag Preserve (AP) 1,060 1,742 20,571 1,811 629 4,671 1,109
31,593
Municipal/ urban (MU) 1,486 667 1,212 87 1,004 2,498 14,244 87 21,285 AW, Airport Compatibility (AC) 848 2,026 759 1,461 3,978 7,873 1,081 1,278 19,303
Residential Country (RC) 101 74 329 99 690 847 1,123
3,263 Planned Development (PD) 19 1 22
60 390 1,340 36 1,868
Industrial Park, AC 528 1 19
19 4 521
1,092
Residential (R) 1 3 9
40 175 724
953 AW, Skyline Wilderness Park 46
853 43
943
Airport 283 12
7 81 450
833
R, Urban Reserve (UR)
49 270
319
General Industrial, AC 56
8 53 186
304
Industrial 4
8 199 70
281 Public Lands, AC 31 128 83
3 13 6
263
Industrial, AC 70
2 7 123
202
PD, AC
25 143
169
R, AC 2
26 12 76 42 157 Local Commercial 24
2
13 8 80
127
AW, UR
110 2
112
Residential Country, UR 31 13
5 18 37
103 Commercial Neighborhood (CN) 7
31
43
81
Marine Commercial (MC), AC 0
9 13 39 15 76
AW, Affordable Housing (AH) 12
59
2
73
Napa Pipe Mixed Use R
1
44 11 56 Napa Pipe Industrial/Business Park
41 10 51
PD, AH, AC
3
36 7
46
Public Lands
4
11 14
29
Residential Country, AH 22
1
23
PD, AH
8
1 10
20 AP, Historic Restaurant
15
1
16
MC 1
2 1 10
14
MC, AH
11
2
13
AW, Produce Stand
4
4 Local Commercial, other
3
3
Local Commercial, AH
3
3
Local Commercial, AC 2
2
CN, UR 2 2
Total Acres: 18,321 9,804 30,616 16,800 178,700 204,086 23,873 23,375 505,575
11
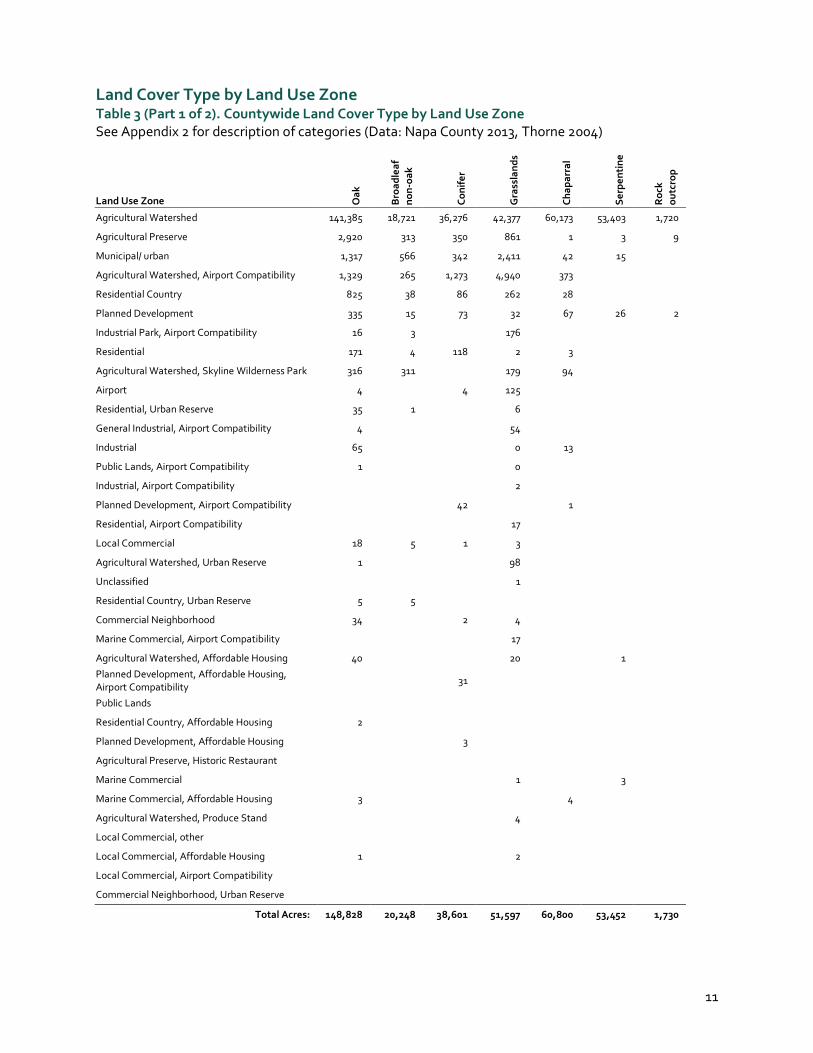
Land Cover Type by Land Use Zone Table 3 (Part 1 of 2). Countywide Land Cover Type by Land Use Zone See Appendix 2 for description of categories (Data: Napa County 2013, Thorne 2004)
Land Use Zone Oak
Bro
adle
af
non
-oak
Con
ifer
Gra
ssla
nds
Cha
parr
al
Ser
pent
ine
Roc
k
out
crop
Agricultural Watershed 141,385 18,721 36,276 42,377 60,173 53,403 1,720
Agricultural Preserve 2,920 313 350 861 1 3 9
Municipal/ urban 1,317 566 342 2,411 42 15
Agricultural Watershed, Airport Compatibility 1,329 265 1,273 4,940 373
Residential Country 825 38 86 262 28
Planned Development 335 15 73 32 67 26 2
Industrial Park, Airport Compatibility 16 3
176
Residential 171 4 118 2 3
Agricultural Watershed, Skyline Wilderness Park 316 311
179 94
Airport 4
4 125
Residential, Urban Reserve 35 1
6
General Industrial, Airport Compatibility 4
54
Industrial 65
0 13
Public Lands, Airport Compatibility 1
0
Industrial, Airport Compatibility
2
Planned Development, Airport Compatibility
42
1
Residential, Airport Compatibility
17
Local Commercial 18 5 1 3
Agricultural Watershed, Urban Reserve 1
98
Unclassified
1
Residential Country, Urban Reserve 5 5
Commercial Neighborhood 34
2 4
Marine Commercial, Airport Compatibility
17
Agricultural Watershed, Affordable Housing 40
20
1
Planned Development, Affordable Housing, Airport Compatibility
31
Public Lands
Residential Country, Affordable Housing 2
Planned Development, Affordable Housing
3
Agricultural Preserve, Historic Restaurant
Marine Commercial
1
3
Marine Commercial, Affordable Housing 3
4
Agricultural Watershed, Produce Stand
4
Local Commercial, other
Local Commercial, Affordable Housing 1
2
Local Commercial, Airport Compatibility
Commercial Neighborhood, Urban Reserve
Total Acres: 148,828 20,248 38,601 51,597 60,800 53,452 1,730

12
Table 3 (Part 2 of 2). Countywide Land Cover Type by Land Use Zone
Land Use Zone Agr
icul
ture
(g
razi
ng)
Urb
an
Wat
er
Wet
land
Vac
ant
No
ID
Total Acres
Agricultural Watershed 29,905 6,148 25,675 2,326 798 1,412 420,319
Agricultural Preserve 25,336 1,323 359 38 45 36 31,594
Municipal/ urban 3,510 11,765 359 150 777 26 21,281
Agricultural Watershed, Airport Compatibility 3,965 1,893 2,194 2,094 6 79 18,411
Residential Country 527 1,481 6 6 4
3,263
Planned Development 20 1,156 36 6 99
1,868
Industrial Park, Airport Compatibility 703 152
42
1,092
Residential 19 636
953
Agricultural Watershed, Skyline Wilderness Park 9 20 9 3
943
Airport 85 587
28
833
Residential, Urban Reserve 7 255
16
319
General Industrial, Airport Compatibility 43 171
13 19
304
Industrial
196
6
281
Public Lands, Airport Compatibility 254
9
263
Industrial, Airport Compatibility 15 165 2 17
202
Planned Development, Airport Compatibility
126
169
Residential, Airport Compatibility 5 42 67 16 11
157
Local Commercial 33 63
2 2
127
Agricultural Watershed, Urban Reserve
13
112
Unclassified
82 21 3
107
Residential Country, Urban Reserve 50 43
103
Commercial Neighborhood 6 36
81
Marine Commercial, Airport Compatibility
29 31
76
Agricultural Watershed, Affordable Housing
8 1 3
73
Planned Development, Affordable Housing, Airport Compatibility
5 9
46
Public Lands 25
2 1
29
Residential Country, Affordable Housing 21
23
Planned Development, Affordable Housing
17
20
Agricultural Preserve, Historic Restaurant 14
1
16
Marine Commercial
9
14
Marine Commercial, Affordable Housing
6
14
Agricultural Watershed, Produce Stand
4
Local Commercial, other 3
3
Local Commercial, Affordable Housing
1
3
Local Commercial, Airport Compatibility
2
2
Commercial Neighborhood, Urban Reserve 2 2
Total Acres: 64,561 26,437 28,763 4,762 1,777 1,554 503,109

13
Figure 1. Napa County reference map.
14
Section 2 - Results of Policy Proposal Options Analysis
Existing Conditions Model Base Several policies govern conversion of wildlands to vineyard in Napa County:
CEQA. The California Environmental Quality Act (CEQA) requires evaluation of any potentially significant impacts a project may have on the environment and avoidance of, or mitigation for, those impacts. This includes habitat for species with threatened, endangered, rare, and special concern status (State of California 1970). Oak Woodland Mitigation. In 2004, CEQA was amended to require counties to determine whether conversion of oak woodlands to other uses will have a significant impact on the environment. In Napa, significant oak woodland impacts are typically mitigated on a two-to-one basis, preferably on-site, though off-site mitigation is allowed (State of California 2004). Hillside Ordinance. Napa County’s Hillside Ordinance went into effect in 1993 in response to erosion problems associated with hillside development (County of Napa 1991). This ordinance:
• Requires stream setbacks with widths correlating to adjacent percent slope • Discourages development on slopes over 30%, requiring exceptions to policy for such
projects. • In sensitive domestic water supply drainages, wildland conversion projects must retain
a minimum of 60% tree canopy and 40% shrubland on-site. Retention credit is allowed on slopes over 30% and within stream setbacks and adjacent parcels having the same owner may be handled as a single area when considering where to count retention.
Countywide developable lands total about 85,500 acres before applying the 2:1 oak retention or replacement rule and the 60/40 retention policy. After applying these rules, about 75,900 acres remain in the “developable” category, assuming landowners maximize their opportunity to count canopy or shrubs on undevelopable areas (such as slopes over 30% and stream setbacks) toward conservation goals and mitigation is done on-site. This is an approximation of existing conditions, issued as a base for policy analysis. The base model for developable area was determined by starting with the total area of Napa County and subtracting areas precluded from conversion to agriculture or other uses due to regulations, existing uses, open water, or unsuitable soils. Estimates of developable area in different tables vary slightly due to secondary datasets that the base model is combined with (see methods and appendices 1 and 2). The largest undevelopable areas include lands over 30 percent slope, open water, reserves, and existing agriculture. Tables 4- 6, and Figures 2-3 show areas from the base model, before applying 2:1 and 60/40 policies.

15
Table 4. Developable land base model: Land Use Zone and California Department of Conservation Farmland Suitability Class. See Appendix 1 for description of categories (Data: Manfree 2018, Napa County 2013, CDC 2016)
Land Use Zone
Higher Quality
Farmland Grazing
land Other land Urban
Total Acres
Agricultural Watershed 8,321 39,569 26,474 369 74,734 Agricultural Watershed, Airport Compatibility 866 1,665 1,401 103 4,035 Agricultural Preserve 736 337 1,317 88 2,478 Municipal/ urban 811 240 757 358 2,167 Residential Country 70 169 244 78 560 Industrial Park, Airport Compatibility 401 16 3 37 456 Public Lands, Airport Compatibility 233 3 9 3 248 Planned Development 22 10 106 87 225 Agricultural Watershed, Urban Reserve 0
86 0 86
Other Zones 119 63 129 108 419 Total Acres 11,579 42,073 30,526 1,231 85,408

16
Table 5. Developable land base model: Land Use Zone and land cover type. See Appendix 2 for description of categories (Data: Manfree 2018, Napa County 2013, Thorne 2004)
Land Use Zone O
ak
Bro
adle
af
non
-oak
Con
ifer
Gra
ssla
nds
Cha
parr
al
Agr
icul
ture
(g
razi
ng)
No
ID
Vac
ant
Wet
land
v
eget
atio
n
Total Acres
Agricultural Watershed 31,589 3,025 5,659 18,129 9,513 6,020 282 315 287 74,819
Agricultural Watershed, Airport Compatibility 572 45 652 1,745 163 830 21
12 4,040
Agricultural Preserve 857 68 86 469
953 9 14 24 2,479
Municipal/ urban 345 201 65 785 2 588 6 142 38 2,172
Residential Country 215 22 19 156 5 140
4 561
Industrial Park, Airport Compatibility 7 2
141
285
22 456
Public Lands, Airport Compatibility
242
6 248
Planned Development 92 6 21 9 19 19
57 1 226
Agricultural Watershed, Urban Reserve
86
86
Residential 28
39 1 1 2
72
General Industrial, Airport Compatibility 1
42
9
53
Residential, Urban Reserve 16
5
5
13
39
Residential Country, Urban Reserve 2
35
37
Industrial 24
4
5 33
Local Commercial 10 3
2
18
32
Agricultural Watershed, Affordable Housing 16
14
2 32
Residential, Airport Compatibility
2
4
9 12 26
Commercial Neighborhood 16
4
4
23
Planned Development, Affordable Housing, Airport Compatibility
17
5
21
Residential Country, Affordable Housing
18
18
Planned Development, Airport Compatibility
12
12
Airport 3
3 3
8
Industrial, Airport Compatibility
1
3 4
Agricultural Watershed, Produce Stand
3
3
Local Commercial, other
2
2
Agricultural Preserve, Historic Restaurant
1
1
Local Commercial, Affordable Housing
1
1
Marine Commercial, Affordable Housing
0
Planned Development, Affordable Housing
0
Agricultural Watershed, Skyline Wilderness Park
0
Marine Commercial
0
Marine Commercial, Airport Compatibility
0
Total Acres 33,794 3,372 6,574 21,598 9,709 9,179 317 549 416 85,503

17
Figure 2. Napa County land at risk of development with vegetation type. Data: Thorne 2004, County of Napa 2019, USGS 2013; 2016.

18
Figure 3. Developable land base model: Canopy. Undevelopable and developable canopy, by canopy type (Data: Thorne 2004, Manfree 2018). Table 6. Developable land base model: Canopy. Acreage of subsets of land cover type relevant to this analysis (Data: Thorne 2004, Manfree 2018, County of Napa 2019).
Parcels with developable land Oak
Broadleaf non-oak Conifer
total canopy
Developable 85,455 33,784 3,369 6,561 43,714 Undevelopable 271,834 81,413 13,799 21,205 116,417 Total 357,289 115,197 17,167 27,767 160,132
81,413
21,205 13,799
33,784
6,561 3,369
0
20,000
40,000
60,000
80,000
100,000
120,000
Oak Conifer Broadleaf Non-oak
Ac
res
Undevelopable Developable

19
13,625
67,789
8,933 24,851
0
40,000
80,000
120,000
Acr
es
Oak Canopy that may be cut with 2:1 rule
Effective oak canopy mitigation
Oak canopy mitigation on undevelopable land
Undevelopable oak canopy not counted toward mitigation
Modeling Existing 2:1 and 60/40 Policy In addition to slope-related restrictions on development, Napa County enforces policy requiring canopy and shrubland protections. With CEQA protections adopted in 2004, oak trees are mitigated at a 2:1 ratio (State of California 1970, 2004), preferably setting aside existing trees on-site, though planting of new trees onsite or off-site are options. In the early 1990s, Napa County adopted a rule requiring retention of 60 percent of trees and 40 percent of shrubland in water supply watersheds. These constraints can be applied to the base model to derive a more accurate estimate of existing conditions. Here the base model is described, followed by 2:1 Mitigation and 60/40 rule adjustments. Napa County has also adopted a Voluntary Oak Woodland Management Plan; participation is at landowner discretion (Napa 2010). Allowing oak canopy mitigation on lands which are otherwise undevelopable allows about 88 percent of oak “conservation” to occur on lands which are not at risk of development, and includes an option to mitigate off-site.
Figure 4. Effectiveness of existing 2:1 oak mitigation. Analysis assumes landowners mitigate on-site and maximize their opportunity to count canopy or shrub on undevelopable lands toward conservation goals. Table 7. Existing 2:1 ratio oak mitigation.
Parameter Acres
Total Oak Canopy 115,197 Developable Oak Canopy 33,784 Undevelopable Oak Canopy 81,413 Oak Canopy Acres Set Aside by 2:1 76,722 Effective Oak Canopy Mitigation by 2:1 8,933 Oak Canopy Cut with 2:1 24,851 Total Canopy Cut with 2:1 34,782

20
Existing 60/40 Rule Constraints Napa County’s 60/40 rule requires retention of 60 percent of trees and 40 percent of shrubland within a parcel, as it existed June, 1993, when wildlands are converted to other uses in sensitive domestic water supply drainages (“water supply watersheds”). County guidelines state that vegetation selected for retention should maximize habitat value and connectivity. The 60/40 rule is applied in the event that it is more restrictive than 2:1 mitigation and Hillside Ordinance requirements would be. As with the 2:1 rule, the 60/40 rule allows undevelopable areas to count toward mitigation. Remaining developable areas in agricultural watersheds tend to be dominated by oak and shrubland, followed by grassland and conifer land cover types (table 8 and figure 5). Table 8. Developable area in sensitive domestic water supply drainages, by vegetation type. See Appendix 2 for description of categories (Data: Thorne 2004, USGS 2017, County of Napa 2019).*
Vegetation Type
Watershed
Oak predominant
Broadleaf non-oak Conifer Chaparral Grasslands
Agriculture (grazing) Other
Total Acres
Hennessey 2,821 227 1,090 1,077 910 516 41 6,682 Curry 2,050 0 2 107 618 6 16 2,799 Rector 335 23 9 1,238 90 110 28 1,833 Milliken 623 101 7 421 280 85 67 1,583 Bell Canyon 163 16 111 158 17 31 10 506 Madigan 145 14 0 133 20 48 0 360 Kimball 84 2 58 8 67 0 0 219 Total Acres 6,221 382 1,276 3,143 2,001 796 162 13,982 Figure 5. Developable vegetation types in sensitive domestic water supply drainages. See Appendix 2 for description of categories (Data: Thorne 2004, USGS 2017, County of Napa 2019). Analyses assume landowners maximize their opportunity to count canopy or shrub on undevelopable lands toward conservation goals. Note difference in scales.
0
200
400
600
BellCanyon
Madigan Kimball0
2,000
4,000
6,000
Hennessey Curry Rector Milliken
Acr
es

21
Figure 6. Developable land in sensitive domestic water supply drainages with vegetation type. Data: Thorne 2004, County of Napa 2019, USGS 2013; 2016.

22
Due to the large amount of area precluded from development by slope and stream setbacks that are designed to protect drinking water supplies, almost all 60/40 “retention” occurs on lands that are not at risk of development. Applying 60/40 conservation requirements to parcels which currently have developable land shows that, if developed, 91% (13,879 acres) of canopy “retention,” and 93% (3,703 acres) of shrub “retention,” may occur on undevelopable areas within these parcels. The existing 60/40 rule effectively protects only about 1,660 acres, or 5 percent, of the 31,034 total acres in water supply drainages (figure 7). The goal of the 60/40 rule was to protect water supplies; however it is unlikely that a 5 percent increase in protected area over the slope and stream setback requirements is accomplishing the objective it was designed to meet. Allowing conservation credit for retention of shrub and canopy in undevelopable areas seriously undermines the effectiveness of the rule.
Figure 7. 60/40 Retention Rule Effects Outcomes of the existing 60/40 policy. (Data: Thorne 2004, USGS 2017, County of Napa 2019). Analyses assume landowners maximize their opportunity to count canopy or shrub on undevelopable lands toward conservation goals.
3,123 3,666 3,703
13,879 2,859
6,504
0
5,000
10,000
15,000
20,000
25,000
30,000
Shrubland Canopy
Acr
es
May be cut with 60/40rule
Effective conservationshrub = 284 accanopy = 1,376 ac
Undevelopable landcounted as mitigation
23
© Manfree 2017
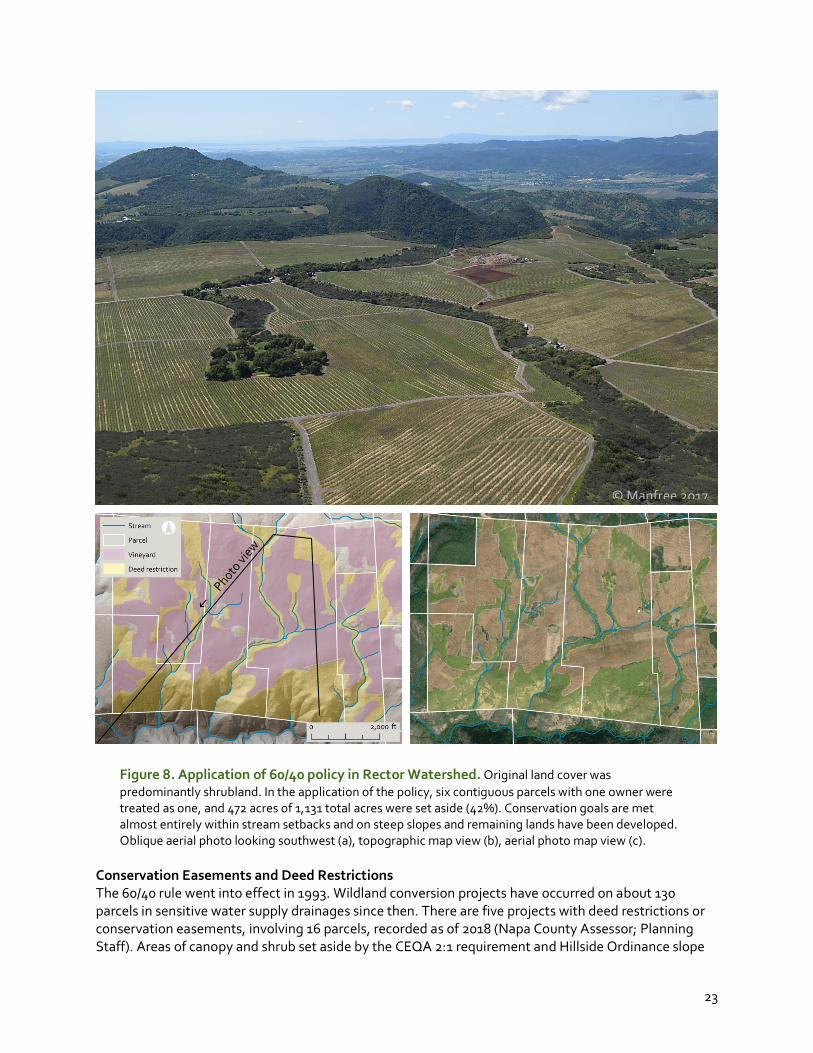
Figure 8. Application of 60/40 policy in Rector Watershed. Original land cover was predominantly shrubland. In the application of the policy, six contiguous parcels with one owner were treated as one, and 472 acres of 1,131 total acres were set aside (42%). Conservation goals are met almost entirely within stream setbacks and on steep slopes and remaining lands have been developed. Oblique aerial photo looking southwest (a), topographic map view (b), aerial photo map view (c).
Conservation Easements and Deed Restrictions The 60/40 rule went into effect in 1993. Wildland conversion projects have occurred on about 130 parcels in sensitive water supply drainages since then. There are five projects with deed restrictions or conservation easements, involving 16 parcels, recorded as of 2018 (Napa County Assessor; Planning Staff). Areas of canopy and shrub set aside by the CEQA 2:1 requirement and Hillside Ordinance slope
24
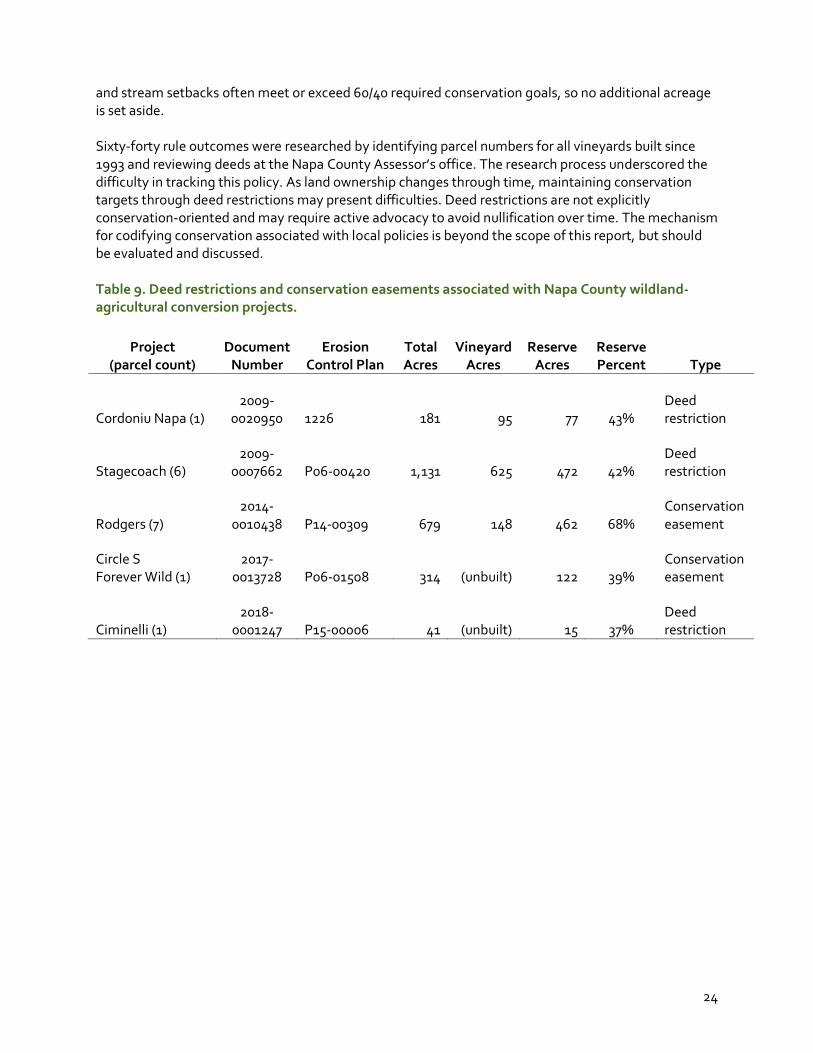
and stream setbacks often meet or exceed 60/40 required conservation goals, so no additional acreage is set aside. Sixty-forty rule outcomes were researched by identifying parcel numbers for all vineyards built since 1993 and reviewing deeds at the Napa County Assessor’s office. The research process underscored the difficulty in tracking this policy. As land ownership changes through time, maintaining conservation targets through deed restrictions may present difficulties. Deed restrictions are not explicitly conservation-oriented and may require active advocacy to avoid nullification over time. The mechanism for codifying conservation associated with local policies is beyond the scope of this report, but should be evaluated and discussed. Table 9. Deed restrictions and conservation easements associated with Napa County wildland-agricultural conversion projects.
Project (parcel count)
Document Number
Erosion Control Plan
Total Acres
Vineyard Acres
Reserve Acres
Reserve Percent Type
Cordoniu Napa (1) 2009-
0020950 1226 181 95 77 43% Deed restriction
Stagecoach (6) 2009-
0007662 P06-00420 1,131 625 472 42% Deed restriction
Rodgers (7) 2014-
0010438 P14-00309 679 148 462 68% Conservation easement
Circle S Forever Wild (1)
2017-0013728 P06-01508 314 (unbuilt) 122 39%
Conservation easement
Ciminelli (1) 2018-
0001247 P15-00006 41 (unbuilt) 15 37% Deed restriction

25
Discussion of 2:1 Mitigation Ratio and 60/40 Retention Rule Whether 2:1 ratio of canopy mitigation or the 60/40 rule protects more area on a given parcel depends on land cover. Two-to-one (66%) oak mitigation, if required on-site and with retention of existing trees, is more stringent in parcels with abundant oak canopy than a 60% canopy retention rule. In water supply watersheds areas with chaparral and conifer, the 60/40 rule will tend to conserve more area. However, given the option to mitigate on steep slopes and in stream setbacks, the “effective conservation” of both policies is restricted. “Effective conservation” discussed here refers to additional conservation acreage beyond that required by slope and stream setbacks.
• If all developable oak forests were converted under the CEQA2:1 Mitigation rule, with landowners maximizing mitigation in undevelopable areas, up to 24,800 acres of oaks could potentially be converted to other uses, while 8,933 acres of oaks would be prevented from development by the rule.
• If all developable forest and shrubland in water supply watersheds were converted under the
60/40 rule, with landowners maximizing mitigation in undevelopable areas, up to 9,360 acres of trees and shrubs could potentially be converted to other uses, while 1,660 acres would be prevented from development by the rule.
In sum, the 2:1 Mitigation rule and the 60/40 rule preclude 9,588 acres of wildlands from conversion to agriculture or other uses. This reduces county-wide developable area from 85,500 (base model) to about 75,900 developable acres. These are existing conditions. As the 60/40 rule has a very minor conservation impact, it is not considered further in this analysis. Box 1. Effect of allowing mitigation on undevelopable land
Counting undevelopable lands toward mitigation allows 80% to 90% of the total acreage set aside by a policy (county-wide) to be mitigated on lands that are not available for development. Percentages of mitigation/retention which may occur on undevelopable land, per policy:
60/40 canopy/shrub retention - existing policy
91% of canopy retention 93% of shrubland retention
2:1 oak canopy mitigation - existing policy
88% of oak mitigation 3:1 canopy mitigation - proposed
87% of canopy mitigation 85% canopy retention - proposed
82% of canopy retention

26
Comparing Policy Outcomes Whether or not mitigation is allowed on undevelopable lands is the single biggest determinant of how much land is protected from development, for options under discussion. Below, current policy protections are compared with alternative options. The California 2:1 oak mitigation policy sets a limit on the cutting of oaks and, if local policy were expanded to protect all trees, the 2:1 state policy would set a floor on oak deforestation. Beyond that, the outcomes for specific types of trees would be unpredictable, unless codified (table 10). Table 10. Mitigation or retention options sorted by amount of canopy area protected. *Assumes undevelopable areas count toward mitigation. ^Assumes undevelopable areas do not count toward mitigation. Areas expressed in acres.
Policy
Canopy set aside by rule(s)
Canopy precluded
from cutting
Total Canopy
Protected
Canopy at Risk
Increase in Canopy Protection
Current policy: 2:1 oak and 60/40* 76,722 9,304 125,721 34,411 n/a 3:1 Mitigation* 120,099 15,855 132,273 27,859 4% 2:1 mitigation^ 29,143 29,143 145,560 14,571 12% 3:1 Mitigation^ 32,786 32,786 149,203 10,929 14% 85% Retention^ 37,157 37,157 153,574 6,557 17%
Figure 9. Mitigation or retention option ranked by canopy area protected. *Assumes undevelopable areas count toward mitigation. ^Assumes undevelopable areas do not count toward mitigation. Areas expressed in acres.
116,417
116,417
116,417
116,417
116,417
37,157
32,786
29,143
15,855
9,304
6,557
10,929
14,571
27,859
34,411
50% 60% 70% 80% 90% 100%
85% Retention^
3:1 Mitigation^
2:1 mitigation^
3:1 Mitigation*
Current policy: 2:1 oak and 60/40*
Undevelopable canopy Canopy precluded from cutting by rule(s) Canopy cut with rule

27
Table 11. Complete Assessment of Policy Outcomes.
On-site mitigation is assumed for all scenarios. All inputs are listed in table 6. *Assumes undevelopable areas count toward mitigation
^ Assumes undevelopable areas can't count toward mitigation
Policy Variable Parameter Acres Operation 2:1 (66%) Oak Mitigation* Oak Canopy Acres Set aside by 2:1* 76,722 Total oak * 0.66
Oak Canopy Precluded from Cutting by 2:1* 8,933 Max of zero or (oak set aside -
undevelopable oak)
Oak Canopy Cut with 2:1* 24,851 Developable oak - oak precluded
from cutting
Total Canopy Cut with 2:1* 34,782 Oak cut + developable conifer + developable non-oak
2:1 (66%) Canopy Mitigation* Canopy Acres Set Aside by 2:1* 105,687 Parcel total canopy * 0.66
Canopy Precluded from Cutting by 2:1* 10,090 Max of zero or (canopy set aside -
undevelopable canopy)
Canopy Cut with 2:1* 33,624 Developable canopy - canopy
precluded from cutting
Total Canopy Protected with 2:1* 126,507 Undevelopable canopy + canopy
precluded from cutting
2:1 (66%) Canopy Mitigation^ Canopy Acres Set Aside by 2:1^ 28,851 Developable canopy * 0.66
Canopy Cut with 2:1^ 14,426 Developable canopy * 0.33
Total Canopy Protected with 2:1^ 145,706 Total canopy - canopy cut
70% Canopy Retention* Canopy Set Aside by 70%* 112,092 Parcel total canopy * 0.70
Canopy Precluded from Cutting by 70%* 12,448 Max of zero or (canopy set aside -
undevelopable canopy)
Canopy Cut with 70%* 31,267 Developable canopy - canopy
precluded from cutting
Total Canopy Protected with 70%* 128,865 Undevelopable + canopy
precluded from cutting
70% Canopy Retention^ Canopy Set Aside by 70%^ 30,600 Developable canopy * 0.70
Canopy Cut with 70%^ 13,114 Developable canopy * 0.30
Total Canopy Protected with 70%^ 147,017 Total canopy - canopy cut
3:1 (75%) Tree Mitigation* Canopy Set Aside by 3:1* 120,099 Total canopy * 0.75
Canopy Precluded from Cutting by 3:1* 15,855 Max of zero or (canopy set aside -
undevelopable canopy)
Canopy Cut with 3:1* 27,859 Developable canopy - canopy
precluded from cutting
Total Canopy Protected with 3:1* 132,273 Undevelopable canopy + canopy
precluded from cutting
3:1 (75%) Canopy Mitigation^ Canopy Set Aside by 3:1^ 32,786 Developable canopy * 0.75
Canopy Cut with 3:1^ 10,929 Developable canopy * 0.25
Total Canopy Protected with 3:1^ 149,203 Undevelopable canopy + canopy precluded from cutting
85% Canopy Retention* Canopy Set Aside by 85%* 136,112 Parcel total canopy * 0.85
Canopy Precluded from Cutting by 85%* 24,509 Max of zero or (canopy set aside -
undevelopable canopy)
Canopy Cut with 85%* 19,206 Developable canopy - canopy
precluded from cutting
Total Canopy Protected with 85%* 140,926 Undevelopable + canopy
precluded from cutting
85% Canopy Retention^ Canopy Set Aside by 85%^ 37,157 Developable canopy * 0.85
Canopy Cut with 85%^ 6,557 Developable canopy * 0.15
Total Canopy Protected with 85%^ 153,574 Total canopy - canopy cut
28
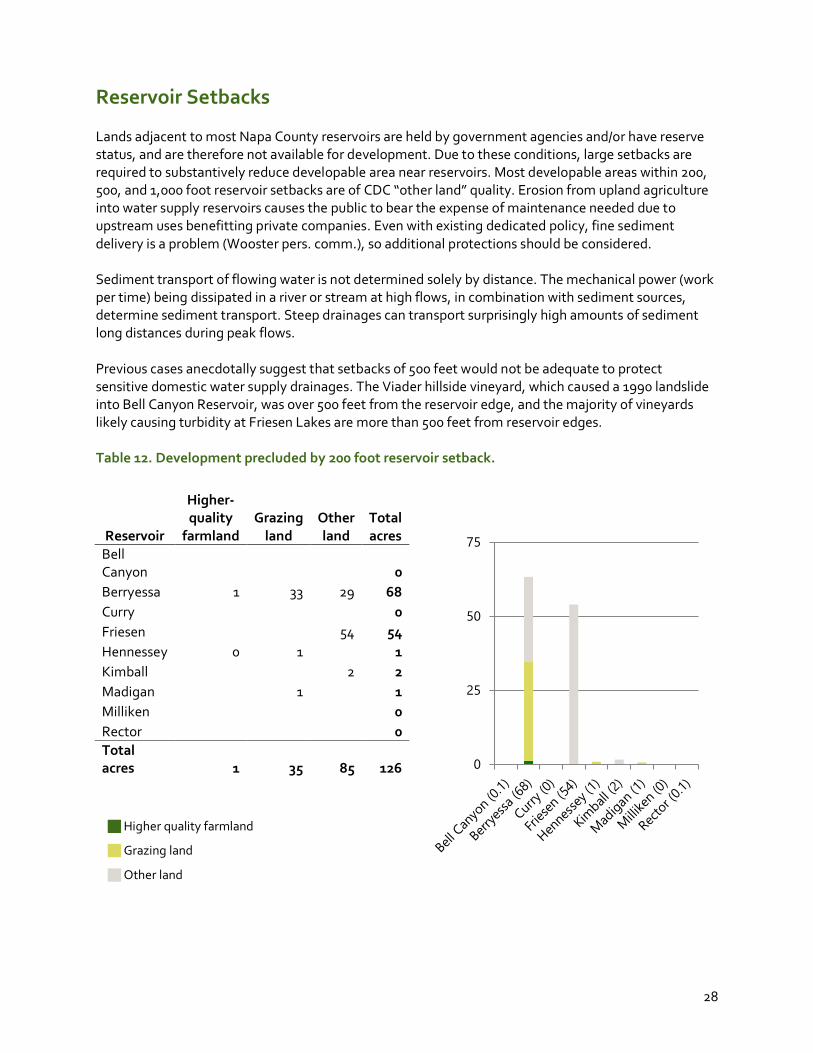
Reservoir Setbacks Lands adjacent to most Napa County reservoirs are held by government agencies and/or have reserve status, and are therefore not available for development. Due to these conditions, large setbacks are required to substantively reduce developable area near reservoirs. Most developable areas within 200, 500, and 1,000 foot reservoir setbacks are of CDC “other land” quality. Erosion from upland agriculture into water supply reservoirs causes the public to bear the expense of maintenance needed due to upstream uses benefitting private companies. Even with existing dedicated policy, fine sediment delivery is a problem (Wooster pers. comm.), so additional protections should be considered. Sediment transport of flowing water is not determined solely by distance. The mechanical power (work per time) being dissipated in a river or stream at high flows, in combination with sediment sources, determine sediment transport. Steep drainages can transport surprisingly high amounts of sediment long distances during peak flows. Previous cases anecdotally suggest that setbacks of 500 feet would not be adequate to protect sensitive domestic water supply drainages. The Viader hillside vineyard, which caused a 1990 landslide into Bell Canyon Reservoir, was over 500 feet from the reservoir edge, and the majority of vineyards likely causing turbidity at Friesen Lakes are more than 500 feet from reservoir edges. Table 12. Development precluded by 200 foot reservoir setback.
Reservoir
Higher-quality
farmland Grazing
land Other land
Total acres
Bell Canyon 0 Berryessa 1 33 29 68 Curry
0
Friesen
54 54 Hennessey 0 1
1
Kimball
2 2 Madigan
1
1
Milliken
0 Rector 0 Total acres 1 35 85 126
0
25
50
75
Higher quality farmland
Grazing land
Other land

29
0
200
400
600
800
1000
1200
Bell
Cany
on (1
8)
Berr
yess
a (1
,074
)
Curr
y (1
8)
Frie
sen
(167
)
Hen
ness
ey (4
5)
Kim
ball
(32)
Mad
igan
(25)
Mill
iken
(0.2
)
Rect
or (4
)
Table 13. Development precluded by 500 foot reservoir setback.
Table 14. Development precluded by 1,000 foot reservoir setback.
Reservoir
Higher-quality
farmland Grazing
land Other land
Total acres
Bell Canyon 2 2 Berryessa 16 148 83 248 Curry
0
Friesen
111 111 Hennessey 2 8
11
Kimball
10 10 Madigan
7
7
Milliken
0 Rector 0 Total acres: 18 164 206 389
Reservoir
Higher-quality
farmland Grazing
land Other land
Total Acres
Bell Canyon 18 18 Berryessa 109 739 226 1,074 Curry 3 15
18
Friesen 4
163 167 Hennessey 7 23 15 45 Kimball
32 32
Madigan
24 1 25 Milliken
0
Rector 4 4 Total acres: 123 801 459
1,382
0
50
100
150
200
250
Higher quality farmland
Grazing land
Other land

30
Figure 10. Municipal and drinking water supply reservoir setbacks and farmland quality of developable lands.
31
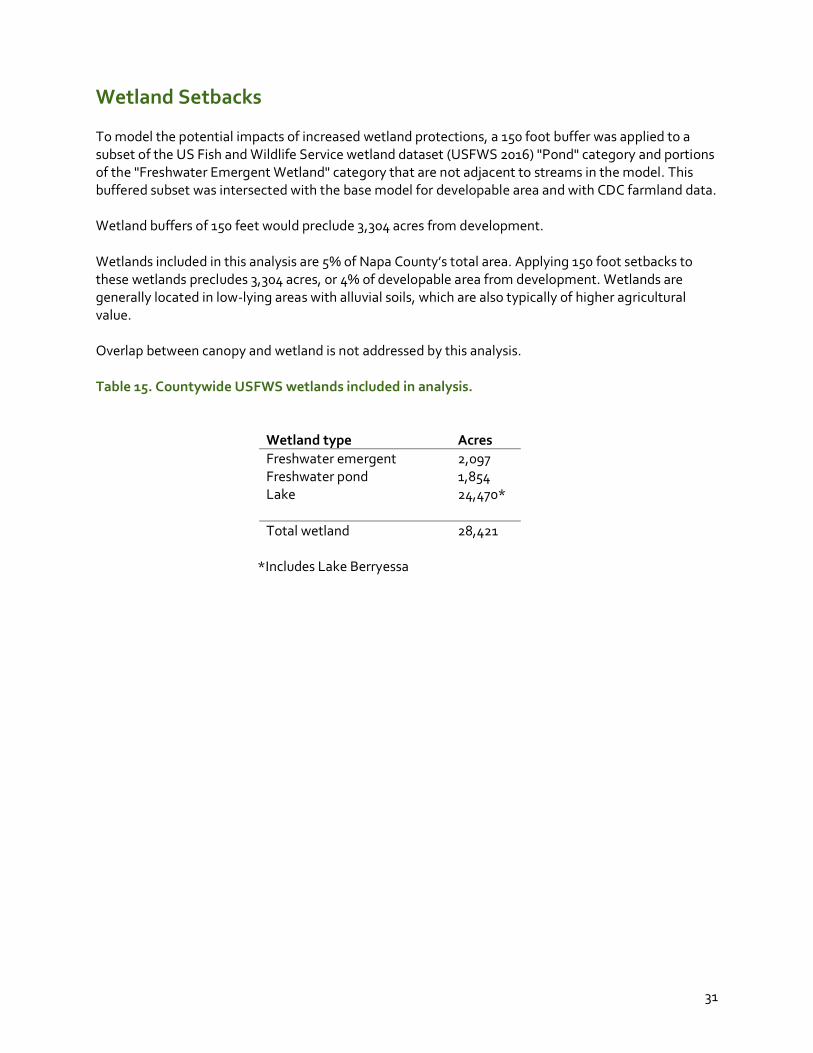
Wetland Setbacks To model the potential impacts of increased wetland protections, a 150 foot buffer was applied to a subset of the US Fish and Wildlife Service wetland dataset (USFWS 2016) "Pond" category and portions of the "Freshwater Emergent Wetland" category that are not adjacent to streams in the model. This buffered subset was intersected with the base model for developable area and with CDC farmland data. Wetland buffers of 150 feet would preclude 3,304 acres from development. Wetlands included in this analysis are 5% of Napa County’s total area. Applying 150 foot setbacks to these wetlands precludes 3,304 acres, or 4% of developable area from development. Wetlands are generally located in low-lying areas with alluvial soils, which are also typically of higher agricultural value. Overlap between canopy and wetland is not addressed by this analysis. Table 15. Countywide USFWS wetlands included in analysis.
Wetland type Acres Freshwater emergent 2,097 Freshwater pond 1,854 Lake 24,470* Total wetland 28,421
*Includes Lake Berryessa

32
Developable Area and Parcel Size There are about 49,768 parcels in Napa County. Of these, there are about 8,800 parcels with more than 1,000 square feet of developable area. Table 16. Parcel distribution by size and Land Use Zone; for parcels with > 1,000 ft2 developable area.
Parcel Size
Land Use Zone < 1 acre 1 to 5 acre > 5 acre Total
Parcels Agricultural Watershed 305 1,088 3,752 5,145 Municipal/ urban 628 332 258 1,218 Agricultural Preserve 40 242 669 951 Residential Country 47 164 151 362 Residential 221 62 27 310 Planned Development 235 41 30 306 Agricultural Watershed, Airport Compatibility 26 40 133 199 Industrial Park, Airport Compatibility 17 42 49 108 Residential, Urban Reserve 51 24 10 85 Local Commercial 3 5 18 26 Commercial Neighborhood
5 10 15
Residential, Airport Compatibility 5 2 8 15 Residential Country, Urban Reserve
5 7 12
Industrial 1 1 8 10 Airport
4 5 9
Industrial, Airport Compatibility
1 6 7 Agricultural Watershed, Skyline Wilderness Park
2 3 5
Agricultural Watershed, Affordable Housing
5 5 General Industrial, Airport Compatibility
1 3 4
Agricultural Preserve, Historic Restaurant 2 1 1 4 Agricultural Watershed, Urban Reserve
1 2 3
Planned Development, Affordable Housing, AC 1 1 1 3 Marine Commercial
1 1 2
Marine Commercial, Affordable Housing
2 2 Public Lands, Airport Compatibility
2 2
Local Commercial, Affordable Housing 1
1 2 Planned Development, Airport Compatibility 1
1
Marine Commercial, Airport Compatibility
1 1 Residential Country, Affordable Housing
1 1
Agricultural Watershed, Produce Stand 1 1 Total Parcels: 1,584 2,066 5,164 8,814

33
Small Parcels Quick Reference County-wide total number of 0 to 5 acre parcels 42,702 parcels Parcels less than 1 acre
Countywide total 38,071 parcels With more than 1,000 square feet developable area 1,584 parcels Homes: essentially all buildable parcels (not roads or slivers) less than one acre have homes
1 to 5 acre Countywide total 4,631 parcels With more than 1,000 square feet of developable area 2,066 parcels
Homes: about 1,790 one-to-five acre parcels with >1,000 ft2 developable area, or 86%, have homes
Figure 11. Distribution of zero to five-acre parcels, classified by size. Remarks Reviewing aerial photos suggests that developable areas within the majority of <1 acre parcels are unlikely to be converted to agriculture as they are being used as yards. Home-related figures were estimated using Napa County’s “ADDRESSES” dataset, which includes street addresses for houses, as well as addresses not assigned to houses. This likely resulted in a minor overestimate of total homes.
35,136
2,935 1,721 794 630 449 296 231 244 266
0
10,000
20,000
30,000
40,000
0-0.
5
0.5-
1
1-1.
5
1.5-
2
2-2.
5
2.5-
3
3-3.
5
3.5-
4
4-4.
5
4.5-
5
Num
ber o
f par
cels
Acreage

34
Figure 12. Napa County parcel size. Small parcels are clustered in towns, valleys, and along roads; large parcels are common on ridgetops and in remote areas (Data: County of Napa 2019).

35
Developable Area Farmland Quality and Land Cover The quality of farmland influences how desirable an area is for development. These tables summarize land cover, categorized by Thorne (2004) and Farmland Type, as categorized by the California Department of Conservation (2016) in areas which are developable under current policy. As the land cover/type categories were developed individually, with different purposes and at different times, there is some agreement and some disagreement about convergent categories, such as grazing. Table 17. Developable Area Farmland Quality and Land Cover. Data: (Thorne 2004, CDC 2016, Manfree 2019)
Farmland Type - Higher Quality Farmland
Land Cover
Category Local
importance Statewide
importance Prime Unique Grazing Other Urban Water Total Acres
Oak predominant 1,177 9 42 96 21,555 10,442 441 22 33,784 Grasslands 5,354 28 26 56 13,083 2,875 151 20 21,591 Chaparral 76 1 0 10 3,584 6,014 11 4 9,701 Agriculture (grazing)
3,230 450 505 216 1,943 2,435 390 1 9,169
Conifer 8 3 3 25 553 5,842 128 0 6,561 Broadleaf non-oak 30 10 3 15 971 2,306 35 0 3,369 Vacant 19 0 1 5 78 382 63
548
Wetland 144 0 5 1 153 98 12 1 415 Unidentified 31 1 0 0 153 131 1
317
Urban 0 0 0 Total Acres: 10,067 502 586 423 42,073 30,526 1,231 48 85,455
0
10,000
20,000
30,000
40,000
50,000
Higher-qualityfarmland
Grazing Other Urban
Acr
es
Developable Land: CDC Farmland Quality by Land Cover
Oak predominant Broadleaf non-oak Conifer Shrubland Grasslands Agriculture (grazing) Wetland

36
Table 18 (part 1 of 2). Developable area, Farmland Quality and Land Cover by Land Use Zone. (Data: Thorne 2004, CDC 2016, Manfree 2019) Continued on next page.
Farmland Type - Higher Quality Farmland
Land Cover Category Lo
cal
impo
rtan
ce
Stat
ewid
e im
port
ance
Pri
me
Uni
que
Gra
zing
Oth
er
Urb
an
Wat
er
Total Acres
Agricultural Watershed (AW)
Agriculture (grazing) 2,123 65 129 179 1,693 1,774 54 1 6,016
Broadleaf non-oak 22 2 2 13 945 2,024 13 0 3,022
Chaparral 76 1 0 10 3,573 5,837 4 4 9,506
Conifer 5 2 0 24 545 5,006 65 0 5,647
Grasslands 4,291 6 12 46 11,329 2,364 57 20 18,125
Oak predominant 1,073 8 19 71 21,147 9,070 175 22 31,584
Unidentified 28 1
0 135 118
281
Urban
0 0
0
Vacant 6 0 1 5 73 228 1
314
Wetland 98 0 5 1 130 53
1 287
AW, Airport Compatibility (AC)
Agriculture (grazing) 200 236 103 14 93 97 85
828
Broadleaf non-oak 1 2 0 0 11 30 0
45
Chaparral
0 7 156
163
Conifer 1 1 0 1 1 643 5
652
Grasslands 261 19 5 7 1,423 25 4
1,744
Oak predominant 7 0 0 2 103 449 8
570
Unidentified 3 0
18
21
Wetland 1 0
0 10 0 0
11
Agricultural Preserve
Agriculture (grazing) 232 20 145 22 53 410 69
952
Broadleaf non-oak 3 1 0 1 3 59 0
68
Chaparral
0
0
Conifer 0
0 0 0 85 0
86
Grasslands 156 2 8 2 165 132 4
469
Oak predominant 82 1 20 23 113 605 12
857
Unidentified
0 0
9
9
Vacant
0 0
13 1
14
Wetland 16 0 0
3 4 0
24

37
Table 18 (part 2 of 2). Developable area, Farmland Quality, and Land Cover by Land Use Zone. Continued from previous page.
Municipal/ urban
Agriculture (grazing) 262 7 18 1 99 83 115
585
Broadleaf non-oak 2 5 0
11 172 11
201
Chaparral
2
2
Conifer 0 0 0 0 1 60 4
65
Grasslands 497
0 1 116 119 51 0 784
Oak predominant 1
1 1 14 195 133
344
Unidentified
0
5 1
6
Vacant 12
1 0
91 37
141
Wetland 2
0 0 1 30 5
38
Residential Country
Agriculture (grazing) 53 0 10 0 1 46 29
139
Broadleaf non-oak 1
0 0 17 5
22
Chaparral
1 5
5
Conifer
0 0 6 12
19
Grasslands
0 1 21 122 12
156
Oak predominant 2
2
139 42 29
214
Wetland
1 3
4
Industrial Park, AC
Agriculture (grazing) 260
0
24
285
Broadleaf non-oak 2
2
Grasslands 110
16 3 13
141
Oak predominant 7
0
7
Wetland 22
0
22
Public Lands, AC
Agriculture (grazing) 29 122 81
3 4 3
242
Grasslands 0 0 0
0
Oak predominant
0
0
Wetland 1 0
5
6
Planned Development
Agriculture (grazing) 0
18
1
19
Broadleaf non-oak
0 2 4
6
Chaparral 0
0
3 10 6
19
Conifer 0
2
0 11 8
21
Grasslands 0
0 9 0
9
Oak predominant 0
0
2 45 44 0 91
Vacant
5 30 22
57
Wetland
0 1
1
Other Land Use Zones 118 0 1 0 63 215 108 0 505
Total Acres: 10,067 502 586 423 42,073 30,526 1,231 48 85,455

38
Section 3 - Methods There are two main components of this analysis; a base model for developable area and a mathematical model of potential policy impacts. The developable area base model is spatial, created in a geographic information system (GIS) with existing and custom inputs. It was combined with other spatial data to evaluate types of land cover available for development, and to explore potential policy impacts related to vegetation type, reservoirs, and streams. The base model is subtractive. Beginning with the entire area of Napa County, areas unsuitable for conversion to agriculture have been removed. Examples of areas unsuitable for agriculture include lands with slopes over 30 percent (precluded from development by local ordinance), open water, reserves, existing agriculture, roads, railroads, and stream setbacks. “Developable” polygon areas under 1,000 square feet were removed from the analysis. Houses, driveways, and slivers were removed with hand-digitization, with most attention on the Agricultural Preserve Zone, where these features significantly skewed “developable” total area. See “1. Base Model: Existing Constraints to Development” table below for a complete list of areas removed. The base model for developable land was intersected with zoning, vegetation, soil quality, and parcel datasets to assess the distribution and total area of feature types and support a parcel-scale analysis of proposed policy impacts, which was completed in spreadsheet software. Project design is completed on an individual basis by applicants and county planning staff. Many decisions are made at that juncture, which are not possible to include in a county-scale model. For example, adjacent parcels may be managed as one contiguous area when deciding where to accomplish mitigation, which may result in more area being developed on a single parcel than would be allowed if the parcel were considered in isolation. Conversely, the adjacent parcel may have more than the required area set aside to make up the difference. Another element that determines site-scale decisions is CEQA compliance. Assessments of habitat and other environmental impacts are made during the application process. This may lead to more area being set aside to mitigate or avoid significant impacts to the environment. Modeling effects of CEQA compliance on county-wide development is beyond the scope of this analysis. Below are notes on source data considerations for select datasets and geoprocessing methods, followed by tables summarizing analysis steps.
Slope Slope was generated with LiDAR digital elevation models prepared by Towill Incorporated for the County of Napa with aerial imagery acquired in 2002. Datasets for the Napa River watershed and non-Napa River watershed were created at different spatial resolution and are distributed separately. To support a county-wide analysis, the less-resolved non-Napa River watershed dataset was resampled to match the cell size resolution of the Napa River watershed dataset, the two datasets were mosaicked, and missing data were patched with Focal Statistics to provide a continuous surface. The resulting raster was used to generate a county-wide slope dataset that was sorted into classes above and below 30 percent slope, and then converted to vector format for geoprocessing.

39
Existing Vineyard Napa County provides data on crop type in its “agriculture_public” shapefile. The most recent available version having was updated by County GIS staff in 2016. This data was hand-edited to reflect vineyard projects built between 2016 and early 2019 using aerial imagery provided by ESRI and Google Earth for reference.
Vegetation Types The Vegetation dataset for Napa County produced by James Thorne in 2002-2004 for the County of Napa was used for this analysis (Thorne 2004). The dataset is currently under revision, and the update may be incorporated in future analyses. See appendix 1 for more information on this dataset.
Streams Stream location data prepared by USGS is not extensive and not closely fitted to the LiDAR-generated digital elevation model used for slope analysis. The streams dataset is an acceptable approximation of actual streams for a county-wide analysis. A revised streams dataset would be of great benefit to Napa County, and could be produced with a watershed analysis of the LiDAR and expert digitization.
Stream Setback Buffers Fifty-foot buffers were applied to USGS blueline stream centerlines to approximate stream setback requirements. Planning staff evaluate stream setbacks on a site-by-site basis with setbacks ranging from 35 to 150 feet from bankfull depending on slope of adjacent land (Napa 2006). Theoretically, as streams get wider, adjacent slopes are lower. As permits are generally not granted to develop areas with over 30% slope, a 50-foot setback is a reasonable model choice, as it accounts for bankfull width of the stream itself plus a setback in the median range for projects on slopes less than 30 percent. Modeling site-specific stream setbacks related to slope could be accomplished with a hydrological model, but is beyond the scope of this study.
Slope % Setback < 1% 35 feet 1 - 5% 45 feet 5 - 15% 55 feet 15 - 30% 65 feet
Slope % Setback 30 - 40% 85 feet 40 - 50% 105 feet 50 - 60% 125 feet 60 - 70% 150 feet
Conservation Lands Reserves are well-represented in GreenInfo Network’s California Protected Areas Database (CPAD). This dataset was used to mask areas precluded from conversion to vineyard due to reserve status. The Napa Land Trust acquired several new properties in 2018, and these were located by researching Assessor’s records and represented by extracting parcels from the county-wide parcel dataset. There are a handful of deed restrictions and easements on portions of parcels (some related to the 60/40 rule) that were researched with the assistance of Brian Bordona and John Tuteur. These were hand-digitized based on georeferenced project planning documents.
Farmland California Department of Conservation (CDC) farmland mapping is based on soils and observed land uses (McLeod, 2018). Soil types grouped as “higher-quality farmland” are likely most desirable for

40
agriculture; however a substantial portion of recent development has occurred on lands classified by CDC as “grazing” and “other.” Vineyard conversion projects over the past 25 years have often occurred in soil classified as “other.” Trucking in of topsoil and other emerging methods for growing in difficult locations make it impossible to rule out most soil types from potential development in the near future. See appendix 2 for more information on this dataset.
Soils While soils can be an important consideration for agriculture, the potential for wine grapes to be grown on poor soils and the emerging practice of covering unsuitable soils with better material from off-site locations for agricultural development means that virtually any area meeting other criteria could be planted. With this in mind, analyses were inclusive of most soil types. Areas with serpentine-associated plant communities in the northeastern part of Napa County were excluded from the “developable” category.
Wetlands Wetland data distributed by US Fish and Wildlife Service (USFWS) were used to model wetlands in this analysis. This dataset has mixed resolution and is not guaranteed for completeness. The source data were subset to exclude riparian zones, which have overriding setback protections provided by local and state policy, represented in this analysis by water body data and buffers on USGS blueline streams.
Parcels Napa Assessor’s parcel data were cleaned and processed for analysis. Geometry was repaired. For small parcel analysis, polygons with duplicate parcel numbers were dissolved into single polygons and railroad parcels were removed before performing a one-to-one spatial join with zoning data. For county-wide parcel-scale “developable” analysis, gaps were filled before intersecting with other county-wide datasets to prevent data from dropping out of the analysis.
60/40 Rule Deed Restrictions and Conservation Easements A handful of conservation easements and deed restrictions related to the 60/40 rule were shared as geospatial data by the County of Napa, and the remainder were researched by identifying all projects were wildland was converted to agriculture in water supply drainages since 1993 and looking up deed documents at the Napa Assessors office.
Ratio and Percentage-based Policy Proposals California Environmental Quality Act (CEQA) requirements and Public Resources Code § 21083.4 allow counties to enforce 2:1 mitigation for canopy removal, preferably on site, with the possibility of counting toward mitigation lands that may be undevelopable due to local policies, such as slope limits and stream setbacks. It is not possible to predict or model off-site mitigation with any confidence. Possible on-site outcomes and the difference between allowing mitigation on undevelopable lands - or not - can be evaluated once a model of developable area is created.
Small Areal Discrepancies There are small differences in area among tallies presented here which arise from source datasets having slightly different extents or other minor issues. For example, Thorne (2004), CDC FMMP (2016), and County of Napa parcels (2019) datasets each have unique edges at the periphery of the county that do not match. Thorne has no polygon covering Napa Bay, whereas zoning data are continuous across
41
this area. Due to these and other mismatches, there may be small discrepancies when summarizing data. They should be in the range of 0 to 5 percent of the total.
42
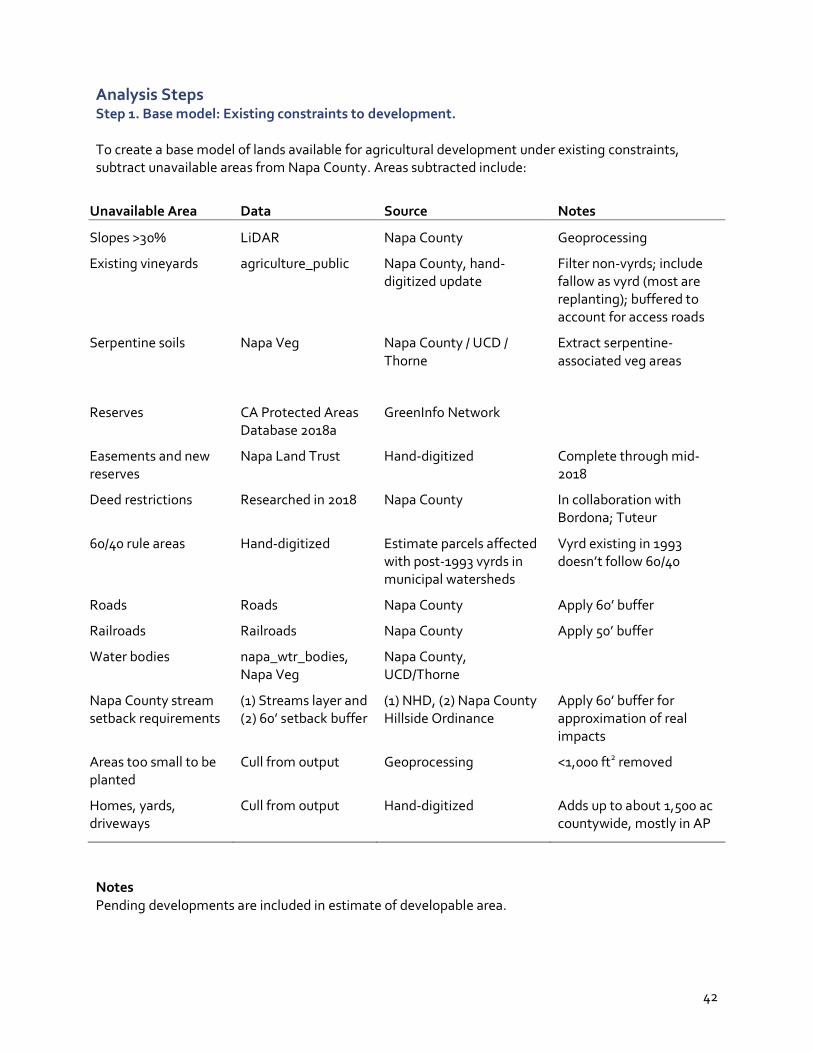
Analysis Steps Step 1. Base model: Existing constraints to development. To create a base model of lands available for agricultural development under existing constraints, subtract unavailable areas from Napa County. Areas subtracted include:
Unavailable Area Data Source Notes
Slopes >30% LiDAR Napa County Geoprocessing
Existing vineyards agriculture_public Napa County, hand-digitized update
Filter non-vyrds; include fallow as vyrd (most are replanting); buffered to account for access roads
Serpentine soils Napa Veg Napa County / UCD / Thorne
Extract serpentine-associated veg areas
Reserves CA Protected Areas Database 2018a
GreenInfo Network
Easements and new reserves
Napa Land Trust Hand-digitized Complete through mid-2018
Deed restrictions Researched in 2018 Napa County In collaboration with Bordona; Tuteur
60/40 rule areas Hand-digitized Estimate parcels affected with post-1993 vyrds in municipal watersheds
Vyrd existing in 1993 doesn’t follow 60/40
Roads Roads Napa County Apply 60’ buffer
Railroads Railroads Napa County Apply 50’ buffer
Water bodies napa_wtr_bodies, Napa Veg
Napa County, UCD/Thorne
Napa County stream setback requirements
(1) Streams layer and (2) 60’ setback buffer
(1) NHD, (2) Napa County Hillside Ordinance
Apply 60’ buffer for approximation of real impacts
Areas too small to be planted
Cull from output Geoprocessing <1,000 ft2 removed
Homes, yards, driveways
Cull from output Hand-digitized Adds up to about 1,500 ac countywide, mostly in AP
Notes Pending developments are included in estimate of developable area.
43
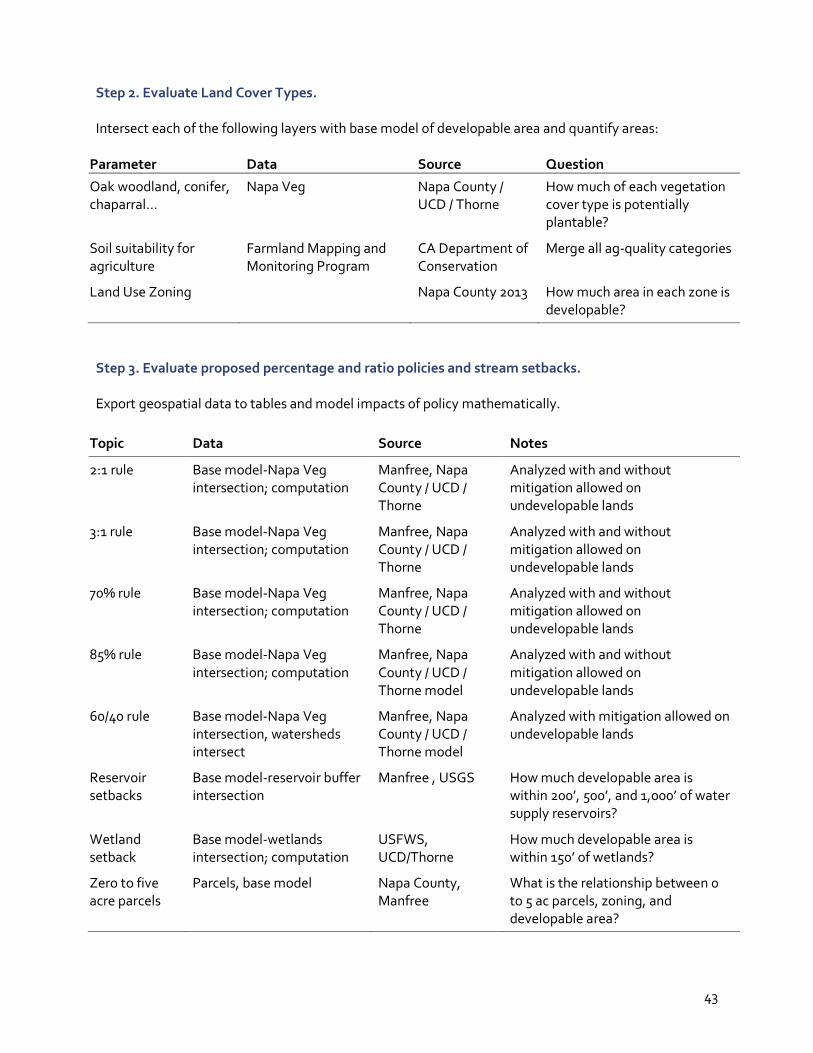
Step 2. Evaluate Land Cover Types. Intersect each of the following layers with base model of developable area and quantify areas:
Parameter Data Source Question
Oak woodland, conifer, chaparral…
Napa Veg Napa County / UCD / Thorne
How much of each vegetation cover type is potentially plantable?
Soil suitability for agriculture
Farmland Mapping and Monitoring Program
CA Department of Conservation
Merge all ag-quality categories
Land Use Zoning Napa County 2013 How much area in each zone is developable?
Step 3. Evaluate proposed percentage and ratio policies and stream setbacks. Export geospatial data to tables and model impacts of policy mathematically.
Topic Data Source Notes
2:1 rule Base model-Napa Veg intersection; computation
Manfree, Napa County / UCD / Thorne
Analyzed with and without mitigation allowed on undevelopable lands
3:1 rule Base model-Napa Veg intersection; computation
Manfree, Napa County / UCD / Thorne
Analyzed with and without mitigation allowed on undevelopable lands
70% rule Base model-Napa Veg intersection; computation
Manfree, Napa County / UCD / Thorne
Analyzed with and without mitigation allowed on undevelopable lands
85% rule Base model-Napa Veg intersection; computation
Manfree, Napa County / UCD / Thorne model
Analyzed with and without mitigation allowed on undevelopable lands
60/40 rule Base model-Napa Veg intersection, watersheds intersect
Manfree, Napa County / UCD / Thorne model
Analyzed with mitigation allowed on undevelopable lands
Reservoir setbacks
Base model-reservoir buffer intersection
Manfree , USGS How much developable area is within 200’, 500’, and 1,000’ of water supply reservoirs?
Wetland setback
Base model-wetlands intersection; computation
USFWS, UCD/Thorne
How much developable area is within 150’ of wetlands?
Zero to five acre parcels
Parcels, base model Napa County, Manfree
What is the relationship between 0 to 5 ac parcels, zoning, and developable area?

44
Step 4. Parcel analysis.
Parameter Data Source Notes Parcel-level impacts Parcels & model Napa County & analysis % available acreage per parcel
- intersection Parcel-level impacts Parcels & model Napa County & analysis Land use zones - intersection
Parcel-level impacts Parcels & model Napa County & analysis Change in development potential (mathematical)
0 to 5 acre parcels Parcels Napa County Subset parcels, dissolve by ASMT, hand-edit to clean
45
Section 4 - Discussion The analysis presented in this report integrates information in a way that can be used to assess potential broad-scale outcomes of a variety of policy constraints. It explains the distribution of land types in Napa County and presents estimates of the upward limit of development given existing constraints and prospective policies. The Bigger Picture Considering the information presented here in the context of broader concerns is key to making it useful. Global trends in environmental ethics, climate, and economics are overarching trajectories in the debate over how to best manage local resources, and they should be central to the discussion. Napa County presently has about 20,590 acres of vineyard in the Agricultural Preserve and 24,200 acres in the Agricultural Watershed zone. Particularly in the Agricultural Preserve, existing vineyards are the crown jewel of our region, and protecting them should be a top priority. The important question is not “How much more can we develop?” but rather, “How can we best preserve the value we have?” Napa County has a unique legacy of conservation and preservation, achieving great success with the establishment of the Agricultural Preserve, the Hillside Ordinance, and the Flood Control Project. Each of these projects is rooted citizen advocacy, eventually being supported and implemented by government agencies. At the time these projects emerged, they were controversial, bitterly fought, and took years to finalize. These projects have demonstrated that citizen action, when channeled effectively and combined with science, can result in local agency leadership. Thanks to these projects, Napa County’s agencies have a remarkable capacity for resource stewardship and are running exemplary programs. The current debate over conversion of wildlands to vineyard and other uses has many similarities to earlier campaigns. It is citizen-led, involves a lively debate among stakeholders, and will require careful policy-making and implementation to get right. It differs in one important way, however: the debate over wildland conversion exists with the backdrop of global climate change. Climate change is already affecting crop quality (e.g., Jones et al. 2005), though it does not yet seem to be influencing planting decisions in Napa County. There are many adjustments farmers can make to mitigate climate change impacts, reduce carbon emissions, and increase carbon storage (Mira de Orduña 2010, Mozell 2014, Neethling et al. 2017). In order to protect existing high-value farmlands into the future, every opportunity should be taken to maximize carbon storage and minimize emissions. Climate change considerations:
• Climate change projections for Napa County predict that the region will become increasingly
unfavorable for high-value wine grapes in this century (Jones 2007, Mozell 2014).
• Climate change is raising daily low temperatures faster than daily highs (Karl et al. 1993, Davy et al. 2016), and winters are warming faster than summers (Cayan et al. 2008); these shifts affect growing degree days and crop quality.
46
• California’s fog bank is expected to shrink (Johnstone and Dawson 2010, Torregrosa et al. 2013 )
• Species presence and habitat connectivity are required to facilitate movement as temperatures
shift and plants and animals must relocate to persist (Heller and Zavaleta 2009, Torregrosa et al. 2013).
• Increased carbon storage in stable sinks, such as living trees, can slow the effects of climate change. The retention of existing forests is an effective strategy because carbon is retained and increases as trees grow (Pregitzer and Euskirchen 2004).
Climate change is sometimes characterized as a looming monstrosity which is causing, or will cause, disasters of monumental scope. I suggest that the more subtle day-to-day effects will ultimately drive the biggest changes in patterns of settlement, agriculture, and economy. For example, slightly more intense storms will frequently cause minor increases in erosion, landslides, and road damage, and leave less time for groundwater infiltration in Napa’s steep drainages (Battany and Grismer 2000). Slightly higher high and higher low temperatures will shift growing degree days, affecting crop quality, suitability, and pest success (Caffarra et al. 2012). At first, these small changes will be inconvenient. Over time, they will become increasingly expensive to correct and - eventually - they will transform land use. Particularly in light of climate change, continued conversion of wildlands to agriculture in lower quality farmland areas is questionable. Low-quality and grazing lands, where most conversion of wildland to vineyard is presently occurring, are more challenging to farm. There are fewer grape varietals suitable for these locations, yields are lower that they would be in higher-quality locations, and wildland-urban interface problems, such as fire, can occasionally disrupt production. These areas are more likely to have groundwater limitations. Their climates are less temperate than the floor of Napa Valley as they are not influenced as much by coastal processes. For all of these reasons, lower-quality lands will be the first to become unprofitable as climate change impacts increase. Continuing to remove native vegetation from low-quality and grazing land types not only depletes Napa County’s best available carbon store and limits species movement, it does so in areas that will be the first to become untenable for farming as climate change progresses. This lose-lose situation should be avoided with policy that better protects wildlands and supports resilience. We can best preserve existing value by focusing on retaining forests for carbon storage and working aggressively toward emissions reduction. Saving trees is the same thing as saving vineyards. Policy Development Any new policy should be science-based, enforceable, and have on-the-ground impacts which substantively exceed the protections of current rules. Existing rules (State of California 1970; 2004) require two-to-one (66%) oak canopy mitigation, and retention of 60% of canopy and 40% of shrublands in sensitive water supply drainages, which Napa County tends to implement on-site, so this is the floor for meaningful new conservation policy. Ratio-based and percentage-based mitigation requirements are different expressions of the same mathematical concept. A 2:1 rule is a 66 percent rule, and a 3:1 ratio is a 75 percent rule. The ratio-based “2:1” language is inherited from statewide regulations, but it is important to recognize that having both a ratio-based and percentage-based mitigation requirement is pointless if other factors (such as

47
whether mitigation is permitted on undevelopable lands) are held constant, and confusing if they are not. A straightforward way to structure new policy would be to adopt a single rule that is more stringent than existing rules. Center for Biological Diversity recommends an ordinance that (1) requires retention of a minimum of 90% of existing forests and woodlands, (2) strictly limits development to slopes with less than 30% grade, (3) strongly favors on-site mitigation that leaves undeveloped areas intact, or would require 5:1 off-site mitigation within the watershed, or 10:1 mitigation outside the watershed in a location as nearby as possible (CBD 2019). These recommendations are in-line with this report, which demonstrates that allowing conservation to occur within undevelopable areas seriously undermines its effectiveness. Important water supply watersheds including Bell Canyon, Hennessey, Rector, and Milliken have proportionally large areas of chaparral and conifer cover, and less oak. To protect these water supplies, adopting broad policies that protect all land cover types and/or increasing protections to water supply watersheds is recommended. Future directions This study could be expanded and complemented with additional analyses. Some potential directions include water supply watershed analysis, carbon storage estimates, historical conditions, or an analysis of land cover in undevelopable areas. A more in-depth study of water supply watersheds to inform policy would be helpful. A GIS analysis paired with in situ water quality data would be ideal. It may be possible to estimate carbon storage using the Thorne vegetation dataset and/or a LiDAR point cloud, if available. An estimate of how current land cover compares proportionally to historical conditions could be completed by combining San Francisco Estuary Institute historical ecology data for the Napa Valley with Thorne vegetation data for wildland areas and interpolating non-conforming polygon values in rural areas. As 30 to 50% slope areas can potentially be developed with exceptions to policy, it could be relevant to evaluate land cover in these lands. Factors not addressed by this analysis There are many considerations related to development that are only possible to evaluate at the site scale, on a project-by-project basis. This county-scale analysis represents broad trends and, with luck, discrete errors will tend to cancel each other at the scale of analysis. The methods section of this report provides a basis for reproduction, comparison, and critique by stating assumptions and rationale. This assessment does not rate the relative quality of lands for carbon storage or conservation value, and it does not consider the presence of special-status species, accessibility, or willingness of owners to sell or develop properties. This report is intended to be considered together with local expert knowledge and assessments of habitat value, landscape connectivity, hydrology, etc. No attempt is made here to represent development likelihood, which is influenced by many factors such as water availability, microclimate, sun exposure, and remoteness. For individual projects, these

48
factors are important considerations, however, they are challenging to model at the county scale. Development pressure could be estimated in a follow-up study, but even then would be impossible to predict if or when individual properties may be developed. Policy effects are not analyzed in tandem with one another as their interactions are best considered at the site scale. At the county scale, it is more helpful to think about comparative policy outcomes. On-the-ground conditions may have overlap between policy outcomes and land cover types. It may be that the same square foot of ground is precluded from development by slope, stream setback, and canopy retention requirements. When adjacent parcels have the same owner, mitigation can be applied to the adjacent parcels as if they are one parcel. There is no systematic way to model this outcome, as ownership changes through time and ownership data are not readily available. Limitations and disclaimer Information presented here is intended to provide a big-picture, county-scale review of land use and land cover, and not to describe precise conditions on any given property or site. Modeling results are affected by data availability, data accuracy, and data quality. Spatial information is inherently dynamic and can be expected to change over time. It is the responsibility of users to understand data limitations and to use information appropriately. Data were generated in a conscientious, attentive manner and are reasonable estimates; however, data and related graphics are not legal documents and are not warrantied for accuracy, reliability, or completeness.

49
References Battany and Grismer. 2000. Rainfall runoff and erosion in Napa Valley vineyards: effects of slope, cover and surface roughness. Hydrological Processes, 14(7), p 1289-1304. Caffarra, Rinaldi, Eccel, Rossi, and Pertota. 2012. Modelling the impact of climate change on the interaction between grapevine and its pests and pathogens: European grapevine moth and powdery mildew. Agriculture, Ecosystems & Environment, 148 (15), p 89-101. Cayan, Maurer, Dettinger, Tyree, and Hayhoe. 2008. Climate change scenarios for the California region. Climatic Change, 87 (Supplement 1), p 21-42. https://doi.org/10.1007/s10584-007-9377-6 Center for Biological Diversity. 2019. Protecting Napa County’s Watershed Health and Biodiversity. Comment letter to Napa County Board of Supervisors. January 25, 2019. County of Napa. 1991. Conservation Regulations Section 18.108.027B “Hillside Ordinance.” Available: http://napacounty-ca.elaws.us/code/coor_title18_ch18.108. County of Napa. 2006. Conservation Regulations Brochure. Available at: https://www.countyofnapa.org/DocumentCenter/View/3374/Conservation-Regulations-Brochure-PDF?bidId=. Accessed February 2019. County of Napa. 2010. Napa County Voluntary Oak Woodland Management Plan. Available: https://www.countyofnapa.org/DocumentCenter/View/953/Voluntary-Oak-Woodland-Management-Plan---October-26-2010-PDF. Accessed February 2019. Davy, Esau, Chernokulsky, Outten, and Zilitinkevich. 2016. Diurnal asymmetry to the observed global warming. International Journal of Climatology, 37(1), p 79-93. Heller, N. E., & Zavaleta, E. S. 2009. Biodiversity management in the face of climate change: a review of 22 years of recommendations. Biological conservation, 142(1), 14-32. Johnstone and Dawson. 2010. Climatic context and ecological implications of summer fog decline in the coast redwood region. Proceedings of the National Academy of Sciences, 107 (10), p 4533-4538. https://doi.org/10.1073/pnas.0915062107 Jones, White, Cooper, and Storchmann. 2005. Climate Change and Global Wine Quality. Climatic Change, 73(3) p 319-343. https://doi.org/10.1007/s10584-005-4704-2 Jones. 2007. Climate Change: Observations, Projections, and General Implications for Viticulture and Wine Production (a review of climate change / wine grape suitability models). Journal of Viticulture and Enology. Conference proceedings, Climate and Viticulture Congress, Zaragoza, Spain. Karl, Jones, Knight, Kukla, Plummer, Razuvayev, Gallo, Lindseay, Charlson, and Peterson. 1993. A new perspective on global warming: Asymmetric trends of daily maximum and minimum temperature. Bulletin of the American Meteorological Society, 74(6), p 1007-1024.

50
MacCracken. 2011. Impact of Climate on Eastern U.S. Wine Production. George Mason University (dissertation). Accessed Jan 2019 at: http://hdl.handle.net/1920/6363 McLeod, Andrew. California Department of Conservation Farmland Mapping specialist. Personal communication. November 2018. Mira de Orduña. 2010. Climate change associated effects on grape and wine quality and production. Food Research International, 43(7), p 1844-1855. Mozell. 2014. The impact of climate change on the global wine industry: Challenges and solutions. Wine Economics and Policy, 3(2), p 81-89. Neethling et al. 2017. Assessing local climate vulnerability and winegrowers’ adaptive processes in the context of climate change. Mitigation and Adaptation Strategies for Global Change, 22(5), p 777-803. Pregitzer and Euskirchen. 2004. Carbon cycling and storage in world forests: biome patterns related to forest age. Global change biology, 10(12), 2052-2077. State of California. 2001. California Oak Woodland Conservation Act: Assembly Bill 242. Available at: http://leginfo.legislature.ca.gov/faces/billTextClient.xhtml?bill_id=200120020AB242&search_keywords=oak+woodland+conservation+act. Accessed: February 10, 2019. State of California. 2004. Public Resources Code § 21083.4. Available: http://www.search-california-law.com/research/ca/PRC/21083.4./Cal-Pub-Res-Code-Section-21083.4/text.html. Accessed: February 12, 2019. State of California. 1970. California Environmental Quality Act. 1970, revised 2004. Torregrosa , Taylor, Flint, and Flint. 2013. Present, Future, and Novel Bioclimates of the San Francisco, California Region. PLoS One. 8(3): e58450. https://doi.org/10.1371/journal.pone.0058450 White et al. 2006. Extreme heat reduces and shifts United States premium wine production in the 21st century. Proceedings of the National Academy of Sciences, 103(30), p 11217-11222. Wooster, Edwin. Rector Reservoir Water Treatment Specialist. Personal communication. February 2019.

51
Geospatial References CalAtlas. 2012. Roads, railroads. Available: http://gisarchive.cnra.ca.gov/iso/. Accessed 2012. California Department of Conservation. 2016. Farmland Mapping and Monitoring Program. Available: https://www.conservation.ca.gov/dlrp/fmmp. Accessed 2018. County of Napa. 2004. Napa County Boundary (cnty_bndry). Available: http://gis.napa.ca.gov/giscatalog. Accessed 2018. County of Napa. 2013. Zoning (zoning). Available: http://gis.napa.ca.gov/giscatalog. Accessed 2018. County of Napa. 2016. Agriculture (agriculture_public). Available: http://gis.napa.ca.gov/giscatalog. Accessed 2018. County of Napa. 2019. Roads (roads). Available: http://gis.napa.ca.gov/giscatalog. Accessed 2019. County of Napa. Date unknown. Water bodies (wtr_bodies). Available: http://gis.napa.ca.gov/giscatalog. Accessed 2018. Subset from USGS National Hydrography Dataset by Napa County staff. County of Napa ITS Department, Towill, Inc. 2002. Light Detection and Ranging (LiDAR) -based digital elevation models for Napa River watershed and non-Napa River Watershed areas of Napa County. Gesch et. al. 2002. The National Elevation Dataset. Photogrammetric Engineering and Remote Sensing 68 (1): 5-11. GreenInfo Network. 2018. California protected Areas Database 2018a. Available: https://data.cnra.ca.gov/dataset/california-protected-areas-database-2018a. Accessed 2019. Manfree. 2018. Updates to County of Napa agriculture_public dataset. Available by request. Manfree. 2018. County of Napa easements and deed restrictions. Available by request. Thorne, J.H., Kennedy, J.A., Quinn, J.F., McCoy, M., Keeler-Wolf, T. and Menke, J. 2004. A Vegetation Map of Napa County Using the Manual of California Vegetation Classification and its Comparison to Other Digital Vegetation Maps. Madroño, pp.343-363. Data available by request. Accessed 2018. US Department of Agriculture-Natural Resources Conservation Service, US Geological Survey, and Environmental Protection Agency. 2013. Watershed Boundary Dataset. Available: https://www.usgs.gov/core-science-systems/ngp/national-hydrography. Accessed 2014. US Fish and Wildlife Service. 2016. Wetlands. Available: https://www.fws.gov/wetlands/data/data-download.html. Accessed 2019.

52
US Geological Survey. 2018. Blueline streams. Available: https://www.usgs.gov/core-science-systems/ngp/national-hydrography. Accessed 2018. US Geological Survey. 2016. National Hydrography Dataset. Available: https://datagateway.nrcs.usda.gov/. Accessed 2017. US Geological Survey. 2013. Federal standards and procedures for the National Watershed Boundary Dataset; 11-A3; Section A: Federal Standards in Book 11 Collection and Delineation of Spatial Data; U.S. Geological Survey; U.S. Department of Agriculture; Natural Resources Conservation Service. Available: https://www.usgs.gov/core-science-systems/ngp/national-hydrography/watershed-boundary-dataset. Accessed 2016.

53
Appendices
Appendix 1. California Department of Conservation Farmland Mapping and Monitoring Program California Department of Conservation (CDC) Farmland Mapping and Monitoring Program (FMMP) classifications were grouped in this analysis. The “Higher quality farmland” category seen in this report includes: prime farmland, farmland of statewide importance, unique farmland, and farmland of local importance. The following information describing CDC categories has been quoted directly from the CDC website and is included for the reader’s convenience (accessed February 2019): https://www.conservation.ca.gov/dlrp/fmmp/Pages/Map-Categories,-Criteria,-and-Data.aspx Important Farmland Categories FMMP's study area is contiguous with modern soil surveys developed by the US Department of Agriculture (USDA). A classification system that combines technical soil ratings and current land use is the basis for the Important Farmland Maps of these lands. Most public land areas, such as National Forests and Bureau of Land Management holdings, are not mapped. The minimum land use mapping unit is 10 acres unless specified. Smaller units of land are incorporated into the surrounding map classifications. In order to most accurately represent the NRCS digital soil survey, soil units of one acre or larger are depicted in Important Farmland Maps. For environmental review purposes under CEQA, the categories of Prime Farmland, Farmland of Statewide Importance, Unique Farmland, Farmland of Local Importance, and Grazing Land constitute 'agricultural land' (Public Resources Code Section 21060.1). The remaining categories are used for reporting changes in land use as required for FMMP's biennial farmland conversion report. Prime Farmland
Farmland with the best combination of physical and chemical features able to sustain long term agricultural production. This land has the soil quality, growing season, and moisture supply needed to produce sustained high yields. Land must have been used for irrigated agricultural production at some time during the four years prior to the mapping date. Download information on the soils qualifying for Prime Farmland. More general information on the definition of Prime Farmland is also available.
Farmland of Statewide Importance
Farmland similar to Prime Farmland but with minor shortcomings, such as greater slopes or less ability to store soil moisture. Land must have been used for irrigated agricultural production at

54
some time during the four years prior to the mapping date. Download information on the soils qualifying for Farmland of Statewide Importance.
Unique Farmland
Farmland of lesser quality soils used for the production of the state's leading agricultural crops. This land is usually irrigated, but may include nonirrigated orchards or vineyards as found in some climatic zones in California. Land must have been cropped at some time during the four years prior to the mapping date.
Farmland of Local Importance
Land of importance to the local agricultural economy as determined by each county's board of supervisors and a local advisory committee. Download a complete set of the Farmland of Local Importance definitions in PDF format. In some counties, Confined Animal Agriculture facilities are part of Farmland of Local Importance, but they are shown separately. The status of each county regarding Confined Animal Agriculture is available in this spreadsheet.
Grazing Land
Land on which the existing vegetation is suited to the grazing of livestock. This category was developed in cooperation with the California Cattlemen's Association, University of California Cooperative Extension, and other groups interested in the extent of grazing activities.
Urban and Built-up Land
Land occupied by structures with a building density of at least 1 unit to 1.5 acres, or approximately 6 structures to a 10-acre parcel. This land is used for residential, industrial, commercial, construction, institutional, public administration, railroad and other transportation yards, cemeteries, airports, golf courses, sanitary landfills, sewage treatment, water control structures, and other developed purposes.
Other Land
Land not included in any other mapping category. Common examples include low density rural developments; brush, timber, wetland, and riparian areas not suitable for livestock grazing; confined livestock, poultry or aquaculture facilities; strip mines, borrow pits; and water bodies smaller than forty acres. Vacant and nonagricultural land surrounded on all sides by urban development and greater than 40 acres is mapped as Other Land.
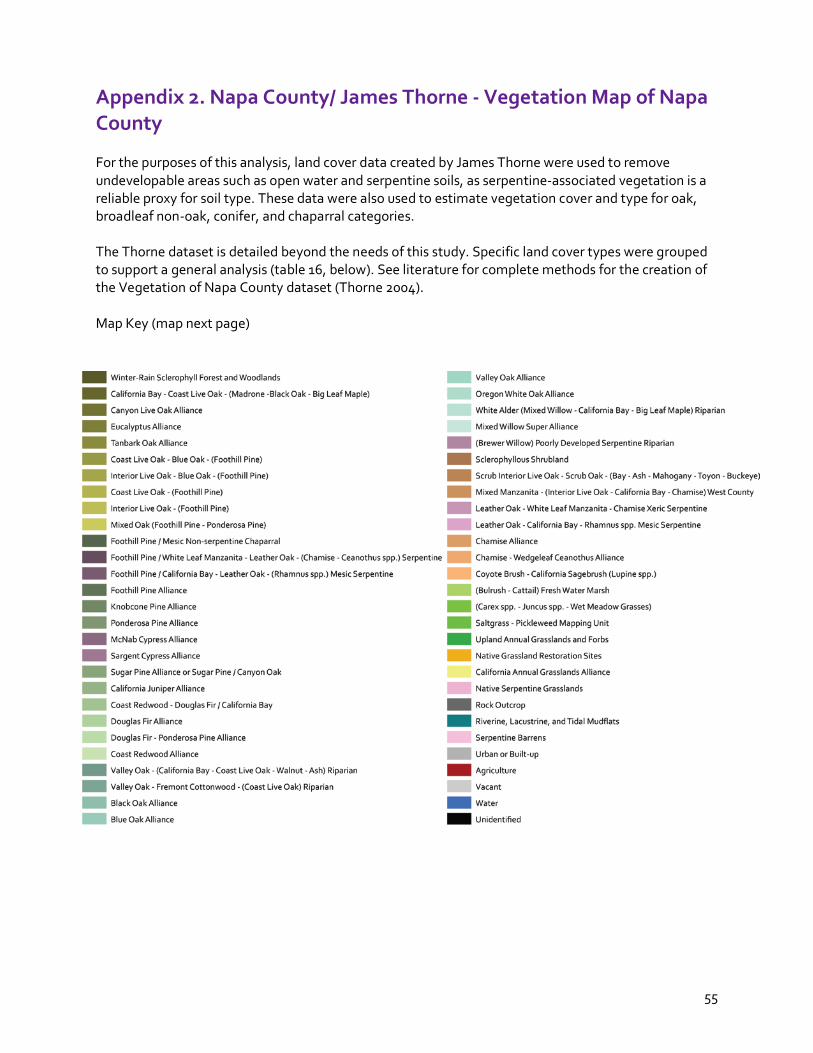
55
Appendix 2. Napa County/ James Thorne - Vegetation Map of Napa County For the purposes of this analysis, land cover data created by James Thorne were used to remove undevelopable areas such as open water and serpentine soils, as serpentine-associated vegetation is a reliable proxy for soil type. These data were also used to estimate vegetation cover and type for oak, broadleaf non-oak, conifer, and chaparral categories. The Thorne dataset is detailed beyond the needs of this study. Specific land cover types were grouped to support a general analysis (table 16, below). See literature for complete methods for the creation of the Vegetation of Napa County dataset (Thorne 2004). Map Key (map next page)

56
Figure 16. Vegetation of Napa County. Thorne et al. 2004. Key - previous page.
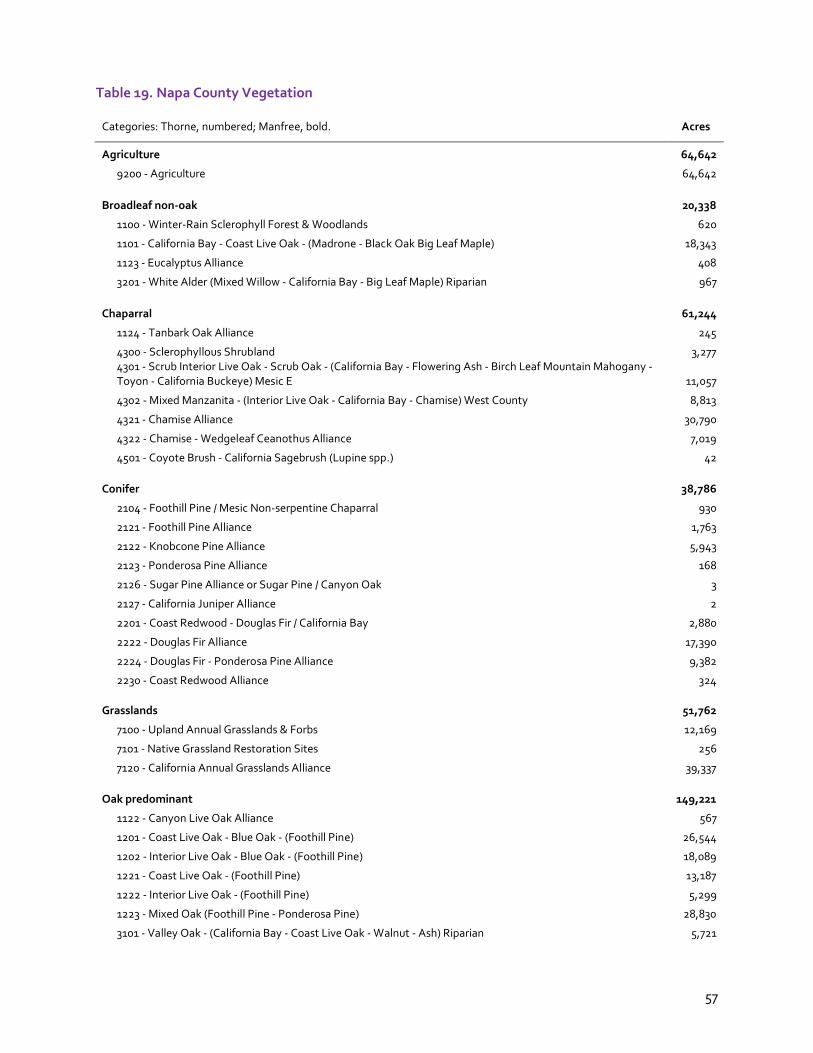
57
Table 19. Napa County Vegetation
Categories: Thorne, numbered; Manfree, bold. Acres
Agriculture 64,642
9200 - Agriculture 64,642
Broadleaf non-oak 20,338
1100 - Winter-Rain Sclerophyll Forest & Woodlands 620
1101 - California Bay - Coast Live Oak - (Madrone - Black Oak Big Leaf Maple) 18,343
1123 - Eucalyptus Alliance 408
3201 - White Alder (Mixed Willow - California Bay - Big Leaf Maple) Riparian 967
Chaparral 61,244
1124 - Tanbark Oak Alliance 245
4300 - Sclerophyllous Shrubland 3,277
4301 - Scrub Interior Live Oak - Scrub Oak - (California Bay - Flowering Ash - Birch Leaf Mountain Mahogany - Toyon - California Buckeye) Mesic E 11,057
4302 - Mixed Manzanita - (Interior Live Oak - California Bay - Chamise) West County 8,813
4321 - Chamise Alliance 30,790
4322 - Chamise - Wedgeleaf Ceanothus Alliance 7,019
4501 - Coyote Brush - California Sagebrush (Lupine spp.) 42
Conifer 38,786
2104 - Foothill Pine / Mesic Non-serpentine Chaparral 930
2121 - Foothill Pine Alliance 1,763
2122 - Knobcone Pine Alliance 5,943
2123 - Ponderosa Pine Alliance 168
2126 - Sugar Pine Alliance or Sugar Pine / Canyon Oak 3
2127 - California Juniper Alliance 2
2201 - Coast Redwood - Douglas Fir / California Bay 2,880
2222 - Douglas Fir Alliance 17,390
2224 - Douglas Fir - Ponderosa Pine Alliance 9,382
2230 - Coast Redwood Alliance 324
Grasslands 51,762
7100 - Upland Annual Grasslands & Forbs 12,169
7101 - Native Grassland Restoration Sites 256
7120 - California Annual Grasslands Alliance 39,337
Oak predominant 149,221
1122 - Canyon Live Oak Alliance 567
1201 - Coast Live Oak - Blue Oak - (Foothill Pine) 26,544
1202 - Interior Live Oak - Blue Oak - (Foothill Pine) 18,089
1221 - Coast Live Oak - (Foothill Pine) 13,187
1222 - Interior Live Oak - (Foothill Pine) 5,299
1223 - Mixed Oak (Foothill Pine - Ponderosa Pine) 28,830
3101 - Valley Oak - (California Bay - Coast Live Oak - Walnut - Ash) Riparian 5,721

58
3102 - Valley Oak - Fremont Cottonwood - (Coast Live Oak) Riparian 520
3121 - Black Oak Alliance 2,221
3122 - Blue Oak Alliance 44,220
3123 - Valley Oak Alliance 2,889
3124 - Oregon White Oak Alliance 1,136
Rock outcrop 1,738
9001 - Rock Outcrop 1,738
Serpentine 53,494
2105 - Foothill Pine / White Leaf Manzanita - Leather Oak - (Chamise -Ceanothus spp.) Xeric Serpentine 7,958
2106 - Foothill Pine / California Bay - Leather Oak - (Rhamnus spp.) Mesic Serpentine 7,280
2124 - McNab Cypress Alliance 2,415
2125 - Sargent Cypress Alliance 2,044
3202 - (Brewer Willow) Poorly Developed Serpentine Riparian 277
4303 - Leather Oak - White Leaf Manzanita - Chamise Xeric Serpentine 26,994
4304 - Leather Oak - California Bay - Rhamnus spp. Mesic Serpentine 4,395
7130 - Native Serpentine Grasslands 2,087
9003 - Serpentine Barrens 44
Wetland 5,089
3221 - Mixed Willow Super Alliance 539
6402 - (Bulrush - Cattail) Fresh Water Marsh 271
6403 - (Carex spp. - Juncus spp. - Wet Meadow Grasses) 275
6501 - Saltgrass - Pickleweed 3,573
9002 - Riverine, Lacustrine, and Tidal Mudflats 432
Water 28,815
9400 - Water 28,815
Urban 26,465
9100 - Urban or Built-up 26,465
Vacant 1,787
9300 - Vacant 1,787
Unidentified 1,571
9999 - Unidentified 1,571
Total Acres: 504,951
59
Appendix 3. Amber Manfree Curriculum Vitae Education Ph.D., Geography, University of California, UC Davis, September 2014. Dissertation: Landscape Change in Suisun Marsh Available: https://pqdtopen.proquest.com/doc/1629429650.html?FMT=ABS Advisor: Dr. Peter Moyle Awards: 2015 Kinsella Memorial Prize in recognition of the Outstanding Graduate Research Dissertation in the College of Agricultural and Environmental Sciences at UC Davis Master of Arts, Geography, UC Davis, December 2012. Specialty in GIS and Geographic Techniques, minor in Plant Ecology Advisor: Dr. Peter Moyle Geographic Information Systems (GIS) Competency Certificate, Santa Rosa Junior College, 2009. Bachelor of Arts, Environmental Studies, Sonoma State University, September 1999. Emphasis in Media Studies. Research Experience Postdoctoral research, UC Davis, 2014 - 2018. Research in ecological effects of drought in the Sacramento-San Joaquin Delta. Research in Floodplain Ecology and fish ecology in Suisun Marsh. Doctoral Research, UC Davis, 2012 - 2014. Read and synthesized historical record for Suisun Marsh, described 200 years of landscape change based on the anthropological record, explorers journals, the map record, and other sources. Designed animated maps to communicate content of the Suisun Marsh Fish and Invertebrate Study dataset. Masters Research, UC Davis, 2006 - 2012. Characterized hydrogeomorphic change in Suisun Marsh based on the map record and other sources. Research Assistant, Center for Watershed Sciences (CWS), UC Davis, 2011 - 2014. Editing, cartography, and graphic design for Suisun Marsh: Ecological History and Possible Futures (book) and California Drought Summit program. Microsoft Access database management and GIS support for research and CWS publications. Research Assistant, Landscape Analysis and Systems Research Laboratory, UC Davis, 2006 - 2011. Modeled landscape-scale impacts of water use patterns in residential neighborhoods. Publications
Opperman, Jeffrey J., Peter B. Moyle, Joan L. Florsheim, Eric W. Larsen, and Amber D. Manfree. Floodplains: processes and management for ecosystems. UC Press, Berkeley, (2017).
60
Baumsteiger, Jason, Robert E. Schroeter, Teejay A. O’Rear, Jonathan D. Cook, Amber D. Manfree and Peter B. Moyle. Factors affecting distribution and abundance of a trio of invasive Black Sea jellyfish in San Francisco Estuary, California. PLOS ONE (in Press). Manfree, Amber D. Napa County strings together a ‘living’ river. July 2015. California WaterBlog, UC Davis Center for Watershed Sciences. http://californiawaterblog.com/2015/07/29/napa-county-strings-together-a-living-river-2/ Moyle, Peter B., Amber D. Manfree, and Peggy L. Fiedler, editors. 2014. Suisun Marsh: Ecological History and Possible Futures. UC Press, Berkeley, CA. Manfree, Amber D. in Moyle, Peter B., Amber D. Manfree, and Peggy L. Fiedler, editors. 2014. Historical Ecology of Suisun Marsh. UC Press, Berkeley, CA. Moyle, Peter B., Amber D. Manfree, and Peggy L. Fiedler. 2013. The Future of Suisun Marsh: Balancing Policy with Change. San Francisco Estuary and Watershed Science, 11(3). Manfree, Amber D. Drought journal: Search for Sierra fish goes from bad to worse. August 2014. California WaterBlog, UC Davis Center for Watershed Sciences. http://californiawaterblog.com/2014/08/18/drought-journal-search-for-sierra-fish-goes-from-bad-to-worse/ Manfree, Amber D., and Peter Moyle. May 2014. Planning for the inevitable at Suisun Marsh. May 1, 2014. California WaterBlog, UC Davis Center for Watershed Sciences. http://californiawaterblog.com/2014/05/01/planning-for-the-inevitable-at-suisun-marsh/
Presentations and Posters
Manfree, Amber D. Warming up to (Climate) Change. How studying landscape change can help communities adjust to a shifting environment. Presented at the 2016 Okanagan Water Board Annual Meeting. Manfree, Amber D. Exploring a long-term fish dataset with ArcGIS animation tools. Presented at the at 2015 Annual ESRI User Conference. Manfree, Amber D. The Fishes of Suisun Marsh: Exploring and Communicating 35 years of research with data animations. Presented at the at 2015 Annual California Geographical Society Conference. Manfree, Amber D. Landscape-scale aquatic reconciliation in the North Delta Arc. Presented at the 2015 Annual Meeting of the California-Nevada Chapter of the American Fisheries Society. Manfree, Amber D. Garden Nurseries and Trophic Relays: Spatial partitioning by fish size class in the Arc reflects higher juvenile recruitment and foraging success in regions of high pelagic food production. Presented at the 2015 Interagency Ecological Program Workshop. Manfree, Amber D., Peter B. Moyle. Thirty-Five Years of Fish Studies in Suisun Marsh: Perspectives and Animations. Presented at the 2014 8th Biennial Bay-Delta Science Conference.

61
Manfree, Amber D. A new look at the fishes of Suisun Marsh. Presented at the 2014 Annual Meeting of the California-Nevada Chapter of the American Fisheries Society. Manfree, Amber D., Peter B. Moyle, Peggy L. Fiedler. Suisun Marsh, past and prospects: Highlights from the forthcoming book with UC Press. Presented at the 2013 11th Biennial State of the Estuary Conference. Manfree, Amber D. Suisun Marsh historical ecology: Notoriously swampy and overflowed lands. Presented at the 2012 7th Biennial Bay-Delta Science Conference. Manfree, Amber D. Historical Ecology of Suisun Marsh. Poster presented at 2011 Annual California Geographical Society Conference. Manfree, Amber D. Modeling wet and dry weather water quality in Sacramento County’s urban residential areas. Presented at the 2010 Annual California Geographical Society Conference. Manfree, Amber D., Andrew Bale, Steven Greco, Loren Oki, Darren Haver, Jay Gan, Sveta Bondarenko. Modeling the effects of landscape best management practices on water quality in urban residential areas. Presented at the2010 239th Annual American Chemical Society Conference. Manfree, Amber D., Steven Greco, Andrew Bale. Modeling the effects of household-scale BMPs in urban residential zones. Presented at the 2009 Annual Meeting of the American Association of Geographers.
Cartographic work Comprehensive Conservation and Management Plan. 2016. San Francisco Estuary Partnership. State of the Estuary Report. 2015. San Francisco Estuary Partnership. Connolly Ranch welcome map interpretive signage. 2014. Napa Land Trust and Connolly Ranch. The Shifting Cultural Landscape of the San Francisco Bay Area, 1772 - 1846. 2013. Self-published. Watersheds of California. 2010. Self-published. Teaching Experience Instructor Introduction to GIS, 2017, 2018, and 2019 courses for the UC Davis Extension GIS for Watershed Analysis, 2018 course for the UC Davis Extension Communicating with Maps, 2018 course for the UC Davis Extension GIS Methods for Hydrology, Spring 2016 and Summer 2014 Practical GIS for Field Research, Fall 2012 and Spring 2013

62
Teaching Assistant Introduction to Geographic Information Systems, Fall 2011 Site Ecology for Landscape Architects, Spring quarters 2007 - 2010 History of Landscape Architecture, Winter 2007 Curriculum Development Led development of GIS curriculum plan for undergraduate studies at UC Davis; effort sponsored by James Quinn at the UC Davis Information Center for the Environment, Fall 2009 Guest Lectures
Careers in GIS. September, 2018. Invited by Professor Alison McNally to lecture undergraduate students at Cal-State Stanislaus. How Historical Ecology informs our Sense of Place. July, 2017. Invited by instructor Sahoko Yui to lecture to UC Berkeley Landscape Architecture students about applying historical research to Landscape Design. What does it mean to design with nature? November, 2012. Invited by Dr. Claire Napawan to lecture to UC Davis Landscape Architecture students in introductory course. Lectured on environmental ethics, landscape change geography, and reconciliation ecology. GIS, GPS, and Cartography. June 2012. Napa Valley Personal Computer Users Group. Genetics and Evolution for Landscape Architects, Spring 2010. Guest lecture to students in Site Ecology for Landscape Architects.
Community Service Suisun Marsh Complete Marsh Project, 2017, 2018 Suisun Marsh Fish and Invertebrate Study field sampling, 2008-2016. Bodega Bay Annual Field Survey volunteer, 2009, 2010, 2011, 2014, 2017 North Bay Fish Study (Hobbs; Napa, Sonoma, and Petaluma creeks), 2016 Outdoor education modules for Napa Resource Conservation District student field trips, 2014, 2015 Organized tour of Napa River restoration projects for UC Davis affiliates, 2015 South San Francisco Bay Salt Ponds Fish Study, 2014 Pine Creek Annual Fish Survey (Modoc County), 2010 Putah Creek Annual Field Survey, 2009