sumida presentation template
TRANSCRIPT

SUMIDA CORPORATION
Performance Briefings
<for FY2019 Q1 ending March 31, 2019>
May 8, 2019

Today’s Speakers
2Copyright© 2018 SUMIDA CORPORATION. All rights reserved. 2
Representative Executive Officer & President
Tomoharu Suseki
Representative Executive Officer & CFO
Yoshiyuki Honda

Today’s Program
Copyright© 2018 SUMIDA CORPORATION. All rights reserved. 3
1. FY2019 Q1 Consolidated Financial Results
CFO Yoshiyuki Honda
2. FY2019 Q1 Performance Results & Management Policies
President Tomoharu Suseki
3. Q&A Session

FY2019 Q1 Consolidated Financial Results
Yoshiyuki Honda
CFO
Copyright© 2018 SUMIDA CORPORATION. All rights reserved. 4

Copyright© 2019 SUMIDA CORPORATION. All rights reserved.
(Million yen)
Consolidated Quarterly Income StatementComparison vs. Previous Year, Quarter
2018 Q1 2018 Q4 2019 Q1 Change % Change %
(A) (B) (C) (C)/(A) (C)/(B)
S a l e s 22,701 25,314 23,198 2.2% △8.4%
G r o s s I n c o m e 2,913 4,089 3,089
GI % 12.8% 16.2% 13.3%
Operating Income 456 1,559 600 31.4% △61.5%
OI % 2.0% 6.2% 2.6%
F inanc ia l Income
/ E x p e n s e s ( N e t )△15 △344 △334
Income before Taxes 441 1,215 265 △39.8% △78.1%
I n c o m e T a x e s △127 △542 △147
Income Attributableto Owners of Parent
287 661 114 △60.2% △82.7%
E P S ( y e n ) 10.76 24.51 4.22
5
Highest-ever Q1 sales with operating income growing from Q1 last year

Operating Income Analysis2018 Q1 → 2019 Q1
6
2018 Q1OperatingIncome
456
(Million yen)
2019 Q1Operating Income
600
FOREXimpact+184
Costsreduction
+140
China wagesup
-180Others+102
Copyright© 2019 SUMIDA CORPORATION. All rights reserved.
Expensesreduction
+46
CapacityUtilization
down-168
Operating income increased due to the weak renminbi, improvement of production efficiency and reduction of raw material prices etc.
Product mix-136
Production efficiency
up+156

Operating Income Analysis2018 Q4 → 2019 Q1
CapacityUtilization
down-157
7
2018 Q4OperatingIncome1,559
Productionefficiency
down-60
(Million yen)
2019 Q1Operating Income
600
Costs reduction
+69
Others-42
Copyright© 2019 SUMIDA CORPORATION. All rights reserved.
FOREXimpact
-86
China wagesup-90
Sales/Product mix
-344
Operating income decreased due to decrease of sales/unfavorable product mix, increase of R&D expenses and lower capacity utilization etc.
R&D Exp.up
-249

Consolidated Statement of Financial Position
2018Dec 31
2019Mar 31
Change
Current Asset 46,292 46,496 203
Cash & Cash Equivalent 4,098 5,551 1,453
Trade & Other Receivables 19,102 18,501 △600
Inventories 18,983 18,200 △782
Others 4,109 4,242 133
Non-current asset 47,984 51,801 3,817
Tangible Asset 33,754 33,427 △327
Right-of-use asset - 4,355 4,355
Intangible Asset 6,183 6,040 △143
Goodwill 4,266 4,255 △11
Deferred Asset 2,225 2,193 △32
Others 1,553 1,529 △24
TOTAL ASSETS 94,277 98,298 4,021
2018 Dec 2019 Mar
Current Ratio 1.54 1.57
Net DE Ratio 1.05 1.08
CCC(days) 110 112
2018Dec 31
2019Mar 31
Change
Current Liabilities 30,155 29,696 △459
Trade & Other Liabilities 10,392 8,896 △1,495
Interest-bearing Loans 15,541 16,181 640
Others 4,222 4,618 396
Non-current Liabilities 28,682 33,782 5,099
Interest-bearing Loans 24,666 29,693 5,026
Others 4,016 4,089 73
TOTAL LIABILITIES 58,838 63,479 4,640
TOTAL NET EQUITY 35,438 34,818 △619
Equity attributable to equity holders of parent
33,829 33,211 △617
Minority Interest 1,609 1,607 △2
TOTAL LIABILITIES & EQUITY
94,277 98,298 4,021
USD/yen 110.21 110.77
euro/yen 126.15 124.35
renminbi/yen 16.01 16.42
(Million yen)
Copyright© 2019 SUMIDA CORPORATION. All rights reserved. 8
Non-current assets & liabilities increased as operating lease assets & liabilities were newly recorded (IFRS No. 16).

Consolidated Statement of Cash Flow
2018 Jan-Mar 2019 Jan-Mar Change
Cash Flow from Operating Activities 1,480 2,217 736
Income before Taxes 441 265 △175
Depreciation & Amortization 913 1,283 370
Net Working Capital 991 254 △737
Others △865 413 1,279
Cash Flow from Investing Activities △2,198 △1,804 393
Capital Investments △2,056 △1,657 398
Others △142 △146 △4
Cash Flow from Financing Activities 861 1,050 188
Net Interest-bearing Debts 1,607 1,528 △78
Dividend Payment △721 △243 477
Payment of distributions to owners of
other capital instruments- △51 △51
Others △24 △183 159
Cash & Cash Equivalent at end of period 5,329 5,551 221
(Million yen)
Copyright© 2019 SUMIDA CORPORATION. All rights reserved.
Capital investments continued
9

Copyright© 2019 SUMIDA CORPORATION. All rights reserved. 10
Tomoharu Suseki
President
FY2019 Q1 Performance Results
& Management Policies

Copyright© 2019 SUMIDA CORPORATION. All rights reserved. 11
Sales by Quarter
USD 109.67 107.92 110.74 112.93 110.23
Euro 133.77 130.06 129.18 129.67 125.74
◼ 2019 Q1 Sales grew by
2.2% from 2018 Q1, but
largely dropped from Q4
last year
◼ Achieved biggest-ever
Q1 sales in 2019
227.0 238.4
256.8 253.1
232.0
120
Q1
2018
Q2 Q3 Q4 Q1
2019(yen)
(+2.2%)
(100 million yen )

Copyright© 2019 SUMIDA CORPORATION. All rights reserved. 12
Sales by Market 2018 Q1→2019 Q1
41.71 43.78
2018 Q1 2019 Q1
147.78 150.01
2018 Q1 2019 Q1
Growth rate was extremely low on the whole. Sales of many existing products did not grow, but those of EV-, actuator-related expanded.
Automotive+ 1.5%
Industry
+ 5.0%
37.52 38.20
2018 Q1 2019 Q1
Consumer Electronics
+ 1.8%
(100 million yen )
Industry sales increased due to expansion of actuator-related sales in the U.S.
Sales of smartphone-related existing key products grew.

108.38 101.09
2018 Q1 2019 Q1
Copyright© 2019 SUMIDA CORPORATION. All rights reserved. 13
Sales by Region 2018 Q1→2019 Q1
48.11 48.55
2018 Q1 2019 Q1
◼ In China, overall sales did not grow. Market-wise, automotive dropped sharply while Consumer electronics grew.
◼ In North America, sales largely increased as Pontiac’s sales were added in 2019.
◼ In Europe, overall sales did not grow as automotive-related dropped sharply.
Asia excl. China/Taiwan
+ 0.9% 53.1348.22
2018 Q1 2019 Q1
China/Taiwan
- 9.2%
17.39
37.12
2018 Q1 2019 Q1
North America/Others
+113.5%
Europe
- 6.7%
(100 million yen)
Copyright© 2019 SUMIDA CORPORATION. All rights reserved. 14
Operating Income 2018 Q1→2019 Q1
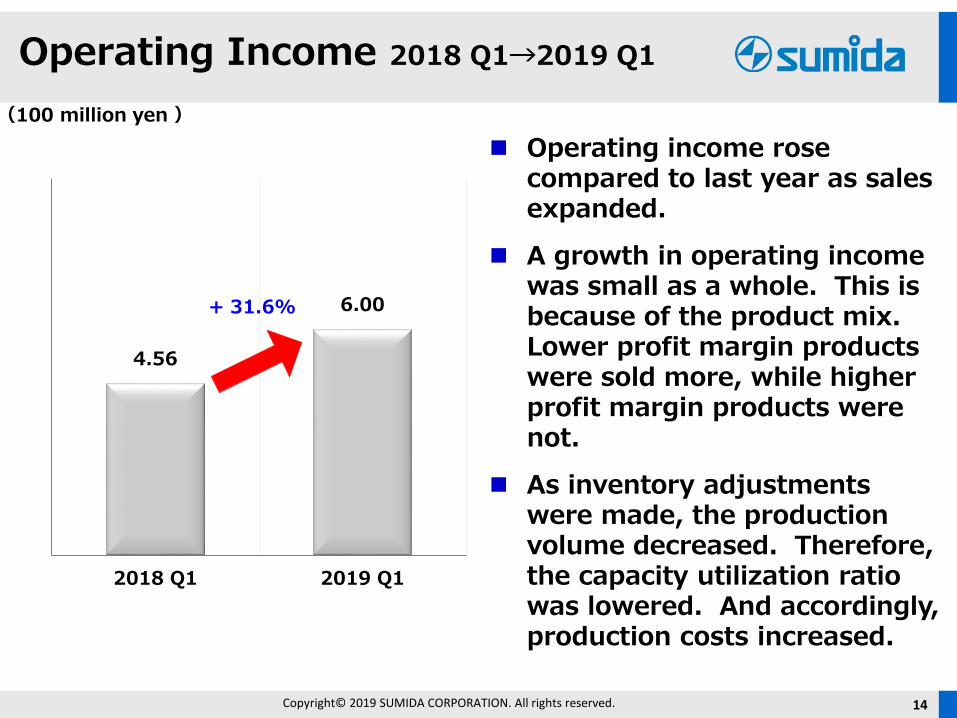
4.56
6.00
2018 Q1 2019 Q1
◼ Operating income rose compared to last year as sales expanded.
◼ A growth in operating income was small as a whole. This is because of the product mix. Lower profit margin products were sold more, while higher profit margin products were not.
◼ As inventory adjustments were made, the production volume decreased. Therefore, the capacity utilization ratio was lowered. And accordingly, production costs increased.
+ 31.6%
(100 million yen )

Copyright© 2019 SUMIDA CORPORATION. All rights reserved. 15
Outlook for Q2
◼ Comparison with Q1
✓ Overall demand is improving gradually, not strongly though.
✓ Flagship automotive business started recovering, while a
difficult situation continues in Europe.
✓ Sales in both industry and consumer electronics markets are
improving.
◼ Factors that may significantly affect our profit and loss conditions for Q2 onwards
✓ Effectiveness in Q2 of the China’s new policies for economic
growth that were announced in Q1
✓ Status of new car sales in Europe and the U.S.
✓ Impacts of Brexit on European economies
✓ Status of production of smartphones and launching of new
products
✓ Impacts on capacity utilization ratio by inventory adjustments
based on sales forecast for Q3 onwards

Copyright© 2019 SUMIDA CORPORATION. All rights reserved. 16
New sales Office in India
(as announced on April 16, 2019)
Company name Sumida Electric (India) Private Limited
Location Bengaluru, Karnataka, India:Room # 2236, Regus World Trade Centre,Brigade Gateway Campus,Rajajinagar Extn, Malleshwaram (W),Bengaluru 560055
Representatives Prasad Bakre, Fumiaki Sawada, Toh Meng Lee
Established January, 2019
Line of business Selling of electronic components
Fiscal-year end December 31
Capital 26 million India Rupee(owned 100% by Sumida group)
Start of operation April 15, 2019
Profile of the OfficeProfile of the Office
New sales office was established in India as part of our mid-term business plan, based on which we intend to further promote our sales activities focusing on automotive and industrial markets

Disclaimer Regarding Forward Looking Statements
Copyright© 2012 SUMIDA CORPORATION. All rights reserved. 17
Sumida Corporation (referred to as "Sumida") makes this document available for informational
purposes only. This document contains certain “forward-looking statements” which reflect
management’s current views and the assumptions made with respect to specific future events
and financial performance. Such statements are based on currently available information, and
by their nature are subject to various risks and uncertainties that could cause actual results to
differ materially from those projected or implied in “forward-looking statements” and from
historical trends.
These risks include but are not limited to domestic and global economic business conditions,
successful execution of our strategy and our ability to realise the resulting benefits, our ability
to develop and market new products, changes in legislation, legal claims, changes in exchange
and interest rates, changes in tax rates, actuarial assumptions, raw materials and employee
costs, our ability to restructure our operations, the rate of technological changes, political,
economic and other developments in countries where Sumida operates, industry consolidation
and competition. As a result, Sumida’s actual future results may differ materially from the plans,
goals and expectations set forth in such forward-looking statements. Sumida is under no
obligation to, and expressly disclaims any obligations to, update or alter its forward-looking
statements, whether as a result of new information, subsequent or otherwise.
Sumida is under no liability of any person in respect of any loss and damage which may be
suffered or incurred or which may arise directly or indirectly in respect of information contained.
All rights, including, but not limited to the copyright, reserved. No part of this document may be
reproduced in any means without the prior written permission of Sumida.

Copyright© 2019 SUMIDA CORPORATION. All rights reserved. 18
Thank you!