suit - uliege.be sustainable development of urban historical areas through an active integration...
TRANSCRIPT

SUITSustainable development of Urban historical areas through an active Integration within Towns
Task 2.3- Morphological Indicators System
Task leader: LEMATask partners: LEMA, KA
Author: Jacques Teller
LEMA June 2002
This deliverable was produced under the SUIT project in the EU Program Energy, Environment andSustainable Development, Key Action 4 : The City of Tomorrow and Cultural Heritage,
Theme 4.2.3. : Foster Integration of Cultural Heritage in the Urban SettingSUIT contract number : EVK4-CT-2000-00017 SUIT
2
SummaryThe report deals with the analysis of urban open spaces, once conceived as part and parcel of oururban heritage. It introduces a mathematical modelling technique that is capable of mapping thevariation of the sky visible from points distributed throughout the space.
The resulting maps overcome the limits of orthographic (plan, section & elevation) andperspective methods of analysis, by considering the dynamic qualities of the Gibsonian “visualworld” that takes account, not only of bifocal vision, but also of the relatively free movement ofthe head and shoulders, i.e. vision as part of the human ecology. The maps show how a personmight experience those volumes of a void that define a space, not from a fixed point, but frommoving about inside the entire urban open space.

3
Content list
1. Introduction.....................................................................................................................42. Field-oriented open space analyses ..................................................................................5
2.1. Two-dimensional analyses .......................................................................................62.2. The use of external references..................................................................................7
3. Indicators based on spherical analyses .............................................................................73.1. Sky opening.............................................................................................................93.2. Mean and characteristic view lengths .....................................................................103.3. Skyline regularity...................................................................................................123.4. Eccentricity and Spread .........................................................................................14
4. Application to a case study ............................................................................................164.1. Sky opening maps..................................................................................................174.2. Comparison with other open spaces .......................................................................18
5. Conclusions...................................................................................................................206. References.....................................................................................................................21

4
1. Introduction
Urban open spaces can be understood in a variety of ways depending on the scientific approachadopted to define and describe them. This notion actually appears to be closely related topolitical, social or environmental concepts, like the public realm (Joseph, 1992), meeting places(Sennet, 1990) or green areas (Expert Group on the Urban Environment, 1996). From amorphological point a view, urban open spaces are usually defined as the empty space, or thevoid, separating the built volumes and surfaces. Defined as such, its shape would obviously becharacterized by a relation of strict duality with the “filled elements” that surround it: buildings,vegetation, fences and screens. Accordingly, an open space will be considered as “dominant”when its geometrical form tends to determine the building layout. In some cases, this relation ofdominancy implies a deformation of the walls of the buildings, as in the case of the place desVictoires in Paris where the façades are incurved to better delineate the circular open space. In thecase of the place des Vosges in Paris, the relation of dominancy explains the partial autonomy ofthe open space towards the urban pattern it was inserted in. This type of spatial organisationalways indicates some form of social organisation governing the construction of the space, may itresult of the fait du Prince or of the continued efforts of a highly integrated society (Lavedan,1941). On the opposite, the open space is usually termed “residual” when its geometry appears tobe determined by the capricious layout of built structures. Its character would then rely upon thedelicate coordination of all the individual buildings.
The dominant type of spatial organisation has long been mistaken for the mere notion of urbandesign itself. Actually regular, dominant spaces were often considered in the literature as superiorto residual ones which were almost denied any intrinsic quality in the “evolutionist” viewepitomised by the modern movement (see for instance Giedeon, 1941). As brilliantly illustratedby Bacon (1967), this postulate appears to be falsified by numerous outstanding examples ofresidual open spaces like, for instance, the Athens Agora of the Hellenistic period or somemedieval Italian places. Remarkable historical examples of residual open spaces can be foundamongst a number of other authors, from Sitte (1945) to Kostoff (1991). It could be argued thatthese residual spaces are somehow exceptional, and that they are either accidental orcharacteristic of the pre-modern period, once considered as a sort of lost paradise. Still, the sameremark could be addressed to most dominant spaces, as many of them date from the renaissanceand baroque periods. Furthermore, one could easily find residual spaces of great quality withincontemporary urban settings, as for instance the esplanade of la Defense in Paris or the squaresand parks of Barcelona (Rowe, 1997 ; Favole, 1995). Arguably, these last examples would leadsome authors to consider that the collapse of the enclosed perspective space is a key aspect of thenew visual urban space (see for instance Chelkoff and Thibaud, 1992).
It has to be acknowledged that there is not a strict dichotomy between dominant and residualopen spaces. As suggested by Thiel (1961), these prototypical situations should rather beunderstood as the two extremes of a continuum, ranging from “vagues” to “volumes”; hence theneed to develop an analysis method that can be applied to the entire spectrum of urban openspaces to characterise their shape. The present paper proposes a new metric to analyse complexopen spaces. It begins by examining existing methods of open space analysis. This reviewdistinguishes between two different approaches: the traditional Euclidean analyses, and theemerging field-oriented approaches. Spherical indicators are then introduced and discussed, as

5
they appear to combine the advantages of both sets of methods. These indicators are then beapplied to a real-world situation, the analysis of place Saint-Lambert in Liege, as a “live testing”of the methodology. Finally, the environmental assessment of projects and plans affecting urbancultural heritage is suggested as a possible application for this kind of metric.
2. Field-oriented open space analyses
Urban open spaces are “virtual” by nature. They are not a material element of the physical world,like a building, road or row of trees. Furthermore, open space is a continuous medium. Usuallythe two-dimensional enclosure of a place or street is not complete, even though there arenotorious exceptions to this statement (like the forum at Pompei, for instance). The limits ofurban open spaces can thus be quite fuzzy or contestable.
Notwithstanding these properties, urban open spaces were often treated as “open air rooms” sincethe Renaissance. Such an analogy basically postulates that, even though virtual and continuous,the shape of an urban open space can be reduced to a composition of elementary geometricvolumes. The properties of these volumes, or so-called “urban boxes”, can then be characterisedthrough simple Euclidean ratios as proposed by Albertian theories. The most notorious of theseEuclidean ratios is probably the prospect of a place (ratio of height over the mid-length of thesquare). According to Spreiregen (1965), this ratio should lie between 1:1 and 1:3. Moresophisticated Euclidean ratios have also been proposed in the literature, as, for instance, the 3Dcompactness of urban open spaces (Dupagne and Teller, 1999).
Obviously, such a conceptual model is not neutral because it tends to favour the above-mentioneddominant spatial configurations, which are easy to assimilate to finite volumes. From a moretheoretical stance, it can be argued that the “urban box” model tends to disregard thecontemporary conception of the space, where the identity of objects is not given a priori—as inthe case of “urban boxes”—but constructed by experience. Following Couclecis (1992), one canindeed distinguish between two main spatial ontologies, namely the atomist and plenumconceptions of the space.
In the atomist conception, space is assimilated to a simple referential where objects are identifiedand defined by clear and stable limits (a point, a line, a surface). The objects exist independentlyof their attributes (colour, texture etc.) and can be manipulated in space (through translations,rotations, scaling etc) without altering their identity. This conception is mostly pertinent forquotidian objects of our world, which we can handle directly, like a chair, a piece of paper etc. Inprinciple, urban open space does not belong to this type of object. Its limits are not entirelymaterial, and it can never be “handled”. Its identity derives from the position and characteristicsof the surrounding buildings. Accordingly, the notion of “urban boxes” is nothing but an analogy.It is nevertheless quite structuring given the ubiquity of the atomist ontology. It assumes thatmentally we tend to organise open space as defined by discrete entities, similar to the objects weinteract with in our daily lives.
We have already noted that residual urban spaces somehow resist this kind of simplification, astheir boundaries are often unclear or even unstable. Moreover, the identity of a place can bedetermined by a series of external factors that do not belong to it once reduced to a box—for

6
instance, landmarks and glimpses (Lynch, 1960), tactile or olfactory sensations (Hall, 1966), oreven cultural and behavioural references (Rapoport, 1975). Typically the plenum conceptionpostulates that the space does not exist a priori. rather, its definition would results from thesingular combination of a whole series of factors, such as the dominant axes, the layout of builtmasses etc. These different factors tend to affect configurations of attributes, which can be moreor less homogeneous and stable. Accordingly the plenum ontology tends to view a space as acontinuous field, like the image of a “magnetic field”. In this conception of space, it is easy toconceive that the boundaries of urban open spaces can be fuzzy and heavily reliant upon externalconditions,—modification of building mass at one point of the system, for instance. Thisontology also accommodates possible overlaps between different open spaces. As such, it is quiteclose to the notions of territory and territoriality formalised by the anthropological sciences. Italso corresponds to the ecological model of perception proposed by Gibson (1950), as it tends toconsider dynamic variations as the mainstay of our interaction with the environment.
The plenum conception of the space underlies some recent spatial analysis methods: isovist fields(Benedikt, 1979 ; Turner et al, 2000 ; Batty, 2001), space syntax (Hillier & Hanson, 1984), andconvex partitions (Peponis et al, 1997). All of these methods share an interest in variations withinspace conceived as a continuous substrate. According to this approach, spatial configurations areproposed as a privileged way to characterise the identity of open spaces. When compared totraditional Euclidean ratios, these methods are nevertheless characterised by two majordrawbacks: they do not fully consider the third dimension, and they do not support comparison ofspaces.
2.1. Two-dimensional analyses
The different field-oriented methods outlined above have all been developed for the analysis ofplans, either of buildings or urban patterns. Though some authors claim that their method couldbe applied to three-dimensional spatial configurations (Turner et al, 2000), it is usually neitherdeveloped nor tested. Hillier rejects the utility of a three-dimensional analysis: "Perhaps contraryto appearances, human spatial organisation is not three-dimensional in the same sense that it istwo-dimensional – for the simple reason that human beings do not fly and buildings do not floatin the air. Human space is in fact full of strategies – stairs, lifts, etc. – to reduce the tree-dimensional structures to the two dimensions in which human beings move and order space."(Hillier & Hanson, 1984) Even if there is some truth in this, does it still justify ignoring theheight of the buildings surrounding our view? It probably depends on the scale of analysis andthe type of urban pattern. In actual spaces, buildings exhibit large variations in height, especiallyin contemporary urban environments. These variations may have strong perceptual effects even ifobserved along a two-dimensional path.
The method of isovist fields could probably be generalised at the third dimension, especiallysince its computation is based on the graph theories proposed by Turner et al (2000). It wouldtherefore be sufficient to consider the topological relations between points located in a plan and a3D grid filling the entire space. Still, this would only apply to spatial configurations whoseoverall limits can be fixed beforehand, namely bounded spatial configurations, such as spaceswithin a building. Urban open space is not like this, as it is never entirely enclosed: the sky is itsonly ceiling and is usually assumed to be at an infinite distance from the observer. Theapplication of isovist fields to the three-dimensional analysis of urban configurations would thus

7
require an arbitrary height limit for unbounded open space. Such a limit would probably be hardto justify from a theoretical point of view.
2.2. The use of external references
Case-based reasoning is common practice when analysing or designing a space. It has beenargued that, contrary to its claims, the modern movement did not escape entirely from the use ofhistorical references (Colquhoun, 1972). The use of actual references, well known to the differentstakeholders, promotes rapid convergence on a common language between the parties to a designdecision (Teller, 2002).
An urban open space analysis method has to afford some comparability between the measurestaken within entirely distinct systems if it claims to support this practice. This proves to be quitedifficult with the different field-oriented approaches proposed until now. Their main efficiencylies in the internal comparison between points, lines or sub-systems of a given system. They arenot really suited to comparisons between separate, distinct systems. The attributes of isovistfields for instance rely on the global dimensions of the spatial system. It means that a measuretaken at one point of the configuration will vary with the global scale of the system. Integrationof axial lines is dependent upon the overall system complexity. Only e-partition indicators allowcomparison between one system and another. Peponis et al (1997) have used them in this way tocompare “Fallingwater” with Farnsworth House, respectively designed by Frank Lloyd Wrightand Mies van der Rohe. However, the proposed indicators seem to be very sensitive to the levelof detail of the basic geometrical model. The options taken when modelling the space may thushave a larger effect than the overall shapes themselves (Teller, 2001). It is not compatible withcurrent urban models whose level of detail (for reasons of computational efficiency) is notusually uniform.
3. Indicators based on spherical analyses
The open space metric we have developed is based on the use of spherical projections. It has tobe stressed that the use of spherical views to analyse urban open spaces is not entirely new, but ithas mostly been applied in the field of energy analysis. Markus and Morris (1980) describe aspherical construction method for calculating solar paths and masks. More recently, Bosselmann(1998) has used fisheye photographs to analyse and compare solar availability within urban openspaces in San Francisco. In relation to these approaches, the main originality of our work lies inthe development of morphological indicators derived from spherical views, and their subsequentapplication to the field-oriented analysis of open spaces. Spherical views of urban scenes shouldhence be computed automatically, on numerical models of urban scenes, so as to allow such alarge-scale application.
The spherical projection of a 3D point is computed in two stages: 1) projection of the point fromthe 3D Cartesian space to a 2D sphere and 2) projection from the 2D sphere to a plane. Thecomputer algorithm to perform spherical projections of faces and volumes has been described inTeller and Azar (2001). Its input is a three-dimensional model of the urban environment in DXFformat.
8
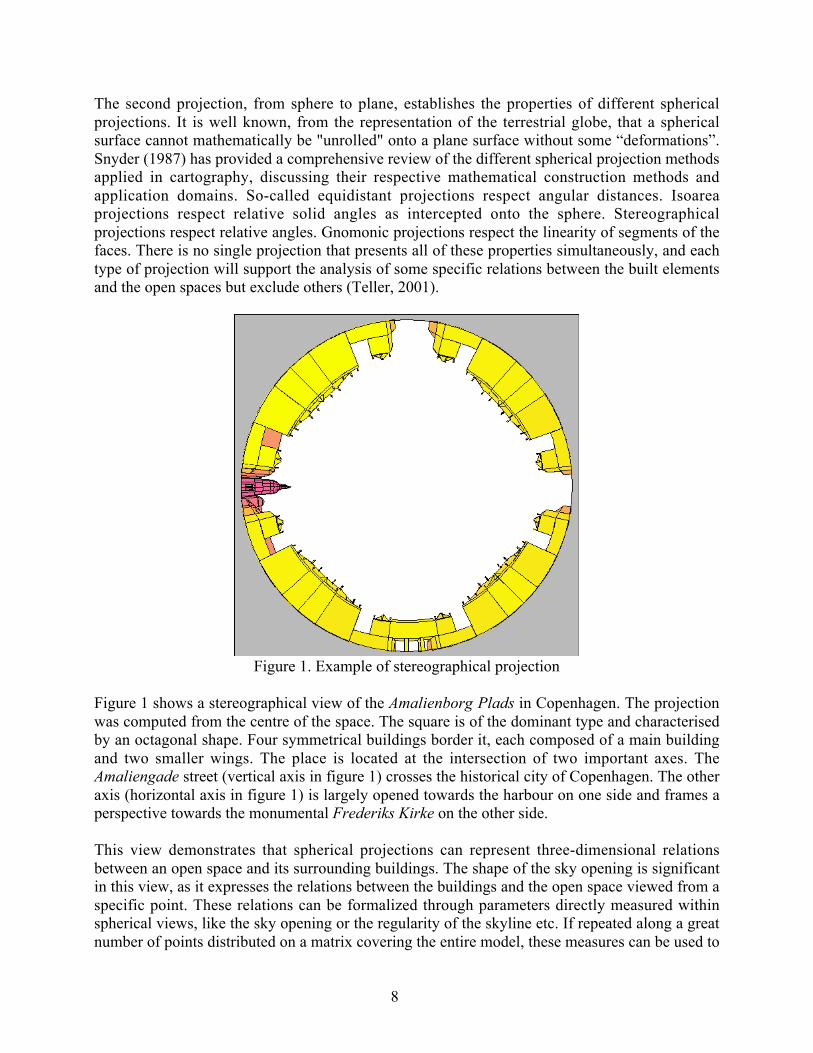
The second projection, from sphere to plane, establishes the properties of different sphericalprojections. It is well known, from the representation of the terrestrial globe, that a sphericalsurface cannot mathematically be "unrolled" onto a plane surface without some “deformations”.Snyder (1987) has provided a comprehensive review of the different spherical projection methodsapplied in cartography, discussing their respective mathematical construction methods andapplication domains. So-called equidistant projections respect angular distances. Isoareaprojections respect relative solid angles as intercepted onto the sphere. Stereographicalprojections respect relative angles. Gnomonic projections respect the linearity of segments of thefaces. There is no single projection that presents all of these properties simultaneously, and eachtype of projection will support the analysis of some specific relations between the built elementsand the open spaces but exclude others (Teller, 2001).
Figure 1. Example of stereographical projection
Figure 1 shows a stereographical view of the Amalienborg Plads in Copenhagen. The projectionwas computed from the centre of the space. The square is of the dominant type and characterisedby an octagonal shape. Four symmetrical buildings border it, each composed of a main buildingand two smaller wings. The place is located at the intersection of two important axes. TheAmaliengade street (vertical axis in figure 1) crosses the historical city of Copenhagen. The otheraxis (horizontal axis in figure 1) is largely opened towards the harbour on one side and frames aperspective towards the monumental Frederiks Kirke on the other side.
This view demonstrates that spherical projections can represent three-dimensional relationsbetween an open space and its surrounding buildings. The shape of the sky opening is significantin this view, as it expresses the relations between the buildings and the open space viewed from aspecific point. These relations can be formalized through parameters directly measured withinspherical views, like the sky opening or the regularity of the skyline etc. If repeated along a greatnumber of points distributed on a matrix covering the entire model, these measures can be used to
9
study the variation of a given parameter throughout the open space. The matrix of attributes thusobtained can then be represented as a field, emphasising the dynamic experience of an openspace, a central concern of the ecology of vision developed by Gibson (1950).
Spherical projections can transform an unbounded 3D environment into a mathematicallybounded 2D view in a clear and controllable way. This ability has two important implications forthe analysis of urban open spaces as a field of attributes. Firstly, the analysis of an unbounded,continuous space, such as an urban open space, becomes trivial because the points located at aninfinite distance, the sky for instance, will be projected within the reference area. As a result, it isno longer necessary to fix an arbitrary vertical dimension, as in other field-oriented approaches.Addressing the 3D nature of the built environment does not entail any extra calculation as it isinherent to the spherical projection. Secondly, the dimension of the projection area is one of theparameters of the computation. It is not influenced by characteristics of the space. This referencedimension can be used to “normalise” the different computations, which greatly facilitatescomparison between different open spaces and the use of external references in case-basedreasoning.
As has been said earlier, it is possible to retrieve many parameters from spherical projections.There are indeed many types of projections, and several indicators can be proposed for each typeof projection. In this paper we present four such indicators: sky opening, view lengths, verticalheights distribution and moments of inertia. The construction of each indicator and its applicationto the urban open space analysis is introduced and discussed below.
3.1. Sky opening
The sky opening is defined as the amount of sky visible from a point. In an isoarea projection, itis given by the proportion of sky area upon the surface of a circle. This indicator varies accordingto a ‘massing factor’ characterizing the relations between the buildings and the open space,observed from a given point. It will be equal to 0% in a totally enclosed volume and 100% in aclear field. As such, it should correlate with the feeling of confinement perceived at a point, evenif one knows that this feeling depends of a number of other factors such as the colours of facades,the presence of glimpses, the ground declivity etc. The spatial variation of the sky opening ischaracteristic of the modification of the massing factor within a space.

10
Figure 2 – Sky opening map of the royal places of Nancy
Sky opening maps can be used to singularise points and/or areas that appear to be central asindicated by this parameter. This operation is far from trivial when building heights vary, eventhough the ground surface is regular. This is particularly well illustrated by the case of the systemof Baroque places in Nancy (figure 2). The sky opening map confirms the existence of an overallspatial structure and of different types of connections between the three main open spaces: theplace Stanislas (left), the place de la Carrière (centre) and the place Royale (right). In the placeStanislas, it can be observed that the centre of massing does not coincide with the geometricalcentre of the base rectangle (the centre is materialised by a statue). A significant shift is due to therelative height of the pavilions framing the triumphal arch (of 5 meters height) when compared tothe other buildings surrounding the space (of some 20 meters height). The whole space is thus“oriented” towards the place de la Carrière.
This characteristic of the place explains the overall triangular shape of the sky opening curves inthe centre of the place. A symmetrical phenomenon can be observed on the place Royale, due tothe shape of the colonnade framing the open space. Accordingly the overall spatial structure ofthe urban setting is one of two poles in close intertwining, thanks to subtle variations in thebuilding heights. It clearly appears through the sky opening graph. The dynamic path between thetwo extreme places is thus punctuated by different interruptions and diaphragms more or lesstransparent : the two pavilions, the triumphal arch and the double row of trees.
3.2. Mean and characteristic view lengths
The notion of sky opening is intended to convey the idea that a set of large and distant volumemay have a visual mass quite similar to a set of smaller volumes, closer from the observer. Therationale of this indicator, therefore, lies in the fact that it is a relative measure, which can be usedto compare open spaces with different absolute dimensions. Such a relative indicator also has its
11
own limits, as it totally neglects the importance of the urban scale. The calculation of scale factormust consider the view length distribution of faces surrounding an observer. When consideringthe distances of faces surrounding a point, and the solid angle they project on the sphere, it ispossible to build two indicators: the mean view length (Lm) and the characteristic view length(Lcar).
L m =
Si x L iSi = 1
n
S iSi = 1
n
L car = L m x Sref
SiSi = 1
n
The mean view length is very similar to the measure of the area of an isovist, in that it heavilyrelies upon the global dimensions of the open space. In highly regular configurations,characterised by a simple geometrical figure and almost constant building heights, the value ofthe mean view length in the centre of the space will be roughly equal to half the dimension of thespace. When applied to residual configurations, this indicator gives an idea of the overalldimension of the open space, but the mean view length does not really support comparisonbetween different configurations. In fact, the mean view length of a mask located at 50 metersfrom an observer and occupying 80% of the sky will be equal to one for a mask at a similardistance, but occupying 20% of the sky. The characteristic view length is intended to differentiatebetween such situations, through a weighting of the mean view lengths according to the maskarea. This last value is of course theoretical. However, it can be used to compare very differentspaces, with quite distinct morphologies.
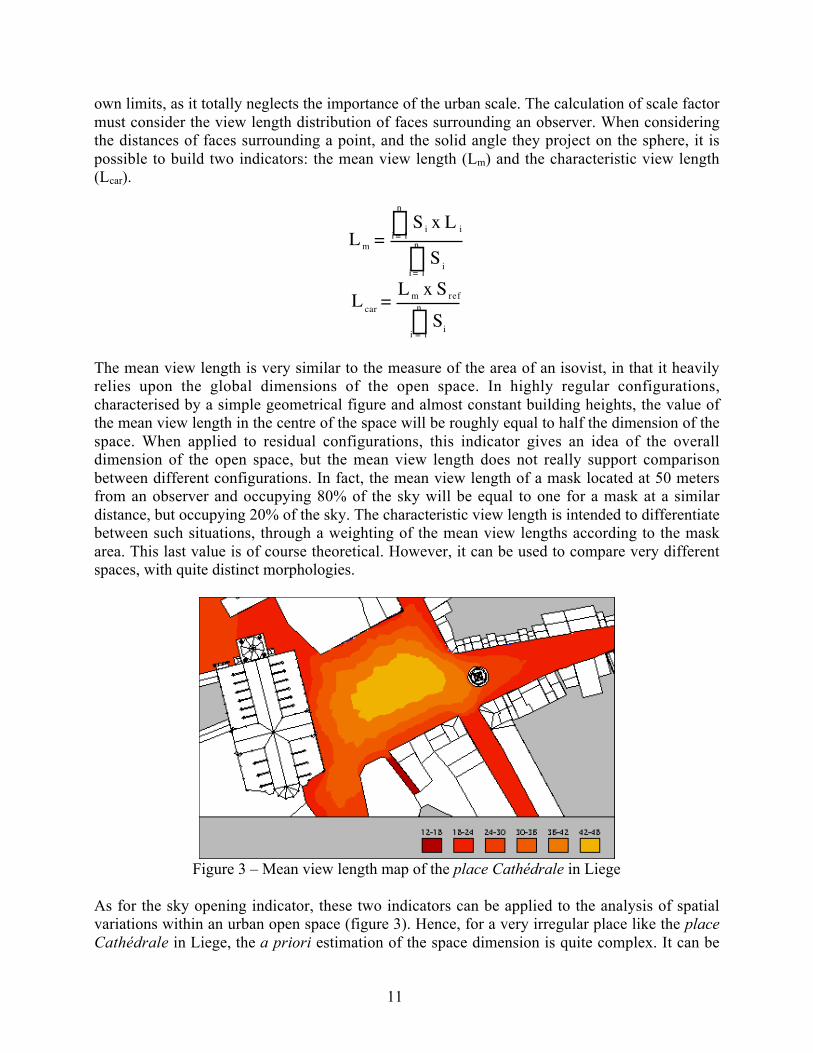
Figure 3 – Mean view length map of the place Cathédrale in Liege
As for the sky opening indicator, these two indicators can be applied to the analysis of spatialvariations within an urban open space (figure 3). Hence, for a very irregular place like the placeCathédrale in Liege, the a priori estimation of the space dimension is quite complex. It can be

12
seen from the graph that the mean view length of this square is 47 metres, while the dimensionsof the base rectangle are 63 * 83 meters. The fact that the mean view length is larger than themaximal half dimension of the base rectangle, or 41.5 meters, can be explained by the presenceof a large and deep opening on the axis of the rectangle. This opening widens the spaceconsiderably, as perceived from the central area. It can be further stressed that despite this largeopening the central area remains largely contained by the base rectangle, given the presence of animportant statue that breaks the otherwise continuous scale decrease between the two openspaces.
3.3. Skyline regularity
The urban layout can have a considerable influence upon the relative heights of the buildings.This is entirely disregarded by Cartesian indicators because they focus on the absolute height ofbuildings or even street prospects, and which treat the regularity of building heights in simplemono-dimensional terms. By contrast, it can be interesting to consider the statistical distributionof angular heights as they are observable from a given point. It would can be used to evaluate theregularity of the skyline as it is actually perceived from the urban open space. This type ofanalysis should typically be realised as an equidistant projection, a spherical projection thatrespects angular heights. This is not the case for the isoarea projections that were used for skyopening and view length distribution analyses.
As it is representative of the relative dispersion of a statistical distribution, standard deviation hasbeen proposed as our main indicator of skyline regularity. It is calculated from the azymuthaldistribution of building angular heights, measured in an equidistant projection. It can besupplemented by other statistical indicators such as the mean, maximal and minimal values, butthese are mostly accompanying figures which help to interpret the standard deviation (Teller,2001).

13
Figure 4 – Variation of the angular height standard deviation
This technique has been applied to the place des Vosges in Paris (figure 4). The trees havedeliberately not been included in the 3D model, in order to focus on the structure of the Royalplace, in its initial XVIIth century configuration, before its transformation into a square in 1797(Joffet, 1957). It can be seen on the map that the standard deviation observable in the place desVosges is quite small. It is equal to 1.9 degrees in the centre and remains less than 10 degrees inmost of the space. In some spatial configurations, a standard deviation of 10 degrees will be theminimum observable. The observed regularity of angular heights can be explained through theuniformity of the facades and roofs of this place. The fact that the place base adopts the shape ofa perfect square also contributes to the regularity.
It should be remembered that the standard deviation is quite limited in scope, as it basically tendsto compare the shape of the skyline with a circle, centred on the origin and with a radius equal tothe mean angular height. Accordingly, the standard deviation observable in a street will alwaysbe quite important, given that its overall shape in spherical projection tends towards an oblongellipse, regardless of the constancy of building heights. This definition of regularity cannot bemistaken for the notion of “morphological deviation” or “continuity” which are measured in twodimensions (Maïzia, 1999).
14
3.4. Eccentricity and Spread
A statistical indicator like the standard deviation is intended to operate on an ordered distributionof values, the angular heights observable from one point in our case. It neglects what truly makesa shape, namely the relations between these values. An alternative way to analyse a skyline is toconsider the sky as a true figure, in gestaltist terms, as suggested in the seminal work of Arnheim(1977). This figure can then be characterised by geometrical properties, like compactness,directionality, symmetry etc. We propose two main shape factors, namely eccentricity andspread, based on the moments of inertia of a shape. The sky shape is therefore treated as anhomogeneous surface. It is computed in stereographical view as this spherical projection ismathematically “conform” and thus better respects the appearance of shapes.
The moment i,j of an homogeneous shape is given by the following formula :
Mi,j = xi yj dx dy
The order of a moment is given by the sum of i and j in the previous expression. The area of ashape is given by its moment of order 0 (M00). This value is totally independent of the positionand orientation of the reference axes used to calculate the integral. The position of the barycentreis given by the ratio between first order moments (M10 and M01) and M00. The second order isalso characterised by significant properties. In opposition to the zero order moment, the values ofM02, M20 and M11 will vary according to the position and orientation of the reference axes. Thepreferential orientation of the axes will then be given by the eigen values of the inertia matrix,namely:
Matrice d'inertie = M2 0 M1 1
M1 1 M0 2
I1 =M2 0 + M0 2 – (M2 0 – M0 2)
2 + 4 M1 1
2
I 2 =M 2 0 + M0 2 + (M2 0 – M0 2) 2 + 4 M 1 1
2
The value I1 corresponds to the smaller M02 moment of the shape. The value I2 is the maximalvalue of M02 when the reference axes are located on the barycentre. Interestingly these twovalues characterise mass distribution within a shape. As such they are heavily used in mechanicsas well as in image analysis. In our case, it is the ratio between these two inertia values that willbe of most use. Actually, these values can be used to build two a-dimensional parameters,independent of the area of the analysed shape, namely the eccentricity (E) and the spread (S).

15
S = Spread =
I1 + I2
Area2
E = Eccentricity =I1
I2
The value of eccentricity and spread for three elementary shapes, a circle, a rectangle and a cross,is given in table 1. In the first case, the value of d1 is equal to the radius of the circle. In thesecond case the values of d1 and d2 are equal to the width and length of the rectangle. In the lastcase, the value of d1 is equal to the width of the cross branches, while d2 is equal to their length.
d1 d2 Spread Eccentricity
circle 20 0.159 1.000
rectangle 20 20 0.167 1.000
20 40 0.208 4.000
20 100 0.433 25.000
cross 20 20 0.187 1.000
20 40 0.263 1.000
20 100 0.506 1.000
Table 1 – Spread and eccentricity of elementary shapes
It can be seen from this graph that the eccentricity of a circle, a square and a cross are equal to 1.This is because these are perfectly symmetrical shapes, considered from their gravity centre. Foreach point (x, y) of the shape, there exists a point (-x, -y) also belonging to the shape. The twoinertia axes will thus have the same value. It can also be observed that the eccentricity of arectangle increases very rapidly with its elongation (ratio of height over width). This is becausethe inertia axes vary as the fourth power of the base dimensions of the shape. The eccentricity canthus be considered as representative of the “anisotropy” of the shape.
It is possible to calculate these coefficients describing the shape of the sky within a sphericalprojection, to measure the anisotropy of the open space, as perceived from specific points. Whenthis calculation is repeated along a great number of points, it highlights the variation ofanisotropy throughout the space.
16
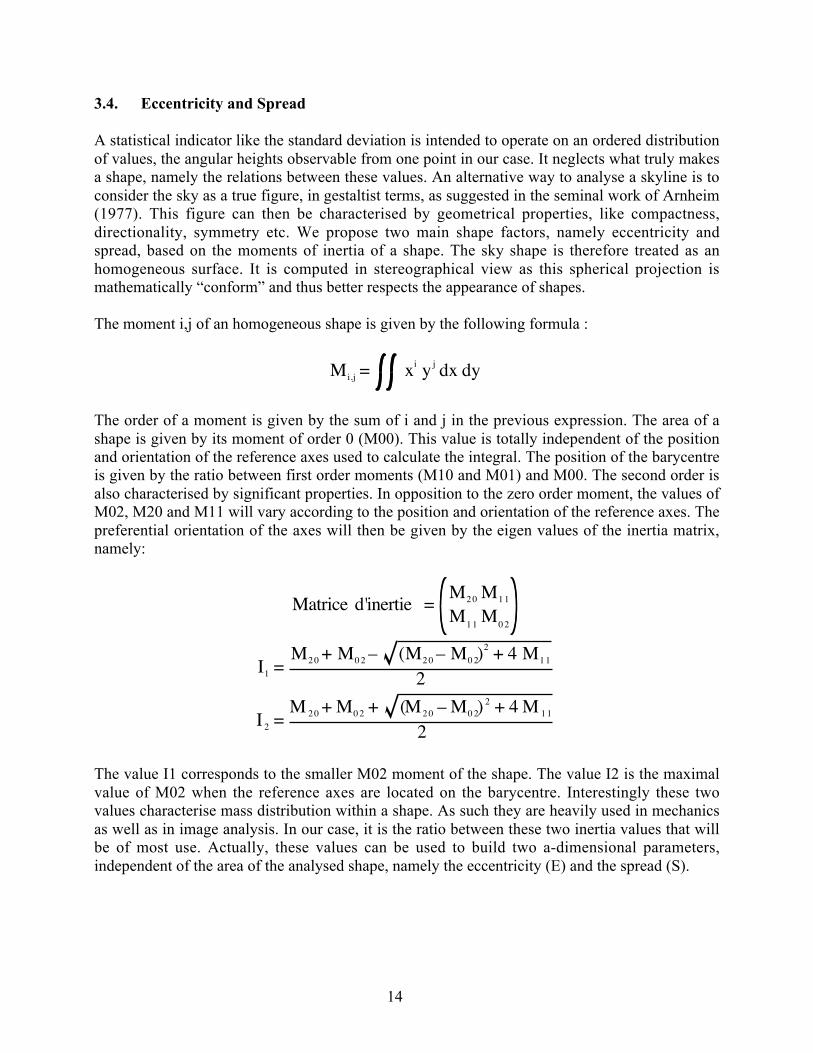
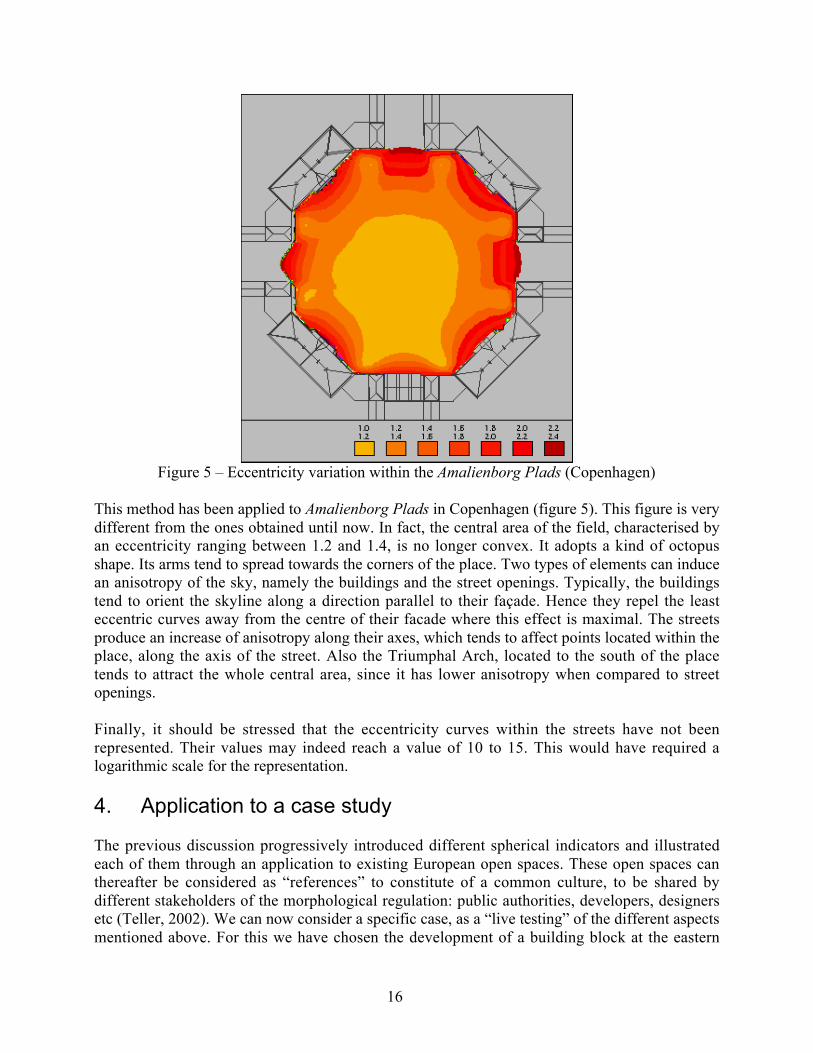
Figure 5 – Eccentricity variation within the Amalienborg Plads (Copenhagen)
This method has been applied to Amalienborg Plads in Copenhagen (figure 5). This figure is verydifferent from the ones obtained until now. In fact, the central area of the field, characterised byan eccentricity ranging between 1.2 and 1.4, is no longer convex. It adopts a kind of octopusshape. Its arms tend to spread towards the corners of the place. Two types of elements can inducean anisotropy of the sky, namely the buildings and the street openings. Typically, the buildingstend to orient the skyline along a direction parallel to their façade. Hence they repel the leasteccentric curves away from the centre of their facade where this effect is maximal. The streetsproduce an increase of anisotropy along their axes, which tends to affect points located within theplace, along the axis of the street. Also the Triumphal Arch, located to the south of the placetends to attract the whole central area, since it has lower anisotropy when compared to streetopenings.
Finally, it should be stressed that the eccentricity curves within the streets have not beenrepresented. Their values may indeed reach a value of 10 to 15. This would have required alogarithmic scale for the representation.
4. Application to a case study
The previous discussion progressively introduced different spherical indicators and illustratedeach of them through an application to existing European open spaces. These open spaces canthereafter be considered as “references” to constitute of a common culture, to be shared bydifferent stakeholders of the morphological regulation: public authorities, developers, designersetc (Teller, 2002). We can now consider a specific case, as a “live testing” of the different aspectsmentioned above. For this we have chosen the development of a building block at the eastern
17
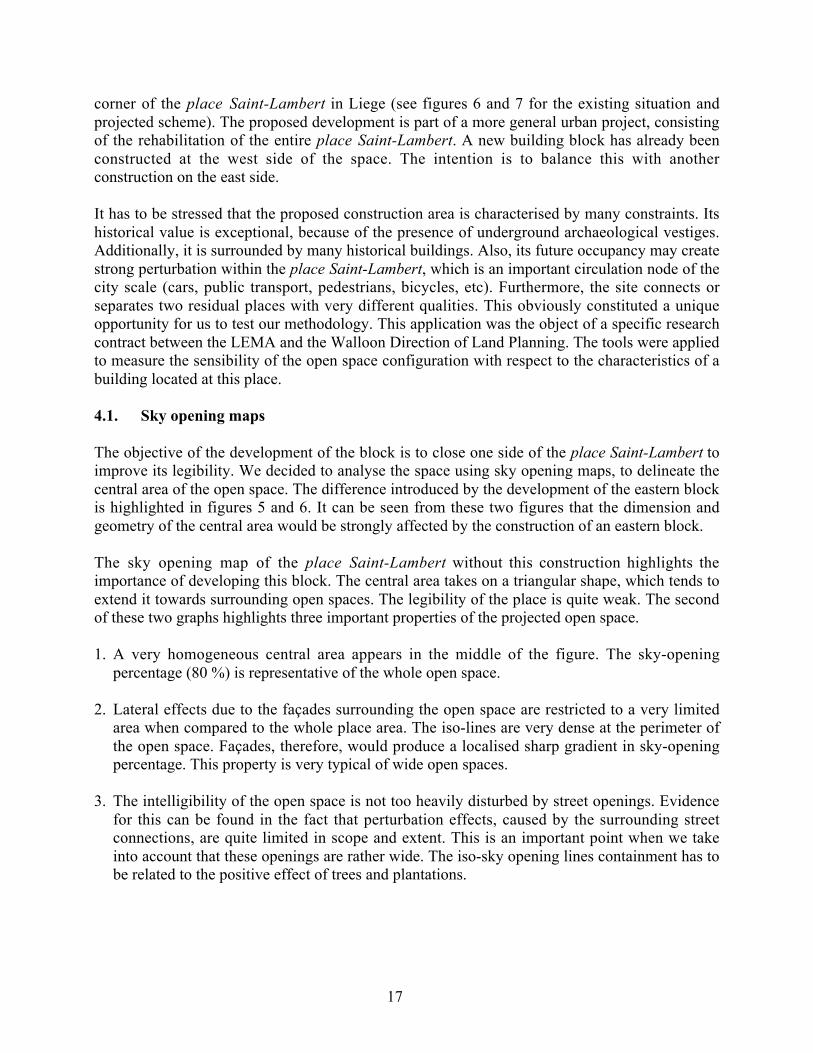
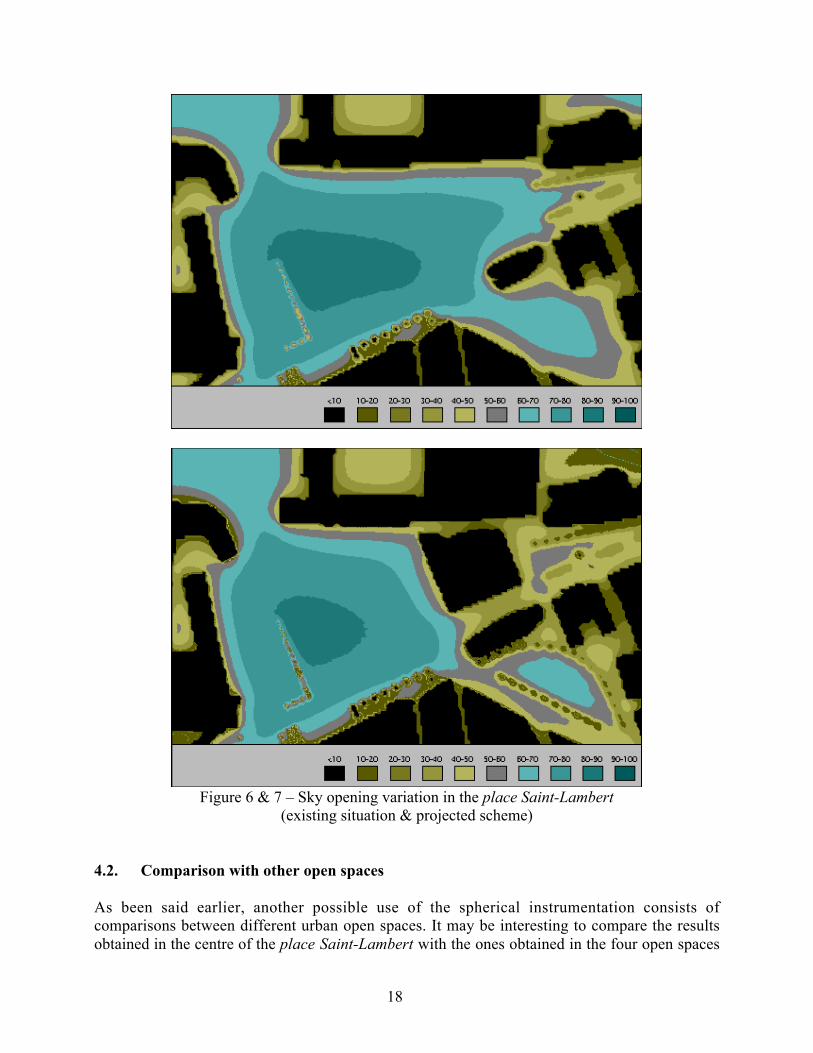
corner of the place Saint-Lambert in Liege (see figures 6 and 7 for the existing situation andprojected scheme). The proposed development is part of a more general urban project, consistingof the rehabilitation of the entire place Saint-Lambert. A new building block has already beenconstructed at the west side of the space. The intention is to balance this with anotherconstruction on the east side.
It has to be stressed that the proposed construction area is characterised by many constraints. Itshistorical value is exceptional, because of the presence of underground archaeological vestiges.Additionally, it is surrounded by many historical buildings. Also, its future occupancy may createstrong perturbation within the place Saint-Lambert, which is an important circulation node of thecity scale (cars, public transport, pedestrians, bicycles, etc). Furthermore, the site connects orseparates two residual places with very different qualities. This obviously constituted a uniqueopportunity for us to test our methodology. This application was the object of a specific researchcontract between the LEMA and the Walloon Direction of Land Planning. The tools were appliedto measure the sensibility of the open space configuration with respect to the characteristics of abuilding located at this place.
4.1. Sky opening maps
The objective of the development of the block is to close one side of the place Saint-Lambert toimprove its legibility. We decided to analyse the space using sky opening maps, to delineate thecentral area of the open space. The difference introduced by the development of the eastern blockis highlighted in figures 5 and 6. It can be seen from these two figures that the dimension andgeometry of the central area would be strongly affected by the construction of an eastern block.
The sky opening map of the place Saint-Lambert without this construction highlights theimportance of developing this block. The central area takes on a triangular shape, which tends toextend it towards surrounding open spaces. The legibility of the place is quite weak. The secondof these two graphs highlights three important properties of the projected open space.
1. A very homogeneous central area appears in the middle of the figure. The sky-openingpercentage (80 %) is representative of the whole open space.
2. Lateral effects due to the façades surrounding the open space are restricted to a very limitedarea when compared to the whole place area. The iso-lines are very dense at the perimeter ofthe open space. Façades, therefore, would produce a localised sharp gradient in sky-openingpercentage. This property is very typical of wide open spaces.
3. The intelligibility of the open space is not too heavily disturbed by street openings. Evidencefor this can be found in the fact that perturbation effects, caused by the surrounding streetconnections, are quite limited in scope and extent. This is an important point when we takeinto account that these openings are rather wide. The iso-sky opening lines containment has tobe related to the positive effect of trees and plantations.
18
Figure 6 & 7 – Sky opening variation in the place Saint-Lambert(existing situation & projected scheme)
4.2. Comparison with other open spaces
As been said earlier, another possible use of the spherical instrumentation consists ofcomparisons between different urban open spaces. It may be interesting to compare the resultsobtained in the centre of the place Saint-Lambert with the ones obtained in the four open spaces
19
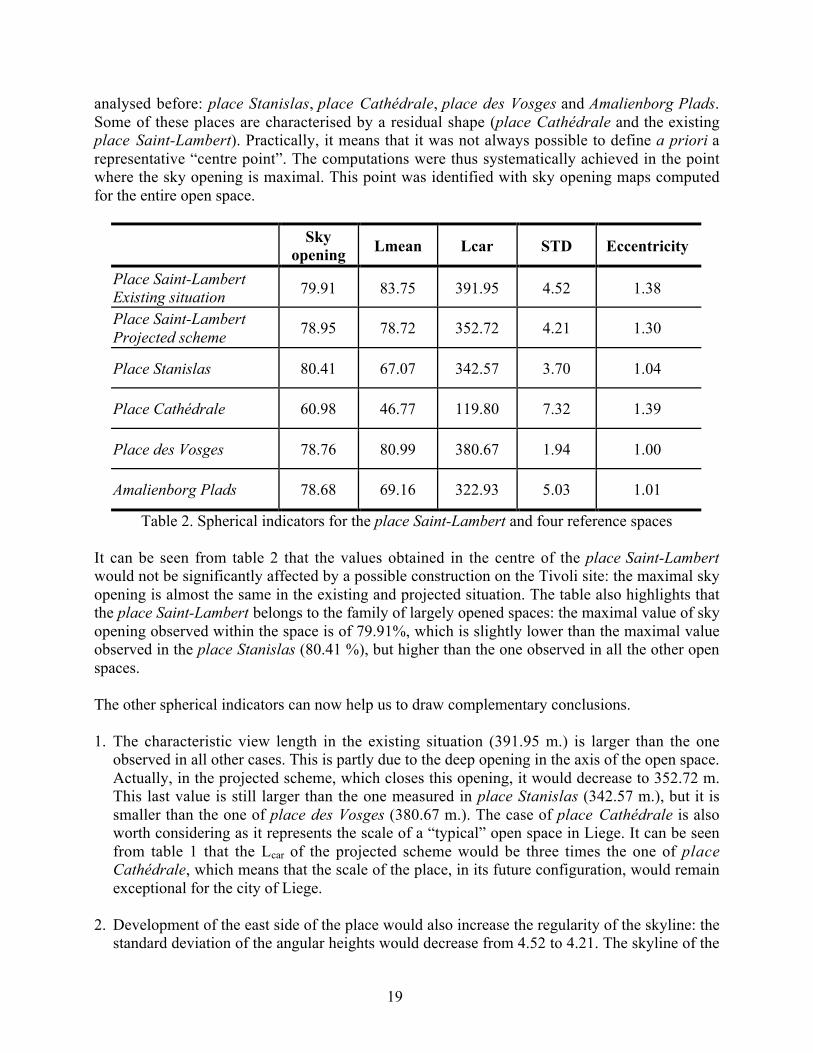
analysed before: place Stanislas, place Cathédrale, place des Vosges and Amalienborg Plads.Some of these places are characterised by a residual shape (place Cathédrale and the existingplace Saint-Lambert). Practically, it means that it was not always possible to define a priori arepresentative “centre point”. The computations were thus systematically achieved in the pointwhere the sky opening is maximal. This point was identified with sky opening maps computedfor the entire open space.
Skyopening Lmean Lcar STD Eccentricity
Place Saint-LambertExisting situation 79.91 83.75 391.95 4.52 1.38
Place Saint-LambertProjected scheme
78.95 78.72 352.72 4.21 1.30
Place Stanislas 80.41 67.07 342.57 3.70 1.04
Place Cathédrale 60.98 46.77 119.80 7.32 1.39
Place des Vosges 78.76 80.99 380.67 1.94 1.00
Amalienborg Plads 78.68 69.16 322.93 5.03 1.01
Table 2. Spherical indicators for the place Saint-Lambert and four reference spaces
It can be seen from table 2 that the values obtained in the centre of the place Saint-Lambertwould not be significantly affected by a possible construction on the Tivoli site: the maximal skyopening is almost the same in the existing and projected situation. The table also highlights thatthe place Saint-Lambert belongs to the family of largely opened spaces: the maximal value of skyopening observed within the space is of 79.91%, which is slightly lower than the maximal valueobserved in the place Stanislas (80.41 %), but higher than the one observed in all the other openspaces.
The other spherical indicators can now help us to draw complementary conclusions.
1. The characteristic view length in the existing situation (391.95 m.) is larger than the oneobserved in all other cases. This is partly due to the deep opening in the axis of the open space.Actually, in the projected scheme, which closes this opening, it would decrease to 352.72 m.This last value is still larger than the one measured in place Stanislas (342.57 m.), but it issmaller than the one of place des Vosges (380.67 m.). The case of place Cathédrale is alsoworth considering as it represents the scale of a “typical” open space in Liege. It can be seenfrom table 1 that the Lcar of the projected scheme would be three times the one of placeCathédrale, which means that the scale of the place, in its future configuration, would remainexceptional for the city of Liege.
2. Development of the east side of the place would also increase the regularity of the skyline: thestandard deviation of the angular heights would decrease from 4.52 to 4.21. The skyline of the

20
place Saint-Lambert in the projected scheme is still much more irregular than the one of placeStanislas (3.70) and of the place des Vosges (1.94). As been said earlier the regularity of theplace des Vosges is quite exceptional in this respect, because its shape is a perfect square, andthe building heights is almost constant. Also, there is no significant break in the skyline as theplace des Vosges is almost entirely closed. The place Saint-Lambert is more similar to thebaroque Amalienborg Plads (5.03), characterised by large openings and visual events. Finally,the place Saint-Lambert is much more regular than the place Cathédrale (7.32), alsocharacterised by a large opening in the axis of the space and the presence of an importantevent on its side (the cathedral building). Still the comparison between place Saint-Lambertand place Cathédrale is not so significant, given the difference between the scales of these twoplaces: the smaller the open space, the greater will be the effect of a given visual event.
3. Finally, it can be seen that the place Saint-Lambert is rather anistropric: the sky shape isactually oriented along the façade of the main buildings. The eccentricity of the space alsotends to decrease from the existing (1.38) to the projected (1.30) situation. This changehowever remains minor when more symmetrical spaces are considered. The sky shapeeccentricity of place Stanislas, place des Vosges and Amalienborg Plads is around 1.00 whenmeasured from the centre. The case of place Saint-Lambert is more like place Cathédrale,which is also oriented towards the large opening governing the space.
It can be seen from this discussion that the spherical metric we have developed enables us tolocate the morphology of place Saint-Lambert in a corpus of references, regardless of whetherthese are local (place Cathédrale) or international (Stanislas, Vosges and Amalienborg). It alsoallows us to treat dominant and residual spaces, with a common instrumentation.
5. Conclusions
A new field-oriented metrics of the open space has been introduced and discussed. It is based onspherical projections, and more specifically on measures applied to spherical views. Whencompared to the existing field-oriented approaches (isovists, e-partitions etc.), its interest lies inthe fact that it is truly three-dimensional and that it can be used to rapidly compare and assess theproperties of different open spaces, possibly belonging to different systems. Thus, we believe thisnew metric opens interesting avenues that will lead towards more reliable assessment of theeffects of projects upon urban morphology. As such it fits well with the European directives onEnvironmental Impact Assessment (EIA) and Strategical Environmental Assessment (SEA).
Interestingly these two Directives signalled a shift from the traditional prescription-basedregulation of the built environment to a performance-based approach. In fact, they allow aconsiderable margin of innovation, as long as it is possible to demonstrate that the project or theplan is not harmful to the environment. The rationale of these directives is to reverse the burdenof proof and to promote a performance-based approach. The EIA and SEA procedures, as definedby the European directives, remain very open and flexible. It is left to Member States and thestakeholders themselves to give flesh to this general framework, although there is, hopefully, agrowing literature about the practical application of the procedure. It should be noted that builtenvironment issues are not extensively covered by any existing EIA references, even though theEIA directive gives provision to identify, describe and assess in an appropriate manner the direct

21
and indirect effects of a private or public particular project on factors including “landscape,material assets and cultural heritage”.
The metric we have described can provide reliable arguments as well as practical references toassess the effects of development projects upon the urban open spaces. It would be tempting todevelop a standard, a sort of benchmark to assess the value of places, before and afterinterventions, or even to make cross-comparisons of the overall value of different spaces. Such abenchmarking method would obviously facilitate the environmental assessment of plans andprojects, and especially the environmental impact reporting. However, apart from the technicaland theoretical difficulties of such an approach, we consider it irrelevant to urban open spaces. Infact, we consider open spaces as part and parcel of our common cultural heritage. Accordinglytheir conservation and enhancement should basically obey the criterion of diversity, which is notnecessarily the case of other environmental performances (the quality of air or water forinstance). The definition of some “open space standard” would certainly contradict this basicobjective. In contrast, the notion of contextual references, possibly mundane ones as in the caseof place Cathédrale in Liege, appears much more flexible. References are intention-driven andmust always be clearly justified. If greater regularity is desired, it could consider references likeArras or place des Vosges. If, the objective is to enhance the axial character of a space, the placeStanislas probably provides a better reference. Hence the use of references provides localdecision-makers and stakeholders with a greater latitude to create options and innovations.
6. References
ARNHEIM R. (1977), The Dynamics of the Architectural Form, University of California Press, Berkeley.
BACON E. (1967), Design of cities, Thames & Hudson, London..
BATTY M. (2001), “Exploring isovist fields: space and shape in architectural and urban morphology”,Environment and Planning B: Planning and Design, vol. 28, pp. 123-150.
BENEDIKT M. (1979), "To take hold of space: Isovists and Isovist fields", Environment and Planning B– Planning and Design, n°6, pp.47-65.
BOSSELMANN P. (1998), Representation of Places. Reality and Realism in City Design, University ofCalifornia Press, Berkeley.
CHELKOFF G., THIBAUD J.-P. (1992), Les mises en vue de l'espace public, Rapport final de larecherche Plan Urbain "Les formes sensibles de l'espace public", CRESSON.
COLQUHOUN A. (1972), “Displacement of Concepts in Le Corbusier”, Architectural Design, vol. 43,pp. 220-243.
COUCLELIS H. (1992), "People Manipulate Objects (but Cultivate Fields): Beyond the Raster-VectorDebate in GIS", in Frank A.U., Campari I. and Formentini U. (Eds) Theories and Methods ofSpatio-Temporal Reasoning in Geographic Space, Lecture Notes in Computer Science 639, pp. 65-77, Springer, Berlin.
DUPAGNE A., TELLER J. (1999), La place Saint-Lambert et l’œil liégeois, Annales du bâtiment et destravaux publics, ESKA editions, n°1, pp. 33-44.
EXPERT GROUP ON THE URBAN ENVIRONMENT (1996), European Sustainable Cities, EuropeanCommission, DG XI, Environment, Nuclear Safety and Civil protection, Brussels, March 1996.

22
FAVOLE P. (1995), Squares in contemporary architecture, Architecture & Natura Press, Amsterdam.
GIBSON J.J. (1950), The perception of the visual world, Greenwood Press Publishers, Westport, 1950,235 p.
GIEDION S. (1941), Space, Time and Architecture. The Growth of a New Tradition, Harvard UniversityPress, Cambridge.
HALL E. (1966), The Hidden Dimension, Doubleday, New-York.
HILLIER B., HANSON J., (1984), The social logic of space, Cambrige University Press, Cambridge.
JOFFET R. (1957), Paysages d’une place royale, Baillière et fils, Paris.
JOSEPH I. (1992), “L’espace public comme lieu de l’action”, Annales de la Recherche Urbaine, n°57-58,pp. 211-217.
KOSTOFF S. (1991), The City Shaped: Urban Patterns and Meanings Through History, Thames andHudson, London.
LAVEDAN P. (1941), Histoire de l'urbanisme (Tome 2) – Renaissance et Temps modernes, HenriLaurens, Paris, 504 p., pp. 455-456.
LYNCH K. (1960), The Image of the City, Technology Press & Harvard University Press, Cambridge,Massachusetts.
MAÏZIA M. (1999), Régularité(s) urbaine(s) : l'écart morphologique, une tentative de systémisation,Thèse de doctorat, Université Paris I, 328 p.
MARKUS T.A., MORRIS E.N. (1980), Buildings, Climate and Energy, Pitman, London.
PEPONIS J., WINEMAN J., RASHID M., HONG KIM S., BAFNA S., (1997), "On the description ofshape and spatial configuration inside buildings: convex partitions and their local properties",Environment and Planning B: Planning and Design, vol. 24, n°5, pp. 761-781.
RAPOPORT A. (1975), Human Aspects of Urban Form, Pergamon Press, Oxford.
ROWE P. (1997), Civic Realism, MIT Press, Cambridge.
SENNET R. (1990), The conscience of the Eye. The Design and Social Life of Cities, Alfred A. Knopf,New York 1990.
SITTE C. (1945), The Art of Building Cities: City Building According to its Artistic Fundamentals,Reinhold Publishing Corporation, New York.
SNYDER J.P. (1987), Map projections : a working manual, US geological survey professional papern°1395, US geological survey, Washington.
SPREIREGEN P.D. (1965) Urban Design : The Architecture of Town and Cities, McGraw Hill, NYLondon..
TELLER (2001), La régulation morphologique dans le cadre du projet urbain. Spécificationd'instruments informatiques destinés à supporter les modes de régulation performantiels, PhDthesis presented in the University of Liège.
TELLER (2002), “An On-line Glossary as a way to foster the construction of a common culture amongurban experts, stakeholders and decision-makers”, to be published in Int. Review of Constructionand Innovation.
TELLER J., AZAR S., (2001) "TOWNSCOPE II - A computer system to support solar access decision-making", Solar Energy Journal, vol. 70, n°3, pp. 187-200.

23
THIEL P. (1961), "A sequence experience notation for architectural and urban spaces", The TownPlanning Review, vol. 32, n°1, pp. 33-52.
TURNER A., DOXA M., O'SULLIVAN D., PENN A., (2000), "From isovists to visibility graphs: amethodology for the analysis of the architectural space", to be published in : Environment andPlanning B: Planning and Design.