sugarcane mapping in paraná state brazil using modis evi
TRANSCRIPT

Cloud Publications International Journal of Advanced Remote Sensing and GIS 2020, Volume 9, Issue 1, pp. 3205-3221 ISSN 2320 – 0243, Crossref: 10.23953/cloud.ijarsg.451 ______________________________________________________________________________________________________
L
Sugarcane mapping in Paraná State Brazil using MODIS EVI images
Clóvis Cechim Júnior1*, Jerry Adriani Johann2, João Francisco Gonçalves Antunes3 and Flávio Deppe4
1,2Agricultural Engineering Department, State University of West Paraná (UNIOESTE), Cascavel, Paraná, Brazil 3Embrapa Agricultural Informatics (EMBRAPA), Campus of Unicamp, Campinas, São Paulo, Brazil 4Meteorological System of Paraná (SIMEPAR), Curitiba, Paraná, Brazil
Correspondence should be addressed to Clóvis Cechim Júnior, [email protected]
Publication Date: 7 April 2020
DOI: https://doi.org/10.23953/cloud.ijarsg.451
Copyright © 2020 Clóvis Cechim Júnior, Jerry Adriani Johann, João Francisco Gonçalves Antunes and Flávio
Deppe. This is an open access article distributed under the Creative Commons Attribution License, which
permits unrestricted use, distribution, and reproduction in any medium, provided the original work is properly cited.
Abstract Sugarcane cultivated in Brazil deserves attention because it makes the Country the world's
largest producer of sugar and ethanol. The aim of this work was to develop and evaluate a
methodology for sugarcane mapping in Paraná State, Brazil using temporal series of the MODIS EVI,
for 2010/2011 to 2013/2014 crop seasons. The methodology included supervised classification Fuzzy
ARTMAP, taking as input variables such as terms of harmonics amplitude and phase, and
phenological metrics of culture. Area estimates indicated a moderate and strong correlation (rs),
ranging from 0.62 to 0.71 comparing with IBGE official data and from 0.79 to 0.87 with the Canasat
data. To assess mapping accuracy, Canasat vector maps were used as reference to build the
confusion matrix. The method developed based on Fuzzy ARTMAP proved efficient to map and
estimate the acreage of sugarcane in the State of Paraná, due to digital processing techniques used in
homogeneous samples, selection of phenological seasonal metrics, and decomposition of images in
accordance with harmonics and supervised training. These together minimized the neural network
forecast errors. Results indicate that the methodology is appropriate for sugarcane mapping.
Keywords Annual agriculture; timeseries; vegetation index
1. Introduction
Brazil is a key player in world agricultural crop production, due to its wide territorial extension and the
adoption of high level crop technology. The availability of reliable and fast information is important for
agricultural planning and management and also to ensure more stability of agricultural market prices.
In this way, it becomes essential to adopt techniques which allow to systematically monitoring in short
and medium time the cultivated areas of different agricultural crops. Many studies (Johann et al., 2012;
Arvor et al., 2012; Victoria et al., 2012; Vicente et al., 2012; Grzegozewski et al., 2016) have showed
that the use of satellite images and remote sensing techniques allow agricultural crop mapping and
area estimates of different crops.
With the use of remote sensing agricultural crop mapping can be done in advance compared to the
method adopted by official organizations which use indirect methodologies and take into account some
subjective procedures, such as questionnaires that are sent to cooperatives, to equipment resellers
and other agencies linked to each production chain (IBGE, 2002).
Research Article

IJARSG– An Open Access Journal (ISSN 2320 – 0243)
International Journal of Advanced Remote Sensing and GIS 3206
An example of sugarcane monitoring project is the Canasat (Rudorff et al., 2010). The aim of this
project was to map sugarcane areas, initially in São Paulo State and subsequently to the other States
in the South Brazil. The methodology used was visual interpretation of LANDSAT, CBERS and
RESOURCESAT-I images for sugarcane mapping and area estimates. In this context it is necessary
to search for new ways to monitor these areas.
Currently, TERRA and AQUA MODIS images are suitable for agricultural monitoring due to high
temporal resolution and moderate spatial resolution (Galford et al., 2008; Sakamoto et al., 2010).
MODIS images have been used in both mapping and monitoring agricultural crops (Xavier et al., 2006;
Johann et al., 2012; Brown et al., 2013; Santos et al., 2014; Mengue and Fontana, 2015; Souza et al.,
2015; Grzegozewski et al., 2016), and specifically for sugarcane which is a semi-perennial crop (Silva
et al., 2010; Ordones et al., 2010; Fernandes et al., 2011; Adami et al., 2012; Alves et al., 2014; Duft
et al., 2015; Antunes et al., 2015a).
The use of MODIS vegetation indexes products, such as EVI (Enhanced Vegetation Index) and NDVI
(Normalized Difference Vegetation Index), allows to establish the default spectro-temporal data to
identify different agricultural crops (Johann et al., 2016) and map large territorial extensions with
repetitivity and low costs. The timeseries of vegetation indices, used in mappings, can also be used to
examine the Earth's surface changes, finding evidence of changes in vegetation development and
demonstrate standards of temporal dynamics (Jia et al., 2011).
To analyse multi temporal remote sensing images the harmonic analysis or Fourier Analysis has been
used (Jakubauskas et al., 2001), as it allows the characterization of vegetation phenology based on
temporal changes, allowing the understanding of temporal dynamics of vegetation cover
(Jakubauskas, 2001; Lacruz, 2006). The oscillatory temporal behaviour throughout the timeseries can
be associated to the vegetation productive cycles and seasonal variation of photosynthetic activity
(Victoria et al., 2009).
In this context, the aim of this study was to map and estimate cultivated areas of sugarcane, in the
State of Paraná, using timeseries MODIS EVI images and a supervised Fuzzy ARTMAP classification
model for 2010/2011 to 2013/2014 crop years.
2. Study Area
Brazil is the largest sugarcane producer, with the average of 271.4 million tonnes (1961 to 2013 crop
seasons), followed by India with around 207.5 million tonnes (FAOSTAT, 2016). Brazil is also the
largest sugar producer, accounting for 20% of the world production and 40% of global sugar exports. It
is the second largest producer of ethanol, accounting for 20% of world production and 20% of global
exports (UNICA, 2015). The study area includes the Paraná State in Brazil´s Southern region (Figure
1). Paraná State is the 5th largest national sugarcane producer, with an average (between 2010 to
2014) of 7.5 milliontons of sugarcane per year, which represents 7.1% of the national production
(IBGE, 2016). It has 399 municipalities; however, the concentration of sugarcane fields is in the
mesoregions Northwest, Central North and Pioneer North.

IJARSG– An Open Access Journal (ISSN 2320 – 0243)
International Journal of Advanced Remote Sensing and GIS 3207
Figure 1: Methodological flowchart for generation of mapping in the Paraná state.
3. Data Used and Methods
The research method consisted of the following steps: (i) Acquisition of satellite images; (ii)
Decomposition of EVI timeseries; (iii) Extraction of phenological seasonal metrics; (iv) Selection of
sampling homogeneous sets; (v) Digital processing; (vi) Stratified random sampling; (vii) Fuzzy
ARTMAP classification model; (viii) Accuracy analysis;(ix) Comparison analysis of area with official
data of IBGE and Canasat.
3.1. Acquisition of satellite images
The timeseries TERRA and AQUA MODIS images were gathered from EMBRAPA (Brazilian
Agricultural Research Corporation). The geodetic reference System is WGS-84, in geographical
coordinates (latitude and longitude) and in GeoTIFF (Geographic Tagged Image File Format). The
image source was the Land Processes Distributed Active Center (LP DAAC). Products available
included EVI (Enhanced Vegetation Index) images with a spatial resolution of 250 meters, with 46
annual compositions from TERRA and AQUA satellites, updated every 16 days.
The vegetation index EVI proposed by (Huete et al., 1997), was developed to be used with MODIS
sensor images. Applications include sugarcane mapping due the optimization of spectral response of
vegetation, improving sensitivity in regions of higher densities of biomass, provide monitoring of
vegetation by reducing canopy substrate and atmospheric influences (Huete et al., 1997; Huete et al.,
1999; Huete et al., 2002).

IJARSG– An Open Access Journal (ISSN 2320 – 0243)
International Journal of Advanced Remote Sensing and GIS 3208
3.2. Decomposition of EVI time series
Before running the algorithm, it was necessary to stack the timeseries images for the period used for
sugarcane mapping (September to April) for each crop year. This is the period of greatest growth of
sugarcane including tilling phase until the vegetative peak. For this procedure it was used an IDL
(Interactive Data Language) routine developed by Esquerdo et al. (2011) which implements time series
stacking of vegetation index images.
The second procedure consisted on decomposition of EVI time series in harmonic terms (composition of
images of amplitude and phase), and variance calculation of each harmonic in each series, which was
made from the application of HANTS algorithm (Harmonic Analysis of Time-Series NDVI) (Roerink et al.
2000).
The harmonics terms were generated on a per-pixel basis for each time series composition, which
decompose the annual variation of the EVI and are represented by the average (0 harmonic), by phase
that indicates the culture cycle and ranges from 0º to 360º and by amplitude (1 harmonic) which
indicates the maximum mode of variation of vegetation for the entire period (Antunes et al., 2016).
The HANTS algorithm was implemented in IDL by De Wit and Su (2005) and it aims to eliminate high-
frequency oscillations called noises. In addition to using the seasonal effect evidenced by the
development of vegetation, turning them into low-frequency sine functions in different phases and
amplitudes, it indicates the period of time series associated with the development cycles of the
phenological stages, and also, perform as smoothing filter in the image time series.
3.3. Extraction of phenological metrics
The third procedure was to extract the phenological metrics "base level" and "rate of senescence"
temporal series of EVI of sugarcane (Figure 1), using TIMESAT software (Eklundh and Jönsson, 2015).
These metrics were extracted from 506 EVI images and the whole study area fit inside one MODIS tile
(TERRA and AQUA) for the period of October 2004 through September 2014, after going through the
procedure of noise filtering and smoothing by Savitzky-Golay filter (Savitzky and Golay, 1964; Luoet al.,
2005). The metrics represent a synthesis (average) of the temporal series and assist on separability
between land cover classes (Antunes, 2014).
3.4. Selection homogeneous pixel set
The selection and acquisition of the sample data set used Canasat maps as reference; the pixel
selection was based on the homogeneity (pure pixels) of the sugarcane spectral response. However,
the sample data set could also be gathered by analyzing the temporal spectrum profile of EVI
characteristic of sugarcane directly on the MODIS images (Cechim Júnior et al., 2016). The pixels used
as samples in the classifiers must represent homogeneously the cultivation of sugarcane and must
eliminate the interference of different targets present in images.
The mesoregions Northwest, Pioneer North and Central North of Paraná State show greater
concentration of sugarcane and high production relative to the rest of the state. Therefore, have a
higher probability of occurrence of pure pixels, which make the spectrum-temporal profiles of EVI in this
region more characteristic of areas of cultivation of sugarcane, compared to spectrum-temporal profiles
of mesoregions West and Southwest where the presence of cultivated areas of sugarcane is not very
significant because of the large amount of soybeans and corn cultivated.

IJARSG– An Open Access Journal (ISSN 2320 – 0243)
International Journal of Advanced Remote Sensing and GIS 3209
3.5. Digital image processing
In order to build the sampling frame, actual Canasat polygons were used as reference and GIS
processing techniques were used in order to convert the vector map to raster format. The spatial
degradation was based on the technics used by Foody and Cox (1994) and Antunes (2014). A low pass
9 x 9 convolution filter and resampling by nearest neighbour method was applied to match with 250
meters spatial resolution and with the same projection system of MODIS images.
The digital image processing technics were necessary to separate and sort the class of sugarcane in
homogeneous regions from the gray levels present in the images converted from vector format the
Canasat. Therefore, field edges were eliminated in order to avoid spectral contamination with other
targets in the selection of samples.
After this, the images were converted to 8 bit range from 0 to 255 digital numbers (DN) values. The DNs
ranging from 200 to 255 included homogeneous areas of sugarcane, the DNs ranging from 2 to 199
represent transitions classes, and 0 to 1, no sugarcane classes (Antunes, 2014).
In order to establish the sample sets, a stratified random sampling technique was used. Therefore,
intervals from 200 to 255 DN were label sugarcane and intervals from 0 to 1 DN were label not
sugarcane. This was done for each crop year.
3.6. Random sampling
To obtain a classification error around 5%, Van Niel et al. (2005) suggests using the golden rule for
minimum size set of samples, calculated by [Eq. 1]:
𝑛 = 30 𝑥 𝑁 𝑥 𝐾 (1)
where n is the total number of training samples, N is the data size (7 harmonic terms (average plus
amplitude and phase frequencies 1, 2, 3)) and 2 phenological metrics of EVI). K is the number of
classes (2 classes: sugarcane and not sugarcane).
In this way, the minimum sample size was 810 pixels, 540 pixels for training samples (i.e., 2/3) and 270
pixels for test samples (i.e., 1/3) which were used to assess the accuracy of the mapping. With the
purpose of increasing the number of pixels of the sample set a mathematical morphological filter was
used, which is a non-linear method of digital image processing. The main purpose is the quantification
of geometric structures. The expansion consists in filling up or expanding the growth of pixels in an
image into binary or gray scale (Haralick et al., 1987).
These procedures end up with a homogeneous set of reference samples to assist and facilitate the
processing of training the classifier, which was obtained from the algebra using the Canasat reference
maps to eliminate overlapping classes of training samples with the application of morphological filter.
After processing MODIS EVI time series on harmonic terms using the HANTS and phenological metrics
using software TIMESAT, these images were inserted into the Fuzzy ARTMAP classifier of the IDRISI
Taiga 16.05, along with the set of samples obtained by stratified random sampling in raster format.
3.7. Fuzzy ARTMAP classification model
ARTMAP networks are commonly grouped into ART1 (binary inputs) and ART2 (real entries) with
unsupervised training, and ARTMAP (for clustering) with supervised training. The advantage of this
type of network is the ability for automatic generation of neurons in the output layer, present a very
stable structure. Therefore, achieving high immunity against noises which can be added from new

IJARSG– An Open Access Journal (ISSN 2320 – 0243)
International Journal of Advanced Remote Sensing and GIS 3210
entries. The ART networks training is independent from the order of presentation of input data
(Rezende, 2003).
The classification of harmonic terms of time series of EVI together with phenological seasonal metrics
was carried out with self-organizing neural network of Fuzzy ARTMAP grouping, which is a non-
parametric model based on Adaptive Resonance Theory of cognitive processing of the human brain, for
the approach of non-linear multidimensional functions. This architecture works repeatedly to solve the
dilemma 'stability x plasticity’, keeping an equilibrium to create new categories of recognition when
unknown standards stimulate the network and the ability to group similar patterns in the same category,
preserving previously acquired knowledge (Carpenter et al., 1991).
The parameterization of the Fuzzy ARTMAP classifier proceeded according to Antunes (2014). For
ARTa, the “choice parameter” was set at 0.01, the training rate was equal to 0.93 and the vigilance
parameter equal to 0.94. For ARTb, training rate and parameter vigilance 1.00 was used.
The mapping layer that connects ARTb to ARTa has the same dimension of the number of output
classes. In this case, there are two classes formed: the class of sugarcane and not sugarcane.
3.8. Map accuracy Analysis
The analysis of spatial accuracy was carried out according to Pontius and Millones (2011), using Overall
Accuracy (OA) and Kappa agreement index (KI) (Congalton, 1991; Congalton and Green, 1999), and
Inclusion Errors (IE) and Omission Errors (OE), taking as reference the Canasat maps that have an
excellent accuracy (Adami, 2012).
When using the KI, to calculate the accuracy based on randomness, emerges as an option for the
Overall Disagreement (OD) analysis (Pontius and Millones, 2011). This is formed by the component
“Quantity”, considered as the classification of incorrect proportions of pixels in classes and by
“Allocation” component, which refers to the spatial distribution of incorrect pixels in classes. These
components provide complementary and additional information to assist in the explanation of the error.
The method proposed by Pontius and Millones (2011) derives from a single confusion matrix, in which
the input variables must be entered as sample reference collections classes, which are compared with
the entire population of pixels of the classes in the generated map.
Band ratio represents a transformation technique that applies by dividing the digital numbers of one
band by their corresponding pixels of another band (e.g., Mather, 2004). This helps to enhance the
spectral differences between the variables on land surface (Goetz et al., 1983). This technique allowed
discrimination between different rock types and highlighted areas rich in specific mineral compositions
(Abrams et al., 1983; Sabins 1997; Abdelkareem and El-Baz, 2016; Gad and Kusky, 2006). In addition to
band ratios, PCA was used to transform the components of the image into its principal components
(Loughlin, 1991; Gomez et al., 2005). This transformation has the ability to highlight the similarities and
differences in the used data. The output will be eigenvectors and eigen values of the matrix covariance.
Minimum noise transformation technique also was used to segregate noise from the VNIR-SWIR ASTER
Data. The advantage of this technique is to filter or remove those bands that contribute most to noise
(Green et al., 1988; Boardman and Kruse, 1994). It is better technique than PCA in compressing and
ordering data in relationship of their image quality. Where the PCA technique is yields linear
transformations of the input data which subsequently amplify their variance, and the Minimum Noise
Fraction (MNF) transform yields linear transformation which subsequently reduce their noise fraction.
IJARSG– An Open Access Journal (ISSN 2320 – 0243)
International Journal of Advanced Remote Sensing and GIS 3211
3.9. Area Comparison Analysis
In the post classification step was applied the filter Sieve Classes available in the Environment for
Visualizing Images (ENVI, 2016) program, which allows to increase the resolution and accuracy of the
parcels mapped, and thus avoiding contamination by isolated pixels that of sugarcane.
The last step consisted of extracting area of culture with a routine developed in IDL by Esquerdo et al.
(2011). The municipal area information, obtained for each crop year were compared with the data of the
project Canasat area and the official Brazilian Institute of Geography and Statistics (IBGE 2016).
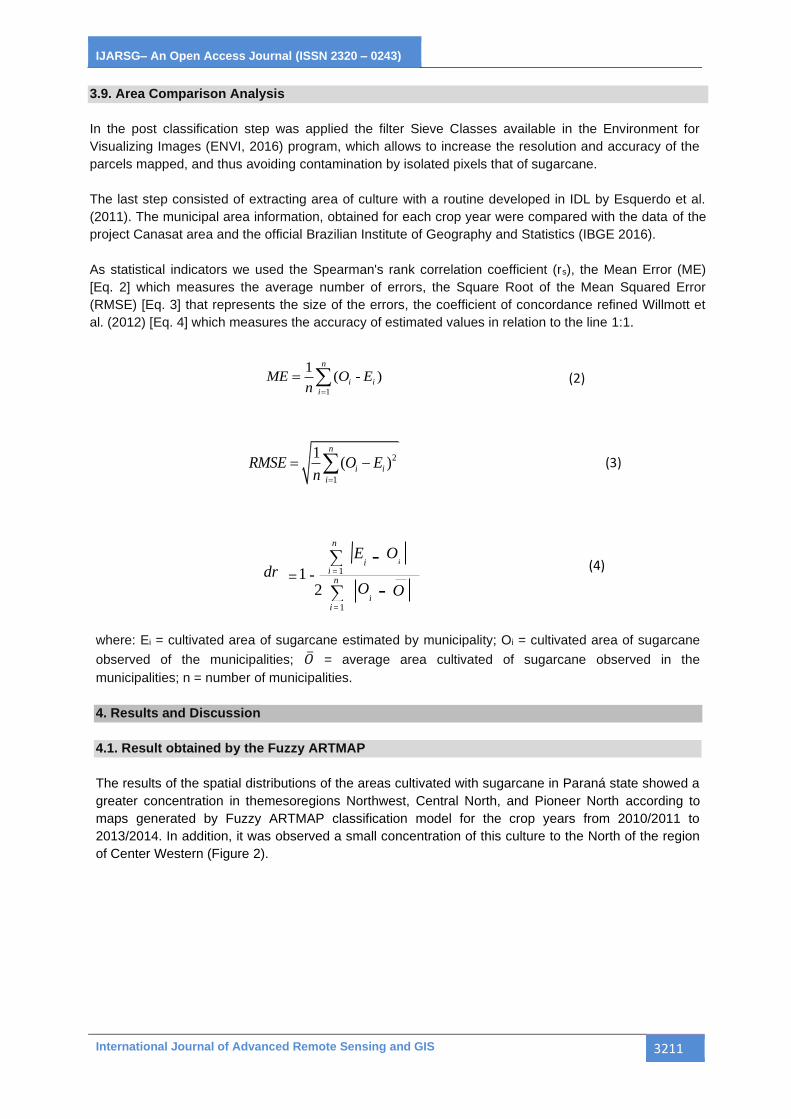
As statistical indicators we used the Spearman's rank correlation coefficient (rs), the Mean Error (ME)
[Eq. 2] which measures the average number of errors, the Square Root of the Mean Squared Error
(RMSE) [Eq. 3] that represents the size of the errors, the coefficient of concordance refined Willmott et
al. (2012) [Eq. 4] which measures the accuracy of estimated values in relation to the line 1:1.
1
1( - )
n
i i
i
ME O En =
=
(2)
2
1
1( )
n
i i
i
RMSE O En =
= −
(3)
(4)
where: Ei = cultivated area of sugarcane estimated by municipality; Oi = cultivated area of sugarcane
observed of the municipalities; �̅� = average area cultivated of sugarcane observed in the
municipalities; n = number of municipalities.
4. Results and Discussion
4.1. Result obtained by the Fuzzy ARTMAP
The results of the spatial distributions of the areas cultivated with sugarcane in Paraná state showed a
greater concentration in themesoregions Northwest, Central North, and Pioneer North according to
maps generated by Fuzzy ARTMAP classification model for the crop years from 2010/2011 to
2013/2014. In addition, it was observed a small concentration of this culture to the North of the region
of Center Western (Figure 2).
∑
∑
=
=
-
- - = n
i
n
i
O Oi
Oi E
i
dr
1
1
2*
1

IJARSG– An Open Access Journal (ISSN 2320 – 0243)
International Journal of Advanced Remote Sensing and GIS 3212
Figure 2: MODIS mappings for the cultivation of sugarcane in the Paraná state for the crop years:
(a) 2010/2011; (b) 2011/2012; (c) 2012/2013; (d) 2013/2014.
4.2. Map accuracy analysis
With regards to the overall accuracy is desirable that a classification reach indexes over 85% (Foody,
2002), which was confirmed by average of the (OA) of 97.52% (Table 2) obtained by Fuzzy ARTMAP
classification, which indicates a high accuracy of thematic maps generated.
The Kappa Index (KI) (Table 2) ranged from 0.81 (2013/2014) to 0.84 (2011/2012 and 2012/2013),
which indicates an excellent quality of thematic classification (KI ≥ 0.81) (Landis and Koch, 1977)
generated from the Fuzzy ARTMAP classification.
In the work carried out by Antunes et al. (2015b), sugarcane mapping using classification of time
series of MODIS data, obtained for the crop years from 2004/2005 to 2011/2012, KI values ranging
from 0.80 to 0.85 and OA ranging from 95.09% to 95.80%. The OA reached 95.41% and average KI of
0.83.
Table 2: Indexes of accuracy obtained for Fuzzy ARTMAP mappings
Inclusion Errors (%) Omission Errors (%)
Crop year (KI) OA (%) Sugarcane Not
Sugarcane
Sugarcane Not
Sugarcane
2010/2011 0.83 97.53 11.35 1.99 20.56 0.99
2011/2012 0.84 97.65 8.98 2.14 23.08 0.30
2012/2013 0.84 97.69 10.19 1.63 17.35 0.89
2013/2014 0.81 97.21 9.46 2.34 24.68 0.76
The results are significant even if compared with works that use other methodologies for sugarcane
mapping using MODIS data. The work by Duft et al. (2015) tested and evaluated the accuracy of maps

IJARSG– An Open Access Journal (ISSN 2320 – 0243)
International Journal of Advanced Remote Sensing and GIS 3213
generated using the seasonal variation and amplitude of values of MODIS NDVI and EVI, applying
HANTS harmonic analysis algorithm to smooth out the data and eliminate noise. This mapping was
done for the crop year of 2009/2010 and obtained the best rating performance with a KI of 0.80 for the
vegetation index EVI and KI of 0.66 for NDVI.
Similar results were found by Johann et al. (2012), with KIs varying from 0.85 to 0.90 and OA of 92.75%
to 95% for summer crops in the Paraná State. The (EI) varied from 3.5% to 7.5% for summer crops and
for not summer crops the variation was from 4.5% to 7.5%.
It was observed that the mappings generated from the model Fuzzy ARTMAP for class "Sugarcane"
presented IE ranging from 8.98% (crop year 2011/2012) to 11.35% (crop year 2010/2011) (Table 2).
This indicates that the model classified erroneously these regions as sugarcane, but were other targets.
To the class "Not-sugarcane" there was a variation of IE from 1.99% (crop year 2010/2011) to 2.34%
(crop year 2013/2014). That were the targets of sugarcane not selected by the model classification. In
this case, targets of pastures with spectrum-temporal profile similar to the cultivation of sugarcane
contributed the representativeness of IE due to spectral confusion. The proportion of OE varied from
0.76% (crop year 2013/2014) to 0.99% (crop year 2010/2011); being this the proportion that was
excluded from the class it belonged.
Although the training samples were homogeneous, the resulted higher level of error of omission of the
Sugarcane class (Table 2) was the same dimension as finded by Antunes et al. (2015b). In their work,
they found that the error is associated with the inherent spectral variability of culture during the
vegetation development cycle, which causes greater spectral confusion in the recognition of the
standard spectral-temporal spectrum by the classifier.
The Overall Disagreement (OD) was used for additional accuracy assessment of Fuzzy ARTMAP
mappings for 2010/2011 to 2013/2014 crop seasons. The quantity component had greatest value
obtained in the crop year of 2014/2015 with 1.97%. While the lowest value registered was 1.22% in
crop year 2012/2013. For the allocation component, the lowest observed value was 0.26% in the crop
year of 2011/2012 and the greatest observed value was 0.75% in the crop year of 2010/2011 (Table 3).
Table 3: Overall disagreement classification models Fuzzy ARTMAP
Fuzzy ARTMAP Model Overall Disagreement (%)
Crop years Quantity Allocation
2010/2011 1.54 0.75
2011/2012 1.94 0.26
2012/2013 1.22 0.69
2013/2014 1.95 0.62
Antunes et al. (2015b) achieved an average total overall disagreement of 4.59%, with 2.72% of the
component quantity and 1.87% of the disagreement of the allocation component. Very near and similar
to the values of accuracy found in the mappings made with classification of time series of EVI/MODIS
in the Paraná State, where the contribution quantity component of the total disagreement was greater
than the allocation component, implying in larger proportions of incorrect pixels assigned in classes.
4.3. Comparison analysis of area
The comparison of the official IBGE data with those obtained in the mappings (Table 4), showed an
average overestimation of 68,291 ha. The greatest difference was found for the crop year 2012/2013
(83,995 ha) and the lowest difference to the crop year 2013/2014 (42,354 ha), representing 13.02%
and 6.22% respectively, of the total area of the State with the culture. Already comparisons of data
mappings with the Canasat data had a minor difference of area in relation to comparison with the

IJARSG– An Open Access Journal (ISSN 2320 – 0243)
International Journal of Advanced Remote Sensing and GIS 3214
official data of the IBGE, the largest difference for the crop year of 2010/2011 (14,464 ha), which is
equivalent to 2.16%.
Table 4: Official sugarcane area IBGE and Canasat, and mappings generated by the models Fuzzy ARTMAP with
regards (2010/11 to 2013/14)
Variables Crop years
2010/2011 2011/2012 2012/2013 2013/2014
IBGE area (ha) 641,765 655,509 645,280 681,152
Mapping area (ha) 718,713 725,375 729,275 723,506
Difference (Map -IBGE) (ha) 76,948 69,866 83,995 42,354
Difference (%) 10.71 10.66 13.02 6.22
Canasat area (ha) 668,673 681,148 699,501
Mapping area (ha) 683,137 694,114 701,650
Difference (Map - Canasat) (ha) 14,464 12,967 2,148
Difference (%) 2.16 1.90 0.31
Data analysis compared through statistical metric (ME) indicated that State scale the area obtained by
mapping was overrated between 106.15 ha (2013/2014) and 210.51 ha (2012/2013) (Figure 3).
Figure 3: Relationship between the cultivated area of sugarcane of Fuzzy ARTMAP mapping and
official data from IBGE for the crop years (a) 2010/2011; (b) 2011/2012; (c) 2012/2013; (d)
2013/2014
In this way, there was a trend of overestimation of cultivated area of sugarcane in the mappings
generated by the Fuzzy ARTMAP classification compared to the official data of IBGE. In comparison
with the Canasat data (ME) indicated that State scale the area obtained by mapping was overrated
between 74.62 ha (2012/2013) and 125.41 ha (2010/2011) (Figure 4).

IJARSG– An Open Access Journal (ISSN 2320 – 0243)
International Journal of Advanced Remote Sensing and GIS 3215
Figure 4: Relationship between the cultivated area of sugarcane of Fuzzy ARTMAP and mapping
Canasat for the crop years (a) 2010/2011; (b) 2011/2012; (c) 2012/2013
Similar results were obtained by Grzegozewski et al. (2016) in their mapping of corn in the Paraná
State using the MODIS sensor with overestimation of area 16% when compared with official data of
the Agriculture and Supply Secretary of Paraná (SEAB). According to Santos et al. (2014) this
overestimation of area with the MODIS sensor can be credited 250 m spatial resolution of the images.
In virtue of this spatial resolution cultivated area estimated can be overrated or underrated. What
depends on the size of the agriculture plots and the type of crop grown to be mapped.
Duft et al. (2015) in mapping of sugarcane with the NDVI also observed an overestimation with 8.3%
justifying this due to problems of mistaken targets between sugarcane and grazing, which feature very
similar physiology and the same type of photosynthetic metabolism. These results were also explained
by Zanzarini et al. (2013) justification according to the saturation of the NDVI in the period of maximum
vegetative development, where different targets feature similar spectral responses.
For the mappings of sugarcane with EVI in the Paraná State, saturation and confusion, with different
targets were not observed, due to there is no large areas of pastureland and the procedure adopted in
the acquisition of homogeneous samples of sugarcane, which minimize the spectral mixture that was
observed by Duft et al., (2015) in the State of São Paulo in Brazil.
The RMSE showed that the size of the error produced between comparisons of estimates of area
(Figure 3) had an average variation municipal from 1,311.55 ha (crop year 2010/2011) to 1,746.20 ha
(crop year 2012/2013). For the Canasat data the RMSE showed that the size of the error produced
between comparisons of estimates of area had an average variation municipal from 1,101.79 ha (crop
year 2010/2011) to 1,201.71 ha (crop year 2012/2013).

IJARSG– An Open Access Journal (ISSN 2320 – 0243)
International Journal of Advanced Remote Sensing and GIS 3216
The refined Willmott’s index of agreement (dr) (Figure 3) measured the accuracy between the
cultivated area estimated and observed data. In comparison with official data of IBGE varied from 0.84
(crop year 2012/2013) to 0.86 in the remaining crop years. For the Canasat data (dr) obtained was of
0.90 in all crop years the which indicates a great performance, having a high accuracy between
estimates compared in all crop years evaluated.
For comparing between estimates of areas of official data of IBGE and the Fuzzy ARTMAP
classifications the municipal level, was used the Spearman's correlation coefficient (rs), because in the
statistical analysis of the data showed no normalcy in the area estimates, the values obtained for the
(rs) coefficient ranged from 0.61 (crop year 2013/2014) to 0.71 (crop year 2012/2013), indicating that
the estimates of cultivated area of sugarcane were moderately correlated with a positive association.
Vicente et al., (2012) to compare data of cultivated area obtained between 2004 and 2009 by
mappings of culture of sugarcane (generated with time series of NDVI Spot), in the State of São Paulo,
with official data of IBGE, there were good correlation (r = 0.89), and the area estimates indicated
good agreement in relation to the official data.
With regards to the municipal level comparisons with Canasat data (Figure 4), the values obtained for
the (rs) ranged from 0.79 (crop year 2010/2011) to 0.87 (crop year 2011/2012), indicating that the
estimates of cultivated area of sugarcane were strongly correlated with a positive association. Ordones
et al. (2010) found that for the State of São Paulo the sugarcane cultivated area (generated with time
series of MODIS NDVI images) for the crop year of 2008/2009, 75% of municipalities showed greater
proximity in comparison of estimates of area with Canasat data than data from the IBGE. Therefore,
indicating with what was observed in this work where the estimates of the area of sugarcane Fuzzy
ARTMAP model generated were more close to Canasat than IBGE. Need to register that the
methodology employed by the Canasat also make use of satellite images, resulting in better estimates
with less errors due to subjective information.
The use of Fuzzy ARTMAP classification model in series spectro-temporal EVI/MODIS enabled
mapping of areas under cultivation with the culture of sugarcane in municipal-scale in an efficient and
objective way. This allowed generating area estimates in advance when compared to other methods
analysed. This opens up possibilities of improving the estimates carried out by official bodies and use
this information in state agricultural planning including crop production and transportation.
5. Conclusions
The decomposition of time series of EVI/MODIS allowed the understanding of dynamic spectro-
temporal and phenological development of sugarcane.
The harmonic analysis proved to be a useful technique in the analysis of time series of vegetation
index MODIS/EVI images, which along the phenological metrics obtained by TIMESAT allowed a
better performance of Fuzzy ARTMAP classifier in the differentiation of agricultural areas with
vegetation or pasture.
The use of images of amplitude, referring to the annual component time series of EVI, made it possible
to establish the pixels that contain agricultural crops, and may also associate such images on the
variance of the series that is most evident in pixels where there is the development of agricultural
crops.
The spatial accuracy analysis generated by Pontius and Millones (2011) the methodology, presented
greater representation when compared to the traditional method of analysis based on error matrix,
since it considered a proportional sampling process.

IJARSG– An Open Access Journal (ISSN 2320 – 0243)
International Journal of Advanced Remote Sensing and GIS 3217
In this way, as the classes evaluated are unbalanced (sugarcane and not-sugarcane), the method
makes it possible to detect the reality of the phenomenon under study from the extrapolation of
sampling sets used to assess the accuracy for the entire population in analysis, thus avoiding
tendentious results.
In comparison with the data of the Canasat and official IBGE statistics, the mappings from sugarcane
obtained presented a higher similarity with Canasat area estimates, despite having overrated the
acreage of sugarcane.
Acknowledgments
This work was supported in part by grants from the Coordination of Improvement of Higher Education
Personnel (CAPES), State University of Western Paraná (UNIOESTE) and Meteorological System of
Paraná (SIMEPAR). And also for the technical-scientific partnership established by the co-author Dr.
João Antunes, geotechnology researcher scientist of Embrapa Agricultural Informatics, with Ph.D. Zhe
Li, currently senior remote sensing scientist in Center for Space Research of University of Texas at
Austin, in support to the software for image classification used in this work.
References
Adami, M., Mello, M. P., Aguiar, D. A., Rudorff, B. F. T., Souza, A. F. 2012. A web platform
development to perform thematic accuracy assessment of sugarcane mapping in South-Central Brazil.
Remote Sensing, 4, pp.3201-3214. https://doi.org/10.3390/rs4103201
Alves, C. D., Florenzano, T. G., Alves, D. S., Pereira, M., N. 2014. Mapping land use land cover
changes in a region of sugarcane expansion using TM and MODIS. Revista Brasileira de Cartografia,
66, pp.337-347.
Aparecido, L. E. O., Rolim, G. S., Richetti, J., Souza, P. S., Johann, J. A. 2016. Koppen, Thornthwaite
and Camargo climate classifications for climatic zoning in the State of Paraná, Brasil. Ciência e
Agrotecnologia. Lavras:UFLA, pp. 405-4017. http://dx.doi.org/10.1590/1413-70542016404003916
Arvor, D., Meirelle, M., Dubreuil, M., Dubreuil, V., Béngue, A., Shimabukuru, Y. E. 2012. Analyzing the
agricultural transition in Mato Grosso, Brasil, using satellite-derived indices. Applied Geography, pp.
702-713. https://doi.org/10.1016/j.apgeog.2011.08.007
Antunes, J. F. G. 2014. Classificação de séries temporais de dados MODIS baseada em redes neuro-
fuzzy para o monitoramento sistemático do cultivo da cana-de-açúcar. 147 f. Tese (Doutorado em
Engenharia Agrícola) – Faculdade de Engenharia Agrícola, Universidade Estadual de Campinas,
Campinas.
Antunes, J. F. G., Lamparelli, R. A. C., Rodrigues, L. H. A. 2015a. Avaliação da dinâmica do cultivo da
cana-de-açúcar no estado de São Paulo por meio de perfis temporais de dados MODIS. Journal of the
Brazilian Association of Agricultural Engineering, 35(6), pp. 1809-4430. http://dx.doi.org/10.1590/1809-
4430-Eng.Agric.v35n6p1127-1136/2015
Antunes, J. F. G., Lamparelli, R. A. C., Rodrigues, L. H. A. 2015b. Mapeamento do cultivo da cana-de-
açúcar por meio da classificação de séries temporais de dados MODIS. Anais XVII Simpósio
Brasileiro de Sensoriamento Remoto – SSBR, João Pessoa – PB, Brasil.
Antunes, J. F. G., Lamparelli, R. A. C., Rodrigues, L. H. A. 2016. Representação de ciclos harmônicos
de séries temporais Modis para análise do cultivo da cana-de-açúcar. Revista Pesquisa Agropecuária
Brasileira, 5(11), pp.1868-1876. http://dx.doi.org/10.1590/s0100-204x2016001100009

IJARSG– An Open Access Journal (ISSN 2320 – 0243)
International Journal of Advanced Remote Sensing and GIS 3218
Brown, J. C., Kastens, J. H., Coutinho, C. A., Victoria, D. C., Bishop, C. R. 2013.Classifying multiyear
agricultural land use data from Mato Grosso using time-series MODIS vegetation index data. Remote
Sensing of Environment, pp. 39-50. https://doi.org/10.1016/j.rse.2012.11.009
Canty, M. J. 2010. Image analysis, classification and change detection in remote sensing: with
algorithms for ENVI/IDL. New York: CRC Press, Taylor & Francis, 2 ed., p.471.
Carpenter, G. A., Crossberg, S., Reynolds. J. H. 1991. ARTMAP: Supervised real-time learning and
classification of nonstationary data by a self-organizing neural Network.Neural Networks, Boston, 4(5),
pp. 565-588. https://doi.org/10.1016/0893-6080(91)90012-T
Caviglione, J. H., Kiihl, L. R. B., Caramori, P. H., Oliveira, D. 2000. Cartas climáticas do Paraná.
Londrina: IAPAR, CD-Rom.
Congalton, R.G. 1991. A review of assessing the accuracy of classifications of remotely sensed data.
Remote Sensing of Environment, 37, pp.35-46. https://doi.org/10.1016/0034-4257(91)90048-B
Congalton, R.G., Green, K. 1999. Assessing the accuracy of remotely sensed data: principles and
practices. Boca Raton: CRC Press, p.160.
Cechim Júnior, C., Johann, J. A., Antunes, J. F. G. 2016. Mapping of sugarcane crop area in the
Paraná State using Landsat/TM/OLI and IRS/LISS-3 images. Revista Brasileira de Engenharia
Agrícola e Ambiental, 21(6), pp.427-432.http://dx.doi.org/10.1590/1807-1929/agriambi.v21n6p427-432
Grzegozewski, D. M., Johann, J. A., Opazo, M. A., Mercante, E., Coutinho, A. C. 2016. Mapping soya
bean and corn crops in the State of Paraná, Brazil, using EVI images from the Modis sensor.
International Journal of Remote Sensing, 37(6), pp.1257-
1275.https://doi.org/10.1080/01431161.2016.1148285
De Wit, A. J. W., Su, B. 2005. Deriving phenological indicators from SPOT-VGT data using the HANTS
algorithm. In: International SPOT-VEGETATION Users Conference, 2nd, Proceedings. Belgium:
Antwerp, pp.195-201.
Duft, D. G., Picoli, M. C, M., Scarpare, F. V., Hernades, T. A. D., Galdos, M. V. 2015. Comparação do
desempenho de índices de vegetação do sensor MODIS para mapeamento sistemático da cana-de-
açúcar. SBSR - XVII Simpósio Brasileiro de Sensoriamento Remoto, João Pessoa-PB, INPE,
pp.2727–2734.
Eklundh, L., Jonsson, P. 2015. TIMESAT: A software package for Time-Series Processing and
Assessment of Vegetation Dynamics.In: Kuenzer, C.; Dech, S.; Wagner, W. Remote Sensing Time
Series: Revealing Land Surface Dynamics. v. 22, Springer: New York, p.441.
https://doi.org/10.1007/978-3-319-15967-6_7
EMBRAPA - Empresa Brasileira de Pesquisa Agropecuária. Centro Nacional de Pesquisa de Solos.
Sistema Brasileiro de Classificação de Solos. Rio de Janeiro, 1999. 412 p.
ENVI (Exelis Visual Information Solutions). 2016. “Pós-classification”. Accessed on 02 June 2016.
https://www.harrisgeospatial.com/docs/SievingClasses.html.
Esquerdo, J. C. D. M., Antunes, J. F. G., Andrade, J. C. de. 2010. Desenvolvimento do banco de
produtos MODIS na Base Estadual Brasileira. (Comunicado Técnico, 100) - Campinas: Embrapa
Informática Agropecuária, p.7.

IJARSG– An Open Access Journal (ISSN 2320 – 0243)
International Journal of Advanced Remote Sensing and GIS 3219
Esquerdo, J. C. D. M., Zullo Junior, J., Antunes, J.F.G. 2011. Use of NDVI/AVHRR time series profiles
for soybean crop monitoring in Brazil. International Journal of Remote Sensing, 32(13), pp.3711- 3727.
https://doi.org/10.1080/01431161003764112
FAOSTAT - Food And Agriculture Organization of the United Nations Statistics Division, 2014.
Disponível em: < http://faostat3.fao.org/browse/Q/*/S >. Acesso em: 3 jul. 2016.
Fernandes, J. L., Rocha, J. V., Lamparelli, R. A.C. 2011.Sugarcane yield estimates using time series
analysis of spot vegetation images. Scientia Agricola. (Piracicaba, Brazil.) 68(2), pp.139-146.
http://dx.doi.org/10.1590/S0103-90162011000200002
Foody, G. M. 2002.Status of land cover classification accuracy assessment. Remote Sensing of
Environment, 80(1), pp.185-201. https://doi.org/10.1016/S0034-4257(01)00295-4
Foody, G. M., Cox, D. P. 1994.Sub-pixel land cover composition using a linear mixture model and
fuzzy membership functions. International Journal of Remote Sensing, 15(3), pp.619-631,
https://doi.org/10.1080/01431169408954100
Galford, G. L., Mustard, J. F., Melillo, J., Gendrin, A., Cerri, C. C., Cerri, C. E. P. 2008. Wavelet
analysis of MODIS time series to detect expansion and intensification of row-crop agriculture in Brazil.
Remote sensing of environment. pp.576-587. https://doi.org/10.1016/j.rse.2007.05.017
Haralick, R. M., Sternberg, S. R., Zhuang, X. 1987.Image Analysis Using Mathematical Morphology.
IEEE Transactions on Pattern Analysis and Machine Intelligence, 9(4), pp.532-550. doi:
10.1109/TPAMI.1987.4767941
Huete, A., Didan, K., Miura, T., Rodriguez, E. 2002. Overview of the radiometric and biophysical
performance of the MODIS vegetation indices. Remote Sensing of Environment, 83(1-2), pp.195-
213.https://doi.org/10.1016/S0034-4257(02)00096-2
Huete, A., Justice, C., Leeuwen, W. V. MODIS vegetation index (MOD 13) algorithm theoretical basis
document. 1999. Disponível em: <http://modis.gsfc.nasa.gov/data/atbd_mod13.pdf>. Acesso em: 24
mar. 2016.
Huete, A., Liu, H. Q., Batchily, K., Leween, W. 1997.A comparison of vegetation indices over a global
set of TM images for EOS-MODIS. Remote Sensing of Environment, 59, pp.440-451.
https://doi.org/10.1016/S0034-4257(96)00112-5
IBGE - Instituto Brasileiro de Geografia e Estatística. Banco de Dados Agregados: Sistema IBGE de
Recuperação Automática – SIDRA. 2014. Disponível em: <http://www.sidra. ibge.gov.br>. Acesso em:
06 mar. 2014.
IBGE - Instituto Brasileiro de Geografia e Estatística. Banco de Dados Agregados: Sistema IBGE de
Recuperação Automática – SIDRA. 2016. Disponível em: <http://www.sidra. ibge.gov.br>. Acesso em:
24 fev. 2016.
IBGE - Instituto Brasileiro de Geografia e Estatística. Relatórios metodológicos - Pesquisas
Agropecuárias - Departamento de Agropecuária. v. 6, 2.ed., Rio de Janeiro, 92 p., 2002.
Jakubauskas, M. E., Legates, D. R., Kastens, J. H. 2001. Harmonic analysis of time-series AVHRR
NDVI data. Photogrammetric Engineering and Remote Sensing, 67(4), pp.461–470.

IJARSG– An Open Access Journal (ISSN 2320 – 0243)
International Journal of Advanced Remote Sensing and GIS 3220
Jia, L., Shang, H., Hu, G., Menenti, M. 2011. Phenological response of vegetation to upstream river
flow in the Heihe River basin by time series analysis of MODIS data.Hydrology Earth System
Sciences, 15(3), pp.1047-1064. https://doi.org/10.5194/hess-15-1047-2011
Johann, J. A., Rocha, J. V., Duft, D. G., Lamparelli, R. A. C. 2012. Estimativa de áreas com culturas
de verão no Paraná, por meio de imagens multitemporais EVI/Modis. Pesquisa Agropecuária
Brasileira, 47(9) pp.1295-1306. http://dx.doi.org/10.1590/S0100-204X2012000900015
Köppen, W., Geiger, R. 1928. Klimate der Erde, Justus Perthes, Gotha.
Landis, J. R., Koch, G. G. 1977. The measurement of observer agreement for categorical data.
Biometrics, 33(1), pp.159-174.
Mengue, V. P., Fontana, D. C. 2015. Assessment of spectral-temporal dynamics for mapping the
main summer crops in the Rio Grande do Sul State. Bragantia, Campinas, 74(3), pp.331-
340.http://dx.doi.org/10.1590/1678-4499.0452
Ordones, H. A. M., Rocha, J. V., Lamparelli, R. A. C. 2010. Mapeamento de cana-de-açúcar para o
ano-safra 2008/2009 no Estado de São Paulo por meio de índice de vegetação do sensor MODIS. III
SEEMI - Simpósio em Estatística Espacial e Modelagem de Imagens, Foz do Iguaçu - PR.
Pontius, R. G., Millones, M. 2011. Death to Kappa: birth of quantity disagreement and allocation
disagreement for accuracy assessment. International Journal of Remote Sensing, 32(15), pp.4407-
4429. https://doi.org/10.1080/01431161.2011.552923
Rezende, S. O. 2003. Sistemas inteligentes fundamentos e aplicações. Manole, p.525.
Roerink, G. J., Menenti, M., Verhoer, W. 2000. Reconstructing cloud free NDVI composites using
Fourier analysis of time series. International Journal of Remote Sensing, 21(9), pp.1911-
1917.https://doi.org/10.1080/014311600209814
Rudorff, B. F. T., Aguiar, D. A., Silva, W. F., Sugawara, L. M., Adami, M., Moreira, M. A. 2010. Studies
on the rapid expansion of sugarcane for ethanol production in São Paulo State (Brazil) Using Landsat
Data. Remote Sensing. https://doi.org/10.3390/rs2041057
Sakamoto, T., Yokozawa, M., Toritani, H., Shibayama, M., Ishitsuka, N., Ohno, H. 2005. A crop
phenology detection method using time-series MODIS data. Remote Sensing of Environment. p.366-
374. https://doi.org/10.1016/j.rse.2005.03.008
Santos, J. S., Fontana, D. C., Silva, T. S. F., Rudorff, B. F. T. 2014. Identificação da dinâmica espaço-
temporal para estimar área cultivada de soja a partir de imagens MODIS no Rio Grande do Sul.
Revista Brasileira de Engenharia Agrícola e Ambiental, Campina Grande, PB, 18(1), pp.54-63.
http://dx.doi.org/10.1590/S1415-43662014000100008
Silva, W. F., Aguiar, D, A., Rudorff, B, F, T., Sugawara, L. M. 2010. Canasat project: Monitoring of the
sugarcane cultivation area in south central Brazil. ISPRS TC VII Symposium - 100 years, Vienna,
Austria.
Vicente, L. E., Gomes, D., Victoria, D. C., Garçon, E. A. M., Bolfe, E. L., Andrade, R. G., Silva, G. B. S.
2012. Séries temporais de NDVI de sensor SPOT vegetation e algoritmo SAM aplicados ao
mapeamento de cana-de-açúcar. Pesquisa Agropecuária Brasileira, Brasília, 47(9), pp.1337-1345.

IJARSG– An Open Access Journal (ISSN 2320 – 0243)
International Journal of Advanced Remote Sensing and GIS 3221
Victoria, D. C., Oliveira, A. F., Grego, C. R. 2009. Análise harmônica de séries temporais de imagens
NDVI/MODIS para discriminação de coberturas vegetais. SBSR - XIV Simpósio Brasileiro de
Sensoriamento Remoto, Natal, INPE, p.1589-1596.
Victoria, D. C., Paz, A. R., Coutinho, A. C., Kastens, J., Brown, C. 2012. Cropland área estimates
using MODIS NDVI time serie in the state of Mato Grosso, Brazil. Pesquisa Agropecuária Brasileira,
47(9), pp.1270-1278. http://dx.doi.org/10.1590/S0100-204X2012000900012
Willmott, C. J., Roberson, S. M., Matsuura, K. 2012. A Refined Index of Model
Performance.International Journal of Climatology, 32, pp.2088-2094. https://doi.org/10.1002/joc.2419
Xavier, A. C., Rudorff, B. F. T., Shimabukuro, E., Berka, L. M. S., Moreira, M. A. 2006. Multi-temporal
analysis of MODIS data to classify sugarcane crop. International Journal of Remote Sensing, 27(4),
pp. 755-768. https://doi.org/10.1080/01431160500296735
Zanzarini, F. V., Pissarra, T. C. T., Brandão, F. J. C., Teixeira, D. D. B. 2013. Correlação espacial do
índice de vegetação (NDVI) de imagem Landsat/ETM+ com atributos do solo. Revista Brasileira de
Engenharia Agrícola e Ambiental, Campina Grande, PB, 17(6), pp.608-
614.http://dx.doi.org/10.1590/S1415-43662013000600006