sudden death in various populations: is gender a risk factor? 11 th international symposium heart...
TRANSCRIPT

SUDDEN DEATH IN VARIOUS SUDDEN DEATH IN VARIOUS POPULATIONS:POPULATIONS:
IS GENDER A RISK FACTOR?IS GENDER A RISK FACTOR?1111thth International Symposium Heart Failure & Co International Symposium Heart Failure & Co
Reggia di Caserta; April 29, 2011; 12:35 P.M.Reggia di Caserta; April 29, 2011; 12:35 P.M.
Maria Rosa Costanzo, M.D., F.A.C.C, F.A.H.AMaria Rosa Costanzo, M.D., F.A.C.C, F.A.H.AMedical Director, Midwest Heart Specialists Heart Failure andMedical Director, Midwest Heart Specialists Heart Failure and
Pulmonary Arterial Hypertension ProgramsPulmonary Arterial Hypertension ProgramsMedical Director, Edward Hospital Center for Advanced Heart FailureMedical Director, Edward Hospital Center for Advanced Heart Failure
Naperville, Illinois, U.S.A.Naperville, Illinois, U.S.A.
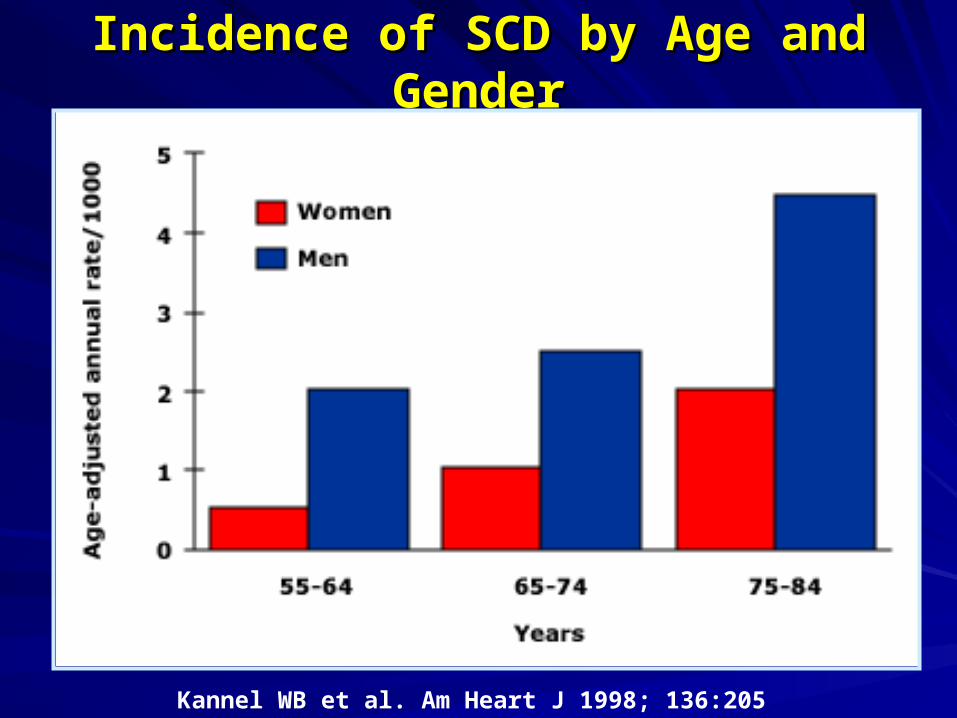
Incidence of SCD by Age and GenderIncidence of SCD by Age and Gender
Kannel WB et al. Am Heart J 1998; 136:205

Prospective Study of SCD in Women in the U.S.Prospective Study of SCD in Women in the U.S.
Albert CM et al. Circulation 2003;107; 2096-101
Relative Risk of SCD by Age% of Cardiac Deaths Deemed SCD by Age
1st. Cardiac Rhythm Documented Near the Time of Collapse in 109 Sudden Arrhythmic Deaths
70%
6%
14%
10%
VF VT Asystole PEA/Bradycardia
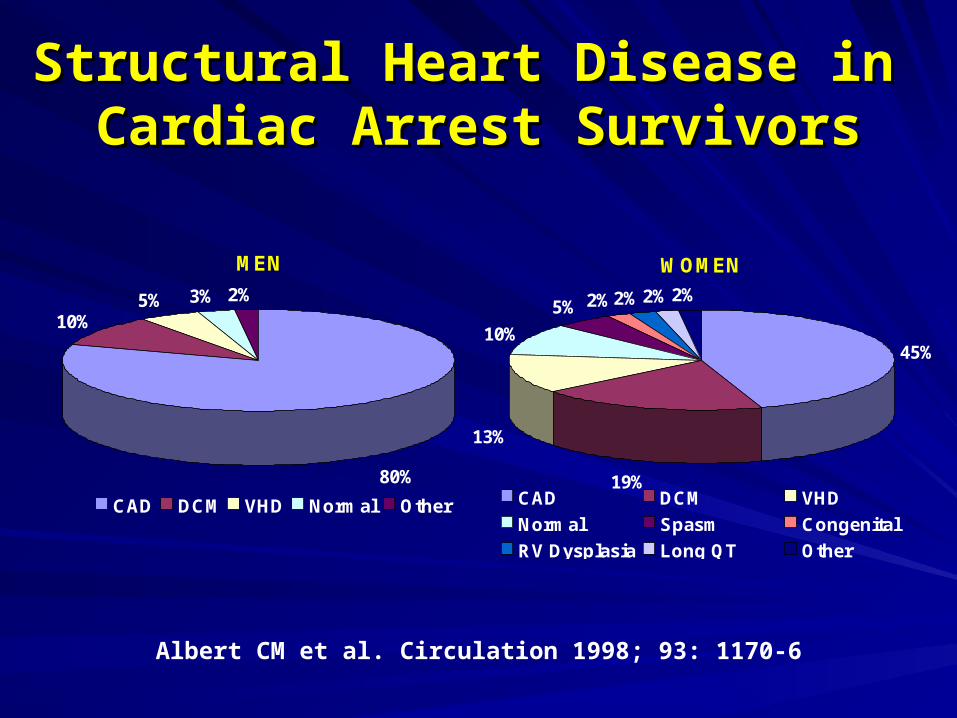
Structural Heart Disease in Structural Heart Disease in Cardiac Arrest SurvivorsCardiac Arrest Survivors
MEN
80%
10%5% 3% 2%
CAD DCM VHD Normal Other
WOMEN
45%
19%
13%
10%
5% 2%2% 2% 2%
CAD DCM VHD
Normal Spasm Congenital
RV Dysplasia Long QT Other
Albert CM et al. Circulation 1998; 93: 1170-6
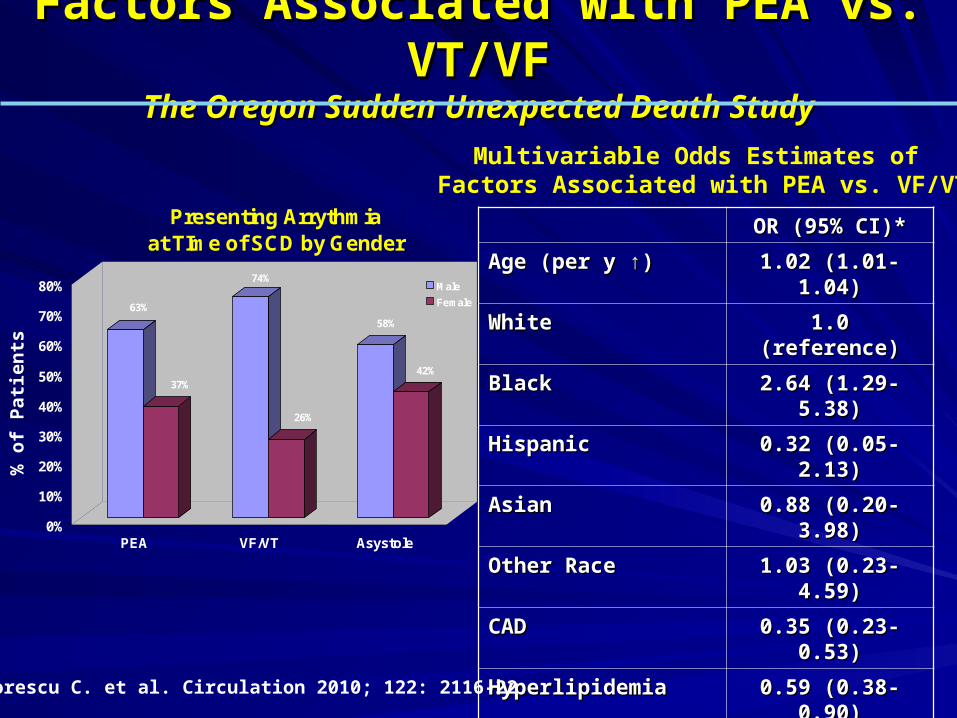
Factors Associated with PEA vs. VT/VFFactors Associated with PEA vs. VT/VFThe Oregon Sudden Unexpected Death StudyThe Oregon Sudden Unexpected Death Study
63%
37%
74%
26%
58%
42%
0%
10%
20%
30%
40%
50%
60%
70%
80%
PEA VF/VT Asystole
Presenting Arrythmia at TIme of SCD by Gender
Male
Female
OR (95% CI)*OR (95% CI)*
Age (per y Age (per y ↑)↑) 1.02 (1.01-1.04)1.02 (1.01-1.04)
WhiteWhite 1.0 (reference)1.0 (reference)
BlackBlack 2.64 (1.29-5.38)2.64 (1.29-5.38)
HispanicHispanic 0.32 (0.05-2.13)0.32 (0.05-2.13)
AsianAsian 0.88 (0.20-3.98)0.88 (0.20-3.98)
Other RaceOther Race 1.03 (0.23-4.59)1.03 (0.23-4.59)
CADCAD 0.35 (0.23-0.53)0.35 (0.23-0.53)
HyperlipidemiaHyperlipidemia 0.59 (0.38-0.90)0.59 (0.38-0.90)
Hx. SyncopeHx. Syncope 2.64 (1.31-5.32)2.64 (1.31-5.32)
Male, No Pulm. DisMale, No Pulm. Dis 1.0 (reference)1.0 (reference)
Female, No Pulm. DisFemale, No Pulm. Dis 1.68 (1.01-2.82)1.68 (1.01-2.82)
Male, Pulm. Dis.Male, Pulm. Dis. 3.17 (1.86-5.42)3.17 (1.86-5.42)
Female, Pulm. DisFemale, Pulm. Dis 2.11 (1.10-4.04)2.11 (1.10-4.04)
Multivariable Odds Estimates of Factors Associated with PEA vs. VF/VT
Teodorescu C. et al. Circulation 2010; 122: 2116-22
% o
f P
atie
nts

Basic Electrophysiological Variables Basic Electrophysiological Variables Affected by Gender DifferencesAffected by Gender Differences
Cardiac Cycle
QT IntervalHeart Rate
T WaveMorphology
QT-RR Relationship
QT Dispersion
Higher Prevalence in Higher Prevalence in FemalesFemales Higher Prevalence in Higher Prevalence in MalesMales
Congenital Long QT SyndromeCongenital Long QT Syndrome AFAF
Acquired Long QT SyndromeAcquired Long QT Syndrome WPWWPW
AV Nodal Re-Entrant TachycardiaAV Nodal Re-Entrant Tachycardia SCDSCD

Sex-Related Differences in RepolarizationSex-Related Differences in RepolarizationAction Potentials from Isolated
Guinea Pig Ventricular MyocytesBaseline and Ibutilide-Induced
QTc Change in Normal Volunteers
Rodriguez I et al. JAMA 285: 1322-6James MJ et al. Basic Res Cardiol 2004;99: 183-92

Relationship between Relationship between Baseline QT Interval and Cycle LengthBaseline QT Interval and Cycle Length
Orchiectomy (Placebo)
Orchiectomy +
Dihydrotestosterone
Liu XK et al. Cardiovasc Res 2003; 57:28-36

Effects of Dofetilide on APD and Incidence of EADs Effects of Dofetilide on APD and Incidence of EADs at a Cycle Length of 1000 ms at a Cycle Length of 1000 ms
in Rabbit RV Endocardial Papillary Musclesin Rabbit RV Endocardial Papillary Muscles
Female
Male
Ovariectomized Females
Orchiectomized Males
Pham TV et al.Circulation 2001; 103:2207-12

Effects of Dihydrotestosterone on Effects of Dihydrotestosterone on Dofelitide-Induced Repolarization Changes Dofelitide-Induced Repolarization Changes in Rabbit RV Endocardial Papillary Musclesin Rabbit RV Endocardial Papillary Muscles
Males
Orchiectomized Males
DHT-Orchiectomized Males
Females
DHT Females
APD EAD
Pham TV et al. Circulation 2002; 106:2132-6

4946
40
65
25
80
5
95
20
85
3
95
21
80
0
10
20
30
40
50
60
70
80
90
100
6-10 11-15 16-20 21-25 26-30 31-35 36-40
Distribution of Probands in Familial LQTS by Age and Sex at Baseline ECG
Males
Females
% P
atie
nts
Age, Y
James AF et al. Prog Biophysics Molecular Biol 2007; 94: 265-319

High Risk Subsets for ACA or ACA by Age GroupsHigh Risk Subsets for ACA or ACA by Age GroupsGoldenberg I et al. Curr Prob Cardiol 2008; 33: 629-94Goldenberg I et al. Curr Prob Cardiol 2008; 33: 629-94
Age Group (Years)Age Group (Years) High Risk SubsetsHigh Risk Subsets BB Effect in High Risk Patients:BB Effect in High Risk Patients:
% Reduction (p value)% Reduction (p value)
ChildhoodChildhood
(1-12)(1-12)
Males Males with prior syncope and/or QTc >500 mswith prior syncope and/or QTc >500 ms
FemalesFemales with prior syncope with prior syncope 73 (0.002)73 (0.002)
AdolescenceAdolescence
(13-20)(13-20)
MalesMales and and Females Females with either one or two or with either one or two or more of the following:more of the following:
QTc QTc ≥ 530 ms≥ 530 ms
≥ ≥ episode of syncope in the past yearepisode of syncope in the past year
≥ ≥ 2 episodes of syncope in the past 2-10 y2 episodes of syncope in the past 2-10 y
64 (0.01)64 (0.01)
AdulthoodAdulthood
(20-40)(20-40) Either one or more of the following:Either one or more of the following:
Female GenderFemale Gender
Interim Syncope after age 18Interim Syncope after age 18
QTc QTc ≥ 500 ms≥ 500 ms
60 (< 0.01)60 (< 0.01)
(41-60)(41-60) Female genderFemale gender
Syncope in the past 10 ySyncope in the past 10 y
QTc QTc ≥ 500 ms≥ 500 ms
LQT3 genotypeLQT3 genotype
42 (0.40)42 (0.40)
(61-75)(61-75) Syncope in the past 10 ySyncope in the past 10 y 86 (0.05)86 (0.05)

Probability of ACA or SCD in 3,774 LQTS PatientsProbability of ACA or SCD in 3,774 LQTS Patientsfrom the International LQTS Registryfrom the International LQTS Registry

0.9%
0.0%
4.5%
1.8%
9.1% 9.0%
0%
1%
2%
3%
4%
5%
6%
7%
8%
9%
10%
Pre-pregnancy Pregnancy Post partum
Influence of Pregnancy on the Risk of Cardiac Events
in Patients with Hereditary Long QT Syndrome% Long QT
% Long QT with new-onset cardiac events
Rashba EJ et al. Circulation 1998; 97: 451-6
% o
f P
atie
nts

320
325
330
335
340
345
350
355
360
365
370
375
Lowest Daily Dose 320 mg/day Highest Daily Dose Max JTc (any dose)
JTc on d, I-sotalol
Women
Men
Lehman MH et al. Am J Cardiol 1999;83: 354-9
JTc
(mse
c)

Lethal Arrhythmias Susceptibility and Lethal Arrhythmias Susceptibility and Myocardial Connexin-43 ExpressionMyocardial Connexin-43 Expression
0
100
200
300
400
500
600
700
800
900
Female Male
Myocardial Connexin-43 Expression
0%
10%
20%
30%
40%
50%
60%
70%
80%
90%
Female Male
Susceptibility to VF
Knezl V. et al. Neuroendocrinology Letters 2008; 29: 798-601

Gender Differences in the Gender Differences in the Clinical Manifestations of the Brugada SyndromeClinical Manifestations of the Brugada Syndrome
No EventsNo Events EventsEvents P valueP value No Events No Events EventsEvents P valueP value
Sx. At Dx.Sx. At Dx. 46 (19)46 (19) 20 (64)20 (64) < 0.001< 0.001 15 (15)15 (15) 1 (33)1 (33) NSNS
Previous Previous AF n (%)AF n (%)
18 (7%)18 (7%) 8 (26)8 (26) 0.0050.005 12 (11)12 (11) 2 (67)2 (67) 0.040.04
Spont. Spont. Type -1 Type -1 ECGECG
105 (43)105 (43) 21 (67)21 (67) 0.010.01 23 (21)23 (21) 2 (67)2 (67) 0.040.04
PR (ms)PR (ms) 175 175 ± 30± 30 178 178 ± 40± 40 NSNS 173 173 ± 32± 32 240 240 ± 62± 62 0.0010.001
QRS (ms)QRS (ms) 107 107 ± 17± 17 110 ± 18 110 ± 18 NSNS 97 97 ± 16± 16 130 130 ± 62± 62 NSNS
QTc (ns)QTc (ns) 421 421 ± 48± 48 432 432 ± 42± 42 NSNS 420 420 ± 49± 49 486 486 ± 47± 47 0.0060.006
ST elev.ST elev. 3.6 3.6 ± 2± 2 3 3 ± 1± 1 NSNS 2.4 2.4 ± 1± 1 3.2 3.2 ±1±1 NSNS
VF VF Inducibility Inducibility (%)(%)
2828 7474 < 0.001< 0.001 1111 5050 NSNS
HV IntervalHV Interval 48 48 ± 10± 10 46 46 ± 7± 7 NSNS 46 46 ± 8± 8 60 60 ± 11± 11 0.0020.002
Benito, B. et al. J Am Coll Cardiol 2008;52:1567-1573
Males Females

Benito, B. et al. J Am Coll Cardiol 2008;52:1567-1573
Kaplan-Meier Estimate of Cardiac Event-Free Survival According to Gender
The Brugada Syndrome and Gender
HRHR 95% CI95% CI P P ValueValue
GenderGender 2.822.82 0.64-12.410.64-12.41 NSNS
Previous AFPrevious AF 2.162.16 0.93-5.030.93-5.03 0.0070.007
Syncope at Syncope at Dx.Dx.
1.861.86 0.7-4.970.7-4.97 NSNS
Aborted SCDAborted SCD 8.458.45 3.17-22.553.17-22.55 <0.001<0.001
Spont. Type 1 Spont. Type 1 ECGECG
1.41.4 0.59-3.330.59-3.33 NSNS
VF InducibilityVF Inducibility 2.932.93 1.14-7.551.14-7.55 0.020.02
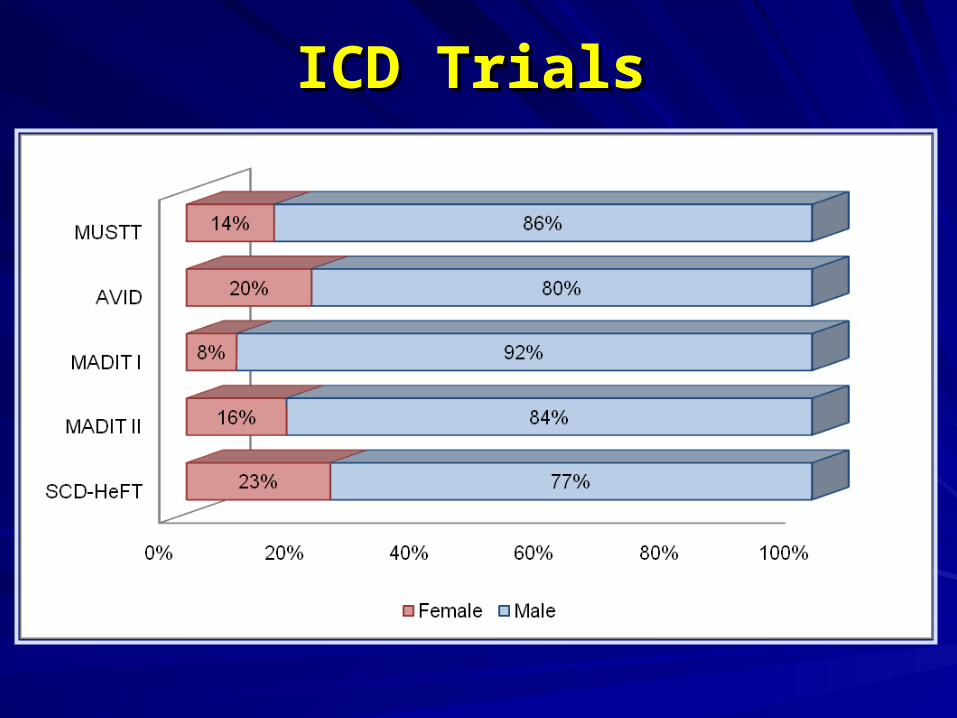
ICD TrialsICD Trials
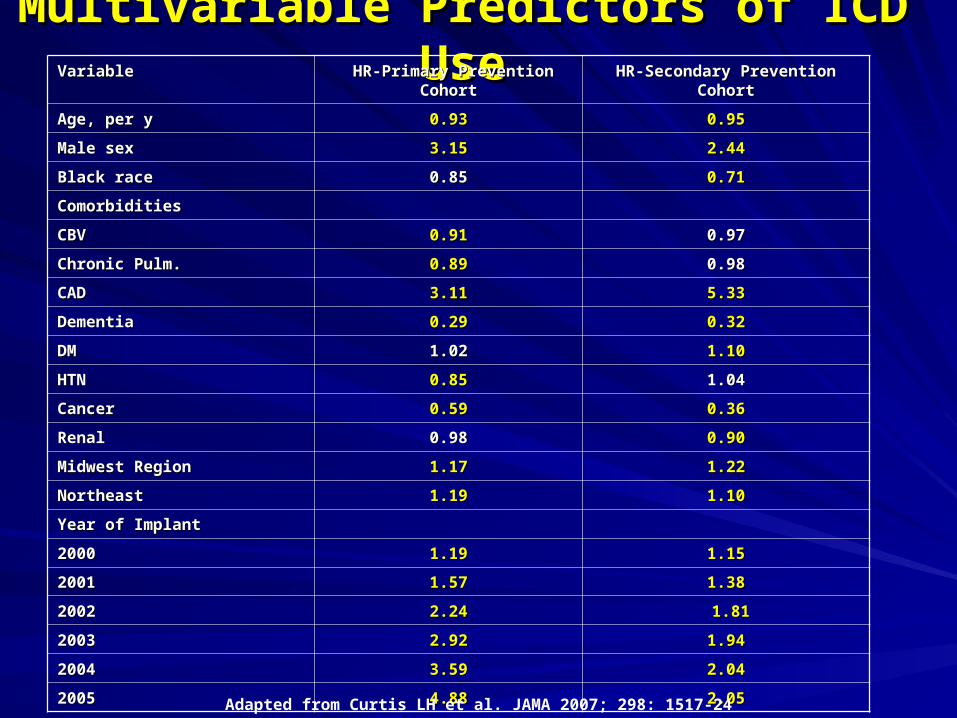
Multivariable Predictors of ICD UseMultivariable Predictors of ICD UseVariableVariable HR-Primary Prevention CohortHR-Primary Prevention Cohort HR-Secondary Prevention CohortHR-Secondary Prevention Cohort
Age, per yAge, per y 0.930.93 0.950.95
Male sexMale sex 3.153.15 2.442.44
Black raceBlack race 0.850.85 0.710.71
ComorbiditiesComorbidities
CBVCBV 0.910.91 0.970.97
Chronic Pulm.Chronic Pulm. 0.890.89 0.980.98
CADCAD 3.113.11 5.335.33
DementiaDementia 0.290.29 0.320.32
DMDM 1.021.02 1.101.10
HTNHTN 0.850.85 1.041.04
CancerCancer 0.590.59 0.360.36
RenalRenal 0.980.98 0.900.90
Midwest RegionMidwest Region 1.171.17 1.221.22
NortheastNortheast 1.191.19 1.101.10
Year of ImplantYear of Implant
20002000 1.191.19 1.151.15
20012001 1.571.57 1.381.38
20022002 2.242.24 1.811.81
20032003 2.922.92 1.941.94
20042004 3.593.59 2.042.04
20052005 4.884.88 2.052.05
Adapted from Curtis LH et al. JAMA 2007; 298: 1517-24

1 Year Mortality by ICD Use and Gender 1 Year Mortality by ICD Use and Gender in a Large Medicare Populationin a Large Medicare Population
No. of No. of Pts. At Pts. At RiskRisk
% % MortalityMortality
with ICDwith ICD
% % MortalityMortality
without without ICDICD
HRHR
(p value)(p value)
OverallOverall 9699096990 10.410.4 13.413.4 1.011.01
MenMen 4772947729 11.211.2 13.113.1 1.051.05
WomenWomen 4926149261 7.87.8 13.713.7 0.930.93
No. of No. of Pts. At Pts. At RiskRisk
% % MortalityMortality
with ICDwith ICD
% % MortalityMortality
without without ICDICD
HRHR
(p value)(p value)
OverallOverall 5434254342 10.910.9 16.816.8 0.65 0.65 (0.001)(0.001)
MenMen 2933329333 11.011.0 16.816.8 0.62 0.62 (0.001)(0.001)
WomenWomen 2500925009 10.810.8 16.016.0 0.710.71
(0.001)(0.001)
Primary Prevention Cohort Secondary Prevention Cohort
Adapted from Curtis LH et al. JAMA 2007; 298: 1517-24

Effectiveness of ICD for the Primary Prevention of Effectiveness of ICD for the Primary Prevention of SCD in Women with Advanced HFSCD in Women with Advanced HF
Baseline Characteristics of Patients in Trials Included in the Meta-AnalysisBaseline Characteristics of Patients in Trials Included in the Meta-Analysis
Ghambari H. et al. Arch Intern Med 2009; 169: 1500-6

Effectiveness of ICD for the Primary Prevention of Effectiveness of ICD for the Primary Prevention of SCD in Women with Advanced HFSCD in Women with Advanced HF
Sex Differences in Mortality Rates Sex Differences in Mortality Rates Between ICD and Medical Therapy GroupsBetween ICD and Medical Therapy Groups
Ghambari H. et al. Arch Intern Med 2009; 169: 1500-6

Effectiveness of ICD for the Primary Prevention of Effectiveness of ICD for the Primary Prevention of SCD in Women with Advanced HFSCD in Women with Advanced HF
MEN
WOMEN
Ghambari H. et al. Arch Intern Med 2009; 169: 1500-6

161.470 pts, 27% women
Gender Differences in Procedure-Related Adverse Events in Patients Receiving ICD Therapy
Peterson PN et al. Circulation 2009; 119: 1078 - 84

Benefits of ICD in WomenBenefits of ICD in Women
No trial powered to separately examine outcomes in men No trial powered to separately examine outcomes in men and women or test for difference in ICD effectivenessand women or test for difference in ICD effectiveness
Small numbers of women enrolled Small numbers of women enrolled
Limited post-hoc analyses for females do not clearly Limited post-hoc analyses for females do not clearly demonstrate a mortality benefit:demonstrate a mortality benefit:
– SCD-HeFT: benefit not clear (SCD-HeFT: benefit not clear (not powered for gendernot powered for gender))
– MADIT II: nonsignificant trend toward lower mortality in MADIT II: nonsignificant trend toward lower mortality in females but analysis limited by too few female subjectsfemales but analysis limited by too few female subjects
Meta-analysis: 934 females in 5 trials; no difference in Meta-analysis: 934 females in 5 trials; no difference in all-cause mortality for women with ICD vs medical Rxall-cause mortality for women with ICD vs medical Rx

■ Females with lower rates of SCD than Females with lower rates of SCD than malesmales
■ Differences in arrhythmia susceptibilityDifferences in arrhythmia susceptibility
■ 30% of ICDs are implanted in females30% of ICDs are implanted in females
■ Even though the benefit is less, it may Even though the benefit is less, it may represent a clinically significant represent a clinically significant reduction in deathsreduction in deaths
ConclusionsConclusions

ConclusionsConclusions
A trial targeting women is needed
To detect the same ICD benefit in women To detect the same ICD benefit in women as was observed in men with 90% power as was observed in men with 90% power and and αα=0.05, a study larger than SCDHeFT =0.05, a study larger than SCDHeFT would be required (would be required (1.585 women in each 1.585 women in each treatment arm, 3.170 totaltreatment arm, 3.170 total))
It may now even be considered “unethical” It may now even be considered “unethical” to withhold ICD therapy in women meeting to withhold ICD therapy in women meeting the SCD-HeFT enrollment criteria.the SCD-HeFT enrollment criteria.