sudan: 2014 article iv consultation and second review ... · sudan staff report for the 2014...
TRANSCRIPT

© 2014 International Monetary Fund
IMF Country Report No. 14/364
SUDAN 2014 ARTICLE IV CONSULTATION AND SECOND REVIEW UNDER STAFF-MONITORED PROGRAM—STAFF REPORT; PRESS RELEASES; AND STATEMENT BY THE EXECUTIVE DIRECTOR FOR SUDAN
Under Article IV of the IMF’s Articles of Agreement, the IMF holds bilateral discussions with members, usually every year. In the context of the 2014 Article IV consultation with Sudan, the following documents have been released and are included in this package: The Staff Report prepared by a staff team of the IMF for the Executive Board’s
consideration on December 3, 2014, following discussions that ended on September 16, 2014, with the officials of Sudan on economic developments and policies. Based on information available at the time of these discussions, the staff report was completed on November 21, 2014.
An Informational Annex prepared by the IMF.
A Debt Sustainability Analysis prepared by the staffs of the IMF and the World Bank.
Press Releases summarizing the views of the Executive Board as expressed during its December 3, 2014 consideration of the staff report that concluded the Article IV consultation with Sudan, and on the conclusion of the second review under the Staff-Monitored Program for Sudan.
A Statement by the Executive Director for Sudan.
The documents listed below have been or will be separately released. Letter of Intent sent to the IMF by the authorities of Sudan*
Technical Memorandum of Understanding* *Also included in Staff Report
The policy of publication of staff reports and other documents allows for the deletion of market-sensitive information.
Copies of this report are available to the public from
International Monetary Fund Publication Services PO Box 92780 Washington, D.C. 20090
Telephone: (202) 623-7430 Fax: (202) 623-7201 E-mail: [email protected] Web: http://www.imf.org
Price: $18.00 per printed copy International Monetary Fund
Washington, D.C.
December 2014

SUDAN STAFF REPORT FOR THE 2014 ARTICLE IV CONSULTATION AND SECOND REVIEW UNDER THE STAFF-MONITORED PROGRAM
KEY ISSUES Context: Sudan’s economy has yet to recover from the shock of South Sudan’s secession three years ago, which took away three-quarters of oil production, half of its fiscal revenues, and two-thirds of its international payments capacity. Despite progress in implementing policies to address the resulting imbalances, inflation remains high and growth sluggish. Macroeconomic adjustment has been complicated by structural weaknesses, a heavy debt burden, U.S. sanctions, and volatile domestic and regional political factors. The authorities embarked earlier this year on a stabilization program supported by a Staff-Monitored Program (SMP). The program runs through end-2014, and the authorities have not yet decided if they want a new SMP; the mission for the third SMP review in December will discuss the matter with them.
Developments, outlook, and risks. Economic performance this year has been mixed as growth has remained subdued and inflation still high at about 40 percent. Growth is expected to rebound in 2015, but the outlook remains uncertain. The risks are largely tilted to the downside, although prospects of a successful national dialogue could lead to resolution of domestic conflicts and improved international relations.
Article IV. Discussions focused on policies to secure macroeconomic stability, strengthen social safety nets, and a move to sustainable and inclusive growth. Fiscal consolidation (through revenue mobilization and expenditure rationalization, including a gradual phase-out of fuel subsidies) should continue, accompanied by increased public investment and social spending. Tight monetary policy and lower central bank financing of the government should help lower inflation. There is also a need for steps to lower the large premium in the foreign exchange market. Stronger supervision is needed to improve banks’ resilience. More should be done to improve the business climate to boost growth.
Program performance: The program remains on track. The authorities continue to minimize non-concessional borrowing and maintain satisfactory track record of payments to the Fund. They recently devalued the official exchange rate by 3 percent to help address external imbalances, which together with a large appreciation of the
November 21, 2014

SUDAN
2 INTERNATIONAL MONETARY FUND
parallel market rate, has helped lower the premium. Going forward, priority should be given to further reducing inflation by continuing fiscal consolidation, tightening monetary policy, and gradually closing the gap between the official and parallel exchange rates.
Debt relief. Relief requires reaching out to creditors, normalizing relations with international financial institutions, and continuing to establish a track record of cooperation with the IMF on policies and payments. The authorities’ agreement with South Sudan to extend the “zero option” by two years is a positive step.

SUDAN
INTERNATIONAL MONETARY FUND 3
Approved By Adnan Mazarei (MCD) and Ranil Salgado (SPR)
Discussions took place in Khartoum during September 3–16, 2014. The staff team comprised Edward Gemayel (head), Eric Mottu, Haiyan Shi (all MCD), Yoon Kim (FAD), Mariusz Sumlinski (FIN), and Yi Xiong (SPR), assisted by Lodewyk Erasmus (Resident Representative) and Amin Yasin. Ms. Matlhodi Serero (OED) participated in the discussions. The mission met with Minister of Finance and National Economy Badredin Mahmoud Abbas, Governor of the Central Bank of Sudan Abdulrahman Hassan Abdulrahman Hashim, other senior officials, parliamentarians, and members of the business, international, and donor communities. Ms. Penso and Ms. Ibrahim (both MCD) edited and helped prepare the report.
CONTENTS
INTRODUCTION __________________________________________________________________________________ 5
ECONOMIC DEVELOPMENTS, OUTLOOKS, AND RISKS _________________________________________ 8
POLICY DISCUSSIONS __________________________________________________________________________ 12
A. Overview ______________________________________________________________________________________ 12
B. Restoring Macroeconomic Stability ___________________________________________________________ 12
C. Policies to Support Inclusive Growth and Reduce Unemployment ____________________________ 19
D. External debt __________________________________________________________________________________ 20
E. Statistical Issues _______________________________________________________________________________ 22
SECOND REVIEW UNDER THE SMP ____________________________________________________________ 22
ARTICLE VIII ISSUES ____________________________________________________________________________ 23
STAFF APPRAISAL ______________________________________________________________________________ 24
BOXES 1. The Recent Breakdown in Correspondent Bank Relations _______________________________________ 62. Fuel Subsidies Reform _________________________________________________________________________ 143. Path to Normalization of Relations and Debt Relief ___________________________________________ 214. Exchange Rate System _________________________________________________________________________ 24
FIGURES 1. Selected Economic Indicators _________________________________________________________________ 272. Selected Political and Social Indicators ________________________________________________________ 283. Selected Economic and Financial Indicators ___________________________________________________ 29

SUDAN
4 INTERNATIONAL MONETARY FUND
TABLES 1. Selected Economic Indicators, 2011-19 _______________________________________________________ 302. Balance of Payments, 2011-19 _________________________________________________________________ 313A. Government Operations, 2013-19 in millions of SDGs _______________________________________ 32 3B. Government Operations, 2013-19 in percent of GDP ________________________________________ 33 4. Monetary Survey, 2010-14_____________________________________________________________________ 345. Summary Accounts of the Monetary Authorities, 2010-14 ____________________________________ 356. Summary Accounts of the Commercial Banks, 2010-14 _______________________________________ 367. Medium-Term Macroeconomic Outlook, 2011-19 ____________________________________________ 378. Financial Soundness Indicators for the Banking Sector, 2010-14 ______________________________ 38
ANNEXES I. External Sector Assessment ____________________________________________________________________ 39 II. Sources of Growth in Sudan ___________________________________________________________________ 43
APPENDICES I. Letter of Intent _________________________________________________________________________________ 46 Attachment I. Technical Memorandum of Understanding ____________________________________ 53

SUDAN
INTERNATIONAL MONETARY FUND 5
INTRODUCTION 1. Sudan is a fragile state weighed by a heavy debt burden and an unsettled domesticand regional political environment. These problems, together with limited revenue mobilization, have been constraining Sudan’s growth prospects and poverty reduction efforts. The economic and financial situation worsened following the secession of South Sudan in 2011. The domestic conflicts in Southern Kordofan, Blue Nile, and Darfur states and the new conflict in South Sudan threaten domestic and regional stability. U.S. sanctions, which were recently extended for an additional year, are also creating uncertainties.
2. Sudan’s external debt, most of which dates back to the 1970s, is unsustainable.External debt, at the end of 2013, was estimated at US$45 billion (78 percent of GDP)—most of which, including its debt to the IMF, is in arrears.1 The unresolved arrears, combined with U.S. sanctions since 1997, rule out access to most sources of external financing, including concessional borrowing.
3. Sudan has had 14 Staff Monitored Programs (SMPs) since 1997. These programsprovided the authorities with comprehensive frameworks to design and implement policies and reforms to address their economic challenges. They helped the authorities stabilize the economy through tight fiscal and monetary policies and supported the modernization of tools to manage the economy, including through reforms in monetary policy operations, tax policy, and public financial management. These programs also facilitated the provision and sequencing of technical assistance from the Fund and others.
4. Sudan’s economy has yet to recover from the shock of South Sudan’s secession threeyears ago. Sudan has been heavily dependent on oil since the late 1990s: the oil sector provided sizeable budget revenues and a major share of the country’s foreign exchange receipts. The secession of South Sudan in 2011 took away three-quarters of oil production, half of fiscal revenues, and two-thirds of the international payments capacity. As a result, the economic situation deteriorated significantly, resulting in the buildup of large economic imbalances.
5. A first attempt was made in June 2012 to address the economic imbalances through apackage of corrective measures.2 Nevertheless, the outcome for 2012 was mixed while the reform process was interrupted in 2013 with the adoption of a budget void of any significant reform measures in support of the needed fiscal consolidation.
6. In September 2013, the authorities embarked on a stabilization program the success ofwhich hinges significantly on improvements in the domestic and regional political
1 Sudan has been in arrears to the Fund since July 1984. 2 See the 2012 Article IV consultation (IMF Country Report No. 12/299; September 7, 2012) for an elaborate discussion.

SUDAN
6 INTERNATIONAL MONETARY FUND
environments. The program’s objective is to restore macroeconomic stability, strengthen social safety nets, and lay the groundwork for sustainable growth. In parallel, the authorities expect that the national dialogue in Sudan initiated earlier this year and the return of peace in South Sudan will ensure the continuation of oil flows. The authorities consider their stabilization program supported by the SMP a basis for a track record towards debt relief from international creditors, which is crucial for sustaining growth and the adjustment process.
7. The recent breakdown in relations with correspondent banks has complicatedinternational financial and trade transactions (Box 1). During the second quarter of 2014, most foreign banks stopped transacting with Sudanese banks following the US$8.9 billion penalty levied in June 2014 by the U.S. authorities on BNP-Paribas for violating the U.S. sanctions on doing business with Sudan and other countries. As a result, the foreign exchange market tightened and the parallel exchange rate weakened significantly.
Box 1. The Recent Breakdown in Correspondent Bank Relations
In recent months, Sudanese banks have experienced a breakdown in their correspondent relations with foreign banks. This comes as a result of the prosecution by the U.S. of BNP Paribas in early 2014 for breaking U.S. sanctions against Sudan and other countries. Foreign and local entities based in Sudan are reporting difficulties and delays in processing foreign exchange transfers to and from Sudan.
As a result, trade has been adversely affected, and the shortage of foreign exchange in Sudan has worsened. Export receipts are being delayed. Importers are unable to obtain trade financing (e.g., letters of credit) or transfer payments. Embassies, international organizations, and other entities based in Sudan—who are all exempt from sanctions—are affected by foreign correspondent banks’ refusal to process foreign exchange transactions. The June and September payments to the IMF were received with long delays as a result of this situation.
If the breakdown in relations with correspondent banks continues, it is likely to have a considerable negative impact on the economy: (i) growth will be affected because exports and imports will decline. The lower imports of foodstuffs, intermediate goods, and raw materials will result in lower domestic consumption and production; (ii) inflation will rise as a result of shrinkage of supplies and higher cost of imports; and (iii) shortage of foreign exchange will contribute to depreciation of the exchange rate on the parallel market, thereby fueling inflation and undermining macroeconomic stability. These adverse developments will impact the poor and the most vulnerable segments of the population, and will most likely increase poverty rates in Sudan.
1 In June 2014, BNP Paribas pleaded guilty to violating U.S. sanctions on doing business with Sudan and other countries and was fined US$8.9 billion by the U.S. authorities.
SUDAN
INTERNATIONAL MONETARY FUND 7
8. The political environment has improved somewhat with progress on the nationaldialogue. In August 2014, the leaders of the Umma Party and the Sudan Revolutionary Forces (both opposition) signed a declaration in Paris calling for, among other things, an end to the fighting in the two border states and the adoption of democratic and peaceful principles to foster political change. This was followed in early September 2014 by an agreement on the principles of the National Dialogue in Addis Ababa between the Paris Declaration group, representatives of the National Dialogue 7+7 Committee, which comprises seven each representatives from the opposition and the ruling National Congress Party (NCP), and the African Union High-Level Implementation Panel (AUHIP). This agreement was followed by the release of some political prisoners.
9. The armed conflict in South Sudan, which erupted in December 2013, persists. Theconflict has affected oil production there and forced many South Sudanese to seek refuge abroad. Sudan has granted unrestricted access to its territory to refugees from South Sudan and has received more than 100,000 of them so far. The UN relief agencies have been assisting the refugees.
10. The authorities have started implementing an outreach strategy with South Sudanunder the auspices of the AUHIP to garner support for debt relief. Sudan and South Sudan, together with the African Union (Tripartite Committee), developed an outreach strategy and an action plan to help garner support for debt relief, which was supported by the June African Union summit. In September, members of the Tripartite Committee held a briefing for key external creditors in Khartoum to discuss the need for debt relief, which was followed by a briefing by the Minister of Finance to the diplomatic community on Sudan's economic policy implementation and the need for debt relief to support the implementation of poverty reduction policies. These briefings were followed by meetings with the donor representatives in Washington during the Annual Meetings. Furthermore, the two countries recently agreed to extend the “zero option” to October 2016.3
11. The authorities’ policies since the last Article IV consultation have be en broadly in linewith Fund recommendations. Notable achievements include improving revenue mobilization, containing expenditure, and unifying the official exchange rates. However, monetary policy management remains weak, including the central bank’s involvement in quasi-fiscal operations, and the business environment still needs to improve.
3 Sudan and South Sudan in September 2012 reached the so-called “zero option” agreement whereby Sudan would retain all the external liabilities after the secession of South Sudan, provided that the international community gave firm commitments to the delivery of debt relief within two years. Absent such a commitment, Sudan’s external debt would be apportioned with South Sudan based on a formula to be determined.

SUDAN
8 INTERNATIONAL MONETARY FUND
ECONOMIC DEVELOPMENTS, OUTLOOKS, AND RISKS 12. The secession of South Sudan had a significant impact on the Sudanese economy.Between 2010 and 2012, annual oil production dropped from 168 million barrels to 38 million barrels, budgetary oil revenues from 11.5 percent of GDP to 1.5 percent of GDP, and oil exports from US$11 billion to US$2 billion. These substantial economic and financial losses affected all sectors of the economy and resulted in slower growth, inflation rising to high double digits, and deteriorating fiscal and current account balances (Table 1).
13. To adjust to the new economicsituation, in 2011 the authorities developed a three-year emergency plan and implemented some corrective measures in June 2012 and September 2013.4 The September 2013 measures included increases in domestic petroleum prices by 67–75 percent, unification of multiple official exchange rates and a step devaluation of the unified rate by about 22 percent. The adoption of these measures was facilitated by improved relations with South Sudan and the resumption of oil production in mid-2013. However, there was civil unrest, including the loss of life, in reaction to some of the reforms.
14. Despite progress in implementing adjustment policies, economic performance throughend-2013 was mixed. Growth started to recover in 2013 but remained sluggish, weighed by poor harvests and lower gold production. Inflation accelerated to 42 percent by end-December, reflecting the September exchange rate devaluation and increase in fuel prices. Fiscal performance was better than expected due to improved tax and custom collections. Reserve money growth decelerated to 20 percent at end-2013 (from 47 percent a year earlier), largely reflecting lower gold purchases by the central bank. The gap between the official and parallel market exchange rates dropped to about 47 percent. Gross international reserves declined to US$1.6 billion—about 1.9 months of imports (Table 2).
4 See IMF Country Report No. 12/298 for a summary of the 2012 measures.
‐
40
80
120
160
200
2010 2011 2012 2013 2014 proj.
Text Figure 1:. Oil production, 2010-14 (In million barrels)
-
2
4
6
8
10
12
2010 2011 2012 2013 2014 proj.
Text Figure 2. Budgetary oil revenue (In percent of GDP)
-
2
4
6
8
10
12
2010 2011 2012 2013 2014 proj.
Text Figure 3. Oil Exports, 2010-14 (In billions of US$)

SUDAN
INTERNATIONAL MONETARY FUND 9
15. Macroeconomic performance has been improving gradually in 2014. Economic activityhas been recovering owing to a rebound in gold extraction and growing manufacturing, trade, and services sectors. On the fiscal front, the budget deficit dropped to 0.4 percent of GDP (against 1.2 percent the previous year) by mid-year, curbing government recourse to central bank financing. The current account deficit is also estimated to have narrowed to 2.7 percent of GDP in H1 2014 from 4.6 percent of GDP in H1 2013, following last September’s exchange rate devaluation and the fiscal consolidation efforts. Inflation, which peaked at 47 percent in July, declined to 39 percent in September thanks to a good agriculture harvest and the drop in the parallel market exchange rate.5
16. The parallel market exchange rate premium has declined considerably (by18 percentage points since August 2014). This decline has been principally due to an appreciation of the parallel market rate following increased agricultural exports and increased supply of foreign currency on the parallel market, but also a devaluation by 3 percent of the official exchange rate;6 it stood at 47 percent in early November.
17. The outlook for the remainder of 2014remains favorable. Non-oil growth is projected at 2.9 percent as gold extraction is expected to be strong and agriculture to rebound owing to favorable weather. Inflation is expected to decelerate to 29 percent by year-end as the one-off effects of the September 2013 fuel price increases dissipate, monetary policy is tightened, and food price declines owing to the expected good harvest. The fiscal deficit is projected to narrow to 1.0 percent of GDP (0.2 percentage points better than previously projected) on account of improved revenue collection and tight expenditure control (Table 3). The current account deficit is expected to narrow to 6.5 percent of GDP on account of continued fiscal consolidation.
18. The outlook for 2015 has improved. An anticipated good agriculture harvest andcontinued robust gold production are expected to strengthen economic growth to about 3½ percent. Continued tight monetary policy should help reduce inflation to 21 percent. The overall
5 In the second quarter of 2014, a series of exogenous events—the uncertainty associated with the conflict in South Sudan, the breakdown of correspondent banking relations with international banks, and floods that reduced food supply—and the injection of excess liquidity by the central bank through unsterilized gold purchases depreciated the parallel exchange rate and increased inflation. 6Sudan has two official exchange rates. First, there is the “indicative” rate set by the central bank. Second, there is an “official” rate set by the central bank within ± 4 percent of the indicative exchange rate and applied to government transactions. The difference between the “official” and the “indicative” rates is now less than 2 percent. Commercial banks and foreign exchange bureaus are required to set their rates ± 4 percent of the indicative exchange rate. In practice, commercial banks trade at the upper part of that band.
0
30
60
90
120
150
0
2
4
6
8
10
Jan-10 Aug-10 Mar-11 Oct-11 May-12 Dec-12 Jul-13 Feb-14 Sep-14
Gap btw. CBOS and parallel rate (in %, RHS) CBOS Buying RateCommercial Banks Buying Rate Parallel rate
Text Figure 4. Exchange Rates, 2010-14
SUDAN
10 INTERNATIONAL MONETARY FUND
fiscal deficit is projected to remain broadly unchanged relative to 2014, thus limiting government recourse to central bank financing. This, together with greater exchange rate flexibility, should help contain the current account deficit to about 6 percent.
19. Implementation of the authorities’ adjustment program should help restoremacroeconomic stability and improve growth prospects over the medium term. Driven by agriculture, minerals, and oil, growth is expected to accelerate gradually to about 4.7 percent in 2019. With prudent macroeconomic policies, inflation is expected to fall to single digits by 2017. The external current account deficit is expected to gradually narrow toward sustainable levels (Table 1). However, the external debt overhang and the large arrears, along with U.S. sanctions, will continue to hinder access to external financing and weigh on growth prospects.
20. Risks are largely tilted to the downside. Downside risks include the fragile domesticsecurity and political situation, regional tensions, and global risks (see Risk Assessment Matrix). Public discontent with the costs of the economic reforms in the wake of the 2015 presidential elections and a setback to the national dialogue could complicate the domestic political situation and weaken the reform effort. The breakdown of correspondent bank relations, if sustained, could weigh on trade, investment, and growth prospects. On the upside, a lasting peace agreement in South Sudan would help the recovery of oil production there and result in higher transit revenues for Sudan.
21. In the event of a crisis in Sudan, spillovers would be mainly in the surrounding region.Sudan’s integration with the region and the global economy has been stunted by sanctions and its unsustainable debt position. Spillovers from a possible deterioration of economic conditions in Sudan would mostly affect the immediate neighbors, especially South Sudan, which relies heavily on oil pipelines and food supply routes in Sudan.

SUDAN
INTERNATIONAL MONETARY FUND 11
Sudan: Risk Assessment Matrix * Potential Deviations from Baseline
Source of Risks Relative
Likelihood Impact if Realized Policy Responses Global
1. Protracted period of slower growth inadvanced and emerging economies
High
Medium Greater exchange rate flexibility would helpmaintain external stability and prevent reserve losses. Declining revenue and lack of fiscal space would likely require pro-cyclical spending cuts. Weakening commodity prices and the widening output gap would facilitate faster disinflation.
Deteriorating external balance. Rising pressure on theexchange rate and reserves. Lower growth.
2. Heightened risk of fragmentation/statefailure in the Middle East, leading to a sharp rise in oil prices, with negative spillovers to the global economy.
Medium
Medium Greater exchange rate flexibility will help reduceexternal pressures. Strengthen social safety nets. Meet fiscal imbalances with spending rationalization.
Lower growth.
Rising unemployment andinflation.
Widening fiscal imbalances.
3. Sustained decline in energy prices,triggered by deceleration of global demand and coming-on-stream of excess capacity (medium-term)
Medium
Medium Greater exchange rate flexibility will help reduceexternal pressures. Improve competitiveness and social safety nets. Strengthen non-resource revenue mobilization.
Lower export receipts but alsolower import bill. Rising imbalances. Resource sectors’ growth slows.
Rising unemployment.
Regional
4. Oil production in South Sudan declinesowing to civil conflicts
High
High Greater exchange rate flexibility will helpreduce external pressures. Tight monetary policy will control inflation. Meet fiscal imbalances with spending rationalization and revenue effort.
Rising imbalances and inflation.
Growing parallel foreignexchange market. Loss of reform momentum.
5. Heightened tensions between Sudan andSouth Sudan
Low to Medium
Low to Medium Fiscal slippages will need to be addressedthrough higher revenue or spending cuts in nonpriority areas. Monetary tightening to keep inflation in check.
Rising military spending. Higher budget deficit. Higher risk of monetization ofthe budget deficit. Rising inflation.
Domestic
6. Heightened social tensions and fiscalslippages owing to 2015 Presidential elections
Medium to High
Medium to High Fiscal slippages linked to election spendingshould be offset by equivalent cuts in nonpriority spending. Tight monetary policy will control inflation. Strengthen social safety nets.
Rising imbalances and inflation. Growing parallel foreignexchange market.
7. Sustained breakdown in correspondentbank relations
High
High
Outreach efforts to remove sanctions. Drop in exports and imports.
Lower supply and higher cost ofimports fuelling inflation. Foreign exchange shortage.
* The Risk Assessment Matrix (RAM) shows events that could materially alter the baseline path (the scenario most likely to
materialize in the view of IMF staff). The relative likelihood of risks listed is the staff’s subjective assessment of the risks surrounding
the baseline (“low” is meant to indicate a probability below 10 percent, “medium” a probability between 10 and 30 percent, and
“high” a probability between 30 and 50 percent). The RAM reflects staff views on the source of risks and overall level of concern as
of the time of discussions with the authorities. Non-mutually exclusive risks may interact and materialize jointly.

SUDAN
12 INTERNATIONAL MONETARY FUND
POLICY DISCUSSIONS
A. Overview
22. Recent efforts to stabilize the economy, following the large economic imbalances thatemerged after South Sudan seceded, are bearing fruit and need to continue despite the difficult circumstances Sudan faces. The ongoing fiscal consolidation should be accompanied by monetary policy tightening to help rein in inflation and stem depreciation pressures. Adjustment of the official exchange rate to align it with market conditions should go a long way toward reducing external imbalances and enhancing the economy’s resilience to real shocks. Structural reforms are needed to help boost investment and growth over the medium term in the non-oil sectors, create jobs, and reduce poverty.
23. Mitigating the impact of the macroeconomic adjustment on the poor should remain apriority. Sudan’s very high inflation rates have had a disproportionate impact on vulnerable groups and the poor. Expanding social safety nets will go a long way to protect the poor and build broader support for policies and reforms.
24. In parallel, Sudan needs to continue efforts to secure progress toward debt relief byreaching out to its major creditors. Debt relief would unlock access to foreign financing, which would help support Sudan’s growth potential through infrastructure and social investment and FDI.
B. Restoring Macroeconomic Stability
25. Discussions focused on policies and reforms to restore macroeconomic stability andsupporting broad-based growth. In particular, the emphasis was on:
Fiscal consolidation—through revenue mobilization and retrenchment of current spending,including a gradual phase-out of fuel subsidies—should continue, accompanied byincreased public investment and social spending.
Tightening monetary policy and further lowering central bank financing of the governmentto help further lower inflation.
Greater flexibility of the official exchange rate to reduce the parallel market rate premium,improve the availability of foreign exchange, enhance competitiveness, and help buildreserves.
Strengthening bank supervision to enhance banking penetration and improve banks’competitiveness and resilience.
Improving the business climate to bolster private sector-led growth.

SUDAN
INTERNATIONAL MONETARY FUND 13
Pursuing Fiscal Consolidation
26. The authorities’ fiscal consolidation plan is advancing but continued efforts are needed to achieve the goal. The non-oil primary deficit (NOPD) is targeted to decline by 1.4 percentage points of GDP to 1.5 percent of GDP in 2014. This will help limit the overall fiscal deficit to 1 percent of GDP, down from 2.3 percent of GDP in 2013. As a result, central bank financing of the fiscal deficit is expected to drop to 0.4 percent of GDP in 2014, from 0.7 percent of GDP last year (Tables 4, 5, and 6). These objectives are supported by:
Enhanced revenue mobilization. Under their economic program, the authorities aim at raising total revenue to 10.9 percent of GDP in 2014 (against 9.2 percent of GDP the previous year) reflecting the full-year effect of the reform measures taken in September 2013, including substantial increases in domestic fuel prices; these are estimated to yield additional revenue of about 1.2 percent of GDP. The authorities also plan additional measures, although their impact will be felt in 2015 and beyond, to reduce tax exemptions, reform the taxation of gold-related activities, and improve tax administration. In this context, a tax and customs reform committee established in March began reviewing tax exemptions and the application of the VAT, and, more broadly, to improve tax policies and practices. Recommendations are expected to be reflected in the 2015 budget;
Streamlined expenditure. Current spending is projected to be limited to 11 percent of GDP, mainly by containing the wage bill and subsidy increases, while public investment and social spending are each expected to increase by 0.3 percentage points of GDP to mitigate the negative impact of ongoing subsidy reforms on the most vulnerable. Staff underscored the importance of continued streamlining of nonpriority spending and containing the wage bill to curb inflation.
27. Rationalizing fuel subsidies remains key to achieving medium-term fiscal sustainability, along with strengthening social safety nets (Box 2). In the first half of 2014, fuel subsidies amounted to 1 percent of GDP due to an unusually warm weather that led to increased fuel consumption, and are expected to reach close to 2 percent of GDP by end-year. In March 2014, Fund technical assistance recommended further steps to reduce fuel subsidies, including the adoption of a flexible fuel pricing mechanism, while improving social safety nets with better targeting of social assistance to the most vulnerable, and systematic monitoring and evaluation of the social safety net system.

SUDAN
14 INTERNATIONAL MONETARY FUND
Box 2. Fuel Subsidies Reform
Sudan can no longer afford to maintain large fuel subsidies. Before the secession of South Sudan, fiscal revenues from the oil sector financed direct and indirect subsidies to fuel prices. The secession resulted in the loss of about 60 percent of those revenues. Rising international oil prices has also put upward pressure on subsidies. Fuel subsidies in Sudan are costly, regressive, and inefficient. Direct subsidies amounted to about 2 percent of GDP in 2013, despite a 162 percent average-weighted increase in the prices of fuel since June 2012. (Box 2 Figure 1) The total fiscal cost is more than twice as high when tax exemptions and special tax rates for fuel products are included. The poorest quintile of the population received only 3 percent of the total subsidy in 2011 (Box 2 Figure 2). Subsidies provide an inefficient social protection and crowd out high-priority public expenditure. Also, relatively low fuel prices in Sudan could encourage smuggling of fuel to neighboring countries and promote overconsumption of energy (Box 2 Figure 3).
The authorities have used part of the fiscal space created by reduced subsidies to bolster social safety nets (SSNs). They reinforced the Social Initiative Program, including the Cash Transfer Program (CTP), health insurance for the poorest, microfinance, rural women’s empowerment program, and others (Box 2 Table). Considering the bottom three income quintiles in Sudan received only 26 percent of total fuel subsidies in 2011 or 0.3 percent of GDP, cash compensation for the income loss of poor population could be achieved at a cost of less than 1 percent of GDP a year.
Removing fuel subsidies is a part of a broad reform strategy. The authorities plan to gradually phase out fuel subsidies by 2019, including by adopting a flexible pricing mechanism. This should be accompanied by a communication campaign that highlights the cost and inequity of current subsidies. The authorities should also review the current SSN programs and develop, with assistance from the World Bank and other donors, a comprehensive medium- to long-term social protection strategy.

SUDAN
INTERNATIONAL MONETARY FUND 15
28. Looking ahead, continued fiscal consolidation is vital to securing macroeconomic stability and fiscal sustainability. Accordingly, staff recommended a zero primary fiscal balance in 2015, about the same level as in 2014, but rising to a primary fiscal surplus of about 1 percent of GDP by 2019 to put the ratio of the domestic public debt to GDP on a declining path (Table 7). This will require reducing the non-oil primary deficit by mobilizing more revenue while ensuring the fairness of the tax system and shifting government expenditure towards social and investment spending.
29. Strengthening public financial management is necessary to strengthen budget planning, execution, and monitoring. Reforms will need to be centered on the development of a medium-term fiscal framework (MTFF) to enhance macroeconomic management and facilitate the implementation of poverty reduction policies. Other key reforms include implementing the Treasury Single Account and effective budgetary controls, linked to a credible cash plan, to prevent arrears, and improving the public accounting system. These should be supplemented by improving within-year budget reporting and transparency, including by publishing quarterly revenue and spending data.
30. The authorities would benefit from continued Fund technical assistance. This will help the authorities improve gold taxation, streamline tax incentives, and enhance the efficiency of the tax system over the medium term. Technical assistance will also continue bolstering public financial management, including by helping complete the banking infrastructure that will support the transfer of funds to the Treasury Single Account and prepare an MTFF.
Authorities’ Views
31. The authorities agreed that fiscal consolidation is critical for restoring macroeconomic stability. They reiterated their commitment to their fiscal program for 2014 and to continued fiscal consolidation over the medium term. The authorities expect that the ongoing tax and customs reforms will help mobilize additional revenue, and confirmed their intention to phase out fuel subsidies over the next five years. At the same time, the authorities committed to strengthening social safety nets to protect the most vulnerable segments of the population to avoid the recurrence of the social discontent and violence that followed the September 2013 fuel price increase. They will continue to enhance their PFM reforms, including the MTFF. The authorities welcomed continued Fund technical assistance. Looking ahead, the authorities agreed in principle to continued fiscal consolidation in 2015, as recommended by staff, but they were not yet ready to discuss a full-fledged budget and supporting measures with the staff. Such a discussion will take place during the forthcoming mission for the third review under the SMP.
Improving Monetary Policy Credibility
32. Monetary policy should be geared to reducing inflation. Despite improvement in the government’s fiscal position, unsterilized gold purchases by the central bank led to faster reserve money growth than targeted by mid-2014. To help reduce inflation, the central bank should mop up the large excess reserves, reduce unsterilized gold purchases, and refrain from using the parallel

SUDAN
16 INTERNATIONAL MONETARY FUND
exchange rate for these purchases. Staff encouraged the central bank to continue using reserve money as nominal anchor—instead of the official exchange rate—given that most private sector foreign exchange transactions are conducted at the parallel market rate.
33. Bringing inflation under control will require greater de facto central bank independence. The monetary policy framework has been hampered by fiscal dominance since the secession of South Sudan. The fiscal consolidation path initiated this year has led to an improvement in fiscal performance and a corresponding reduction in central bank financing, which has reduced reserve money growth. In order to enhance monetary policy credibility, staff encouraged the authorities to enhance the operational independence of the central bank and to mandate it to maintain price stability. In this regard, the central bank should continue to gradually reduce its monetization of the budget deficit, and cease quasi-fiscal operations, such as the provision of foreign exchange at the official rate to the government for fuel and wheat imports.7 Staff also encouraged the central bank to develop a communication strategy to improve transparency and help anchor inflation expectations.
34. The institutional framework of monetary policy management should be strengthened. Enhanced coordination between the central bank and the ministry of finance would improve liquidity forecasts and management. The recently established interbank money market, once fully operational, will improve the effectiveness of monetary policy and banks’ liquidity management and may help dampen inflationary pressures in the future;8 nevertheless, its success will first hinge on the central bank ability to reduce excess reserves in the system. To address excess liquidity, a 20 percent cap on banks’ holdings of government and central bank securities should be relaxed.
Authorities’ views
35. The authorities agreed that tightening monetary policy should help reduce inflation. They are committed to limiting central bank financing of the budget to the level agreed under the program, reducing unsterilized gold purchases by the central bank to contain reserve money growth, and continue using reserve money as the nominal anchor. The authorities are considering relaxing the cap on banks’ holdings of government and central bank securities, but are concerned that such a measure may crowd out private sector credit. They noted that the provision of foreign exchange at the official rate for fuel and wheat imports was temporary and is aimed at avoiding social discontent. They requested Fund technical assistance on improving foreign exchange management.
7 The cost of quasi-fiscal activities, including the purchase of gold at the parallel market exchange rate and the sale of foreign exchange at the official market rate to finance fuel and wheat imports, amounted to 0.7 percent of GDP during the first half of 2014. 8 To promote interbank activities and reduce banks’ excess reserves, the authorities recently established a “liquidity management fund” to encourage interbank activities. Banks are required to contribute a total of SDG 750 million in proportion to the size of their deposits, of which 60 percent is in the form of government securities and the remainder in cash. Banks can borrow overnight from this fund with a 0.1 percent fee, to cover liquidity shortages.

SUDAN
INTERNATIONAL MONETARY FUND 17
Enhancing Exchange Rate Flexibility
36. Sudan faces large and unsustainable external imbalances. Staff’s external stabilityassessment points to significant overvaluation of the currency and problems with external competitiveness (Annex 1). This conclusion is also supported by the wide gap between the official and parallel market exchange rates, which was 65 percent in the third quarter of 2014, before narrowing to 47 percent in mid-November. Despite two step devaluations in 2012 and 2013, high inflation has fully eroded the initial real depreciation of the exchange rate.
37. Greater exchange rate flexibility is essential to reducing external imbalances,enhancing competitiveness, and building up international reserves. Given the shortage of foreign exchange on the official market, the parallel market has nearly completely replaced the official market as a source of foreign exchange for private transactions. Staff urged the authorities to rapidly adjust the official exchange rate in order to reduce the overvaluation of the currency. Closing the gap would remove an implicit tax on exports, rationalize imports, and reduce quasi-fiscal costs. Staff stressed that with continued fiscal consolidation and tight monetary policy stance, and given that most of the economy already operates at the parallel market rate, devaluation of the official rate is unlikely to result in higher inflation.
Authorities’ views
38. The authorities reiterated their commitment to gradually close the gap between theofficial and parallel market rates, but are reluctant to provide a specific timeframe. They expressed readiness to make gradual monthly adjustments to the official exchange rate. This, together with an expected appreciation of the parallel exchange rate driven by robust agriculture exports and increased foreign exchange receipts from oil transit fees later in the year, would help close the gap and reduce quasi-fiscal losses. In their view, the official rate is a strong determinant of the parallel market rate, and they fear that any rapid change in the former would only impact the latter without closing the gap, as had happened in the past two years.
Financial sector policies
39. The financial system in Sudan is dominated by the banking sector and operates underIslamic principles. At end-2013, there were 37 banks, including two established during the year, which accounted for 90 percent of the financial sector assets. Monetization and financial intermediation are low, with broad money at only 21 percent of GDP and credit to the private sector at a low 10.4 percent of GDP at end-2013. Inter-bank transactions are limited, although there is an informal inter-bank market, Qard Al Hassan, whereby banks lend to each other without charging any fees.

SUDAN
18 INTERNATIONAL MONETARY FUND
40. Banking sector soundness indicators remain positive. The capital adequacy ratio exceeded the required 12 percent at end-2013 (Table 8). Although there were modest declines recently in the ratios of liquid assets to total assets and liquid assets to short-term liabilities, banks’ liquidity remains comfortable. The ratio of NPL declined from 7.6 percent at end-2011 to 4.0 percent in September 2014.
41. The CBOS has taken several measures to improve the performance of the banking sector. It started implementing best practices in banking supervision, which included the CBOS divesting from some public banks, and improving and upgrading the regulatory and institutional framework. The authorities have also taken a number of actions to broaden access to banking services, which included simplifying the procedures for opening bank accounts, encouraging banks to open new branches and setting up a credit registry system. As a result, since end-2013, 32 new bank branches were opened, and 37 new ATMs and about 200 cash points located in supermarkets were installed. In addition, the CBOS is preparing to introduce mobile banking.
42. The authorities are continuing to upgrade the AML-CFT framework. Following the passage of the amended AML-CFT law in June, the CBOS established, with IMF technical assistance, an upgraded AML/CFT circular to enhance preventive measures requirements for the financial institutions under its supervision. A robust supervisory framework would enhance the effectiveness of the AML/CFT regime and further actions are required to exit the Financial Action Task Force’s monitoring process.
43. Stronger bank supervision and privatization are needed to improve banks’ competitiveness and resilience. Key recommendations include: (i) continuing the implementing of best practices in bank supervision, inspection, and enforcement; (ii) the CBOS to divest its remaining interests in commercial banks; and (iii) the completion of the restructuring plan for Omdurman bank is also important.
Authorities’ views
44. The authorities generally agreed with staff’s assessment of the financial sector. They acknowledged that further efforts are needed to bring bank supervision in line with best practices. They welcomed technical assistance from the Fund to this end. The authorities also pointed to
0
20
40
60
80
100
120
140
Text Figure 5. Broad Money, end-2013(In Percent of GDP)
0
10
20
30
40
50
60
70
80
Text Figure 6. Domestic Credit to Private Sector, end-2013(In Percent of GDP)

SUDAN
INTERNATIONAL MONETARY FUND 19
progress on the banking sector review, which is being finalized. They intend to gradually privatize their share-capital in banks and have requested Fund assistance in this effort.
C. Policies to Support Inclusive Growth and Reduce Unemployment
45. Improving the business climate is essential for achieving high and sustained growth. Sudan’s business climate, as measured by the 2014 World Bank Doing Business survey, is ranked 149 among 189 countries—in the lowest quartile of all surveyed countries as in previous years.9 Key weaknesses include difficulties in obtaining licenses, accessing credit, and trading across borders.10 Addressing these weaknesses, fighting corruption including by mobilizing AML measures, and strengthening the judiciary would help improve the business climate.
46. Increased investment in human and physical capital is needed to help boost growth and make it broad-based. Sudan lags in the areas of human development and public sector capacity, as evidenced by the UNDP’s 2012 Human Development Index (Sudan ranked 171 out of 186 countries) and the World Bank’s 2012 Country and Policy Institutional Assessment (Sudan is classified as a weak performer). Addressing these weaknesses requires improving the prioritization of public expenditure with increased allocations to the education and health sectors. Improving infrastructure—electricity, roads, and railways—and strengthening regional connectivity are also critical for improving productivity and access to markets, and for lowering transportation costs.
47. Unemployment is a persistent problem, especially for women and the youths. In 2012, the unemployment rate was estimated by the World Bank at 14.8 percent of the labor force (20 percent for women and 24 percent for the youth), with little change since 1991. Labor participation was estimated at about 54 percent (76 percent for men and 32 percent for women). To reduce unemployment, investment in skill-formation activities for the unemployed is important. Providing equal opportunities to women in these activities could significantly boost labor participation and economic growth. Reforms in the agriculture sector, which supports nearly 70 percent of the population, will also help in employment generation (Annex 2).
Protecting the Most Vulnerable
48. Improving the efficiency of the social safety net is critical to protecting the most vulnerable. Sudan’s social indicators compare unfavorably with regional comparators. Phasing out fuel subsidies should be accompanied by measures that shield the poorest and help middle-income groups to adjust11. The authorities intend to increase the number of beneficiaries of the cash transfer
9 These indicators should be interpreted with caution because of the limited number of respondents, limited geographical coverage, and standardized assumption on business constraints and information availability. 10 U.S. sanctions against Sudan also generate additional costs and difficulties for international trade and foreign direct investment. 11 The WB is currently providing technical assistance to Sudan to improve the targeting, payments and monitoring mechanisms of the social safety net.

SUDAN
20 INTERNATIONAL MONETARY FUND
program to 500,000 families in 2014 (410,000 as of September 2014),12 complemented by private programs such as the Zakat Fund,13 which benefits 4.5 million households.
49. Work is underway to prepare a full Poverty Reduction Strategy Paper (PRSP) withdonor support. The project structure is in place and a household budget survey will be completed by March 2015 to serve as a base on which to develop the poverty reduction strategy. The authorities will use a broad and inclusive consultation process to prepare the PRSP. In the meantime, the authorities are implementing policies identified in the I-PRSP.
Authorities’ views
50. The authorities agreed with staff on the importance of advancing pro-poor policies.They are committed to providing assistance for the neediest as evidenced by the implementation of the I-PRSP, their social commitments under the SMP, and the policy initiatives aimed at shielding the poor and vulnerable from the costs of the reforms. Nevertheless, the authorities noted that their efforts are constrained by the limited resources and expressed hope that fast-track progress on debt relief would unlock concessional resources that would boost pro-poor programs.
D. External debt
Debt sustainability analysis
51. Sudan continues to be in debt distress. Both public and external debt ratios remain athigh levels (91 percent and 79 percent of GDP, respectively), and most of the external debt is in arrears. In line with the results of past Debt Sustainability Analyses (DSAs), Sudan’s debt is unsustainable. All external debt indicators breach their indicative thresholds under the baseline scenario, and many of those remain above the thresholds throughout the 20-year projection period. It is therefore critical for Sudan to follow sound economic policies, continue garnering support for debt relief, avoid selective debt servicing, and minimize non-concessional borrowing. As of end-June 2014, nonconcessional external borrowing for development projects was limited to US$147 million, with an average grant element of 26 percent.14 There was no additional nonconcessional external borrowing between June and September 2013. Staff noted that any new borrowing would eventually need to be treated as part of any comprehensive debt relief workout to restore external debt sustainability.
12 The total budgeted amount for social spending in 2014 more than doubled compared to 2013 to SDG 2 billion (or 0.4 percent of GDP). 13 Zakat is the practice of taxation, prescribed by Islam, imposed upon Muslims based on accumulated wealth and distributed to poor Muslims; the Zakat Fund is not part of the government budget. 14 These loans were provided by bilateral official creditors and Arab multilateral development institutions.

SUDAN
INTERNATIONAL MONETARY FUND 21
Prospects for debt relief
52. Debt relief prospects are predicated on normalizing relations with internationalfinancial institutions, and establishing a track record of cooperation with the IMF on policies and payments. While Sudan has met some of those requirements (Box 3), further efforts are needed to reach the Decision Point under the enhanced Heavily Indebted Poor Countries initiative. At this stage, it is not possible to assign a firm timeline for the fulfillment of all the remaining steps, which mainly depend on the result of the bilateral outreach to creditors. Staff advised the authorities to continue to: (i) reach out to all their external creditors, jointly with South Sudan, to secure their participation and support for the debt relief process; and (ii) continue to strengthen cooperation with the Fund on policies and payments, including through the ongoing SMP. Staff welcomed the recent decision by Sudan and South Sudan to extend the “zero option” to October 2016.
Box 3. Path to Normalization of Relations and Debt Relief
Sudan is eligible for debt relief under the HIPC initiative, but has not yet met all the qualifications. The normalization
of relations with external creditors, including the Fund, other multilateral institutions, and bilateral creditors, is a key
pillar of the requirements for debt relief, requiring efforts in specific areas for each class of creditor. As of now, Sudan
meets the following conditions for the HIPC initiative:
Faces an unsustainable debt burden that cannot be addressed through traditional debt relief mechanisms;
Has developed an Interim Poverty Reduction Strategy (I-PRSP) document. Sudan’s I-PRSP was assessed by the
staffs of the Fund and the World Bank and was discussed by both Boards in September 2013, and
In 2012 Sudan reconciled its external debt as of end-2010 in order to determine its HIPC eligibility. The
reconciliation expires at end-2014. A new debt reconciliation exercise will have to be conducted when Sudan
nears the Decision Point.
To reach the Decision Point, Sudan would still need to undertake the following:
Obtain assurances of support for HIPC debt relief from a large majority of creditors representing at least
70 percent of HIPC-eligible debt;
Whereas Sudan has already done 14 SMPs with the Fund, it would still need to establish with the IMF a track
record of strong policy performance for at least six months in the period leading up to the Decision Point,
which could take the form of an SMP judged by the Executive Board to meet the policy standards associated
with upper-credit tranche arrangements; and
Clear its arrears with the Fund, and have a fully financed plan and a timetable to clear arrears with the World
Bank and the African Development Bank in order to restore its eligibility to borrow from these sources.
The resources required for the IMF's participation in the HIPC Initiative have not yet been identified. As the costs
to the Fund for providing debt relief to Sudan were not included in the original costing estimates for the HIPC
initiative, additional financing will need to be secured when Sudan is ready to clear its arrears and embark on the
HIPC initiative.

SUDAN
22 INTERNATIONAL MONETARY FUND
53. Sudan’s arrears to the Fund totaled SDR 977.7 million at end-October 2014. Sudanmade payments totaling about US$7.5million (SDR 4.9 million) thus far this year as agreed under the SMP. They intend to make the remaining quarterly payment to reach a total of at least $10 million in 2014. Staff encourages the authorities to make payments to the Fund that are at least sufficient to cover obligations falling due, make payments regularly, and to significantly increase them as Sudan’s payment capacity improves.
Authorities’ views
54. The authorities agreed with staff’s assessment and advice. They agreed with the resultsof the DSA. They expressed dissatisfaction with the slow pace of the debt relief process, but remained hopeful that the international community will support Sudan for a fast-track debt relief. They underscored that the extension of the “zero option” was a goodwill gesture, and that in the meantime they would step up their outreach efforts to creditors, including through the joint approach. They agreed to minimize non-concessional borrowing as agreed under the SMP and indicated that they will borrow on the best terms possible to invest in priority agriculture, energy, and infrastructure projects.
E. Statistical Issues
55. Data are broadly adequate for surveillance and program monitoring, although thetimeliness, coverage, and periodicity of data reporting could be improved. Further improvements require strengthening interinstitutional and interdepartmental cooperation on data collection and reporting, and enhancing the capacity of the units responsible for compiling statistics.
SECOND REVIEW UNDER THE SMP 56. Performance in the second quarter of 2014 was broadly satisfactory: all Junequantitative targets under the SMP were met, except for the indicative target on reserve money (LOI, Attachment I, Table 1). Central bank NDA was contained and NIR was on target. Tax revenue, the non-oil primary deficit, and social spending over-performed, and, as a result, domestic and central bank financing of the central government were well below targets. However, reserve money growth at 8 percent in the year-to-June exceeded the 6.2 percent target, owing to unsterilized gold purchases by the central bank. The authorities have also adjusted the official rate by 3 percent starting in September to narrow the gap between the official, and the parallel market exchange rates. They intend to gradually continue this adjustment process.
57. End-December targets were adjusted. The quantitative benchmarks and targets, exceptfor the domestic financing of the central government and net international reserves have been revised taking into account improved revenue collection and contained spending. The end-December ceiling on net domestic financing of the central government and the floor on net international reserves have been revised taking into account projected lower external financing. The

SUDAN
INTERNATIONAL MONETARY FUND 23
completion of the structural benchmark on the restructuring of Omdurman Bank is now envisaged in December, instead of November.
58. Efforts to keep the structural reform agenda on track are continuing, with delays insome areas but early achievements in others (LOI, Attachment I, Table 2). Early achievements include the extension of the GFSM 2001 classification to all states and issuance, in January, of a directive to close all central government accounts in commercial banks. The tax audit manual has been distributed to the relevant departments and training started at end September, and the establishment of appropriate IT systems is also under way. Further, an amended AML/CFT law was enacted. However, there were some delays. The committee, set up in March to review tax exemptions and enhance collections, finalized its report in October instead of June, and work is still ongoing to strengthen the penalty procedures for noncompliant taxpayers. Similarly, the restructuring plan for Omdurman Bank is still under preparation and should be finalized before year-end.
59. The authorities agreed that the current SMP, which ends in December 2014, hasprovided them with a framework to address their economic challenges. However, they have yet to decide on proceeding with a new SMP for 2015, and plan to discuss the way forward with the staff during the third review of the SMP.
ARTICLE VIII ISSUES 60. Sudan’s exchange rate regime and the measures taken to restrict access to foreignexchange have been determined to give rise to exchange restrictions and multiple currency practices (MCPs), which are subject to Fund jurisdiction under Article VIII (Box 4). These measures include an exchange rate regime with multiple effective rates and a policy of rationing foreign exchange and allocating it to certain sectors, such that foreign exchange is limited for other current international transactions. The authorities have unified official exchange rates to within a ±4 percent band of the central bank indicative rate. However, a number of exchange restrictions and MCPs remain in effect (see Informational Annex). Staff urged, in line with previous recommendations, the authorities to eliminate the remaining restrictions and MCPs, noting that such measures are not helping Sudan’s economy to reduce external imbalances, attract foreign investment, improve resource allocation, and enhance external competitiveness.

SUDAN
24 INTERNATIONAL MONETARY FUND
Box 4. Exchange Rate System
Sudan maintains the following exchange restrictions and multiple currency practices that are subject to Fund jurisdiction under Article VIII, Sections 2 and 3: An exchange restriction arising from the government's limitations on the availability of
foreign exchange and the allocation of foreign exchange to certain priority items;
A multiple currency practice and exchange restriction arising from the establishment of an official exchange rate (the CBOS rate) for use in all government exchange transactions which in practice differs by more than 2 percent from the rate used by commercial banks;
A multiple currency practice and exchange restriction arising from large spreads between the CBOS rate and the parallel market exchange rate due to the CBOS’ limitation on the availability of foreign exchange which channels current international transactions to the parallel market; and
An exchange restriction and a multiple currency practice arising from the imposition by the government of a cash margin requirement for most imports
The Authorities’ Views
61. The authorities indicated that they were unable to remove all exchange restrictions and MCPs because of continued pressures on the balance of payments. Shortage of foreign exchange persists despite projected increased foreign exchange receipts from agricultural exports and oil transit fees later in the year. Given current constraints on the CBOS’s ability to meet all the demand for foreign exchange, the authorities had to maintain temporary restrictions and engage in MCPs for strategic priority needs such as imports of food and fuel. The CBOS remains committed to gradually removing the remaining exchange restrictions and MCPs. It will begin to remove the exchange rate restrictions and multiple currency practices by November 2015 and will remove all restrictions within three years.
STAFF APPRAISAL 62. Sudan’s economy has yet to recover from the shock of South Sudan’s secession three years ago. Despite progress in implementing policies to address the resulting imbalances, inflation remains high and growth sluggish. Macroeconomic adjustment has been complicated by structural weaknesses, a heavy debt burden, U.S. sanctions, and volatile domestic and regional political environments, which affect confidence and investment.

SUDAN
INTERNATIONAL MONETARY FUND 25
63. The authorities embarked last year on an adjustment program to restore macroeconomic stability and lay the foundations for sustained and inclusive growth. The adjustment to the new economic situation is proceeding through fiscal consolidation, monetary tightening, and structural reforms. The authorities have implemented difficult corrective measures, the latest of which in September 2013 entailed a sharp reduction in fuel subsidies, a unification of all official exchange rates, and exchange rate devaluation; these unfortunately led to civil unrest and the loss of life. Adjustment efforts continued in 2014 under the SMP.
64. Economic performance has gradually improved this year but growth has remained subdued and inflation still high at about 40 percent—a sign of continued imbalances. Growth is expected to rebound on account of a good harvest, but the outlook remains uncertain amidst high vulnerabilities, and is weighed by the breakdown of correspondent banking relations, U.S. sanctions, and a fragile domestic and regional political environment. Risks are largely tilted to the downside, though prospects of a successful national dialogue could ultimately lead to resolution of domestic conflicts and improved international relations.
65. Fiscal consolidation should continue while bolstering social safety nets and improving the quality of spending. The favorable fiscal performance in the first half of 2014 is positive and the authorities should continue with disciplined execution of their fiscal program. Enhanced revenue collection efforts and gradual reduction of fuel subsidies should ensure reduction in fiscal imbalances, create space for development and social spending, and reduce government recourse to central bank financing.
66. Monetary policy should continue focusing on reducing the very high inflation. This will require limiting unsterilized gold purchases by the central bank to contain reserve money growth. Promoting a market for government securities and making fully operational the recently established interbank money market to address chronic excess liquidity are important for improving monetary policy management.
67. Exchange rate flexibility is key to rebuilding reserves and external competitiveness. The wide gap between the official and parallel market exchange rates suggests persistent external imbalances, and the authorities’ commitment to gradually close this gap is welcome. Resorting to foreign exchange restrictions does not address the underlying external imbalances, and the recent removal of some of these measures is a step in the right direction. The authorities’ commitment to eliminate the remaining foreign exchange restrictions and the multiple currency practices is appropriate. In the interim, Staff supports the authorities’ request for the approval of remaining exchange restrictions and multiple currency practices given that these measures are adopted for balance of payments reasons, and are temporary and non-discriminatory.
68. More efforts are needed to enhance financial stability. Stronger banking supervision and privatization are needed to improve competitiveness and resilience of banks. The current restriction on commercial banks’ holdings of government and central bank securities should be relaxed. Further strengthening and implementation of the AML/CFT framework would contribute to improving financial stability and integration into the global financial system.

SUDAN
26 INTERNATIONAL MONETARY FUND
69. Structural policies should focus on fostering sustained and inclusive growth. Reformsto improve the business environment will promote private sector led growth. Improving the quality of spending to support human capital formation and better targeting of social safety nets will be critical for expanding opportunities and protecting the most vulnerable groups from the effects of fuel subsidy reforms. In this context, the launch of the PRSP process is welcome and will offer an instrument to implement coherent macroeconomic and structural reforms to lift growth prospects and reduce poverty.
70. Performance under the SMP is broadly satisfactory. All of the end-June quantitativetargets, with the exception of the indicative target on reserve money growth, were met. The authorities have also made good progress toward meeting their end-September structural benchmarks. The SMP continues to provide a useful framework for the authorities’ policy and reform efforts. The authorities have made determined efforts to implement their program, which nevertheless is subject to significant downside risks, including the fragile domestic security and political situation and regional tensions.
71. Gaining the support of the international community is critical for the success ofSudan’s reform strategy and minimizing risks. Resolving Sudan’s unsustainable external debt is of paramount importance. While Sudan has made some progress towards meeting the requirements for debt relief, the successful implementation of the SMP and intensification of outreach to bilateral creditors will help the case for a comprehensive debt relief. In this regard, staff urges the authorities to reach out to their external creditors, including under the framework of the Joint Approach with South Sudan and the African Union High-level Implementation Panel. Staff welcomes the recent agreement between the governments of Sudan and South Sudan to extend the “zero option” to October 2016. It encourages the authorities to minimize nonconcessional borrowing and avoid selective debt servicing, as these may complicate reaching agreement with creditors on a debt resolution strategy. Sudan should continue efforts to strengthen its cooperation with the Fund on policies and payments, including in the context of the SMP. Staff encourages the authorities to make payments to the Fund that are at least sufficient to cover obligations falling due, make payments regularly, and to significantly increase them as Sudan’s payment capacity improves.
72. It is proposed that the next Article IV consultation take place on the standard 12-month cycle.

SUDAN
INTERNATIONAL MONETARY FUND 27
Figure 1. Selected Economic Indicators
-9
-4
1
6
11
16
2007 2008 2009 2010 2011 2012 2013 2014
Real
gro
wth
( in
per
cent
)
ManufacturingAgricultureServicesOilOthersOverall Real GDP Proj.
0
10
20
30
40
50
60
Jan-10 Oct-10 Jul-11 May-12 Feb-13 Nov-13 Sep-14
CP
I in
flat
ion
(in
per
cen
t)
Non-food
Food
Overall
-7
0
7
14
21
28
35
42
2007 2008 2009 2010 2011 2012 2013 2014
In p
erce
nt o
f GD
P
Non-oil non-tax revenueOil revenueTax revenueTotal expenditureFiscal balance (Cash basis) Proj.
-20
0
20
40
60
80
Nov-07 Dec-08 Jan-10 Mar-11 May-12 Jun-13 Aug-14
(12-
mon
th g
row
th, p
erce
nt)
Broad money
Reserve money
Non-government credits
Inflation has started to ease.Real GDP is expected to grow moderately, held back by slow recovery in oil GDP.
Total revenue is recovering gradually and fiscal balance is improving. Broad money and reserve money growth have
moderated.
The real effective exchange rate appreciated significantly.
Gross international reserves rose, supported by loans and grants.
Sources: Sudanese authorities; and IMF staff estimates and projections.
0
500
1,000
1,500
2,000
2,500
3,000
Jun-08 Jun-09 Jun-10 Jul-11 Jul-12 Jul-13 Aug-14
Gross international reserves (in millions of U.S. dollars)
Sudan FOB oil price (RHS, in U.S. dollars)
40
80
120
160
200
240
280
Jan-08 Feb-09 Mar-10 Apr-11 Jun-12 Jul-13 Aug-14
REER NEER

SUDAN
28 INTERNATIONAL MONETARY FUND
Figure 2. Selected Political and Social Indicators

SUDAN
INTERNATIONAL MONETARY FUND 29
Figure 3. Selected Economic and Financial Indicators
Credit to the Economy, May 2005–July 2014(y-o-y growth, in percent)
Trade and Investment Rating(Scores out of 100, with 100 representing the best score available)
Ease of Doing Business Ranking(Out of 185 countries)
Business and Operation Risk Rating Outlook for Q12013
(Scores out of 100, with 100 representing the best score available)
Government Debt, 2013(In percent of GDP)
Government External Debt, 2000–13(In billions of US dollars)
Sources: Worldwide Governance Indicators; Business Monitor International; IFC Doing Business Rankings; Sudanese authorities; and IMF staff estimates.
0
20
40
60
80
100
Sudan Egypt Kenya Uganda Chad Ethiopia Congo0
10
20
30
40
50
2000 2001 2002 2003 2004 2005 2006 2007 2008 2009 2010 2011 2012 2013
Arrears
Total external debt (excl. arrears)
0
5
10
15
20
25
30
35
40
45
50
Sudan Chad DR Congo Mauritania Ethiopia Kenya Uganda
InfrastructureInstitutionsMarket orientationBusiness environment
0
40
80
120
160
200
Uganda Kenya Ethiopia Sudan Mauritania DR Congo Chad
2014 2013
0
20
40
60
80
100
Chad DR Congo Sudan Uganda Mauritania Kenya Ethiopia
Openness to investment
Openness to trade
-60
-40
-20
0
20
40
60
80
100
120
Credit to the private sector
Credit to the government
SUDAN
30 INTERNATIONAL MONETARY FUND
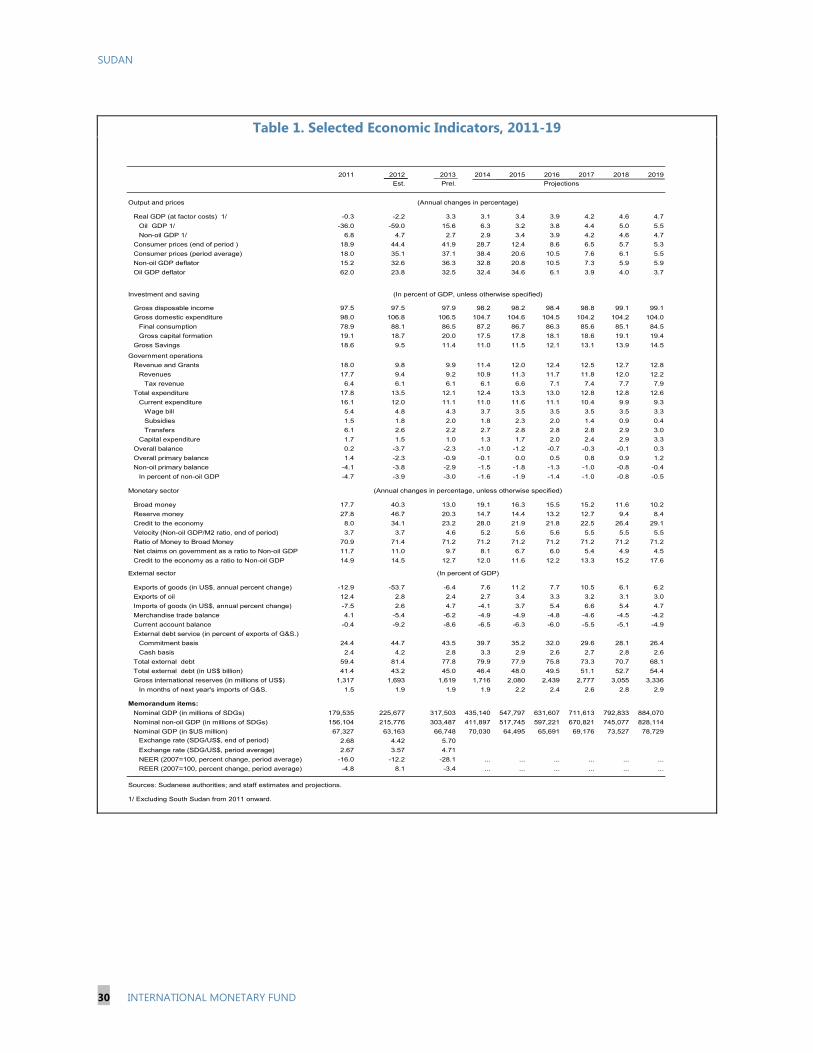
Table 1. Selected Economic Indicators, 2011-19
2011 2012 2013 2014 2015 2016 2017 2018 2019
Est. Prel.
Output and prices
Real GDP (at factor costs) 1/ -0.3 -2.2 3.3 3.1 3.4 3.9 4.2 4.6 4.7
Oil GDP 1/ -36.0 -59.0 15.6 6.3 3.2 3.8 4.4 5.0 5.5
Non-oil GDP 1/ 6.8 4.7 2.7 2.9 3.4 3.9 4.2 4.6 4.7
Consumer prices (end of period ) 18.9 44.4 41.9 28.7 12.4 8.6 6.5 5.7 5.3
Consumer prices (period average) 18.0 35.1 37.1 38.4 20.6 10.5 7.6 6.1 5.5
Non-oil GDP deflator 15.2 32.6 36.3 32.8 20.8 10.5 7.3 5.9 5.9
Oil GDP deflator 62.0 23.8 32.5 32.4 34.6 6.1 3.9 4.0 3.7
Investment and saving
Gross disposable income 97.5 97.5 97.9 98.2 98.2 98.4 98.8 99.1 99.1
Gross domestic expenditure 98.0 106.8 106.5 104.7 104.6 104.5 104.2 104.2 104.0
Final consumption 78.9 88.1 86.5 87.2 86.7 86.3 85.6 85.1 84.5
Gross capital formation 19.1 18.7 20.0 17.5 17.8 18.1 18.6 19.1 19.4
Gross Savings 18.6 9.5 11.4 11.0 11.5 12.1 13.1 13.9 14.5
Government operations
Revenue and Grants 18.0 9.8 9.9 11.4 12.0 12.4 12.5 12.7 12.8
Revenues 17.7 9.4 9.2 10.9 11.3 11.7 11.8 12.0 12.2
Tax revenue 6.4 6.1 6.1 6.1 6.6 7.1 7.4 7.7 7.9
Total expenditure 17.8 13.5 12.1 12.4 13.3 13.0 12.8 12.8 12.6
Current expenditure 16.1 12.0 11.1 11.0 11.6 11.1 10.4 9.9 9.3
Wage bill 5.4 4.8 4.3 3.7 3.5 3.5 3.5 3.5 3.3
Subsidies 1.5 1.8 2.0 1.8 2.3 2.0 1.4 0.9 0.4
Transfers 6.1 2.6 2.2 2.7 2.8 2.8 2.8 2.9 3.0
Capital expenditure 1.7 1.5 1.0 1.3 1.7 2.0 2.4 2.9 3.3
Overall balance 0.2 -3.7 -2.3 -1.0 -1.2 -0.7 -0.3 -0.1 0.3
Overall primary balance 1.4 -2.3 -0.9 -0.1 0.0 0.5 0.8 0.9 1.2
Non-oil primary balance -4.1 -3.8 -2.9 -1.5 -1.8 -1.3 -1.0 -0.8 -0.4
In percent of non-oil GDP -4.7 -3.9 -3.0 -1.6 -1.9 -1.4 -1.0 -0.8 -0.5
Monetary sector
Broad money 17.7 40.3 13.0 19.1 16.3 15.5 15.2 11.6 10.2
Reserve money 27.8 46.7 20.3 14.7 14.4 13.2 12.7 9.4 8.4
Credit to the economy 8.0 34.1 23.2 28.0 21.9 21.8 22.5 26.4 29.1
Velocity (Non-oil GDP/M2 ratio, end of period) 3.7 3.7 4.6 5.2 5.6 5.6 5.5 5.5 5.5
Ratio of Money to Broad Money 70.9 71.4 71.2 71.2 71.2 71.2 71.2 71.2 71.2
Net claims on government as a ratio to Non-oil GDP 11.7 11.0 9.7 8.1 6.7 6.0 5.4 4.9 4.5
Credit to the economy as a ratio to Non-oil GDP 14.9 14.5 12.7 12.0 11.6 12.2 13.3 15.2 17.6
External sector
Exports of goods (in US$, annual percent change) -12.9 -53.7 -6.4 7.6 11.2 7.7 10.5 6.1 6.2
Exports of oil 12.4 2.8 2.4 2.7 3.4 3.3 3.2 3.1 3.0
Imports of goods (in US$, annual percent change) -7.5 2.6 4.7 -4.1 3.7 5.4 6.6 5.4 4.7
Merchandise trade balance 4.1 -5.4 -6.2 -4.9 -4.9 -4.8 -4.6 -4.5 -4.2
Current account balance -0.4 -9.2 -8.6 -6.5 -6.3 -6.0 -5.5 -5.1 -4.9
External debt service (in percent of exports of G&S.)
Commitment basis 24.4 44.7 43.5 39.7 35.2 32.0 29.6 28.1 26.4
Cash basis 2.4 4.2 2.8 3.3 2.9 2.6 2.7 2.8 2.6
Total external debt 59.4 81.4 77.8 79.9 77.9 75.8 73.3 70.7 68.1
Total external debt (in US$ billion) 41.4 43.2 45.0 46.4 48.0 49.5 51.1 52.7 54.4
Gross international reserves (in millions of US$) 1,317 1,693 1,619 1,716 2,080 2,439 2,777 3,055 3,336
In months of next year's imports of G&S. 1.5 1.9 1.9 1.9 2.2 2.4 2.6 2.8 2.9
Memorandum items:
Nominal GDP (in millions of SDGs) 179,535 225,677 317,503 435,140 547,797 631,607 711,613 792,833 884,070
Nominal non-oil GDP (in millions of SDGs) 156,104 215,776 303,487 411,897 517,745 597,221 670,821 745,077 828,114
Nominal GDP (in $US million) 67,327 63,163 66,748 70,030 64,495 65,691 69,176 73,527 78,729
Exchange rate (SDG/US$, end of period) 2.68 4.42 5.70 6.10 6.37 6.52 6.52 6.52
Exchange rate (SDG/US$, period average) 2.67 3.57 4.71 7.00 7.28 7.50 7.50 7.50
NEER (2007=100, percent change, period average) -16.0 -12.2 -28.1 ... ... ... ... ... ...
REER (2007=100, percent change, period average) -4.8 8.1 -3.4 ... ... ... ... ... ...
Sources: Sudanese authorities; and staff estimates and projections.
Projections
1/ Excluding South Sudan from 2011 onward.
(Annual changes in percentage)
(In percent of GDP, unless otherwise specified)
(Annual changes in percentage, unless otherwise specified)
(In percent of GDP)

SUDAN
INTERNATIONAL MONETARY FUND 31
Table 2. Balance of Payments, 2011-19
(in Millions of US Dollars)
2011 2012 2013 2015 2016 2017 2018 2019
Est. Prel.SMP
Request1st
ReviewProj.
Current account balance -288 -5,839 -5,750 -5,212 -4,343 -4,518 -4,091 -3,948 -3,784 -3,766 -3,850
Current account balance (on cash basis) 1,345 -4,226 -4,174 -3,601 -2,735 -2,911 -2,492 -2,356 -2,197 -2,185 -2,269
Trade balance 2,751 -3,405 -4,132 -3,073 -3,288 -3,400 -3,145 -3,183 -3,153 -3,278 -3,326
Exports, f.o.b. 11,063 5,122 4,793 5,655 5,653 5,156 5,731 6,171 6,819 7,236 7,686
Oil exports 8,679 2,012 1,720 2,670 2,561 2,085 2,387 2,389 2,424 2,492 2,586
Crude oil 8,378 1,755 1,617 2,415 2,402 1,884 2,178 2,180 2,212 2,275 2,361
Petroleum products 301 257 102 254 159 201 209 209 212 217 224
Non-oil products 2,384 3,110 3,073 2,985 3,092 3,071 3,344 3,782 4,395 4,744 5,101
Of which: Gold 1,442 2,158 1,048 833 1,012 1,172 1,258 1,252 1,291 1,370 1,431
Imports, f.o.b. -8,312 -8,528 -8,925 -8,728 -8,941 -8,555 -8,876 -9,354 -9,971 -10,514 -11,013
Foodstuffs -1,699 -1,844 -2,135 -1,809 -1,947 -1,847 -1,714 -1,710 -1,737 -1,755 -1,789
Petroleum products -662 -947 -1,313 -1,499 -1,587 -1,612 -1,752 -1,880 -1,989 -1,944 -1,703
Machinery and transport equipments -2,892 -2,707 -2,384 -2,430 -2,383 -2,243 -2,423 -2,609 -2,866 -3,171 -3,550
Manufactured goods -1,610 -1,761 -1,658 -1,727 -1,684 -1,586 -1,730 -1,868 -2,054 -2,262 -2,527
Other -1,450 -1,268 -1,434 -1,263 -1,339 -1,267 -1,257 -1,287 -1,325 -1,382 -1,444
Services (net) -1,389 -875 -226 -708 152 130 209 255 227 210 209
Receipts 764 1,159 1,578 1,373 1,960 1,861 2,003 2,147 2,243 2,336 2,435
Of which : Oil fees charged to South Sudan 0 0 123 390 333 343 382 336 289 289 289
Of which: TFA transfers 0 0 248 520 438 460 446 446 446 446 446
Payments -2,153 -2,033 -1,805 -2,081 -1,808 -1,730 -1,795 -1,892 -2,016 -2,126 -2,227
Income (net) -2,763 -2,422 -2,772 -2,595 -2,712 -2,685 -2,725 -2,739 -2,739 -2,757 -2,800
Receipts 108 14 9 27 0 0 -4 0 27 46 47
Non-oil payments -1,886 -2,220 -2,533 -2,284 -2,353 -2,352 -2,367 -2,386 -2,407 -2,431 -2,455
Public interest due -1,701 -1,676 -1,663 -1,664 -1,657 -1,656 -1,651 -1,648 -1,647 -1,646 -1,646
Of which: interest cash payments -67 -64 -87 -53 -50 -50 -52 -56 -60 -65 -65
Other payments -185 -544 -870 -620 -696 -696 -716 -738 -760 -784 -810
Oil related expenses -985 -216 -249 -338 -359 -333 -353 -353 -359 -372 -391
Current transfers (net) 1,112 863 1,380 1,164 1,505 1,437 1,570 1,719 1,881 2,060 2,067
Private 439 445 945 607 1,061 992 1,114 1,249 1,399 1,565 1,558
Official 673 418 436 557 445 445 456 470 482 495 509
Capital account and Financial Account -1,000 4,061 3,523 3,676 2,662 2,829 2,720 2,617 2,439 2,370 2,462
Capital account 162 320 309 235 249 232 210 204 213 225 223
Financial account (net) -1,161 3,741 3,214 3,441 2,413 2,597 2,510 2,413 2,226 2,145 2,239
Disbursements 606 376 344 377 324 261 313 318 335 356 382
Amortization -445 -402 -381 -405 -405 -405 -347 -286 -305 -317 -300
Of which: Cash payments -216 -198 -90 -182 -182 -182 -173 -157 -183 -206 -195
Net foreign assets of banks (increase -) 313 -61 227 -61 232 234 242 251 262 274 286
Investors' net income-cost oil -1,362 -731 -515 -771 -762 -765 -767 -761 -763 -763 -763
Foreign direct investment and portfolio (net) 2,666 2,466 3,091 2,351 2,487 2,322 2,099 2,045 2,133 2,253 2,226
Other net capital flows -2,938 2,092 447 1,950 537 950 971 845 564 343 409
Public -1,388 556 580 614 685 624 694 747 826 876 931
Private -1,550 1,536 -133 1,336 -148 326 277 98 -262 -534 -522
Errors and omissions -708 549 65 0 0 0 0 0 0 0 0
Overall Balance -1,996 -1,229 -2,162 -1,536 -1,681 -1,688 -1,371 -1,331 -1,345 -1,395 -1,388
Overall Balance (on cash basis) -134 588 -295 298 149 141 401 390 364 297 298
Financing 1,996 1,229 2,162 1,536 1,681 1,688 1,371 1,331 1,345 1,395 1,388
Change in net international reserves (increase -) 192 -547 299 -260 -115 -108 -378 -375 -357 -297 -301
Gross reserves 249 -376 75 -250 -105 -98 -364 -359 -339 -277 -281
Gross usable reserves (increase -) 249 -376 75 -250 -105 -98 -364 -359 -339 -277 -281
Gross earmarked and other reserves (increase -) 0 0 0 0 0 0 0 0 0 0 0
Short-term foreign liabilities (increase +) -51 -164 230 0 0 0 0 0 0 0 0
IMF (net) -5 -7 -6 -10 -10 -10 -14 -16 -18 -20 -20
Disbursements 0 0 0 0 0 0 0 0 0 0 0
Repayments -5 -7 -6 -10 -10 -10 -14 -16 -18 -20 -20
Exceptional financing 1,804 1,776 1,863 1,796 1,796 1,796 1,749 1,706 1,701 1,693 1,689
Of which : Change in arrears 1,804 1,776 1,863 1,796 1,796 1,796 1,749 1,706 1,701 1,693 1,689
Financing gap 0 0 0 0 0 0 0 0 0 0 0
Memorandum items:
Current account balance (accrual basis) -0.4 -9.2 -8.6 -8.3 -6.9 -6.5 -6.3 -6.0 -5.5 -5.1 -4.9
Current account balance (cash basis) 2.0 -6.7 -6.3 -5.7 -4.3 -4.2 -3.9 -3.6 -3.2 -3.0 -2.9
Excluding official transfers (cash basis) 1.0 -7.4 -6.9 -6.6 -5.0 -4.8 -4.6 -4.3 -3.9 -3.6 -3.5
Non-oil current account (on cash basis) -8.4 -8.0 -6.7 -7.6 -5.8 -4.8 -4.9 -4.3 -3.7 -3.6 -3.9
Current transfers (net) 1.7 1.4 2.1 1.8 2.4 2.1 2.4 2.6 2.7 2.8 2.6
Of which: Private transfers 0.7 0.7 1.4 1.0 1.7 1.4 1.7 1.9 2.0 2.1 2.0
Gross International reserves (in US$ Million) 1,317 1,693 1,619 1,868 1,723 1,716 2,080 2,439 2,777 3,055 3,336
In months of next year's imports 1.5 1.9 1.9 2.0 1.9 1.9 2.2 2.4 2.6 2.8 2.9
Financing gap 0.0 0.0 0.0 0.0 0.0 0.0 0.0 0.0 0.0 0.0 0.0
Net repayment of external debt -322.1 -115.2 -167.1 -141.3 -92.0 -29.4 -86.7 -105.0 -92.1 -85.1 -122.0
Exports of goods (value) -12.9 -53.7 -6.4 18.3 17.9 7.6 11.2 7.7 10.5 6.1 6.2
Non-oil exports of goods (value) 39.5 30.4 -1.2 5.0 0.6 -0.1 8.9 13.1 16.2 7.9 7.5
Imports of goods (value) -7.5 2.6 4.7 -1.8 0.2 -4.1 3.7 5.4 6.6 5.4 4.7
Nominal GDP (in millions of U.S. dollars) 67,327 63,163 66,748 63,063 63,034 70,030 64,495 65,691 69,176 73,527 78,729
Crude oil exports (volume, in millions of barrels) 87.5 18.6 15.8 26.6 26.6 24.8 26.0 27.7 28.7 29.9 31.2
Sudanese crude oil price (U.S. dollars per barrel) 95.8 94.6 94.6 90.7 94.2 96.3 95.2 89.6 87.5 86.3 85.4
Sources: Sudanese authorities; and staff estimates and projections.
(In percent of GDP)
(Annual changes in percent, unless otherwise specified)
2014
Proj.

SUDAN
32 INTERNATIONAL MONETARY FUND
Table 3A. Government Operations, 2013-19 (In Millions of SDGs)
2015 2016 2017 2018 2019
Prel. SMP Revised
Revenues and grants 31,309 46,131 49,421 65,949 78,103 88,916 100,585 113,394
Revenues 29,236 43,982 47,272 62,072 73,585 83,956 95,244 107,677
Tax revenues 19,427 25,059 26,676 36,188 44,699 52,766 60,868 69,888
Income, profits and capital gains 1,714 2,106 2,395 3,011 3,751 4,424 5,209 6,137
Property 19 87 87 109 188 218 252 291
Goods and services 11,017 14,535 15,236 20,379 24,866 29,271 33,729 38,625
International trade and transactions 6,620 8,243 8,870 12,578 15,757 18,688 21,483 24,604
Other 58 88 88 111 137 164 195 232
Oil revenues 4,805 4,761 4,448 6,678 8,118 9,141 10,015 10,852
Domestic sales 4,610 4,471 4,093 6,123 7,181 8,003 8,669 9,493
Oil exports revenues 195 290 355 554 937 1,137 1,346 1,359
Other nontax revenues 5,005 14,163 16,148 19,206 20,767 22,050 24,361 26,936
Property income 1,034 1,420 1,251 1,572 1,905 2,289 2,720 3,235
Administrative fees 733 1,038 1,028 1,292 1,640 2,026 2,475 3,026
Transit fees 925 2,441 1,852 2,483 2,361 2,045 2,143 2,232
Other (including TFA) 2,313 9,265 12,017 13,859 14,862 15,691 17,022 18,443Of which : TFA 1,177 3,244 2,858 3,784 4,283 4,583 4,804 5,003
Grants 2,073 2,149 2,149 3,876 4,519 4,960 5,341 5,718
Total expenditure 38,540 51,076 53,779 72,694 82,264 91,165 101,388 110,965
Expense (current expenditure) 35,209 45,225 47,929 63,514 69,942 73,982 78,374 82,017
Wages 1/ 13,670 16,012 16,012 19,302 22,396 25,050 27,375 29,459
Goods and services 2,929 3,803 4,919 6,184 5,956 6,623 7,209 7,797
Interest due 4,356 4,061 4,061 6,662 7,324 7,588 7,941 8,005
Foreign interest due 416 336 336 445 537 620 702 728
Domestic interest due 3,940 3,726 3,726 6,218 6,787 6,969 7,240 7,277
Subsidies 6,214 7,527 8,027 12,441 12,558 9,691 7,213 3,870
Fuel subsidies 6,160 6,027 6,027 9,707 9,463 6,380 3,743 0
Other subsidies 54 1,500 2,000 2,734 3,095 3,311 3,471 3,870
Transfers 7,065 11,909 11,909 15,266 17,377 19,939 22,666 26,231
South 0 0 0 0 0 0 0 0
States 6,921 11,760 11,760 15,097 17,202 19,762 22,488 26,032
Current 4,515 7,846 7,846 9,078 9,366 9,271 8,999 9,745
Capital 2,405 3,914 3,914 6,019 7,836 10,491 13,489 16,288
Other transfers 144 149 149 169 175 178 178 199
Other expenditures 975 1,913 3,000 3,659 4,331 5,091 5,969 6,655
Net acquisition of NFA (capital expenditure) 3,331 5,850 5,850 9,180 12,322 17,183 23,014 28,948
Operating balance (accrual basis) -3,899 906 1,492 2,435 8,161 14,934 22,212 31,377
Overall accrual balance -7,230 -4,945 -4,358 -6,745 -4,160 -2,249 -803 2,429
Overall accrual balance (including discrepancy) -7,230 -4,945 -4,358 -6,745 -4,160 -2,249 -803 2,429
Nonoil primary balance 2/ -9,069 -7,659 -6,496 -9,982 -8,223 -6,821 -6,075 -3,743
Financing (accrual basis) 7,230 4,945 4,358 6,745 4,160 2,249 803 -2,429
Foreign financing 1,211 708 491 1,181 1,547 1,567 1,620 2,098
Disbursements 1,638 1,844 1,623 2,655 3,061 3,449 3,842 4,284
Principal repayment (-)) 427 1,136 1,132 1,473 1,514 1,882 2,223 2,186
Domestic financing 6,141 4,237 3,868 5,564 2,614 682 -817 -4,527
Bank financing 3,987 3,073 2,440 94 94 94 94 94
Nonbank financing -1,419 3,275 3,809 6,511 3,561 838 -661 -4,370
Accounts payable (net arrears accumulation) 3,573 -2,111 -2,111 -1,042 -1,042 -250 -250 -251
Accumulation of arrears 3,750 0 0 0 0 0 0 0
Repayment of arrears (-) -177 -2,111 -2,111 -1,042 -1,042 -250 -250 -251
Financing Gap 0 0 0 0 0 0 0 0
Sources: Sudanese authorities; and staff estimates and projections.
1/ The retroactive effect of the September 2013 wage increase will be spread over 3 years starting in 2014. The total amount is SDG1.2 billion, of which SDG 550 million will be
reflected under current transfers to state.
2/ Non-oil primary balance excludes oil revenues, grants, transfers to South, oil related transfers to Northern states and pipelines fees paid by the government.
2013 2014
Proj.

SUDAN
INTERNATIONAL MONETARY FUND 33
Table 3B. Government Operations, 2013-19
(In Percent of GDP)
2015 2016 2017 2018 2019
Prel. SMP Revised
Revenues and grants 9.9 11.7 11.4 12.0 12.4 12.5 12.7 12.8
Revenues 9.2 11.2 10.9 11.3 11.7 11.8 12.0 12.2
Tax revenues 6.1 6.4 6.1 6.6 7.1 7.4 7.7 7.9
Oil revenues 1.5 1.2 1.0 1.2 1.3 1.3 1.3 1.2
Other non-oil nontax revenues 1.6 3.6 3.7 3.5 3.3 3.1 3.1 3.0
Grants 0.7 0.5 0.5 0.7 0.7 0.7 0.7 0.6
Total expenditure 12.1 13.0 12.4 13.3 13.0 12.8 12.8 12.6
Expense (current expenditure) 11.1 11.5 11.0 11.6 11.1 10.4 9.9 9.3
Wages 1/ 4.3 4.1 3.7 3.5 3.5 3.5 3.5 3.3
Goods and services 0.9 1.0 1.1 1.1 0.9 0.9 0.9 0.9
Interest 1.4 1.0 0.9 1.2 1.2 1.1 1.0 0.9
Subsidies 2.0 1.9 1.8 2.3 2.0 1.4 0.9 0.4
Transfers 2.2 3.0 2.7 2.8 2.8 2.8 2.9 3.0
Other 0.3 0.5 0.7 0.7 0.7 0.7 0.8 0.8
Net acquisition of NFA (capital expenditure) 1.0 1.5 1.3 1.7 2.0 2.4 2.9 3.3
Operating balance (accrual basis) -1.2 0.2 0.3 0.4 1.3 2.1 2.8 3.5
Overall accrual balance -2.3 -1.3 -1.0 -1.2 -0.7 -0.3 -0.1 0.3
Non-oil primary balance as a ratio to Non-oil GDP 2/ -3.0 -2.1 -1.6 -1.9 -1.4 -1.0 -0.8 -0.5
Financing (accrual basis) 2.3 1.3 1.0 1.2 0.7 0.3 0.1 -0.3
Foreign financing 0.4 0.2 0.1 0.2 0.2 0.2 0.2 0.2
Domestic financing 1.9 1.1 0.9 1.0 0.4 0.1 -0.1 -0.5Of which : Net accumulation of arrears 1.1 -0.5 -0.5 -0.2 -0.2 0.0 0.0 0.0
Financing gap 0.0 0.0 0.0 0.0 0.0 0.0 0.0 0.0
Memorandum Items
Change in external arrears (SDG million) 8,861 11,197.0 11,159 14,851 16,402 17,500 18,250 18,964
Change in external arrears (percent of GDP) 2.9 3.0 2.7 2.9 2.7 2.6 2.4 2.3
Sources: Sudanese authorities; and staff estimates and projections.
1/ The retroactive effect of the September 2013 wage increase will be spread over 3 years starting in 2014. The total amount is SDG1.2 billion, of which SDG 550 million will be
reflected under current transfers to state.
2/ Non-oil primary balance excludes oil revenues, grants, transfers to South, oil related transfers to Northern states and pipelines fees paid by the government.
(In percent of GDP)
2013 2014
Proj.

SUDAN
34 INTERNATIONAL MONETARY FUND
Table 4. Monetary Survey, 2010-14 (In Millions of SDGs)
2010 2011 2012 2013
Prel. March June September December
Net foreign assets -4,187 -5,876 -7,271 -12,729 -13,409 -12,591 -14,047 -15,207Central Bank of Sudan -6,429 -7,590 -10,372 -15,428 -15,974 -15,375 -15,964 -16,256Commercial banks 2,242 1,713 3,100 2,700 2,564 2,784 1,916 1,049
Net domestic assets 39,799 47,790 66,064 79,174 84,291 86,415 90,432 94,344Net domestic credit 35,483 41,536 54,888 68,024 69,512 71,195 76,971 82,641
Net claims on general government (NCGG) 13,951 18,272 23,681 29,575 28,862 29,495 31,217 33,417NCGG excluding IMF 10,166 14,217 16,980 20,967 20,235 20,840 21,884 23,407
Central Bank of Sudan (central government) 6,186 8,173 9,861 13,503 13,140 13,131 13,951 15,249Commercial banks (central government) 3,980 6,044 7,120 7,464 7,095 7,709 7,933 8,158
Claims on nongovernment sectors 21,532 23,264 31,207 38,449 40,650 41,701 45,755 49,224Public enterprises 2,810 2,821 3,170 4,004 4,654 4,372 4,686 5,001Private sector 17,959 19,427 26,966 33,034 34,514 35,856 39,487 42,534Other sectors 763 1,016 1,071 1,411 1,481 1,473 1,581 1,689
Other items (net) 4,316 6,254 11,175 11,150 14,780 15,219 13,461 11,703
Broad money 35,612 41,914 58,792 66,446 70,882 73,824 76,385 79,137 Money 24,748 29,729 42,006 47,309 49,984 52,241 54,576 56,344
Currency in circulation 10,068 12,850 16,751 19,178 19,902 20,820 21,405 21,990 Demand deposits 14,680 16,879 25,254 28,130 30,082 31,420 33,170 34,355 Domestic currency 9,840 12,000 14,242 16,487 18,194 19,240 19,307 19,374 Foreign currency 4,840 4,879 11,012 11,643 11,887 12,181 13,581 14,981
Quasi-money 10,864 12,185 16,786 19,137 20,898 21,583 21,810 22,792 Domestic currency 10,380 10,894 13,969 15,394 16,971 17,898 17,826 18,510 Foreign currency 484 1,291 2,817 3,743 3,927 3,685 3,984 4,283
Money 18.6 14.0 29.3 9.0 13.6Quasi-money 6.3 3.7 11.0 4.0 5.5Net foreign assets 1.4 -4.7 -3.3 -9.3 -3.7Net domestic assets 23.4 22.4 43.6 22.3 22.8Net claims on government 13.5 12.1 12.9 10.0 5.8Credit to the economy 10.6 4.9 18.9 12.3 16.2 Nonfinancial public enterprises 1.8 0.0 0.8 1.4 1.5 Private sector 8.6 4.1 18.0 10.3 14.3
Broad money 24.9 17.7 40.3 13.0 19.1Money 27.3 20.1 41.3 12.6 19.1
Currency in circulation 24.8 27.6 30.4 14.5 14.7Demand deposits 29.0 15.0 49.6 11.4 22.1
Of which: Public enterprises 31.5 28.6 37.1 15.0 12.7Private enterprises 24.0 11.9 42.1 12.4 12.7
Quasi-money 19.8 12.2 37.8 14.0 19.1Of which: Public enterprises 23.3 -13.7 0.6 -1.7 12.7
Private enterprises 19.5 8.3 27.7 12.7 12.7Deposits 24.9 13.8 44.6 12.4 12.7
Domestic currency 23.2 13.2 23.2 13.0 18.8Foreign currency 31.7 15.9 124.1 11.3 25.2
Net foreign assets -8.9 40.3 23.7 75.0 19.5Net domestic assets 20.2 20.1 38.2 19.8 19.2Net claims on government 38.0 31.0 29.6 24.9 13.0Credit to the economy 16.4 8.0 34.1 23.2 28.0
Nonfinancial public enterprises 22.9 0.4 12.4 26.3 24.9Private sector 15.8 8.2 38.8 22.5 28.8
Memorandum itemsRatio of Money to Broad Money 69.5 70.9 71.4 71.2 71.2Ratio of Currency in Circulation to M2 28.3 30.7 28.5 28.9 27.8Ratio of Private sector deposits to M2 63.0 59.9 60.7 60.4 57.1Net claims on government as a ratio to GDP 9.2 10.2 10.5 9.3 7.7Net claims on government as a ratio to NHGDP 10.9 11.7 11.0 9.7 8.1Credit to the economy as a ratio to GDP 14.2 13.0 13.8 12.1 11.3Credit to the economy as a ratio to NHGDP 16.9 14.9 14.5 12.7 12.0Velocity 1 (GDP, eop) 4.3 4.3 3.8 4.8 5.5Velocity 2 (NHGDP, eop) 3.6 3.7 3.7 4.6 5.2CBOS's gross foreign assets/M2 ratio 11.3 8.8 13.1 14.3 16.8Foreign currency deposits/M2 ratio 14.9 14.7 23.5 23.2 24.3Reserve money growth (annual changes, end of period) 17.2 27.8 46.7 20.3 14.7Money multiplier (end of period) 2.2 2.0 1.9 1.8 1.9
Sources: Sudanese authorities; and staff estimates and projections.
(In percent of beginning of the period broad money stock)
(Changes in percent, end of period)
(Ratios in percentage)
2014
Proj.
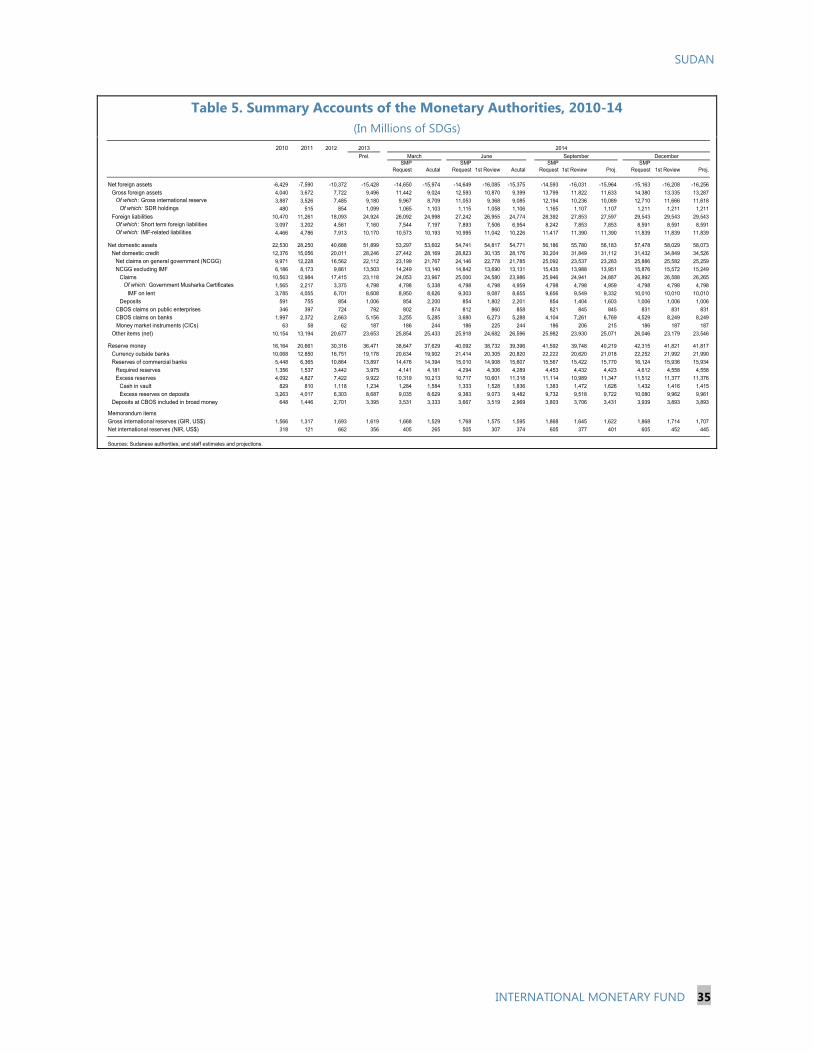
SUDAN
INTERNATIONAL MONETARY FUND 35
Table 5. Summary Accounts of the Monetary Authorities, 2010-14 (In Millions of SDGs)
2010 2011 2012 2013
Prel.SMP
Request AcutalSMP
Request 1st Review AcutalSMP
Request 1st Review Proj.SMP
Request 1st Review Proj.
Net foreign assets -6,429 -7,590 -10,372 -15,428 -14,650 -15,974 -14,649 -16,085 -15,375 -14,593 -16,031 -15,964 -15,163 -16,208 -16,256
Gross foreign assets 4,040 3,672 7,722 9,496 11,442 9,024 12,593 10,870 9,399 13,799 11,822 11,633 14,380 13,335 13,287Of which : Gross international reserve 3,887 3,526 7,485 9,180 9,967 8,709 11,053 9,368 9,085 12,194 10,236 10,089 12,710 11,666 11,618
Of which: SDR holdings 480 515 854 1,099 1,065 1,103 1,115 1,058 1,106 1,165 1,107 1,107 1,211 1,211 1,211
Foreign liabilities 10,470 11,261 18,093 24,924 26,092 24,998 27,242 26,955 24,774 28,392 27,853 27,597 29,543 29,543 29,543Of which : Short term foreign liabilities 3,097 3,202 4,561 7,160 7,544 7,197 7,893 7,506 6,954 8,242 7,853 7,853 8,591 8,591 8,591Of which: IMF-related liabilities 4,466 4,786 7,913 10,170 10,573 10,193 10,995 11,042 10,226 11,417 11,390 11,390 11,839 11,839 11,839
Net domestic assets 22,530 28,250 40,688 51,899 53,297 53,602 54,741 54,817 54,771 56,186 55,780 56,183 57,478 58,029 58,073
Net domestic credit 12,376 15,056 20,011 28,246 27,442 28,169 28,823 30,135 28,176 30,204 31,849 31,112 31,432 34,849 34,526
Net claims on general government (NCGG) 9,971 12,228 16,562 22,112 23,199 21,767 24,146 22,778 21,785 25,092 23,537 23,283 25,886 25,582 25,259
NCGG excluding IMF 6,186 8,173 9,861 13,503 14,249 13,140 14,842 13,690 13,131 15,435 13,988 13,951 15,876 15,572 15,249
Claims 10,563 12,984 17,415 23,118 24,053 23,967 25,000 24,580 23,986 25,946 24,941 24,887 26,892 26,588 26,265Of which: Government Musharka Certificates 1,565 2,217 3,375 4,798 4,798 5,338 4,798 4,798 4,959 4,798 4,798 4,959 4,798 4,798 4,798
IMF on lent 3,785 4,055 6,701 8,608 8,950 8,626 9,303 9,087 8,655 9,656 9,549 9,332 10,010 10,010 10,010
Deposits 591 755 854 1,006 854 2,200 854 1,802 2,201 854 1,404 1,603 1,006 1,006 1,006
CBOS claims on public enterprises 346 397 724 792 802 874 812 860 858 821 845 845 831 831 831
CBOS claims on banks 1,997 2,372 2,663 5,156 3,255 5,285 3,680 6,273 5,288 4,104 7,261 6,769 4,529 8,249 8,249
Money market instruments (CICs) 63 58 62 187 186 244 186 225 244 186 206 215 186 187 187
Other items (net) 10,154 13,194 20,677 23,653 25,854 25,433 25,918 24,682 26,596 25,982 23,930 25,071 26,046 23,179 23,546
Reserve money 16,164 20,661 30,316 36,471 38,647 37,629 40,092 38,732 39,396 41,592 39,748 40,219 42,315 41,821 41,817
Currency outside banks 10,068 12,850 16,751 19,178 20,634 19,902 21,414 20,305 20,820 22,222 20,620 21,018 22,252 21,992 21,990
Reserves of commercial banks 5,448 6,365 10,864 13,897 14,476 14,394 15,010 14,908 15,607 15,567 15,422 15,770 16,124 15,936 15,934
Required reserves 1,356 1,537 3,442 3,975 4,141 4,181 4,294 4,306 4,289 4,453 4,432 4,423 4,612 4,558 4,558
Excess reserves 4,092 4,827 7,422 9,922 10,319 10,213 10,717 10,601 11,318 11,114 10,989 11,347 11,512 11,377 11,376
Cash in vault 829 810 1,118 1,234 1,284 1,584 1,333 1,528 1,836 1,383 1,472 1,626 1,432 1,416 1,415
Excess reserves on deposits 3,263 4,017 6,303 8,687 9,035 8,629 9,383 9,073 9,482 9,732 9,518 9,722 10,080 9,962 9,961
Deposits at CBOS included in broad money 648 1,446 2,701 3,395 3,531 3,333 3,667 3,519 2,969 3,803 3,706 3,431 3,939 3,893 3,893
Memorandum itemsGross international reserves (GIR, US$) 1,566 1,317 1,693 1,619 1,668 1,529 1,768 1,575 1,595 1,868 1,645 1,622 1,868 1,714 1,707
Net international reserves (NIR, US$) 318 121 662 356 405 265 505 307 374 605 377 401 605 452 445
Sources: Sudanese authorities; and staff estimates and projections.
2014
March June DecemberSeptember

SUDAN
36 INTERNATIONAL MONETARY FUND
Table 6. Summary Accounts of the Commercial Banks, 2010-14 (In Millions of SDGs)
2010 2011 2012 2013 2014Prel. Proj.
Net foreign assets 2,242 1,713 3,100 2,700 1,049Gross foreign assets 3,494 2,489 4,894 4,696 3,444Gross foreign liabilities 1,252 776 1,793 1,996 2,395
Net domestic assets 23,555 26,626 37,453 42,717 52,205
Reserves 5,831 6,838 13,134 14,440 17,350Of which: Cash in vaults 829 810 1,118 1,234 1,415
Required reserves 1,318 1,646 3,775 4,029 4,620Other reserves 3,400 3,950 7,988 9,098 11,315
Net claims on central government 3,980 6,044 7,120 7,464 8,158Claims 4,907 6,132 7,277 7,590 8,290
Of which: GMCs 4,907 6,132 7,277 7,590 8,290Deposits 927 88 157 126 132
Claims on state & local government 145 613 758 966 966Claims on non-government sectors 21,040 22,254 29,724 36,691 48,393
Private sector 17,959 19,427 26,966 33,034 43,570Non-financial Public enterprises 2,464 2,424 2,446 3,213 4,237Non-bank financial institutions 618 403 312 444 586
Other items, net -7,441 -9,123 -13,284 -16,844 -22,661Unclassified assets 7,690 8,179 11,262 13,097 17,621Unclassified liabilities 7,602 8,195 13,668 16,657 22,410Capital accounts 7,478 9,036 10,831 13,149 17,691Other (incl. discrepancies) 52 70 48 135 182
Deposits 24,896 27,623 39,340 43,872 53,254Demand deposits 14,117 16,159 24,753 27,537 33,425
Domestic currency 9,278 11,280 13,741 15,893 19,292Foreign currency 4,840 4,879 11,012 11,643 14,133
Quasi-money deposits (Time & saving) 10,778 11,459 14,586 16,335 19,829Domestic currency 10,380 10,893 13,969 15,394 18,686Foreign currency 398 566 617 942 1,143
Liabilities to CBOS 1/ 902 721 1,213 1,544 1,730
Memorandum items
Deposits with commercial banks 25,823 27,711 39,497 43,998 53,386Central government 927 88 157 126 132Other sectors 24,896 27,623 39,340 43,872 53,254
State and local government deposits 412 521 1,756 1,744 2,117Demand deposits 350 371 1,302 1,173 1,424Time and savings deposits 62 150 454 571 694
Public enterprises deposits 2,037 1,995 1,896 2,011 2,441Demand deposits 712 852 746 880 1,068Time and savings deposits 1,325 1,143 1,150 1,131 1,373
Private sector deposits 22,446 25,107 35,687 40,117 48,695Demand deposits 13,056 14,942 22,705 25,484 30,933Time and savings deposits 9,390 10,165 12,982 14,633 17,762
Time deposits 2,297 3,165 4,397 5,371 6,520Savings deposits 7,093 7,001 8,585 9,262 11,242
Banks' credit to deposits ratio 85.1 82.8 77.5 85.8 92.7Bank reserves as a ratio to bank deposits 21.1 23.0 27.5 31.6 29.9Reserve requirements as a ratio to bank deposits 5.2 5.5 8.7 9.0 8.6Excess reserves as a ratio to bank deposits 15.8 17.4 18.8 22.6 21.4Banks' cash to deposit Ratio 3.2 2.9 2.8 2.8 2.7GMC as a ratio to Bank reserves 90.1 96.3 67.0 54.6 52.0GMC as a ratio to Bank excess reserves 119.9 127.0 98.0 76.5 72.9
Sources: Sudanese authorities; and staff estimates and projections.
(Ratios in percentage)
1/ The difference between commercial banks' liabilities to CBOS and CBOS's claims on banks is due to misclassification of government guarantees.

SUDAN
INTERNATIONAL MONETARY FUND 37
Table 7. Medium-Term Macroeconomic Outlook, 2011-19
2011 2012 2013 2014 2015 2016 2017 2018 2019
Est. Prel.
Production and prices
Nominal GDP (billions of SDGs) 179.5 225.7 317.5 435.1 547.8 631.6 711.6 792.8 884.1
Nominal GDP (billions of US$) 67.3 63.2 66.7 70.0 64.5 65.7 69.2 73.5 78.7
Non-oil GDP billions of US$) 58.5 60.4 63.8 66.3 61.0 62.1 65.2 69.1 73.7
Non-oil GDP (percent of total GDP) 86.9 95.6 95.6 94.7 94.5 94.6 94.3 94.0 93.7
Real GDP growth -0.3 -2.2 3.3 3.1 3.4 3.9 4.2 4.6 4.7
Oil Sector -36.0 -59.0 15.6 6.3 3.2 3.8 4.4 5.0 5.5
Non-oil sector 6.8 4.7 2.7 2.9 3.4 3.9 4.2 4.6 4.7
GDP deflator 20.3 29.3 36.3 32.8 21.6 10.1 7.1 5.8 5.7
Non-oil GDP deflator 15.2 32.6 36.3 32.8 20.8 10.5 7.3 5.9 5.9
Oil GDP deflator 62.0 23.8 32.5 32.4 34.6 6.1 3.9 4.0 3.7
Income, expenditure and saving
Gross national income (GNI) 95.9 96.2 95.8 96.2 95.8 95.8 96.0 96.2 96.4
Gross disposable income (GDI) 97.5 97.5 97.9 98.2 98.2 98.4 98.8 99.1 99.1
Gross domestic expenditure (GDE) 98.0 106.8 106.5 104.7 104.6 104.5 104.2 104.2 104.0
Final consumption 78.9 88.1 86.5 87.2 86.7 86.3 85.6 85.1 84.5
Gross capital formation 19.1 18.7 20.0 17.5 17.8 18.1 18.6 19.1 19.4
Gross Savings 18.6 9.5 11.4 11.0 11.5 12.1 13.1 13.9 14.5
Central government operations
Total revenue and grants 18.0 9.8 9.9 11.4 12.0 12.4 12.5 12.7 12.8
Revenue 17.7 9.4 9.2 10.9 11.3 11.7 11.8 12.0 12.2Of which : Oil revenue 10.4 1.5 1.5 1.0 1.2 1.3 1.3 1.3 1.2
Grants 0.3 0.4 0.7 0.5 0.7 0.7 0.7 0.7 0.6
Total expenditure 17.8 13.5 12.1 12.4 13.3 13.0 12.8 12.8 12.6
Current expenditure 16.1 12.0 11.1 11.0 11.6 11.1 10.4 9.9 9.3
Capital expenditure 1.7 1.5 1.0 1.3 1.7 2.0 2.4 2.9 3.3
Overall balance 0.2 -3.7 -2.3 -1.0 -1.2 -0.7 -0.3 -0.1 0.3
Money and banking
Broad money 17.7 40.3 13.0 19.1 16.3 15.5 15.2 11.6 10.2
Reserve money 27.8 46.7 20.3 14.7 14.4 13.2 12.7 9.4 8.4
Credit to the economy 8.0 34.1 23.2 28.0 21.9 21.8 22.5 26.4 29.1
Credit to the economy as a ratio to NHGDP 14.9 14.5 12.7 12.0 11.6 12.2 13.3 15.2 17.6
Velocity (Non-oil GDP/M2 ratio, eop) 3.7 3.7 4.6 5.2 5.6 5.6 5.5 5.5 5.5
External sector
External trade balance 4.1 -5.4 -6.2 -4.9 -4.9 -4.8 -4.6 -4.5 -4.2
Exports, f.o.b. 16.4 8.1 7.2 7.4 8.9 9.4 9.9 9.8 9.8
Non-oil exports 3.5 4.9 4.6 4.4 5.2 5.8 6.4 6.5 6.5
Imports, f.o.b. -12.3 -13.5 -13.4 -12.2 -13.8 -14.2 -14.4 -14.3 -14.0
Current account balance -0.4 -9.2 -8.6 -6.5 -6.3 -6.0 -5.5 -5.1 -4.9
Gross useable reserves (in months of imports) 1.5 1.9 1.9 1.9 2.2 2.4 2.6 2.8 2.9
Public debt 70.5 94.3 90.3 90.8 87.6 85.0 81.7 78.3 74.9
External debt 59.4 81.4 77.8 79.9 77.9 75.8 73.3 70.7 68.1
Domestic debt 1/ 11.0 12.9 12.5 10.9 9.8 9.1 8.4 7.6 6.8
Total debt in US$ billion 48.8 49.8 52.0 52.7 53.7 54.7 55.5 56.2 57.5
Memorandum item:
Crude oil export price (U.S. dollars per barrel) 2/ 95.8 94.6 94.6 96.3 95.2 89.6 87.5 86.3 85.4
Crude oil production (million barrels per year) 106.1 37.6 43.5 46.2 47.7 49.5 51.7 54.3 57.2
Crude oil exports (million barrels per year) 87.5 18.6 15.8 24.8 26.0 27.7 28.7 29.9 31.2
Sources: Sudanese authorities; and staff estimates and projections.
1/ Staff estimates and projections.
2/ Sudanese oil blends. Projections are based on the latest WEO assumptions (based on futures prices).
Projections

SUDAN
38 INTERNATIONAL MONETARY FUND
Table 8. Financial Soundness Indicators for the Banking Sector, 2010-14
Dec-10 Dec-11 Dec-12 Mar-13 Jun-13 Sep-13 Dec-13 Mar-14 Jun-14 Sep-14
Capital AdequacyRegulatory capital to risk-weighted assets 1/ 10.0 13.0 12.0 - 14.9 14.9 16.6 - - - Regulatory Tier I capital to risk-weighted assets 1/ 8.9 11.0 10.5 - 13.6 13.6 14.5 - - -
Asset composition and qualityLoans to nongovernment to total assets 51.8 - - - - - - - - - Gross NPLs to gross loans 14.4 12.6 11.8 11.3 10.4 9.9 8.4 8.4 8.5 8.3NPLs net of provisions to gross loans 10.4 7.6 7.5 7.5 5.8 5.7 3.8 4.6 4.0 4.0NPLs net of provisions to capital 43.7 33.3 36.5 33.3 43.7 42.5 16.7 21.4 21.0 19.3Loans provisions to NPLs 31.7 39.8 33.5 30.5 25.5 26.9 53.6 - - - Foreign currency loans to total loans 13.7 9.0 15.7 13.2 11.8 10.8 11.8 11.3 11.6 9.5Deposits and investment accounts to total assets 63.9 63.5 63.4 64.5 65.1 63.5 62.2 63.4 64.0 59.5Foreign currency deposits to total deposits 22.0 18.7 27.0 26.9 24.9 24.3 31.9 25.9 25.2 25.4Off- balance sheet commitments to assets 31.5 29.8 32.2 29.9 28.9 27.8 30.1 29.2 28.5 26.7
LiquidityCBOS deposits to total assets 10.8 13.1 17.5 17.3 18.1 18.3 16.5 16.9 17.7 16.4Required reserves to total assets 3.2 3.5 5.5 5.6 5.6 5.5 5.0 5.2 5.1 4.9Required reserves to total reserves 25.5 23.9 28.6 28.9 28.0 27.7 27.8 27.7 25.9 27.1Cash in vault to total assets 1.9 2.1 2.0 2.6 2.6 2.0 1.9 2.4 2.7 2.3Liquid assets to total assets 35.3 36.3 41.7 39.6 39.8 39.2 39.5 36.3 37.5 35.3Liquid assets to total short-term liabilities 98.2 93.8 102.5 96.3 96.7 98.3 99.5 91.7 95.1 95.7
Source: Central Bank of Sudan.
(In percent, unless otherwise indicated)
1/ Data for December 2006 refer only to 27 of the 30 existing banks (exclude Sudanese Agriculture Bank, Capital Bank, and Industrial Development Bank).

SUDAN
INTERNATIONAL MONETARY FUND 39
Annex I. External Sector Assessment
Current account imbalances, an overvalued exchange rate, and low international reserves continue to
undermine Sudan’s external stability. Three years after the secession of South Sudan, Sudan has not
yet fully adjusted to the permanent loss of oil exports and has not restored its external competitiveness.
Applying the EBA-lite methodology, staff estimated a 40 percent exchange rate overvaluation relative
to economic fundamentals. Further adjustment would involve diversifying exports, allowing greater
exchange rate flexibility, developing a business environment supportive of the non-oil private sector,
and gradual buildup of reserves.
Background
1. Sudan’s balance of payments deteriorated significantly following the secession of
South Sudan in 2011. Sudan lost about three-quarters of oil production and two-thirds of exports.
The current account balance deteriorated, shortages of foreign exchange emerged, and the
exchange rate on the parallel market diverged from the official rate. Under the government’s three-
year emergency plan, the authorities devalued the Sudanese Pound (SDG) from 2.9 to 4.4 SDG/USD
in June 2012 and subsequently to 5.7 SDG/USD in September 2013. However, fiscal and monetary
policies remained expansionary for most of this period. As a result, inflation surged, the current
account deficit remained high, and the parallel market exchange rate continued to drift away from
the official rate.
Recent external developments
2. The current account balance improved
in the first half of 2014. While exports were
unchanged, imports declined by 15 percent year-
on-year in the first half of the year, reflecting
adjustment from the September 2013
devaluation as well as a tightened fiscal stance.
From July 2013 Sudan also started receiving
stable oil-related revenue flows—oil transit fees
and TFA transfers—from South Sudan. As a result,
the current account deficit is expected to narrow to 6½ percent of GDP in 2014 from 8¾ percent
in 2013.
3. The exchange rate continued to depreciate on the parallel market before stabilizing in
recent months (Figure 1). External shocks contributed to this depreciation in the first half of the

SUDAN
40 INTERNATIONAL MONETARY FUND
year, including the conflict in South Sudan and the U.S. prosecution of an international bank for
violating U.S. sanctions. By mid-2014, the
parallel market rate reached
9.5 SDG/USD—a 20 percent depreciation
from its end-2013 level. Since July,
however, the rate appreciated. In mid-
November, the gap between the official
and parallel market exchange rates
dropped to about 47 percent.
Price competitiveness
4. The official SDG rate is
overvalued as suggested by a number
indicators: (i) the current account deficit
remains high; (ii) the gap between the official and the parallel market rates persists; (iii) the real
effective exchange rate depreciation, generated by the nominal devaluations in June 2012 and
September 2013, has been largely reversed by
high domestic inflation relative to trading
partners (Figure 2); (iv) international reserves
remain low; and (v) external payment capacity is
weak, as evidenced by the continued
accumulation of external arrears.
5. Results from the EBA-lite
methodology suggest that Sudan’s currency
was overvalued by about 40 percent relative
to economic fundamentals.1 Before the
secession, Sudan’s current account cash
balance2 was broadly in line with fundamentals.
Since 2011, however, the current account
1 The External Balance Assessment (EBA-lite) methodology was developed as a successor to the macroeconomic balance approach used under CGER. EBA-lite takes into account a broader set of factors—including policies, cyclical conditions, and global capital market conditions—that may influence the current account and real exchange rate. 2 Interest and penalties on Sudan’s external debt arrears have been excluded from the current account deficit in this exercise as they do not present actual cash flows.
0
50
100
150
200
Jan-
05
Jan-
06
Jan-
07
Jan-
08
Jan-
09
Jan-
10
Jan-
11
Jan-
12
Jan-
13
Jan-
14
Real Effective Exchange Rate (REER)Nominal Effective Exchange Rates (NEER)
Figure 2. REER and NEER (January 2010 - June 2014)
Sources: Sudanese authorities; and IMF staff calculations
-8%
-6%
-4%
-2%
0%
2%
4%
6%
8%
2000 2002 2004 2006 2008 2010 2012
Figure 3. Current Account Norm and Actual CA Balance
CA-Norm-2013 CA-Fitted CA

SUDAN
INTERNATIONAL MONETARY FUND 41
balance has diverged from the norm (Figure 3), and was about 4 percent of GDP above the level
consistent with fundamentals and desirable policies, adjusted for cyclical factors, in 2013. Because of
Sudan’s relatively low elasticity of the current account to the REER of 0.09—owing to its low export-
and import-to-GDP ratios3 —reducing the current account by 1 percent of GDP requires an
11 percent real depreciation. Hence, the current account gap translates into an exchange rate
overvaluation of 41 percent.
Non-price competitiveness
6. Weak institutions and an unfavorable business environment undermine Sudan’s
competitiveness. Sudan’s business climate, as measured by the 2014 World Bank Doing Business
survey, is ranked 149 among 189 countries—in the lowest quartile of all surveyed countries—as in
previous years. 4Indicators point to difficulties in obtaining licenses, accessing credit, and trading
across borders. Sanctions imposed on Sudan by the United States generate additional costs and
difficulties for international trade and foreign direct investment. Sudan also lags in the areas of
human development and public sector capacity, as evidenced by the UNDP’s 2012 Human
Development Index (Sudan ranked 171 out of 186 countries) and the World Bank’s 2012 Country
and Policy Institutional Assessment (Sudan is classified as a weak performer).
Reserve adequacy
7. Sudan’s international reserves are below the levels considered adequate. Gross
international reserves have been on a declining trend since 2006. Following the September 2013
depreciation, they increased moderately (Figure 4) to 1.6 months of imports from a trough of
1.3 months. However, they are still well below the traditional recommended minimum coverage of
3 months of imports, and below the optimal level suggested by the new methodology for low-
income countries, which suggests an optimal reserve level of 6 – 6½ months for Sudan, based on
country-specific probabilities and the costs of balance of payments crises (Figure 5).5
3 Trade elasticities, estimated by Tokarick, 2010, were applied: Sudan has an export supply elasticity of 0.57 and an import demand elasticity of 1.23. 4 These indicators should be interpreted with caution because of the limited number of respondents, limited geographical coverage, and standardized assumption on business constraints and information availability. 5 Crispolti, V., and others, Assessing Reserve Adequacy for Low-Income Countries, Washington, D.C.: International Monetary Fund, 2013. Optimal reserve level is based on an estimated annual marginal return on capital of 6 percent and a real return on reserve assets of ½ percent for Sudan.

SUDAN
42 INTERNATIONAL MONETARY FUND
Conclusion
8. Sudan’s external sector continues to be vulnerable to shocks. To restore external
stability and increase resilience to external shocks, Sudan needs to: (i) introduce greater
exchange rate flexibility to reduce overvaluation and close the gap between the official and parallel
market exchange rates, and gradually remove restrictions on access to foreign exchange;
(ii) continue fiscal consolidation and tighten further monetary policy to contain inflation; and
(iii) develop the country’s infrastructure and human capital; this requires stepped-up efforts by the
authorities to secure debt relief to reduce the unsustainably high external debt burden and unlock
concessional foreign financing; (iv) undertake structural reforms aimed at removing structural
impediments, and strengthening institutions to create a supportive business environment; and
(v) gradually build up reserves to provide sufficient buffers against shocks.

SUDAN
INTERNATIONAL MONETARY FUND 43
Annex II. Sources of Growth in Sudan
1. Agriculture has the potential for significant inclusive growth. This sector has, since at
least 1980, carried promise of becoming a bread basket of the Arab world. However challenging
climatic conditions, low productivity and developmental neglect have kept that promise unfulfilled
so far.
2. Agriculture supports nearly 70 percent of the population and accounts for about
27 percent of GDP. That share declined from the high of 47 percent in 1996 before the advent of
oil in 1998. Since then, agriculture also lost its position as a prime exporting sector. However, this
trend has reversed since the secession of South Sudan. Agriculture exports were 18 percent of
exports in 2012 and 39 percent in 2013—nearly as much as oil. They more than doubled within one
year, owing to exchange rate depreciation and increasing export orientation of agriculture. Sudan’s
trade partners highly value Sudan’s agricultural products. One of these, gum Arabic, Sudan
dominates the world market.
3. The authorities plan to turn agriculture into the growth engine. The regional economies
are showing interest in agriculture and imports of its products. Staff expects, as economic reforms
take hold, agricultural exports will dominate Sudan’s exports.
4. Agriculture can lead economic growth provided a number of reforms are
implemented. The World Bank has identified necessary reforms and policy actions comprising
infrastructure investments, improving access to agricultural inputs, making agricultural markets
more efficient, eliminating fees and taxes not related to services provided by the state, and
improved extension services.1
5. Agricultural sector reforms should improve economy-wide productivity and growth.
According to the IMF research, agricultural reforms are associated with higher productivity growth
and higher manufacturing sector productivity that can yield economy-wide productivity gains,
including by facilitating structural transformation.2
6. Gum Arabic production is a sector within agriculture with significant potential to
deliver inclusive growth. An estimated five million people are directly involved in the gum
1 World Bank, Diagnostic Trade Integration Study, 2008 and 2014. 2 See “Anchoring Growth: The Importance of Productivity-Enhancing Reforms in Emerging Market and Developing Economies,” Staff Discussion Note 13/8.

SUDAN
44 INTERNATIONAL MONETARY FUND
procurement and utilization of the gum trees. The gum Arabic “belt”—an area of half a million
square kilometers where gum trees are growing—extends from the border of Sudan with Ethiopia to
its border with Chad and Central African Republic. The gum is exempt from the U.S. sanctions, is
widely exported, and used in food, chemical, pharmaceutical, and other industries.
7. Recent reforms in the gum sector have increased production and exports, and lifted
incomes of gum producers. The reforms have been supported by the World Bank and International
Fund for Agricultural Development.3 The production increased from 20,000 tons in 2009-10 to
88,000 tons in 2013-14. Further increases are expected as the reforms continue. The producers’ take
of the gum price has increased from 15 percent to 50 percent improving livelihood and providing
incentives for responsible production.
8. Gold mining is another sector with considerable potential. Sudan is rich in mineral
resources, and exports of gold have grown rapidly
since the late 2000s. In 2011, gold exports were
13 percent of total exports, in 2012 for
42 percent, and in 2013 for 36 percent. Reliable
data on gold production are not available, but
judging by export volumes Sudan could be the
15th largest gold producer in the world and the
third largest in Africa (Table 1). Anecdotal
evidence suggests that significant amounts of
gold are smuggled out of Sudan.
9. Gold mining is dominated by artisanal
miners. Most artisanal operations are in the North where surface deposits are located. Those are
becoming progressively depleted leading to rising operation costs. The authorities estimate that
close to one million workers (about 11 percent of total employment) are in gold mining. The
authorities are planning to provide extension services to them to improve the safety of operations
and legalize them.
10. The government is attracting foreign companies to invest in gold mining. It had
awarded 127 concessions of which 10 have started production. The oldest mining operation in
Sudan since 1991 is operated by Sudan’s Ariab Mining Company with La Mancha Resources Inc. of
3See “Revitalizing the Sudan Gum Arabic Production and Marketing Project”: http://www.worldbank.org/projects/P110588/revitilizing-sudan-gum-arabic-production-marketing?lang=en .
2011 2012 2013
Sudan 1/ 30 46 25
Chile 45 50 55Indonesia 96 59 60Papua New Guinea 66 53 62Brazil 62 65 75
Ghana 80 87 85
Uzbekistan 91 93 93Mexico 84 97 100Canada 97 104 120
South Africa 181 160 145
Peru 164 161 150Russia 200 218 220United States 234 235 227Australia 258 250 255China 362 403 420
Other countries 610 655 700
World total 2,660 2,690 2,770
Source: USGS and Sudan's authorities.1/ Reported exports. Data on production are not available.
(in tons)
Table 1. Gold: Sudan and top producers in the world

SUDAN
INTERNATIONAL MONETARY FUND 45
Canada. Interest in gold mining in Sudan is shown by Egypt, South Africa, Saudi Arabia, UK, Russia,
and China. The government plans to develop gold mining as a part of the broader development
mineral sector. They are also focusing on associated minerals and on processing the extracted
minerals to higher value-added products. At end-2012 they opened the first gold refinery with a
capacity of 150 tons per year.
11. Reliance on gold mining for development is not free from challenges. The most obvious
ones are owing to fluctuations of the world price of gold (Table 2). Prices for Sudan’s gold exports
have been lower than the indicated world price (GAS price in Table 2) and exports have fluctuated in
response to changing prices. In 2013, when,
reportedly, the lack of confidence in gold as
an investment resulted in a price decrease,
Sudan experienced what the local press
referred to as a gold recession. Development
needs of the sector are another set of
challenges. Infrastructure investments,
improved business environment, and proper
regulations are required. The government is
concerned about environmental damage
owing to artisanal miners’ usage of mercury
for gold smelting. Also, there have been
increased tensions and fighting for control of
the mines. If gold mining becomes a catalyst
of armed conflict and human rights abuses,
this could possibly disrupt its exports and deal a blow to Sudan’s development prospects.
12. Total factor productivity (TFP) is likely to become a major source of growth in Sudan
owing to structural changes in the economy and the sudden stop of reliance on oil after the
secession of South Sudan. Although these changes had a negative influence on the economy, they
are also removing many of the constraints that hampered TFP growth. It will take some time for the
supply of inputs to respond to new price structures and new opportunities, especially given the risks
still facing the economy. Nevertheless the productivity improvements can happen much faster.
13. Labor and capital will need to contribute to growth to assure that it is balanced and
sustainable. Human capital had historically grown at about 1 percent per annum. Removal of
constraints on the economy would likely increase growth rate of human capital. Similarly, capital
services are likely to increase assuring sustainable, inclusive economic growth and poverty reduction.
Q1 Q2 Q3 Q4 Year
Volume 6,090 5,987 8,713 9,087 29,877Value 247 286 445 464 1,442Price
per kg 40,538 47,702 51,080 51,080 48,254per oz 1,149 1,352 1,448 1,448 1,368
GAS price per oz 1,384 1,504 1,700 1,685 1,569
Volume 14,093 14,525 7,536 9,979 46,133Value 644 647 365 502 2,158Price
per kg 45,693 44,543 48,413 50,328 46,778per oz 1,295 1,263 1,372 1,427 1,326
GAS price per oz 1,691 1,611 1,655 1,719 1,669
Volume 8,000 6,715 4,657 5,440 24,813Value 346 303 194 206 1,048Price
per kg 43,199 45,093 41,752 37,789 42,254per oz 1,225 1,278 1,184 1,071 1,198
GAS price per oz 1,631 1,414 1,328 1,272 1,411
Source: Sudanese authorities and staff calculations; GAS= IMF Global Assumptions Database.
Table 2. Gold Exports - Volumes, Value, and Implied Prices
(In kg, U.S. dollar millions, and U.S. dollar per kg and ounce)
2013
2012
2011

SUDAN
46 INTERNATIONAL MONETARY FUND
Appendix I. Letter of Intent
Khartoum, November 21, 2014
Ms. Christine Lagarde Managing Director International Monetary Fund Washington, D.C. 20431
Dear Ms. Lagarde,
We appreciate the support received from the International Monetary Fund (IMF) through the Staff-Monitored Program (SMP), on which we embarked to achieve our dual objective of addressing the macroeconomic imbalances created by the secession of South Sudan and advancing our reform program in a challenging domestic and external environment, while at the same time garnering international support for debt relief. This letter updates our March and June 2014 Letters of Intent and Memorandums of Economic and Financial Policies (MEFP), which remain valid, and revises the technical memorandum of understanding (attached) to reflect the recent agreement with oil companies in South Sudan.
We have met all the end-June quantitative benchmarks and targets set for the second review of the SMP, except the indicative target on reserve money growth which was missed but will be achieved by year-end through corrective measures described below. We have also made good progress on structural conditionality by advancing implementation of the reforms agreed under the program, most notably in the areas of revenue administration, public financial management, and anti-money laundering and combating the financing of terrorism (AML/CFT).
The tangible benefits of the program are already evident, most notably in continued economic recovery and greater fiscal stability, although we need to continue our efforts to bring inflation down. We consider these results evidence of a track record of macroeconomic performance and policy implementation required to obtain debt relief, which remains an utmost priority for us.
Economic growth continues broadly as expected, performance in gold extraction has been very good, and we expect a bountiful harvest thanks to ample and timely rains. Twelve-month inflation has begun to decline from 46 percent in August to 39 percent in September, and this is expected to continue as the impact of the one-off effect of last year’s energy price hikes, the exogenous events that led to the depreciation of the curb market exchange rate in the first half of the year, and seasonal factors begin to dissipate. The depreciation pressures in the curb market have eased and the gap with the official exchange rate declined from 65 percent in August to 47 percent in mid-November. Reserve money grew by 8 percent over the first six months of the year, exceeding the 6.2 percent target for June. Gross international reserves increased to US$1.6 billion and net international reserves exceeded the June target. Fiscal performance in the first half of the year was strong: with revenue rising by more than 60 percent relative to the same period last year and

SUDAN
INTERNATIONAL MONETARY FUND 47
expenditure in line with targets, the budget deficit dropped to 0.4 percent of GDP (against 1.2 percent last year). In parallel, the central bank’s net credit to the government declined over the first six months of the year.
Much remains to be done, though, and in the months ahead we will build on the progress already achieved. With this in mind, we have reached an understanding with the IMF staff on a revised macroeconomic framework for the remainder of 2014 and the medium term, updated quantitative benchmarks and indicative targets for end-December 2014, and re-phased the structural benchmark on the restructuring plan for the Ommdurman Bank, as the preparation of the plan will take longer than previously envisaged (Tables 1 and 2).
We remain committed to implementing the agreed policy mix aimed at achieving macroeconomic stability. We will: (i) continue fiscal consolidation through revenue enhancement and fiscal retrenchment, while broadening social protection and allocating more resources to productive projects; (ii) continue our tight monetary policy stance and improve the monetary transmission mechanism; iii) address external imbalances by assuring greater exchange rate flexibility through a managed-float exchange rate system; and (iv) enhance the capacity of the financial public sector.
Our macroeconomic objectives for 2014 remain broadly in line with the first review projections. We expect non-oil real GDP to grow by 2.9 percent as a result of a rebound in agriculture, gold extraction, continued good performance in manufacturing, robust export performance, and productivity gains as reforms take hold. We are committed to: (i) bringing inflation down to about 30 percent by year-end, reflecting the combined effects of fiscal consolidation and further monetary policy tightening, as well as the dissipation of the base effect from last year’s energy price adjustments; (ii) limiting the overall fiscal deficit to 1.0 percent of GDP, reflecting improved revenue collection and contained spending; and (iii) narrowing the current account deficit to 6½ percent of GDP, reflecting improved exchange rate flexibility.
Owing to our adjustment efforts, the medium-term outlook remains favorable despite being weighed by the difficult domestic and external environment, the absence of significant foreign financing, the unsustainable debt burden, and the adverse impact of sanctions on the domestic economy, cross-border transactions, and foreign investment. The outlook has been further clouded by the widespread negative effect of the sanctions against an international commercial bank involved in transactions with Sudan, which are taking a heavy toll on our economy and, ultimately, on the poor.
Fiscal adjustment remains the cornerstone of the program. On the revenue side, we are pressing ahead with the implementation of the revenue-enhancing measures outlined in the March and June MEFPs. In particular, progress is underway to rationalize tax exemptions, strengthen taxpayer compliance, and advance a framework that uses risk-based audit and non-audit interventions. The committee on tax and customs reform has advanced its work; its report was finalized by October and its recommendations will be incorporated in the 2015 budget. On the expenditure side, we continue to be committed to the SMP targets for the year despite some overruns on goods and services and on fuel subsidies due to exceptionally warm weather, and we are strengthening public

SUDAN
48 INTERNATIONAL MONETARY FUND
financial management as outlined in the March and June MEFPs. We are containing the wage bill and ensuring improvements in operations of the state-owned oil company and the electricity sector. We have extended the GFSM 2001-compatible classification to the six remaining states, and have closed all central government accounts in commercial banks except in areas with no Central Bank of Sudan (CBOS) branches.
We will further tighten our monetary policy stance to keep inflationary pressures in check. In this context, we will maintain our reserve money growth target of 14.7 percent for the year, despite the overshooting in the first half of the year, and will limit monetary financing of the fiscal deficit to 0.4 percent of GDP. To achieve this, we will reduce the injection of liquidity in the economy as we will contain domestic gold purchases at the curb market rate, even though gold exports constitute an important source of foreign exchange. At the same time, we will continue to strengthen the central bank’s independence and improve the transmission mechanism of monetary policy by: (i) improving the coordination between monetary and fiscal policies; (ii) promoting an interbank market for commercial banks; (iii) expanding the open market operations to provide commercial banks with the opportunity to recycle unused cash balances; and (iv) relaxing restrictions on commercial banks’ holdings of government and central bank securities to help develop a market for such securities and reduce excess liquidity.
To improve the operation of the banking sector, we are working to implement best practices in bank supervision, inspection and enforcement; update the risk-based manuals for offsite and onsite supervision; limit the direct ownership of banks by CBOS; and upgrade the legal, regulatory, and institutional framework of the sector. We will finalize a plan to restructure Omdurman National Bank in line with the recommendations of the independent audit by December 2014. To strengthen our governance framework, we have enacted an amended AML/CFT law.
A continuation of the tight monetary policy stance, lower fiscal deficits, and enhanced exchange rate flexibility should reduce the gap between the official and curb market exchange rates. The persistent gap between those two rates reflects insufficient foreign exchange supply and limited exchange rate flexibility, together with absence of international financial support. We fully recognize the urgent need to reduce this gap, and have introduced measures to enhance flexibility in foreign exchange transactions. Specifically, commercial banks and foreign exchange bureaus have been allowed to set the exchange rate freely within the trading bands of the managed float regime, while exporters have been allowed to sell their proceeds to any importer at an agreed price. From end-June, we have begun a gradual adjustment of the indicative rate with a view to achieving convergence between the official and the curb market rates. As part of our commitment to enhance flexibility, we adjusted the official exchange rate by 3 percent to narrow the gap between the two rates. This will be followed by regular adjustments as needed, depending on market developments to preserve our limited foreign exchange reserves and the economy’s competitiveness.
We remain committed to improving the business environment, strengthening our social policies, and upgrading debt management. The reform agenda will continue to focus on lowering the cost of doing business in order to attract increased domestic and foreign investment. We are also taking action to improve transparency and governance. We will continue our efforts to improve the human

SUDAN
INTERNATIONAL MONETARY FUND 49
capital and reduce poverty within the framework of the I-PRSP, and we will finalize a full PRSP with support from external donors. Specifically, in addition to increased assistance to the most needy, we are also allocating more funds to basic social spending, which has already increased in line with targets.
Resolving the unsustainable debt burden remains the government’s utmost priority. In this regard, we are profoundly disappointed that none of our efforts have been matched by the creditors or the international community so far. Indeed, we have satisfied key technical requirements, including a long track record of economic performance that spans 13 successful SMPs, finalized our I-PRSP, and reconciled our external debt records with creditors. We urge creditors, donors, and the international community to recognize our efforts and commitment, as evidenced by our track record of performance under the current and past SMPs, and to take concrete and positive action towards awarding debt relief on an equal footing with other countries. In the meantime, we are committed to: (i) minimizing non-concessional borrowing, and to borrowing on as concessional terms as possible; and (ii) continuing to make regular quarterly payments to the IMF totaling at least US$10 million in 2014, and further increasing them if Sudan’s payment capacity improves.
The deadline under the “zero option” elapsed in September 2014, and according to the agreement, the external debt would have been apportioned between Sudan and South Sudan since creditors, donors, and international community have not provided firm commitments to deliver debt relief. This failure by the international community to move toward granting debt relief has come at great socio-economic cost to Sudan, and has stifled our attempts to spur economic growth and reduce poverty. Nevertheless, in light of recent events in South Sudan and in order to give time to the Tripartite Committee (Sudan/South Sudan/African Union) to carry out its outreach strategy, the parties have agreed to extend this deadline to September 2015. Moreover, we intend to: (i) continue our technical work; (ii) step up, through the Tripartite Committee, our joint outreach efforts towards the international community to secure debt relief; and (iii) supplement the joint outreach with bilateral outreach to intensify the process, while reporting all efforts in this regard to the Tripartite Committee.
The government of Sudan is committed to a comprehensive national dialogue to achieve sustainable peace in Sudan, as envisaged in the agreement signed in Addis Ababa on September 4 under the auspices of the African Union High-level Implementation Panel.
We believe that the policies set forth herein and in the above-mentioned MEFPs are sufficient to achieve the objectives of our program, and we stand ready to take any additional measures that may become necessary for this purpose. We will consult with Fund staff in advance of any revision of the policies described here and in the March and June MEFPs, in accordance with the Fund’s policies. We will remain in close contact with Fund staff and provide timely information required for monitoring economic developments and implementation of policies under the SMP.
We authorize the IMF to publish this letter and the policy documents related to this second review under the SMP.

SUDAN
50 INTERNATIONAL MONETARY FUND
Sincerely yours,
/s/ /s/
BadrEldein Mahmoud Abbas Abdelrahman Hassan Abdelrahman Hashim Minister of Finance and National Economy Governor, Central Bank of Sudan

SUDAN
INTERNATIONAL MONETARY FUND 51
2013
DecemberSMP
request Adj. Actual 1st Review Adj. Actual 1st Review ActualRevised Program
Quantitative Benchmarks
Domestic financing of the central government (ceiling; in SDG million) 2/ 5,596 1,059 1,149 -220 1,199 1,198 579 2,518 … 3,868CBOS net credit to the central government (ceiling; in SDG million) 13,503 14,249 14,249 13,140 13,690 13,690 13,131 13,988 … 15,249CBOS net domestic assets (ceiling; in SDG million) 3/ 51,699 53,297 53,297 53,341 38,206 38,206 38,205 39,269 … 41,562Net international reserves (floor; in millions of U.S. dollars) 2/ 355 405 390 267 307 307 374 377 … 445
Contracting or guaranteeing of external long term nonconcessional debt by the government or the central bank (ceiling, in millions of U.S. dollars) 4/
600 600 600 47 600 600 147 600 147 600
Central government budget domestic expenditure arrears accumulation (ceiling, in SDG million)
0 0 0 0 0 0 0 0 … 0
Payments to the Fund (in millions of U.S. dollars) 6 2.5 2.5 2.5 5.0 5.0 5.0 7.5 7.5 10.0
Indicative Targets
Tax revenue (floor; in SDG million) 19,427 5,295 5,295 5,746 11,562 11,562 11,891 18,173 … 26,676Social spending (floor; in SDG million) 580 500 500 296 688 688 695 1,080 … 2,000Reserve money (ceiling; change in percent) 3/ 20.3 6.0 6.0 3.2 6.2 6.2 8.0 9.0 … 14.7Nonoil primary deficit (ceiling; in SDG million) 2/ 8,377 1,743 1,743 1,930 4,122 4,121 3,462 6,172 … 6,496
1/ Cumulative from the beginning of the year.
4/ Continuous benchmark.
Table 1. Quantitative Targets, 2013-14
3/ Calculated using program exchange rate. The definition of NDA has been revised for end-June target and onwards; see Technical Memorandum of Understanding (Attachment II). March 2014 NDA is SDG37,091 million under the revised definition.
2014 1/
DecemberMarch
2/ Subject to an adjustor to take account of oil-related fees and TFA from carrying crude oil of the RSS being different than assumed in the program.
June September

SUDAN
52 INTERNATIONAL MONETARY FUND
Benchmarks Target Date Macroeconomic Rationale Status
Prior Actions for Request of SMP1. Adopt a 2014 budget in line with SMP. Support fiscal consolidation. Met.2. Unify the CBOS exchange rates. Eliminate distortions in the foreign exchange market
and ensure flexibility going forward. Met.
Structural Measures
Tax policy1. Reduce VAT exemptions. Jun. 2014 Boost tax revenue The report of the Review by Tax and Customs Committee was finalized in October.
Revenue administration2. Complete and adopt the manual for risk-based audit and non-audit interventions. Sep. 2014 Enhance VAT and income tax productivity. Audit manual is distributed to the departments in June. Training on the manual started in
September.
3. Strengthen the penalty procedures for non-compliant tax payers. Quarterly Enhance tax administration. The report of the Review by Tax and Customs Committee was finalized in October.
Expenditure policy4. Develop, with Fund TA, a flexible fuel pricing mechanism. Dec. 2014 Improve the efficiency and targeting of current
spending.Authorities are reviewing the March 2014 TA report.
Public financial management5. Extend the GFSM 2001 compatible economic classification to the six remaining states, and monitor the quality and consistency of classification applied at the state level.
Sep. 2014 Improve budget classification and fiscal reporting. Met.
6. Develop a medium-term fiscal framework (MTFF) that provides three-year aggregate fiscal targets and projections of revenue and expenditure by main economic categories.
Dec. 2014 Enhance budget planning and preparation. Designing MTFF is in progress with TA from METAC in August 2014
7. Close all central government accounts in commercial banks (except in areas with no CBOS branch). Jun. 2014 Improve cash management. Met.
Financial sector8. Prepare a time-bound restructuring plan for Omdurman Bank in line with the recommendations of the independent audit.
Dec. 2014 Reduce risks stemming from the financial sector.
Under preparation.
AML/CFT9. Enact the amended AML/CFT Law based on the recommendations of the December 2013 IMF Technical Assistance on AML/CFT.
Sep. 2014 Support anti-corruption efforts, improve financial sector stability and integration into the global financial system. Met.
Table 2: Prior Actions and Structural Measures Under the 2014 SMP

SUDAN
INTERNATIONAL MONETARY FUND 53
Attachment I. Technical Memorandum of Understanding
1. This technical memorandum of understanding (TMU) sets out the framework for monitoring
the performance of Sudan under the 2014 Staff-Monitored Program (SMP). It specifies the
quantitative benchmarks, indicative targets, and structural benchmarks on the basis of which the
implementation of the SMP will be monitored. In addition, the TMU establishes the terms and
timeframe for transmitting the data that will enable Fund staff to assess program implementation
and performance.
2. The SMP relies on seven quarterly quantitative benchmarks and four indicative targets for
end-March 2014, end-June 2014, end-September 2014, and end-December 2014.
3. The quantitative benchmarks are:
(i) Ceiling on domestic financing of the central government;
(ii) Ceiling on the CBOS net credit to the central government;
(iii) Ceiling on net domestic assets of the central bank;
(iv) Floor for the buildup of net international reserves of the CBOS;
(v) Ceiling on new nonconcessional external loans contracted or guaranteed by the government or the central bank;
(vi) Ceiling on central government budget expenditure arrears; and
(vii) Floor for payments to the Fund.
4. The indicative targets are:
(i) Floor for tax revenue;
(ii) Ceiling on reserve money growth;
(iii) Floor for social spending; and
(iv) Ceiling on non-oil primary deficit.
5. Some of these targets are subject to adjustors. The definitions of these variables and the
adjustors are set out below. All the quantitative benchmarks and structural benchmarks are
displayed in Tables 1 and 2 of the MEFP.
Definitions
6. Central Bank of Sudan (CBOS) net domestic assets (NDA) are defined as reserve money
minus CBOS net foreign assets (NFA), minus revaluation accounts. CBOS Net foreign assets (NFA)

SUDAN
54 INTERNATIONAL MONETARY FUND
are defined as foreign assets minus foreign liabilities. Foreign assets comprised of active accounts
and other foreign assets of the CBOS. Foreign liabilities comprised of the following items: CBOS use
of Fund credit, overdue Fund charges, liabilities to other international organizations, short-term
liabilities, and other foreign liabilities. Revaluation accounts are as noted in the balance sheet of the
CBOS.
7. CBOS net credit to the central government (NCG) is defined as CBOS credit to the central
government minus total central government deposits. Central government deposits include all
accounts of line ministries and agencies controlled by the government;
8. CBOS credit to the central government includes temporary advance, plus CBOS’s acquisition
of Government Musharaka Certificates (GMCs) and Government Investment Certificates (GICs), plus
CBOS long-term claims on the central government;
The central government comprises all accounts of line ministries and agencies controlled by the
government (corresponding to Group no. 11, Group no. 12, and some accounts of the Group
no. 19 in the CBOS general ledger), the Zakat funds (recorded under Group no. 13), and margin
deposits placed with the CBOS by the central government against letters of credit issued by the
CBOS. The definition includes all oil-related accounts controlled by the government (e.g., OSA).
9. Net international reserves (NIR) are total gross official foreign reserve assets on active
accounts minus official short-term liabilities. The gross reserve assets include assets maintained on
accounts with overseas correspondent banks, foreign exchange banknotes in the vaults of the
central bank, monetary gold, and SDR holdings. Short-term liabilities include the foreign liabilities,
net of barter and payment agreements and non residents’ time liabilities, as reported in the balance
sheet of the CBOS. 1
10. To evaluate program targets, the guinea equivalent values of foreign exchange denominated
items in the balance sheet of the CBOS will be calculated at the program exchange rate of SDG
5.672 per U.S. dollar, and SDG 8.708 per SDR. For currencies other than SDR and U.S. dollar, cross
program exchange rates against the U.S. dollar will be fixed as of end-March 2014.
11. Domestic financing of the central government is defined as total net domestic borrowing by
the central government, including net borrowing from the banking system (including GMCs and
GICs), net sales of GMCs and GICs outside the banking system, promissory notes (i.e., standing
1 These liabilities are related to government debts dating back to the 1970s and 1980s and that were not repaid.

SUDAN
INTERNATIONAL MONETARY FUND 55
orders, letters of guarantees,2 sanadats, etc.), revenues from privatization (net of new acquisition of
financial assets), revenues from leasing, buildup of domestic government arrears, and drawdown in
government cash deposits at the CBOS.
12. Non-oil primary fiscal balance of the central government (NOPB) is defined as non-oil
revenues3 minus non-oil expenditures 4excluding net interest payments (interest payments minus
interest receipts) cumulatively since the beginning of the calendar year.
The floor on the NOPB set in Table 1 will be lowered by the excess in project loans or budget
loans relative to program assumptions. The floor on the NOPB set in Table 1 will be raised by the
shortfall in project loans relative to program assumptions.
13. Debt is defined for program purposes in accordance with Executive Board Decision
No. 12274, Point 9, as revised on August 31, 2009 (Decision No. 14416-(09/91)).
For the purpose of this guideline, the term “debt” will be understood to mean a current, i.e., not
contingent, liability, created under a contractual arrangement through the provision of value in
the form of assets (including currency) or services, and which requires the obligor to make one
or more payments in the form of assets (including currency) or services, at some future point(s)
in time; these payments will discharge the principal and/or interest liabilities incurred under the
contract. Debts can take a number of forms, the primary ones being as follows:
(i) Loans, i.e., advances of money to the obligor by the lender made on the basis of an undertaking that the obligor will repay the funds in the future (including deposits, bonds, debentures, commercial loans and buyers’ credits) and temporary exchanges of assets that are equivalent to fully collateralized loans under which the obligor is required to repay the funds, and usually pay interest, by repurchasing the collateral from the buyer in the future (such as repurchase agreements and official swap arrangements);
2 These guaranties are issued by the government to finance capital and current spending and may, in some instances, be countersigned by the CBOS. 3 Oil revenue include royalties, oil income taxes, oil-related profit transfers, income from state equity in the oil sector (including national oil company dividends), oil export taxes, receipts from granting exploration rights, and signature bonuses. 4 Oil expenditures include government investment in the oil sector and any associated recurrent spending, other current oil spending, and transfers to national oil companies.

SUDAN
56 INTERNATIONAL MONETARY FUND
(ii) Suppliers’ credits, i.e., contracts where the supplier permits the obligor to defer payments until sometime after the date on which the goods are delivered or services are provided; and
(iii) Leases, i.e., arrangements under which property is provided which the lessee has the right to use for one or more specified period(s) of time that are usually shorter than the total expected service life of the property, while the lessee or retains the title to the property. For the purpose of the guideline, the debt is the present value (at the inception of the lease) of all lease payments expected to be made during the period of the agreement excluding those payments that cover the operation, repair or maintenance of the property.
Under the definition of debt set out in point (a) above, arrears, penalties, and judicially awarded
damages arising from the failure to make payment under a contractual obligation that
constitutes debt are debt. Failure to make payment on an obligation that is not considered debt
under this definition (e.g., payment on delivery) will not give rise to debt.
14. A non-concessional external debt ceiling applies to the contracting and guaranteeing by the
public sector of new nonconcessional borrowing debt with nonresidents with original maturities of
one year or more. The ceiling applies to debt and commitments contracted or guaranteed for which
value has not yet been received. This applies to private debt for which official guarantees have been
extended and which, therefore, constitute a contingent liability of the public sector.
The public sector comprises the central government, the central bank, nonfinancial public
enterprises (enterprises and agencies in which the government holds a controlling stake—
typically owns more than 50 percent of the shares, but which are not consolidated in the budget,
and other official sector entities.
For program purposes, the guarantee of a debt arises from any explicit legal obligation of the
public sector to service a debt in the event of nonpayment by the debtor (involving payments in
cash or in kind), or from any implicit legal or contractual obligation of the public sector to
finance partially or in full any a shortfall incurred by the debtor.
15. For program purposes, a debt is concessional if it includes a grant element of at least
35 percent, calculated as follows: the grant element of a debt is the difference between the present
value (PV) of debt and its nominal value, expressed as a percentage of the nominal value of the
debt. The PV of debt at the time of its contracting is calculated by discounting the future stream of
payments of debt service due on this debt. The degree of concessionality of debt will be calculated

SUDAN
INTERNATIONAL MONETARY FUND 57
using 5 percent discount rate. The concessionality calculator is available via the Internet at
www.imf.org.
16. Central government budget expenditure arrears are defined as budgeted central
government payments to residents determined by contractual obligations that remain unpaid
90 days after the due date. Under this definition, the due date refers to the date in which domestic
debt payments are due according to the relevant contractual agreement, taking into account any
contractual grace periods.
17. Broad money is defined as the sum of local currency circulating outside of the banks, banks’
demand, and time and savings deposits. It also includes transferable deposits and margin deposits
against letters of credit placed by state and local governments, nonfinancial public enterprises, and
the nonbank private sector with the CBOS.
18. Reserve money is defined as the sum of local currency circulating outside of the banks, total
reserves (required and excess) for banks, and deposits at the CBOS included in broad money.
19. The program sets a floor on priority social spending of the central government. For the
purpose of the program, priority social spending of the government is defined as the central
government’s spending on social benefits program that includes cash transfer, spending on health
insurance, on primary health care, and students support.
20. Transitional financial arrangement (TFA) is defined as in the September 2012 agreement
between Sudan and South Sudan and consists of financial transfers paid by the government of
South Sudan and totaling $3.028 billion. These payments are expressed in per barrel terms
($15/barrel), based on South Sudan’s projection of an average of 152,000 barrels/day of oil
production. If production is higher, payments will be made at the agreed rate until cumulative
payments reach $3.028 billion.
21. Oil transit fees from South Sudan government are defined in the September 2012
agreement as the fees paid by South Sudan government for exporting its oil using Sudan’s pipeline
and oil infrastructure. These fees (i) average $9.1/barrel, of which only $6.9/barrel accrue to the
government (including government’s share in the pipelines and processing facilities) and the rest to
oil companies; and (ii) will apply for the whole 3½ year period and will be renegotiated thereafter.
22. Oil transit fees from oil companies are defined as the government’s share in the fees paid by
oil companies operating in South Sudan for exporting their oil using Sudan’s pipeline and oil
infrastructure.

SUDAN
58 INTERNATIONAL MONETARY FUND
Adjustors
23. An adjustor will be applied for the oil transit fees from South Sudan government and oil
companies and TFA accrued from carrying crude oil from South Sudan. The gross programmed
government revenue is based on the program’s assumptions about oil transit fees and TFA from
South Sudan. Accrued revenue is the cumulative government revenue inflows based on actual
shipments at current international prices (f.o.b. Port Sudan).5 The local currency equivalent of the
dollar difference between the programmed and accrued oil transit fees and TFA, needed to calculate
the adjustor, will be obtained by multiplying the dollar difference by the average of the monthly
exchange rates prevailing during the period in question.
The programmed value for the oil transit fees and the TFA are as shown in the Table below.
2014 Q1 Q2 Q3 Q4
Actual Actual Program Program(in USD millions, cumulative from beginning of the year)
Oil transit fees from South Sudan government and oil companies
73.0 151.9 247.5 343.1
TFA 114.0 237.2 348.6 460.0Total (oil transit fees + TFA) 187.0 389.1 596.1 803.0
The adjustor will work as follows:
If the accrued oil transit fees and TFA falls short of the programmed value, the program targets
on domestic financing of the central government and non-oil primary deficit will be increased by
25 percent of the local currency equivalent of the difference between the accrued and
programmed value. The program target for NIR will be reduced by 25 percent of the difference
between the accrued and programmed value.
If the accrued oil transit fees and TFA exceeds the programmed value, the program targets on
domestic financing of the central government and non-oil primary deficit will be reduced by the
local currency equivalent of the difference between the accrued and programmed value. The
program target for NIR will be increased by the difference between the accrued and
programmed value.
5 As compiled monthly by the Ministry of Finance and National Economy (MOFNE).

SUDAN
INTERNATIONAL MONETARY FUND 59
24. The payments to the IMF are defined as a minimum quarterly payment of US$2,500,000.
Program Monitoring
25. The Sudanese authorities established a program-monitoring committee composed of senior
officials from the Ministry of Finance, the Ministry of Petroleum, the CBOS, and other relevant
agencies. The IMF Resident Representative has an observer status on this committee. The committee
is responsible for monitoring the performance of the program, recommending policy responses,
informing the IMF regularly about the progress of the program, and transmitting the supporting
materials necessary for the evaluation of benchmarks. The committee shall provide the IMF with a
progress report on the program on a monthly basis within four weeks of the end of each month,
using the latest available data.
Data Reporting
26. The following table contains the agreed reporting framework. To the extent possible, the
data will be submitted in both printed and electronic form to the IMF local office.

SUDAN
60 INTERNATIONAL MONETARY FUND
Reporting Agency
Type of Data
Description of Data Frequency Timing (within period specified)
Central Bank of Sudan
CBOS balance sheet
Detailed CBOS balance sheet Monthly 15 days after the end of each month
Monetary survey
Banking system balance sheet and consolidated balance sheet of commercial banks
Monthly 30 days after the end of each month
Cash flow of foreign exchange
Cash flow data of foreign exchange, including sales and purchases by the dealing room at the CBOS
Monthly 1 week after the end of each month
Banking indicators
Capital adequacy; asset composition and quality including non-performing loans; profitability; liquidity; open FX positions; and compliance with prudential norms
Monthly 30 days after the end of each quarter
Balance of payments
Detailed composition (exports, imports volume and values, invisible transactions, quarterly BOP tables).
Quarterly 2 months after the end of each quarter
External debt Contracting or guaranteeing of medium-and long-term external debt of the government, the CBOS, and state owned companies
Quarterly 30 days after the end of each quarter
Disbursements and repayments, (i) scheduled, and (ii) actual interest and principal on debt of the government, the CBOS, and state-owned companies, by creditor
Monthly 30 days after the end of each month
Ministry of Finance and National Economy
Central government operations
Revenues, expenditures, and financing as in GFSM 2001 format
Monthly 30 days after the end of each month
Central government domestic debt
End-month stocks, and monthly issuances and repayments, of all domestic debt instruments: GMCs, GICs, loans and advances from the ban king system, sanadat, letters of guarantee, standing orders, accounts payable (including arrears) and amortization schedule
Monthly 30 days after the end of each month
Social spending
Spending on education, health and training
Monthly 30 days after the end of each month
External support
Disbursement of grants, disbursement and repayment (principal and interest)of loans by donor, breakdown of foreign
Monthly 30 days after the end of each month

SUDAN
INTERNATIONAL MONETARY FUND 61
budget and project grants
Central Bureau of Statistics
CPI Including detailed data and inflation for imported products
Monthly 1 week after the end of each month
Ministry of Finance and National Economy / Ministry of oil
Oil transit fees/TFA, from South Sudan
Shipment data, listing by blend specifying date, quantity, prices, and values in US$ and in guinea
Monthly 30 days after the end of each month
Crude oil Production by block; share of Sudan and foreign partners; prices and values ($ million), investment and production costs by block
Monthly 30 days after the end of each month
Sales to refineries
Sales listing by refineries specifying date, quantity, prices, and values in US$ and in guinea
Monthly 30 days after the end of each month
Refineries Volumes and prices of production, consumption and imports of gasoline, gasoil, fuel oil, jet oil, kerosene, and LPG (see attached template).
Monthly 15 days after the end of each month
Net operating income transfers to the treasury
Net income of SPC (including those derived from exports of petroleum products), see template.
Monthly 15 days after the end of each month

SUDAN STAFF REPORT FOR THE 2014 ARTICLE IV CONSULTATION AND SECOND REVIEW UNDER THE STAFF MONITORED PROGRAM—INFORMATIONAL ANNEX
Prepared By Middle East and Central Asia Department (In Consultation with Other Departments)
RELATIONS WITH THE FUND ____________________________________________________________ 2
RELATIONS WITH THE WORLD BANK ___________________________________________________ 6
RELATIONS WITH THE AFRICAN DEVELOPMENT BANK _______________________________ 9
STATISTICAL ISSUES ____________________________________________________________________ 12
CONTENTS
November 21, 2014

SUDAN
2 INTERNATIONAL MONETARY FUND
RELATIONS WITH THE FUND (As of October 31, 2014)
Membership Status Joined 09/05/1957; Article VIII.
General Resources Account
SDR Million Percent QuotaQuota 169.70 100.00Fund holdings of currency (Exchange Rate) 341.80 201.42Reserve Tranche Position 0.01 0.01
SDR Department
SDR Million Percent QuotaNet cumulative allocation 177.99 100.00Holdings 125.24 70.36
Outstanding Purchases and Loans
SDR Million Percent QuotaStand-by Arrangements 111.28 65.58Trust Fund 59.23 34.90Extended Arrangements 60.81 35.84
Latest Financial Arrangements In millions of SDR, (mm/dd/yyyy)
Type Date of
Arrangement Expiration
Date Amount
ApprovedAmount Drawn
Stand-By 06/25/1984 06/24/1985 90.00 20.00
Projected Payments to Fund (SDR million; based on existing use of resources and present holdings of SDRs)
Overdue Forthcoming 31-Aug-
13 2014 2015 2016 2017 2018 Principal 231.32 Charges/interest 746.37 0.62 2.13 2.13 2.13 2.13 Total 977.69 0.62 2.13 2.13 2.13 2.13

SUDAN
INTERNATIONAL MONETARY FUND 3
Exchange Rate Arrangement
The legal tender is the Sudanese guinea, which replaced the Sudanese dinar in proportion SDG 1=SDD 100 in mid-2007. Sudan has a de jure managed floating and a de facto other managed exchange rate regime. It has two official exchange rates. First, there is the “indicative” rate set by the central bank. Second, there is an “official” rate set by the central bank within ± 4 percent of the indicative exchange rate and applied to government transactions. The difference between the “official” and the “indicative” rates is now less than 2 percent. Commercial banks and foreign exchange bureaus are required to set their rates ± 4 percent of the indicative exchange rate. In practice, commercial banks trade at the upper part of that band.
Sudan maintains the following measures subject to Fund jurisdiction under Article VIII, Sections 2 and 3: 1) An exchange restriction arising from the government's limitations on the availability of foreign exchange and the allocation of foreign exchange to certain priority items; 2) A multiple currency practice and exchange restriction arising from the establishment of an official exchange rate (the CBOS rate) for use in all government exchange transactions which in practice differs by more than 2 percent from the rate used by commercial banks; 3) A multiple currency practice and exchange restriction arising from large spreads between the CBOS rate and the parallel market exchange rate due to the CBOS’ limitation on the availability of foreign exchange which channels current international transactions to the parallel market; 4) An exchange restriction and a multiple currency practice arising from the imposition by the government of a cash margin requirement for most imports.
Sudan is on a 12-month consultation cycle. The last Article IV consultation discussion was concluded by the Executive Board on September 20, 2013.
FSAP Participation
The FSAP work took place during October 9–14, 2004 and was completed during December 1–14, 2004. The Financial System Stability Assessment report was discussed by the Executive Board on April 29, 2005.
Resident Representative
The Fund’s resident representative office in Khartoum was opened in October 2005, as a shared post with Djibouti. It was converted to a full post in September 2006.
Technical Assistance
In January 1995, the Executive Board decided to resume Fund technical assistance to Sudan. The following table contains a summary of the technical assistance provided since 2004. This assistance has been provided both from headquarters and from the IMF’s Middle East Technical Assistance Center (METAC).

SUDAN
4 INTERNATIONAL MONETARY FUND
Sudan: Technical Assistance from the Fund, 2005–14
Subject Type of Mission Timing Counterpart
Fiscal Affairs Department
Revenue administration assessment (including METAC)
Short-term February and October 2005, May and August 2006 , January 2007
Ministry of Finance (MOF)
Expenditure control and management Short-term April 2006 MOF
Restructuring of headquarters (METAC) Short-term November 2007 MOF
Installation of STX (METAC) Short-term March 2008 MOF
Tax and customs administration Short-term August 2006, January 2014 MOF
Cash management and budget classification (GFS) (including METAC)
Short-term February 2004, May and September 2004, June and October 2005, April and October 2006, April, September and November 2007, November 2013
MOF
Public Finance Management Diagnostic Short-term October 2006, June 2007 MOF
Implementing a TSA and improving cash management (including METAC)
Short-term June and July 2008 MOF
Self Assessment and Audit (METAC)
Reorganization of the MOF and Public Finance Management Reforms
Strengthening Tax and Customs Administration
Short-term
Short-term
Short-term
March 2008
January and February 2009
January 2009
MOF
MOF
MOF
Petroleum fiscal regime Short-term October 2010 MOF
Budget management reform Short-term February 2010, June 2012 MOF
Tax payer compliance management Short-term August 2011 MOF
Fuel subsidy reform Short-term April 2012, March 2014 MOF
Tax reform strategy Short-term April 2013 MOF
Budget classification and chart of account
(METAC)
Short-term April and December 2013 MOF
Monetary and Capital Markets Department
Introduction of new national currency Short-term February and April 2005,
January 2006, February and April 2007
Central Bank of Sudan (CBOS)
Monetary management and banking supervision
Short-term March and April 2006 CBOS
Islamic compliant monetary instruments Short-term August 2006, May 2007 CBOS
Monetary policy operations Short-term September 2004, June 2006 CBOS
Banking supervision Short-term August 2005, August, September and December 2006, November 2012, July 2013
CBOS

SUDAN
INTERNATIONAL MONETARY FUND 5
Central bank organization Resident Advisor
September 2005, Feb. 2006-August 2007
CBOS
Microfinance supervision and regulation Short-term December 2005 CBOS
Liquidity management and forecast Short-term March 2006, November 2007 and May 2012
CBOS
Payment systems Short-term November 2007 CBOS
Bank regulation Short-term March and April 2006, May 2007 CBOS
Banking operations Short-term April and July 2006, 2013 CBOS
Banking supervision Short-term August, September and December 2006 CBOS
Implementation of Islamic financial services board standards
Short-term April 2008 CBOS
Currency handling and reform Short-term November 2006 CBOS
Interbank market development Long-term June 2012 CBOS
Credit Bureau/registry/scoring Short-term September and December 2012, June 2013
CBOS
Statistics Department
National accounts, CPI and PPI statistics Short-term
April 2007, August 2014 Central Bureau of Statistics (CBS)
Real sector statistics and CPI statistics (METAC)
Short-term March and September 2007, March 2008, September 2012
CBS
Balance of payments statistics Short-term September 2006, January 2007, July 2012, July and November 2013, August 2014
CBOS
General data dissemination system (GDDS) Short-term June 2006, August and September 2007 CBS, MOF and CBOS
Assessing technical assistance needs in economic statistics (with METAC)
Short-term May-June 2005 CBS, MOF and CBOS
Government Financial Statistics Short-term October 2005, March 2007, July 2008 MOF
Monetary and Financial Statistics Short-term December 2005, June 2006, July 2007, July 2008, October 2012, January 2014
CBOS
SRFs Data Improvement Short-term October 2012 CBS
Multisector Statistics Short-term April/May 2012, January 2013 CBOS,MOF,CBSTAT
Legal Department
AML/CFT legislation Short-term December 2013, March 2014 CBOS
July and October 2014
Payment system law Short-term September 2007 CBOS

SUDAN
6 INTERNATIONAL MONETARY FUND
RELATIONS WITH THE WORLD BANK (As of July 31, 2014) 1. The World Bank’s International Development Association (IDA) has no active lending portfolio in Sudan because of the country’s default on its financial obligations to IDA, which led to the suspension of disbursements in April 1993. After discussions between the World Bank and the Sudanese authorities on the need for Sudan to take steps toward normalizing its relations and establishing a track record with the World Bank, the authorities made small, intermittent debt service payments between mid-1999 and 2008. The amount of payments has not been sufficient to prevent a continued accumulation of arrears, which currently stand at about US$800 million and are growing.
2. The World Bank was a major player in the reconstruction of Sudan following the Addis Ababa peace agreement of 1972, but was mostly absent from Sudan between 1993 and 2002. As the prospects for peace with the South rose in 2003, the World Bank formulated a strategy for a potential reengagement. Following the signing of the Comprehensive Peace Agreement (CPA) on January 9, 2005 by the Government of Sudan and the Sudan People’s Liberation Movement, the World Bank became the administrator for two large Multi-Donor Trust Funds (MDTFs) that support the CPA, and built up its program of non-lending support. Fifteen MDTF partners1 have contributed US$790 million in paid-in funds to the MDTFs. MDTF-supported projects initially experienced implementation challenges, as have all development and recovery programs in Sudan, but performance has steadily improved. Significant results are being seen on the ground, including the successful MDTF-supported launch of the CPA-mandated new national currency and the completion of the 5th Population Census, though daunting challenges remain—most notably low capacity, especially at the state level and in the South. The MDTF closed at the end of 2013.
3. A new World Bank’s Interim Strategy Note (ISN) for Sudan was discussed by the World Bank’s Board in September 2013. The ISN aims to support the Government of Sudan to achieve the overarching goal of shared growth and institutional reform that provides economic opportunities and reduces conflict. The Bank will focus on supporting activities that accelerate growth and expand sources of growth, ensure equitable distribution of resources and access to services, and respond urgently to opportunities to consolidate peace in areas emerging from conflict. The Bank will support Sudan through carefully selected knowledge products and projects financed through partnership funds and structured across two pillars: (1) Manage the Economic Transition, and (2) Address Socio-economic Roots of Conflict.
4. The World Bank presently maintains a portfolio of approximately $120 million in non-lending technical assistance, funded primarily from global trust funds. The portfolio cuts across a 1 Partners having paid in funds to the MDTFs are: Netherlands, Norway, United Kingdom, European Commission, Canada, Sweden, Germany, Finland, Spain, Denmark, Italy, Egypt, Iceland, Greece, and the World Bank. The World Bank contributed (from IBRD surplus) US$5 million to each of the MDTFs.

SUDAN
INTERNATIONAL MONETARY FUND 7
range of important issues consistent with the ISN, including education, agriculture, environmental protection, and peace-building. In April 2014, the World Bank’s Board approved a new Sudan Multi-Partner Fund (SMPF) as a successor to the MDTF. It is expected that this new Fund will have starting capital approximating $10 million; it has proven challenging to mobilize donor support for this new Fund. Governing arrangements will be similar to the MDTF, with the Government of Sudan engaging as a full partner in the Fund’s Oversight Committee. The purpose of the Fund is to support the two pillars of the Bank’s ISN within the context of Sudan’s national development strategy (i.e., the current I-PRSP and forthcoming full PRSP, where the World Bank is leading the dialogue in collaboration with the AfDB).
5. The entry points for World Bank support—through management of the SMPF and other partnership funds as well as non-lending activities—vary according to the diverse conditions facing different regions of Sudan. At the National level, a focus on managing the transition and stabilizing peace entails a major role for analytical work and policy dialogue in support of the I-PRSP which focuses to a large extent on activities to promote economic diversification through a vibrant private sector. In Darfur, the World Bank works with partners, as security allows, to assess development and recovery needs and to prepare rehabilitation and development programs to be implemented as soon as conditions are right.
6. IDA’s financial reengagement requires clearance of Sudan’s outstanding arrears. The clearance of these arrears can only be undertaken once a firm and comprehensive agreement among preferred creditors is in place. Such an agreement would also include significant reductions in bilateral debts, so as to make the total debt service obligations sustainable. Following the eventual clearance of IDA arrears, an exceptional IDA allocation for Sudan as a post-conflict country would be sought, and the World Bank would prepare another strategy document which would include, inter alia, a pipeline of projects. The World Bank, together with the IMF supports the technical preparation of Sudan for a debt relief process through the Technical Working Group on Sudan’s External Debt, which met 8 times between 2011 and 2014 and brings together major bilateral and multilateral creditors of Sudan. In addition, March 2014 saw the Bank deploy a mission of its Debt Reduction Facility (DRF) to engage Sudan on matters related to its commercial debt obligations. The Bank continues to urge Sudan to intensify its outreach to its key creditors.
7. The World Bank has completed a series of major non-lending products since the CPA in 2005, including a National Public Expenditure Review in 2007, a Diagnostic Trade Integration Study (DTIS) in 2008, a Country Economic Memorandum (CEM) in 2009, a Country Integrated Fiduciary Assessment in 2011 and a Sub-National Public Expenditure Review in 2013. Other major sector works include an Investment Climate Assessment in 2010 and Education and Health Status Reports in 2011 and 2012. Major non-lending products planned to be completed and delivered in 2014/15are: A new Country Economic Memorandum focusing on economic diversification, an Update to the 2008 Diagnostic Trade Integration Study, Promoting Private Sector Revitalization in Darfur, a Benchmarking of the Business of Agriculture, and Financial Sector Capacity Building with a focus on financial inclusion.

SUDAN
8 INTERNATIONAL MONETARY FUND
8. To enrich this menu of policy and analytical support, the World Bank will seek to deepen dialogue—and open up space for civil society participation in such dialogue—in areas such as: managing the economic transition; making fiscal decentralization work; promoting economic diversification; and local area development.

SUDAN
INTERNATIONAL MONETARY FUND 9
RELATIONS WITH THE AFRICAN DEVELOPMENT BANK (As of September 18, 2014) Group’s Portfolio and Arrears
1. Since its first intervention in 1971 in Sudan, the Bank Group (AfDB) has approved to date 42 operations amounting to a total net commitment of UA331 million2. The Bank also approved grants for emergency assistance under the Special Relief Fund in 2001, 2003, 2010 and 2013 amounting to a total of US$3.0 million. The most recent is the Public Financial and Economic Management and Capacity Building Project approved in February 2014 financed with US$34.8 million from the Fragile States Facility (FSF). In terms of sector distribution, the portfolio is dominated by agriculture (54%), followed by infrastructure (28.6 %), multi sector (8.9%), finance (6 %) and social sectors (2.5 %).
2. The Bank’s ongoing operations include the Technical Capacity Building for Preparation of Full Poverty Reduction Strategy Paper (TCB PRSP), which was approved in July 2013 for US$2.85 million from Fragile States Facility. Support to PRSP preparation includes replicating the National Baselne Household Survey (NBHHS) by conducting a new household survey. This project will also help set up functioning management and coordination structures that will enhance the full participation of all donors and stakeholders, under the leadership and ownership of the Government. Other ongoing operations include the Darfur Water Project for Conflict Resolution and Peace Building, which was approved in April 2012 and is financed by Euro 3.3 million from the African Water Facility (AWF). This project will rehabilitate and construct water infrastructure in Darfur and demonstrate an integrated approach to water development. Under the Fragile States Facility (FSF), the other ongoing projects include Capacity Enhancement for Debt Management and Resource Mobilization (CEDMRM) approved in May 2012 for UA 1.05 million. The CEDMRM will build institutional and human capacities in Debt Units and other departments in the Ministry of Finance and National Economy (MoFNE), and the Central Bank of Sudan. Sudan has also been able to access competitive Bilateral Trust Fund financing for notable projects including: (i) Economic Diversification and Private Sector Study financed with USD 485,000 aimed at identifying opportunities for private sector contribution to the economy; (ii) Technical Assistance to Mamoun Beheiry Centre approved in August 2012 for US$260,500 which aims to improve the quality of policy analysis and policy dialogue currently in Sudan and (iii) the Capacity Building and Assessment of Options for Increasing Access to Energy in Sudan approved in October 2012 for US$340,500 that intends to identify and map out energy poverty in Sudan. In addition, a grant to support the University of Nyala (Darfur) to undertake a study on Scientific Adaptation of Livestock Breeds to Climate Change was approved in May 2013 for US$497,000.
2 For June 2012, the exchange rate between the Unit of Account (UA) and the US Dollar (USD): UA1 = USD1.51.

SUDAN
10 INTERNATIONAL MONETARY FUND
3. The AfDB has not been able to undertake much needed regular investment activities in the country since 1995 because of arrears. As of end-August 2014, the arrears to the Bank Group stood at UA 207.4 million, of which UA 91.9 million is to the African Development Fund (ADF) window and UA 115.5 to the African Development Bank (ADB).
Sudan: Arrears to the AfDB Group as of 30 June 2013
(Thousands UA) Total Principal Charges
ADF 91,899.85 66,944.23 24,955.62 ADB 115,532.84 52,851.46 62,681.37 Total 207,432.69 119,795.69 87,636.99
Strategy and Programming
4. The Bank has maintained field presence and sustained policy dialogue with the Government of Sudan and Development Partners, especially on arrears clearance and debt relief and PRSP. It has conducted technical assistance and capacity building activities, using grant resources that are not affected by the arrears situation of the country (Fragile State Facility and the Bilateral Trust Funds). Recently, the Bank has also explored the opportunities to finance private sector operations in Sudan. To this end, the Bank has organized a Business Information Seminar on 14th September 2014 to expose the Sudanese private sector to the Bank’s private sector financing opportunities.
5. Given the arrears situation of the country, the Bank has not been preparing Country Strategy Papers for Sudan since 1994. Instead, it has been preparing Country Briefs, as the appropriate programming document. The last Country Brief (CB) was approved in October 2012 covering the period 2012–2014. However, a new CB covering the period 2014-2016 was prepared and will be considered by the Board on 24th September. The new CB is aligned with Sudan’s development priorities as articulated in the National Development Plan (NDP) for 2012-2016 and I-PRSP, as well as with the Bank’s Ten-Year Strategy (2013–2022). In particular, they are fully consistent with the Bank’s Strategy for Engagement in Fragile Situations in Africa 2014-2019, which builds on the Bussan New Deal for Engagement in Fragile States and the recommendations of the High Level Panel on Fragile States. All these documents primarily underscore the building of state capacity through institutional strengthening, and promoting inclusive and equitable growth.
6. Sudan still faces most of the challenges that prevailed when the last Country Brief (2012-2014) was prepared. These challenges include creating the conditions for peace and security, stabilizing the economy, enhancing institutional capacity, addressing weaknesses in PFM and improving overall governance. Since these issues remain relevant in Sudan today, the Bank has maintained these priorities in the new CB 2014-2016. Therefore, the previous focus on policy dialogue, technical assistance, capacity building and targeted operations will be maintained, but consolidated under two Pillars: i) Governance and Accountability; and ii) Skills and Technology. These two Pillars are complementary and mutually reinforcing, as they both seek to assist Sudan acquire the human and institutional capacity required to get out of fragility. In this context, progress

SUDAN
INTERNATIONAL MONETARY FUND 11
was made on a number of issues and initiatives; Sudan has made significant progress in improving the political stalemate with South Sudan, evident in the signing of the Cooperation Agreement in 2012 and the Matrix of Implementation in 2013, which forms a solid framework for permanently resolving post-secession issues. On internal peace, the Doha Document for Peace in Darfur (DDPD) represents a solid milestone which augurs well for stability in Darfur. Finally, the on-going AUHIP-brokered negotiations between the GoS and SPLM-N, as well as the initiation of national dialogue for inclusive political reform, further demonstrate progress towards consolidation of internal peace and security.
7. Furthermore, Sudan has made considerable progress in implementing sound macroeconomic policy reforms, including bold austerity measures in both 2012 and 2013 and monetary policies. This has significantly reduced fiscal deficit, and relatively reduced exchange rate distortions, curbed inflation and stabilized the economy. Openness, transparency and accountability in the use of public resources are now being strongly strengthened by a Bank-financed project on public financial management, approved in December 2013. The country has also achieved nearly all technical milestones for HIPC debt relief as set by the Technical Working Group (TWG) comprising the Bank, WB, IMF and creditors, Sudan and South Sudan, and the AUHIP as facilitator. Notable among these milestones are: i) completion of the I-PRSP adopted in 2012; ii) over 90% reconciliation of external debt in 2012; iii) establishment of debt scenarios in 2012; iv) preparation of an Arrears Clearance and Debt Relief Strategy (ACDRS) in 2013; v) concluding and initiating the implementation of new SMP agreed with the IMF in 2014. The Government will use its debt relief strategy to prepare a coordinated arrears clearance plan for the Bank and the BWIs as soon as it gets positive signals from creditors on HIPC debt relief.

SUDAN
12 INTERNATIONAL MONETARY FUND
STATISTICAL ISSUES (As of September 20, 2014)
Assessment of Data Adequacy for Surveillance
General: Sudan’s current statistical data base appears broadly adequate for surveillance and program monitoring, but needs further improvements, including upgrading the base year, coverage, periodicity and timeliness of national accounts data; improving labor market and direct investment data; and more detailed and comprehensive fiscal accounting. Enhancing the status of the Central Bureau of Statistics (CBS) with the authority and resources to compile and disseminate official statistics and coordinate the national statistical work program is important for further statistical improvements, and should be addressed within the context of the ongoing work in developing a five-year National Strategy for the Development of Statistics (2012-16). Retooling of the CBS’ computing infrastructure should also be accorded high priority.
National accounts: The CBS lacks a comprehensive data collection program, and relies largely on administrative reporting which is not optimal for national accounts compilation. Economic surveys were last conducted in the 1970s and 1980s, and the benchmarks derived from these surveys inform current estimates of value added. The compilation of GDP by activity depends heavily on indirect indicators of growth rates and price indicators that are less appropriate. Informal activities are not covered, and are likely to be significant in areas such as retail trade and construction. Sudan’s national accounts data are based on the System of National Accounts 1968 (SNA 1968), and the base year of the existing GDP constant price series (by activity and by expenditure) is 1981. National accounts statistics are compiled with a lag exceeding three years; and there are no national accounts or industrial production data at sub annual frequencies. On the expenditure side, data are lacking on final consumption by households, investment, and changes in stocks.
The adoption of updated statistical guidelines (SNA 2008), rebasing of the national accounts, and developing procedures to improve the timeliness of GDP estimates should be among the core medium-term objectives of Sudan’s national accounts work program. There is an urgent need to increase funding to the CBS and to rebuild its capacity for conducting household, agricultural and enterprise surveys.
Price statistics: Practices in the production of the Consumer Price Index (CPI) are good. Monthly CPI data (base year=2007) are provided shortly after the end of each month. However, the CBS should begin developing plans for a new household expenditure survey to facilitate weight updates to the existing CPI. The CBS is developing for the first time, a quarterly producer price index (PPI) for manufactured goods. STA’s recent multisector statistics mission (April 2012) conducted a preliminary assessment of the methods and procedures for compiling the PPI; and issues regarding the frame and the sample size were raised with the authorities. The mission also advised on how the base year weights would need to be adjusted to reflect the reduced contributions of oil to the Sudan economy.

SUDAN
INTERNATIONAL MONETARY FUND 13
Government finance statistics: Government finance statistics reported to MCD are broadly adequate for program monitoring, with the main revenue, expenditure, and financing items reported on a monthly basis with a lag of about one and half month. The reported statistics are for the central government only, and do not include the states and publicly owned corporations. Data are submitted using an economic classification and, while the allocation of resources by MOFNE to the various ministries is reported, their actual expenditures are not.
Since STA’s multisector statistics mission (April 2012), there has been a progress in implementing GFS classifications at the level of state governments. However, there has been no progress in all other sub-national governments and extra budgetary funds. The responsibility for GFS compilation and dissemination is assigned to the chamber of account within the MOFNE. There are no comprehensive data reconciliations on government claims on and liabilities to the banking system; and the recording of “arrears securities” is not in line with the GFSM guidelines. The compilation of consolidated GFS for the general government with the objective of producing the statement of government operations should be a key priority.
Monetary and financial statistics (MFS): Sudan has received significant technical assistance to improve the collection, compilation, and dissemination of monetary and financial statistics. STA’s multisector statistics mission (2012) found that all major recommendations made by the previous MFS mission in 2007 have been implemented. STA fielded two MFS missions —one in October 2012 and another one in January 2014—to assist in addressing data issues and improving the account classifications in the standardized report forms. The current coverage of Sudan’s monetary statistics includes the CBOS and 32 commercial banks, which constitute the other depository corporations (ODCs). Due to South Sudan’s secession, the Bank of South Sudan (BOSS) and the conventional banks operating in South Sudan were excluded from the coverage of the CBOS and the ODCs, respectively, beginning with July 2011 data. The revised monthly statistical return has been used by all commercial banks to report data for compiling monetary statistics. However, stronger efforts are needed to improve the consistency in reporting of inter-bank data. Going forward, the CBOS should also develop a work program for collecting and compiling data on insurance corporations and pension funds for inclusion in Sudan’s monetary statistics.
External sector statistics: Daily exchange rate data are posted on the CBOS’ web page with minimal lags. There are several areas for improvement in the external accounts, particularly with regard to direct investment (DI), external debt arrears, remittances, goods and services, capital transfers and oil statistics. The lack of survey data continues to affect the compilation of important balance of payments and IIP items such as DI. The implementation of a DI survey has been delayed due to the lack of financing. Consistency between external sector statistics and monetary and financial statistics needs to be further improved, in particular regarding the recording of reserve assets (ongoing) and the treatment of Fund accounts. Compilation of the data template on international reserves and foreign currency liquidity should be initiated. During the last METAC mission it was clarified that CBOS’s earmarked reserves are not readily available; therefore they are not to be classified as reserve assets. Currently only the SDR holdings, reserve position in the Fund,

SUDAN
14 INTERNATIONAL MONETARY FUND
and foreign currency holdings at CBOS vaults are reserve assets.
STA’s 2012 multisector statistics mission assisted the CBOS in improving the compilation of a number of balance of payments and IIP items. METAC is providing ongoing support to improve the accuracy and consistency of external sector statistics. The CBOS should resubmit BOP and IIP data to STA including significant corrections discussed in the last METAC mission.
Data Standards and Quality
Sudan participates in the General Data Dissemination System (GDDS) since August 2003. GDDS metadata and plans for improvement need to be updated. No data ROSC is available.
Reporting to STA
Annual data reported for the Government Finance Statistics Yearbook cover only budgetary central government up to 1999. No monthly and quarterly fiscal data are reported for the International Financial Statistics (IFS). The reporting of external trade statistics for inclusion in the Direction of Trade Statistics (DOTS) database is done with significant lags. National accounts data are not provided for publication in the IFS. The CBOS has compiled and reported to STA for publication in the IFS, the Standardized Report Forms (SRFs) 1SR for the central bank and 2SR for ODCs. However, timeliness of data reporting and dissemination should be improved. The CBOS also reports to STA, quarterly balance of payments and annual IIP data. As a follow up the STA’s recent multisector statistics mission, the authorities should submit updated GDDS metadata for dissemination on the Dissemination Standards Bulletin Board.

SUDAN
INTERNATIONAL MONETARY FUND 15
Sudan: Table of Common Indicators Required for Surveillance (As of September 30, 2014)
Date of latest
observation
Date
received
Frequency
of Data7Frequency of
Reporting7Frequency of
publication7
Exchange Rates 6/30/2013 6/30/2013 D D D
International Reserve Assets and Reserve
Liabilities of the Monetary Authorities1June 2013 7/7/2013 M M M
Reserve/Base Money July 2014 9/8/2014 M W M/W
Broad Money July 2014 9/8/2014 W W M/W
Central Bank Balance Sheet July 2014 9/8/2014 M M M
Consolidated Balance Sheet of the Banking
System
July 2014 9/8/2014 M M M
Interest Rates2 12/31/05 1/09/06 W M M/W
Consumer Price Index August 2014 9/8/2014 M M M
Revenue, Expenditure, Balance and
Composition of Financing3– General
Government4
2014: Q2 August
2014
M M M
Stocks of Central Government and Central
Government-Guaranteed Debt52014:Q2 August
2014
A A A
External Current Account Balance 2013:Q4 July 2014 Q Q Q
Exports and Imports of Goods and Services 2013:Q4 July 2014 M M M
GDP/GNP 2013 July 2014 A A A
Gross External Debt 2014:Q2 July 2014 I A A
International Investment Position 6 2012 July 2013 A A A
1Includes reserve assets pledged or otherwise encumbered as well as net derivative positions. 2 Both market-based and officially determined, including discount rates, money market rates, rates on treasury bills, notes and bonds. 3 Foreign, domestic bank, and domestic nonbank financing. 4 The general government consists of the central government (budgetary funds, extra budgetary funds, and social security funds) and state and local governments.5 Including currency and maturity composition. 6 Includes external gross financial asset and liability positions vis-à-vis nonresidents. 7 Daily (D); Weekly (W); Monthly (M); Monthly/Weekly (M/W); Bi-monthly (B); Quarterly (Q); Annually (A); Irregular (I); Not Available (NA).

SUDAN STAFF REPORT FOR THE 2014 ARTICLE IV CONSULTATION AND SECOND REVIEW UNDER THE STAFF MONITORED PROGRAM—DEBT SUSTAINABILITY ANALYSIS
This debt sustainability analysis (DSA) confirms that Sudan continues to be in debt distress.1 Both
public and external debt ratios remained high, and most of the external debt is in arrears.
Consistent with the results of past DSAs, Sudan’s debt is assessed to be unsustainable. All
external debt indicators breach their indicative thresholds under the baseline scenario, and many
of them stayed above the thresholds throughout the time horizon of the analysis. It is therefore
critical for Sudan to follow sound economic policies, including a prudent borrowing strategy, and
to continue garnering support for debt relief.
1 [This DSA update was prepared jointly by IMF and World Bank staff under the joint Fund-Bank Low-Income Country (LIC) Debt Sustainability Framework (DSF).] Sudan’s Country Policy and Institutional Assessment (CPIA) Rating averaged 2.34 for 2011-13 and falls under the weak performer category. Sudan’s fiscal year runs from January 1 to December 31.
Approved By Adnan Mazarei and Ranil Salgado (IMF) and John Panzer (IDA)
Prepared by the staffs of the International Monetary Fund (IMF)and the International Development Association (IDA)
November 21, 2014

SUDAN
2 INTERNATIONAL MONETARY FUND
BACKGROUND AND RECENT DEVELOPMENTS 1. Sudan’s economy has yet to recover from the shock of South Sudan’s secession in 2011.Sudan lost three-quarters of oil production, two-thirds of exports, and half of fiscal revenues in the secession. A heavy debt burden, international sanctions, and volatile domestic and regional political environments continue to weigh on economic performance. Growth has been subdued and inflation was high since the secession.
2. Economic performance in the first half of 2014 was mixed. Under a new staff-monitoredprogram (SMP) with the IMF for the year 2014, the authorities have tightened fiscal and monetary policy stances. Government borrowings from the central bank was reduced, reserve money growth slowed (albeit higher than the program target), and international reserves increased marginally. However, inflation remains stubbornly high, affected by past energy price hikes, exchange rate devaluation, and continued supply disruptions due to conflict. There is a large gap between the parallel market rate and the official exchange rate.
3. The “zero-option” and prospects for debt relief. Debt relief prospects are predicated onreaching out to creditors, normalizing relations with international financial institutions, and establishing a track record of cooperation with the IMF on policies and payments. As for the “zero-option”2, the Sudanese authorities have indicated that they have agreed with South Sudan to extend the deadline for another 2 years till October 2016 in order to avoid immediate apportionment of debt between the two countries. In the meantime, they will step up outreach efforts to creditors to garner support for debt relief.
STRUCTURE OF DEBT 4. Sudan’s external debt remained very high as of end-2013.3 In nominal terms, it amounted toabout US$45 billion (79 percent of GDP), of which about 85 percent was in arrears (Error! Reference source not found.). The structure of external debt has not changed over the last decade. The bulk is public and publicly guaranteed (PPG) debt (US$43.4 billion, of which 88 percent in arrears), mainly owed to bilateral creditors and roughly equally divided between Paris Club and non-Paris Club creditors (Figure 2). Only a small fraction is private debt owed to suppliers (US$1.6 billion).
2 Sudan retained all the external debt under the “zero-option” following the secession of South Sudan, provided that (i) South Sudan joined Sudan in outreach efforts for debt relief, and (ii) the international community gave firm commitments to the delivery of debt relief. The deadline for these conditions to be met was set at September 2014. If the conditions are not met, Sudan’s external debt would be apportioned between the two countries, based on a formula to be determined within six months from the deadline. 3 Debt data were provided by the Sudanese authorities, complemented by information obtained during the 2011 external debt reconciliation exercise as well as Fund and World Bank staffs’ estimates.

SUDAN
INTERNATIONAL MONETARY FUND 3
Figure 1. Stock of External Debt, 2001–13 Figure 2. Structure of 2013 PPG External Debt
Sources: Sudanese authorities, World Bank, and IMF staff estimates. Sources: Sudanese authorities, World Bank, and IMF staff estimates
5. External public borrowing has been limited in recent years (Table 1). Sudan has been largelycut off from access to external financing due to its arrears with the creditors. It has been only able to contract new debt—below 1 percent of GDP per year in 2012-14—with a limited number of multilateral and non-Paris Club bilateral creditors. The newly contracted debt has been mainly used to finance projects in the agriculture, services and energy sectors. In the first half of 2014, some US$152 million of new debt (0.2 percent of GDP) was contracted, including US$99 million from a multilateral creditor and US$53 million from bilateral creditors. The new debt contracted is within the annual limit of US$600 million under the SMP. There has not been any new private external debt in decades.
Table 1. New External Debt Contracted (2012-14)
Sources: Sudanese authorities; and IMF staff calculations.
2012 2013 H1 2014
Total new debt (in US$ million) 431 618 152 In percent of GDP 0.7 0.9 0.2
Of which:Concessional 134 16 5 Nonconcessional 296 602 147
By creditor (in percent)Multilateral 79 48 65 Non-Paris Club bilateral 21 52 35
Average grant element (in percent) 30 28 27
By sector (in percent) 100 100 100 Agriculture 32 38 - Energy 7 47 33 Services 61 - 36 Industrial Development - 6 31 Other - 10 -
0
10
20
30
40
50
60
0
100
200
300
400
500
600
2001 2003 2005 2007 2009 2011 2013Total external debt (US$ bn, RHS)Percent of GDPPercent of revenues
Mulitlateral13%
Paris Club37%
Non-Paris Club36%
Commercial14%

SUDAN
4 INTERNATIONAL MONETARY FUND
6. Sudan’s total public debt reached 91 percent of GDP by end-2013. The bulk of the public debt is external debt. Domestic debt has been on the rise due to increased domestic financing of the budget, albeit to a still relatively low level (13 percent of GDP).
DEBT SUSTAINABILITY ANALYSIS A. Underlying Assumptions 7. The macroeconomic assumptions underlying this DSA have been updated based on developments in 2013 and the first half of 2014 (Box 1). The differences compared to the macroeconomic framework in 2013 DSA are driven by: (i) lower growth and higher inflation outturns in 2013 relative to previous projections; (ii) the impact of the policy measures carried out in September 2013, including a step devaluation in the official SDG/USD exchange rate and increases in domestic fuel prices; and (iii) outturns in the first half of 2014. Both the fiscal and current account deficits are projected to be lower than in the previous DSA over the medium term, reflecting improved fiscal performance as well as higher oil-related revenues from South Sudan. As in previous DSAs, this DSA update does not base its baseline or any alternative scenario projections on speculations about the timing and magnitude of arrears clearance, possible external debt relief or debt apportionment between Sudan and South Sudan.
Box 1. Sudan: Macroeconomic Assumptions 2014-34
Natural resources. The outlook is informed by discussions with the Ministries of Oil and Mining. Oil production is projected at 127 thousand barrels/day in 2014, a moderate increase from 119 thousand barrels/day in 2013. Enhanced recovery in existing fields and further exploration will likely help production to further increase over the medium term, reaching a peak of 210 thousand barrels/day in 2020 before it start to gradually decline. Meanwhile, annual production of gold is projected to increase by 3 percent per year until 2020 stable afterwards. Price projections are guided by the IMF’s latest World Economic Outlook (WEO). Price for Sudan’s crude oil is projected to average at US$91/barrel, and remains stable at US$87/barrel in the longer term.
Real sector. The real GDP growth rate is expected to gradually increase to 4.7 percent until 2019 and then to average 4.2 percent over 2020–34. Medium term real GDP growth mainly reflects a strengthening non-oil sector led by the agriculture and mining sectors under macroeconomic stabilization and structural reforms in the areas of business environment, education and health, and reducing unemployment1. Inflation, as measured by GDP deflator, is projected to be high in the near term, but will stabilize over the medium term; it averages at 15 percent in 2014-19 and 5½ percent in 2020-34.
Fiscal sector. The fiscal deficit is projected to improve over the medium term, reflecting a combination of improvements in tax revenue collection, increase in oil revenues, and containment of current spending, including a gradual phasing out of fuel subsidies. Over the long run, the fiscal d eficit is expected to average some 1 percent of GDP, reflecting (i) a gradual increase in tax revenues, against the backdrop of decreasing oil revenues and (ii) increase in capital spending. Domestic debt to GDP ratio is projected to be stable under the growth and fiscal performance assumptions.
External sector. The current account deficit is expected to improve slightly over the medium term, reaching 5 percent of GDP by end-2019, reflecting further fiscal consolidation as well as growth in oil and non-oil exports. In the long run it is expected to be stable at 5-6 percent of GDP as oil exports decline while non-oil exports continue to increase. The current account deficit will be financed by foreign direct investment and continued accumulation of external debt arrears.
External debt. Reflecting continued limited access to international finance and a deteriorating debt service capacity, disbursements of new loans are expected to be limited, at about 0.4 percent of GDP during 2013–33. In line with the recent portfolio of new contracted debt, the share of new concessional loans is kept at around one third. It is assumed that Sudan will continue to fail to service obligations arising from the stock of arrears.
1/ For more information on sources of growth in Sudan, see IMF (2014), Staff Report for the 2014 Article IV Consultation and Second Review Under the Staff Monitored Program, Annex II.

SUDAN
INTERNATIONAL MONETARY FUND 5
B. External Debt Sustainability 8. Sudan’s external debt stock remains unsustainable under the baseline scenario (Figure A1and Table A1). All PPG external debt level ratios continue to breach their indicative thresholds throughout the 20-year projection period. The present value (PV) of PPG external debt is at 125 percent of GDP at end-2013—more than four times of the 30 percent threshold for weak policy performers—and is projected to stay above 60 percent of GDP through the projection period. Similarly, both the PV of debt-to-exports and the PV of debt-to-revenue ratios are above 1300 percent in 2014, well above their respective thresholds. Although these ratios are projected to improve based on the assumptions of robust growth and limited external borrowing over the medium to long run, such improvements are insufficient to bring debt to sustainable levels.
9. In addition, Sudan’s debt outlook is vulnerable to a range of shocks (Figure A1 and Table A2).The PV of debt-to-GDP, debt-to-revenue and debt service-to-revenue ratios are most vulnerable to a one-time depreciation shock, whereas the PV of debt-to-exports and debt service-to-exports ratios are most vulnerable to an exports shock. A standard one-time 30 percent depreciation shock in 2015 would increase the PV-of-debt to more than 160 percent of GDP in that year, and result in a permanently upward shift in the debt path.
C. Public Debt Sustainability 10. Public DSA results mirrors those of the external DSA (Figure A2 and Tables A3). The debt ratios,albeit declining, converge to relatively high levels in the long term. The PV of public debt-to-GDP ratio is projected to stay well above the indicative benchmark throughout the projection period. Similar to the external DSA, the public DSA bound tests show that public debt path is most vulnerable to a one-time 30 percent real depreciation (Table A4).
CONCLUSIONS 11. Sudan remains in debt distress. The results of this DSA are broadly unchanged from those inprevious DSAs. External debt remains unsustainable. Over the long term, all public and public-guaranteed external debt burden ratios remain well above their respective indicative thresholds (except for the debt service ratios at the end of the projection horizon). Public debt is also unsustainable, driven mostly by external debt dynamics.
12. Further efforts are needed for Sudan to obtain much-needed debt relief and regain accessto external financing. Sudan needs to: (i) step up outreach efforts to its creditors to garner broad support for debt relief; (ii) continue to cooperate with the IMF on economic policies and payments with a view to establish a track record of sound macro policies; and (iii) limit new borrowing on non-concessional terms as much as possible, since it further increases the future debt burden, and secure foreign support on highly concessional terms to finance necessary development and infrastructure expenditures.
13. The authorities generally agree with the results and assessments of the DSA. They agree thatSudan’s external debt is at unsustainable levels, debt service burdens are beyond Sudan debt servicing capacity, and as a result Sudan continues to accumulate external debt arrears. They agree that non-concessional borrowing is costly and therefore should be minimized. They reiterated that debt relief is

SUDAN
6 INTERNATIONAL MONETARY FUND
urgently needed for Sudan’s economic development, and remain hopeful that international community will support Sudan to secure a debt relief in the near future. In this regard, the authorities will step up their efforts in reaching out to creditors.

SUDAN
INTERNATIONAL MONETARY FUND 7
Sources: Country authorities; and staff estimates and projections.
Figure A1. Sudan: Indicators of Public and Publicly Guaranteed External Debt under Alternatives Scenarios, 2014-34 1/
1/ The most extreme stress test is the test that yields the highest ratio on or before 2024. In figure b. it corresponds to a One-time depreciation shock; in c. to a Exports shock; in d. to a One-time depreciation shock; in e. to a Exports shock and in figure f. to a One-time depreciation shock
Baseline Historical scenario Most extreme shock 1/ Threshold
0
5
10
15
20
25
30
35
40
45
2014 2019 2024 2029 2034
f.Debt service-to-revenue ratio
33
33
34
34
35
35
36
0
1
1
2
2
3
2014 2019 2024 2029 2034
Rate of Debt AccumulationGrant-equivalent financing (% of GDP)Grant element of new borrowing (% right scale)
a. Debt Accumulation
0
200
400
600
800
1000
1200
1400
1600
1800
2000
2014 2019 2024 2029 2034
c.PV of debt-to-exports ratio
0
20
40
60
80
100
120
140
160
180
2014 2019 2024 2029 2034
b.PV of debt-to GDP ratio
0
200
400
600
800
1000
1200
1400
1600
2014 2019 2024 2029 2034
d.PV of debt-to-revenue ratio
0
5
10
15
20
25
30
35
40
45
50
2014 2019 2024 2029 2034
e.Debt service-to-exports ratio

SUDAN
8 INTERNATIONAL MONETARY FUND
Sources: Country authorities; and staff estimates and projections.1/ The most extreme stress test is the test that yields the highest ratio on or before 2024. 2/ Revenues are defined inclusive of grants.
Figure A2.Sudan: Indicators of Public Debt Under Alternative Scenarios, 2014-34 1/
BaselinePublic debt benchmark
Most extreme shock 1/Historical scenario
Fix Primary Balance
0
200
400
600
800
1000
1200
1400
1600
1800
2014 2016 2018 2020 2022 2024 2026 2028 2030 2032 2034
PV of Debt-to-Revenue Ratio 2/
0
50
100
150
200
250
2014 2016 2018 2020 2022 2024 2026 2028 2030 2032 2034
PV of Debt-to-GDP Ratio
0
10
20
30
40
50
60
70
80
2014 2016 2018 2020 2022 2024 2026 2028 2030 2032 2034
Debt Service-to-Revenue Ratio 2/

SUDAN
INTERNATIONAL MONETARY FUND 9
Historical 6/ Standard 6/
Average Deviation 2014-2019 2020-20342011 2012 2013 2014 2015 2016 2017 2018 2019 Average 2024 2034 Average
External debt (nominal) 1/ 61.8 84.0 80.3 82.3 80.5 78.4 75.9 73.1 70.4 65.4 53.6of which: public and publicly guaranteed (PPG) 59.4 81.4 77.8 79.9 77.9 75.8 73.3 70.7 68.1 63.2 51.7
Change in external debt -2.8 22.2 -3.7 2.0 -1.8 -2.1 -2.6 -2.7 -2.7 -1.0 -1.2Identified net debt-creating flows -5.0 9.4 0.1 1.2 0.6 0.0 -0.6 -1.2 -1.1 -0.2 -0.6
Non-interest current account deficit -2.1 6.6 6.1 2.7 3.6 4.1 3.7 3.5 3.0 2.8 2.8 3.9 4.7 4.2Deficit in balance of goods and services -2.0 6.8 6.5 4.7 4.6 4.5 4.2 4.2 4.0 4.7 5.0
Exports 17.6 9.9 9.5 10.0 12.0 12.7 13.1 13.0 12.9 12.1 11.4Imports 15.5 16.7 16.1 14.7 16.5 17.1 17.3 17.2 16.8 16.8 16.5
Net current transfers (negative = inflow) -1.7 -1.4 -2.1 -2.9 2.0 -2.1 -2.4 -2.6 -2.7 -2.8 -2.6 -2.2 -1.4 -1.9of which: official -1.0 -0.7 -0.7 -0.6 -0.7 -0.7 -0.7 -0.7 -0.6 -0.5 -0.3
Other current account flows (negative = net inflow) 1.5 1.1 1.6 1.4 1.6 1.6 1.5 1.5 1.4 1.3 1.1Net FDI (negative = inflow) -4.0 -3.9 -4.6 -5.9 2.1 -3.3 -3.3 -3.1 -3.1 -3.1 -2.8 -3.3 -4.2 -3.5Endogenous debt dynamics 2/ 1.1 6.8 -1.4 0.5 0.2 -0.3 -0.6 -0.9 -1.0 -0.8 -1.1
Contribution from nominal interest rate 2.7 2.7 3.1 2.9 3.2 2.8 2.5 2.3 2.2 1.8 1.2Contribution from real GDP growth 0.2 1.4 -2.6 -2.4 -3.1 -3.1 -3.1 -3.3 -3.2 -2.6 -2.3Contribution from price and exchange rate changes -1.8 2.7 -1.9 … … … … … … … …
Residual (3-4) 3/ 2.2 12.8 -3.8 0.8 -2.4 -2.1 -1.9 -1.6 -1.6 -0.8 -0.6of which: exceptional financing -2.7 -2.8 -2.8 -2.6 -2.7 -2.6 -2.5 -2.3 -2.1 -1.8 -1.1
PV of external debt 4/ ... ... 127.5 128.9 124.1 119.2 113.7 108.2 102.8 89.9 66.7In percent of exports ... ... 1335.3 1286.9 1035.2 941.2 868.0 831.0 799.8 743.4 583.3
PV of PPG external debt ... ... 125.0 126.6 121.5 116.6 111.2 105.8 100.5 87.7 64.8In percent of exports ... ... 1309.7 1263.3 1013.4 920.6 848.7 812.4 781.8 725.6 566.7In percent of government revenues ... ... 1357.6 1165.1 1072.5 1000.6 942.4 880.4 843.0 749.7 559.7
Debt service-to-exports ratio (in percent) 18.3 33.5 32.5 29.7 26.2 23.6 21.9 20.8 19.6 16.7 12.7PPG debt service-to-exports ratio (in percent) 18.1 33.1 32.1 29.3 25.8 23.2 21.5 20.5 19.2 16.3 12.1PPG debt service-to-revenue ratio (in percent) 18.0 35.2 33.3 27.1 27.3 25.2 23.9 22.2 20.7 16.8 11.9Total gross financing need (Billions of U.S. dollars) -1.9 3.8 3.0 2.6 2.3 2.2 2.0 1.8 1.9 2.6 2.9Non-interest current account deficit that stabilizes debt ratio 0.7 -15.6 9.8 2.0 5.5 5.5 5.6 5.6 5.5 4.9 5.9
Key macroeconomic assumptions
Real GDP growth (in percent) -0.3 -2.2 3.3 3.5 3.0 3.1 3.4 3.9 4.2 4.6 4.7 4.0 4.1 4.4 4.2GDP deflator in US dollar terms (change in percent) 2.9 -4.1 2.3 10.9 11.2 1.8 -11.0 -2.0 1.1 1.6 2.3 -1.0 0.3 0.2 0.1Effective interest rate (percent) 5/ 4.4 4.1 3.9 4.9 0.5 3.7 3.6 3.5 3.4 3.3 3.2 3.4 2.8 2.3 2.6Growth of exports of G&S (US dollar terms, in percent) -8.7 -46.9 1.4 15.4 35.7 10.1 10.2 7.5 8.9 5.6 5.7 8.0 2.9 4.7 3.5Growth of imports of G&S (US dollar terms, in percent) -7.5 0.9 1.6 15.6 25.5 -4.1 3.7 5.4 6.6 5.4 4.7 3.6 4.1 4.4 4.2Grant element of new public sector borrowing (in percent) ... ... ... ... ... 35.1 35.1 35.1 35.1 35.1 35.0 35.1 34.4 33.5 34.1Government revenues (excluding grants, in percent of GDP) 17.7 9.4 9.2 10.9 11.3 11.7 11.8 12.0 11.9 11.7 11.6 11.7Aid flows (in Billions of US dollars) 7/ 0.4 0.4 0.4 0.4 0.6 0.6 0.6 0.6 0.6 0.5 0.4
of which: Grants 0.2 0.3 0.4 0.3 0.5 0.5 0.5 0.5 0.5 0.4 0.3of which: Concessional loans 0.2 0.1 0.0 0.1 0.1 0.1 0.1 0.1 0.1 0.1 0.1
Grant-equivalent financing (in percent of GDP) 8/ ... ... ... 0.6 0.9 0.9 0.9 0.8 0.8 0.6 0.3 0.5Grant-equivalent financing (in percent of external financing) 8/ ... ... ... 72.1 73.6 73.8 73.4 72.1 71.1 67.5 60.8 65.3
Memorandum items:Nominal GDP (Billions of US dollars) 67.3 63.2 66.7 70.0 64.5 65.7 69.2 73.5 78.7 95.9 149.0Nominal dollar GDP growth 2.6 -6.2 5.7 4.9 -7.9 1.9 5.3 6.3 7.1 2.9 4.4 4.6 4.3PV of PPG external debt (in Billions of US dollars) 69.7 70.9 72.2 73.6 74.9 76.2 77.6 84.4 96.8(PVt-PVt-1)/GDPt-1 (in percent) 1.8 1.9 2.1 2.0 1.9 1.8 1.9 1.5 0.8 1.3Gross workers' remittances (Billions of US dollars) 1.4 1.1 1.4 1.4 1.6 1.7 1.9 2.1 2.1 2.1 2.1PV of PPG external debt (in percent of GDP + remittances) ... ... 122.5 124.0 118.6 113.6 108.2 102.8 97.9 85.8 63.9PV of PPG external debt (in percent of exports + remittances) ... ... 1077.1 1047.6 840.6 760.7 700.1 665.3 645.5 612.7 503.6Debt service of PPG external debt (in percent of exports + remittances) ... ... 26.4 24.3 21.4 19.2 17.7 16.8 15.8 13.8 10.8
Sources: Country authorities; and staff estimates and projections.
1/ Includes both public and private sector external debt.2/ Derived as [r - g - ρ(1+g)]/(1+g+ρ+gρ) times previous period debt ratio, with r = nominal interest rate; g = real GDP growth rate, and ρ = growth rate of GDP deflator in U.S. dollar terms. 3/ Includes exceptional financing (i.e., changes in arrears and debt relief); changes in gross foreign assets; and valuation adjustments. For projections also includes contribution from price and exchange rate changes.4/ Assumes that PV of private sector debt is equivalent to its face value.5/ Current-year interest payments divided by previous period debt stock. 6/ Historical averages and standard deviations are generally derived over the past 10 years, subject to data availability. 7/ Defined as grants, concessional loans, and debt relief.8/ Grant-equivalent financing includes grants provided directly to the government and through new borrowing (difference between the face value and the PV of new debt).
Actual
Table A1. External Debt Sustainability Framework, Baseline Scenario, 2011-2034 1/(In percent of GDP, unless otherwise indicated)
Projections

SUDAN
10 INTERNATIONAL MONETARY FUND
Table A2. Sensitivity Analysis for Key Indicators of Public and Publicly Guaranteed External Debt, 2014
(In Percent)
2014 2015 2016 2017 2018 2019 2024 2034
Baseline 124 119 114 108 103 98 86 64
A. Alternative Scenarios
A1. Key variables at their historical averages in 2014-2034 1/ 124 91 74 62 53 44 13 -13A2. New public sector loans on less favorable terms in 2014-2034 2 124 109 109 105 101 96 87 65
B. Bound Tests
B1. Real GDP growth at historical average minus one standard deviation in 2015-2016 124 112 115 111 106 101 91 68B2. Export value growth at historical average minus one standard deviation in 2015-2016 3/ 124 111 114 111 106 101 91 65B3. US dollar GDP deflator at historical average minus one standard deviation in 2015-2016 124 97 96 92 88 84 75 56B4. Net non-debt creating flows at historical average minus one standard deviation in 2015-2016 4/ 124 111 112 106 101 96 87 64B5. Combination of B1-B4 using one-half standard deviation shocks 124 94 89 85 82 78 69 52B6. One-time 30 percent nominal depreciation relative to the baseline in 2015 5/ 124 162 162 156 149 142 127 96
Baseline 1048 841 761 700 665 645 613 504
A. Alternative Scenarios
A1. Key variables at their historical averages in 2014-2034 1/ 1048 664 519 426 363 313 101 -112A2. New public sector loans on less favorable terms in 2014-2034 2 1048 773 730 682 653 634 619 515
B. Bound Tests
B1. Real GDP growth at historical average minus one standard deviation in 2015-2016 1048 772 727 678 648 628 610 503B2. Export value growth at historical average minus one standard deviation in 2015-2016 3/ 1048 1021 1243 1159 1105 1078 1068 875B3. US dollar GDP deflator at historical average minus one standard deviation in 2015-2016 1048 772 727 678 648 628 610 503B4. Net non-debt creating flows at historical average minus one standard deviation in 2015-2016 4/ 1048 864 825 686 656 636 618 506B5. Combination of B1-B4 using one-half standard deviation shocks 1048 881 910 837 800 775 752 624B6. One-time 30 percent nominal depreciation relative to the baseline in 2015 5/ 1048 772 727 678 648 628 610 503
Baseline 1165 1073 1001 942 880 843 750 560
A. Alternative Scenarios
A1. Key variables at their historical averages in 2014-2034 1/ 1165 818 649 538 445 378 111 -112A2. New public sector loans on less favorable terms in 2014-2034 2 1165 987 961 918 864 828 758 573
B. Bound Tests
B1. Real GDP growth at historical average minus one standard deviation in 2015-2016 1165 1013 1018 971 913 874 794 595B2. Export value growth at historical average minus one standard deviation in 2015-2016 3/ 1165 1004 1009 964 907 869 796 572B3. US dollar GDP deflator at historical average minus one standard deviation in 2015-2016 1165 879 839 801 753 720 655 491B4. Net non-debt creating flows at historical average minus one standard deviation in 2015-2016 4/ 1165 990 967 923 868 831 756 562B5. Combination of B1-B4 using one-half standard deviation shocks 1165 840 772 737 692 663 602 454B6. One-time 30 percent nominal depreciation relative to the baseline in 2015 5/ 1165 1485 1442 1376 1293 1238 1125 844
Projections
PV of debt-to-GDP+remittances ratio
PV of debt-to-exports+remittances ratio
PV of debt-to-revenue ratio
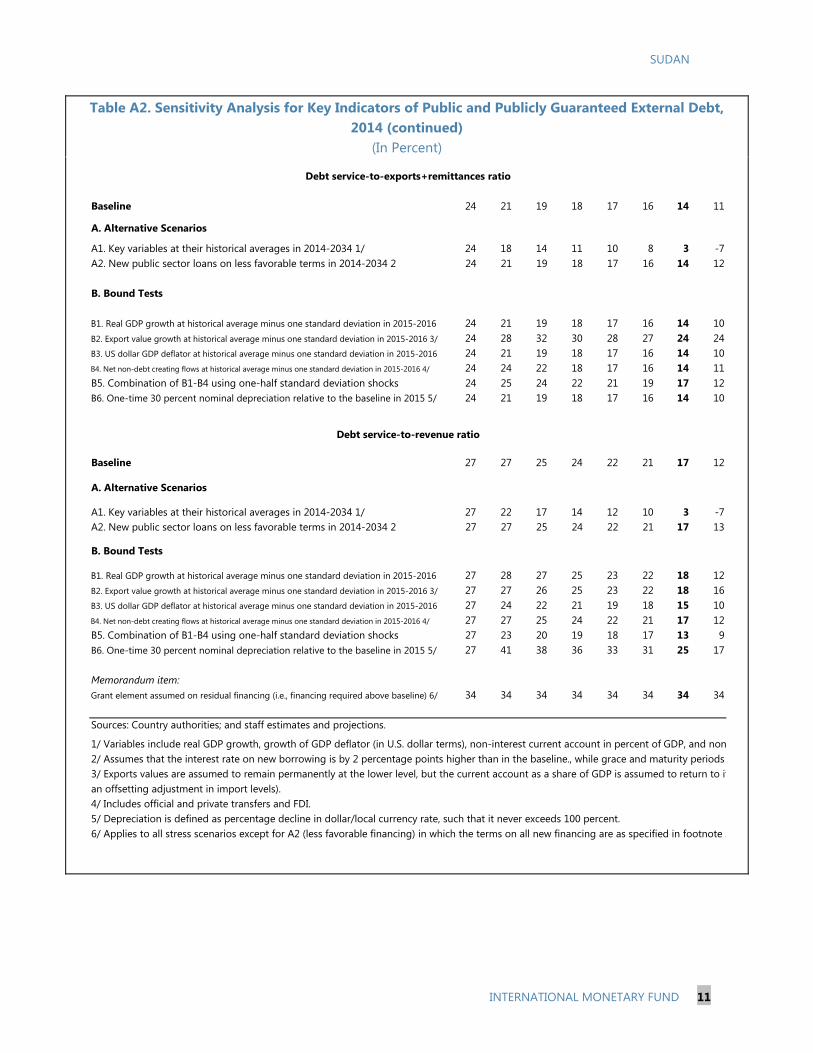
SUDAN
INTERNATIONAL MONETARY FUND 11
Table A2. Sensitivity Analysis for Key Indicators of Public and Publicly Guaranteed External Debt, 2014 (continued)
(In Percent)
Baseline 24 21 19 18 17 16 14 11
A. Alternative Scenarios
A1. Key variables at their historical averages in 2014-2034 1/ 24 18 14 11 10 8 3 -7A2. New public sector loans on less favorable terms in 2014-2034 2 24 21 19 18 17 16 14 12
B. Bound Tests
B1. Real GDP growth at historical average minus one standard deviation in 2015-2016 24 21 19 18 17 16 14 10B2. Export value growth at historical average minus one standard deviation in 2015-2016 3/ 24 28 32 30 28 27 24 24B3. US dollar GDP deflator at historical average minus one standard deviation in 2015-2016 24 21 19 18 17 16 14 10B4. Net non-debt creating flows at historical average minus one standard deviation in 2015-2016 4/ 24 24 22 18 17 16 14 11B5. Combination of B1-B4 using one-half standard deviation shocks 24 25 24 22 21 19 17 12B6. One-time 30 percent nominal depreciation relative to the baseline in 2015 5/ 24 21 19 18 17 16 14 10
Baseline 27 27 25 24 22 21 17 12
A. Alternative Scenarios
A1. Key variables at their historical averages in 2014-2034 1/ 27 22 17 14 12 10 3 -7A2. New public sector loans on less favorable terms in 2014-2034 2 27 27 25 24 22 21 17 13
B. Bound Tests
B1. Real GDP growth at historical average minus one standard deviation in 2015-2016 27 28 27 25 23 22 18 12B2. Export value growth at historical average minus one standard deviation in 2015-2016 3/ 27 27 26 25 23 22 18 16B3. US dollar GDP deflator at historical average minus one standard deviation in 2015-2016 27 24 22 21 19 18 15 10B4. Net non-debt creating flows at historical average minus one standard deviation in 2015-2016 4/ 27 27 25 24 22 21 17 12B5. Combination of B1-B4 using one-half standard deviation shocks 27 23 20 19 18 17 13 9B6. One-time 30 percent nominal depreciation relative to the baseline in 2015 5/ 27 41 38 36 33 31 25 17
Memorandum item:Grant element assumed on residual financing (i.e., financing required above baseline) 6/ 34 34 34 34 34 34 34 34
Sources: Country authorities; and staff estimates and projections.
1/ Variables include real GDP growth, growth of GDP deflator (in U.S. dollar terms), non-interest current account in percent of GDP, and non2/ Assumes that the interest rate on new borrowing is by 2 percentage points higher than in the baseline., while grace and maturity periods 3/ Exports values are assumed to remain permanently at the lower level, but the current account as a share of GDP is assumed to return to itan offsetting adjustment in import levels). 4/ Includes official and private transfers and FDI.5/ Depreciation is defined as percentage decline in dollar/local currency rate, such that it never exceeds 100 percent.6/ Applies to all stress scenarios except for A2 (less favorable financing) in which the terms on all new financing are as specified in footnote 2
Debt service-to-revenue ratio
Debt service-to-exports+remittances ratio

SUDAN
12 INTERNATIONAL MONETARY FUND
2011 2012 2013 Average5/ Standard
Deviation
5/
2014 2015 2016 2017 2018 20192014-19 Average 2024 2034
2020-34 Average
Public sector debt 1/ 70.5 94.3 90.3 90.8 87.6 85.0 81.7 78.3 75.1 70.5 60.4of which: foreign-currency denominated 59.4 81.4 77.8 79.9 77.9 75.8 73.3 70.7 68.1 63.2 51.7
Change in public sector debt -2.6 23.9 -4.0 0.4 -3.1 -2.7 -3.2 -3.4 -3.1 -0.9 -1.0Identified debt-creating flows -7.7 20.4 -8.0 -2.2 -5.3 -4.9 -5.3 -5.6 -4.9 -2.4 -2.3
Primary deficit -3.9 -0.3 -1.5 -2.6 2.2 -2.2 -2.5 -2.7 -2.9 -3.1 -2.4 -2.6 -1.3 -0.9 -1.1Revenue and grants 18.0 9.8 9.9 11.4 12.0 12.4 12.5 12.7 12.5 12.1 11.8
of which: grants 0.3 0.4 0.7 0.5 0.7 0.7 0.7 0.6 0.6 0.4 0.2Primary (noninterest) expenditure 14.2 9.5 8.4 9.1 9.6 9.7 9.6 9.5 10.1 10.8 10.9
Automatic debt dynamics -3.7 21.1 -6.4 0.0 -2.9 -2.2 -2.4 -2.5 -2.5 -1.2 -1.4Contribution from interest rate/growth differential 1.2 1.9 -3.1 -3.1 -2.3 -1.9 -2.1 -2.2 -2.3 -2.8 -2.8
of which: contribution from average real interest rate 0.9 0.4 -0.1 -0.5 0.7 1.4 1.3 1.3 1.2 0.0 -0.2of which: contribution from real GDP growth 0.2 1.6 -3.0 -2.7 -3.0 -3.3 -3.4 -3.6 -3.5 -2.8 -2.6
Contribution from real exchange rate depreciation -4.9 19.1 -3.2 3.2 -0.6 -0.2 -0.3 -0.2 -0.2 ... ...Other identified debt-creating flows -0.2 -0.4 -0.2 -0.1 0.0 0.0 0.0 0.0 0.0 0.0 0.0
Privatization receipts (negative) -0.2 -0.4 -0.2 -0.1 0.0 0.0 0.0 0.0 0.0 0.0 0.0Recognition of implicit or contingent liabilities 0.0 0.0 0.0 0.0 0.0 0.0 0.0 0.0 0.0 0.0 0.0Debt relief (HIPC and other) 0.0 0.0 0.0 0.0 0.0 0.0 0.0 0.0 0.0 0.0 0.0Other (specify, e.g. bank recapitalization) 0.0 0.0 0.0 0.0 0.0 0.0 0.0 0.0 0.0 0.0 0.0
Residual, including asset changes 5.1 3.5 4.0 2.7 2.2 2.2 2.0 2.2 1.8 1.5 1.3
Other Sustainability IndicatorsPV of public sector debt ... ... 137.5 137.4 131.3 125.7 119.6 113.3 107.5 95.0 73.5
of which: foreign-currency denominated ... ... 125.0 126.6 121.5 116.6 111.2 105.8 100.5 87.7 64.8of which: external ... ... 125.0 126.6 121.5 116.6 111.2 105.8 100.5 87.7 64.8
PV of contingent liabilities (not included in public sector debt) ... ... ... ... ... ... ... ... ... ... ...Gross financing need 2/ 1.6 7.6 5.3 4.8 4.2 4.5 4.1 3.4 3.7 4.7 7.3PV of public sector debt-to-revenue and grants ratio (in percent) … … 1394.7 1210.1 1090.6 1016.7 956.9 895.6 859.6 784.1 622.2PV of public sector debt-to-revenue ratio (in percent) … … 1493.6 1265.1 1158.7 1079.1 1013.5 943.3 901.9 812.2 634.4
of which: external 3/ … … 1357.6 1165.1 1072.5 1000.6 942.4 880.4 843.0 749.7 559.7Debt service-to-revenue and grants ratio (in percent) 4/ 25.3 71.8 59.4 53.6 48.2 51.7 49.0 45.7 43.3 44.0 63.0Debt service-to-revenue ratio (in percent) 4/ 25.8 75.1 63.6 56.0 51.2 54.8 51.9 48.1 45.5 45.6 64.3Primary deficit that stabilizes the debt-to-GDP ratio -1.2 -24.2 2.5 -2.7 0.7 0.0 0.4 0.3 0.7 -0.4 0.0
Key macroeconomic and fiscal assumptionsReal GDP growth (in percent) -0.3 -2.2 3.3 3.5 3.0 3.1 3.4 3.9 4.2 4.6 4.7 4.0 4.1 4.4 4.2Average nominal interest rate on forex debt (in percent) 4.5 4.2 4.0 5.0 0.6 3.8 3.7 3.6 3.4 3.3 3.2 3.5 2.8 2.2 2.6Average real interest rate on domestic debt (in percent) -5.6 -9.8 -16.6 -1.1 8.6 -17.7 -7.0 1.6 3.6 5.2 5.3 -1.5 1.6 2.1 1.7Real exchange rate depreciation (in percent, + indicates depreciation) -7.6 30.8 -4.0 -5.0 14.0 … ... ... ... ... ... ... ... ... ...Inflation rate (GDP deflator, in percent) 19.0 28.5 36.2 17.6 9.3 33.0 21.7 11.0 8.1 6.5 6.5 14.5 5.3 4.9 5.2Growth of real primary spending (deflated by GDP deflator, in percent) -8.6 -34.4 -8.4 -5.0 11.0 12.1 8.4 4.7 4.1 3.1 11.0 7.2 4.8 4.7 4.8Grant element of new external borrowing (in percent) ... ... ... … … 35.1 35.1 35.1 35.1 35.1 35.0 35.1 34.4 33.5 ...
Sources: Country authorities; and staff estimates and projections.1/ General government gross debt.2/ Gross financing need is defined as the primary deficit plus debt service plus the stock of short-term debt at the end of the last period. 3/ Revenues excluding grants.4/ Debt service is defined as the sum of interest and amortization of medium and long-term debt.5/ Historical averages and standard deviations are generally derived over the past 10 years, subject to data availability.
Table A3. Public Sector Debt Sustainability Framework, Baseline Scenario, 2011-2034(In percent of GDP, unless otherwise indicated)
Actual Projections

SUDAN
INTERNATIONAL MONETARY FUND 13
Table A4. Sensitivity Analysis for Key Indicators of Public Debt 2014-2034
2014 2015 2016 2017 2018 2019 2024 2033 2034
Baseline 137 131 126 120 113 108 95 75 73A. Alternative scenariosA1. Real GDP growth and primary balance are at historical averages 137 131 126 121 116 112 98 72 69A2. Primary balance is unchanged from 2014 137 131 126 121 115 109 94 66 63A3. Permanently lower GDP growth 1/ 137 132 128 122 117 112 104 96 95
B. Bound tests
B1. Real GDP growth is at historical average minus one standard deviation 137 135 135 129 123 117 106 89 88B2. Primary balance is at historical average minus one standard deviations 137 133 129 123 116 110 98 78 76B3. Combination of B1-B2 using one half standard deviation shocks 137 134 132 126 119 114 102 84 82B4. One-time 30 percent real depreciation in 2015 137 200 191 182 172 164 144 116 114B5. 10 percent of GDP increase in other debt-creating flows in 2015 137 139 133 127 120 114 101 81 79
Baseline 1210 1091 1017 957 896 860 784 638 622A. Alternative scenariosA1. Real GDP growth and primary balance are at historical averages 1210 1089 1020 967 918 890 810 606 584A2. Primary balance is unchanged from 2014 1210 1092 1021 966 910 874 778 557 533A3. Permanently lower GDP growth 1/ 1210 1098 1030 977 922 893 859 807 803B. Bound testsB1. Real GDP growth is at historical average minus one standard deviation 1210 1123 1085 1026 966 932 874 756 742B2. Primary balance is at historical average minus one standard deviations 1210 1105 1045 983 920 883 807 658 642B3. Combination of B1-B2 using one half standard deviation shocks 1210 1112 1063 1003 941 906 840 707 692B4. One-time 30 percent real depreciation in 2015 1210 1659 1545 1455 1362 1308 1191 985 961B5. 10 percent of GDP increase in other debt-creating flows in 2015 1210 1158 1078 1014 949 911 836 683 665
Baseline 54 48 52 49 46 43 44 60 63
A. Alternative scenarios
A1. Real GDP growth and primary balance are at historical averages 54 48 52 49 47 45 44 56 59A2. Primary balance is unchanged from 2014 54 48 52 50 47 46 43 52 55A3. Permanently lower GDP growth 1/ 54 48 52 50 47 45 50 76 81
B. Bound testsB1. Real GDP growth is at historical average minus one standard deviation 54 50 55 53 51 49 51 72 76B2. Primary balance is at historical average minus one standard deviations 54 48 53 54 52 47 45 63 66B3. Combination of B1-B2 using one half standard deviation shocks 54 49 54 53 51 47 48 67 71B4. One-time 30 percent real depreciation in 2015 54 56 65 64 62 60 59 78 82B5. 10 percent of GDP increase in other debt-creating flows in 2015 54 48 58 69 53 51 46 68 71
Sources: Country authorities; and staff estimates and projections.1/ Assumes that real GDP growth is at baseline minus one standard deviation divided by the square root of the length of the projection.2/ Revenues are defined inclusive of grants.
PV of Debt-to-GDP Ratio
Projections
PV of Debt-to-Revenue Ratio 2/
Debt Service-to-Revenue Ratio 2/

Press Release No. 14/606
FOR IMMEDIATE RELEASE
December 30, 2014
IMF Executive Board Concludes 2014 Article IV Consultation with Sudan and Second
Review under Staff Monitored Program
On December 3, 2014, the Executive Board of the International Monetary Fund (IMF) concluded
the Article IV consultation1 with Sudan.
Sudan’s economy has yet to recover from the shock of South Sudan’s secession three years ago,
which took away three-quarters of oil production, half of its fiscal revenues, and two-thirds of its
international payments capacity. In March 2014, Sudan reached understandings with IMF staff
on a staff-monitored program (SMP) for 2014 (See Press Release No. 14/139). The program is
consistent with the government’s emergency three-year strategy adopted in the wake of 2011
South Sudan secession and aims to restore macroeconomic stability, strengthen social safety
nets, and create condition for sustainable and inclusive growth. Macroeconomic adjustment has
been complicated by structural weaknesses, a heavy debt burden, external sanctions, and volatile
domestic and regional political environments, which affect confidence and investment.
Economic performance in 2014 has been mixed. Growth remains relatively low, and inflation
high. The budget deficit has narrowed compared with 2013 on account of improved revenue
collection and tight expenditure control. Growth in monetary aggregates has slowed significantly
from the end of 2013. Following a large appreciation of the parallel market exchange rate and a
small devaluation of the official exchange rate, the gap between those rates has declined
considerably. The current account deficit is estimated to have narrowed to 6.5 percent of GDP on
account of continued fiscal consolidation.
Implementation of the authorities’ adjustment program should help restore macroeconomic
stability and improve growth prospects over the medium term. Driven by agriculture, minerals,
and oil, growth is expected to accelerate gradually to about 4.7 percent in 2019. With prudent
macroeconomic policies, inflation is expected to fall to single digits by 2017. The external
current account deficit is expected to gradually narrow toward sustainable levels. However, the
external debt overhang and the large arrears, along with protracted political transition and
1 Under Article IV of the IMF's Articles of Agreement, the IMF holds bilateral discussions with members, usually
every year. A staff team visits the country, collects economic and financial information, and discusses with officials
the country's economic developments and policies. On return to headquarters, the staff prepares a report, which
forms the basis for discussion by the Executive Board.
International Monetary Fund
700 19th
Street, NW
Washington, D. C. 20431 USA

unsettled regional civil conflicts will continue to hinder access to external financing and weigh
on growth prospects.
Resolving Sudan’s unsustainable external debt is of paramount importance for the successful
adjustment to the impact of South Sudan’s secession, implementation of the government’s
poverty reduction policies, and for supporting inclusive growth. The key pillar of the
requirements for debt relief is normalization of relations with external creditors, including the
Fund, other multilateral institutions, and bilateral creditors. In this regard, it is critical for the
authorities to reach out to their external creditors, including under the framework of the Joint
Approach with South Sudan and the African Union High-level Implementation Panel. The recent
agreement between the governments of Sudan and South Sudan to extend the “zero option” for
another two years till October 2016 is a welcome step2.
Executive Board Assessment3
Executive Directors noted a gradual improvement in Sudan’s macroeconomic performance
despite difficult economic and social conditions related to South Sudan’s secession and political
insecurity. Directors welcomed Sudan’s continued engagement with the Fund under the staff-
monitored program (SMP). They encouraged the authorities to sustain the reform momentum in
order to reduce macroeconomic imbalances, foster resilience, and promote broad-based,
inclusive growth.
Directors welcomed the improved fiscal performance in the first half of 2014, which helped
create fiscal space for much-needed social and investment outlays. They called for a
consolidation of recent gains, through a further streamlining of low-priority expenditures and
enhanced revenue mobilization, and recommended cuts in tax exemptions and reform of gold-
related taxation, as well as a reduction in fuel subsidies. Directors cautioned that the decline in
subsidies should also be accompanied by reinforced social safety nets, to help safeguard the poor
and vulnerable and enhance the success of the economic reforms. They noted that an integrated
public financial management system would be critical to modernize the budgetary framework
and improve fiscal governance.
Directors called for a tightening of the monetary stance and strengthening of the monetary policy
framework, to contain high inflation. They encouraged continued use of reserve money as the
nominal anchor, and advised that monetization of the budget deficit and unsterilized gold
purchases be curtailed. Directors noted that reforms to strengthen the independence of the central
bank would help bolster monetary policy credibility.
2In September 2012, Sudan and South Sudan reached the so-called “zero option” agreement under which Sudan
would retain all the external liabilities after the secession of South Sudan, provided that the international community
gave firm commitments to the delivery of debt relief to Sudan within two years. Absent such a commitment,
Sudan’s external debt would be apportioned based on a formula to be determined.
3At the conclusion of the discussion, the Managing Director, as Chairman of the Board, summarizes the views of
Executive Directors, and this summary is transmitted to the country's authorities. An explanation of any qualifiers
used in summings up can be found here: http://www.imf.org/external/np/sec/misc/qualifiers.htm.
While welcoming the recent adjustment of the official exchange rate, Directors called for
enhanced exchange rate flexibility to help eliminate the parallel market rate premium and
improve the availability of foreign exchange, to rebuild international reserves and promote
external competitiveness. They considered remaining exchange restrictions and multiple
currency practices unhelpful in addressing the underlying external imbalances, and
recommended their removal.
Directors encouraged the authorities to advance structural reforms to foster sustained and
inclusive growth. They supported reforms to strengthen the business environment and the legal
framework for private investment, including improvements to the AML/CFT regime and
implementation of other policies identified in the Interim Poverty Reduction Strategy.
Directors recognized that the external debt overhang weighs heavily on the country’s
development. They welcomed the recent extension to September 2016 of the “Zero Option”
agreement, whereby Sudan retains all the external liabilities after South Sudan’s secession
conditional upon receipt of commitment to debt relief from the international community within
two years. Directors supported continued joint outreach to creditors with South Sudan and the
African Union High Level implementation Panel, to help garner support for debt relief. They
encouraged Sudan to minimize non-concessional borrowing, avoid selective debt servicing, and
continue strengthening the cooperation with the IMF on policies and payments.

Sudan: Selected Economic Indicators, 2011–14
2011 2012 2013 2014
Prel. Est.
Real sector
(Annual changes in percentage)
Real GDP (at factor costs) -0.3 -2.2 3.3 3.1
Oil GDP -36.0 -59.0 15.6 6.3
Non-oil GDP 6.8 4.7 2.7 2.9
Consumer prices (period average) 18.0 35.1 37.1 38.4
Gross capital formation (in percent of GDP) 19.1 18.7 20.0 17.5
Gross Savings (in percent of GDP) 18.6 9.5 11.4 11.0
Public finance
(In percent of GDP)
Revenue and Grants 18.0 9.8 9.9 11.4
Total expenditure 17.8 13.5 12.1 12.4
Overall balance 0.2 -3.7 -2.3 -1.0
Overall primary balance 1.4 -2.3 -0.9 -0.1
Non-oil primary balance -4.1 -3.8 -2.9 -1.5
In percent of nonoil GDP -4.7 -3.9 -3.0 -1.6
Monetary sector
(Annual changes in percentage)
Reserve money 27.8 46.7 20.3 14.7
Credit to the economy 8.0 34.1 23.2 28.0
Balance of payments
(In percent of GDP)
Exports of goods (in US$, annual percent change) -12.9 -53.7 -6.4 7.6
Imports of goods (in US$, annual percent change) -7.5 2.6 4.7 -4.1
Current account balance -0.4 -9.2 -8.6 -6.5
Total external debt 59.4 81.4 77.8 79.9
Gross international reserves (in millions of US$) 1,317 1,693 1,619 1,716
In months of next year's imports of G&S. 1.5 1.9 1.9 1.9
Exchange rate: SDGs per U.S. dollar
End of period 2.68 4.42 5.70
Period average 2.67 3.57 4.71
Sources: Sudanese authorities; and IMF Staff estimates and projections.

Press Release No. 14/549 FOR IMMEDIATE RELEASE December 3, 2014
IMF Management Concludes the Second Review under the Staff-Monitored Program for Sudan
On November 19, the Management of the International Monetary Fund completed the second review under the Staff-Monitored Program (SMP)1 with Sudan.
Despite the major challenges facing Sudan, performance under the SMP, which expires at end–2014, has been satisfactory. The authorities met all June quantitative targets under the SMP, except for reserve money growth, which the authorities are taking corrective measures to address. On structural reforms, the authorities adopted an amended law on Anti-Money Laundering and Combating the Financing of Terrorism and closed all government accounts in commercial banks. They continue to minimize non-concessional borrowing and maintain satisfactory track record of payments to the Fund as agreed under the SMP. Fund Management welcomes the authorities’ commitment to meeting the program’s objectives.
The outlook for the rest of 2014 remains favorable. Non-oil growth is projected at 2.9 percent as gold extraction is expected to be strong and agriculture to rebound due to favorable weather. Inflation is expected to drop to 29 percent by year-end from 47 percent in July as the one-off effects of the September 2013 fuel price increases dissipate, monetary policy is tightened, and food prices decline owing to the expected good harvest. The fiscal deficit is expected to narrow to about 1.0 percent of GDP. The outlook for 2015 has improved but is subject to domestic and regional risks. Real GDP growth is projected at 3.4 percent supported by a good harvest, robust gold production, and the recovery of oil production.
The authorities’ medium-term program focuses on policies and reforms to reduce inflation, increase international reserves and achieve high and inclusive economic growth. The implementation of the government’s medium-term program faces challenges, including a dearth of external financing, economic sanctions, and an unsustainable external debt burden.
1 An SMP is an agreement between country authorities and Fund staff to monitor the implementation of the authorities’ economic program. SMPs do not entail financial assistance or endorsement by the IMF Executive Board.
International Monetary Fund Washington, D.C. 20431 USA

2
Sudan is in debt distress with most of its external debt in arrears. Debt relief prospects are predicated on normalizing relations with international creditors. In this context, Sudan has to intensify efforts, jointly with South Sudan, to secure broad support for comprehensive debt relief from Sudan’s bilateral external creditors. The agreement between the governments of Sudan and South Sudan to extend the deadline for the “zero option” for two more years is positive in this regard.2
IMF staff will continue to provide the authorities with policy advice in implementing and monitoring their economic program. The IMF will also continue to provide technical assistance to Sudan to help strengthen institutional capacity for economic management.
2 In September 2012, Sudan and South Sudan reached the so-called “zero option” agreement under which Sudan would retain all the external liabilities after the secession of South Sudan, provided that the international community gave firm commitments to the delivery of debt relief to Sudan within two years. Absent such a commitment, Sudan’s external debt would be apportioned based on a formula to be determined.

Statement by Ms. Kapwepwe, Executive Director for Sudan, and Ms. Serero, Advisor
to Executive Director for Sudan December 3, 2014
The Sudanese economy continues to grapple with the economic shock brought about by the secession of South Sudan in 2011; and the resultant significant contraction in public finances, creating a massive fiscal imbalance and significantly reducing their capacity in international payments. In addition, the challenging domestic and regional political environment; a huge debt burden; and the protracted US and other international economic sanctions, make it even more difficult for Sudan to recover from the effects of loss of oil revenues. The authorities are implementing a Staff Monitored Program (SMP) which serves to anchor the macroeconomic framework, support their reform program, rebuild donor and investor confidenceand lead to macroeconomic stability.
Sudan is one of the remaining HIPC eligible countries, which is yet to receive debt relief. The authorities anticipate that the SMP would support their efforts to fulfill conditions required to reach a decision point under the HIPC initiative, though they are greatly disappointed with the lack of progress by the international community in granting them debt relief, as part of the ‘Zero Option’ Agreement.
Recent Economic Developments
Inflation has dropped drastically from an average of 45 percent between May and August, to an annual rate of 39 percent in September and 28 percent in October. The significant decline in the September inflation was largely driven by the dissipation of the effects of fuel price increases a year ago. In October, the drop in inflation is attributed to an appreciation of the parallel exchange rate, and the increased foreign exchange inflows on the backdrop of higher exports of livestock and the receipt of oil transit fees from South Sudan.
Performance under the Program
The program remains on track, with all end-June quantitative targets met, while the indicative target on reserve money was missed due to excess liquidity arising from purchases of gold by the central bank. Structural benchmarks for end September are on track, and as part of the commitment to eventually align the official and the parallel exchange rate, the authorities have devalued the official rate by up to 3 percent since September, 2014. In

2
addition, the authorities have remained committed to making payments to the Fund and minimizing non-concessional borrowing.
The Near to Medium Term Outlook
The agricultural and gold sectors are expected to continue to boom until year end, leading to a stronger recovery in the export sector. In addition, a good harvest is expected to continue to ease pressure on food prices, and drive the overall inflation further down, while the parallel exchange rate is expected to decrease further and stabilize at its normal rate The budget deficit is expected to decline from 2.3 percent of GDP in 2013 to 1 percent in 2014, in tandem with the reduction in the non-oil primary deficit, and maintain the reduction in government borrowing from the central bank. These positive developments are expected to continue in 2015, pushing growth slightly up to 3.5 percent and inflation further down to about 20 percent.
Growth is expected to continue rising gradually from about 4 percent in 2016 to nearly 5 percent in 2019 due to a combination of; retained momentum in the agriculture, mining and oil sectors and implementation of the adjustment program. However, this positive prognosis may be reversed by challenges in security and political environment both, domestically and in the region.
Fiscal Policy
Despite the improved fiscal performance in the first half of 2014, the fiscal space remains tight and macroeconomic imbalances continue. However, the authorities remain committed to applying concerted efforts, critical to restoration of fiscal stability. In this regard, the authorities will adhere to a fiscal program that promotes fiscal consolidation, mobilizes additional revenue and eases the debt burden. The program aims to narrow the budget deficit by reining in fuel subsidies, by way of gradual elimination, while at the same time, containing the wage bill. This would free up some resources to be used in increasing social sector spending in order to enhance social safety nets to protect the vulnerable and support public investment to reinvigorate inclusive economic growth and create employment.
To boost public revenues, the authorities will strengthen the tax policy and administration, and rationalize tax exemptions, with the view to improve revenue collections. This process would be guided by the recently completed recommendations of the Tax and Customs Committee Review, and would be taken into account during the formulation of the 2015 public budget. In addition, the rise in fuel prices implemented through the September 2013 reforms package will make a positive contribution to domestic revenue mobilization efforts.
The authorities are also implementing public finance management reforms which aim to improve budget classification and fiscal reporting, and develop a medium term fiscal framework to enhance budget planning and preparation. Overall, the reforms would facilitate planning, execution and monitoring of the budget, and contribute to the envisaged reduction in the overall fiscal balance.

3
Monetary Policy and the Exchange Rate
Despite the dramatic reductions experienced in recent months, inflation remains too high. Therefore, in line with advice from staff, the authorities have committed to a tight policy stance to mitigate any buildup of inflationary pressures. They also aim to restrict the monetization of the fiscal deficit to program targets, and mop excess liquidity arising from gold purchases by the central bank at the parallel exchange rate, and substitute reserve money growth for the official exchange rate, as a nominal anchor.
The fiscal shock and other underlying economic fundamentals necessitated the adoption of some temporary relief measures, including the subsidization of imports of basic necessities such as wheat, fuel and medical supplies. This development arose from the need to protect the poor and the most vulnerable.
The authorities agree with Staff on the need to bridge the gap between the official and the parallel rate and eventually move to a flexible exchange regime. However, the authorities are mindful of the social sensitivities around hikes in the price some imported goods. Experience has also shown that a devaluation of the official rate could lead to further depreciation of the parallel exchange rate. Under these circumstances, the authorities are more comfortable with a cautious and gradual closure of the gap between the two rates, at a pace commensurate with conducive domestic economic conditions.
Structural Reforms
The authorities are implementing a number of structural reforms to help stimulate the economy. Reforms to the business climate are expected to promote private sector investment, job creation and growth of the economy. In addition, banking sector reforms will improve financial intermediation and access to commercial bank lending by the private sector. With respect to poverty alleviation, the authorities are implementing policies included in the Interim Poverty Reduction Strategy Paper, while the preparation of a full Poverty Reduction Strategy Paper is in progress. The authorities will continue to implement reforms in areas of human capital development in order to improve labor productivity.
Public Debt and Debt Relief
Sudan’s public debt levels have reached unsustainable levels, and the debt burden continues to rise with the accumulation of arrears and the need for credit to fund development expenditure and the provision of social safety nets. Under the SMP, the authorities have committed to a limited nonconcessional external borrowing, though prospects for concessional borrowing remain low, and access to credit remains tight. As extensively discussed in our previous Buff Statements, the high debt burden is exerting a toll on government and its citizenry. Therefore, the need for debt relief in Sudan remains urgent and critical to restore macroeconomic stability.
The authorities have expressed dissatisfaction with the fact that the original deadline for the ‘Zero Option’ elapsed without debt relief for Sudan. It is regrettable that the 14 satisfactory

4
SMPs, the implementation of policies of the Interim Poverty Reduction Strategy (I-PRSP), external debt reconciliation, and adherence to repayment to the Fund, have all failed to advance the process of achieving debt relief. Nevertheless, the authorities have agreed with South Sudan, to extend the deadline for the ‘Zero Option’ to September 2016, in part, to allow time for South Sudan to address the ongoing internal challenges. Both countries will step up efforts in outreach to Sudan’s creditors.
Article VIII Proposed Decision
Staff has determined that some aspects of Sudan’s exchange rate policy are subject to approval under Article VIII, Sections 2(a) and 3(i) of the Fund’s Articles of Agreement. Sudan is still suffering from the debilitating effects of oil revenue loss, due to the secession of South Sudan. As a result, the central bank still faces shortages of foreign exchange, hence the capacity to make international repayments remains limited. Therefore, the short term measures implemented to address the balance of payments problems are still relevant.
To this effect, my Sudanese authorities request the support of the Executive Board in approving the ‘Proposed Decision’ on page 26 of the Staff Report. This would allow them the necessary time to devise an appropriate strategy to phase out the interventions.
Conclusion
The authorities broadly agree with staff that a combination of tight monetary and fiscal policies, and the move towards a single flexible exchange rate, could go a long way in correcting the prevailing macroeconomic imbalances. At the same time, the authorities recognize that reforms to the exchange rate policy should be undertaken within the context of a framework that simultaneously addresses reforms to both fiscal and monetary policies. To this end, they are committed to implementing prudential macroeconomic policies and structural reforms to foster macroeconomic stability, sustain the growth momentum and reduce poverty.
The authorities are also committed to normalize relations with the development partners and expect to be accorded debt relief as other countries which have benefited from the HIPC initiative.