success of auto enrollment and auto increase: using ... 14, 2010 · success of auto enrollment and...
TRANSCRIPT
Success of Auto Enrollment and Auto Increase:Using Behavioral Finance to Improve Retirement Planning
EBRI Policy Forum, May 13, 2010
Mark RobinsonT Rowe Price Retirement Plan ServicesT. Rowe Price Retirement Plan Services
T. Rowe Price, Invest With Confidence and the Bighorn Sheep logo is a registered trademark of T. Rowe Price Group, Inc.

Focus for Discussion
Four Key Retirement Decisions Employees Face
1. Whether to participate in a retirement plan
2. How much to contribute to the plan
3 How to invest contributions
Focus for Discussion
3. How to invest contributions
4. How to manage money in retirement
Lessons Learned from Behavioral Finance
• Auto-Enrollment and Overcoming Participant “Inertia”
• Auto-Increase and Hyperbolic Discounting
2
2

Participation in Retirement Plans
Issue: Employees Do Not Participate• 3 out of 10 employees do not participate in their retirement plan• 3 out of 10 employees do not participate in their retirement plan
• Employees miss out on tax benefits & employer match
Psychological Barrier: Inertia• Newton’s First Law of Motion: The property of an object to remain still or moving in
its established direction unless acted upon by an outside force.
• Applies well to human behavior, too
3 Source: Benartzi (2010)

Tools Used to Increase Participation in Retirement Plans
Education has had little impact on participant inertia
Automatic enrollment uses inertia to improve participation in retirement plans
Automatic Enrollment Overcomes Participant Inertia
•Does Education Spur Action?
83%91% 88%
95%
p•100%
53% 53%
•14%•7%
Case A by Choi et al Case B by Choi et al 13 Case Studies byBenartzi and Thaler
Before automatic enrollment After automatic enrollment
•Seminar Attendees•Planning to Join
•Seminar Attendees•Actually Joining
•Non-Attendees•Actually Joining
4Source: Choi et al, Bernartzi and T. Rowe Price (2006)

T. Rowe Price Automatic Enrollment
Adoption of auto enrollment continues to grow
Majority of plans use a 3% default rate
Percentage of Participants Saving At, Above, and Below the Plan Default Rate
53% of eligible T. Rowe Price clients use Automatic Enrollment
• 56% default @ savings rate of 3%;39.1%
56.8% 35.7%
13.4%11.8% 7.1%
0.7% 1.7% 2.5%
• 56% default @ savings rate of 3%; another 36% > 4%
• 1/3 also apply it to existing nonparticipants
• ~5% annually implement auto-60.2%
41 5%52.6%
79.5%
56.8%75.3%
35 %
y penrollment for opt-outs
41.5%22.2%
2% 3% 4% 5% 6%
At Default Above Default Below Default
5Source: T. Rowe Price (3/10), DiCenzo and T Rowe Price (2009)

Participants at T. Rowe Price : Auto Enrollment Impact Over Time
Opt out rates for participants do not change much for different participant populations
Participants with deferrals above their default rate grow over time (due in part to auto services such as auto increase)
70%
80%
90% Automatic Enrollment Participants’ Salary Deferral % Compared to their Automatic Default Rate
30%
40%
50%
60%
0%
10%
20%
< 3 months 3 < 6 months 6 < 12 months 1 < 2 years 2 < 5 years 5 < 10 years
6
< 3 months 3 < 6 months 6 < 12 months 1 < 2 years 2 < 5 years 5 < 10 years
At Default Increased Decreased Opted Out
Source: T. Rowe Price (12/09)
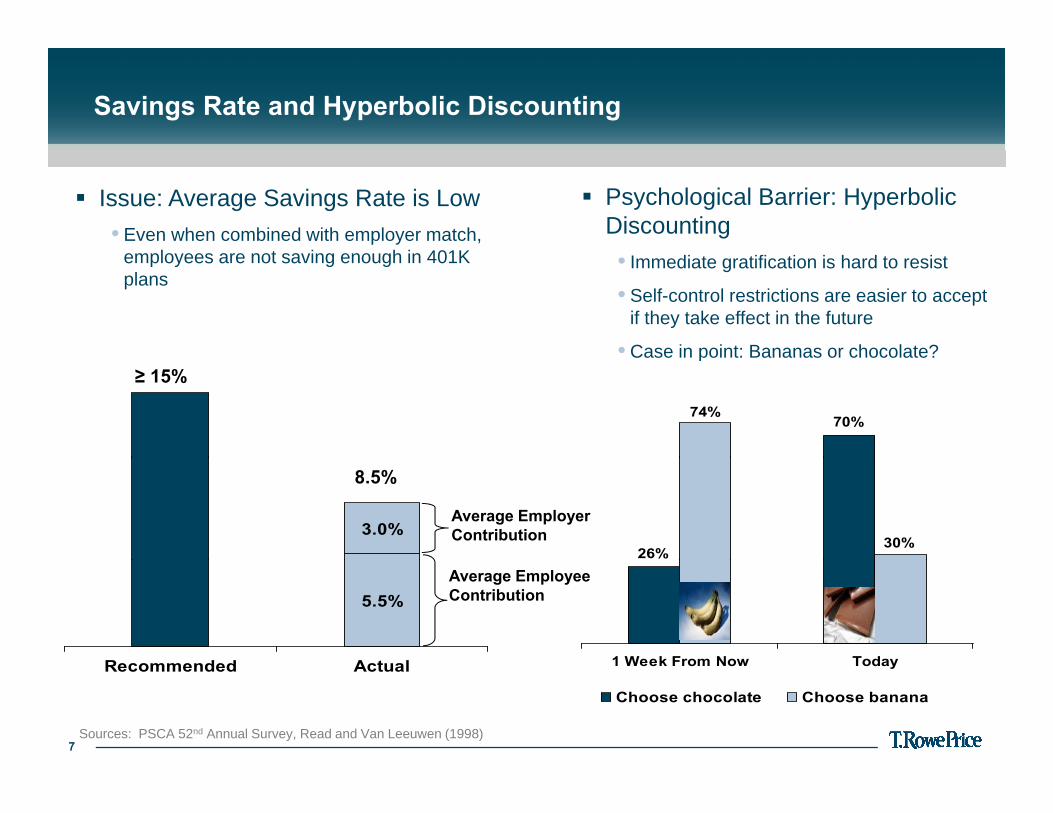
Savings Rate and Hyperbolic Discounting
Psychological Barrier: Hyperbolic Discounting
Issue: Average Savings Rate is Low• Even when combined with employer match,
l t i h i 401K • Immediate gratification is hard to resist
• Self-control restrictions are easier to accept if they take effect in the future
• Case in point: Bananas or chocolate?
employees are not saving enough in 401K plans
70%74%
Case in point: Bananas or chocolate?≥ 15%
3.0%26%
30%
Average Employer Contribution
8.5%
5.5%
Recommended Act al 1 Week From Now Today
Average Employee Contribution
7
Recommended Actual 1 Week From Now Today
Choose chocolate Choose banana
Sources: PSCA 52nd Annual Survey, Read and Van Leeuwen (1998)

T. Rowe Price Automatic Increase
Use of automatic increase in retirement plans is growing
More clients are shifting the automatic increase percentage from 1% to 2%
Adopted but not optimized by clients
Percentage of Participants Saving At, Above, and Below the Plan Default Rate
• 82% of eligible clients offer Automatic Increase
– 77% as an opt-in solution (only 5.8% of participants opt-into service)
3%
33%– 23% as a default (opt-out) solution (70%
of participants maintain default)
• Rate of increase is shifting up – 43% of clients at 2% vs. 1%
• M j it t ili f t ib ti t11%
53%
• Majority set ceiling for contribution rates above 20%
≤ 5% >5% ≤ 10% >10% ≤ 15% ≤ 20%
8Source: T. Rowe Price 3/10

Automatic Increase: Key Lessons
Opt-out Rate Just 15% of participants would opt-out 85%Opt out Rate Just 15% of participants would opt out, 85% would remain in the program
Best Time to Implement “Future date”; January - synchronize with pay raises
Annual Incremental Amount Sign-up rates for 1% and 2% are virtually equal
Sensitivity to “Cap” Signup rates are the same with a cap of 10% and 20%.
9Source: Benartzi (2010)

Summary
Automatic enrollment and automatic increase can help improve retirement outcomes of all employees by helping them overcome p y y p gbehavioral barriers
Five Key Opportunities To Improve Employee SavingsFive Key Opportunities To Improve Employee Savings • Utilize opt-out vs. opt-in• Adopt automatic enrollment for existing employees• Use default savings rate higher than 3% in automatic enrollment• Use default savings rate higher than 3% in automatic enrollment• Raise auto increase from 1% to 2%• Combine auto enrollment and auto increase and use inertia to improve
participant behaviorspa t c pa t be a o s
THANK YOU
10