subtropical front fluctuations south of australia s,...
TRANSCRIPT
Subtropical Front fluctuations south of Australia(458090S, 1468170E) for the last 130 ka years
based on calcareous nannoplankton
C.S. Findlaya,* , J.A. Floresb
aInstitute of Antarctic and Southern Ocean Studies, University of Tasmania, GPO Box 252-77, Hobart 7001, AustraliabUniversidad de Salamanca, Departamento de Geologı´a, 37008 Salamanca, Spain
Received 30 November 1999; accepted 30 May 2000
Abstract
Calcareous nannoplankton assemblages from a Late Quaternary deep-sea core (GC07; 468090S, 1468170E) south of Australiaprovide information on regional palaeoceanography and palaeoclimate changes in the Southern Ocean, in particular themovement of the Subtropical Front for the past 130 ka years. Marine Isotope Stages 1–5 are identified through changes incalcareous nannoplankton assemblages, supported by14C dates, and oxygen isotope and %CaCO data.
Two distinct assemblages are recognised: a warm water assemblage with higher abundances ofCalcidiscus leptoporus,Emiliania huxleyi, Helicosphaera.carteri, Syracosphaera pulchra, Gephyrocapsa caribbeanicaandGephyrocapsa oceanica;and, a cold water assemblage with higher abundances ofGephyrocapsa muelleraeand Coccolithus pelagicus. Alternationbetween these two assemblages downcore in GC07 reflect movement of the Subtropical Front across the location and can becorrelated to Marine Isotope Stages (MIS) 1–5. Sediments with a cold water assemblage indicate the position of the SubtropicalFront equatorward of the site when transitional to sub-antarctic waters were overlying the site. Conversely sediments with awarm water assemblage indicate the Subtropical Front was poleward of GC07 when warmer, subtropical waters were over thesite. MIS 1 and 5 are interpreted as warmer than MIS 3 (based on species composition) with the Subtropical Front morepoleward than for MIS 3. During MIS 3 the Subtropical Front is interpreted as adjacent to or immediately poleward of GC07.Some species includingC. leptoporusandC. pelagicusshow negative covariance and are considered to be reliable species inidentifying glacial and interglacial intervals in this region.
Comparison with established biostratigraphy based on calcareous nannoplankton showed the datum event for the reversalbetweenE. huxleyiandG. muelleraeof 73 ka in transitional waters is not applicable in this region. The reversal between thesetwo species occurs between 48 and 30 cm downcore in GC07 with a14C date of 11 020 year BP at 49–48 cm, i.e. the reversalevent is younger than this date.q 2000 Elsevier Science B.V. All rights reserved.
Keywords: calcareous nannoplankton; palaeoceanography; palaeoclimate; biostratigraphy; Southern Ocean
1. Introduction
The Southern Ocean plays a major role in global
deep ocean circulation and has been identified as lead-ing the northern hemisphere in sea surface tempera-ture changes during glacial terminations (Labracherieet al., 1989; Howard and Prell, 1992, 1994; Labeyrieet al., 1996). Calcareous nannoplankton, which reflectthe signatures of surface waters, are an ideal proxy for
Marine Micropaleontology 40 (2000) 403–416
0377-8398/00/$ - see front matterq 2000 Elsevier Science B.V. All rights reserved.PII: S0377-8398(00)00045-1
www.elsevier.nl/locate/marmicro
* Corresponding author.E-mail address:[email protected] (C.S. Findlay).

C.S. Findlay, J.A. Flores / Marine Micropaleontology 40 (2000) 403–416404
Fig. 1. Location of gravity core GC07 (458090S, 1468170E) on the South Tasman Rise.

the study of palaeoceanography and palaeoclimate inthe Southern Ocean. In addition, preservation ofcalcium carbonate sediments provides a record ofgeochemical (calcium and carbon dioxide) pathways.Calcareous nannoplankton are important in palae-oceanography as they are often the major componentof calcium carbonate sediments.
Studies of Quaternary palaeoceanography basedon calcareous nannofossils is limited in the southernhemisphere (Geitzenauer, 1969, 1972; Gard, 1989;Gard and Crux, 1991; Wells and Okada, 1996,1997; Wells and Connell, 1996; Hiramatsu and DeDeckker 1997; Flores et al., 1999) in comparison tothe northern hemisphere (Gard, 1989; Gard andBackman, 1990; Kleijne, 1991; Baumann andMatthiesen, 1992; Samtleben and Schro¨der, 1992;Samtleben et al., 1995a, b; Knappertsbuch and Brum-mer, 1995). This study provides additional informa-tion for the southern hemisphere in this area ofresearch.
The objectives of this study are two-fold, firstlyto examine palaeoceanography in the SouthernOcean based on calcareous nannoplankton dataincluding the identification of glacial and intergla-cial intervals; movement of the Subtropical Front(STF); and, the relationship between palaeoclimateand changes within the nannofossil assemblage.The results show movement of the STF is in agree-ment with previous studies in the southern hemi-sphere based on faunal migrations of planktonicforaminifera (Howard and Prell, 1992) and radiolar-ian assemblages (Morley, 1989) although thisdisagrees with others (Wells and Connell, 1996).Secondly, to compare the Quaternary bio-stratigraphy based on calcareous nannoplankton in
this region with the established biostratigraphy forthis group of microfossils. Results show the datumevent identified as the reversal betweenEmilianiahuxleyi and Gephyrocapsa muelleraediffers in thisregion in comparison to the established record(Thierstein et al., 1977).
2. Materials and techniques
During the Australian Geological Survey CruiseRS 147 (Exon et al., 1995) to the South TasmanRise, an initial sampling of eighteen gravity core-tops from the South Tasman Rise identified fourwith a Holocene age (Connell and Sikes, 1997).Of these, core GC07 was selected on the basis ofits proximity to the STF, surface sediments ofHolocene age, subsequent14C dates (Samson,1998) (Table 1) and minimal reworking withinthe core. GC07, a 5.3 m gravity core, wascollected from a depth of 3307 m south of Austra-lia at 458090S, 1468170E (Fig. 1, map). The loca-tion of GC07 is equatorward of the STF asidentified by Belkin and Gordon (1996) andRintoul et al. (1997).
Downcore sediment samples were taken immedi-ately after the core arrived on board at 10 cm intervalsbetween the coretop, and 200 and 20 cm intervalsfrom 210 cm to the base of the core (510 cm).Samples were placed in plastic vials and subsequentlyoven-dried at 608C in the same vials.
Examination and counting of each sample wascarried out using a light microscope (LM) and ascanning electron microscope (SEM). Preparation forthe LM involved mixing a small amount of sediment
C.S. Findlay, J.A. Flores / Marine Micropaleontology 40 (2000) 403–416 405
Table 1Core depths of14C dates and estimated sedimentation rates for core GC07
Core depth(cm)
Age of oxygen isotope stages(ka)(Martinson et al., 1987)
14C dates correctedfor reservoir effect(years BP)
Estimatedsedimentation rate(cm/ka)
0–3 116748.5 11 020 4.957.5 11 420 770 Stage 2 (12.05) 12082 14 880 28
120 Stage 3 (24.11) 13270 Stage 4 (58.96) 7.9

C.S
.F
ind
lay,
J.A.
Flo
res
/M
arin
eM
icrop
ale
on
tolo
gy
40
(20
00
)4
03
–4
16
406
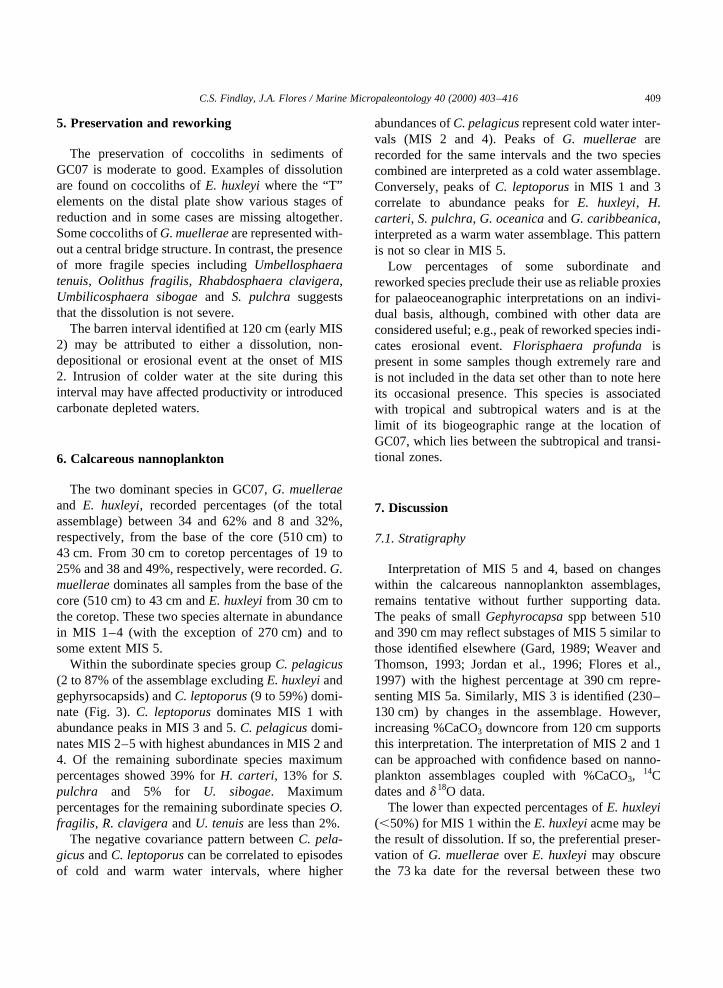
Fig. 2. Stratigraphy for GC07: (a) oxygen isotope data and14C dates from Samson (1998); (b) %CaCO3 curve (McCorkle unpublished; Connell and Sikes, 1997); (c) percentages ofstratigraphically significant species; (d) estimated sedimentation rate based on dates of oxygen isotope stages of Martinson et al. (1987) and14C dates.

directly onto a glass slide with buffered distilledwater. This slurry was spread thinly over the slideand dried on a hotplate to prevent coagulation.When dry a cover slip was mounted using an ultravio-let light sensitive compound fixed under ultravioletlight for approximately 15 min. The samplescontained few clay particles eliminating the need forultrasonification, addition of anti-flocculants or centri-fuging. Preparation for SEM slides followed the sameprocedure substituting mica slides for glass slides.
The counting procedure follows Okada (1992).Two counts of minimum 300 coccoliths were madefor each sample. The first count included percentagesof the total assemblage forE. huxleyi, individualGephyrocapsaspecies and the single category ‘subor-dinate species’, i.e. the sum of all other species as asingle percentage of the total assemblage. The secondcount was restricted to percentages of individualspecies within the ‘subordinate species’ group, i.e.excluding E. huxleyi and gephyrocapsids. Thismethod overcomes the bias of a few species dominat-ing the assemblage. Examination and counting foreach sample was carried out using a Zeiss AxioskopLM with an oil immersion objective of 100× with atotal magnification of 1000× . Supplementaryexaminations of samples were made with a JEOLSEM.
3. Oceanographic setting
The South Tasman Rise is the southern extension ofthe continental margin of Australia and lies betweenwater depths of 1000–4000 m (Exon et al., 1995). Theplateau is continuously swept by strong east-flowingcurrents associated with the intensification of theAntarctic Circumpolar Current in this region (Calla-han, 1971). Evidence of strong current activity isreflected by erosion with many coretops in the regionfound to be Late Pleistocene or older (Osborn et al.,1983; Belford 1989; Wells and Connell, 1996). Incontrast, core GC07 of this study has a Holocene core-top. The location of GC07 on the northeast slope ofthe plateau may provide protection from the east-flowing currents preserving younger sediments inthis region. The water depth of 3307 m for coreGC07 is well above the established depths for thecalcite lysocline in the southern high latitudes(Constans, 1975; Kolla et al., 1976; Takahashi et al.,1981; Howard and Prell, 1994.) suggesting goodpreservation of carbonate sediments at this location.
Three major oceanic fronts are located south ofAustralia (Belkin and Gordon, 1996). In a polewarddirection they are the STF at approximately 45–468S,defined by 128C isotherm at 150 m; the SubantarcticFront, at approximately 50–528S, where the largest
C.S. Findlay, J.A. Flores / Marine Micropaleontology 40 (2000) 403–416 407
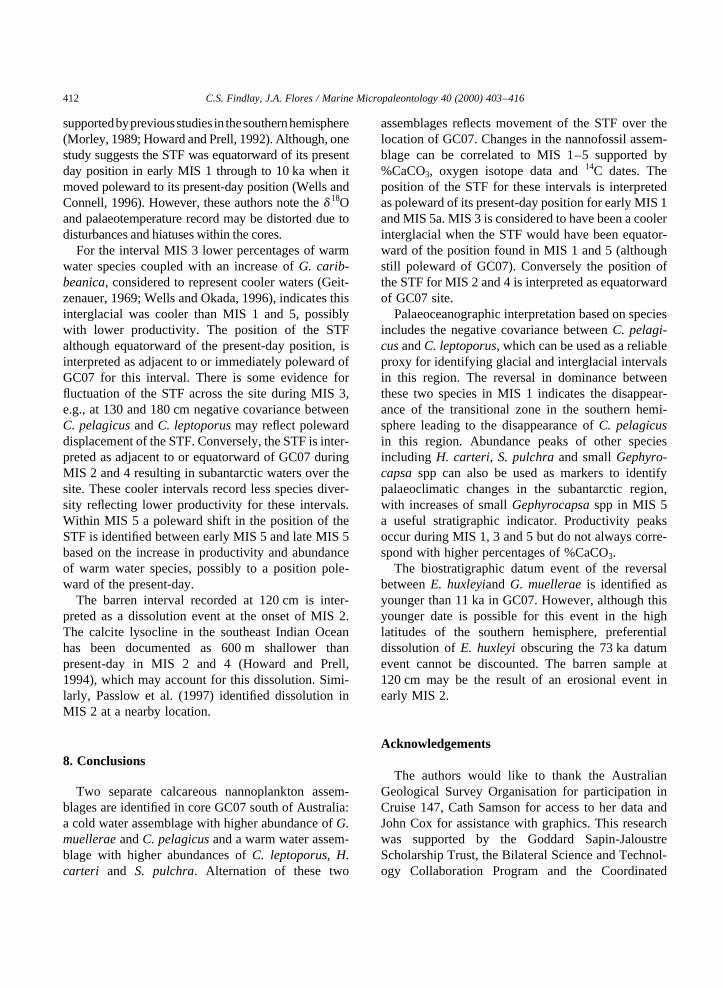
Fig. 3. Percentages of calcareous nannoplankton species for core GC07. ‘Reworked (others)’ includes cf.Reticulofenestrasp.,Sphenolithussp.andDiscoastersp. Ages of isotopic events are based on Martinson et al. (1987).

horizontal gradient between 3–88C occurs at 300 m;and, the Polar Front at approximately 638S, where theisotherms dome. Core GC07 is located equatorward ofthe STF in the present-day subtropical zone.
4. Stratigraphy
Stratigraphy of core GC07 is based on changes incalcareous nannoplankton assemblages combinedwith %CaCO3 data (McCorkle, unpublished; Connelland Sikes, 1997) supplemented byd 18O data and14Cdates (Samson, 1998) for the upper 150 cm (Fig. 2).Marine Isotope Stages (MIS) 1–5 are recognised.
Emiliania huxleyiwas identified in all samples tothe base of core GC07 (Fig. 2) indicating an ageyounger than the first occurrence (FO) ofE. huxleyi,i.e. late MIS 8 or younger (Thierstein et al., 1977;Weaver, 1993). This is supported by the absence ofhigh abundances ofGephyrocapsa caribbeanica,associated with MIS 8–15 (Gard and Backman,1990; Weaver, 1993). As MIS 7 and 6 are dominatedby small Gephyrocapsaspp, the base of coreGC07(dominated byG. muellerae) is MIS 5 oryounger.
The presence ofE. huxleyi, dominance ofG. muel-lerae and increase in smallGephyrocapsasppbetween 510 and 380 cm is interpreted as MIS 5.Similarly, higher abundances of smallGephyrocapsaspecies have been identified in MIS 5 (Gard and Back-man 1990; Gard and Crux, 1991; Weaver, 1993;Jordan et al., 1996; Okada and Wells, 1997). Thereduction of small Gephyrocapsaspecies, 390–370 cm, is interpreted as the boundary between MIS5 and 4.
Identification of MIS 4 between 380 and 250 cm isbased on the increase ofCoccolithus pelagicusandG.muellerae (Fig. 3) considered to represent colderwaters. Within this interval a peak of reworkedspecies occurs at 270 cm corresponding to a turbiditestructure identified in the core log. Between 230 and130 cm the calcareous nannoplankton assemblagechanges with higher abundances of species associatedwith warmer waters (Calcidiscus leptoporus, Helico-sphaera carteri, Syracosphaera pulchra, Gephyro-capsa caribbeanicaand Gephyrocapsa oceanica).This interval is interpreted as MIS 3 supported bythe %CaCO3 data, which records an increase for this
interval from MIS 2. The interval at 120 cm wasbarren of coccoliths and may represent the onset ofMIS 2.
Increases inC. pelagicusand G. muelleraeat thedepth of 110 to 70 cm indicate a cool interval, inter-preted as MIS 2. This is supported by the oxygenisotope data (Samson, 1998), which shows highervalues for the same interval compared to 70 cm andcoretop; the14C date of 14 880 years BP at 82–83 cm;and lower %CaCO3 values. Similarly, interpretationof MIS 1 between 70 cm and coretop based onincreases in warm water species is supported by adecrease in oxygen isotope values; three14C dates(11 420 years BP at 58–57 cm, 11 020 years BP at49–48 cm and 1167 years BP at 3–0 cm); and, anincrease in %CaCO3 values.
4.1. Reversal event betweenGephyrocapsa muelleraeandEmiliania huxleyi
Between 40 cm core depth and the coretopE.huxleyi dominates the assemblage. The reversal indominance betweenE. huxleyiandG. muelleraehasbeen established as a datum event at 85 ka (MIS 5) intropical waters and 73 ka (MIS 4) in transitionalwaters (Thierstein et al., 1977). In this study the rever-sal is found between 40 and 30 cm core depth with a14C date of 11 020 years BP at 49–48 cm (Samson,1998). The earlier date (less than 11 ka) for the rever-sal event between these two species is possible in thisregion. This datum event is time transgressive and hasbeen documented at 40 ka in regions of coastal upwel-ling (Jordan et al., 1996), 73–47 ka in the westernMediterranean (Flores et al., 1997) and 42 ka in south-east Indonesian basins (Biekart, 1989). South ofAustralia the reversal between these two species wasfound between MIS 2 (,12 ka) and MIS 4 (Hiramatsuand De Deckker, 1997) and between 11–41 ka (Wellsand Okada, 1996). Possibly this time transgressiveevent occurs at 11 ka in the high latitudes of theSouthern Ocean. Alternatively, dissolution of calcar-eous nannoplankton in this region may obscure thedatum event through the preferential preservation ofthe more robustG. muelleraeoverE. huxleyi. In eithercase the established datum event of 73 ka for thereversal between these two species is not applicablein the high latitudes of the Southern Ocean.
C.S. Findlay, J.A. Flores / Marine Micropaleontology 40 (2000) 403–416408
5. Preservation and reworking
The preservation of coccoliths in sediments ofGC07 is moderate to good. Examples of dissolutionare found on coccoliths ofE. huxleyiwhere the “T”elements on the distal plate show various stages ofreduction and in some cases are missing altogether.Some coccoliths ofG. muelleraeare represented with-out a central bridge structure. In contrast, the presenceof more fragile species includingUmbellosphaeratenuis, Oolithus fragilis, Rhabdosphaera clavigera,Umbilicosphaera sibogaeand S. pulchra suggeststhat the dissolution is not severe.
The barren interval identified at 120 cm (early MIS2) may be attributed to either a dissolution, non-depositional or erosional event at the onset of MIS2. Intrusion of colder water at the site during thisinterval may have affected productivity or introducedcarbonate depleted waters.
6. Calcareous nannoplankton
The two dominant species in GC07,G. muelleraeand E. huxleyi, recorded percentages (of the totalassemblage) between 34 and 62% and 8 and 32%,respectively, from the base of the core (510 cm) to43 cm. From 30 cm to coretop percentages of 19 to25% and 38 and 49%, respectively, were recorded.G.muelleraedominates all samples from the base of thecore (510 cm) to 43 cm andE. huxleyifrom 30 cm tothe coretop. These two species alternate in abundancein MIS 1–4 (with the exception of 270 cm) and tosome extent MIS 5.
Within the subordinate species groupC. pelagicus(2 to 87% of the assemblage excludingE. huxleyiandgephyrsocapsids) andC. leptoporus(9 to 59%) domi-nate (Fig. 3).C. leptoporusdominates MIS 1 withabundance peaks in MIS 3 and 5.C. pelagicusdomi-nates MIS 2–5 with highest abundances in MIS 2 and4. Of the remaining subordinate species maximumpercentages showed 39% forH. carteri, 13% for S.pulchra and 5% for U. sibogae. Maximumpercentages for the remaining subordinate speciesO.fragilis, R. clavigeraandU. tenuisare less than 2%.
The negative covariance pattern betweenC. pela-gicusandC. leptoporuscan be correlated to episodesof cold and warm water intervals, where higher
abundances ofC. pelagicusrepresent cold water inter-vals (MIS 2 and 4). Peaks ofG. muellerae arerecorded for the same intervals and the two speciescombined are interpreted as a cold water assemblage.Conversely, peaks ofC. leptoporusin MIS 1 and 3correlate to abundance peaks forE. huxleyi, H.carteri, S. pulchra, G. oceanicaandG. caribbeanica,interpreted as a warm water assemblage. This patternis not so clear in MIS 5.
Low percentages of some subordinate andreworked species preclude their use as reliable proxiesfor palaeoceanographic interpretations on an indivi-dual basis, although, combined with other data areconsidered useful; e.g., peak of reworked species indi-cates erosional event.Florisphaera profunda ispresent in some samples though extremely rare andis not included in the data set other than to note hereits occasional presence. This species is associatedwith tropical and subtropical waters and is at thelimit of its biogeographic range at the location ofGC07, which lies between the subtropical and transi-tional zones.
7. Discussion
7.1. Stratigraphy
Interpretation of MIS 5 and 4, based on changeswithin the calcareous nannoplankton assemblages,remains tentative without further supporting data.The peaks of smallGephyrocapsaspp between 510and 390 cm may reflect substages of MIS 5 similar tothose identified elsewhere (Gard, 1989; Weaver andThomson, 1993; Jordan et al., 1996; Flores et al.,1997) with the highest percentage at 390 cm repre-senting MIS 5a. Similarly, MIS 3 is identified (230–130 cm) by changes in the assemblage. However,increasing %CaCO3 downcore from 120 cm supportsthis interpretation. The interpretation of MIS 2 and 1can be approached with confidence based on nanno-plankton assemblages coupled with %CaCO3,
14Cdates andd 18O data.
The lower than expected percentages ofE. huxleyi(,50%) for MIS 1 within theE. huxleyiacme may bethe result of dissolution. If so, the preferential preser-vation of G. muelleraeover E. huxleyimay obscurethe 73 ka date for the reversal between these two
C.S. Findlay, J.A. Flores / Marine Micropaleontology 40 (2000) 403–416 409

species in this region. The effects of dissolution mayalso lead to difficulties distinguishingE. huxleyicoccoliths without “T” elements fromG. muelleraecoccoliths without central bridge structures using alight microscope. In this study the use of a scanningelectron microscope overcomes this problem.Changes in productivity may reduce the abundanceof E. huxleyi in the sediments. Research on livingassemblages in the same region (Findlay, 1998;Findlay and Giraudeau, submitted for publication)show a significant drop in productivity polewardacross the STF.
7.2. Preservation and reworking
The virtual absence ofF. profundacoupled withstructural changes to individual coccoliths suggeststhat the effects of dissolution are significant in preser-vation of calcium carbonate in this region. Althoughthe lysocline is approximately 3307 m for this region(Constans, 1975; Kolla et al., 1976; Takahashi et al.1981; Howard and Prell, 1994) the site is affected bythe Circumpolar Deep Water (CDW) associated withincreased CO2, which would account for dissolution.The CDW has been identified at depths between 1600and 4000 m in this region (Passlow et al., 1997). Incontrast the presence of species identified as less resis-tant (McIntyre and McIntyre, 1971; Berger, 1973)indicates that the dissolution is not significant;however, the solution indices previously recordedmay not be applicable in this region.
Interpretation of the barren interval at 120 cm isproblematic. Similar barren intervals in sedimentsabove the CCD in the southern hemisphere havebeen interpreted as movement of the PF equatorwardof those sites for those intervals (McIntyre et al.,1970; Gard, 1989) as coccosphere production islimited poleward by the PF (McIntyre et al., 1972;Nishida, 1986; Findlay, 1998; Findlay and Giraudeau,2000). In this event a migration of the PF by 88 equa-torward from its present-day location in early MIS 2would be required for the site of GC07, an unlikelyscenario. Although the PF has been placed at 458S atthe Last Glacial Maximum in the southeastern IndianOcean based on faunal migrations (Morley, 1989), thepoleward displacement of fronts south of Tasmaniaresulting from ocean-floor topography precludes asimilar interpretation for GC07. In addition, the
presence of more fragile species (U. tenuis, U. sibo-gae, O. fragilis, R. clavigeraand S. pulchra) in allother samples for MIS 2 suggests the absence ofpolar waters during this interval.
The barren interval in GC07 may be the result of acarbonate dissolution event similar to that identified inthe South Atlantic during MIS 2 when the PF waspoleward of the core site (Gard, 1989; Hays et al.,1976). Alternatively, it may be the product of anerosional event associated with the onset of MIS 2.Intensification of currents during glacial intervalsresulted in greater erosion of bottom sediments.Earlier studies (Wells and Okada, 1996) to the north-west of GC07, adjacent to the south coast of Australia,recorded a major hiatus between the lower section ofMIS 2 and MIS 10, suggesting a major erosional eventduring early MIS 2. The same erosional event couldbe reflected in GC07 at 120 cm depth.
Low abundances of reworked species includingDiscoastersp.,Sphenolithussp.,C. floridanus, Calci-discus macintyrei and reticulofenestrids indicateminor reworking throughout the core (Fig. 3). Inlow abundances reworked species includingPseudo-emiliania lacunosa(330, 470 and 510 cm) are notconsidered stratigraphically important. The peak ofreworked species at 270 cm is associated with a turbi-dite feature recognisable in the core log. The peak ofCyclicargolithus floridanus within the turbiditesuggests erosion of Miocene sediments upslope fromGC07.
7.3. Palaeoceanographic implications fromcalcareous nannoplankton
Two separate assemblages of nannoplankton areidentified in GC07. The first is identified by higherpercentages ofC. pelagicusand G. muelleraeinter-preted as a cold water assemblage. Previous researchhas identifiedC. pelagicuswith cooler waters (McIn-tyre and Be´, 1967; Geitzenauer, 1972; Geitzenauer etal., 1976; Okada and McIntyre, 1977, 1979; Raffi andRio, 1981; Samtleben and Schro¨der, 1992; Baumann,1995) and higher percentages during glacial intervalsin Quaternary cores from the southern hemisphere(Gard, 1989; Wells and Okada, 1996; Hiramatsu andDe Deckker, 1997).G. muelleraehas also been asso-ciated with colder waters (Winter et al., 1994; Samtle-ben et al., 1995a) recording higher percentages in
C.S. Findlay, J.A. Flores / Marine Micropaleontology 40 (2000) 403–416410

cooler intervals from Late Quaternary cores in highlatitudes both in the regional (Hiramatsu and DeDeckker, 1997; Wells and Okada, 1997) and northeastAtlantic (Lototskaya et al., 1998) areas. Results fromGC07 found higher abundances of this assemblage forthe intervals MIS 2 and 4 (Fig. 3).
The warm water assemblage that records higherpercentages ofC. leptoporus, H. carteri, S. pulchraandG. oceanicais associated with MIS 1, 3 and 5 inGC07. Highest percentages ofC. leptoporusand S.pulchrawere recorded for MIS 1 with highest percen-tages ofH. carteri recorded in MIS 5 (Fig. 3). Thesespecies have been identified as warm water species(McIntyre and Be´, 1967; McIntyre et al., 1970;Samtleben et al., 1995a;) and associated previouslywith interglacial intervals in the southern hemisphere(Geitzenauer, 1969, 1972; Gard, 1989; Wells andOkada 1997; Hiramatsu and De Deckker, 1997).
The resulting negative covariance betweenC.leptoporusandC. pelagicusin GC07 can be used tointerpret palaeoceanography in this region, confirmedby previous studies (Geitzenauer, 1969; Gard, 1989;Wells and Okada, 1996). For the interval MIS 5 thepattern is not so clear, possibly the result of cyclicalenvironmental changes associated with substages ofMIS 5. The reduced abundance in late MIS 5 in GC07indicates a warmer interval than for the remainder ofMIS 5. In the North AtlanticC. pelagicusis sparse orabsent during MIS 5, interpreted as an interval toowarm for this species (Baumann, 1995). Livingassemblages in high latitudes of the northernhemisphere showC. pelagicusoccupies the transi-tional waters where small changes in environmentalparameters would affect their production (Geitze-nauer, 1972). In the southern hemisphere this hasnot always been present (McIntyre et al., 1970) andwas possibly absent in late MIS 5. Reversal in domi-nance betweenC. pelagicusandC. leptoporusin earlyMIS 1 (70 cm) of GC07 suggests a similar event, i.e.the absence of a transitional zone through the pole-ward movement of the STF, resulting in the replace-ment ofC. pelagicusby C. leptoporusin the SouthernOcean (McIntyre and Be´, 1967; McIntyre et al., 1970;Geitzenauer, 1972).
Increases of smallGephyrocapsaspp in late MIS 5(MIS 5a) are in contrast to previous results from thisregion (Wells and Okada, 1997; Hiramatsu and DeDeckker, 1997), which recorded highest percentages
in MIS 5e. However, it is possible the base of GC07 isno older than MIS 5d. Data from NW Africa (Jordanet al., 1996) and the northeast Atlantic (Lototskaya etal., 1998) record smallGephyrocapsaspp dominantover G. muelleraein MIS 5 interpreted as warmerwaters for this interval in those regions. The negativecovariance in GC07 betweenG. muelleraeand smallGephyrocapsaspp, noted in previous studies (Geitze-nauer et al., 1976; Flores et al., 1997; Lototskaya etal., 1998) confirms the palaeoceanographic interpreta-tion for this region.
Increases ofG. oceanicain MIS 1 and 3 reflect thisspecies preference for warmer waters. However,combined with its possible environment and evolu-tionary changes this species is not considered to bea reliable palaeoclimatic indicator in this region. Inaddition, abundance variations ofG. oceanicahavebeen associated with factors other than temperature(Knappertsbusch, 1993).
7.4. Palaeoceanography
The position of the STF is interpreted as polewardof GC07 during MIS 1 and 5 when warmer, subtropi-cal waters covered the site. This is reflected by higherproductivity including increased abundance ofC.leptoporus, G. oceanica, H. carteri, S. pulchra, O.fragilis and U. tenuis. Similar conditions are foundat present where the STF (separating subtropicalwaters from subantarctic waters) is poleward ofGC07, the overlying waters are subtropical and theliving assemblage reflects these conditions (Nishida,1986; Findlay, 1998; Findlay and Giraudeau, 2000).
Increase of productivity in early MIS 1 reflected bya high sedimentation rate (Fig. 2d), higher %CaCO3
and higher abundances of warm water species is inter-preted as a more equatorward position of the STF thanthe present-day. Increases in %CaCO3 have been usedto infer high productivity during interglacial intervalsin the Southern Ocean (Howard and Prell, 1994).However, as MIS 4 records relative high %CaCO3,the latter cannot be reliable as a proxy for glacialand interglacial intervals without further substantivedata. This is further supported by the results of Gardand Crux (1991) who identified intervals barren ofcoccoliths and rich in %CaCO3 in the SouthernOcean (Gard and Crux, 1991).
The interpretation for the position of STF in MIS 1 is
C.S. Findlay, J.A. Flores / Marine Micropaleontology 40 (2000) 403–416 411
supportedbypreviousstudies in thesouthernhemisphere(Morley, 1989; Howard and Prell, 1992). Although, onestudy suggests the STF was equatorward of its presentday position in early MIS 1 through to 10 ka when itmoved poleward to its present-day position (Wells andConnell, 1996). However, these authors note thed 18Oand palaeotemperature record may be distorted due todisturbances and hiatuses within the cores.
For the interval MIS 3 lower percentages of warmwater species coupled with an increase ofG. carib-beanica, considered to represent cooler waters (Geit-zenauer, 1969; Wells and Okada, 1996), indicates thisinterglacial was cooler than MIS 1 and 5, possiblywith lower productivity. The position of the STFalthough equatorward of the present-day position, isinterpreted as adjacent to or immediately poleward ofGC07 for this interval. There is some evidence forfluctuation of the STF across the site during MIS 3,e.g., at 130 and 180 cm negative covariance betweenC. pelagicusandC. leptoporusmay reflect polewarddisplacement of the STF. Conversely, the STF is inter-preted as adjacent to or equatorward of GC07 duringMIS 2 and 4 resulting in subantarctic waters over thesite. These cooler intervals record less species diver-sity reflecting lower productivity for these intervals.Within MIS 5 a poleward shift in the position of theSTF is identified between early MIS 5 and late MIS 5based on the increase in productivity and abundanceof warm water species, possibly to a position pole-ward of the present-day.
The barren interval recorded at 120 cm is inter-preted as a dissolution event at the onset of MIS 2.The calcite lysocline in the southeast Indian Oceanhas been documented as 600 m shallower thanpresent-day in MIS 2 and 4 (Howard and Prell,1994), which may account for this dissolution. Simi-larly, Passlow et al. (1997) identified dissolution inMIS 2 at a nearby location.
8. Conclusions
Two separate calcareous nannoplankton assem-blages are identified in core GC07 south of Australia:a cold water assemblage with higher abundance ofG.muelleraeandC. pelagicusand a warm water assem-blage with higher abundances ofC. leptoporus, H.carteri and S. pulchra. Alternation of these two
assemblages reflects movement of the STF over thelocation of GC07. Changes in the nannofossil assem-blage can be correlated to MIS 1–5 supported by%CaCO3, oxygen isotope data and14C dates. Theposition of the STF for these intervals is interpretedas poleward of its present-day position for early MIS 1and MIS 5a. MIS 3 is considered to have been a coolerinterglacial when the STF would have been equator-ward of the position found in MIS 1 and 5 (althoughstill poleward of GC07). Conversely the position ofthe STF for MIS 2 and 4 is interpreted as equatorwardof GC07 site.
Palaeoceanographic interpretation based on speciesincludes the negative covariance betweenC. pelagi-cusandC. leptoporus, which can be used as a reliableproxy for identifying glacial and interglacial intervalsin this region. The reversal in dominance betweenthese two species in MIS 1 indicates the disappear-ance of the transitional zone in the southern hemi-sphere leading to the disappearance ofC. pelagicusin this region. Abundance peaks of other speciesincluding H. carteri, S. pulchraand smallGephyro-capsaspp can also be used as markers to identifypalaeoclimatic changes in the subantarctic region,with increases of smallGephyrocapsaspp in MIS 5a useful stratigraphic indicator. Productivity peaksoccur during MIS 1, 3 and 5 but do not always corre-spond with higher percentages of %CaCO3.
The biostratigraphic datum event of the reversalbetweenE. huxleyiand G. muelleraeis identified asyounger than 11 ka in GC07. However, although thisyounger date is possible for this event in the highlatitudes of the southern hemisphere, preferentialdissolution ofE. huxleyiobscuring the 73 ka datumevent cannot be discounted. The barren sample at120 cm may be the result of an erosional event inearly MIS 2.
Acknowledgements
The authors would like to thank the AustralianGeological Survey Organisation for participation inCruise 147, Cath Samson for access to her data andJohn Cox for assistance with graphics. This researchwas supported by the Goddard Sapin-JaloustreScholarship Trust, the Bilateral Science and Technol-ogy Collaboration Program and the Coordinated
C.S. Findlay, J.A. Flores / Marine Micropaleontology 40 (2000) 403–416412

French–Australian Scientific Collaboration on theEnvironment.
Appendix A. Taxonomy
This taxonomic list includes all taxa identified inthis study, following the descriptions and illustrationsby Perch-Nielsen (1985) supplemented by Okada andMcIntyre (1977), Takayama and Sato (1987), Wei andThierstein (1991), Sato and Takayama (1992), Beau-fort (1992) and Okada (1992). Species were identifiedusing both a scanning electron microscope and lightmicroscope. Species are listed in alphabetical order ofFamily name.
Four different species of gephyrocapsids wererecognised, three with medium sized coccoliths andone with very small coccoliths. The three mediumsized coccoliths are interpreted as:G. caribbeanica,with coccoliths between 3 and 6mm and a closed oralmost closed central area;G. oceanica, with cocco-liths approximately 6mm and a bridge almost hori-zontal across the width of the central opening; and,G. muellerae, with coccoliths between 3 and 6mmand a bridge spanning the central area at an obliqueangle. The smallGephyrocapsaspp with coccolithsbetween 1 and 2.5mm are not identified at specieslevel.
The reticulofenestrids were categorised by threesizes: 6–12mm with open (R. pseudoumbilica) andclosed (R. gelida) central areas; 5–8mm with openR. minutula) and closed or small (R. productellaorR. antarctica) central areas; and 3–5mm with aclosed central area. These small species are consid-ered to be end members ofR. productellarather thanR. minuta(,3 mm).
Although a ‘warm water’ and ‘cold water’morphotype of E. huxleyi is observed in livingassemblages of this region (Findlay, 1998; Nishida,1986), only one morphotype is identified in thesediments of GC07. It is possible that the morefragile ‘warm water’ morphotype is subject todissolution and not preserved, or, as the ‘warmwater’ morphotype is at the limit of its range preser-vation in the sediments is diluted by the ‘cold water’form.
A number of coccoliths were grouped together as‘reworked spp’ and are considered to be mostly reti-
culofenestrids altered through mechanical breakageand dissolution precluding positive identification.
Family Ceratolithaceae Norris, 1965Ceratolithus cristatusKamptner, 1950 var.cristatus
Family Calciosoleniaceae Kamptner 1937Calciosolenia murrayiGran, 1912
Family Coccolithaceae Poche, 1913Calcidiscus leptoporus(Murray and Blackman,1898) Loeblich and Tappan, 1978 f.leptoporusCalcidiscus macintyrei(Bukry and Bramlette, 1969)Loeblich and Tappan, 1978Coccolithus pelagicus(Wallich, 1877) Schiller, 1930Oolithus fragilis (Lohmann, 1912) Martini andMuller, 1972 var.fragiliscf. Umbilicosphaera angustiforamen Okada andMcIntyre 1977Umbilicosphaera sibogae(Weber-Van Bosse, 1901)Gaarder, 1970 var.sibogae
Family Discoasteraceae Tan, 1927Discoastersp. Tan, 1927
Family Helicosphaeraceae Black, 1971, emend. Jafarand Martini, 1975Helicosphaera carteri(Wallich, 1877) Kamptner,1954 var.cartericf. Helicosphaera selliiBukry and Bramlette, 1969
Family Noelaerhabdaceae Jerkovic, 1970Cyclicargolithus floridanus(Roth and Hay in Hayet al., 1967) Bukry, 1971Emiliania huxleyi (Lohmann, 1902) Hay andMohler, in Hay et al., 1967 var.huxleyiGephyrocapsa caribbeanicaBoudreaux and Hay,in Hay et al., 1967Small Gephyrocapsasp. cf. G. ericsonii McIntyreand Be, 1967Gephyrocapsa oceanicaKamptner, 1943Gephyrocapsa muelleraeBreheret, 1978Pseudoemiliania lacunosa (Kamptner, 1963)Gartner, 1969
C.S. Findlay, J.A. Flores / Marine Micropaleontology 40 (2000) 403–416 413

Reticulofenestra gelida (Geitzenauer, 1972)Backman, 1978Reticulofenestra pseudoumbilica(Gartner, 1967)Gartner 1969Reticulofenestra minutula(Gartner, 1967) Haq andBerggren, 1978Small Reticulofenestra sp. cf. Reticulofenestraproductella (Bukry 1973) Gallagher 1989 andReticulofenestra antarcticaHaq 1976
Family Pontosphaeraceae Lemmermann, 1908Pontosphaerasp.
Family Rhabdosphaeraceae Ostenfeld, 1899Acanthoicasp.Rhabdosphaera clavigeraMurray and Blackman,1898, var.clavigera
Family Sphenolithaceae Deflandre, 1952Sphenolithussp.
Family Syracosphaeraceae Lemmermann, 1908Syracosphaera pulchraLohmann, 1902
Genera incertae sedisUmbellosphaera tenuis(Kamptner, 1937) Paaschein Markali and Paasche, 1955
References
Baumann, K.-H., 1995. Morphometry of QuaternaryCoccolithuspelagicus coccoliths from northern North Atlantic and itspalaeoceanographical significance. In: Flores, J.A., Sierro, F.J.(Eds.), 5th INA Conference in Salamanca Proceedings, pp. 11–21.
Baumann, K.-H., Matthiesen, J., 1992. Variations in surface watermass conditions in the Norwegian Sea: evidence from Holocenecoccolith and dinoflagellate cysts. Mar. Micropal. 20, 129–146.
Belford, D.J., 1989. Planktonic foraminifera and age of sediments,West Tasmanian margin, South Tasman Rise and Lord HoweRise. BMR J. Aust. Geol. Geophys. 11, 37–62.
Belkin, I.M., Gordon, A.L., 1996. Southern Ocean Fronts fromGreenwich Meridian to Tasmania. J. Geophys. 101 (C2),3675–3696.
Berger, W.H., 1973. Deep-sea carbonates: evidence for a coccolithlysocline. Deep-Sea Res. 20, 917–920.
Biekart, J.W., 1989. The distribution of calcareous nannoplanktonin Late Quaternary sediments collected by the Snellius II expe-dition in some southeast Indonesian basins. Palaentol. proc. B92 (2 (June)).
Callahan, J.E., 1971. Velocity structure and flux of the AntarcticCircumpolar Current of South Australia. J. Geophys. Res. 76,5859–5870.
Connell, R.D., Sikes, E.L., 1997. Controls on Late Quaternary sedi-mentation of the South Tasman Rise. Aust. J. Earth Sci. 44,667–675.
Constans, R.E., 1975. A study of fluctuations in the carbonatecompensation depth in the Southern Ocean south of Australia.MA thesis. Department of Geology, Florida State University.
Exon, N.F., Marshall, J.F., McCorkle, D.C., Alcock, M., Chapro-niere, G.C.H., Connell, R., Dutton, S.J., Elmes, M., Findlay, C.,Robertson, L., Rollet, N., Samson, C., Shafik, S., Whitmore,G.P., 1995. AGSO Cruise 147 Report — Tasman Rises Geolo-gical Sampling Cruise of Rig Seismic: Stratigraphy, TectonicHistory and Palaeoclimate of the Offshore Tasmanian Region.Australian Geological Survey Organisation. Marine, Petroleumand Sedimentary Resources Program. Project 101.202. AGSORecord 1995/56.
Findlay, C.S., 1998. Living and Fossil Calcareous Nannoplanktonfrom the Australian Sector of the Southern Ocean: Implicationsfor Palaeoceanography. PhD thesis. University of Tasmania.
Findlay, C.S., Giraudeau, J., 2000. Extant calcareous nannoplanktonin the Australian sector of the Southern Ocean caustral summers1994 and 1995). Mar. Micropaleontol. 40, 415–437.
Flores, J.A., Sierro, F.J., France´s, G., Vazquez, A., Zamarreno, I.,1997. The last 100,000 years in the western Mediterranean: seasurface water and frontal dynamics as revealed by coccolitho-phores. Mar. Micropal. 29, 351–366.
Flores, J.A., Gersonde, R., Sierro, F.J., 1999. Pleistocene fluctua-tions of the Agulhas Current Retroflection based on the calcar-eous plankton record. Mar. Micropal. 37, 1–22.
Gard, G., 1989. Variations in coccolith assemblages during the lastglacial cycle in the high and mid-latitude Atlantic and IndianOceans. In: Crux, J.A., van Heck, S.E. (Eds.), Nannofossilsand their Applications, Proceedings of the InternationalNannofossil Association Conference, London, 1987. The Brit-ish Micropalaeontological Society / Ellis Horwood, Chiche-ster, pp. 108–121.
Gard, G., Backman, J., 1990. Synthesis of Arctic and Sub-Arcticcoccolith biochronology and history of North Atlantic driftwater influx during the last 500,000 years. In: Bleil, U., Thiede,J. (Eds.), Geological History of the Polar Oceans: Arctic versusAntarctic. Kluwer Academic, Netherlands, pp. 417–436.
Gard, G., Crux, J.A., 1991. Preliminary results from Hole 704A:Arctic-Antarctic correlation through nannofossil biochronology.Proc. ODP Sci. Res., 114.
Geitzenauer, K.R., 1969. Coccoliths as Late Quaternary Palaeocli-matic indicators in the Subantarctic Pacific Ocean. Nature 223,170–172.
Geitzenauer, K.R., 1972. The Pleistocene calcareous nannoplanktonof the subantarctic Pacific Ocean. Deep Sea Res. 19, 45–60.
Geitzenauer, K.R., Roche, M.B., McIntyre, A., 1976. Modern Paci-fic coccolith assemblages: derivation and application to Late
C.S. Findlay, J.A. Flores / Marine Micropaleontology 40 (2000) 403–416414

Pleistocene palaeotemperature analysis. Geol. Soc. Am.Memoir 145, 423–448.
Hays, J.D., Imbrie, J., Shackleton, N.J., 1976. Variations in theearth’s orbit: pacemaker of the Ice Ages. Science 194, 1121–1132.
Hiramatsu, C., De Deckker, P., 1997. The late Quaternary calcar-eous nanoplankton assemblages from three cores from theTasman Sea. Palaeoceanog. Palaeoclim. Palaeoecol. 131,391–412.
Howard, W.R., Prell, W.L., 1992. Late Quaternary surface circula-tion of the southern Indian Ocean and its relationship to orbitalvariations. Palaeoceanography 9 (3), 453–482.
Howard, W.R., Prell, W.L., 1994. Late Quaternary CaCO3 produc-tion and preservation in the Southern Ocean: implications foroceanic and atmospheric carbon cycling. Palaeoceanography 9(3), 453–482.
Jordan, R.W., Zhao, M., Eglinton, G., Weaver, P.P.E., 1996. Cocco-lith and alkenone stratigraphy at a NW Africa upwelling site(ODP 658C) over the last 130,000 years. In: Moguilevsky, A.,Whatley, R. (Eds.), Microfossils and Oceanic Environments.University of Wales Aberystwyth Press, pp. 11–130.
Kleijne, A., 1991. Holococolithophorids from the Indian Ocean,Red Sea, Mediterranean Sea and North Atlantic Ocean. Mar.Micropal. 17, 1–76.
Knappertsbusch, M., 1993. Living and Holocene coccolithophores:Mediterranean Sea. Mar. Micropal. 21 (1-3), 219–247.
Knappertsbuch, M., Brummer, G.-J.A., 1995. A sediment trapinvestigation of sinking coccolithophorids in the North Atlantic.Deep Sea Res. 42 (7), 1083–1109.
Kolla, V., Be, A.W.H., Biscaye, P.E., 1976. Calcium Carbonatedistribution in the Surface Sediments of the Indian Ocean. J.Geophys. Res. 81 (15), 2605–2616.
Lototskaya, A., Ziveri, P., Ganssen, G.M., van Hinte, J.E., 1998.Calcareous nannofloral response to Termination II at 458N,258W (northeast Atlantic). Mar. Micropal. 34, 47–70.
Martinson, D.G., Pisias, N.G., Hays, J.D., Imbrie, J., Moore, T.C.,Shackleton, N.J., 1987. Age dating and the orbital theory of theice ages: development of a high-resolution 0–30,000-yearchronostratigraphy. Quat. Res. 27, 1–29.
McIntyre, A., Be, A.W.H., 1967. Modern coccolithophoridae of theAtlantic Ocean I. Placoliths and cyrtoliths. Deep Sea Res. 14,561–597.
McIntyre, A., Be, A.W.H., Roche, M.B., 1970. Modern Pacificcoccolithophorida: a palaeontological thermometer. N.Y.Acad. Sci. Trans. 32 (6), 720–731 (series II).
McIntyre, A., McIntyre, R., 1971. Coccolith concentrations anddifferential solution in sediments. In: Funnel, B.M., Riedel,W.R. (Eds.), The Micropalaeontology of Oceans, pp. 253–261(chap. 16).
McIntyre, A., Ruddiman, W.F., Jantzen, R., 1972. Southward pene-trations of the North Atlantic Polar Front: faunal and floralevidence of large-scale surface water mass movements overthe last 225,000 years. Deep Sea Res. 19, 61–77.
Morley, J.J., 1989. Variations in the high-latitude oceanographicfronts in the southern Indian Ocean: an estimation based onfaunal changes. Palaeoceanography 4 (5), 547–554.
Nishida, S., 1986. Nannoplankton flora in the Southern Ocean, with
special reference to siliceous varieties. Mem. Nat. Instit. PolarRes. 40, 56–68 special issue.
Okada, H., 1992. Biogeographic Control of Modern NannofossilAssemblages in Surface Sediments of Ise Bay, Mikawa Bayand Kumano-Nada, off Coast of Central Japan. Mem. Sci.Geol., Mem. Ist. Geol. Mineral., Univ. Padova 43, 431–449.
Okada, H., McIntyre, A., 1977. Modern Coccolithophores of thePacific and North Atlantic Oceans. Micropalaentology 23 (1),1–55.
Okada, H., McIntyre, A., 1979. Seasonal distribution of moderncoccolithophores in the western North Atlantic Ocean. Mar.Biol. 54, 319–328.
Okada, H., Wells, P., 1997. Late Quaternary nannofossil indica-tors of climate change in two deep-sea cores associated withthe Leeuwin Current off Western Australia. Palaeoceanog.Palaeoclim. Palaeoecol. 131, 412–413.
Osborn, N.I., Ciesielski, P.F., Ledbetter, M.T., 1983. Disconformi-ties and palaeoceanography in the southeast Indian Oceanduring the past 5.3 million years. Bull. Geol. Soc. Am. 94,1345–1358.
Passlow, V., Pinxian, W., Chivas, A.R., 1997. Late Quaternarypalaeoceanography near Tasmania, southern Australia. Palaeo-ceanog. Palaeoclim. Palaeoecol. 131, 412–413.
Raffi, I., Rio, D., 1981. Coccolithus pelagicus (Wallich) a palaeo-temperature indicator in late Pliocene Mediterranean deep searecord. In: Wezel F.C. (Ed.), Sedimentary basins of Mediterra-nean margins. C.N.R. Italian Project of Oceanography. Tecno-print. pp. 187–190.
Rintoul, S.R., Donguy, J.R., Roemmich, D.H., 1997. Seasonalevolution of upper ocean thermal structure between Tasmaniaand Antarctica. Deep Sea Res. 44 (7), 1185–1202.
Samson, C., 1998. High resolution deglaciation records from thesubtropical and subpolar southwest Pacific: implications fordriving forces of climate. PhD thesis (unpub). University ofTasmania.
Samtleben, C., Schro¨der, A., 1992. Living coccolithophore commu-nities in the Norwegian-Greenland Sea and their record in sedi-ments. Mar. Micropal. 19, 33–354.
Samtleben, C., Baumann, C., Schro¨der-Ritzrau, A., 1995a. Distri-bution, composition and seasonal variation of coccolithophorecommunities in the northern North Atlantic. In: Flores, J.A.,Sierro, F.J. (Eds.), 5th INA Conference in Salamanca Proceed-ings, pp. 219–235.
Samtleben, C., Schafer, P., Andruleit, H., Baumann, A.,Baumann, K.-H., Kohly, A., Matthiessen, J., Schro¨der-Ritz-rau, A., 1995b. Plankton in the Norwegian-Greenland Sea:from living communities to sediment assemblages — anactualistic approach. Geol. Rundsch. 84, 108–136 (SynpalWorking Group; Springer).
Takahashi, T., Broecker, W.S., Bainbridge, W., 1981. The alkalinityand total carbon dioxide concentration in the world oceans. In:Bolin, B. (Ed.), Carbon Cycle Modelling, SCOPE. Wiley, NewYork, pp. 271–286.
Thierstein, H.R., Geitzenauer, K.R., Molfino, B., Shackleton, N.J.,1977. Global synchroneity of late Quaternary coccolith datumlevels: validation by oxygen isotopes. Geology 5, 400–404.
Weaver, P.P.E., 1993. High resolution stratigraphy of marine
C.S. Findlay, J.A. Flores / Marine Micropaleontology 40 (2000) 403–416 415

Quaternary sequences. In: Hailwood, E.A., Kidd, R.B. (Eds.),High Resolution Stratigraphy, 70. Geological Society, pp. 137–153 (special publication).
Weaver, P.P.E., Thomson, J., 1993. Calculating erosion by deep-seaturbidity currents during initiation and flow. Nature 364, 136–138.
Wells, P.E., Connell, R., 1996. Movement of hydrological frontsand widespread erosional events in the southwestern TasmanianSea during the Late Quaternary. Aust. J. Earth Sci. 44, 105–112.
Wells, P., Okada, H., 1996. Holocene and Pleistocene glacialpalaeoceanography off southeastern Australia, based on forami-
nifers and nannofossils in Vema cored hole V18-222. Aust. J.Earth Sci. 43, 509–523.
Wells, P., Okada, H., 1997. Response of nannoplankton to majorchanges in sea-surface temperature and movements ofhydrological fronts over Site DSDP 594 (south Chatham Rise,southeastern New Zealand), during the last 130 kyr. Mar.Micropal. 32, 341–363.
Winter, A., Jordan, R.W., Roth, P.H., 1994. Biogeography of livingcoccolithophores in ocean waters. In: Winter, A., Siesser, W.(Eds.), Coccolithophores. Cambridge University Press, pp.161–178.
C.S. Findlay, J.A. Flores / Marine Micropaleontology 40 (2000) 403–416416