subsurface geology and oil and gas … · subsurface geology and oil and gas resources of osage...
TRANSCRIPT

UNITED STATES DEPARTMENT OF THE INTERIOR Harold L. Ickes, Secretary
GEOLOGICAL SURVEY W. C. Mcndcnhall, Director
Bulletin 900-K
SUBSURFACE GEOLOGY
AND OIL AND GAS RESOURCES OF
OSAGE COUNTY, OKLAHOMA
PART 11. Summary of subsurface geology with
special reference to oil and gas
BY
N. W. BASS
UNITED STATES
GOVERNMENT PRINTING OFFICE
WASHINGTON : 1942
For sale by the Superintendent of Documents, Waahington, D. C. --------- Price 45 cenl
FOREWOKD
This report on the subsurface geology of Osage County, Okla., describes the structual features, the character of the oil- and gas-producing beds, and the localities where additional oil and gas may be found. It embodies a part of the results of a subsurface geologic investigation of the Osage Indian Reservation, which coincides in area with Osage County. The investigation was conducted by a field party of the Geological Survey of the United States Department of the Interior from 1934 to 1937 and involved the study of the records of about 17,000 wells that have been drilled in Osage County. Funds for the investigation were allotted to the Geological Survey by the Public Works Administration. The primary purpose of the examination was to obtain geologic data for use in the administration of the Indian lands. The results of the inquiry have shown that many localities in Osage County outside the present producing oil fields are worthy of prospecting for oil and gas and that additional oil and gas can be found also by exploring deeply buried beds in old producing fields.
All townships in Osage County that contain many wells are described; the information furnished by such townships is ample for drawing detailed subsur face structure-contour maps. The descriptions of several continguous townships are combined in separate reports, which are issued as parts of a single bulletin. No edition of the consolidated volume will be published, but the several parts can be bound together if desired.
The subsurface investigation of Osage County was carried on mainly by L. E. Kennedy, W. R. Dillard, H. B. Goodrich, Charles T. Kirk, J. D. McClure, Otto Leatherock, Constance Leatherock, W. E. Shamblin, J. N. Conley, H. D. Jenkins, J. H. Hengst, G. D. Gibson, and N. W. Bass, geologists. The work of each geol ogist contributed more or less to the results of the investigation in each town ship. However, the investigations of the individual townships in Osage County were made mainly by various individuals of the group, and their names appear in the township descriptions. In addition to those whose names appear above, valuable assistance in the compilation of information was given by Lucile Lin- ton, S. B. Thomas, R. C. Beckstrom, B. A. Lilienborg, J. G. Dwen, K. H. John son, J. G. Beaulieu, C. R. Viers, E. L. Hitt, Grace Clark, R. A. Payne, and J. C. Rollins.
Oil companies and individuals who contributed information are too numerous to acknowledge all by name. Special mention is made, however, of Laughlin- Simmons & Co. and the Indian Territory. Illuminating Oil Co. for supplying most of the well elevations used in Osage County ; of the Continental Oil Co., Tide Water Associated Oil Co., Sinclair Prairie Oil Co., Indian Territory Illuminating Oil- Co., Phillips Petroleum Co., W. C. McBride, Inc., The Carter Oil Co., and others for supplying well logs, maps, cuttings, and cores of the producing sands in Osage County.
H. D. Miser, geologist in clmrge of the section of geology of fuels, supervised the work upon which the report is based. Appreciative acknowledgment is heremade Of many suggestions made by him during the progress of the investigation
and during the preparation of the manuscript. Grateful acknowledgment is due the Osage Tribal Council and the officers of the Osage Indian Agency at Paw- huska and the late John M. Alden, and others in the Tulsa office of the Geological Survey for cooperation and assistance; also Hale B. Soyster and H. I Smith, of the Geological Survey, for sponsorship and interest in the investigation.
N. W. BASS. ii

CONTENTS
Fuge Abstract. __________.________-_____-_-__ _-__-__-__---__--_-------_ 343Introduction______________'___-_--__-_-___-__-__---_-___---___-_--_ 344History. ......................................................... 346
Leasing.________________-__-__-__-___-__-_--_-__-__-__-______ 346Oil .production ________________________________________________ 349Income from oil and gas___----_-_---__-----_-------_----_--_-_- 351
Exposed rocks_________-_____-__-__-_--__-_--__-_-___-__---_-_----_ 353Buried rocks.________-_______-_____---__--_--------__-_-----_---__ 353
Crystalline rocks______________________________________________ 356Siliceous lime_____-__-__--_-----_--__--_-__---__----------_-__ 357Simpson formation. _____-__-_----_-__-_-----_---__----_-______ 359Chattanooga shale__._-_-_.---_--_--__--_-_--_--------------__. 360Burgess sand-Mississippi lime zone_______---___-_________________ 361Taneha sand-__-_________-________-_--__-__-__-_-___-_________ 362Bartlesville sand__________-____-__------_--__-__.__-_________ 362Burbank and Red Fork sands.___'_______________________________ 364Skinner sand. '............\.................................... 365Squirrel (Prue) sand___________________________________________ 366Oswego lime (Fort Scott limestone)______________________________ 367Peru sand___________-___------__-_--.---___-_-._-_-.-_.___.__ 368Big lime (Oologah limestone) and Weiser sand..__________________ 369Wayside sand.__________'________________-_____________________ 370Jones and Cleveland sand zone_______L___________________________ 371
Stratigraphic relationship of the Wayside sand and the Jones andCleveland sand zone.____________________________________ 371
Layton sand __________________________________________________ 372Mussellem and Peoples sand zone________.____'_________________ 374Okesa, Torpedo, and Clem Creek sand zone_-_-__-________-_______ 375Bigheart, Revard, Cheshewalla, and Cochahee sand zone-_--_______ 376
Structure-...-.-------.-----------------------------------------._ 377Relationship of the oil and gas pools to the structure of the rocks____ 380
Siliceous lime and Simpson formation._______________________ 380Burgess,sand-Mississippi lime zone_-_--_-_______________.____ 381Bartlesville sand_______.____________-__ ___________.______ 382Burbank sand_____________________________________________ 383Skinner sand-___--___---_-_____-__-----_--____________..-. 385Squirrel (Prue) sand__-_-__-'_______________________________ ( 385Oswego lime._____________________________________________ 385Peru sand._______________________________________________ 385Big lime._________ ________________________________________ 385Wayside sand. ..........^........................_._....._ 385Jones and Cleveland sand zone._____________________________ 386Layton sand_______________________________________________ 386Mussellem and Peoples sand zone._-_--------_____-_________ 386Okesa, Torpedo, and Clem Creek sand zone___________________ 386Bigheart, Revard, Cheshewalla, and Cochahee sand zone.______ 386Summary_______________________________________________ 386
Possibilities for discovering additional oil and gas__-__-____._-____-_ __ 387
in

IV CONTENTS
ILLUSTKATIONS
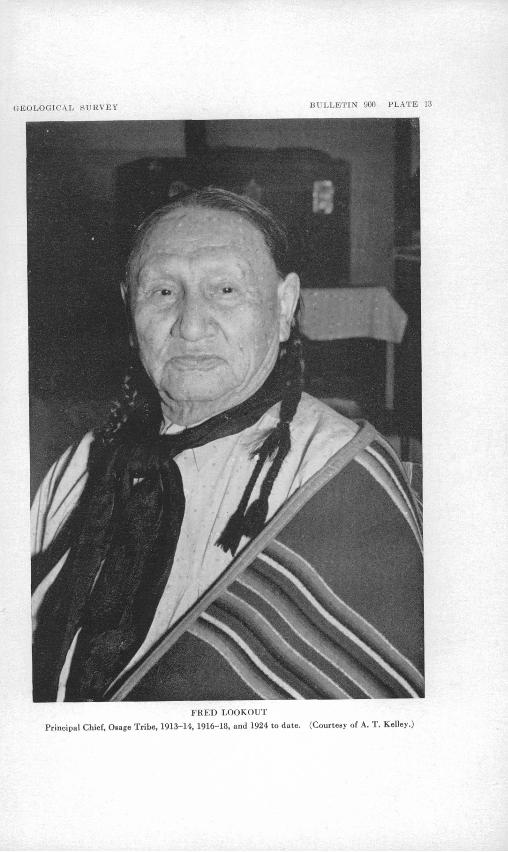
Page PLATE 13. Fred Lookout,"Principal Chief, Osage Tribe.-____---________ 346
14. Geologic section northwest-southeast across Osage County,Okla.j.-------------^-----------.----------------- In pocket
15. Map of Osage County showing oil and gas fields________ In pocket16. Map showing oil and gas pools in the Ordovician beds, mainly
in the Siliceous lime________________________________ In pocket17. Map showing oil and gas pools in the Burgess sand-Mississippi
lime zone_____-__-___-_____,_-________-_-___---___ In pocket18. Map showing oil and gas pools in the Bartlesville sand and oil
pools in the Burbank (Red Fork) sand._______________ In pocket19. Map showing oil and gas pools in the Wayside sand and the
Jones and Cleveland sand zone_____________________ In pocket20. Geologic section across eastern Osage County showing strati-
graphic relationship of the Wayside sand and the Jones and Cleveland sand zone________________________________ In pocket
FIGURE 4. Index map of Osage County showing areas described in parts 1to 10 of this report (Bull. 900-A to 900-J) ________________ 345
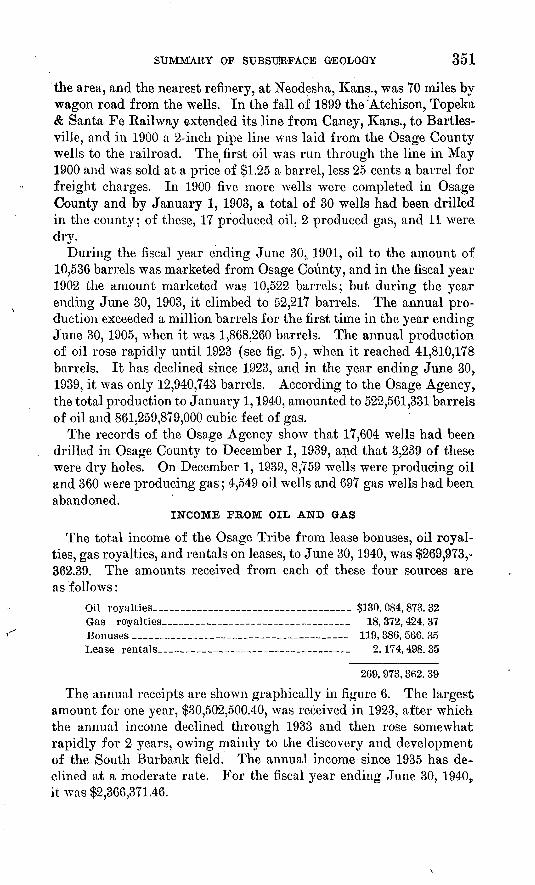
5. Total oil produced from Osage County, by fiscal years___---_. 3506. Annual receipts of the Osage Tribe from oil and gas royal
ties, bonuses, and rentals.___-____-_______-___--._._____ 352

SUBSURFACE GEOLOGY AND OIL AND GAS RESOURCES OF OSAGE COUNTY, OKLAHOMA
Part 11. Summary of subsurface geology with special referenceto oil and gas
By N. W. Bass
ABSTRACT
The area included in Osage County, the largest county in Oklahoma, was purchased in 1872 by the United States Government from the Cherokee Nation, for $1,099,137.41, for use as a reservation for the Osage Tribe. It is known as the Osage Indian Reservation and contains 1,470,934 acres.
The reservation was owned in common by the tribe for 34 years, following which the land was divided among the tribal members. The coal, oil, gas, and other minerals are reserved by acts of Congress to the Osage Tribe in common until April 8, 1983.
Drilling was begun in the reservation in 1896, and oil was discovered in 189T, in the third well drilled. The total income of the Osage Tribe from oil and gas to June 30, 1940, was $269,973,362.39.
The rocks exposed in the county are Pennsylvanian in age, except in a small area in the westernmost part, where Permian rocks are exposed. They consist of alternating beds of shale, sandstone, limestone, and in the western part some redbeds. Wooded hills and ridges composed of sandstone characterize the east ern part of the county, but the western part is an almost treeless, grass-covered upland.
The concealed rocks, as shown by the nearly 18,000 wells drilled for oil and gas, include 2,000 to 5,000 feet or more of sedimentary rocks that overlie a basement complex of pre-Cambrian granite and other igneous and metamorphic rocks. The basement rocks have been reached in 26 wells.
Oil or gas has been produced in Osage County from many different "sands," which may be grouped into 16 principal zones one in the Ordovician system, one in the Mississippian series, and the others in the Pennsylvanian series. Most of the county's yield of oil and g'as has been obtained from the Siliceous lime, of Ordovician age, the Burgess sand-Mississippi lime zone, of Mississippian and Pennsylvanian age, and the Bartlesville and Burbank sands, of Pennsylvanian age. The oil and gas pools in the Siliceous lime and the Burgess sand- Mississippi lime zone are generally located on or near the crests of domes and anticlines, and the edges of the pools are determined by the position of salt water in the oil- and gas-bearing zones on the sides of the folds. Each of these two zones consists in large part of cherty limestone that was weathered and became porous during the existence of ancient erosion surfaces. The Bartlesville and Burbank sands are composed of numerous individual bodies of sand that are widely distributed. Each of the sand bodies is an elongated lens whose length is many times greater than its width, and they all lie in a thick sequence of
343

344 OIL AND GAS RESOURCES OF OSAGE COUNTY, OKLA.
shale the Cherokee shale. The lenses of Bartlesville sand are confined to the east half of the county, and the lenses of Burbank sand to the west half. The sand lenses of each represent deposits of sand that accumulated during Cherokee time as offshore bars along the western shore of an ancient sea. Most of the sand lenses'Contain both oil and gas, but mainly oil, land the limits of the pools are determined by the pinching out of the sand bodies rather than by the structural attitude, of the beds.
The rocks in the eastern half of the county have been folded into many domes, anticlines, structural basins, and synclines, but in the western half very few such features are present. la spite of the numerous local folds the rocks in the county as a whole dip westward at an average rate of 39 feet to the mile, as measured on the top of the Oswego lime (Fort Scott limestone). Many of the domes and anticlines have no systematic arrangement, but some appear to be alined in northeastward-trending belts and others appear to lie in poorly defined northwestward-trending belts. The individual domes and anticlines vary greatly in size, ranging from less than 1 to 3 square miles. The structural relief of the domes and anticlines as mapped on the top of the Oswego lime is low; in only 5 of the 235 domes and anticlines that have structural closure does it exceed 150 feet, and in 58 it ranges from 50 to 150 feet. The structural relief increases progressively but not uniformly with depth, and is thus greatest in the oldest rocks. Although the folds in the subsurface rocks conform in general shape and position to the folds in the exposed rocks, the crests of most, but not all, domes in the buried rocks lie westward of the crests of the domes in the exposed rocks.
Many short normal faults that trend northwestward and are arranged en Echelon in belts that trend in a north-northeasterly direction cut the. exposed rocks but appear to die out at shallow depth. They appear to bear no relation ship to the folds and were not formed until long after the folding was completed.
Additional oil and gas pools will doubtless be discovered in Osnge County, particularly in the Burbank and Bartlesville sands and the Siliceous lime, and greater recoveries of oil from the pools now known can be obtained by the use of secondary recovery methods, such as repressuring with gas, water flooding, and'acid treatment.
INTRODUCTION
Osage County, the largest county in Oklahoma, containing an area of 1,470,059 acres, is in the northeastern part of the State adjoining the Kansas-Oklahoma line. The boundaries of this county coincidewith those of the Osage Indian Reservation. The county is in the
Mid-Continent oil and gas region and contains numerous oil and gas fields, which are widely distributed through most parts of the county. Most of the oil- and gas-producing areas have been de scribed in detail, by township units, in the 10 chapters of this reportpreviously published,1 which are accompanied by subsurface structure contour maps. For the location of the area described in each report see figure 4, In the present chapter the regional structure of the buried rocks and the general character and distribution of the oil- and gas-bearing beds of Osage County are described.
1 Bass, N. W., and others, Subsurface geology and oil and gas resources of Osage County, Okla.; U. S. Geol. Survey Bull. 900, chapters A to J, 1938 to 1942.

SUMMARY OF SUBSURFACE GEOLOGY 345
Nearly 18,000 wells have been drilled in Osage County.« The logs of these wells, supplemented by the results of microscopic examina tion of drill cuttings from 600 or more wells, have furnished abun dant data, on the buried rocks that were not available at the time of the preparation of earlier reports by the Geological Survey on the Osage Eeservation.
PONCA CITY Q
TULSA
FIGURE 4. Index map of Osage County, Okla., showing areas described in parts 1 to 10 of this report (Bull. 900-A to 900-J).
The reports listed below have aided materially in the discovery of many oil and gas fields in Osage County.HEAIJD, K. C., The oil and gas geology of the Poraker quadrangle, Osage County,
Okla.: U. S. Geol. Survey Bull. 641, pp. 17-47,1916.HEALD,' K. C., Geologic structure of the northwestern part of the Pawhuska quad
rangle, Okla.: U. S. Geol. Survey Bull. 691, pp. 57-100, 1918.WHITE, DAVID, and others, Structure and oil and gas resources of the Osage
Reservation, Oklahoma: U. S. Geol. Survey Bull. 686, 427 pp., 60 pis., 1922. A comprehensive report that includes detailed maps of the Osage Reserva tion in township units, showing the structure of the exposed rocks, descrip tions of the exposed and buried rocks with particular reference to oil- and gas-bearing beds, and recommendations for sites for drilling.
WOOD, R. H., Map of part of the Hominy quadrangle, Osage County, Okla. (unpublished, in flies of the Geological Survey).
346 OIL AND GAS RESOURCES OF OSAGE COUNTY, OKLA.
HISTORY
The area that now constitutes Osage County, Olda., was purchased in 1872 by the United States Government from the Cherokee Nation for use as a reservation for the Osage Tribe, and during that year the Osages moved onto their reservation. The transaction was not completed, however, until June 14, 1883, the date of the execution of the deed. The price paid was $1,099,137.41, which, is about 70. cents an acre. Some years later the bonuses and royalties from oil leases on each of many tracts of 160 acres within the reservation amounted to more than twice the purchase price of the entire.reservation,- and for a period of 8 years beginning in 1920, the average annual income of each member of the Osage Tribe exceeded the original price of the reservation.
The Osage Indian [Reservation was owned in common by the tribe for 34 years. Then, by an act of Congress approved June 28, 1906, the land included in the reservation was divided among the 2.229 members, each receiving an allotment of 657 acres, which is a few acres more than 1 square mile. The coal, oil, gas, and other minerals were reserved by this act to the Osage Tribe in common for a period of 25 years following April 8,1906. The period of ownership in com mon has had several extensions, the last being by an act of Congress approved June 24, 1938, which advanced the date to April 8, 1983. On January 1, 1938, 2,032 of the original 2,229 mineral snares, called head rights, belonged to 1,909 Osage Indians, 55 shares belonged to 92 Indians not members of the Osage Tribe, and whole or fractional shares totaling 142 belonged to 233 white persons or corporations. Thus the ownership of about 9 percent of the original mineral shares has passed from the Osage Indians to white persons or to Indians of tribes other than the Osage.
LEASING
The first oil-and-gas lease in Osage County was obtained March 16, 1896, by Edwin B. Foster of Westerly, R. I., who was then engaged with his brother in building a railroad from Kansas City to Coffey- ville, Kans., and had become interested in the possibility of an extension of the Kansas oil fields southward into Indian territory.The lease was executed by James Bigheart, principal chief of theOsage Tribe, and was approved by Hoke Smith, Secretary of the Interior under President Cleveland. The lease granted to the lesseeexclusive right to oil and gas on the entire Osage Nation, for a period
of 10 years and provided for royalties of $50 annually for each gas well and one-tenth of all oil produced. The proceeds from the royalties were to be distributed among all the members of the Osage
GEOLOGICAL SURVEY BULLETIN 800 PLATE 13
FRED LOOKOUT Principal Chief, Osage Tribe, 1913-14, 1916-18, and 1924 to date. (Courtesy of A. T. Kelley.)

SUMMARY OF SUBSURFACE GEOLOGY 347
Tribe. The lease was later assigned to the Phoenix Oil Co., and an area of 60 square miles in the reservation was assigned to the Osage Oil Co. In January 1902 the Indian Territory Illuminating Oil Co. was formed and took over all interest in the lease.
On March 3, 1905, the Foster lease was renewed for an additional period of 10 years from March 16, 1906, but was restricted to an area of 680,000 acres in the eastern part of the reservation. The terms of the renewal increased the gas royalty from $50 to $100 a year for each well and increased the oil royalty from one-tenth to one-eighth of the oil marketed. On April 11, 1912, leases for oil and gas were awarded to bidders who had submitted sealed bids offer ing bonuses. On September 29,1913, the practice of obtaining sealed bids was replaced by public auctions at which bidders made their bonus offers by oral competitive bidding. Although the early leases embraced large tracts, the practice since 1916 has been to confine each lease to a tract of 160 acres or less. The Foster lease expired March 16, 1916. On March 17, 1916, the Tribal Council, with the approval of the Secretary of the Interior, awarded to the operating sublessees the tracts embraced by the Foster lease whose wells pro duced less than 25 barrels per well per day. For wells that produced more than 25 barrels per well per day subleases for tracts of 160 acres were sold at public auctions beginning on April 20, 1916.
The oil leases stipulate the payment of a royalty of one-sixth of the oil produced from tracts whose monthly average per well is less than 100 barrels per day and one-fifth of the oil produced from tracts whose monthly average per well equals or exceeds 100 barrels per day. The leases entered into at the auction sales become effective after approval by the Osage Tribal Council and the Secretary of the Interior. The Council for many years, including the period of the present investigation, has been presided over by Principal Chief Fred Lookout (pi. 13).
At the first public auction of leases the auctioneer, Col. E. Walters of Skedee, Okla., disposed of 12,049 acres for a total bonus of $498,182.58. By April 2, 1940, 52 auction sales had been held, all of which had been cried by Colonel Walters, and the total of bonuses had amounted to $114,154,561.86. A record of the auction lease sales is given in the table on the following page.
At the first two sales, November 11, 1912, and September 29, 1913, listed in the table, the leases were executed for the combined oil and gas rights; but at the other sales the oil and gas rights were leased separately. Of the 52 auction sales of oil rights that had been held by 1940, the maximum total of bonuses received fom a single sale was $14,144,000, which was received for the sale held on March 18 and 19,
459067 42 2

348 OIL AND GAS RESOURCES OF OSAGE COUNTY,, OKLA.
1924; at this sale oil leases for 48,422 acres were sold at an average price of $292.09 an acre. Over a period of 20 years or more-a- total of $64,127,300 in cash bonuses has been received for leases in the Bur- bank field alone. Over a period of years in the 1920's bonuses exceed ing $1,000,000 were paid for <each of 21 tracts of 160 acres in the Burbank field, and in 1920, a bonus of $1,990,000 was paid for one tract of 160 acres, the NW*4 sec, 14, T. 27 N., R. 5 E. Auction lease sales are still held, and Colonel Walters still officiates as auctioneer, but since 1937 the total of the bonuses bid at a single sale has seldom amounted to as much as $50,000.
Auction sales of leases for oil rights on Osage Indian lands
Date of sale
Nov. 11, 1912 1. Sept. 29, 1913 i. ............ .............................Apr. 20, 1916---.-. --------------.-, ----------------June 20,-1916... ...........................................May31,1917._ .
Feb. 14, 1918...... .... . - - . May 18, 1918 Nov. 9,1918 - ................................Mar. 5, 1919.. ..........................................
Oct. 6, 1919.... ........... .........^... ..............Feb. 3, 1920.. ........................................... ..MaylS, 1920 . Oct. 12, 1920..-. June 14, 1921 . __ . . . ___ ... .Dec- 12, 1921 ... ... ... . . . . _. .Mar. 2, 1922.... ............. ............^....... ..........June 28, 1922. __Jan.18, 1923... ___Apr. 5, 1923 - _ ___Mar.18-19, 1924 . .... June 30, 1924 _ ... . .. ...Dec. 18, 1924... Mar. 18,1925 Mar. 17-18, 1926 ........................................Sept. 30, 1926.. ...... .. .. . . . .... ..... . . .Mar. 28, 1927........ ..... ... . . . _ . _Dec. 12, 1927............ ... ...... ....... .Mar. 28-29, 1928. . . ,. . ... . ... .Sept. 27, 1928-..--...........- . Dec. 11, 1928 Sept. 20, 1929...-- .............. ..^. .........Sept. 29, 1930.-.. ..- __ ... .. __ ...... _____ .- ...-Mar. 22, 1932,. ................ ........ . ............. . .Sept. 28, 1932..... ......... ..... . ..... ... .Dec- 20, 1932 ____..__. . . . . . .Mar. 21,1933 .............. . . . ........... . .Oct. 30, 1933. ... , .... .... . . . .Feb. 7, 1934....... ........................................Sept. 18, 1934-. ........ ..... ......... ,Mar. 27, 1935. ... .... .. .Sept. 24, 1935-- Feb. 11, 1936 Mar- 10, 1937 _ --. .-_----. . : .......June22, 1937 ____ _ ____ . __ ... ... .. .Jan. 26, 1938 ... .... . .Mar. 29, 1938 ... ... , ___ Dec- 6, 1938 ............. ............................ ..Mar. 21, 1939 ............................... ...........Aug. 17, 1939..... Apr. 2, 1940. .
Acres leased
24, 541. 0010, 132. 3114, 377. 002,171.008, 160. 00
20, 029. 0030,080.0035, 225. 0034,720.0020,040.0036,897.0034, 255. 0029,533.0029,543.0034, 453. 0024, 158. 70
33,152.9721,919.2421,720.004 ,422.2410,917.328, 289. 73
43, 953. 8815,200.0018, 736. 2618, 720. 0062,000.0018,594.7526,802.3018,420.814, 539. 12
17.639.-007,840.008, 422. 805,118.944,480.00
11, 114. 9313,040.0011,548.009,714.76
11,139.0811,687.25
11,199.57
o 477 nn8,960.00
10, 080. 009,719.00
1,040,375.67
Bonus received
$39,436.00498, 182. 58
2,057,600.001,169,280.781,967,600.001,682,750.001,275,500.001, 168, 350. 003,350,200.002, 783, 125. 003,773,175.005,967,525.003,039,475.002,817,575.003, 903, 862. 504,478,250.00
3, 946, 687. 5010,889,475.006,094,900.00
14, 144, 000. 002, 249, 618. 751,085,875.00
3,990,355.00
2,431,650.002,267,550.002, 427, 850. 00
974, 293. 75431,785.00416, 200. 00
28, 100. 0094,611.2527, 637. 50
101, 243. 758, 637. 503,787.50
227,450.00950, 650. 00
1,057,043.75630,275.00812, 875. 00373, 300. 00
7, 725. 0026, 975. 00
15,600.0019,805.0047, 350. 0017, 687. 50
114,154,561.86
Average bonus per.
acre :
$1.6049.17
143. 11538.59241. 1284.0142.40
96.49138.87102. 26174. 20102. 9195.37
' 113.30185. 36207.51IfiQ Q9
278.045fiQ Id
206.05130. 9961. 60
' 90. 78139 26129. 78121.1239.1552.3916.1122.606. 195.363.55
12.03[- 1.70' .8720.4775.8392.2865.6272.9831.95
1 ^32.401 42I n r
9 91
4.691 fl^
1 Lease included combined oil and gas rights.

SUMMARY OF SUBSURFACE GEOLOGY 349
The gas leases shown in the following table have been executed since 1913, the last year in which the oil and gas rights were leased together. The leases provide for a royalty of 18 cents a thousand cubic feet of gas at the well and stipulate the minimum amount that must be expended annually for development drilling in order to maintain a certain average open flow of gas per day.
Auction sales of leases for gas rights on Osage Indian lands
Date of sale
May 17,1910......Do.............
Do. ..........
Do...........
DO....:......Do...-.--....
July 19, 1916......Nov. 9,19181-... Junc6, 1919 ......
Do.'.. ....... -Oct. 25, 1922......
Acres leased
337, 400107, -200
104, 960
Id'5, 700
181, 120
6,40019, 680
192, 048 153, 640166, 400
2,400
1,43?, 008
Bonus
$1,920.48 447, 440. 00614, 560. 00
1,0'J5,02'.).4S
Lessee
Oklahoma Co.).
Home).
Gas Co.).
Co.).
Kay County Gas Co. Do.
1 Sold at public auction; all others were awarded v ithout bonus.
OIL PRODUCTION
The drilling of the first well in Osage County was begun in June 1896 by the Phoenix Oil Co., about 100 yards south of the Oklahoma- Kansas boundary, in the NE%NW^4NE% sec. 13, T. 29 N., R, 10 E. The well found only slight shows of oil and gas and was plugged as a dry hole in July of the same year, at a depth of about 1,100 feet. In the fall of 1896 a second dry hole was drilled by the same company to a depth of about 1,500 feet, about 6 miles west of the first hole. On October 28, 1897, the Phoenix Oil Co. completed its third hole in Osage County in the northeast corner of the SW% sec. 34, T. 27 N., R. 12 E., as a producing oil well in the Bartlesville sand, with an initial daily yield of 20 barrels. The discovery of oil in this well followed by 7 months the completion of the first oil well in Oklahoma, which was drilled by the Cudahy Oil Co. in- sec. 12, T. 27 N., R. 12 E., a short distance east of Osage County and about 2,y2 miles southeast of the Phoenix Oil Co.'s first producing well. The Cudahy Oil Co.'s well was completed in March 1897 in the Bartlesville sand but was shut in until 1903 because of litigation over title to the land.
At the time these two wells were completed there was no market for the oil they produced. This part of the present State of Oklahoma then had only a sparse population. Tulsa and Bartlesville, which are now the two largest cities in the area, were then but small villages, each having about 100 residents. No railroad or pipe line traversed

350 OIL AND GAS RESOURCES OF OSAGE COUNTY, OKLA.
o
/X/
~~ ~~-
^
^ -
1^
"^
s
^^,
/
^X
\ "̂^
/-X\
y
\^A
\
\/
\/\/
x^
\\
6C6I
8E6I
IC6I
9C6I
SC6I
CC6/
ZC6I
oeei
6Z6I
8261
1261
9261
9261
C26I
2261
1261
6161
8161
9161
9161
fl6l
Cl 61
2161
1 161
0161
6061
8061
1061
9061
9061
f06l
CO6I
2061
IO6Io o o O 0
bo
O
K O<do in
SUMMARY OF SUBSTJ1RFACE GEOLOGY 351
the area, and the nearest refinery, at Neodesha, Kans., was 70 miles by wagon road from the wells. In the fall of 1899 the Atchison, Topeka & Santa Fe Railway extended its line from Caney, Kans., to Bartles- ville, and in 1900 a 2-inch pipe line was laid from the Osage County wells to the railroad. The ( first oil was run through the line in May 1900 and was sold at a price of $1.25 a barrel, less 25 cents a barrel for freight charges. In 1900 five more wells were completed in Osage County and by January 1, 1903, a total of 30 wells had been drilled in the county; of these, 17 produced oil, 2 produced gas, and 11 were dry.
During the fiscal year ending June 30, 1901, oil to the amount of 10,536 barrels was marketed from Osage County, and in the fiscal year 1902 the amount marketed was 10,522 barrels; but during the year ending June 30, 1903, it climbed to 52,217 barrels. The annual pro duction exceeded a million barrels for the first time in the year ending June 30, 1905, when it was 1,868,260 barrels. The annual production of oil rose rapidly until 1923 (see fig. 5), when it reached 41,810,178 barrels. It has declined since 1923, and in the year ending June 30, 1939, it was only 12,940,743 barrels. According to the Osage Agency, the total production to January 1,1940, amounted to 522,561,331 barrels of oil and 861,259,879,000 cubic feet of gas.
The records of the Osage Agency show that 17,604 wells had beer* drilled in Osage County to December 1, 1939, and that 3.239 of these were dry holes. On December 1, 1939, 8,759 wells were producing oil and 360 were producing gas; 4,549 oil wells and 697 gas wells had been abandoned.
INCOME FROM OIL AND GAS
The total income of the Osage Tribe from lease bonuses, oil royal ties, gas royalties, and rentals on leases, to June 30,1940, was $269,973,- 362.39. The amounts received from each of these four sources are as follows:
Oil royalties______________________ $130, 084,873, 32 Gas royalties______________________ 18, 372, 424. 37 Bonuses _________-________________ 119, 386, 566. 35 Lease rentals______________________ 2,174,498.35
269, 973, 3tf2. 39
The annual receipts are shown graphically in figure 6. The largest amount for one year, $30,502,500.40, was received in 1923, after which the annual income declined through 1933 and then rose somewhat rapidly for 2 years, owing mainly to the discovery and development of the South Burbank field. The annual income since 1935 has de clined at a moderate rate. For the fiscal year ending June 30, 1940,, it was $2,366,371.46.

^3
0,0
00
,00
0 I
25,0
00,0
00
20,0
00,0
00
15,0
00,0
00
10,0
00,0
00
5,0
00
,00
0
o
o 0
60
6
to O o d »
o H
CO o O
FIG
UR
E 6. A
nnual
rec
eipt
s of
th
e O
sage
Tri
be f
rom
oil
and
gas
roy
alti
es,
bonu
ses,
and
ren
tals
.

SUMMARY OF SUBSURFACE GEOLOGY 353
EXPOSED ROCKS
Rocks of Pennsylvanian age are exposed at the surface in all of Osage County except the extreme westernmost part, where .the sur face rocks are of Permian age. Because the strata have a regional westward clip and the surface of the land rises in the same direction, youn'ger and stratigraphically higher beds are exposed progressively toward the west. The outcrops of the formations occupy narrow belts that trend in a north-northeast direction across the county.2
The sequence of exposed rocks in most of the eastern half of the county consists of about 1,500 feet of strata, extending upward from the middle of the Coffeyville formation to the Pawhuska for mation. This sequence of beds contains thick units of sandstone, which form fairly rugged hills thickly forested with scrub oaks. Toward the west these sandstones dip beneath the surface and yield oil and gas in several localities in Osage County. Above the base of the Pawhuska formation, whose outcrop belt passes northeast ward a short distance west of Pawhuska, is a sequence of beds about 1,600 feet thick, consisting of interbedded shale and limestone with some redbeds in its upper part. This sequence of rocks forms the treeless, grass-covered uplands of western Osage County that are utilized as pasture lands for cattle. (See pi. 14.)
BURIED ROCKS
Above the crystalline rocks that form the basement in Osage County is a sequence of sedimentary rocks whose thickness ranges from about 2,000 feet over peaks of pre-Cambrian rocks in the southeastern part of the county to about 5,000 feet in the western part. The lowermost 1,400 feet of the sedimentary rocks is com posed mainly of limestone and dolomite, ranging in age from Cam brian to Mississippian. Oil and gas are produced from several zones in these beds. (See pi. 15.) The succeeding 3,000 feet of strata is composed mainly of shale but contains some beds of sand stone and limestone and, in its uppermost part, some beds of red- rock. The age of most of this sequence is Pennsylvanian, although the uppermost part is Permian.
The Pennsylvanian series in Osage County includes 14 zones that are oil- or gas-bearing, and some of these zones contain several oil- or gas-bearing sands. Of the 14 zones, the Bartlesville and Bur- bank sands, in the Cherokee shale, have produced most of the oil and gas yielded by Pennsylvanian beds.
Studies of Pennsylvanian rocks have been made recently by geolo gists of the State Geological Survey of Kansas investigating out-
3 Miser, H. D., Geologic map of Oklahoma: U. S. Geol. Survey. 1926.

354 OIL AND GAS RESOURCES OF OSAGE COUNTY,, OKLA.
crops in southern Kansas on the north margin of Osage County, Okla,, and by geologists of the Oklahoma Geological Survey work ing on the east border of Osage County. These investigators have introduced new names for some units and have redefined a few units previously named. The relationship of the names used in the present report to those used in the reports of the other investigators is shown in the table following.
Names used for the oil- or gas-tearing beds of the Pennsylvanian series in OsageCounty
U. S. GEOLOGICAL SURVEY
After Miser, H. D., Geologic map of Oklahoma, U. S. Oeol. Survey, 1926; Could, C. N., Index to the stratigraphy of Oklahoma, Oklahoma Qeol. Survey Bull. 35, 1925; White, David, and others. Structure and oil and gas resources of the Osage Reservation. Okla.: U. S. Oeol. Survey Bull. 686, 1922.
Carboniferous system. Pennsylvanian series.
Pawhuska formation.
Elgin sandstone. Nelagoney formation.
, Oread (?) limestonemember.
Wynona and Four-mlle sandstonemembers.
Cochahec sandstommember.
Cheshewalla and Bevard sandstone members.
Bigheart sandstone member.
OKLAHOMA GEOLOGICAL SURVEY
Oakes, M. C., Geology and min eral resources of Washington County, Okla,: Oklahoma Geol. Survey Bull. 62. 1940.
Unconformity. Missouri subseries.
KANSAS GEOLOGICAL SURVEY
All above Missouri series after Moore, R. C., Stratigraphic clas sification of the Pennsylvanian rocks of Kansas? Kansas Geol. Survey Bull. 22,1930; Guidebook, llth Annual Field Conference, Kansas Geol. Soc., 1937. All below the top of the Missouri series after Abernathy, G. E., Oil and gas in Montgomery County, Kans.: Kansas Geol. Survey Bull. 31, 1940.
Pennsylvanian system. Virgil series.
Calhoun shale. Deer Creek limestone.
Ervine Creek lime stone member.
Larsh-Mission Creekshale member.
Rock Bluff limestonemember.
Oskaloosa shale mem ber.
Ozwakie limestonemember.
Tecumseh shale. Lecompton limestone.
Avoca limestone mem ber.
King Hill shale mem ber.
Beil limestone mem ber.
Queen Hill shale mem ber.
Big Springs limestone- member.
Doniphan shale mem ber.
Spring Branch lime- Stone member.
Kanwaka shale. Oread limestone.
Plattsmouth limestonemember.
Heebncr shale member. Leavenworth lime
stone member.Snydervillc shale mcm-
Der. Toronto limestone
member. Douglas group.
Lawrence shale.
Amazonia limestonemember.
Ireland sandstonemember.
Robbins shale member Haskell limestone. Stranger formation.
Vinland shale member. Tongonoxie sandstone
member. Disconfqrmity. Missouri series.

SUMMARY OF SUBSURFACE GEOLOGY 355
Names used for the oil- or gas-bearing beds of the Pennsylvanian series in OsageCounty Continued
U. 3. GEOLOGICAL SURVEY continued
Carboniferous system Con. Pennsylvanian series Con.
Ochelata formation.
Okesa, Torpedo, and Clem Creek sand stone members, undifierentiatcd.
Avant limestone member (local).
Dewey limestone (local). Nellie Ely formation. Hogshooter limestone.
Coffeyville formation.
Checkerboard lime stone member.
Lenapah limestone. Nowata shale. Oologah limestone.
Labette shale.Fort Scott limestone.Cnerokee shale.
OKLAHOMA GEOLOGICAL SURVEY continued
Ochelata group. Weston shale.
UndiUerentiatcd shale and sand stone.
"The Okesa" sand stone and shale.
Birch Creek lime stone.
Unconformity. Unnamed shale. Torpedo sandstone. Wann formation, lola formation.
Avant limestonemember.
Muncie Creekshale member.
, Paola limestonemember.
Chanute formation. Carboniferous
shale member. Cottage Grove
sandstone. Thayer coal mem
ber. Unnamed shale
member. Noxie sandstone
member.Basal conglomer
ate member. Unconformity, Skiatook group.
Dewey limestone. . Nellie Ely formation. Hogshpoter limestone.
Wintcrset lime stone member.
Stark shale mem ber.
Canville lime stone member.
Coffeyville formation. Shale.Dodds Creek sand
stone member. Shale.
Checkerboard forma tion.
Seminole formation. Sandstone and
shale. Shale. Sandstone and
shale.Unconformity. Des Moines subseries.
Memorial shale. Lenapah limestone. Nowata shale. Altarnont limestone. Bandera shale.
Eawnee limestone, abette shale.
Fort Scott limestone. Cherokee shale.
KANSAS GEOLOGICAL SURVEY-continued
Ochelata group. Weston shale.
Stanton limestone.
Lane-Vilas shale.
lola limestone.
Chanute shale.
Skiatook group. Drurn limestone. Ghefryvale shale. Dennis limestone.
Coffeyville shale.
Checkerboard lime stone.
Seminole sandstone.
Disconformity. Des Moines series.
Marmaton group.Memorial shale.Lenapah limestone.Nowata shale.Altamont limestone.Bandera shale.Pawnee limestone.Labette shale.Fort Scott limestone.Cherokee shale.
459067 42-

356 OIL AND GAS RESOURCES OF OSAGE COUNTY, OKLA.
Crystalline rocks of pre-Cambrian age form the basement of Osage County upon which the sediments were deposited. Inasmuch as the crystalline rocks of other parts of the mid-Continent region are known to include a variety of igneous and metamorphic rocks,3 it is probable that those of Osage County, also include both igneous and metamor phic rocks, all of which are referred to locally as "granite." Pink to pinkish-brown granite has been identified from miscroscopic examina tions made by different petroleum geologists of drill cuttings from 16 wells. Cuttings from the other 10 wells in Osage County that have reached pre-Cambrian rocks have not been available for study.
The upper surface of the pre-Cambrian rocks lies at a depth of about 2,200 feet on the dome in sees. 4, 5, 8, and 9, T. 20 N., R. 12 E.', near the southeast corner of Osage County; at about the same depth on the anticline in the southern part of T. 22 N., R. 10 E.; at a depth of about 2,400 feet on a dome in T. 23 N., R. 8 E., iy2 miles north of Hominy; at a depth of about 2,800 feet in sec. 19, T., 25 N., R. 8 E.; and at a depth of about 4,600 feet in sec. 11, T. 27 N., R. 5 E., in the northern part of the Burbank field. (See pi. 14.) The pre-Cambrian surface thus slopes westward, ranging in altitude from about 1,300 feet below sea level near the southeast corner of the county to 3,400 feet below sea level in the northern part of the Burbank field.
Deep wells in Osage County and within a few miles of its boundary indicate that the floor of pre-Cambrian rocks has considerable relief. For example, granite was encountered only 40 feet beneath the base of the Mississippi lime and at an altitude of 1,661 feet below sea level in well 2 in the SW}4 sec. 9, T. 21 N., R. 9 E., but three other wells in the same township reached greater depths without encountering gran ite. One of these, in the NW14 sec- 26, reached a stratum whose alti tude is 2,483 feet below sea level; another, in the S'W^SE^ sec. 19, penetrated sedimentary rocks at an altitude of 2,345 feet below sea level; and another well in the SW*4 sec- 20 was carried to a depth of 2,325 feet below sea level without encountering granite.
Further evidence is furnished by deep wells in T. 24 N., Rs. 10 and11 E. Well 8 on the dome in the SEU sec. 30, T. 24 N., R. 11 E., en-
countered granite at an altitude of 933 feet below sea level, but well 17 in the NW^4 sec. 12, T. 24 N., R. 10 E., reached granite at an alti tude of 2,095t feet below sea level, The wells in Osage County reJported to have reached pre-Cambrian rocks are listed in the following
table.
8 Landes, K. K., A petrographic study of the pre-Cambrian of Kansas: Am. Assoc. Petroleum Geologists Bull., vol. 11, no. '8, pp. 822-824,1927.

SUMMARY OF SUBSURFACE GEOLOGY 357
Wells in Osagte County that reached pre-Cambrian rocks
Operator
Do.... ----------------------
Finance Oil Co. and Foster & Davis.
Red Bank Oil Co.. .......... ...
Do...... ~
Do. --------------------Darby Petroleum Corporation..
Sinclair Prairie Oil Co. andPure Oil Co.
Do _..--..----- T'VlO I^AYQG f^n
Amerada Petroleum Corporation.
Marland Oil Co. and Kay County Gas Co.
Oled Oil Co.. -..---- F. M. Penny and B. Ulrich ._Barnsdall Oil Co ...............
Well No.
212223
12
34
218
19
2026
121416
171
1691
2
34117891
17
Location
NE. corner of NEM sec. 8, T. 20 N., R. 12 E_...._NEJiNEM sec. 8, T. 20 N., R. 12 E... .............
E.
SWM sec. 9, T. 21 N., R. 9 E... ...................SW. corner of SEJ4 sec. 19, T. 21 N., R. 9 E.......
SW. corner of SEJ<NWM sec. 14, T. 22 N., R. 8 E.Center of <west line of EJ^NEK sec. 32. T. 22 N.,
R. 10 E." Center of south line of NEM sec. 32, T. 22 N., R.
10 E. SWMSE^NE^ sec. 32, T. 22 N., R. 10 E... ......Center of west line of EHW^NW^ sec. 33, T. 22
N., R. 10 E. Center of NE^SE^ sec. 25, T. 23 N., R. 8 E......NE^SW^SE^ sec. 25, T. 23 N., R. 8 E. .........NEMSWKSEJ4 sec. 25, T. 23 N., R. 8 E-.. ......SWM sec. 9, T. 23 N., R. 8 E....... ...............
SWM sec. 9, T. 23 N., R. 8 E... ..................Center of NJ^SK sec. 36, T. 23 N., R. 10 E. .......NWMSEM sec.'7, T. 23 N., R. 11 E... ............
SE^NEJi sec. 16, T. 24 N., R. 8 E. ..............
SE^NEMNEM sec. 16,' T. 24 N., R. 8 E..........NWJ4 sec. 15, T. 24 N., R. 8 E.. ..................NWM sec. 12, T. 24 N., R. 10 E...................SEJ4 sec. 30, T. 24 N., R. 11 E. .................SWM sec. 19, T. 25 N., R. 8 E. ...................NWM sec. 9, T. 26 N., R. 6 E ....................NE corner of SEJ4 sec. 11, T. 27 N., R. 5 E........
Depth to pre-Cam-
brian rocks
Feet 2,1402,2152,425
2 7572,5763,200
i 3, 422I 9 917
i 2, 387
i 2, 2672,622
i 2, 545' 2, 383
' 2, 678
(00)
2,360
' 2, 480
i 2, 708i 2, 505
2,8909 31Q
1 9 ft'Mi 4, 230' 4, 568
i Rock reported as granite from microscopic examination of drill cuttings made by petroleum geologists.
SILICEOUS LIME
The Siliceous lime consists mainly of gray limestone and dolomite; some beds are cherty, and the chert is commonly oolitic. Some thin beds of greenish gray shale and beds of sandstone are recorded in the well logs. The lower part of the sequence of beds that consti tute the Siliceous lime is of probable Cambrian age and the upper part of Ordovician age. Probably all these beds are equivalent to parts of the thick Arbuckle limestone of southern Oklahoma, and the name Arbuckle is applied to them in Osage County by many workers. Microscopic examinations of siliceous residues obtained from cuttings of the Siliceous lime in deep wells at places in south eastern Kansas not far from Osage County have been made recently by Keroher 4 and McQueen.5
The following formations of the Cambrian and Ordovician systems which crop out in Missouri, have been identified in these Kansas
4 Keroher, R. P., in Abernathy, G. E., Oil and gas in Montgomery County, Kans., Kansas Geol. Survey Bull. 31, pp. 10-13, 1940.
0 McQueen, H. S., Missouri Bureau of Geology and Mines, unpublished notes on,well logs supplied by G. E. Abernathy.

358 OIL AND GAS RESOURCES OF OSAGE COUNTY, OKLA.
wells: Lamotte sandstone, lying on pre-Cambrian granite; Bonne- terre dolomite; Potosi dolomite; Eminence dolomite; Van Buren formation, including the Gunter sandstone member; Gasconade dol omite; Roubidoux formation; Jefferson City dolomite; and Cotter dolomite. The formations listed probably are present in Osage County and probably could be identified by an examination of the siliceous residues obtained from well cuttings.
Deep wells in Osage County indicate that the Siliceous lime is commonly 1,000 feet or more thick, but on prominent domes it is thin and in some places it is absent from the tops of the peaks of pre-Cambrian crystalline rock. For example, this lime is absent from the crest of the granite peak that underlies the dome in the SE% sec. 25, T. 23 N., R. 8 E., but is present on the flanks of the dome; in the NW}4 sec. 21, of the same township, 3i/^ miles northwest of the dome, well 25 of the Beacon Oil Co., penetrated the lime to a depth of 600 feet without reaching its base. The Siliceous lime is only 250 feet thick in well 1 on the crest of the dome in the SEP4 sec. 7, T. 23 N., R. 11 E., but well 4 in the SW% sec. 16, 2y2 miles northeast of that dome, stopped in the Siliceous lime after penetrating 600 feet below its top.
On the crest of the dome in the SE% sec. 30, T. 24 N., R. 11 E., the Siliceous lime is thin or absent, for beds of limestone, most or all of which are probably in the Mississippi lime and having a total thickness of only 218 feet, intervene between the Pennsylvanian series and the pre-Cambrian rocks. On an anticline in the NW% sec. 12, T. 24 N., R. 10 E., a little less than 4 miles northwest of the dome, well 17 of the Barnsdall Oil Co. reached pre-Cambrian rocks beneath a total thickness of 796 feet of the Siliceous lime. Moreover, in the synclinal areas near the anticline, the lime is probably of greater thickness than 796 feet. In western Osage County the Siliceous lime is 1,055 feet thick in well 17 of the Phillips Petroleum Co. in the NE^SE^ sec. 11, T. 27 N., R. 5 E., and it is 980 feet thick in well 1 of the Carter Oil Co., in the northwest corner of sec. 9, T. 26 N.,R. 6 E.
' The oil-bearing portion of the Siliceous lime is the uppermost 50feet and in most places the uppermost 5 to 25 feet. The reservoir
beds commonly are composed of finely crystalline cherty dolomitetliat in many places was weathered, dviring ti land interval in or after
Ordovician time. The beds that are at the top of the formation in different fields are probably at different stratigraphic positions, owing to uplift and erosion of the limestone prior to the deposition of the overlying Simpson formation. In most fields, but not in all, the oil is confined to the higher parts of domes and anticlines. (See pi. 16.) The oil is associated with considerable gas and much salt water.

SUMMARY OF SUBSURFACE GEOLOGY 359
Wells producing from the Siliceous lime flow during their early life and later yield much water, and most wells that penetrated the upper part of the Siliceous lime without obtaining oil encountered water. . The gravity of the oil ranges from 37° to 51°, A. P. I. scale. An investigation of the crude oils made recently by a committee of the Tulsa Geological Society 6 shows that the oils from different pools differ greatly in composition.
In recent years much progress has been made in the production of oil from pools in the Siliceous lime. Many years ago it was com mon practice to drill wells a considerable distance into the lime usually into the water-bearing zone below the oil and they were then produced at their maximum capacity. As a result of this prac tice much salt water was brought to the surface and the wells were short-lived. Eecent practice is illustrated by well 5 in the SW1/^ sec. 20, T. 23 N., R. 10 E., which was completed in the fall of 1939. Drilling below the Mississippi lime proceeded only about a foot at a time. As each foot was drilled cuttings were bailed out and examined microscopically by a geologist. After entering the top 3 feet of the Siliceous lime a show of oil was encountered; drilling was stopped and a test showed a yield of about 1 7 barrels of oil a day and considerable gas. The oil-bearing zone was then treated with 2,000 gallons of acid, after which a test showed a yield of about 1,000 barrels of oil a day. The well was choked down to a yield of about 100 barrels a day and flowed at that rate for more than 6 months; only after producing for more than 6 months it began yielding a few barrels of water a day,
SIMPSON FORMATION
In Osage County the Simpson formation, as defined by Luther White,7 represents a thin northeastward-tapering wedge of beds that is thickest south and southwest of this county. The wedge has a maximum thickness of somewhat less than 200 feet in the southern part of the county. It pinches out along a curved line that extends northwestward from the eastern Osage County boundary near the middle of T. 23 N., R. 12 E., passes about 2 miles southwest of Pawhuska, and then crosses the Oklahoma-Kansas boundary in sec. 14,T.29N.,R.6E.
The Simpson formation in Osage County consists of sandstone in the lower part, green shale and sandstone and locally dolomite
8 Geologists: Neumann, L. M., Carter Oil Co.; Newman. T. F., Stanolind Oil & Gas Co.; Ryniker, Charles, Gulf Oil Corporation; and Bass, N. W., U. S. Gepl. Survey. Chemists: Smith, H. M., U. S.. Bureau of Mines; Mauney, S. F., Carter Oil Co.; and Ginter, R. E., Ginter Chemical Laboratory.
7 White, L. H., Subsurface distribution and correlation of the pre-Chattanooga ("Wilcox" sand) series of northeastern Oklahoma: Oklahoma Geol. Survey Bull. 40, vol. 1, pp. 29-32. 1928.

360 OIL AND GAS RESOURCES OF OSAGE COUNTY, OKLA.
in the middle part, and sandstone in the uppermost part. White 8 calls the lower sandstone unit the "Burgen sand," the middle shale- and-sandstone unit the "Tyner formation," and the upper sandstone unit the "Wilcox" sand. The "Wilcox" is present in only the south- westernmost part of Osage County; the "Tyner formation" is wide spread in the southwestern half of the county but pinches out along a course that lies about 6 miles southwest of the northeastern margin of the Simpson formation. A microscopic «examination of a few samples showed that the sandstone consists mainly of fine to medium quartz grains, with lesser amounts of coarse, subrounded to subangular, and some rounded grains, and that the shale is mostly light green.
The lower sandstone of the Simpson formation is known locally as the Hominy sand. It was named from the Hominy.field in T. 22 N., Rs. 8 and 9 E., because at the time of the early development of that field it was believed that this sand was the main oil-producing bed. Later, however, oil company geologists learned from micro scopic examination of well samples that most of the oil was found in the underlying Siliceous lime.9 The name, "Hominy sand" has been retained locally,' however, for beds of sandstone in the lower part of the Simpson formation. Some wells yield water from the upper part of the Simpson formation and oil or gas from the lower part. Many such wells obtain much additional oil after being drilled deeper into the uppermost beds of the Siliceous lime.
CHATTANOOGA SHALE
The Chattanooga shale, of Devonian (?) age, which is classified as Mississippian by most Mid-Continent geologists, is absent through out much of Osage County.10 It is present, however, in the eastern most, southernmost, and locally in the westernmost part of the county,where it ranges in thickness from a feather edge to 65 feet and un- conformably overlies the Simpson formation and the Siliceous lime. The Chattanooga shale consists of coal-black fissile carbonaceous shale and contains small nodules of pyrite and small flattened discs that are believed to be plant spores. Lenses of sandstone, known as the Misener sand, occur in places at the base of the shale. The Misener sand is composed of sand grains that are similar to those in the Simpson formation and probably were derived, at least in part,from the Simpson.
8 Idem.8 White, L. H., op. cit, pp. 29-30.10 Buchanan, G. S., The distribution and correlation of the Mississippian of Oklahoma:
Am. Assoc. Petroleum Geologists Bull., vol. 11, pp. 1310-1311, 1927. Leatherock, Con stance, and Bass, N. W., Chattanooga shale in Osage County, Okla., and adjacent area: Am. Aseoc. Petroleum Geologists Bull., vol. 20, No. 1, pp. 91-101, 1936.

SUMMARY OF SUBSURFACE GEOLOGY . 361
BURGESS SAND-MISSISSIPPI LIME ZONE
The Mississippi lime underlies the whole of Osage County and is about 300 feet thick in three-fourths of the county. It is less than 100 feet thick, however, in the southern part and about 400 feet thick in the western part. The Mississippi lime consists of beds of lime stone, cherty limestone, and chert, many of which are dark gray. The upper surface of the Mississippi lime is an old erosion surface, and its uppermost beds consist mainly of weathered chert and less commonly limestone, which yield oil and gas in many places in Osage County. In parts of southeastern Osage County a bed of sandstone, known as the Burgess sand, occurs in the lowermost part of the Cherokee shale and thus immediately overlies the old erosion surface of the Mississippi lime; but in some localities a thin bed of shale separates the sandstone from the lime. It is impossible to determine definitely from the logs of many wells whether the oil and gas occur in the Burgess sand or in the Mississippi lime or in both. Consequently, the oil- or gas-bearing beds at or near the contact of the Cherokee shale and the Mississippi lime are referred to in this report as the Burgess sand-Mississippi lime zone.
The true Burgess sand in Osage County is confined to the south eastern part, because the lower beds of the Cherokee shale that con tain this sandstone unit pinch out toward the northwest. Along a northeastward-trending belt that passes a few miles southeast of Pawhuska, the Bartlasville sand is in contact with the old erosion surface of the Mississippi lime; its relationship there with the Mis sissippi lime is comparable to that of the Burgess sand in south eastern Osage County, where the Bartlesville sand is separated from the Mississippi lime by about 150 feet of shale.
A broad belt in southeastern Osage County contains many widely separated small oil pools and several gas pools in the Burgess sand- Mississippi lime zone. (See pi. 17.) The data available indicate that in many of these pools the oil and gas occur in the Burgess sand and that in others they occur in the uppermost beds of the Mississippi lime. In another belt 10 to 20 miles wide, extending northeastward from a point a few miles northwest of Hominy and passing through Pawhuska to T. 29 N., Es. 10 and 11. E., the main oil pools are in the uppermost beds of the Mississippi lime. In most pools in this belt the oil occurs in weathered chert beds in the uppermost 25 to 40 feet of the lime, but in a few it occurs 50 to 60 feet below the top of the lime, and in a very few places oil has been found from 150 to 175 feet below the top of the lime.
A third belt, containing mainly gas pools, extends northwestward from T. 26 N., R. 12 E., to T. 29 N., R. 10 E. The gas and oil in this belt occur mainly in weathered chert in the Mississippi lime.

362 OIL AND GAS RESOURCES OF OSAGE COUNTY, OKLA.
A few wells in or near the Burbank and South Burbank fields in western Osage County yield oil from the uppermost 50 feet of the Mississippi lime; in this part of the 'county beds younger than the Bartlesville sand are in contact with the upper surface of the lime.
TANEHA SAND
A bed of sandstone commonly not more than 30 feet thick occurs locally in southeastern Osage County about 30 feet above the base of the Cherokee shale. It is separated from the thick Bartlesville sand above by 30 to 50 feet of shale. To this sand the names Taneha and Tucker have been applied. It yields oil in a northeastward-trending belt about half a mile wide and 3 miles long in the Hominy Falls field, in T. 21 N., Ks. 11 and 12 E., and T. 22 N., R. 12 E., and in some of the wells in the Bird Creek field, in the northeastern part of T. 21 N., R. 12 E. A few wells in widely separated localities else where in southeastern Osage County have produced oil or gas from this sand. The initial daily yield of rnost of the oil wells, was less than 100 barrels each.
BARTLESVILLE SAND
The total area in Osage County producing oil or'gas from the Bartlesville sand is greater than the total area producing from all other zones. (See pi. 18). It was this sand that yielded the oil for the first producing well in Osage County, in 1897, and pools are yet being discovered in it. The Bartlesville sand occurs as elongated lenses 10 to 200 feet thick in the lower part of the Cherokee shale. In southeasternmost Osage County the sand lies from 175 to 200 feet above the base of.'the formation. Most of the Cherokee below the sand is composed of shale. This lower shale unit pinches out toward the northwest along a northeastward-trending course that passes about 4 miles southeast of Pawhuska; there the Bartlesville sand forms the basal bed of the Cherokee shale and lies in contact with the old erosion surface on the Mississippi lime. The sand in turn pinches out a short distance northwest of the edge of the shale,and farther northwest successively younger beds of the Cherokee arein contact with the Mississippi lime.
Cores of Bartlesville sand from a few wells, supplemented by drill samples from many wells and the logs of most wells, show that insome places the sand is composed of fairly homogeneous materialthroughout thicknesses of more than 50 feet; that in most fields it
consists of thick beds of sandstone separated by thin beds of sandy shale and shale. As a rule, the sand bodies contain more partings of sandy shale and shale near their margins, where the -sands are thin, than they do in their central parts, where the sands are thickest.

SUMMARY OF SUBSURFACE GEOLOGY 363
Although a few cores contain cross-bedded sand, the bedding planes appear horizontal in most cores. In many cores of the massive parts of the sand bodies no bedding planes can be seen. On the other hand, the bedded and shaly parts of the sand bodies commonly contain finely laminated zones in which the quartz, mica, and car bonaceous grains are separated into laminae that are sharply defined. These parts of the sand bodies appear to contain more mica and carbonaceous material than the massive homogeneous beds.
A zone' of dense siltstone or very fine grained sandstone, called the cap rock by some drillers, forms the top of the sand body in many fields. Sandy shale a few feet thick and containing lenticular coal beds commonly overlies the sand body, and such shale is in turn overlain by beds of fossiliferous limestone.
Most of the lenses of Bartlesville sand are elongated toward the northeast and are alined in roughly parallel northeastward-trending belts. Many of the sand belts lie within a strip of country about 18 miles wide, whose northwest margin lies about 2 miles southeast of Pawhuska and whose southeast margin lies about 15 miles northwest of Tulsa. Bordering this strip of country on the southeast is a second strip, about 6 to 8 miles wide, that is essentially devoid of large sand bodies. A third strip, next on the southeast and extending beyond the southeast corner of Osage County, contains broad thick lenses of oil- and gas-bearing Bartlesville sand.
The belts of Bartlesville sand bodies are of slightly different age, though they lie within a stratigraphic zone about 250 feet thick. For example, sand lenses near the southeast corner of Osage County are somewhat lower stratigraphically than the sand bodies in the broad strip of country that lies southeast of Pawhuska. The sand near the southeast corner of the county could therefore appropriately be designated Lower Bartlesville, but it is believed to be less confusing to continue the name Bartlesville, which has become established by long usage of all oil workers in the region, rather than to employ the term Lower Bartlesville.
The Bartlesville sand is composed mainly of quartz grains, but it contains also fragments of chert, shale, and other rocks, very small amounts of mica, varying amounts of grains of black carbonaceous material that may be coal or asphalt, and traces of feldspar, zircon, chlorite, glauconite, hornblende, rutile, magnetite, pyrite, and epidote.11
Microscopic examination of sand samples showed that in most places approximately three-fourths of the sand grains fall within
11 Leatherock, Constance, Physical characteristics of Bartlesville and Burbank sands in northeastern Oklahoma and southeastern Kansas : Am. Assoc. Petroleum Geologists Bull., vol. 21, no. 2, pp. 254-255, 1937.
. 459067 4

364 OIL AND GAS RESOURCES OF OSAGE COUNTY, OKLA.
the size classes fine and very fine, whose limits in diameter, as defined by Wentworth,12 are yQ to % millimeter. In some places, such as the Avant field, the predominant grains are of medium size that is, they range in diameter from % to 1/2 millimeter.13 The sand com monly contains from 5 to 10 percent of silt and clay. Sand grains smaller than medium size are characteristically angular or subangu- lar. Of the medium grains, roughly two-thirds to three-fourths are angular or subangular and from one-third to one-fourth are sub- rounded. Essentially all coarse and very coarse grains are sub- rounded or rounded.
The Bartlesville sand gives up its oil at a relatively slow rate but wells in it continue to produce through a long period of time. Many wells in this sand that were drilled 30 to 35 years ago are still pro ducing. In several places additional wells have been drilled less than a quarter of a mile from very old producers, and the initial daily yields of the new wells have been as much as 50 to 175 barrels. One such locality is in sec. 23, T. 24 N., R. 10 E., in the West Barnsdall field; -another is in sees. 20 and 21, T. 24 N., R 9 E. The behavior of these new wells indicates that wells producing from the Bartles ville sand do not drain much oil from a great distance.
Oil-bearing Bartlesville sand is being repressured with gas in some fields and with water in several fields in northeastern Oklahoma and southeastern Kansas. A few such projects are in progress in Osage County, and other fields in the Bartlesville sand in the county are potentially valuable for repressuring. For example, a part of the Avant field in Tps. 23 and 24 N., Rs. 11 and 12 E., has been repres- sured with gas, and as a result the daily yields of the wells have been increased. A small tract in the Pershing field and a small tract in the Quapaw field have been subjected to water flooding, but 4he results have not been noteworthy.
BUBBANK AND BED FOBK SANDS
The Burbank sand occurs as relatively thick, elongated lenses in the western part of Osage County. In most places it lies from 25 to 50 feet below the Pink lime and from 25 to 50 feet above the base of the Cherokee shale, but at some places its upper part occupies the horizon of the Pink lime and at other places its lower part forms thebasal beds of the Cherokee shale and is in contact with tk© under lying Mississippi lime. In the southern part of the county the RedFork sand occurs as elongated lenses at about the same stratigraphic
position as the Burbank. The Red Fork sand likewise lies from 25
u Wentworth, C. K., Grade and class terms for clastic sediments: Jour. Geology, vol. 30, pp. 377-392, 1922.
18 Leatherock, Constance, op. clt., pp. 257-25S.

SUMMARY OF SUBSURFACE GEOLOGY 365
to 50 feet below the Pink lime, but it is separated from the Missis sippi lime by a sequence of shale, sandstone, and limestone that has a total thickness of about 250 feet.
The Burbank and Red Fork sand lenses are elongated bodies that range from half a mile to 3^ miles in width and from a feather edge to a little over 100 feet in thickness. The long axes trend northward or northwestward. The sand bodies of the South Bur- bank and Burbank fields, including the Stanley stringer, and of the Naval Keserve field are the main oil- and gas-bearing lenses of the Burbank sand, and the narrow sand body that extends southeastward for many miles in T. 21 N., R. 8 E., is the main lens of the Ked Fork sand. (See pi. 18.)
The Burbank and Red Fork sands are similar to the Bartlesville sand in composition and physical characteristics. They are composed largely of quartz grains, but include also minor amounts of mica and feldspar and traces 14 of other minerals that are loosely cemented with a mixture of magnesium, iron, and calcium carbonate. Very small concretions of siderite occur in the sand and are particularly abundant in the shaly parts. The sand contains from a trace to 10 percent of black shiny grains of carbonaceous or coaly material. In most local ities three-fourths or more of the sand grains range from fine to very fine (grains 1/16 to ^ millimeter in diameter). The sand commonly contains from 5 to 15 percent of silt, locally as much as 40 percent. Medium, coarse, and even very coarse grains occur in minor amounts in some localities.
The fine and very fine sand grains and about two-thirds of the medium grains are angular to subangular; about a third of the med ium grains are subrounded; and the coarse and very coarse grains are subrounded to rounded.
The Burbank and Red Fork sands, like the Bartlesville sand, give up their oil at a relatively slow rate but continue to yield for many years. The Burbank sand is being successfully repressured with gas in the Burbank, South Burbank and Naval Reserve fields.
Little or no water is produced from these sands in the greater parts of most fields. Some wells on the western margins of the Burbank, South Burbank, and Naval Reserve fields produce water, but the behavior of these wells indicates that the water is under very low hydrostatic pressure and does not act as a drive on the oil in the sand.
SKINNER SAND
In parts of Osagfe County, particularly the southeastern part, relatively thin lenticular beds of sandstone occur at various positions
14 Leatherock, Constance, op. cit., pp. 254-258. 1937.

366 OIL AND GAS RESOURCES OF OSAGE COUNTY, OKLA.
in the shale bed about 100 feet thick that lies between the Pink lime and the Verdigris lime. All beds of sandstone that occur at this general stratigraphic position are commonly called the Skinner sand. The sand is rarely more than 30 feet thick and is extremely erratic in its occurrence. It is, in general, very fine grained and in many places shaly. The Skinner sand has produced small amounts of either oil or gas, mainly oil, in a few small tracts listed in the following table.
Areas producing oil or gas from the Skinner sand
Location
T. 26N..R. 10 E.: Sec. 31..................................
T. 25 N., R. 6E.: Sec. 26......................... ........
T. 25 N., R. 8E.: Sees. 29, 30 and 31............. .......
T. 24 N., R. 8E.: Sees. 6 and 7-.--.. ......... .......
T. 23 N., R. 7 E.: Sees. 22, 26 and 35.-.. ...................
T. 23 N., R. 8E.: Sees. 6 and 10. ..........................
T. 23 N., R. 10 E.:
T. 22 N., R. 8E.: Sees. 12 and Z2.... ......................
T. 22 N., R. 9 E.: Sec. 16..................................
T. 22 N., R. 10 E.: Sec. 14..................................Sees. 22, 26 and 27.......................
T. 21 N., R. 9E.: Sec. 10------.-.-----.---...-............
T. 21 N., R. HE.:
T. 20 N., R. 12 E.: Sec. 28
Oil or gas
Gas... .-_.-.--
Oil...........
.....do.........
.....do... .-.
.....do...... ...
.....do.........
Oil ........... .
.....do.... .....
...--do... ......-...-do.........
.....do.........
...--do.........
Number of wells
1
1
3
7
9
2
1
2
2
1
1
1
Remarks
Do.
Do.
SQUIRREL (PRUE) SAND
Lenticular beds of sand, designated by some operators the Squirrel and by others the Prue, occur at various positions from a few feet to about 75 feet below the top of the Cherokee shale. In most places this sand lies about midway between the Verdigris lime and the Oswego lime, but in some places, notably in the W^ sec. 8, T. 23 N., R. 8 E., the lower part of the sand occupies the horizon of the Verdigris lime as well as that of the beds above that lime. The sand ranges in thickness from a feather edge to 100 feet, but in most places is 15 to 30 feet thick.
A microscopic examination of samples of the Squirrel sand from a
few Wells Indicates that it is similar in composition and general character to the Burbank and Bartlesville sands except that in many places it is more shaly. It is composed mainly of fine and very fine angular to subangular quartz grains but includes also 1 to 5 percent of mica and minor amounts of other minerals. The Squirrel sand is

SUMMARY OF SUBSURFACE GEOLOGY 367
oil- or gas-bearing mainly in two poorly defined northeastward- trending belts. One belt lies in:the eastern part of Tps. 21 to 23 N., K. 10 E.; the other lies in the western part of T. 23 N., R. 8 E., and extends northeastward into the northwestern part of T. 25 N., R. 9 E. Another important area is in the east-central part of T. 26 N., R. 4 E., but the sand there is only tentatively identified as the Squirrel.
The main oil- and gas-bearing areas in the Squirrel sand are listed in the following table:
Areas producing oil or gas from the Squirrel (Prue) sand
Location
T. 21 N., R. 10 E.:
W)^ sec. 26', E^ sec. 27, and NWJi sec.34
SW \i sec. 27, SEJi sec. 28, NEJi sec. 33,and NWJi sec. 34.
T. 23 N., R. 10 E.: SWJi sec. 25 and NW}£ sec. 36..........
T. 23 N., R. 8E.: W^sec. 8... -.-._.----..---------.,
T. 25 N., R. 9E.: Sec. 17... ......... ........... ............
T. 26 N., E. 9 E.: Sec. 33-...,.. -. .-
1.25N., R. 9E.: Sees. 2, 3, 4, 9, 10, and 11.
T. 26 N., R. 4E.:
Oil' or gas
/Gas-....-,....\0il_ ........ Oil.... Gas. ........ ..
Oil.... ........
Gas..........
Oil............Gas. ..........
/Oil............\Gas- .....
Oil............
Number of wells
81
27.8
7
5
142
9
22
6
Initial daily' yield
250,000 to 3,500,000 cu. ft.20 bbls. 10 to 700 bbls.1,000,000 to 12,000,000 cu. ft.
15 to 150 bbls.
8,000,000 to 35,000,000 cu. ft.
10 to 500 bbls.
25 to 200 bbls.11,000,000 cu. ft.
500,000 to 22,000,000 CU. ft.
In addition to the wells listed above, about half a dozen wells have produced either oil or gas from the Squirrel sand in widely separated localities, but the total amount produced is small.
OSWEGO LIME (FORT SCOTT LIMESTONE)
The Os'wego lime has long served as a valuable key bed in subsur face geologic mapping in northeastern Oklahoma because it is one of the most persistent rock units. In much of Osage County it is from 50 to 75 feet thick and is composed mainly of limestone, but it includes one or two thin beds of shale in the lower part. In some places the uppermost 10 to 25 feet of the Oswego lime is recorded in the logs as sand or sandy lime, and where this zone contains oil or gas, it is called the Wheeler sand by some operators. Some wells producing oil from this zone have had a large increase in yield after being given acid treatment. Several areas on prominent anticlines and domes in T. 24 N., Rs. 8 and 9 E., are the main sources of oil and gas from the Oswego lime. Small areas, chiefly in the southeastern part of the county, many of which contain only one well, produce

368 OIL AND GAS RESOURCES OF OSAGE COUNTY, OKLA.
either oil or gas from the Oswego. The oil- and gas-bearing areas in the Oswego lime are listed in the following table: .
Areas producing oil or gas from the Oswego lime
Location
T. 22 N.; K. 8E.: SW^sec. 32... _ ...:..._.
T. 22 N.; R. 9 E.: Southeast corner of NE}£ sec. 29. _ ....
T. 22 N., R. 10 E.: SE^sec. 18..................'...........
T. 22 N., R. HE.: SEJ^.sec. 33...... .......................
T.22N., R:i2E.': . . - SWJ^sec. 5................... ..........
T. 23 N., R. 8E.: NE^sec. 5.-..--.-....---...-.-.-....-.
SEJi sec. 25..... ........................T. 23 N., R. 11 E.:
NEJ^sec. 7... ..........................SEJ^sec. 31 .
T. 24N..R. 8E.: SWMSWK sec. 10, W^ sec. 15, and E^
sec. 16. NE^sec. 13.... ........................Sees. 22, 23, 25, 26, 35, and 36-..--...-.-.E>£ sec. 32 and NW^ sec. 33..... . ......
T. 24 N., R. 9E.: Sees. 3 and 4.. _ .. __ ....---....-....
SEMSWMsec. 17__ .....................NWJi sec. 32. ..........................
T. 25 N., R. 8E.: NWJ^sec. 34....... .................
T. 25 N., R. 9E.: SWM sec. 26, SWM sec. 27, E^ sec. 33,
and W}£ sec. 34.NEMSWJi sec. 31....... ..........
T. 25 N., R. 10 E.:
SEKNEMsec. 25--.-....--..-......--.SWM sec. 31 -_
T.25N., B. HE.: SWJisec. 15 ; ..___
T. 27 N., R. 10 E.: NWMNEM sec. 9-...----...............
Oil or gas
Oil.. .
.....do.......
..... do...... .
Gas.-...-..
.....do..... ..
Oil .....
... ..do. ..
Gas... Oil- ... -
Gas
...... do ...Oil-. ..
..--do-....--
/Oil - ... -\Gas_.
Oil. .. do.......
fOU...... ....iGas.. Gas.-----...
fOU- -
---do ....
Oil ...
Number of wells
2
1
1
1
1
3
5
33
6
141
4
54 512
2
521
5
1
3
1
Initial daily yield
350 bbls. from 1 well after acidtreatment.
30 bbls.
750,000 cu. ft.
500 to 600 bbls. after acid treatment.
1,000,000 to 2,000,000 cu. ft.
2,000,000 to 12,000,000 cu. ft.
6,400,000 cu. ft.15 to 500 bbls.
10 to 100 bbls. :3,000,000 to 9,000,000 cu. ft. 2,000,000 to 8,500,000 cu. ft.
5,000,000 cu. ft.
4,500,000 cu. ft.
1,225,000 cu. ft.
PERU SAND
The Peru sand occurs as lenses in the Labette shale, which lies between the Oswego and Big limes. Though the Peru sand occurs at various positions in the Labette shale, it lies in the upper part of the shale in most places. It ranges from a feather edge to 100 feet in thickness. The individual lenses are composed of beds of sand that are commonly interbedded with shale and sandy shale. The Peru sand is relatively unimportant as a reservoir for oil and gas
and has produced one or the other in only a few wells, all of which are in eastern Osage County. The largest group of wells producing oil from this sand are in sec. 36, T. 24 N., R. 8 E., sec. 3, T. 24 N., R. 10 E., in the NEy4 sec. 36, T. 29 N., R. 11 E., and the NW% sec. 31 T. 29 N., R. 12 E.

SUMMARY OF SUBSURFACE GEOLOGY 369
limestone phase of the lower part of the Big lime. The boundary between the Big lime and the Peru sand in this area is not clearly shown by the logs, and therefore the two are treated as one zone in this report.
The oil- or gas-producing areas in the Peru sand are listed in the following table:
Areas producing oil or gas from the Peru sand
Location .
T. 21 N., R. 10 E.: SWKNEJisec. 17. SWJ^sec. 30---.--.....- -..-.- ..
T. 24 N., R. 8E.: NE^sec. 36..--------. -------------
T. 24 N., R. 9E.: Sec. 3 - - . NW^ sec. 20. ............................
T. 24 N., R. 10 E.: SWJ£sec. 4......
T. 24 N., R. HE.: NW^sec. 16.. ...........................SE^SW}< sec. 21.. ..............
T. 26 N., R. 10 E.: NE&sec. 2 J...
T. 26N., R. HE.:
T. 28 N., R. 10 E.:
s^scc.yr. ...............................T. 28N., R. HE.:
SWJ^ sec. 29 and SE}£ sec. 30 .........T. 29 N., R. 10 E.:
NE^sec. 34....--..--- ...........SW^ sec. 35
Oil or gas
Oil ... do
. do... .
.... do . do ...
.... do........
do........:.-do-. .-
do-...
. do. ...
.... do .../Oil ...\Gas
Oil..
Gas. .Oil.... ......
Number of wells
11
6
132
2
11
1
2
651
4
11
Initial daily yield
50 bbls.
sand zone:
15 to 150 bbls.
20 to 2,400 bbls.15 to 30 bbls.
15 bbls.
4 to 20 bbls.About 500 bbls. per acre.
10 to 65 bbls.
2,500.000 cu. ft.2 bbls.
BIG LIME (OOLOGAH LIMESTONE) AND WEISEB SAND
Beds that are recorded as limestone, sand, sandy limestone, or alternating beds of sand and limestone and that lie 25 to 50 feet below the top of the Big lime yield oil or gas in several places in Osage County. The most productive area of these beds is on the large anticline in Tps. 22 and 23 N., R. 11 E. There the Big lime yields oil along the west flank of the anticline in sec. 5, T. 22 N., R. 11 E., and sees. 32 and 33, T. 23 N., R. 11 E., and yields gas on the crest of the anticline in sees. 4 and 9, T. 22 N., R. 11. E. The rate of yield of several wells producing oil or gas from the Big lime has been greatly increased by acid treatment. The Weiser sand lies in a shale between the upper and lower limestone members of the Big lime. The sand is present in some parts of northeastern Osage County. It yields oil and some gas on the dome in the north-central part of T. 28 N., R, 10 E., and the south-central part of T. 29 N., R. 10 E., in the NE% sec. 36, T. 29 N., R. 11 E., and the NW% sec. 31, T. 29 N., R. 12 E.

370 OIL AND GAS RESOURCES OF OSAGE COUNTY, OKLA.
The oil- or gas-bearing areas in the Big lime and the Weiser sand are listed in the following table:
Areas producing oil or gas from the Big lime and the Weiser sand
Location
T. 22 N., R. 10 E.: NE^sec. 19
T. 22 N., R. HE.:Sec. 4, EM sec. 5, sees. 8 and 9...
T. 23N..R. HE.:
T. 24 N., R. 8E.:
T. 24 N., R. 9 E.:
T. 24 N., R. 10 E.:
NWJ^sec. 8.. ....... . NEJi sec. 11
T. 25 N., R. 8E.: NEM sec. 29 . ..WJ-£ sec 30NWJ^sec. 34. SE}<sec. 24
T. 25 N., R. 9E.: 8&s.^7. ............. ............SWK sec. 34............. .
T. 27 N., R. 10 E.: SWMSEJi sec. 4 SWJiNEMsec. 17...
T. 28 N., R. 10 E.:
T. 29 N., R. 10 E.:
T. 29 N., R. 11 E.: NEM sec. 36...................
T. 29 N., R. 12 E.: NWJ4 sec. 31......--.. _ ......
Oil or gas
Gas .
/Oil .\Gas Oil.
..... do.......
..... do.......
.....do.......
.... . do do....... do
Gas... do ..do Oil .....
Gas. ....OO ......
Gas..-- .Oil ......
Gas -
/Oil ......Gas.
Oil
do
Number of wells
1
} M3
17
7
1
221
1212
54
12
2
211
4
Initial daily yield and remarks
750,000 cu. ft.
12 to 450 bbls.1,000,000 to 7,000,000 cu. ft.25 to 80 bbls.
10 to 460 bbls.; several wells acid treated.
100 to 400 bbls.
2,000 bbls.
1,200,000 cu. ft.; acid treated.
9,800,000 cu. ft.; acid treated.Small.
100 to 160 bbls.
3,250,000 cu. ft.10 to 60 bbls.
WAYSIDE SAND
The Wayside sand occurs at places in Osage County in the upper part of the Nowata shale. The sand was named from an oil field near Wayside, Kans., and is also known in parts of northeastern Oklahoma as the Whiting or Kamsey sand. The Wayside sand is the main oil-producing reservoir in many fields in T. 27 N., Rs. 10 to 12 E., and Tps. 28 and 29 K, Es. 9 to 11 E. (See pi. 19.) The logs of wells in and near the oil fields show that the sand reaches a thickness of about 40 feet and pinches out on the margins of the fields. Many of the sand lenses are overlain directly by the Lenapah limestone, but in some places the horizon of the limestone is occupied by sand that forms the upper part of the Wayside. A microscopic examina
tion of drill samples of the sand from a few wells shows it to be COffl-posed mainly of fine to very fine angular quartz grains but to contain also 1 to 3 per cent of mica flakes, minor fragments of shale, and 5 to 10 per cent of silt.
Most oil wells in this sand have had small initial daily yields, but they continue production for a long time. The total yields are rela tively small, being less than 1,000 barrels to the acre for many tracts.

SUMMARY OF SUBSURFACE GEOLOGY 371
JONES AND CLEVELAND SAND ZONE
In parts of the south half of Osage County a zone of sandstone and some shale about 200 feet thick occurs between the Big lime and the Checkerboard limestone member of the Coffeyville formation. Some well logs record a solid sand body somewhat more than 200 feet thick, but most logs record two thick beds of sand separated by shale. The sand was named Cleveland after the oil-bearing sand in wells on the.Cleveland townsite, which is in T. 21 N., R. 8 E., about a mile south of the Osage County boundary. In the vicinity of Cleve land, where the sand is split into two beds, the upper bed is known as the Jones sand (also called Dillard sand) and the name Cleveland is restricted to the lower bed. Elsewhere, the name Cleveland is generally applied to all oil-bearing beds of sand in the zone, that contains these sands.
Both the Cleveland and Jones sands yield oil and gas. The Cleveland yields mainly oil in sees. 1 and 2, T. 21 N., R. 9 E., in sees. 4 and 5, T. 21 N., R. 10 E., in a large part of the Wildhorse field in T. 22 N., R. 10 E., and in the southern part of T. 23 N., R. 11 E. (See pi. 19.) The Jones sand yields mainly oil in a field in the north eastern part of T. 21 N., R. 8 E., and a field in the northern part of T. 21 N., R. 10 E. The Bird! Creek field in T. 24 N., R. 10 E., produces oil from a sand called Cleveland that lies in the upper part of the Jones and Cleveland sand zone and, therefore, is in the approximate stratigraphic position of the Jones sand.
STRATIGRAPHIC RELATIONSHIP OF THE WAYSIDE SAND AND THE JONES AND CLEVELAND SAND ZONE
The stratigraphic position of the Wayside sand in the Nowata shale is readily determined in the logs by the presence of the Lenapah limestone, which directly overlies it or is separated from it by a thin bed of shale. This relationship of the Wayside sand and the Lenapah limestone persists throughout the parts of northeastern Osage County that contain the Wa}^side sand lenses. In much of southern and east- central Osage County, however, the Lenapah limestone is absent and a sequence of sandstone, including the Jones and Cleveland sand zone, shale, and some limestone occupies the entire interval between the Big lime and the Checkerboard limestone member of the Coffeyville formation. This sequence, therefore, occupies the stratigraphic posi tions of the Nowata shale, Lenaph limestone, and the lower part of the Coffeyville formation.
The Jones and Cleveland'sand zone attains its maximum thickness in a broad belt that trends northeastward from Cleveland across southeastern Osage County. It is noteworthy that the Big lime is thin or locally absent in the belt of thick sand and that the lower part of

372 OIL AND GAS RESOURCES OF OSAGE COUNTY, OKLA. '>
the sand appears to occupy the horizon of at least a part of the Big lime. The Big lime attains its full thickness only a short distance away from the belt of thick sand.
The relationship of the Jones and Cleveland sand zone to the Wayside sand and to the Lenapah limestone, Nowata shale, and Big lime is shown in part on the cross section (pi. 20), which ex tends northeastward from the Cleveland field to oil pools in the Wayside sand near the northeast corner of the county. It is note worthy that the logs of some wells in southeastern Osage County record a coal bed in the shale unit that lies between the Cleveland and Jones sands. (See well 37 on pi. 20.) This coal bed may be equivalent to the Dawsori coal, which is mined near Collinsville, Okla. At any rate, the sequence of beds made up of the Cleveland sand; middle shale, and Jones sand appears to be equivalent to the Seminole formation, which is described by Dott 15 as occurring near Collinsville and Tulsa and consisting of two thick sandstone members and a middle shale member that includes the Dawson coal.
The Seminole formation, and therefore its subsurface equivalent, the Jones and Cleveland sand zone, constitutes the basal deposit of the Missouri subseries in eastern Kansas,16 western Missouri,17 and northeastern Oklahoma.18 The sand zone appears to occupy the position of the Helper sandstone 19 of Kansas. Accordingly, it ap pears probable that a period of erosion followed the deposition of the lowermost part of the Coffeyville formation (Memorial shale on the outcrops) in Osage County and that in places the erosion extended deep enough to remove much of the Big lime. Later, the beds of the Cleveland and Jones sand zone were deposited above the old erosion surface.
IiAYTON" SAND
Interbedded shale, sandy shale, and sandstone constitute the upper part of the Coffeyville formation. The sandstone is lenticular, but in much of Osage County the upper part of the Coffeyville contains one or more beds of sandstone. The term "Layton sand" is applied to all beds of sandstone in this zone. The Layton sand can be identified generally by its position below the Hogshooter limestone.
15 Dott, R. H./and Ware, J. M., quoted! by Miller, A. K., and Owen ( J. B.. A flCW
Vanlan cephalopocl fauna from Oklahoma: Jour. Paleontology, vol. 11, p. 404, 1937.19 Moore, R. C., Newell, N. D., Dott, R. H., and Borden, J. L,., Definition and classification
of the Missouri subseries of the Pennsylvanian series in northeastern Oklahoma: Kansas Geol. Soc. llth Ann. Field Conference Guidebook, pp. 41-42, 1937.
"Jewett, J. M., Lateral changes in the lower Missouri beds of southeastern Kansas, idem, pp. 36-37. Abernathy, G. E., Oil and gas in Montgomery County, Kans.: Kansas Geol. Survey Bull. 31, fig. 2, p. 8, 1940.
18 Oakes, M. C., Geology and mineral resources of Washington County, Okla.: Oklahoma Geol. Survey Bull. 62, pp. 23-26, 1940.
19 Jewett, J. M., Classification of the Marmaton group, Pennsylvanian, in Kansas: Kansas Geol. Survey Bull. 38, pp. 293-295, 298-300, 311, 341, 1941.
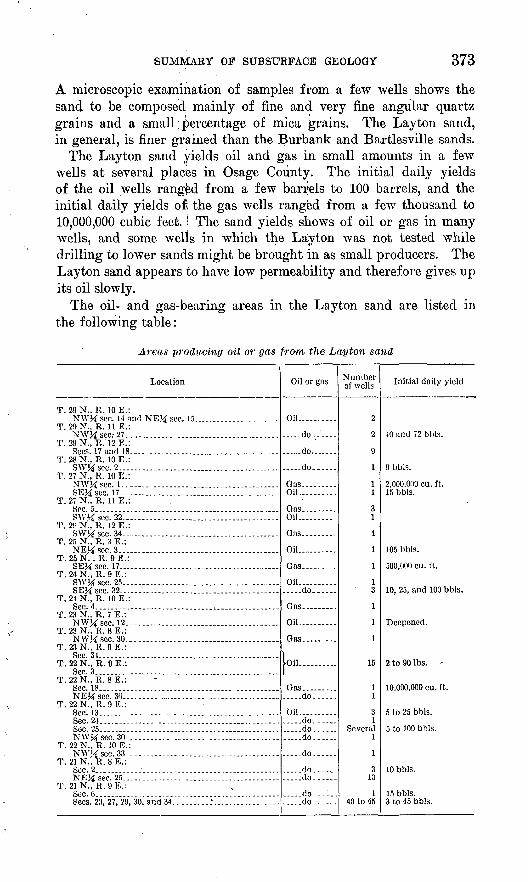
SUMMARY OF SUBSTJIRFACE GEOLOGY 373
A microscopic examination of samples from a few wells shows the sand to be composed mainly of fine and very fine angular quartz grains and a small; percentage of mica grains. The Layton sand, in general, is finer grained than the Burbank and Bartlesville sands.
The Layton sand yields oil and gas in small amounts in a few wells at several places in Osage County. The initial daily yields of the oil wells ranged from a few barrels to 100 barrels, and the initial daily yields of the gas wells ranged from a few thousand to 10,000,000 cubic feet.! The sand yields shows of oil or gas in many wells, and some wells in which the Layton was not tested while drilling to lower sands might be brought in as small producers. The Layton sand appears to have low permeability and therefore gives up its oil slowly.
The oil- and gas-bearing areas in the Layton sand are listed in the following table:
Areas 'producing oil or gas from the Layton sand
Location
T. 29 N.. R. 10 E.: NT \VJ<f, sec. 14 and NEJ4 sec. 15... ...... . ...
T. 29 N., R. 11 E.: NWJi sec.- 27.. ....... ...........................
T. 29 N., R/12E.:
T.28N., R. 10 E.: SWJi sec. 2....... ....................................
T. 27N., R. 10 E.: NW 1^ sec 1SEKsoc. 17..... .....................................
T. 27 N., R. 11 E.: Soc. 5... ...........................................K\V^sm.y2.... ....................................
T. 2f N., R. 12 E.: SWJi sec. 34.......... ................................
T. 25 N., R. 3 E.: NE 1^ sec 3
T. 25 N. , R. 9E.: SEJisoc. 17... ........ ........ -.........-_._...
T. 24N., R. 9E.: SWJiscc. 25... . -.. .......... ...... .. SFMsc.c.32...... ....................................
T. 21 N., R. 10 E.: SGC 4
T. 23 N.. R. 7 E.: NWJ<sec. 12...... ...............................
T. 23 N., R.8E.: NWJOcc. 30. -.-....-. .............................
T. 23N., R. 9E.: Sec.3-l....... ........................................
T. 22 N., R. 9 E.:See. 3.................................................
T.22N., R.8E.: Sec. 18 .- . . ...........NEXseo. 30 ............. .....................
T. 22 N., R. 9E.:
Sec. 2-i... ........... ................................
NW^sec. 30 ............. ......... ...................T. 22 N., R. 10 E.:
NW^sec. 33 ..... .. ............. ...... .......T. 21 N., R. SE.:
Sec. 2............-........ ...........................NEJisec. 2S.. ........................................
T. 21N., R.9E.:
Sees. 20, 27, 29, 30, and 34..... ....:............... ...
Oil or gas
Oil
..... do..
......do.......
.....do......
Oil.. ...
Gas....----.Oil
Gas. ........
Oil ......
Gas. ........
Oil .- -..... do..
Oil
Gas.. .......
loil.. .....
Gas.. ........do......
Oil -..... do...........do..........-do......
...... do......
... ..do. -_-... -:do.. .
.....do--.:...
...-do......
Number of wells
2
2
9
1
11
31
4
1
1
13
1
1
1
15
11
31
Several1
1
310
140 to 45
Initial daily yield
10 and 72 bbls.
9 bbls.
2,000,000 cu. ft.15 bbls.
105 bbls.
500,000 cu. ft.
10, 25, and 100 bbls.
Deepened.
2 to 90 Ibs. -
10,000,000 cu. ft.
5 to 25 bbls.
5 to 100 bhls.
10 bbls.
15 bbls.3 to 45 bbls.

374 OIL AND GAS RESOURCES OF OSAGE COUNTY, OKLA.
MUSSELLEM AND PEOPLES SAND ZONE
A sequence of sandstone and shale and a few beds of limestone having a total thickness of about 250 feet overlies the Hogshooter limestone. This sequence occupies the position of the Nellie Bly formation, the Dewey limestone, and the lower part of the Ochelata formation and includes the Peoples and Mussellem sands. The deter mination of the boundaries of these formations depends on-the identi fication of the Dewey limestone, which is not persistent in much of Osage County.
In parts of northeastern Osage County and for a few miles west of its outcrops, the Dewey limestone can be identified in the well logs. The Peoples sand, which is in the upper part of the Nellie Bly formation, underlies it, and the Mussellem sand, which is in the lower part of the Ochelata formation, overlies it. In much of the remainder of the county the horizon of the Dewey limestone is occupied by a zone containing lenticular beds of sandstone, lime stone, and shale. Accordingly, this entire sandy zone is referred to in this report as the Mussellem and Peoples sand zone. Oil- or gas- bearing beds in the lower part of the zone are tentatively identified as the Peoples sand, and such beds in the upper part of the zone as the Mussellem sand.
The Mussellem and Peoples sand zone is of relatively little impor tance as a producer of oil and gas in Osage County. The zone pro duced gas in 19 wells on the dome in sees. 8, 9, and 17, T. 27 N., R. 11 E. The initial daily yields of the wells ranged from 1 to 8^ million cubic feet. Twelve wells in sees. 4 and 9, T. 20 N., R. 10 E., produced gas from sand in this zone. Two wells in the NEi/4 sec. 5, T. 23 N., R. 8 E., produced oil from this zone; four wells in the Pettit field, in the same township, produced gas and one well pro duced oil; and two wells in the Osage-Hominy field produced gas and two wells produced oil from this zone. A few wells in sees. 23 and 24, T. 21 N., R. 8 E., and three wells in! sees. 32 and 33, T. 24 N., R. 8 E., produced small amounts of oil from this zone. Two wells in the NEi/4 sec/ 30, T. 23 N., R. 9 E., produced oil, and one well in the SE^ sec. 29 of the same township produced gas from this zone at the rate of 2,500,000 cubic feet a day. One well in each of the following locations produced oil: NE1/^ sec. 18, T. 27 N.,E. 11 E.; J3E% sec. 2, T. 27 N., R. 10 E.; SE% sec. 28, T. 28 N.,R. 11 E. One well in each of the following locations produced gas: NEi/4 sec. 34, T. 29 N., R, 10 E.; NW% sec. 1 and SE*4 sec. 27, T. 28 N., R. 10 E.; NW% sec. 1, T. 27 N., R, 10 E.

.SUMMARY OF SUBSTJ1RFACE GEOLOGY 375OKESA, TORPEDO, AND CLEM CHEEK SAND ZONE
A sequence of beds composed largely of sandstone but containing lesser amounts of shale and limestone occurs near the middle of the Ochelata. formation. The beds have a total thickness of 100 to 300 feet. They occupy the stratigraphic position of the Okesa, Torpedo, and Clem Creek sandstone members of the Ochelata formation, which crops out in an irregular belt extending from T. 20 N., E. .10 E., northeastward to T. 27 N,, E. 12 E. The sequence occupies the posi tion of the so-called Suitcase sands that are present in the subsurface in western Osage County. Single beds in the sequence are lenticular and cannot be traced from one locality to another by the weir logs, but the sand sequence considered as a unit appears to persist through out the part of Osage County that lies west of the outcrops. Many sandstone beds within the zone produce oil or gas. in several localities in the county. In this report the oil- and gas-bearing beds in the upper part of the sequence are tentatively called the Okesa sand, those in the middle part the Torpedo sand, and those in the lower part the Clem Creek sand. The operators commonly apply the name Buzzard sand to any oil- or gas-bearing bed in the zone.
The Okesa, Torpedo and Clem Creek sand zone yields oil in about a score of pools in a belt about 6 miles wide, extending from the southwestern part of T. 25 N., E. 8 E., southeastward to the western part of T. 21 N., E. 9 E. In addition, a few wells in sec. 22, T. 24 N., E. 7 E., and sec. 1, T. 26 N., E. 5 E., have produ'ced gas from the zone. The oil-bearing beds of the zone lie at depths ranging from 240 to 750 feet in Tps. 21 to 24, N., Es, 8 and 9 E., which townships contain most of the oil pools.
The initial yields of most oil wells were from 10 to 50 barrels a day, and the initial yields of the gas wells were 'from less than half a million to 5% million cubic feet a day.
Areas producing oil or gas from the Okesa, Torpedo, and Clem Creek sand zone
Location
T. 29 N., R. 9E.: Sees. 10 and 21 ........
T. 27N., R. 10 E.: SE^NE^ sec. 2.. .................
T. 20 N., R. 5 E.: NEHsec. l._ ....... ...... ..........
T. 24 N., R. 7 E.: Sec. 22.. . .-.... .
T. 24 N., R. 8 E.: SEM sec. 6..........................
T. 24 N., R. 9E.: NWK seer 32..... ..................
T. 23 N., R. 7E.: NEMSEM sec. 36...................
Oil or gas
Gas..........
do
.do .
.. do.
Oil........../Oil.... ...... .
Oil..........
/Oil..........
Gas.........
Number of wells
5
1
Few
4
1 12
jSeveral Many
1 1
1
Initial daily yield and remarks
From Torpedo sand.
1,750,000 cu. ft., from Clem Creek sand.
1,600,000 Cu. ft., from Torpedo sand 10 to 50 bbls., from Okesa sand.
f5 to 75 bbls. 12,000,000 to 5,500,000 cu. ft. 5 to 60 bbls., from Okesa sand.
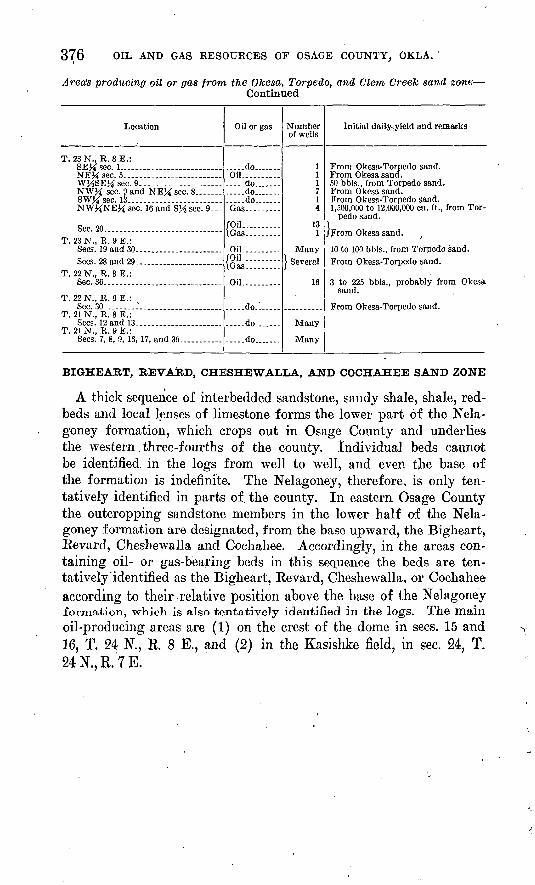
376 OIL AND GAS RESOURCES OF OSAGE COUNTY, OKLA. '
Area's producing oil or gas from the Okesa, Torpedo, and Clem Creek sand zone Continued
Location
T. 23 N., R. 8 E.: SE^sec. !_..__ ........ .............NE^ sec. 5. ......... .... ..WJfl3E& sec. 9.....................NWJ4 sec. 9 and NE% sec. 8... .SWJ<sec. 13 .NW^NEM sec. 16 and SV$ sec. 9...
Sec. 20... ._ . ......T. 23 N., R. 9E.:
Sees. 19 and 30 ........... _ . __ .Sees. 28 and 29- .....................
T. 22 N., R. 8E.: Sec. 36... . ... .......... ......
T. 22 N., R. 9E.: Sec. 30 .--..-.. ................
T. 21 N., R. 8E.: Sees. 12 and 13- ___________ .
T. 21 N., R. 9E.: Sees. 7, 8, 0, 16, 17, and 30 ........
Oil or gas
. do.... Oil.. .. do....... do... .... -do.......Gas...
/Oil.. ....\Gas- --.
Oil. ........./Oil .........\Gas-- .
Oil...... ....
do.:..... .do....
. do.......
Number of wells
1 1 1 7 1 4
13 1
Many | Several
16
Many
Many
Initial dailjsyield and remarks
From Okesa-Torpedo sand. From Okesa sand. 50 bbls., from Torpedo sand. From Okesa sand. From Okesa-Torpedo sand. 1,500,000 to 12,000,000 cu. ft., from Tor
pedo sand.
/From Okesa sand.
10 to 100 bbls., from Torpedo sand. From Okesa-Torpedo sand.
3 to 225 bbls., probably from Okesa sand.
From Okesa-Torpedo sand.
BIGHEABT, BEVABD, CHESHEWALLA, AND COCHAHEE SAND ZONE
A thick sequence of interbedded sandstone, sandy shale, shale, red- beds and local lenses of limestone forms the lower part of the Nela- goney formation, which crops out in Osage County and underlies the western three-fourths of the county. Individual beds cannot be identified, in the logs from well to well, and even the base of the formation is indefinite. The Nelagoney, therefore, is only ten tatively identified in parts of the county. In eastern Osage County the outcropping sandstone members in the lower half of the Nela goney formation are designated, from the base upward, the Bigheart, Revard, Cheshewalla and Cochahee. Accordingly, in the areas con taining oil- or gas-bearing beds in this sequence the beds are ten tatively'identified as the Bigheart, Revard, Cheshewalla, or Cochahee according to their relative position above the base of the Nelagoneyformation, -which is also tentatively identified in the logs. The main
oil-producing areas are (1) on the crest of the dome in sees. 15 and 16, T. 24 N., R. 8 E., and (2) in the Kasislike field, in sec. 24, T. 24N.,R.7E.

SUMMARY OF SUBSURFACE GEOLOGY 377
The oil- and gas-bearing areas in the Bigheart, Revard, Cheshe- walla and Cochahee sands are listed in the following table:
Areas producing oil or gas from the Bigheart, Revard, Cheshewalla, and Cochahee sand zone
Location
T. 22 N., R.8E.: Sec. 22.. _.. ...-.._.. . ..............
T. 23 N., R. SE.: SEK sec. 9......... ..................
T. 23 N., R. 9 E.: SW&scc. 4...... ........... .........
T. 24 N., R. 7E.: Sec. 24............. ....................
T. 24 N., R. « E.: Sees. 15 and 16... . .................... NW J£S\Y X sec. 36... ................
T. 25 N., R. SE.: NEJOoc. 29.-.. . ...... ...........
T. 20 N., R. 6E.: ' SE'4 soc. 1....... ...................
T. 27 N., R. 5E.: NK& sou. 4 (in Kay Countv). _...._
Oil or gas
Gas.........
.....do........
.....do........
/Oil ..........\Gas. ........
Oil.......... Gas.........
.....do !...
......do.. ..
......do.......
Number of wells
s 2
2
Many1
19 1
2
1
Initial daily yield and remarks
2,000,000 to 2,500,000 cu. ft., from Cochahee sand.
From Revard sand.
10 to 170 bbls., from Bishnart sand.
5 to'lOO bbls., from Revard sand. 750,000 cu. ft., from Cheshewalla sand.
4,000,000 and 7,000,000 cu. ft., fromCheshewalla sand.
From Revard-tti&hcart sand.
STRUCTURE
Osage County is situated on the Prairie Plains monocline, a regional structural feature extending from Iowa and Nebraska to the central mineral region in Texas, in which the exposed rocks dip westward at a rate of 30 to 80 feet to the mile. The mountains of southern Oklahoma constitute the most pronounced interruption in the westward dipping monocline. The regional dip of the rocks is almost due west in the eastern part of Osage County and slightly south of west in the western part. The top of the Oswego lime (Fort Scott limestone) is 200 feet below sea level on the eastern boundary of the county in T. 25 N., R. 12 E. (see plate 15) and 2,500 feet below sea level on the western boundary in T. 25 N., E. 2 E. The average westward dip in this area is 39 feet to the mile.
Although the regional dip is toward the west the rocks have been deformed, and numerous domes, anticlines, and basins, all having low structural relief, interrupt the uniformity of the westerly dip in most parts of the county. The eastern half of the county con tains many domes, anticlines, and structural basins; the western half contains very few folds.
The domes, anticlines, and basins are small and range in size from less than 1 to 3 square miles. Although the individual folds appear not to be systematically arranged, many of them lie in two north-'
378 OIL AND GAS RESOURCES OF OSAGE COUNTY, OKLA.
eastward-trending belts, as shown on plate 17. The western belt, about 12 miles wide, contains many sharply folded domes and anti clines and passes through Cleveland, Hominy, Wynona, and Paw- huska. The eastern belt occupies the easternmost part of .the county. The strip of country about 10 miles wide that lies between these two belts contains relatively few prominent folds.
The crests of many of the domes and anticlines in the western belt and a few in the eastern belt are alined in a northeasterly direc tion. The most prominent of these alinements is one that extends northeastward from the domes in sec. 13, T. 21 N., K. 8 E., passing through Hominy to sec. 13, T. 23 N., E. 8 E., thence a short distance west of Wynona, and thence east of Pawhuska. This belt contains most of the domes of Osage County whose structural closure on the top of the Oswego lime exceeds 100 feet. Another alinement extends northeastward from sec. 1, T. 21 N., R. 7 E., and the southwestern part of T. 22 N., K. 8 E., to sees. 11 and 12, T. 26- N., K. 8. E. A third alinement extends from the dome in sec. 29, T. 22 N., R. 8 E., to sec. 24, T. 26 K, R. 8. E.
Similar alinements, although not so well'defined, appear in the easternmost belt of folds of Osage County. For example, one extends northeastward from the dome in sec. 9, T. 22 N., R. 11 E., to sec. 27, T. 24 N., R. 11 E., and another extends from the dome in sec. 7, T. 23 N., R. 11 E., to the dome in sec. 17, 24 N., R. 11 E.
Noteworthy is the fact that many of the most pronounced folds of the county lie in somewhat poorly defined northwestward-trending belts that cross the northeastward-trending belts at angles of 45 to 60 degrees. Three such northwesterly belts, each 3 to 6 miles wide, are apparent. One extends northwestward from Tps. 25 and 26 N., R. 12 E., through Tps. 26 and 27 N., R. 11 E., and Tps. 27 and 28 N., R. 10 E., into T. 28 N., R. 9 E. A second extends northwestward from the large dome south of Avant in T. 23 N., R. 12 E., to the southwestern part of T. 25 N., R. 9 E., and possibly farther to the northwest. The third belt extends northwestward from T. 20 N"., Rs. 11 and 12 E., to Tps. 23 and 24 N., R. 7 E.; it includes the prom inent domes and anticlines in T. 21 N., R. 9 E., and T. 22 N., R. 10 E.
In Osage County there are 235 domes and anticlines that haveclosures, as represented by 50-foot contours lines on the top of t-he Oswego lime. Of these, only 5 have a closure greater than 150 feet and58 have a closure ranging from 50 to 150 feet. On the southeast flankof many of the domes the Oswego lime dips southeastward as much
as QOO feet in a mile. The dip on the west flanks of the domes andanticlines exceeds that on the east flanks. For most domes and anticlines this difference is a result of the westward regional tilting. The departure from the regional plane formed by any single bed is

SUMMARY OF SUBSURFACE GEOLOGY 379
really greater than it appears on the structure-contour map, because the altitudes used for the map were calculated on a sea-level datum, whereas the datum bed used for the structure contour lines is the top of the Oswego lime, which forms a plane that dips westward at the rate of 39 feet to the mile. Therefore, if the structure-contour map were redrawn with the regional dip eliminated, the domes and anticlines would appear with a greater structural closure, and many of the noses shown on the present map would appear as closed domes.
' The structure of the exposed rocks shown on the maps prepared by Heald and others 20 and by Wood 21 conforms closely to that of the buried Oswego lime, but the buried rocks are more steeply folded than the exposed rocks. Structure-contour maps of the -top of the Siliceous lime show that the rocks older than the Oswego lime are even more steeply folded. Structure-contour maps on these and other key beds show that all the beds are folded and that they are essentially, but not precisely, parallel; the dips increase progressively, although not uniformly, so in the older beds, the intervals between key beds are smaller on the crests of folds than they are on their flanks. All these features are common to most folds in the Mid- Continent region.22
The crests of most of the folds as mapped on the top of the Oswego lime are about 1,000 feet away from the crests of the folds in the ex posed rocks. The shift of the crests in the buried rocks is not uni formly in one direction. Of 101 domes and anticlines in eastern Osage County for which considerable structural control is available, the crests of 28 folds on the Oswego lime lie northwest of the crests of the same folds in the exposed rocks; in 20 the subsurface crests lie southwest of the exposed crests; in 14 the subsurface crests lie west of the surface crests; in 20 the subsurface crests lie directly beneath the surface crests; and in 14 the subsurface crests lie east, northeast, or southeast of the surface crests.
"Many short normal faults cut the surface rocks.23 As has been described by Fath,24 the individual faults trend from N. 20° to 45° W., and have an en echelon arrangement within lineal belts that trend about N. 25° E., across several counties in northeastern Okla homa. The vertical displacement of the exposed rocks is less than
20 White, David, and others, Structure and oil .and gas resources of the Osage Reserva tion, Oklahoma: U. S. Geol. Survey Bull. 686, pis. 2 to 58, 1922.
21 Wood, R. H., Map of parts of the Hominy quadrangle (unpublished, in U. S. Geol. Survey files).
^McCoy, A. W., An interpretation of local structural development in Mid-Continent areas associated with deposits of petroleum : Problems of petroleum geology (Sidney Powers memorial volume), p. 582, Am. Assoc. Petroleum Geologists, 1934.
» Miser, H. D., Geologic map of Oklahoma, U. S. Geol, Survey, 1936.^Fath, A. E., The origin of the faults, anticlines, and buried "granite ridge" of the
northern part of the Mid-Continent oil and gas field : U. S. Geol. Survey Prof. Paper 128, p. 78, 1920.

380 OIL AND GAS RESOURCES OF OSAGE COUNTY, OKLA.
50 feet along most faults, and the extent of most faults is less than 2 miles. In Osage County, the belts of faults lie within the belts of folds but appear to be unrelated to the individual domes and anti clines in fact, the faults do not traverse the domes and anticlines except in a very few localities. The faulting appears to have occurred long after the folding. The faults probably were formed by torsional stresses during westward tilting of the rocks in this part of the Mid- Continent region.
One belt of faults passes through the western part of Tps. 22, 23, and 24, N., R. 8 E., the middle part of T. 25 N., R. 8 E., and east of the middle of T. 26 N., R. 8 E.; a second belt of faults extends north eastward from sec. 6, T. 23 N., R. 9 E., to sec. 4, T. 27 N., R. 10 E.; and a third belt lies mainly in R. 11 E. An investigation of the logs of wells in faulted areas showed that in no place could it be estab lished that rocks as old as the Oswego lime are displaced by the faults. It, therefore, appears reasonable to conclude that the faults die out at shallow depths.
RELATIONSHIP OF THE OIL AND GAS POOLS TO THE STBITCTUBEOF THE BOCKS
Many oil and gas pools in Osage County, in the Siliceous lime and in other rocks, are located on prominent domes and anticlines, but other pools, including those in the Bartlesville and Burbank sands, appear to bear no relation to the attitude of the rocks. (See pis. 16 and 18.) .
Siliceous Ivme and Simpson formation. Most of the oil and gas pools of Osage County that occur in the Ordovician rocks are in the Siliceous lime. The subsurface structure-contour map of the county (pi. 16), on which the pools in the Ordovician rocks are sketched, shows that all except a very few of these pools occur on the crests of domes and anticlines. In some fields the character of the reservoir rock in the Siliceous lime appears to have controlled the location of the main oil pool, for .wells with unusually large yields are situated below the crests of the folds.
The oil pool in sec. 15, T. 24 N., R. 8 E., is an outstanding example of the few pools in Ordovician rocks that do not occur on the crests of domes. In that pool the oil reservoir in the Siliceous lime lies on the east flank of a prominent dome where the top of the Siliceous lime is about 100 feet lower than it is on the crest of the dome. (See pi. 16 of this report, and chapter C, p, 95 and pi. 3.) The rocks of tk© oil. pool are structurally higher, however, than in most of the nearby area. Although no detailed information is available concerning the beds of the Siliceous lime in the oil pool and on the dome, it is prob able that the beds containing oil are missing on the crest of the dome.

SUMMARY OF SUBSU1RFACE GEOLOGY 381
A noteworthy > feature of the occurrence of oil and gas in Osage County is that many domes and anticlines in the southeastern part of the county contain oil pools in the Siliceous lime, whereas domes and anticlines in the northeastern part contain only gas pools in this lime, except in one locality, where both oil and gas are produced. Also, all the oil- and gas-bearing folds,are essentially similar. The oil-bearing anticline in the northeastern part of the county is in sec. 3, T. 28 N., R. 10 E., and sec. 34, T. 29 N., R. 10 E.; two wells on it have yielded oil of low gravity from the Siliceous lime. Oil of low gravity, is also produced from the Siliceous lime on several domes in southeastern Kansas, not far north of Osage County. The gravity of the oil in southeastern Osage County ranges from 37° to 51° A. P. I. scale.
The boundary between the oil-bearing and gas-bearing parts of Osage County is apparent from plate 16. It extends from the south east corner of sec. 3, T. 21 N., R. 12 E., in. a northwestward direction and passes about 6 miles southwest of Pawhuska. This boundary lies from 4 to.9 miles southwest of the northeastern edge of the Simpson formation,25 which extends northwestward from sec. 22, T. 23 N., R. 12 E., and passes about 2 miles southwest of Pawhuska.
The presence of the Simpson formation in southern Osage County may account for the occurrence of the oil in that part of the county; if so, the absence of this formation in the northeastern part of the county explains the absence of oil there. On the other hand, it may be that only certain beds in: the Siliceous lime contain oil, that other beds are barren, and that still other beds contain gas. Erosion in pre-Simpson time formed a peneplain on the southwestward-dipping Siliceous lime and beveled progressively older beds of the Siliceous lime northeastward across Osage county. Thus the gas-bearing beds of northeastern Osage County may be much older and therefore lower in the Siliceous lime than the oil-bearing beds of the southern part.
Much information that might contribute toward an understandingof the occurrence of oil and gas pools in the Siliceous lime could
' doubtless be obtained from a microscopic study of well samples andfrom an investigation of the residues obtained by dissolving thecuttings in acid.
Burgess sand-Mississippi lime zone. The oil and gas pools in the Burgess sand-Mississippi lime zone in Osage County (see pi. 17) occur1 mainly in the several belts of folds. Many oil pools and gas pools occur in a zone 25 to 50 feet thick at the top of the Mississippi lime, and other pools occur in the Burgess sand, which rests upon the lime. The Burgess sand pools are confined to the southeastern and
25 White, L. H., Subsurface distribution and correlation of the pre-Chattanooga ("Wilcox" sand) series of northeastern Oklahoma: Oklahoma Geol. Survey Bull. 40, vol. 1, pi. 2, 1928.

382 OIL AND GAS RESOURCES OF OSAGE COUNTY, OKLA.
eastern parts of the county; elsewhere in Osage County the Burgess sand is absent, and younger beds rest upon the Mississippi lime.
Many oil pools in the upper part, of the Mississippi lime are situated on domes and anticlines in a broad belt extending in a northeasterly direction from -the northwestern part of T. 23 N., R. 8 E., through Pawhuska, to T. 29 N., Es. 10 and HE. (See pi. 17.) This is the main northeastward-trending belt of domes and anticlines in Osage County, and along its western margin are founcl most of the pools in the Mississippi lime. The belt formed by these pools lies directly northwest of a broad belt that contains oil pools in the Bartlesville sand. Along the margin of the oil-bearing Bartlesville sand belt this sand rests upon the Mississippi lime, and oil occurs in both the sand and the lime in some fields. Northwest of this marginal belt the Bartlesville sand is not present. Recent investigations of the crude oils in this part of Osage County show that the oil from many pools in the Mississippi lime is similar to the oil from pools in the Bartlesville sand.26 This may indicate that the oil in the two zones had a common source.
Many widely separated oil or gas pools in the folded belt of south eastern Osage County occur in the Burgess sand, but in some fields the pools lie in the uppermost beds of the Mississippi lime. In several fields the gas pools lie on the higher parts of the domes or anticlines and the oil pools on the flanks; there are, however, many exceptions. (See pi. 17.)
Another prominent belt of pools lies on the broad belt of folded rocks that extends northwestward from T. 26 N., Rs. 11 and 12 E., to T. 29 N., R. 10 E. Most of these pools contain only gas, but several contain both gas and oil, and a few contain only oil. Inasmuch as most of the oil pools lie along the extension of the northeastward- trending oil belt that passes through Pawhuska, they may form a part of that belt rather than a part of this northwestward-trending belt. Most of the pools in this belt are on the higher parts of domes and anticlines, but the producing areas extend far down their flanks. In some fields for example, the one in T. 27 N. on the boundary be tween Rs. 10 and 11 E. gas occurs on the crest and oil on the flanksof the folds. The gas pool in sees. 13, 24, and 25, T. 26 N., R. 11 E., lies low on the west flank of an anticline whose crest is barren.
Bartlesville sand. In much of eastern Osage County the size anddistribution of the oil pools in the Bartlesville sand do not appear to
be controlled by the attitude of the beds but rather by the extent of the reservoir sand bodies. -(See pi, 18.) The Bartlesville sand con-
28 Oral communication from the research committee Of the Tulsa Geological Society, a subcommittee of the Research Committee of the American Association of Petroleum Geologists, April 1940. . .
SUMMARY OF SUBSURFACE GEOLOGY 383
sists of lens-shaped bodies whose length exceeds their width, and as a rule they are arranged in northeastward-trending belts. Some of the Bartlesville sand pools that bear little or no relation to structure are here described. The long, narrow field that lies in the eastern part of T. 25 N., R. 11 E., and the large Avant field, which extends north westward from a locality south of Avant in T. 23 N., R. 12 E., and passes beyond Walco in T. 24 N., R. 11 E., cross local domes and syn- clines. Moreover several small areas within these fields that have yielded unusually large amounts of oil are not in the structurally higher parts of the field. The amount of oil produced from separate tracts apparently is dependent on the permeability, thickness, and other characters of the sand rather than on the position of the tract on a dome or anticline or other structural feature.
The field that trends southwestward across the southwestern part of T. 25 N., R. 11 E., is another example of oil pools whose loca tion and shape are not controlled by the attitude of the rocks. It crosses several small anticlinal and synclinal noses, and its south western part lies in the saddle between two prominent domes. In this pool most of the wells whose yields were small are near the edges of the pool and wells with large yields lie along a narrow northeast ward-trending belt near the middle. The reservoir sand body here, like other Bartlesville sand bodies, is believed to represent an ancient offshore bar, and the limits of the pool coincide with the edges of the lens-shaped sand bod}?. The narrow belt in the middle of the field that contains wells with large yields is probably the central part of the sand body and hence its most permeable and thickest part.
The oil pool in the Bartlesville sand in the Wynona field, which lies mainly in" the eastern part of T. 24 N., R. 9 E., extends across two prominent anticlines and the syncline that lies between them. The tracts in the field that have yielded the largest amount of oil, how ever, are not on the domes but in the syncline. The large field in Tps. 20 and 21 N., R. 12 E., near the southeast corner of the county, crosses prominent domes and synclines.
In much of the southern part of Osage County the oil pools in the Bartlesville sand are related to the structural features. Many wells in areas in which the rocks are structurally low yield water from the Bartlesville sand, and many pools are confined to the higher parts of the domes; but a belt of pools extending southeast from sees. 35 and 36, T. 22 N., R. 8 E., to sees. 29 and 30, T. 21 N., R. 91 E., crosses anticlines and synclines.
Butrbcvrik sand. The occurrence of oil pools in the Burbank sand, (see pi. 18) is controlled by the lensing out of the reservoir sand bodies and does not bear any relationship to the attitude of the beds. Some lenses that contain both oil and water yield mainly
384 OIL AND GAS RESOURCES OF OSAGE COUNTY, OKLA.
water along parts of the structurally low margins of the fields. For example, water occupies the sand at the southwest margin of the South Burbank field whereas only gas, or an increasingly large amount of gas, is present on the crests of some domes, as in the Naval Keserve field, in T. 24 N., R. 7 E.
The Burbank sand, which ranges in thickness from a few feet to about 100 feet in the Burbank field, yields oil throughout an area more than 5 miles wide, across which the beds dip westward a total of about 200 feet. Some wells on the western margin of the field, where the rocks are structurally low, yield some water with the oil, but the water is not under a strong hydrostatic head. Nu merous domes, structural basins, anticlinal noses, and synclines are present in the Burbank field. The lean or abundant oil-bearing parts of the field, however, do not correspond in position to any of these structural features,-but they lie in long, narrow parallel belts that extend through the field in curving paths that are believed to be related directly to features of the sand body formed during its deposition, long prior to the folding of the rocks or the westward regional tilting of the beds. 'The narrow belts containing much oil, are believed to represent the middle, highly permeable parts of the many overlapping bars that comprise the Burbank sand body, and the intervening lean belts probably represent the areas that lie be tween such middle parts and contain the overlapping edges of the bars.
Along the eastern margin of the Burbank and South Burbank fields are several shallow structural basins and synclines in the Oswego lime. (See pi. 10, in chapter J of this bulletin.) They dis appear upward in the sequence of rocks that overlies the Oswego lime, and they are not reflected in the exposed rocks,27 as are most of the folds in the Oswego lime. These characteristics of the basins and synclines, together with their alinement along the eastern mar gins of the sand lenses of the Burbank and South Burbank fields, suggest that they were formed as the result of the compaction of the sediments above them. The sand bodies containing the oil pools are 50 to 100 feet thick, and the degree of their compaction was less than that of the shale east of the sand bodies.28 . An increase in the degree of compaction toward the east margin of the sand lenses would cause eastward-dipping flexures in the beds above the sand bodies. Subsequent tilting of the region toward the west appears to have transformed the flexures into shallow basins and synclines.
27 Heald, K. C., The oil and gas geology of the Foraker quadrangle, Osage County, Okla. : U. S. Geol. Survey Bull. 641, pi. 2, 1916. Bowen, C. F., in White, David, and others, Structure and oil and gas resources of the Osage Reservation, Okla.: U. S. Geol. Survey Bull. 686, pi. 23, 1922.
^Hedberg, H. D., The effect of gravitational compaction on the structure of sedimentary rocks: Am. Assoc. Petroleum Geologists Bull., vol. 10, no. 11, p. 1063, 1926.

SUMMARY OF SUBSURFACE GEOLOGY 385
Skinner sand. Most of the known oil and gas pools in the Skin ner sand in Osage County lie on the flanks of the domes. As this sand is extremely lenticular and has yielded only small amounts of oil or gas in very small areas, the apparent structural relations may be due to the fact that most of the wells have been drilled on folds. Further drilling may reveal several pools that are not on domes in addition to the two now known.
Squirrel (Pirue) sand. The Squirrel sand, called also the Prue sand, yields oil and gas mainly in two narrow belts, one extending northeastward from the west-central part of T. 23 N., R. 8 E., to the vicinity of Pawhuska, and the other extending northeastward from sees. 33 and 34, T. 21 N., R. 10 E., to sec. 25, T. 23 N., R. 10 E. The first of these belts is in one of the prominent belts of folds in Osage County; the second lies in a broad area containing relatively few prominent folds. Most of the oil and gas pools are on or near the crests of domes or anticlines, but an oil pool in sees. 14, 22, and 23, T, 21 N., R. 10 E., is a striking exception. This pool is low On the west flank of a prominent dome (see pi. 8, in chapter H of this bulletin), and its eastern limit is determined by the lensing out of the reservoir sand. Although the oil and gas pools in the Squir rel sand in T. 25 N., R. 9 E., are on folds, their limits are determined in part by the pinching out of the sand.
Oswego lime. The Oswego lime yields oil or gas on the crests of several of the most prominent domes and anticlines in the main belt of folds near the middle of the county and also on a few domes in the eastern part of the county. The largest pools are in T. 24 N., Rs. 8 and 9 E.
Peru sand. The few areas that yield oil or gas from the Peru sand are widely separated, and many of them contain only one well. Some areas are on domes or anticlines, and others are in synclines. The data are too meager to indicate the true relationship between the oil and gas pools and the structure of the rocks.
Big lime. Nearly all the pools that produce oil or gas from the Big lime are on domes or anticlines. Most of these pools are in Tps. 24 and 25 N., Rs. 8 and 9 E., in the midst of one of the promi nent belts of folds in Osage County. Other important oil pools are in Tps. 22 and 23 N., R. 11 E., in another prominent belt of folds. It appears conclusive, therefore, that the occurrence of oil and gas pools in the Big lime bears x a definite relation to the structure of the rocks.
"Wayside sand. The oil pools in the Wayside sand, which are con fined to the northeastern part of the county, lie in synclines or in parts of the regional monocline that are not interrupted by local folds. (See pi. 19.) The well logs in some areas show that the limits of the pools are defined by the pinching out of the sand
OIL AND GAS RESOURCES OF OSAGE COUNTY, OKLA.
bodies, but in other areas the records are inconclusive. It is prob able that the oil-bearing sand lenses lie in definite belts, but the information available is yet too meager to define such belts accu rately in Osage County.
Jones and Cleveland sand zone. On the other hand, most oil pools- in the Jones and Cleveland sand zone, in the southeast quarter of Osage County (see pi. 19), occur on domes and anticlines. The large oil pool in the south-central part of T. -24 N., R. 10 E., however, is an outstanding exception. There the rocks form a broad synclinal nose on the westward-dipping regional, monocline.
Layton sand. Small oil or gas pools in the Layton sand are wide spread in Osage County, but none have had large yields. Some pools occur on domes or anticlines, and others in synclines. A study made by Dillard of the logs of wells in Tps. 21 to 23 N., Us. 8 and 9 E., in which most of the pools are located, showed that the sand beds are extremely lenticular and that the location of the oil and. gas pools is probably determined by the lensing out of the sand, bodies. (See chapters B and H of this report.)
Musseffiem and Peoples sand zone. Of the few pools of oil and gas in the Mussellem and Peoples sand zone some are on domes or anticlines and others are low on the flanks of upfolds or in synclines. Structural features thus appear to have exercised a dominant in fluence on the accumulation of oil and gas in some pools, and the lensing out of the reservoir sand bodies has doubtless been the controlling factor in other pools.
Okesa, Torpedo, and Clem Creek sand zone. Oil and gas pools 'in the Okesa, Torpedo, and Clem Creek sand zone, most of which are in Tps. 21 to 24 N.,,Bs. 8 and 9 E., are on the crests of promi nent domes or anticlines. Inasmuch as this sand zone is widespread,, though individual beds in the zone appear to be lenticular, and has; been penetrated by thousands of wells in the county, it appears rea sonable to conclude that the position of the oil and gas pools is controlled mainly by the attitude of the rocks.
Biglieart, Revard, ChesJiewalla, and Cochahee sand zone. Oil and gas pools in the Bigheart, Revard, Cheshewalla, and Cochahee sand.zone occur on or near the crests of domes, but most of them are of small extent. The largest oil pool in this zone, in sees. 15 and 16 f T. 24 N., R. 8 E., in which 19 wells have yielded oil, is on one of the=
steepest domes in the county. Another large pool, in sec. 24, T. 24N., R. 7 E., is on the west flank of a low dome.
Summary. The available information brings out the following- relationships: (1) In the Siliceous lime, Mississippi lime, Oswego- lime and Big lime, the oil and gas pools occur on or near the crests- of domes and anticlines. (2) In the Bartlesville, Burbank, Way side, and Layton sands the oil arid gas pools occur in lenticular reser-

SUMMARY OF SUBSURFACE GEOLOGY 387
voir bodies, which in Osage County are distributed indiscriminately with respect to the domes, anticlines, and synclines. The occurrence of the oil and gas pools in these sands appears, therefore, to be con trolled mainly by the pinching out of the reservoir beds, though local structural features appear to have influenced the distribution of the oil, gas, and water within individual fields. (3) In the Squirrel
, sand and in the Mussellem and Peoples sand zone a combination of lenticular reservoir beds and local structural features appears to account for the occurrence of the oil and gas pools. (4) In the Okesa, Torpedo, and Clem Creek sand zone and in the Bigheart, Kevard, Cheshewalla, and Cochahee sand zone a similar combination of lenticular beds and local structural features probably accounts for many of the pools, but most pools in these zones are on or near crests of domes or anticlines. (5) In the Skinner and Peru sands the
occurrence of oil and gas pools may be due either to lenticular beds or to local structure.
POSSIBILITIES FOR DISCOVERING ADDITIONAL OILAND GAS
tOf the many areas described in detail in the previous chapters of
this report (Bull. 900, A-J), probably the most promising for the discovery of large pools lies south of the South Burbank and Bur- bank fields, where additional oil-bearing lenses of Burbank sand are believed to be present. These postulated sand bodies are probably narrower than the sand bodies of the Burbank fields, and if present they are not reflected in the attitude of the exposed rocks. They will therefore be difficult to locate.
Several domes and anticlines in southeastern Osage County have not been adequately tested for oil in the Siliceous lime, ancl others in northeastern Osage County have not been fully explored for gas in this lime. Successful.oil wells drilled in 1940 in T. 23 N., T&. 10 E., and T. 21 N., R. 9 E., tend to prove that Osage County contains pools not yet discovered. Some of the domes that are prospectively valuable for oil in the Siliceous lime are described in chapters A, B, C, G, and H.
Chapters A to E call attention to localities wherein oil pools in the Bartlesville sand have not been completely developed. For ex ample, the NWi/4 sec. 11, T. 24 N., R. 11 E. (see Bull. 900-D, pi. 4) contains five oil wells alined in a row on the west margin of the quarter section, and none of these wells has been offset on the west or the east. Sees. 20, 22, and 26, T. 24 N., R. 9 E., and sees. 13, 23, and 24, T. 24 N., R. 8 E., contain incompletely developed areas of oil- bearing Bartlesville sand (see Bull. 900-C, pi. 3).
388 OIL AND GAS RESOURCES OF OSAGE COUNTY, OKLA.
Some additional oil pools will be discovered in reservoir beds other than those just described. The small oil pool in a lens in the Way side sand in sees. 3 and 10, T. 28 N\, K. 11 E., discovered and de veloped in 1939 to 1941 is an example of what may be expected from the younger sands in Osage County.
Many oil pools contain undeveloped gas pools that were drilled through and sealed off in order to produce oil from reservoir beds either below or above the gas sands. Detailed information on such gas pools can be acquired from the well logs on file at the Osage Indian Agency. Aside from these proved gas pools, a few others doubtless will be discovered by additional drilling.
Much oil probably will be produced in Osage County by secondary- recovery methods, which include repressuring of the reservoir beds with gas, flooding with water, or treatment with acid. Oil pools in the Bartlesville and Burbank sands offer the best opportunities.- for large recoveries by secondary methods, because only a relatively small portion of the oil originally contained in these sands has been recovered by the usual method of pumping. Secondary-recovery operations in these sands carried on recently in several places in northeastern Oklahoma have demonstrated the feasibility of such methods. Though it is probable that not all areas are adaptable to secondary-recovery methods as now practiced, the very large total area underlain by one or the other of these sands furnishes a large potential reserve. The Wayside sand and the Okesa, Tor pedo, and Clem Creek sand zone also may yield fair results from secondary-recovery operations. v
The reservoir rocks in the Siliceous lime, the Mississippi lime, the Cleveland and Jones sand zone, the Oswego lime, and the Big lime are in general poorly adapted to such secondary-recovery operations as gas repressuring and water flooding, because these reservoirs contain much water as well as oil and therefore produce much, water along with the oil in most of the wells. Doubtless the production of large amounts of water has subjected the reservoirs in part to naturalwater-flooding during the normal producing life of the wells. The yield of oil and water of some old wells producing from the Siliceous lime, Oswego lime, or Big lime has been greatly increased by acid treatment. Such operations have generally been profitable, though it has been necessary to handle an increased amount of water.

INDEX
PageAbstracts of chapters____ 1, 47-48, 83-84,
131, 173, 209-210, 237,269, 303, 321, 343-344
Alineda field_____________ 195-196Alvin dome________________ 201-202Avant field_______________ 154-155
B
Bacon Rind dome___________ 186-187,202-293
Bald Hill dome____________ 257-259Bandwheel dome.. 115 Bartlesville sand_________ 5-6,15-16,
22-23, 35-36, 52-54, 87-88, 135-137, 176-177, 241-242, 274-275, 362-36i, 882-383, pi. 18
Bass, N. W., work by_ _ 4,15, 58, 64, 73, 93, 122, 308, 314, 323, 339, 341, pis. 1-5, 7j 9, 31, 12 (in pocket)
Bellieu dome______________ 187 Benchmark anticline_-____ - 227 Big lime and Peru sand zone _ 275,
368-369Big lime (Oologah limestone)___ 7, 24, 37.
55, 90, 138, 177, 369-370, 385 Bigheart, Eevarcl, Cheshewalla, and
Cochahee sand zone_ 376-377 Bigheart anticline. See North Big-
heart anticline; South Bigheart dome.
Bigheart sand______________ 58, 307 See also Revard and Bigheart
sand zone.Bighorse anticline___________ 205-206 Birch Creek dome___ 142,158-159, 217 Birch Creek field____________ 142 Birdseye anticline. See East Birds-
eye anticline.Blaine dome______________ 184-185 Bonuses. See Oil and gas rights. Boston dome____________ 62-63, 283 Boston-Osage anticline_______ 167-168
See also East Boaton-Osage anti cline.
Brown anticline_____________ 40-41See also South Brown anticline.
Brunt anticline____-_-______ 186 Buck Creek anticline_________ 193-194 Buck Creek field __________ 226-227 Buck Point dome-____________ 195 Bug Creek dome. See Lower Bug
Creek dome ; Middle Bug Creek dome; Upper Bug Creek dome.
459067 42
. PageBulldog anticline__________ 118-119 Burbank field, beach-sand deposition
in____________ 334-341, pis. 11-12 (in pocket)
description of__________ 326-332 maps of_____ pis. 10-12 (in pocket) possibility of discovering new oil
and gas pools in ___ 334-336, 339, 341, pi. 12 (in pocket)
Burbank sand_____________ 305-306, 313, 324-325, 335-341, 364-365, 383-384, pis. 11, 18 (in pocket)
Burgess sand-Mississippi lime zone_ 6-7, 23-24, 36, 51-52, 86-87, 134- 135,175-176, 212, 240-241, 273, 361-362, 381-382, pi. 17 (in pocket)
Caney River anticline. See NorthCaney River anticline.
Cedar Bluff dome___________ 30-31 Cedar Creek anticline________ 149-150 Chattanooga shale____________ 360 Cheshewalla sand____________ 58, 92
See also Bigheart, Revard, Cheshe walla, and Cochahee sand zone.
Clear Creek domes_____________ 110Clem Creek sand _ _ _ __ 57-58
See also Okesa, Torpedo, andClem Creek sand zone.
Cleveland sand____ 6, 36-37, 56, 276, 371 See also, Jones and Cleveland
sand zone. Cochahee dome. _ 121
Se also North Cochahee dome. Cochahee sand_______________ 58
See also Bigheart, Revard, Chesb- ewalla, and Cochahee sand zone.
Cold Spring anticline ______ 104-106Cottonmouth anticline____ 120-121, 125 Conley, J. N., work by_ 93, pi. 3 (in pocket) Country Club dome_________ 259-260 Crane dome __-_ 223 Crystalline rocks____________ 356-357
D
Dalton dome_______________ 94-95 Delaware anticline_____ _ 259 Dillard, W. R., work by__ 4, 15, 35, 58, 64,
244, 250, 257, 263, 285, 293, 296, 308, 314, 323, pis. 1, 2, 7-11 (in pocket)
Dillard sand. See Jones sand.389

390 INDEX
PageDoe Creek anticline______ 192-193, 207 Dogtbrasher anticline_________ 157 Drilling, history of______.___ 349-351 Dry Hollow anticline_____ 180-181, 188 Ducotey dome _____________ 127-128 Dunn anticline__ __ __ __ 169
E
East Birdseye anticline- ___ _ 144-145 East Boston-Osage anticline-____ 168 East Hominy anticline____ _ 75-76 East Madalene dome_____ 296, 299-300 East Mission Creek anticline__ 224, 230 Edgewood dome_ _ 252
See also South Edgewood dome. Eleven-Twelve anticline____ 154 155 Elgin field. See South Elgin field. Elkins anticline____________ 204-205 Euches Creek dome _ 248
P
Fairfax field______________ 332 Falls anticline _ 100-101 Flat Rock field_____________ 26'i-265 Flesher anticline- _ . 73-74 Fort Scott limestone. See Oswego
lime.Foster lease, provisions of_ _ 346-347 Fourmjle dome_ 112-114, 145 Fox dome - 41
See also South Fox dome.
G
Gas, occurrence of, relation of struc ture to 380-387
possibilities for discovering newpools_________ 387-388,
pi. 12 (in pocket) See also under particular
townships.production of, total________ 351
See also under particulartownships,
sand bodies containing, originof_____________ 334-337
See also Oil. Gibson domes _ ________ 129Gobbler anticline. See North Gobbler
anticline; South Gob bler anticline.
Goodrich, H. B., work by_ ____ 308, 323, pis. 6, 9-11 (in pocket)
H
H.irdy dome 42Hengst, J. H., work by _ 4,
15, 103, pis. 1, 3 (in pocket)Herddge anticline_______ 186-187, 203Hickory Creek field___ __ - 233-235Hominy dome-__ _____ 59-60, 76-77
See also East Hominy anticline.
PageJavine anticline._ __ ______ 167 Jenkins, H. D., work by_________ 78,
147, 285, pis. 2, 4, 8 (in pocket) Jones and Cleveland sand zone____ 90-91,
138, 371-372, 386, pis. 19-20(in pocket)
Jones 'anticline _ ___ 197-198 Jones sand___-___ 6, 56, 243, 276, 371
See also Jones and Cleveland sandzone.
K
Kasishke field. ____ 317-318Kay County. See Burbank field.Kennedy, L. E., work by 4,
15, 22, 35, 58, 78, 93, 103, 111, 140, 153, 179, 190, 199, 214, 233, 308, 314, pis. 1-5, 6, 9 (in pocket)
Kiheki dome______________ 151Kirk, C. T., work by_- __ 58,
73, 278, pis. 2, 7, 8 (in pocket)
Labardie domes _ 42-43Labette shale____ 368Lake View dome_______ 31-32, 255-256Layton sand _ - 8,
56-57, 91. 138, 178, 213, 276,306, 372-373, 386
Leasing, oil and gas rights- 346-349, 351-352Leatherock, Otto, work by_______ 22,
35, 64, 111, 199, 214, 221, 224,228, 233, 244, 250, 293, 296,pis. 1, 2, 5, 6, 8 (in pocket)
Lee dome ________________ 97-98Lombard dome.____________ 41Lookout, Fred, photograph of___ pi. 13Lost Creek anticline_________ 169, 197Lower Bug Creek dome_______ 311-312Lynn anticline ________ 185-186
M
McClure, G. D., work by___-____ 164, pi. 4 (in pocket)
McKeen, O. L., work by______ 323, 330 Madalene anticline___'_______ 297
See also East Madalene dome. Manion anticline ______ 69-70, 80-81
See also North Manion anticline.Mathews dome.__ _________ 201Mayer anticline_______ 108, 126-127Meribel, M/D., work by_- ____ 244,
250, 257, 263, 308Middle Bug Creek dome________ 310 Minnehoma dome___________ 157 158 Misener sand_______________ 360 Mission Creek anticline. See East
Mission Creek anti cline ; West Mission Creek anticline.

INDEX 391Page
Mississippi lime__ 16-17, 240, 305, 324 See aluo Burgess sand-Missisippi
lime zinc.Mizer dome_______________. 181-182Musgrove dome ____ ______._ 200Mussellem and Peoples sand zone_ 9.1,
138-139, 178-179, 276-277,374, 386
Mussellem sand_____________ 57
N
Naval Reserve field__________ 315-317 Naval Reserve oil pool_________ 313 Nelagoney anticline __________ 148-149 North Bigheart anticline______ 160-161 North Caney River anticline____ 229-230 North Cochahee dome________ 148 North Gobbler anticline_______ 235-236 North Manion anticline________ 68-69,
79-80, 117-118 North Wildhorse dome_________ 10-11
0
Ohio-0s:ige field____________ 291-292 Oil, occurrence of, relation of struc
ture to_________ 380-387 possibilities for discovering new
pools 224-336, 338-340, 341, 387-388, pi. 12 (in pocket)
See also under particulartownships.
production of, history of___ 349-351 total_____________ 350, 351 See also under particular
townships and fields, recovery of, by secondary meth
ods________ 340-342, 388 See also under particular
townships and fields, sand bodies containing, origin
of ___________ 334-337 Oil and gas rights, bonuses, rentals,
and royalties from__ 351-352 leasing of-____________ 346-349
Oil or gas-bearing beds, Pennsyl-vanian, names for____ 353-355
tables listing___________ 3', 49, 85, 132, 174, 210, 238, 270, 303, 322.
See also names of individualbeds.
Okay anticline___.__..__. 125-126 Okesa, Torpedo, and Clem Creek sand
zone_________ 91-92, 179, 277, 307, 325, 375-376, 386.
Okesa dome______________ 106-197 Okesa sand- ______________ 57-58 Oologah limestone. See Big lime. Ordovician beds, oil and gas pools in,
map showing. _ pi. 16 (in pocket)
PageOsa^e County, acreage of____ __ 344
areas described, map showingrelative position of__ 345
eastern, geologic section across- pi. 20(iu pocket)
geologic section across_____ pi. 14 (in pocket)
location of_____________ 2, 344 oil and gas in, map showing
fields___ pi. 15 (in pocket) previous reports on____ 345 See also particular townships and fields.
structure of_________ 377-387 See also particular town
ships and fields. Osage Tribe, income received by,.from
oil and gas_______ 351-352 principal chief of, photograph
of______________ pi. 1 Osage Indian Agency, records of, tables
of production compiled from. See particular
' townships and fields. Osage Indian Reservation, history of 346 Osage-Hominy field _______ 65-68 Oswego lime (Fort Scott limestone) 7-8,
26. 38, 55, 89, 137, 177, 243, . 367-368, 385
Page dome- ___ __ ____ 249 Pawhuska anticline_________ 128-129 Pencresdall anticline _ ____ 141-142 Penn Creek dome_ _________ 70 Pennsylvanian beds, oil or gas-bearing,
names for____ _ 353-355 Peoples sand_______________ 57, 306
See also Mussellem and Peoplessand zone.
Pershing field ____________ 321, 123-124, 143-144
Peru sand____________ 89-90, 137-138, 177, 212, 368-369, 385
See also Big lime and Peru sandzone. .
Pettit dome________ ______ 70-71 Phillips anticline___________ 198-199 Phillips Petroleum Co., work by__ 323, 330 Pioneer dome_______.._______ 245 Pipeline anticline_>__________ 116-117- Polledoak dome____________ 309-110 Pond Creek dome_____ 215-216, 231-232 Postoak anticline___________ 119-120 Prairie Plains monocline________ 377 Pre-Cambrian rocks _________ 356-357 Prue anticline__ __'. ____________ 129Prue dome____________ 293-294, 301 Prue sand. See Squirrel (Prue) sand.
Q
Quapaw field____________ 166-167, 170'

392 INDEX
RPage
Rainbow anticline 319 Rattlesnake anticline _ 218 Red Bluff anticline____________ 254-255 Red Eagle anticline_____ 140-141 Red Fork sand________________ 23, 38,
54, 242, 275, 281-282, 304-365,pi. 18 (in pocket)
Rentals of oil and gas rights. SeeOil and gas rights.
Revard anticline_______ _ 182 Revard and Bigheart sand zone- 325-326 Revard sand_______________ 58,92
See also Bigheart, Revard, Chese-walla, and Cochaheesand zone.
Rodeo anticline______________ 108-109Royalties. See Oil and gas rights.Rutter anticline_______1____ 201
Sand bars, relation of, to oil andgas_ 335-338, pi. 12 (in pocket)
Sand Creek anticline___ 180, 193, 207-208 Saucy Calf anticline_______ 121, 123-124 Scarp anticline_____________ 250-251 Shamblin, W. B., work~by______ 183,
pi. 5 (in pocket)Shaw dome ______________ 206 Shell Creek dome___________ 247-248 Shidler stage of beach-sand deposi
tion__________ 337-338, 339, pi. 12 (in pocket)
Shoestring sands, relation of, to an cient shore lines_ _ 334
water-flooding of, results of-__ 342 Shore lines, ancient, determination
of 337-340, pi. 12 (in pocket)Siliceous lime____________ 7, 16, 24-25,
37-38, 49-51, 85-86, 133-134,175, 211-212, 239-240, 271-272, 305, 323-324, 357-359,380^381, pi. 16 (in pocket)
Simpson formation_____________ 724-25, 37, 49^51, 85-86, 133-134, 239-240, 271-272, 305, 323-324, 359-360, 380-381
Skinner sand___ _ _ 7,17, 54, 89, 177, 242-243, 306, 325, 365-366, 385
South Bigheart dome________ 159-160 South Brown anticline-1_______ 26-29 South Burbank field, bench-sand depo
sition in_ 335-341, pis. 11-12 (in pocket)
description of_____ 326-328, 332-334 maps of pis. 10-12 (in pocket) possibility of discovering new oil
and gas pools in_ 334-336,339-341, pi. 12 (in pocket)
South Burbank stage of beach-sand deposition. See Stanley stringer-South IJurbank stage of beach-sand dep osition.
PageSouth Edgewood dome_____ 253 South Elgin field_____________ 225-226 South Fox dome_____________ 29-30 South Gobbler anticline__ - 235-236 South Wildhorse anticline___ 296, 298-299 Spring Creek domes ________ 217-218 Squirrel (Prue) sand____ __ 17,
25, 38, 54-55, 89, 137, 243, 275, 366-367, 385
Stanley stringer, character and extentof ________ 328, 336-337, 341, pis. 10, 12 (in pocket)
Stanley stringer-South Burbank stage of beach-sand deposi tion________ 337, 338, 340, 341, pi. 12 (in pocget)
Strikeaxe anticline_ _ 182 Structure, relation of, to oil and
gas ________ 380-38V Sycamore dome_________ 193, 312-333
T
Taneha sand________ 25, 241, 273, 362 Thirty-six anticline_______ 98-100, 118 Thomas, S. B., work by__ 323 Torpedo sand__________ 57-58, 213
See also Okesa, Torpedo, and Clem Creek sand zone.
T. 20 N., R. 9 E__ 283-284; pi. 8 (in pocket) T. 20 N., R. 10 E 292-295, pi. 8 (in pocket) T. 20 N., R. 11 E__243-249, pi. 7 (in pocket) T. 20 N., R. 12 E 256-262, pi. 7 (in pocket) T. 21 N., R. 8 E__ 277-283, pi. 8 (in pocket) T. 21 N., R. 9 E__ 284-292, pi. 8 (in pocket) T. 21 N., R. 10 E__ 295-302, pi. 8 (in pocket) T. 21 N., R. 11 E__ 249-256, pi. 7 (in pocket) T. 21 N., R. 12 E 262-268, pi. 7 (in pocket) T. 22 N., R. 8 E__ 48-64, pi. 2 (in pocket) T. 22 N., R. 9 E___ 72-78, pi. 2 (in pocket) T. 22 N., R. 10 E___ 3-14, pi. 1 (in pocket) T. 22 N., R. 11 E___ 22-34, pi. 1 (in pocket) T. 23 N., R. 7 E__ 307-313, pi. 9 (in pocket) T. 23 N., R. 8 E___ 64-72, pi. 2 (in pocket) T. 23 N., E. 9 E__ 78-82, pi. 2 (in pocket) T. 23 N., R, 10 E__ 14-22, pi. 1 (in pocket) T. 23 N., R. 11 E___ 34-35, pi. 1' (in pocket) T. 24 N., R. 7 E_313-319, pi. 9 (in pocket) T. 24 N., R. 8 E___.92-103, pi. 3 (in pocket) T. 24 N., R. 9 B__ 110-1.21, pi. 3 (in'pocket)T. 24 N., K. 10 E__ 131-146, pi. 4 (in pocket) T. 24 N., R..11 E__ 152-163, pi. 4 (in pocket) T. 25 N., R. 6 E. See South Bur-
bank field.T. 25 N., R. 8 E 103-110, pi. 3 ,(in pocket) T..25 N., R. 9 E__ 122-129, pi. 3 (in pocket) T. 25 N., R. 10 E__ 146-152, pi. 4 (in pocket) T. 25 N., K. 11 E__ 163-171, pi. 4 (in pocket) T. 26 N., R 5 E. See Burbank field. T. 26 N., R. 6 E. See Burbank field;
South Burbank field.T. 26 N., R.' 10 E__ 179-182, pi. 5 (in pocket) T. 26 N., R. 11 E__ 190-199, pi. 5 (in pocket) T. 27 N., R. 5 E. See Burbank field. T. 27 N., R. 6 E. See Burbank field.
T. 27 N., R. 10 B 183-189 T. 27 N., R. 11 E 199-208 T. 28 N., R. 10 E__ 214-220 T. 28 N., R. 11 B 220-224 T. 29 N., R. 9 E__ 224-227, T. 29 N., R. 10 E__ 227-232 T. 29 N., R. 11 E__ 232-236 Turkey anticline_ - Turkey Creek anticline.
Turkey CreekTurkey Creek dome Turley field- __ . .
Pagepi. 5 (in pocket) pi. 5 (in pocket) pi. 6 (in pocket) pi. 6 (in pocket) pi. 6 (in pocket) pi. 6 (in pocket)
i, pi. 6 (in pocket) ______ 102-103 See West anticline. .____; 245-246 .____ 260-261
U
Upper Bug Creek dome. 309
W
Wayside sand_____ ___ 90-91, 177-178, 212-213, 370, 371-372, 385-386, pis. 19-20 (in pocket)
Weiser sane ____ West Birdseye aiWl'fflhiie _-___ 112-?3I West Javine dome ____ _ 150-151 West Mission Creek anticline 218-219 West Turkey Creek anticline____ 228-i!29 Wheeler dome ._______'.- ___'.- 95--97 WhiteclifE dome__ _________, 106-^08 WMtetail dome______r 181, 187-188 Whisky Hollow dome__________ 196 Wimberley dome_____________ 246-247 Woodring anticline .___ 222 Woolaroc field_____:__ _ _ 165-166 Wildhorse anticline_______ 295-296, 298
See also North Wildhorse dome; South Wildhorse anti cline.
Wooster anticline- _ _ __ 125 Wynona anticline _ - __ 115 Wynona field________ 112-114,144-145