substance use and other health-related behaviours …
TRANSCRIPT
SUBSTANCE USE AND OTHER
HEALTH-RELATED BEHAVIOURS AMONG ACT SECONDARY STUDENTS
Results of the 2002 ACT Secondary Student
Alcohol and Drug survey
Health Series Number 37
Population Health Research Centre Population Health Division
ACT Health
December 2004

2
ACKNOWLEDGEMENTS The authors of this report, Liza Kelsall, Wasu Jayasinghe, Louise Freebairn and Karen Lees, wish to acknowledge the efforts of the ACT Survey Leader Jan McKenzie and the ACT survey team in conducting the 2002 ACT Secondary Student Alcohol and Drug (ASSAD) survey. The Cancer Council ACT and Department of Education and Training are especially thanked for their support as partners with ACT Health in the conduct of the survey. Special acknowledgement is made of the assistance and guidance provided by Jane Hayman and Vicki White from the Centre for Behavioural Research in Cancer at the Anti-Cancer Council of Victoria in the conduct and analysis of the survey, and of the contributions of the ACT ASSAD Survey Stakeholder Group.
ISSN 1325-1090 © Australian Capital Territory, Canberra, July 2004 This work is copyright. Apart from any use as permitted under the Copyright Act 1968, no part may be reproduced by any process without written permission from Library & Information Management, Department of Urban Services, ACT Government, GPO Box 249, Civic Square ACT 2608. Produced for the Population Health Research Centre by ACT Health and printed on recycled paper. Enquiries about this publication should be directed to Gerard Fitzsimmons, Population Health Research Centre, Building 5 Level 1, The Canberra Hospital PO Box 11, Woden ACT 2606, or via email to [email protected]. Publication No: 04/1709 Suggested citation: Population Health Research Centre, ACT Health. 2004. Alcohol, Tobacco and Other Substance Use by ACT Secondary Students in 2002. Health Series No 37. Canberra, ACT Government. Population Health Research Centre publications can be accessed online at http://www.health.act.gov.au

3
CONTENTS
ACKNOWLEDGEMENTS ........................................................................................................................................... 2
LIST OF TABLES.......................................................................................................................................................... 5
LIST OF FIGURES........................................................................................................................................................ 8
OVERVIEW ................................................................................................................................................................. 10
INTRODUCTION ........................................................................................................................................................ 16
METHODS.................................................................................................................................................................... 17
ALCOHOL CONSUMPTION BY ACT SECONDARY STUDENTS .................................................................... 23 Consumption of alcohol.......................................................................................................................................... 23 Recent consumption of alcohol............................................................................................................................... 25 Harmful alcohol consumption ................................................................................................................................ 27 Self-described drinking status................................................................................................................................. 28 Source of alcohol .................................................................................................................................................... 29 Access to alcohol .................................................................................................................................................... 31 Average number of drinks consumed...................................................................................................................... 31 Preferred alcoholic drinks...................................................................................................................................... 31 Places where alcohol was consumed...................................................................................................................... 32 Attitudes to alcohol ................................................................................................................................................. 33 Education in class on alcohol................................................................................................................................. 35
TOBACCO USE BY ACT SECONDARY STUDENTS........................................................................................... 36 Use of tobacco ........................................................................................................................................................ 36 Recent, or current use of tobacco ........................................................................................................................... 38 Self-described smoking status................................................................................................................................. 39 Source of tobacco ................................................................................................................................................... 39 Quantity of tobacco used ........................................................................................................................................ 41 Attitudes to smoking................................................................................................................................................ 43 Intention to be smoking in twelve months............................................................................................................... 44 Education in class on smoking ............................................................................................................................... 45
USE OF OTHER (INCLUDING ILLICIT) SUBSTANCES BY ACT SECONDARY STUDENTS.................... 46 ANALGESICS................................................................................................................................................................ 46
Recent use of analgesics ......................................................................................................................................... 47 Frequency of use..................................................................................................................................................... 47
CANNABIS ................................................................................................................................................................... 48 Recent use of cannabis ........................................................................................................................................... 49 Frequency of use..................................................................................................................................................... 49 Places where cannabis was used............................................................................................................................ 50 Preferred methods of using cannabis ..................................................................................................................... 50 With whom students used cannabis ........................................................................................................................ 50
INHALANTS.................................................................................................................................................................. 50 Recent use of inhalants ........................................................................................................................................... 51 Frequency of use..................................................................................................................................................... 51
TRANQUILLISERS......................................................................................................................................................... 52 Recent use of tranquillisers .................................................................................................................................... 52 Frequency of use..................................................................................................................................................... 53
HALLUCINOGENS......................................................................................................................................................... 53 Frequency of use..................................................................................................................................................... 54
AMPHETAMINES .......................................................................................................................................................... 54 Frequency of use..................................................................................................................................................... 55

4
STEROIDS .................................................................................................................................................................... 55 Frequency of use..................................................................................................................................................... 56
OPIATES ...................................................................................................................................................................... 56 Frequency of use..................................................................................................................................................... 57
COCAINE ..................................................................................................................................................................... 57 Frequency of use..................................................................................................................................................... 57
ECSTASY ..................................................................................................................................................................... 58 Frequency of use..................................................................................................................................................... 58
USE OF ANY ILLICIT SUBSTANCE.................................................................................................................................. 58 Recent use of any illicit substance .......................................................................................................................... 59
USE OF NEEDLES FOR INJECTING DRUGS ...................................................................................................................... 60 Frequency of use..................................................................................................................................................... 60
PERCEPTIONS OF DANGER ASSOCIATED WITH ILLICIT SUBSTANCE USE ........................................................................ 60 Perceptions of the level of danger associated with cannabis use among students who had used/not used cannabis at least once in their lifetime .................................................................................................................................. 61 Changes in perception of the level of danger associated with other substance use ............................................... 62
EDUCATION IN CLASS ON ILLICIT SUBSTANCE USE ....................................................................................................... 62 POLY-SUBSTANCE USE BY ACT SECONDARY STUDENTS........................................................................... 64
Recent poly-substance use ...................................................................................................................................... 66 Factors associated with recent poly-substance use (tobacco, alcohol and at least one illicit substance) ............. 66
NON-USE OF SUBSTANCES BY ACT SECONDARY STUDENTS .................................................................... 68 Factors associated with non-use of substances (tobacco, alcohol and illicit substances) ..................................... 68
OTHER HEALTH-RELATED BEHAVIOURS AMONG ACT SECONDARY STUDENTS............................. 70 NUTRITION .................................................................................................................................................................. 70
Daily fruit consumption .......................................................................................................................................... 70 Daily vegetable consumption.................................................................................................................................. 70 Daily bread and cereal consumption...................................................................................................................... 70 Factors associated with meeting the fruit, vegetable and bread and cereal Dietary Guidelines for Children and Adolescents in Australia ......................................................................................................................................... 71
PHYSICAL & LEISURE-TIME ACTIVITY........................................................................................................................ 73 Factors associated with meeting the recommendations in the National Physical Activity Guidelines for Australians................................................................................................................................................................................ 73 Time spent watching TV or Video........................................................................................................................... 75 Time spent using the Internet/playing computer games ......................................................................................... 76
SUN PROTECTION ........................................................................................................................................................ 77 Knowledge about skin cancer................................................................................................................................. 77 Education on skin cancer ....................................................................................................................................... 78 Sunburn................................................................................................................................................................... 78 Sun protective behaviours ...................................................................................................................................... 79
APPENDICES............................................................................................................................................................... 82 TABLES ..................................................................................................................................................................... 83 ASSAD 2002 QUESTIONNAIRE................................................................................................................................. 111
GLOSSARY ................................................................................................................................................................ 141
REFERENCES ........................................................................................................................................................... 143

5
LIST OF TABLES TABLE 1: OVERVIEW OF RESULTS, ACT 1996, 1999 & 2002.......................................................................................... 10 TABLE 2: ACT SECONDARY SCHOOL ENROLMENTS(A),(B) (12 TO 17 YEARS) BY SCHOOL TYPE AND SEX, 2002. ................ 17 TABLE 3: ASSAD STUDENT SAMPLE, BY AGE AND SEX, FOR THE ACT, 1996, 1999 & 2002. ........................................ 18 TABLE 4: NUMBER OF DRINKS CONSUMED, AT LEAST ONCE, ON ANY ONE OCCASION, IN THE LAST TWO WEEKS, BY SEX,
ACT 2002 (%). ....................................................................................................................................................... 28 TABLE 5: RECENT AND HARMFUL DRINKERS BY SELF-DESCRIBED DRINKING STATUS, ACT 2002 (%)............................ 29 TABLE 6: WHERE AND FROM WHOM STUDENT GOT LAST ALCOHOLIC DRINK, BY CLASS OF DRINKER, ACT 2002 (%). ... 30 TABLE 7: STUDENT ACCESS TO ALCOHOL THROUGH RETAILERS, ACT 2002 (%). ........................................................... 31 TABLE 8: TYPE OF ALCOHOL PREFERRED BY STUDENTS, ACT 1996, 1999 & 2002 (%). ................................................ 32 TABLE 9: ATTITUDES TO DRINKING, PER CENT AGREEING OR STRONGLY AGREEING, BY SEX, ACT 1996, 1999 & 2002
(%). ......................................................................................................................................................................... 34 TABLE 10: LEVEL OF PERCEIVED DANGER IN HAVING FIVE OR MORE DRINKS OF BEER, WINE OR SPIRITS IN A ROW, BY AGE
GROUP, ACT 1996, 1999 & 2002 (%). ................................................................................................................... 35 TABLE 11: RECEIVED AT LEAST PART OF A LESSON IN CLASS ON ALCOHOL BY AGE AND YEAR, ACT 1996, 1999 & 2002
(%). ......................................................................................................................................................................... 35 TABLE 12: ALL STUDENTS, RECENT, OR CURRENT SMOKERS AND 'HEAVY SMOKERS' ACCESS TO CIGARETTES, ACT 2002
(%). ......................................................................................................................................................................... 41 TABLE 13: MEDIAN NUMBER OF CIGARETTES SMOKED IN THE LAST WEEK, BY AGE GROUP AND SEX, ACT 1996, 1999 &
2002 (%). ................................................................................................................................................................ 41 TABLE 14: RECENT, OR CURRENT SMOKERS' PREFERRED BRANDS OF CIGARETTES, BY SEX, ACT 1996, 1999 & 2002 (%).
................................................................................................................................................................................ 42 TABLE 15: STUDENT ATTITUDES TO CIGARETTES, AGREEING OR STRONGLY AGREEING BY SEX, ACT 1996, 1999 & 2002
(%). ......................................................................................................................................................................... 44 TABLE 16: STUDENT PERCEPTIONS OF DANGER ASSOCIATED WITH SMOKING CIGARETTES, ACT 2002 (%). ................... 44 TABLE 17: 'DO YOU THINK YOU WILL BE SMOKING CIGARETTES THIS TIME NEXT YEAR?', ACT 2002 (%). .................... 44 TABLE 18: STUDENTS REPORTING HAVING RECEIVED AT LEAST PART OF A LESSON IN CLASS ON SMOKING IN THE PREVIOUS
12 MONTHS, BY AGE, ACT 1996, 1999 & 2002 (%). .............................................................................................. 45 TABLE 19: STUDENT PERCEPTIONS OF DANGER ASSOCIATED WITH SUBSTANCE USE, BY SEX, ACT 2002 (%). ............... 61 TABLE 20: STUDENT PERCEPTIONS OF DANGER ASSOCIATED WITH SUBSTANCE USE, BY AGE GROUP, ACT 2002 (%). ... 61 TABLE 21: STUDENTS INDICATING THAT THEY HAD RECEIVED AT LEAST PART OF A LESSON ON ILLICIT SUBSTANCE USE BY
AGE AND SEX, ACT 1999 & 2002 (%). ................................................................................................................... 63 TABLE 22: STUDENTS WHO HAD USED OTHER SUBSTANCES, IN CONJUNCTION WITH CANNABIS, IN THE PREVIOUS YEAR, BY
AGE GROUP AND SEX, ACT 1999 & 2002 (%)......................................................................................................... 65 TABLE 23: STUDENTS WHO HAD USED OTHER SUBSTANCES IN CONJUNCTION WITH AMPHETAMINES, BY SEX, ACT 1999 &
2002 (%). ................................................................................................................................................................ 65 TABLE 24: STUDENTS WHO USED MULTIPLE SUBSTANCES (AT LEAST ONE ILLICIT SUBSTANCE, TOBACCO AND ALCOHOL) IN
THE WEEK PRIOR TO SURVEY, ACT 2002 (%).......................................................................................................... 66 TABLE 25: FACTORS ASSOCIATED WITH STUDENTS WHO REPORTED USING ALCOHOL, TOBACCO AND AT LEAST ONE OTHER
ILLICIT SUBSTANCE IN THE WEEK PRIOR TO SURVEY, ACT 2002. ............................................................................ 67 TABLE 26: FACTORS ASSOCIATED WITH STUDENTS WHO REPORTED NEVER HAVING USED ALCOHOL, TOBACCO OR ILLICIT
DRUGS, ACT 2002. ................................................................................................................................................. 68 TABLE 27: FACTORS ASSOCIATED WITH STUDENTS WHO REPORTED AN ADEQUATE(A) DIET, ACT 2002. ......................... 71 TABLE 28: FACTORS ASSOCIATED WITH STUDENTS WHO REPORTED SUFFICIENT PHYSICAL ACTIVITY(A), ACT 2002. ...... 74 TABLE 29: PREVIOUS AND RECENT ALCOHOL CONSUMPTION BY AGE GROUP AND SEX, ACT 2002 (%). ......................... 83 TABLE 30: PROPORTION OF STUDENTS USING ALCOHOL IN THEIR LIFE, IN THE PREVIOUS MONTH OR IN THE PREVIOUS WEEK
AND THE PROPORTION OF RECENT DRINKERS AT HARMFUL LEVELS AND AVERAGE NUMBER OF DRINKS CONSUMED PER WEEK, ACT 1999 & 2002. ...................................................................................................................................... 84
TABLE 31: PROPORTIONS AND ODDS RATIOS (ORS) FOR STUDENTS, 12 TO 15 AND 16 TO 17 YEARS, WHO WERE RECENT DRINKERS AND HARMFUL DRINKERS AMONG RECENT DRINKERS AND AVERAGE NUMBER OF DRINKS CONSUMED BY RECENT DRINKERS, ACT 1996, 1999 & 2002. ........................................................................................................ 84
TABLE 32: EVER HAD A DRINK, BY AGE, ACT 2002 (%)................................................................................................. 85 TABLE 33: HAD A DRINK IN THE LAST 12 MONTHS, BY AGE AND SEX, ACT 1996, 1999 & 2002 (%). ............................ 85 TABLE 34: HAD A DRINK IN THE LAST FOUR WEEKS, BY AGE AND SEX, ACT 1996, 1999 & 2002 (%). .......................... 85 TABLE 35: STUDENTS WHO HAD CONSUMED ALCOHOL IN THE LAST WEEK BY AGE AND SEX, ACT 1996, 1999 & 2002 (%).
................................................................................................................................................................................ 85 TABLE 36: STUDENTS WHO HAD CONSUMED ALCOHOL IN THE LAST WEEK BY AGE GROUP AND SEX, ACT 1996, 1999 &
2002 (%). ................................................................................................................................................................ 86

6
TABLE 37: PROPORTION OF ALL STUDENTS REPORTING HARMFUL ALCOHOL CONSUMPTION IN THE WEEK PRIOR TO SURVEY, BY AGE AND SEX, ACT 1996, 1999 & 2002. ............................................................................................ 86
TABLE 38: PROPORTION OF RECENT DRINKERS REPORTING HARMFUL ALCOHOL CONSUMPTION, BY AGE GROUP AND SEX, ACT 1999 & 2002. ................................................................................................................................................. 86
TABLE 39: NUMBER OF DRINKS CONSUMED, ON ANY ONE OCCASION, IN THE LAST TWO WEEKS, BY AGE GROUP, ACT 2002 (%). ......................................................................................................................................................................... 86
TABLE 40: NUMBER OF DRINKS CONSUMED IN THE LAST TWO WEEKS, BY FREQUENCY OF OCCASIONS, ACT 2002 (%). 87 TABLE 41: SELF-DESCRIBED DRINKING STATUS, ACT 1996, 1999 & 2002 (%). ............................................................ 87 TABLE 42: SELF-DESCRIBED DRINKING STATUS, BY NUMBER OF DRINKS CONSUMED, AT LEAST ONCE, ON ANY ONE
OCCASION, IN THE LAST TWO WEEKS, ACT 2002 (%). ............................................................................................ 87 TABLE 43: DRINKING STATUS BY SOURCE OF LAST ALCOHOLIC DRINK, ACT 2002 (%).................................................. 88 TABLE 44: PROPORTION OF STUDENTS REPORTING THAT THEY HAD TRIED TO PURCHASE ALCOHOL FROM A RETAILER AT
LEAST ONCE, ACT 1996, 1999 & 2002................................................................................................................... 88 TABLE 45: REPORTED SOURCE OF LAST ALCOHOLIC DRINK, ACT 1996, 1999 & 2002 (%). ........................................... 88 TABLE 46: PROPORTION OF STUDENTS REPORTING WHETHER THEY HAD BEEN REFUSED WHEN TRYING TO PURCHASE
ALCOHOL FROM A RETAILER, ACT 1996, 1999 & 2002. ......................................................................................... 88 TABLE 47: MEAN NUMBER OF DRINKS CONSUMED BY STUDENTS IN THE WEEK PRIOR TO SURVEY, BY SEX, ACT 2002. . 88 TABLE 48: RECENT AND HARMFUL DRINKERS BY PREFERRED ALCOHOLIC DRINKS, ACT 2002 (%)................................ 89 TABLE 49: RECENT, AND HARMFUL DRINKERS BY PLACE WHERE STUDENT DRANK LAST ALCOHOLIC DRINK, ACT 2002
(%). ......................................................................................................................................................................... 90 TABLE 50: RECENT, AND HARMFUL DRINKERS' ATTITUDES TO DRINKING, ACT 2002 (%). ............................................ 91 TABLE 51: STUDENT ATTITUDES TO DRINKING, BY AGE GROUP, ACT 2002 (%)............................................................. 91 TABLE 52: PERCEIVED DANGER IN HAVING FIVE OR MORE DRINKS OF BEER, WINE OR SPIRITS IN A ROW, BY SEX, ACT 2002
(%). ......................................................................................................................................................................... 91 TABLE 53: RECENT AND HARMFUL DRINKERS BY PERCEIVED DANGER IN HAVING FIVE OR MORE DRINKS OF BEER, WINE OR
SPIRITS IN A ROW, ACT 2002 (%). .......................................................................................................................... 92 TABLE 54: RECENT AND HARMFUL DRINKERS HAVING RECEIVED AT LEAST PART OF A LESSON IN CLASS ON ALCOHOL IN
THE PREVIOUS 12 MONTHS, BY AGE, ACT 1996, 1999 & 2002 (%)........................................................................ 92 TABLE 55: EVER SMOKED, BY AGE, ACT 2002 (%). ....................................................................................................... 93 TABLE 56: EVER SMOKED, BY SEX AND AGE GROUP, ACT 1996, 1999 & 2002 (%). ..................................................... 93 TABLE 57: SMOKED IN THE LAST 12 MONTHS, BY AGE AND SEX, ACT 1996, 1999 & 2002 (%)..................................... 93 TABLE 58: SMOKED IN THE LAST 12 MONTHS, ACT 1996, 1999 & 2002 (%)................................................................. 93 TABLE 59: SMOKED IN THE LAST FOUR WEEKS, BY AGE GROUP AND SEX, ACT 1996, 1999 & 2002 (%). ...................... 93 TABLE 60: SMOKED IN THE LAST FOUR WEEKS, ACT 1996, 1999 & 2002 (%). .............................................................. 94 TABLE 61: SMOKED IN THE LAST WEEK, BY AGE GROUP AND SEX, ACT 1996, 1999 & 2002 (%). ................................. 94 TABLE 62: STUDENTS' SELF-DESCRIBED SMOKING STATUS, ACT 1996, 1999 & 2002 (%)............................................. 94 TABLE 63: RECENT, OR CURRENT SMOKERS BY SELF-DESCRIBED SMOKING STATUS, ACT 2002 (%). ............................ 94 TABLE 64: QUANTITY OF TOBACCO USED IN THE LAST WEEK, ACT 1996, 1999 & 2002 (%). ........................................ 94 TABLE 65: AVERAGE (MEAN) NUMBER OF CIGARETTES SMOKED BY RECENT, OR CURRENT SMOKERS, BY SEX, ACT 1996,
1999 & 2002. .......................................................................................................................................................... 94 TABLE 66: AVERAGE (MEAN) AND MEDIAN NUMBER OF CIGARETTES SMOKED IN THE LAST WEEK BY 'HEAVY SMOKERS',
ACT 1996, 1999 & 2002. ....................................................................................................................................... 95 TABLE 67: RECENT, OR CURRENT SMOKERS' PREFERRED PACK SIZE OF CIGARETTES, BY SEX, ACT 2002 (%)................ 95 TABLE 68: 'HEAVY SMOKERS' PREFERRED BRANDS OF CIGARETTES, BY SEX, ACT 2002 (%). ........................................ 95 TABLE 69: RECENT, OR CURRENT SMOKERS' PREFERRED PACK SIZE OF CIGARETTES, BY AGE GROUP, ACT 2002 (%). .. 95 TABLE 70: RECENT OR CURRENT SMOKERS SOURCE OF LAST CIGARETTE, ACT 1996, 1999 & 2002 (%). ...................... 96 TABLE 71: PROPORTION OF RECENT OR CURRENT SMOKERS WHO BOUGHT THEIR LAST CIGARETTE FROM A RETAILER
THEMSELVES, BY AGE GROUP, ACT 1996, 1999 & 2002. ....................................................................................... 96 TABLE 72: 'HEAVY SMOKERS' BY SOURCE OF LAST CIGARETTE, ACT 2002 (%). ............................................................ 96 TABLE 73: RECENT OR CURRENT SMOKERS AND ‘HEAVY SMOKERS’ WHO BOUGHT A SINGLE CIGARETTE OR CIGARETTES
NOT IN A FULL PACKET (FROM ANY SOURCE), IN THE LAST FOUR WEEKS, ACT 1996, 1999 & 2002 (%). ............... 96 TABLE 74: FROM WHOM RECENT OR CURRENT SMOKERS AND ‘HEAVY SMOKERS’ BOUGHT THEIR LAST SINGLE CIGARETTE
OR CIGARETTES THAT WERE NOT IN A FULL PACKET, ACT 2002 (%). ..................................................................... 97 TABLE 75: 'WHEN YOU HAVE TRIED TO BUY CIGARETTES, HAS A RETAILER EVER REFUSED TO SELL CIGARETTES TO YOU?',
ACT 1996, 1999 & 2002 (%). ................................................................................................................................ 97 TABLE 76: 'HAVE YOU EVER BEEN ASKED TO PROVIDE PROOF OF YOUR AGE WHEN BUYING CIGARETTES?', BY AGE GROUP,
ACT 2002 (%). ....................................................................................................................................................... 97 TABLE 77: RECENT, OR CURRENT SMOKERS AND 'HEAVY SMOKERS' ATTITUDES TO CIGARETTES, AGREEING OR STRONGLY
AGREEING, ACT 2002 (%). ..................................................................................................................................... 97
7
TABLE 78: STUDENT ATTITUDES TO CIGARETTES, AGREEING OR STRONGLY AGREEING BY AGE GROUP, ACT 2002 (%).98 TABLE 79: STUDENT PERCEPTIONS OF DANGER ASSOCIATED WITH SMOKING CIGARETTES, BY AGE GROUP AND SEX, ACT
2002 (%). ................................................................................................................................................................ 98 TABLE 80: RECENT, OR CURRENT SMOKERS - 'DO YOU THINK YOU WILL BE SMOKING CIGARETTES THIS TIME NEXT YEAR?',
BY AGE GROUP AND SEX, ACT 2002 (%)................................................................................................................. 99 TABLE 81: ANALGESICS: PROPORTION OF STUDENTS ACCORDING TO RECENCY OF USE BY AGE GROUP AND GENDER, ACT
1999 & 2002 (%). ................................................................................................................................................. 100 TABLE 82: TRANQUILLISERS: PROPORTION OF STUDENTS ACCORDING TO RECENCY OF USE BY AGE GROUP AND GENDER,
ACT 1999 & 2002 (%). ........................................................................................................................................ 100 TABLE 83: CANNABIS: PROPORTION OF STUDENTS ACCORDING TO RECENCY OF USE BY AGE GROUP AND GENDER, ACT
1999 & 2002 (%). ................................................................................................................................................. 100 TABLE 84: INHALANTS: PROPORTION OF STUDENTS ACCORDING TO RECENCY OF USE BY AGE GROUP AND GENDER, ACT
1999 & 2002 (%). ................................................................................................................................................. 101 TABLE 85: HALLUCINOGENS: PROPORTION OF STUDENTS ACCORDING TO RECENCY OF USE BY AGE GROUP AND GENDER,
ACT 1999 & 2002 (%). ........................................................................................................................................ 101 TABLE 86: AMPHETAMINES: PROPORTION OF STUDENTS ACCORDING TO RECENCY OF USE BY AGE GROUP AND GENDER,
ACT 1999 & 2002 (%). ........................................................................................................................................ 101 TABLE 87: STEROIDS: PROPORTION OF STUDENTS ACCORDING TO RECENCY OF USE BY AGE GROUP AND GENDER, ACT
1999 & 2002 (%). ................................................................................................................................................. 102 TABLE 88: OPIATES: PROPORTION OF STUDENTS ACCORDING TO RECENCY OF USE BY AGE GROUP AND GENDER, ACT
1999 & 2002 (%). ................................................................................................................................................. 102 TABLE 89: COCAINE: PROPORTION OF STUDENTS ACCORDING TO RECENCY OF USE BY AGE GROUP AND GENDER, ACT
1999 & 2002 (%). ................................................................................................................................................. 102 TABLE 90: ECSTASY: PROPORTION OF STUDENTS ACCORDING TO RECENCY OF USE BY AGE GROUP AND GENDER, ACT
1999 & 2002 (%). ................................................................................................................................................. 103 TABLE 91: NEEDLE USE: PROPORTION OF STUDENTS ACCORDING TO RECENCY OF USE BY AGE GROUP AND GENDER, ACT
2002 (%). .............................................................................................................................................................. 103 TABLE 92: INFORMATION ON CANNABIS USE BY STUDENTS WHO HAD REPORTED USING CANNABIS IN THE LAST 12
MONTHS, ACT 2002 (%)....................................................................................................................................... 104 TABLE 93: FREQUENCY OF USE OF OTHER SUBSTANCES BY SEX, ACT 2002 (%). ......................................................... 105 TABLE 94: PERCEPTIONS AMONG SECONDARY STUDENTS ON SUBSTANCE USE BY AGE GROUP AND SEX, ACT 1999 & 2002
(%). ....................................................................................................................................................................... 106 TABLE 95: PERCEPTIONS ON CANNABIS USE AMONG STUDENTS WHO HAD EVER/NEVER USED CANNABIS, BY AGE GROUP,
ACT 2002 (%). ..................................................................................................................................................... 106 TABLE 96: PERCEPTIONS ON CANNABIS USE AMONG STUDENTS WHO HAD EVER/NEVER USED CANNABIS, BY SEX, ACT
2002 (%). .............................................................................................................................................................. 106 TABLE 97: PROPORTIONS, ODDS RATIOS (ORS), 95% CONFIDENCE INTERVALS (95%CI) AND P-VALUES WHERE STUDENT
PERCEPTIONS OF DANGER ASSOCIATED WITH OTHER SUBSTANCE USE WERE 'VERY DANGEROUS', ACT 1999 & 2002 (%). ....................................................................................................................................................................... 107
TABLE 98: STUDENTS WHO HAD USED OTHER SUBSTANCES IN CONJUNCTION WITH AMPHETAMINES BY AGE GROUP AND SEX, ACT 1999 & 2002 (%). ................................................................................................................................ 108
TABLE 99: STUDENTS WHO HAD USED OTHER SUBSTANCES IN CONJUNCTION WITH HALLUCINOGENS BY AGE GROUP AND SEX, ACT 1999 & 2002 (%). ................................................................................................................................ 108
TABLE 100: STUDENTS WHO HAD USED OTHER SUBSTANCES IN CONJUNCTION WITH ECSTASY BY AGE GROUP AND SEX, ACT 2002 (%). ..................................................................................................................................................... 108
TABLE 101: DAILY FRUIT, VEGETABLE AND BREAD/CEREAL CONSUMPTION BY SEX, ACT 2002 (%). .......................... 109 TABLE 102: NUMBER OF 30-MINUTE SESSIONS OF MODERATE AND VIGOROUS PHYSICAL ACTIVITY UNDERTAKEN IN THE
PREVIOUS WEEK, BY SEX, ACT 2002 (%).............................................................................................................. 109 TABLE 103: TIME SPENT WATCHING TV/VIDEO ON AN AVERAGE SCHOOL DAY, BY SEX, ACT 2002 (%). .................... 109 TABLE 104: TIME SPENT USING THE INTERNET OR PLAYING COMPUTER GAMES ON AN AVERAGE SCHOOL DAY, BY SEX,
ACT 2002 (%). ..................................................................................................................................................... 109 TABLE 105: STUDENTS REPORTING AT LEAST PART OF A LESSON ON SKIN CANCER IN THE PREVIOUS YEAR, BY AGE GROUP,
ACT 1996, 1999 & 2002 (%). .............................................................................................................................. 109 TABLE 106: EDUCATION ON SUN PROTECTION IN THE PREVIOUS YEAR BY CORRECT RESPONSES TO QUESTIONS ABOUT THE
CAUSES OF SKIN CANCER, ACT 2002 (%). ............................................................................................................ 110 TABLE 107: CORRECT RESPONSES TO TRUE/FALSE QUESTIONS ABOUT THE CAUSES OF SKIN CANCER, ACT 2002 (%).. 110 TABLE 108: TYPE OF HAT MOST OFTEN WORN ON A SUNNY DAY IN SUMMER, ACT 1996, 1999 & 2002 (%)................ 110 TABLE 109: STUDENTS USUALLY/ALWAYS USING SUN PROTECTION MEASURES, BY SEX, ACT 1996, 1999 & 2002 (%).110
8
TABLE 110: STUDENTS USUALLY/ALWAYS USING SUN PROTECTION MEASURES, BY AGE GROUP, ACT 1996, 1999 & 2002 (%). ....................................................................................................................................................................... 110
LIST OF FIGURES FIGURE 1: ‘HAVE YOU EVER HAD AN ALCOHOLIC DRINK’ BY AGE, ACT 2002 (%). ........................................................ 24 FIGURE 2: HAD A DRINK IN THE LAST 12 MONTHS, BY AGE AND SEX, ACT 1996, 1999 & 2002 (%). ............................. 24 FIGURE 3: HAD A DRINK IN THE LAST FOUR WEEKS, BY AGE AND SEX, ACT 1996, 1999 & 2002 (%). ........................... 25 FIGURE 4: CONSUMPTION OF ALCOHOL IN THE PAST WEEK BY SEX AND AGE, ACT 1996, 1999 & 2002 (%). ................. 26 FIGURE 5: STUDENTS WHO HAD CONSUMED ALCOHOL IN THE LAST WEEK BY AGE GROUP AND SEX, ACT 1996, 1999 &
2002 (%). ................................................................................................................................................................ 26 FIGURE 6: PROPORTION OF ALL STUDENTS REPORTING HARMFUL ALCOHOL CONSUMPTION IN THE WEEK PRIOR TO SURVEY,
BY AGE AND SEX, ACT 1996, 1999 & 2002. ........................................................................................................... 27 FIGURE 7: SELF-DESCRIBED DRINKING STATUS, ACT 1996, 1999 & 2002 (%). ............................................................. 28 FIGURE 8: SELF-DESCRIBED DRINKING STATUS, BY NUMBER OF DRINKS CONSUMED, AT LEAST ONCE, ON ANY ONE
OCCASION, IN THE LAST TWO WEEKS, ACT 2002 (%). ............................................................................................ 29 FIGURE 9: PLACES WHERE STUDENTS REPORTED CONSUMING THEIR LAST ALCOHOLIC DRINK, 12-15 YEARS OF AGE, ACT
2002 (%). ................................................................................................................................................................ 32 FIGURE 10: PLACES WHERE STUDENTS REPORTED CONSUMING THEIR LAST ALCOHOLIC DRINK, 16-17 YEARS OF AGE, ACT
2002 (%). ................................................................................................................................................................ 33 FIGURE 11: PROPORTION OF STUDENTS WHO HAD EVER SMOKED, BY AGE, ACT 2002. .................................................. 37 FIGURE 12: PROPORTION OF STUDENTS WHO HAD EVER SMOKED, BY SEX AND AGE GROUP, ACT 1996, 1999 & 2002. . 37 FIGURE 13: PROPORTION OF STUDENTS WHO HAD SMOKED IN THE LAST 12 MONTHS, BY AGE AND SEX, ACT 1996, 1999 &
2002. ....................................................................................................................................................................... 38 FIGURE 14: PROPORTION OF STUDENTS WHO HAD SMOKED IN THE LAST FOUR WEEKS, BY AGE GROUP AND SEX, ACT 1996,
1999 & 2002. .......................................................................................................................................................... 38 FIGURE 15: PROPORTION OF STUDENTS WHO HAD SMOKED IN THE LAST WEEK, BY AGE GROUP AND SEX, ACT 1996, 1999
& 2002. ................................................................................................................................................................... 39 FIGURE 16: RECENT, OR CURRENT SMOKER'S SELF-DESCRIBED SMOKING STATUS, ACT 2002 (%)................................. 39 FIGURE 17: PROPORTION OF RECENT OR CURRENT SMOKERS WHO BOUGHT THEIR LAST CIGARETTE FROM A RETAILER
THEMSELVES, BY AGE GROUP, ACT 1996, 1999 & 2002 (%) ................................................................................. 40 FIGURE 18: PLACES STUDENTS USUALLY SMOKE, ACT 2002 (%)................................................................................... 43 FIGURE 19: STUDENTS WHO HAD USED ANALGESICS AT LEAST ONCE IN THEIR LIVES BY AGE GROUP AND SEX, ACT 1999
& 2002 (%). ............................................................................................................................................................ 46 FIGURE 20: STUDENTS WHO HAD USED ANALGESICS IN THE LAST WEEK BY AGE GROUP AND SEX, ACT 1999 & 2002 (%).
................................................................................................................................................................................ 47 FIGURE 21: STUDENTS WHO HAD USED CANNABIS AT LEAST ONCE IN THEIR LIVES BY AGE GROUP AND SEX, ACT 1999 &
2002 (%). ................................................................................................................................................................ 48 FIGURE 22: STUDENTS WHO HAD USED CANNABIS IN THE LAST FOUR WEEKS BY AGE GROUP AND SEX, ACT 1999 & 2002
(%). ......................................................................................................................................................................... 49 FIGURE 23: STUDENTS WHO HAD USED INHALANTS AT LEAST ONCE IN THEIR LIVES BY AGE GROUP AND SEX, ACT 1999 &
2002 (%). ................................................................................................................................................................ 50 FIGURE 24: STUDENTS WHO HAD USED INHALANTS IN THE LAST FOUR WEEKS BY AGE GROUP, ACT 1999 & 2002 (%). 51 FIGURE 25: STUDENTS WHO HAD USED TRANQUILLISERS AT LEAST ONCE IN THEIR LIVES BY AGE GROUP AND SEX, ACT
1999 & 2002 (%). ................................................................................................................................................... 52 FIGURE 26: STUDENTS WHO HAD USED HALLUCINOGENS AT LEAST ONCE IN THEIR LIVES BY AGE GROUP, ACT 1999 &
2002 (%). ................................................................................................................................................................ 53 FIGURE 27: STUDENTS WHO HAD USED AMPHETAMINES AT LEAST ONCE IN THEIR LIVES BY AGE GROUP, ACT 1999 &
2002 (%).................................................................................................................................................................. 54 FIGURE 28: STUDENTS WHO HAD USED NON-PRESCRIBED STEROIDS AT LEAST ONCE IN THEIR LIVES BY SEX, ACT 1999 &
2002 (%). ................................................................................................................................................................ 55 FIGURE 29: STUDENTS WHO HAD USED OPIATES AT LEAST ONCE IN THEIR LIVES BY AGE GROUP, ACT 1999 & 2002 (%).56 FIGURE 30: STUDENTS WHO HAD USED COCAINE AT LEAST ONCE IN THEIR LIVES BY AGE GROUP, ACT 1999 & 2002 (%).
................................................................................................................................................................................ 57 FIGURE 31: STUDENTS WHO HAD USED ECSTASY AT LEAST ONCE IN THEIR LIVES BY AGE GROUP, ACT 1999 & 2002 (%).
................................................................................................................................................................................ 58 FIGURE 32: LIFETIME USE OF AT LEAST ONE ILLICIT SUBSTANCE, BY AGE GROUP AND SEX, ACT 1999 & 2002 (%). ..... 59 FIGURE 33: DAILY FRUIT, VEGETABLE AND BREAD AND CEREAL CONSUMPTION, ACT 2002 (%)................................... 71

9
FIGURE 34: NUMBER OF 30-MINUTE SESSIONS OF MODERATE AND VIGOROUS PHYSICAL ACTIVITY UNDERTAKEN IN THE PREVIOUS WEEK, BY SEX, ACT 2002 (%)................................................................................................................ 74
FIGURE 35: TIME SPENT WATCHING TV/VIDEO ON AN AVERAGE SCHOOL DAY, BY SEX, ACT 2002 (%)......................... 75 FIGURE 36: TIME SPENT USING THE INTERNET OR PLAYING COMPUTER GAMES ON AN AVERAGE SCHOOL DAY, BY SEX,
ACT 2002 (%). ....................................................................................................................................................... 76 FIGURE 37: CORRECT RESPONSES TO TRUE/FALSE QUESTIONS ABOUT THE CAUSES OF SKIN CANCER, ACT 2002 (%). ... 78 FIGURE 38: STUDENTS REPORTING AT LEAST PART OF A LESSON ON SKIN CANCER IN THE PREVIOUS YEAR, BY AGE GROUP,
ACT 1996, 1999 & 2002 (%). ................................................................................................................................ 78 FIGURE 39: STUDENTS REPORTING LAST SUMMER AS LAST TIME SEVERELY SUNBURNT, BY AGE GROUP, ACT 1999 & 2002
(%). ......................................................................................................................................................................... 79 FIGURE 40: STUDENTS REPORTING 'USUALLY' OR 'ALWAYS' USING SUN PROTECTION MEASURES, ACT 1996, 1999 & 2002
(%). ......................................................................................................................................................................... 79 FIGURE 41: TYPE OF HAT MOST OFTEN WORN ON A SUNNY DAY IN SUMMER, ACT 1996, 1999 & 2002 (%). ................. 80
10
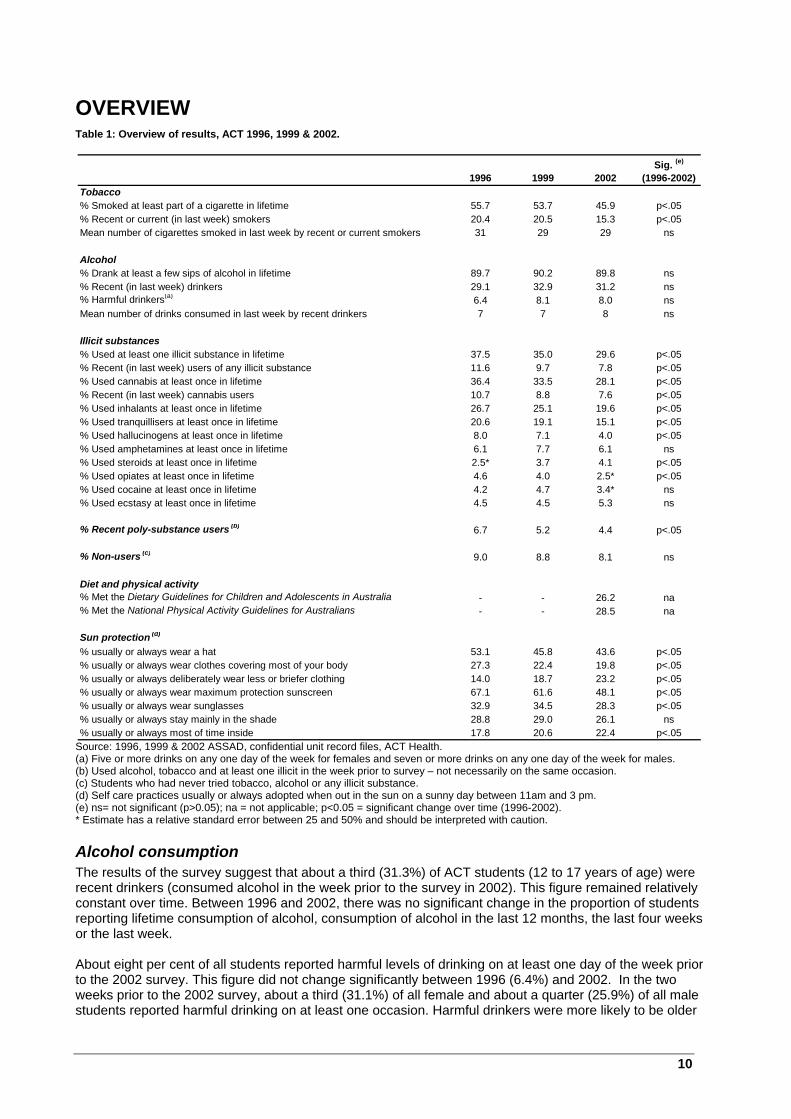
OVERVIEW Table 1: Overview of results, ACT 1996, 1999 & 2002.
Source: 1996, 1999 & 2002 ASSAD, confidential unit record files, ACT Health. (a) Five or more drinks on any one day of the week for females and seven or more drinks on any one day of the week for males. (b) Used alcohol, tobacco and at least one illicit in the week prior to survey – not necessarily on the same occasion. (c) Students who had never tried tobacco, alcohol or any illicit substance. (d) Self care practices usually or always adopted when out in the sun on a sunny day between 11am and 3 pm. (e) ns= not significant (p>0.05); na = not applicable; p<0.05 = significant change over time (1996-2002). * Estimate has a relative standard error between 25 and 50% and should be interpreted with caution.
Alcohol consumption The results of the survey suggest that about a third (31.3%) of ACT students (12 to 17 years of age) were recent drinkers (consumed alcohol in the week prior to the survey in 2002). This figure remained relatively constant over time. Between 1996 and 2002, there was no significant change in the proportion of students reporting lifetime consumption of alcohol, consumption of alcohol in the last 12 months, the last four weeks or the last week. About eight per cent of all students reported harmful levels of drinking on at least one day of the week prior to the 2002 survey. This figure did not change significantly between 1996 (6.4%) and 2002. In the two weeks prior to the 2002 survey, about a third (31.1%) of all female and about a quarter (25.9%) of all male students reported harmful drinking on at least one occasion. Harmful drinkers were more likely to be older
1996 1999 2002Sig. (e)
(1996-2002)Tobacco% Smoked at least part of a cigarette in lifetime 55.7 53.7 45.9 p<.05% Recent or current (in last week) smokers 20.4 20.5 15.3 p<.05Mean number of cigarettes smoked in last week by recent or current smokers 31 29 29 ns
Alcohol% Drank at least a few sips of alcohol in lifetime 89.7 90.2 89.8 ns% Recent (in last week) drinkers 29.1 32.9 31.2 ns% Harmful drinkers(a) 6.4 8.1 8.0 nsMean number of drinks consumed in last week by recent drinkers 7 7 8 ns
Illicit substances% Used at least one illicit substance in lifetime 37.5 35.0 29.6 p<.05% Recent (in last week) users of any illicit substance 11.6 9.7 7.8 p<.05% Used cannabis at least once in lifetime 36.4 33.5 28.1 p<.05% Recent (in last week) cannabis users 10.7 8.8 7.6 p<.05% Used inhalants at least once in lifetime 26.7 25.1 19.6 p<.05% Used tranquillisers at least once in lifetime 20.6 19.1 15.1 p<.05% Used hallucinogens at least once in lifetime 8.0 7.1 4.0 p<.05% Used amphetamines at least once in lifetime 6.1 7.7 6.1 ns% Used steroids at least once in lifetime 2.5* 3.7 4.1 p<.05% Used opiates at least once in lifetime 4.6 4.0 2.5* p<.05% Used cocaine at least once in lifetime 4.2 4.7 3.4* ns% Used ecstasy at least once in lifetime 4.5 4.5 5.3 ns
% Recent poly-substance users (b) 6.7 5.2 4.4 p<.05
% Non-users (c) 9.0 8.8 8.1 ns
Diet and physical activity% Met the Dietary Guidelines for Children and Adolescents in Australia - - 26.2 na% Met the National Physical Activity Guidelines for Australians - - 28.5 na
Sun protection (d)
% usually or always wear a hat 53.1 45.8 43.6 p<.05% usually or always wear clothes covering most of your body 27.3 22.4 19.8 p<.05% usually or always deliberately wear less or briefer clothing 14.0 18.7 23.2 p<.05% usually or always wear maximum protection sunscreen 67.1 61.6 48.1 p<.05% usually or always wear sunglasses 32.9 34.5 28.3 p<.05% usually or always stay mainly in the shade 28.8 29.0 26.1 ns% usually or always most of time inside 17.8 20.6 22.4 p<.05

11
students; they were more likely to describe themselves as ‘heavy’ drinkers or ‘party’ drinkers than other students; they consumed greater quantities of alcohol in the week prior to survey than other drinkers; were more likely to report a preference for beverages with a high alcohol content (spirits and pre-mixed spirits); and, they were more likely to have purchased their last drink from a retailer than other drinkers. In 2002, very few students who reported consuming alcohol at least once in their lifetime also reported purchasing their last drink from a retailer themselves (5.6%). Among those students who did purchase their last drink from a retailer, most reported having purchased their last drink from a supermarket or liquor store. There was a significant decrease in the proportion of students purchasing their last drink from a retailer, between 1996 (8.9%) and 2002.The majority of students who did not purchase their last drink from a retailer in 2002 reported being given their last drink by parents (37.6%) or friends (21.8%). Among students who reported having tried to purchase alcohol from a retailer at least once in their lifetime, about a third (32.4%) reported never being refused alcohol by a retailer and 40 per cent reported never having been asked for proof of age. There was no significant change in the proportion of students reporting that they had never been refused alcohol when trying to purchase from a retailer, between 1996 (32.4%) and 2002. Students reported consuming their last alcoholic drink in a variety of places. The most popular places for students to report consuming their last drink were at home or at a party, celebration or function. Younger students (12 to 15 years) were more likely to report consuming their last drink at home whereas older students (16 to 17 years) were more likely to report consuming their last drink at a party, celebration or function. Both recent and harmful drinkers were more likely to report consuming their last drink at a party, celebration or function. In terms of alcohol preference, the majority of males expressed a preference for beer and spirits, while females expressed a preference for pre-mixed spirits and spirits in 2002. Recent drinkers and harmful drinkers expressed a preference for pre-mixed spirits and spirits. Finally, males, older students (16 to 17 years) and harmful drinkers were more likely to express relaxed attitudes towards alcohol or play down the dangers associated with high levels of alcohol consumption, than their counterparts in 2002.
Tobacco use The results of the survey suggest that about 15.3 per cent of ACT students (12 to 17 years) were recent or current smokers (used tobacco in the week prior to the 2002 survey). This figure decreased significantly between 1996 (20.4%) and 2002. Between 1996 and 2002, there was also a significant decrease in the proportion of students reporting tobacco use for other periods (lifetime use of tobacco, use of tobacco in the last 12 months and the last four weeks). In 2002, older students (16 to 17 years) (17.8%) were more likely to be recent, or current smokers than younger students (12 to 15 years) (14.1%), although the proportion of older students who were recent, or current smokers decreased significantly between 1996 (28.6%) and 2002. Similarly, females (16.0%) were more likely to be recent, or current smokers than males (14.6%), although the proportion of females who were recent, or current smokers also decreased significantly between 1996 (24.0%) and 2002. Almost a quarter (23.7%) of recent, or current smokers in 2002 described themselves as ‘heavy smokers’. Although the category ‘heavy smoker’ was self-described, or based on student perceptions of their own smoking status, this group of smokers had a different profile to other smokers. ‘Heavy smokers’ were more likely to smoke more cigarettes, more likely to have tried purchasing cigarettes from a retailer and were more likely to indicate they would likely be smoking in 12 months time, than other recent or current smokers. The proportion of recent, or current smokers who purchased their last cigarette from a retailer themselves decreased significantly between 1996 (25.8%) and 2002 (19.1%). At the same time, there was a significant increase in the proportion of recent, or current smokers who got someone else to purchase their last cigarette for them, up from 15.7 per cent in 1996 to 21 per cent in 2002.
12
Among those who did not purchase their last cigarette from a retailer themselves and did not ask another person to purchase for them, the majority obtained their last cigarette from friends (36.5%) or were given their last cigarette by parents or siblings (13.4%). There was also a significant increase in the proportion of recent or current smokers who reported purchasing (from any source, including retailers, friends, relatives etc) a single cigarette or cigarettes that were not in a packet, in the four weeks prior to survey, up from 21.3 per cent in 1996 to 40.4 per cent in 2002. About three quarters (73.5%) bought singles from friends and relatives, very few reported purchasing singles from a retailer. More than a third (37.8%) of students who reported having tried to purchase cigarettes from a retailer at least once in their lifetime also reported never being refused cigarettes by a retailer. There was no significant change in the proportion of students reporting that they had never been refused cigarettes when trying to purchase from a retailer between 1996 (35.7%) and 2002. More than a third (36.7%) of all students who had ever tried to purchase cigarettes from a retailer reported never having been asked for proof of age in 2002. Students reported smoking in a variety of places in 2002. The most popular places for students to report smoking were dance venues, dance parties and nightclubs (14.6%), parties (13.8%), at a friend’s home (10.8%), at home (9.9%), and about one in ten (10.8%) reported that they usually smoked on school grounds during school hours. Males, younger students (12 to 15 years) and students who described themselves as ‘heavy smokers’ were more likely than their counterparts to regard smokers as popular or mature and play down the dangers associated with smoking and exposure to environmental tobacco smoke. About one in ten (9.5%) students reported that they were likely to be smoking in 12 months. Among recent, or current smokers, almost half (46.4%) reported that they were likely to be smoking in 12 months and among students who described themselves as ‘heavy smokers’, the majority (83.7%) reported that they were likely to be smoking in 12 months. Finally, there was a significant increase in the proportion of students who recalled having received at least part of a lesson on smoking in the previous year, between 1996 (77.4%) and 2002 (80.4%).
Other (including illicit) substance use In 2002, less than a third (29.6%) of students in the ACT reported the use of an illicit substance in their lifetime. Over all, the reported use of illicit substances declined between 1996, 1999 and 2002. The reported lifetime use of cannabis, inhalants, tranquillisers, hallucinogens and opiates all decreased between 1996 and 2002 and for the period 1999 to 2002. There was no significant change over time in reported lifetime use of ecstasy or amphetamines, but reported use of cocaine decreased significantly between 1999 and 2002. Although the reported illicit lifetime use of steroids decreased significantly between 1996 and 2002, there was no significant change in reported use between 1999 and 2002. In general, older (16 to 17 years) students were more likely to report having tried an illicit substance than younger (12 to 15 years) students (a notable exception was the use of inhalants, where younger students were more likely to report use than older students). Between the sexes, males were more likely to report the use of cannabis and steroids without a prescription than females. The most commonly used illicit substance reported in 2002 was cannabis/marijuana, with more than a quarter (28.1%) of students reporting use of the substance in their lifetime and 7.6 per cent reporting use in the week prior to the survey. Although about a third (31.9%) of cannabis users indicated having tried the drug only once or twice in their lifetime, 42.2 per cent of students who had ever used cannabis indicated that they had used the substance at least 40 times in their lifetime. Among students who reported using cannabis in the last 12 months, 33.9 per cent reported having used cannabis last at a friend’s home, 22.7 per cent reported having used cannabis last at a party and 13.8 per cent reported having used cannabis last at the park. About two thirds (65.4%) of students who reported using cannabis in the last 12 months indicated a preference for smoking cannabis from a bong or pipe.
13
The second most commonly used illicit substance was inhalants (including deliberate sniffing of spray cans, glue, paint, petrol or thinners). One in five (19.6%) students reported deliberately sniffing inhalants at least once in their lifetime and 6.2 per cent in the week prior to the 2002 survey. Although about half (47.3%) of the students who had ever used inhalants reported use only once or twice in their lifetime, a quarter (25.2%) reported use ten times or more in their lifetime. The use of tranquillisers for non-medical purposes, which included sleeping tablets and sedatives such as Valium, Serapax and Rohypnol, were the third most commonly used group of substances. In 2002, 15.1 per cent of students reported having used tranquillisers for non-medical purposes, at least once in their lifetime and 4.3 per cent reported use in the four weeks before the survey. About 45 per cent of students who had ever used tranquillisers for non-medical purposes reported using tranquillisers only once or twice. The results for other frequency categories (used tranquillisers 10 times or more; used tranquillisers 40 times or more) were not reliable and were therefore not reported. In 2002, 6.1 per cent of students reported having used amphetamines (speed) at least once in their lifetime and 5.3 per cent reported having used ecstasy at least once in their lifetime. The reported levels of use of other illicit substances were very low, with less than five per cent of students reporting the use of substances such as cocaine (3.4%), opiates (2.5%), steroids (4.1%) and hallucinogens (4.0%) at least once in their lifetime. About four per cent of students reported having used needles for injecting illicit drugs at least once in their lifetime. About 40 per cent of needle users indicated that they had shared a needle at least once with someone else and about half indicated that they had obtained equipment from a needle exchange. More than 60 per cent of students perceived the use of most illicit substances as ‘very dangerous’. Perceptions of the danger associated with illicit substance use varied according to student age and sex. Females and older students (16 to 17 years) were more likely than males and younger students (12 to 15 years) to perceive the use of most illicit substances as ‘very dangerous’. However, there were a few exceptions – younger students were more likely than older students to perceive regular use of cannabis as ‘very dangerous’. Students who had never used cannabis were more likely to perceive cannabis use as ‘very dangerous’ compared to students who had used cannabis at least once in their lifetime. Between 1999 and 2002, there were increases in the proportion of students perceiving the use of a number of illicit substances as ‘very dangerous’. In most instances, these changes in perception were accompanied by decreases in reported levels of substance use by students. For instance, lifetime use of cannabis decreased significantly between 1999 (33.5%) and 2002 (28.1%). At the same time, there was a significant increase in the proportion of students who perceived ‘smoking cannabis regularly’ as ‘very dangerous’ (1999, 57.3%; 2002, 64.7%). In 2002, about three quarters (76.2%) of secondary students recalled receiving at least part of a lesson on the use of illicit substances in the previous year. This figure did not vary significantly from 1999 (73.9%). There was no significant difference between the proportion of students who had/had not used an illicit substance, cannabis, or inhalants in the last 12 months and the proportion of students who recalled receiving at least part of a lesson on illicit substance use in the last 12 months.
Poly-substance use In 2002, students who reported using cannabis, amphetamines, hallucinogens and ecstasy in the previous year were asked to report any other substances they may have used on the same occasion that they used cannabis, amphetamines, hallucinogens or ecstasy. As more than one other substance may have been used on any one occasion, or different substances may have been used on different occasions, students were able to indicate the use of multiple substances. Alcohol was the most popular substance to have been used in conjunction with cannabis, amphetamines, hallucinogens or ecstasy in the previous year. At least 60 per cent of students who had used any one of these illicit substances in the previous year reported using alcohol, on at least one occasion, at the same time as using cannabis, amphetamines, hallucinogens or ecstasy.
14
Tobacco was popular, with 40 per cent of ecstasy users, about half of all cannabis users (47.7%), and more than half of amphetamine users (59.5%) and hallucinogen users (54.4%) reporting the use of tobacco, at least once in the previous year, in conjunction either ecstasy, cannabis, amphetamines or hallucinogens. Cannabis was also commonly used in conjunction with other substances. More than half (56.4%) of the students who reported amphetamine use in the previous year reported using cannabis on at least one occasion in conjunction with amphetamines. About a third of ecstasy users (31%) and hallucinogen users (35.3%) reported using cannabis on at least one occasion when they used either ecstasy or hallucinogens in the previous year. There were too few students who reported the use of other substances (eg tranquillisers, inhalants etc) in conjunction with ecstasy, cannabis, amphetamines or hallucinogens in the previous year to provide reliable estimates. In 2002, 4.4 per cent of all students reported the use of tobacco, alcohol and at least one other illicit substance, on at least one occasion (not necessarily all at once on a single occasion) in the week prior to survey. More than a quarter (27.3%) of recent, or current smokers (smoked in the week prior to survey) were recent drinkers (consumed alcohol in the week prior to survey) and more than a third (35.2%) had used an illicit substance in the week before the 2002 survey. Among recent drinkers, more than third (35.0%) were also recent, or current smokers and one in five (20.3%) had used an illicit substance in the week before survey. Among students who reported the use of at least one illicit substance in the week before survey, 70 per cent were recent, or current smokers and 84.8 per cent were recent drinkers. Dietary inadequacies, large amounts of time (four hours or more on an average school day) spent watching TV or video and ‘below average’ self-described school performance were the major factors associated with students who reported the use of alcohol, tobacco and at least one illicit substance in the week prior to survey.
Non-users In 2002, 8.1 per cent of students reported that they had not used tobacco, alcohol or an illicit substance in their lifetime. Being a younger student (12 to 15 years), meeting dietary guidelines and ‘average’ or ‘above average’ self-described school performance levels were the major factors associated with non-users.
Other health-related behaviours In 2002, for the first time, the ASSAD survey questionnaire included a series of questions on nutrition, physical activity and leisure-time activities. There were also a number of new questions about sun protection and changes to some of the sun protection questions that had been included in previous surveys. These changes and new introductions to the survey content meant that many of the 2002 questions were not comparable with questions from previous survey years (1996 and 1999). Nutrition The results on dietary behaviours, or nutrition, should be interpreted with caution. Estimates that were derived from the survey data and are compared in the report to national guidelines are conservative. The guidelines on nutrition changed in 2003 and the ASSAD questionnaire administered in 2002 did not allow for direct comparison to the new guidelines. In addition, the nutrition questions that were asked in the survey required students to visualise ‘serves’ of various food types and pilot testing of these types of survey questions suggest they do not always yield valid results. 1,2 Limitations aside, the results of the questions about nutrition suggest that a substantial proportion of secondary students in the ACT had an inadequate intake of fruit, vegetables and breads and cereals in 2002. About three quarters (73.8%) of the students who were surveyed in 2002 did not consume enough of
1 Barkess JL, Sherriff JL. 2003. Relative validity of two brief sets of questions to assess vegetable intake behaviours. Asia Pac J Clin Nutr.12 Suppl:S23. 2 Australian Bureau of Statistics. 2001. Measuring Dietary Habits in the 2001 National Health Survey, Australia. Occasional Paper: 4814.0.55.001. Canberra, Australian Bureau of Statistics.

15
at least one of the food types included in the survey to meet the 2003 Dietary Guidelines for Children and Adolescents in Australia. About a third (34%) of all students did not consume sufficient vegetables, about a third (32.4%) did not consume sufficient fruit and more than half (58.7%) did not consume sufficient breads and cereals to meet the minimum daily requirements outlined in the national guidelines. Meeting the National Physical Activity Guidelines for Australians and describing school performance as ‘average’ or ‘above average’ were the major factors found to be associated with an adequate diet (consumption of sufficient fruit, vegetables and breads and/or cereals to meet national guidelines). Physical and leisure-time activity Levels of physical activity reported by students in 2002 were compared to the recommendations for children and young people less than 18 years of age in the national guidelines. Although only 15.6 per cent of ACT secondary students reported undertaking at least 30 minutes of moderate activity at least six times in the week prior to the 2002 survey, about half (52.9%) reported undertaking at least three 30 minute sessions of vigorous activity. In 2002, 28.5 per cent of students reported undertaking sufficient moderate and vigorous activity to meet the National Physical Activity Guidelines for Australians. Having an adequate diet (adequate consumption of each of the three food types included in the survey to meet national guidelines), being male and watching less than four hours of TV or video a day were the major factors found to be associated with meeting the National Physical Activity Guidelines for Australians. The survey also included questions about leisure-time activity. Two of the questions focused on the amount of time students spent watching TV or video and the amount of time they spent on the Internet or playing computer games on an average school day. An arbitrary threshold of four hours was used in the analysis. Students were pooled into two groups for comparison with each question – those who spent four hours or more watching TV or video vs. those who spent less than four hours; and, those who spent four hours or more using the Internet or playing computer games vs. those who spent less than four hours. About one in five (18.5%) students reported spending four hours or more watching TV or video on an average school day. Students were more likely to report spending four hours or more watching TV or video if they were male, if they reported using the Internet or playing computer games for four hours or more, if their self-described school performance was poor, or if they reported inadequate consumption of one or more of the food types included in the survey. Approximately one in ten (11.3%) students reported spending four hours or more on the Internet or playing computer games on an average school day. Students were more likely to report spending four hours or more on the internet or playing computer games if they were male, if they reported spending four hours or more watching TV or video, or if their self-described school performance was poor. Sun protection The results of the 2002 survey suggest that although the majority of students had a reasonable level of knowledge about the need for sun protection and had had at least part of a lesson on sun protection or skin cancer in the previous year, they were less likely to engage in self care practices than students in 1996 and 1999. Although, almost two-thirds (63.7%) of students surveyed in 2002 responded correctly to questions about the causes of skin cancer and almost two-thirds (64.5%) recalled having had at least part of a lesson on sun protection or skin cancer in the previous year, the proportion of students reporting that they ‘usually’ or ‘always’ wore a hat, wore clothing to cover up, wore a maximum protection sunscreen, wore sunglasses, or mostly stayed inside, decreased significantly between 1996 and 2002. The proportion of students reporting that they ‘usually’ or ‘always’ wore briefer clothing to get sun on their skin increased significantly between 1996 and 2002. Some self-care practices appeared to be quite unpopular with students. Only one in five students reported ‘usually’ or ‘always’ wearing clothes to cover up when outdoors, or reported mostly staying inside between 11am and 3pm in summer. Finally, students who were unlikely to wear a hat outdoors or to use a maximum protection sunscreen were unlikely to use any other sun protective measures. Most of these students indicated a preference for a
16
suntan. They also indicated that they had had at least part of a sun protection lesson in the previous year and more than half had a reasonable level of knowledge about the causes of skin cancer.
Introduction In 2002, ACT Health and the Cancer Council ACT conducted the ACT Secondary Student Alcohol and Drug (ASSAD) survey. The survey was administered in ACT secondary schools by external research staff using a self-completion questionnaire. The main aim of the survey was to obtain information about substance use among secondary school students in the ACT. The 2002 survey was also designed to collect information about sun protective behaviours, nutrition, physical and leisure-time activities among secondary students. Previous ASSAD surveys were conducted in the ACT in 1996 and 1999. Many of the questions about substance use included in these earlier surveys were similar to questions in the 2002 survey, allowing for analysis of trends over time. Accordingly, substance use results from 1996 and 1999 have been discussed, where relevant, throughout the report. However, the 1996 and 1999 surveys did not include questions about nutrition, physical activity or leisure-time activities and many of the earlier questions about sun protection differ from those included in the 2002 survey. Therefore, the analysis of these health-related behaviours in the report is largely specific to the 2002 survey. As with previous surveys, the target population for the 2002 survey was students in Years 7 to 12, between 12 to 17 years of age, enrolled in government, Catholic and independent schools in the ACT. Students completed a total of 1,675 questionnaires. The 2002 data were weighted by age, sex and school type to ensure the survey sample represented ACT school enrolments for Semester 2, 2002. Probability levels below 0.05 are reported as significant throughout the report and p-values have been provided where relevant. The report includes analysis of tobacco, alcohol, other (including illicit) substance and poly-substance use by students in the ACT. Student access, attitudes, perceptions of danger and other behaviours associated with substance use are included in the analysis. There is an analysis of daily fruit, vegetable and bread and cereal consumption in the ACT. The reported number of food serves consumed daily by students are compared to the number of food serves recommended in the Dietary Guidelines for Children and Adolescents in Australia. Similarly, reported levels of physical activity among students in the ACT are compared to the recommended levels of activity for children and young people, under the age of 18, in the current National Physical Activity Guidelines for Australians. Leisure-time activities are included in the report. There is an analysis of the reported time spent by students watching TV or video and reported time spent using the Internet or playing computer games, on an average school day. The report also includes an analysis of the sun protection questions included in the 2002 survey. Information is presented on self-care practices, student knowledge about the causes of skin cancer and information about student education on skin cancer and sun protection. Finally, there are a series of tables included in the appendices that complement the analysis in the main body of the report. A copy of the 2002 survey questionnaire has also been included in the appendices. Note that the analytical detail in the report has been limited by the size of the sample that was taken and ensuing problems with the (statistical) reliability of results. For instance, although it would have been possible to present age breakdowns of the data throughout the report by single year of age, as this information was collected in the survey, the report presents data by single year of age (12 years, 13 years….17 years) or by age group (12-15 years and 16-17 years), according to the level of reliability of results. Much of the data has had to be aggregated, so the results for the ACT are not always directly comparable with results for other States and Territories (although we have produced comparable ACT figures where ever possible).

17
In addition, there were 50 Aboriginal and Torres Strait Islander students who completed the survey questionnaire in 2002, comprising about three per cent of the 1,675 students surveyed. Unfortunately, the sample was too small to reliably estimate levels of substance use and other health-related behaviours among Aboriginal and Torres Strait Islander students in the ACT.
Methods As part of a national survey effort, the 2002 ACT Secondary Students Alcohol and Drug (ASSAD) survey was conducted in ACT secondary schools between September and November 2002. The self-completion survey questionnaire was administered to students in schools by an external research team. Teachers were not present during administration of the survey, unless otherwise requested by the school, and schools were generally discouraged from providing students with pre-knowledge of the survey topic.
Sample selection The target population for the survey included all students between 12 to 17 years of age, enrolled in year levels 7 to 12 in government, Catholic and independent schools in the ACT (Table 2). Table 2: ACT secondary school enrolments(a),(b) (12 to 17 years) by school type and sex, 2002.
Source: Australian Bureau of Statistics. 2003. 2002 Schools Australia. Cat. No. 4221.0. Canberra, Australian Bureau of Statistics; Australian Bureau of Statistics. 2003. Companion data tables. (a) Full-time students only. (b) There were 28 secondary schools and 12 primary/secondary combined schools in the ACT in 2002. A stratified two-stage sample design was used. Schools were randomly selected at the first stage of sampling and students were to be selected from the school roll, within schools, at the second stage of sampling. The schools were stratified by school type (the three education sectors - government, Catholic and independent) and randomly selected from within each sector. Two school samples were drawn from (a) high schools (Years 7 to 10); and (b), colleges (Years 11 and 12) in the ACT. There were 16 high schools and 6 colleges included in the sample. Fourteen of these schools were government schools, five were catholic schools and three were independent schools. Eighty-six per cent of the ACT schools originally selected agreed to participate in the 2002 survey. The intention at the second stage of sampling was to randomly select students from the school roll within each school. However, implementation of random selection proved problematic in the field. Some of the high schools required students to return consent forms before participating in the survey, and at other schools entire classes of students were selected for survey, rather than individual students selected at random from the school roll. Random selection of students from the school roll at colleges in the ACT proved impractical because of the way in which the college system operates in the ACT. Instead, field interviewers visited colleges at a designated time, for a period of an hour, and surveyed students who were on campus at the time. As a consequence, the methodology used in the ACT for the second stage of sampling differed somewhat from the protocol followed by other jurisdictions in Australia. The selection process may have implications for the representativeness of the ACT sample, and should be considered when comparing results with other jurisdictions.
Questionnaire The 2002 questionnaire included questions about behaviours, access, perceptions of danger and attitudes to tobacco, alcohol and illicit drugs. The bulk of these questions were identical to those from previous surveys undertaken in 1996 and 1999.
Males Females PersonsGovernment secondary school enrolments (12-17 years) 8,233 7,891 16,124Catholic secondary school enrolments (12-17 years) 4,262 4,128 8,390Independent secondary school enrolments (12-17 years) 1,816 1,762 3,578Total ACT secondary school enrolments (12-17 years) 14,311 13,781 28,092
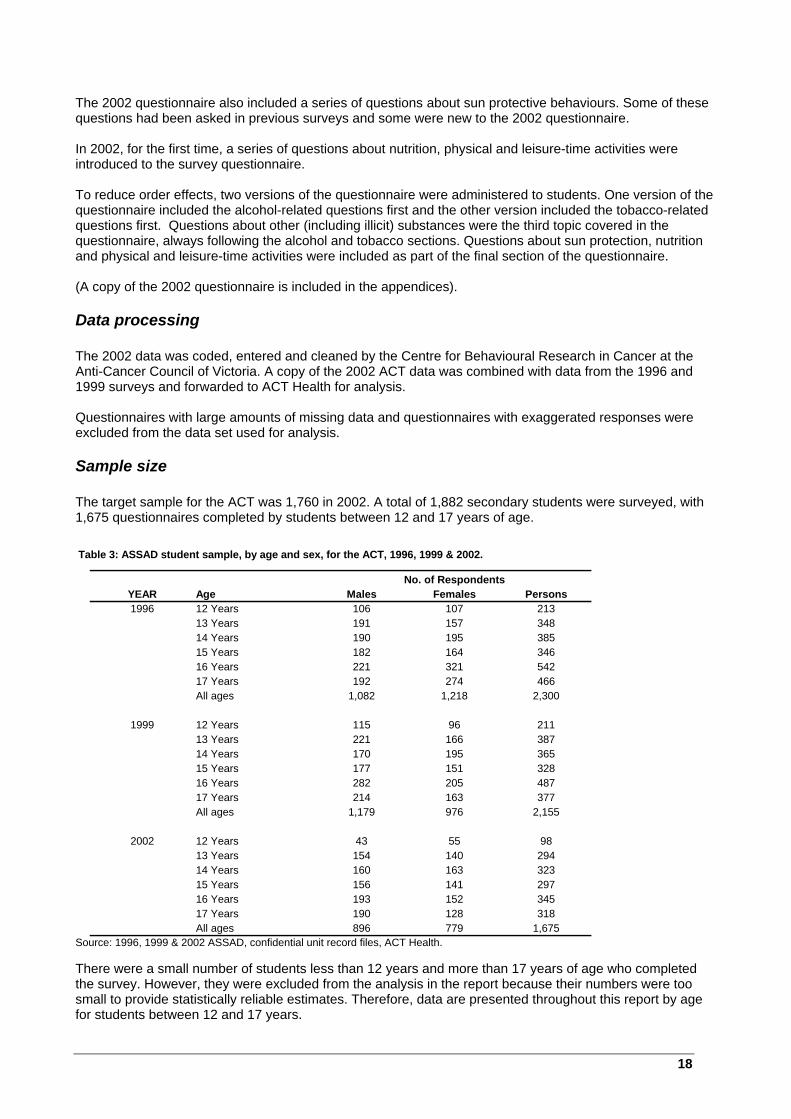
18
The 2002 questionnaire also included a series of questions about sun protective behaviours. Some of these questions had been asked in previous surveys and some were new to the 2002 questionnaire. In 2002, for the first time, a series of questions about nutrition, physical and leisure-time activities were introduced to the survey questionnaire. To reduce order effects, two versions of the questionnaire were administered to students. One version of the questionnaire included the alcohol-related questions first and the other version included the tobacco-related questions first. Questions about other (including illicit) substances were the third topic covered in the questionnaire, always following the alcohol and tobacco sections. Questions about sun protection, nutrition and physical and leisure-time activities were included as part of the final section of the questionnaire. (A copy of the 2002 questionnaire is included in the appendices).
Data processing The 2002 data was coded, entered and cleaned by the Centre for Behavioural Research in Cancer at the Anti-Cancer Council of Victoria. A copy of the 2002 ACT data was combined with data from the 1996 and 1999 surveys and forwarded to ACT Health for analysis. Questionnaires with large amounts of missing data and questionnaires with exaggerated responses were excluded from the data set used for analysis.
Sample size The target sample for the ACT was 1,760 in 2002. A total of 1,882 secondary students were surveyed, with 1,675 questionnaires completed by students between 12 and 17 years of age. Table 3: ASSAD student sample, by age and sex, for the ACT, 1996, 1999 & 2002.
Source: 1996, 1999 & 2002 ASSAD, confidential unit record files, ACT Health. There were a small number of students less than 12 years and more than 17 years of age who completed the survey. However, they were excluded from the analysis in the report because their numbers were too small to provide statistically reliable estimates. Therefore, data are presented throughout this report by age for students between 12 and 17 years.
No. of RespondentsYEAR Age Males Females Persons1996 12 Years 106 107 213
13 Years 191 157 34814 Years 190 195 38515 Years 182 164 34616 Years 221 321 54217 Years 192 274 466All ages 1,082 1,218 2,300
1999 12 Years 115 96 21113 Years 221 166 38714 Years 170 195 36515 Years 177 151 32816 Years 282 205 48717 Years 214 163 377All ages 1,179 976 2,155
2002 12 Years 43 55 9813 Years 154 140 29414 Years 160 163 32315 Years 156 141 29716 Years 193 152 34517 Years 190 128 318All ages 896 779 1,675
19
There were also a small number of non-resident students who completed the 2002 survey questionnaire. A brief review of student postcodes (there was a question on student postcodes in the survey) suggests that between 2-15 per cent of students who completed the survey were interstate residents in 2002. It is not possible to be any more precise than this as a number of postcodes span the ACT and NSW borders and the actual state of residence can not be clearly ascertained by the use of postcodes alone. All have been included in the analysis, regardless of their postcode or State of usual residence. The relatively small sample size of the survey has implications for the reliability of estimates. An indication of the reliability of estimates has been provided in tables and graphs throughout the report. Estimates with a relative standard error (RSE) between 25 and 50 per cent should be interpreted with caution and have been indicated with a single asterisk (*). Estimates with an RSE above 50 per cent are considered unreliable for general use and have not been included in the report. In tables and graphs where other estimates are reliable, estimates with an RSE above 50 per cent have not actually been included, but are indicated by a double asterisk (**).
Data analysis The analysis that was undertaken and the results that have been presented in the report have largely been determined by the reliability of estimates. Although it is theoretically possible to analyse and provide results in more detail than has been presented here, it is not necessarily valid to do so. The relative standard error has been used to provide an indication of estimate reliability (see section above). The 2002 data was weighted by age, sex and school type to account for differences between the sample that was obtained and ACT school enrolments for Semester 2, 2002. Data from the 1996 and 1999 surveys was weighted similarly to time-appropriate school enrolment data. All estimates provided in the report are based upon weighted data. Logistic regression was used to identify changes in the proportion of students reporting specific behaviours (eg tobacco use) over time (between 1996 and 2002). Logistic regression was also used to identify factors associated with specific behaviours that were reported by students in 2002. Chi-square statistics were calculated, using unweighted data, to determine the relative discrepancy/association between categorical variables. These statistics have not generally been reported, but their p-values have been reported where results are significant – null hypothesis has been rejected. Note that probability levels below 0.05 are reported as significant throughout the report. Student responses were not included in the analysis for certain questions if there was evidence of contradictory responses or multiple responses. However, responses from these students were included in the analysis of other questions, if other questions had been validly completed. All statistical analyses were undertaken using SPSS v11.5. Analysis of alcohol questions Depending upon estimate reliability, the majority of alcohol questions were analysed and presented for three groups of students: All students who were surveyed who validly completed various alcohol questions; Recent drinkers – students who reported consuming alcohol in the week prior to survey; Harmful drinkers – females who reported consuming five or more drinks on any one day in the week
prior to survey and males who reported consuming seven or more drinks on any one day in the week prior to survey.
Analysis of tobacco questions Depending upon estimate reliability, the majority of tobacco questions were analysed and presented for three groups of students: All students who were surveyed who validly completed various tobacco questions; Recent or current smokers – students who reported smoking in the week prior to survey;
20
‘Heavy smokers’ – students who reported smoking in the week prior to survey and described themselves as ‘heavy smokers’. This group of students had a very different profile to other smokers. For instance, they smoked a median of 70 cigarettes in the week prior to survey, (the median for recent, or current smokers was 12 cigarettes). They were also more likely to have tried purchasing cigarettes from a retailer and were more likely to indicate that they would be smoking in 12 months time, compared to other recent or current smokers.
Analysis of questions about other (including illicit) substance use Depending upon estimate variability, the questions on substance use were analysed and presented for all the students who were surveyed who validly completed the questions based on the following categorisation: Lifetime/ever users – students who had used relevant substances at least once in their lifetime. Users in the last 12 months – students who had reported using substances in the 12 months preceding
the survey. Recent users – students who had reported using substances in either the four weeks or the week
preceding the survey, depending upon estimate reliability. The other (including illicit) substances in the 2002 survey were: painkillers/analgesics (Disprin, Panadol, Aspro) – for any reason; sleeping tablets/tranquillisers/sedatives (Valium, Serapax, Rohypnol) – other than for medical reasons; marijuana/cannabis; steroids - without a doctor’s prescription; inhalants that were deliberately sniffed from spray cans, glue, paint, petrol or thinners in order to get
high. This did not include sniffing white-out, liquid paper textas or pens; amphetamines (speed, uppers, MDA, goey, dex, dexxies, dexamphetamine, ox blood,
methamphetamine, ice) – other than for medical reasons; ecstasy or XTC (E, MDMA, ecci, X, bickies); cocaine; heroin or other opiates (narcotics) (smack, horse, skag, hammer, H, methadone, pethidine) – other than
for medical reasons; hallucinogens (LSD, acid, trips, magic mushrooms, datura, angel’s trumpet).
Changes in reported levels of illicit substance between 1999 and 2002 have been explored in the text. There is also mention in the text of changes in reported levels of illicit substance use between 1996 and 2002, where there are differences to the pattern between 1999 and 2002. Note that the table in the Overview (Table 1) presents trends overtime in reported levels of illicit substance use between 1996 and 2002. Analysis of questions about poly-substance use Depending upon estimate variability, the questions on poly-substance use were analysed and presented for the following groups of students: Students who reported using cannabis in the year preceding the survey. Students who reported using amphetamines in the year prior to the survey. Students who reported using hallucinogens in the year prior to the survey. Students who reported using ecstasy in the year prior to the survey.
There is also an analysis of students who reported the use of tobacco, alcohol and at least one other illicit substance in the week prior to the 2002 survey. These students are referred to as ‘recent poly-substance users’ in the report. Logistic regression was used to identify factors associated with students who reported recent poly-substance use. Analysis of non-users Students who reported never having used tobacco, alcohol or any illicit substance in their lifetime were categorised as ‘non-users’. Logistic regression was used to identify factors associated with students who reported never having used tobacco, alcohol or any illicit substance in their lifetime. Analysis of nutrition questions In 2002, students in the ACT were asked to report on their daily intake of fruit, vegetables and breads and cereals. The Dietary Guidelines for Children and Adolescents in Australia recommend at least three serves
21
of vegetables and fruits and 5 -11 serves of breads and cereals per day for young people between 12 and 18 years of age. A serve of fruit is equal to one medium piece, or two small pieces of fruit, or one cup of diced fruit. A serve of vegetables is equal to ½ cup of cooked vegetables, or one cup of salad vegetables. One slice of bread, ½ bread roll, ½ cup of breakfast cereal, ½ cup of pasta, rice or noodles comprise a single serve of bread or cereal. The analysis of nutrition questions focused on reported consumption levels of fruit, vegetables and breads and cereals. Students were pooled into two groups for comparison: those students who reported consuming less than the daily recommended serves of one or more food
type, according to the Dietary Guidelines for Children and Adolescents in Australia (indicating an inadequate diet); and
those students who reported consuming the daily recommended serves (or more) of each food type
(indicating an adequate diet). The 2002 questionnaire required students to report the level of consumption of each food type by a range of serves ie. ‘less than one serve’, ‘2-3 serves’, ‘4-5 serves’, ‘6 serves or more’, ‘I do not eat fruit (or vegetables, or breads/cereals)’. However, the ranges specified in the questionnaire did not allow for direct comparison with the guidelines. For instance, although the guidelines recommend three serves of fruit and three serves of vegetables a day, the questionnaire did not allow for identification of students reporting exactly three serves, as the range specified in the questionnaire was ‘2-3 serves’. In the analysis, therefore, students reporting consumption of ‘less than one serve’ and students reporting ‘I do not eat fruit(/vegetables)’ were assigned to the student group reporting an ‘inadequate’ level of consumption of fruit or vegetables (see questions 53 and 54 in the questionnaire in the Appendices). Similarly, the Dietary Guidelines for Children and Adolescents in Australia recommend a minimum of five serves of breads and cereals a day, but it was not possible to ascertain those students who consumed five serves, as the relevant range specified in the questionnaire was ‘4-5 serves’. Therefore, students who reported not eating breads and cereals, or eating ‘less than one serve’ or between ‘2-3 serves’, were included in the student group with an ‘inadequate’ level of consumption of breads and cereals (see question 55 in the questionnaire in the Appendices). Because of the way student responses have been categorized, it is important to note that the results for the nutrition questions under estimate the actual proportion of students consuming less than the recommended daily serves of fruit, vegetables and breads and cereals. Analysis of physical and leisure-time activity questions The 2002 survey included a series of questions on physical and leisure-time activity. Students were asked to report the number of 30-minute sessions of vigorous and/or moderate physical activity undertaken during the week prior to the survey. They were also asked to report the time they spent watching TV or video and using the Internet or playing computer games on an average school day. The aim was to gain a better understanding of physical and leisure-time activity patterns among secondary school students in the ACT. In order to obtain health benefits, the National Physical Activity Guidelines for Australians recommends at least 30 minutes of moderate-intensity physical activity on most, preferably all days of the week. The National Physical Activity Guidelines for Australians also recommend an additional level of activity for adults who wish to increase their physical fitness. In addition to the 30 minutes of moderate-intensity physical activity on most, preferably all days of the week, a further 30 minutes of vigorous activity 3-4 times a week is recommended. This additional level of activity is routinely recommended for children and young people less than 18 years of age. A vigorous physical activity session included at least 30 minutes of activity that made students sweat or breathe hard, and included activities such as basketball, netball, soccer, football, running, aerobics and fast bike riding. A moderate physical activity session included at least 30 minutes of activity that did not make students sweat or breathe hard, and included activities such as slow bike riding, brisk walking, housework and pushing a lawn mower. (It should be noted that moderate physical activity reported by students might have been under reported due to the types of activities cited as an example in the survey questionnaire).
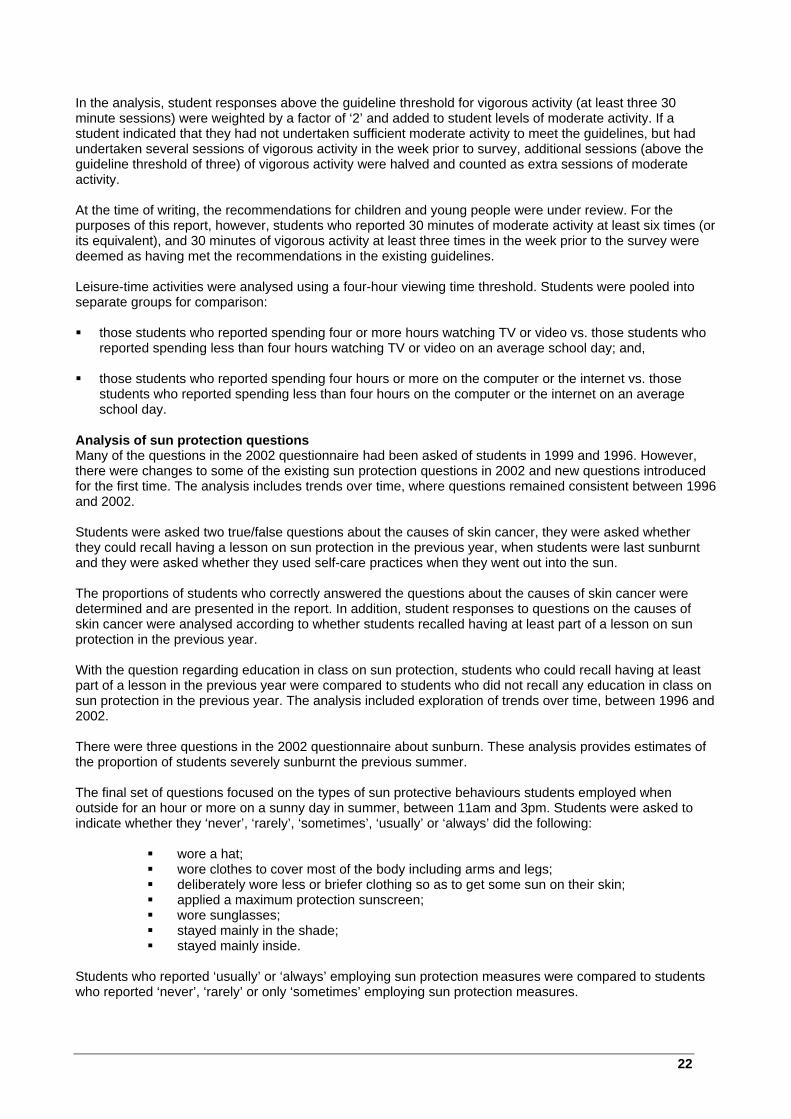
22
In the analysis, student responses above the guideline threshold for vigorous activity (at least three 30 minute sessions) were weighted by a factor of ‘2’ and added to student levels of moderate activity. If a student indicated that they had not undertaken sufficient moderate activity to meet the guidelines, but had undertaken several sessions of vigorous activity in the week prior to survey, additional sessions (above the guideline threshold of three) of vigorous activity were halved and counted as extra sessions of moderate activity. At the time of writing, the recommendations for children and young people were under review. For the purposes of this report, however, students who reported 30 minutes of moderate activity at least six times (or its equivalent), and 30 minutes of vigorous activity at least three times in the week prior to the survey were deemed as having met the recommendations in the existing guidelines. Leisure-time activities were analysed using a four-hour viewing time threshold. Students were pooled into separate groups for comparison: those students who reported spending four or more hours watching TV or video vs. those students who
reported spending less than four hours watching TV or video on an average school day; and, those students who reported spending four hours or more on the computer or the internet vs. those
students who reported spending less than four hours on the computer or the internet on an average school day.
Analysis of sun protection questions Many of the questions in the 2002 questionnaire had been asked of students in 1999 and 1996. However, there were changes to some of the existing sun protection questions in 2002 and new questions introduced for the first time. The analysis includes trends over time, where questions remained consistent between 1996 and 2002. Students were asked two true/false questions about the causes of skin cancer, they were asked whether they could recall having a lesson on sun protection in the previous year, when students were last sunburnt and they were asked whether they used self-care practices when they went out into the sun. The proportions of students who correctly answered the questions about the causes of skin cancer were determined and are presented in the report. In addition, student responses to questions on the causes of skin cancer were analysed according to whether students recalled having at least part of a lesson on sun protection in the previous year. With the question regarding education in class on sun protection, students who could recall having at least part of a lesson in the previous year were compared to students who did not recall any education in class on sun protection in the previous year. The analysis included exploration of trends over time, between 1996 and 2002. There were three questions in the 2002 questionnaire about sunburn. These analysis provides estimates of the proportion of students severely sunburnt the previous summer. The final set of questions focused on the types of sun protective behaviours students employed when outside for an hour or more on a sunny day in summer, between 11am and 3pm. Students were asked to indicate whether they ‘never’, ‘rarely’, ‘sometimes’, ‘usually’ or ‘always’ did the following:
wore a hat; wore clothes to cover most of the body including arms and legs; deliberately wore less or briefer clothing so as to get some sun on their skin; applied a maximum protection sunscreen; wore sunglasses; stayed mainly in the shade; stayed mainly inside.
Students who reported ‘usually’ or ‘always’ employing sun protection measures were compared to students who reported ‘never’, ‘rarely’ or only ‘sometimes’ employing sun protection measures.
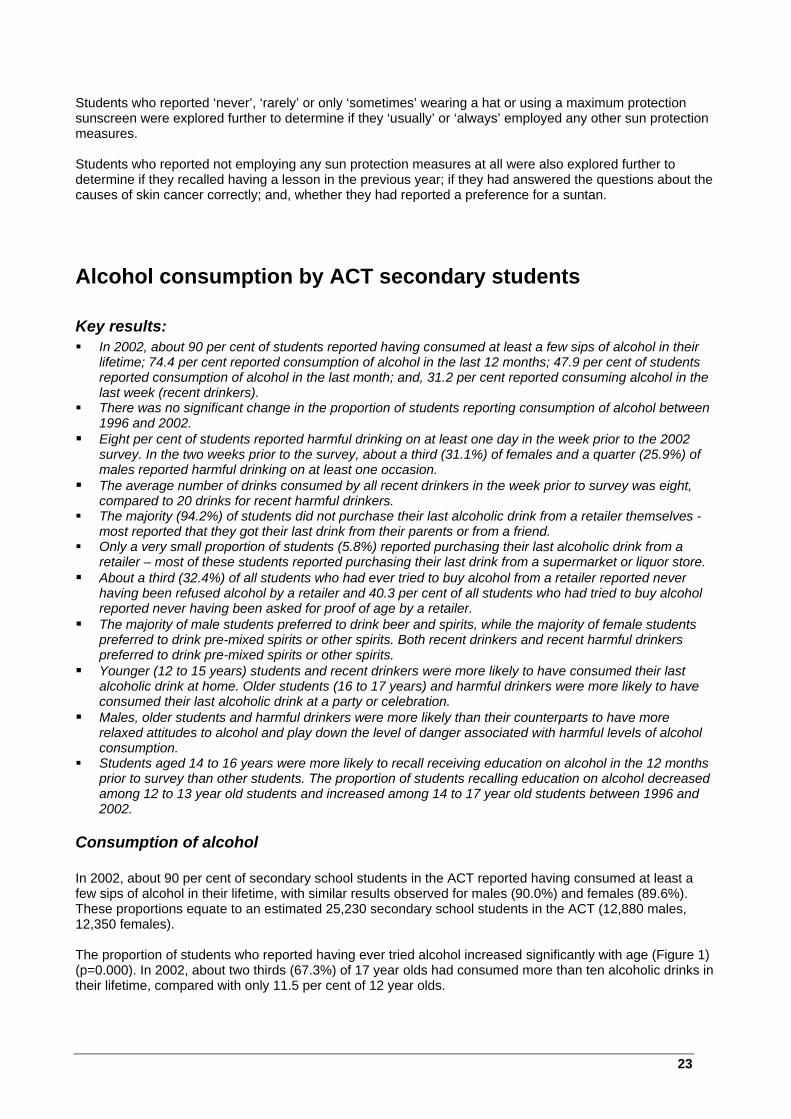
23
Students who reported ‘never’, ‘rarely’ or only ‘sometimes’ wearing a hat or using a maximum protection sunscreen were explored further to determine if they ‘usually’ or ‘always’ employed any other sun protection measures. Students who reported not employing any sun protection measures at all were also explored further to determine if they recalled having a lesson in the previous year; if they had answered the questions about the causes of skin cancer correctly; and, whether they had reported a preference for a suntan.
Alcohol consumption by ACT secondary students
Key results: In 2002, about 90 per cent of students reported having consumed at least a few sips of alcohol in their
lifetime; 74.4 per cent reported consumption of alcohol in the last 12 months; 47.9 per cent of students reported consumption of alcohol in the last month; and, 31.2 per cent reported consuming alcohol in the last week (recent drinkers).
There was no significant change in the proportion of students reporting consumption of alcohol between 1996 and 2002.
Eight per cent of students reported harmful drinking on at least one day in the week prior to the 2002 survey. In the two weeks prior to the survey, about a third (31.1%) of females and a quarter (25.9%) of males reported harmful drinking on at least one occasion.
The average number of drinks consumed by all recent drinkers in the week prior to survey was eight, compared to 20 drinks for recent harmful drinkers.
The majority (94.2%) of students did not purchase their last alcoholic drink from a retailer themselves - most reported that they got their last drink from their parents or from a friend.
Only a very small proportion of students (5.8%) reported purchasing their last alcoholic drink from a retailer – most of these students reported purchasing their last drink from a supermarket or liquor store.
About a third (32.4%) of all students who had ever tried to buy alcohol from a retailer reported never having been refused alcohol by a retailer and 40.3 per cent of all students who had tried to buy alcohol reported never having been asked for proof of age by a retailer.
The majority of male students preferred to drink beer and spirits, while the majority of female students preferred to drink pre-mixed spirits or other spirits. Both recent drinkers and recent harmful drinkers preferred to drink pre-mixed spirits or other spirits.
Younger (12 to 15 years) students and recent drinkers were more likely to have consumed their last alcoholic drink at home. Older students (16 to 17 years) and harmful drinkers were more likely to have consumed their last alcoholic drink at a party or celebration.
Males, older students and harmful drinkers were more likely than their counterparts to have more relaxed attitudes to alcohol and play down the level of danger associated with harmful levels of alcohol consumption.
Students aged 14 to 16 years were more likely to recall receiving education on alcohol in the 12 months prior to survey than other students. The proportion of students recalling education on alcohol decreased among 12 to 13 year old students and increased among 14 to 17 year old students between 1996 and 2002.
Consumption of alcohol In 2002, about 90 per cent of secondary school students in the ACT reported having consumed at least a few sips of alcohol in their lifetime, with similar results observed for males (90.0%) and females (89.6%). These proportions equate to an estimated 25,230 secondary school students in the ACT (12,880 males, 12,350 females). The proportion of students who reported having ever tried alcohol increased significantly with age (Figure 1) (p=0.000). In 2002, about two thirds (67.3%) of 17 year olds had consumed more than ten alcoholic drinks in their lifetime, compared with only 11.5 per cent of 12 year olds.

24
Figure 1: ‘Have you ever had an alcoholic drink’ by age, ACT 2002 (%).
Source: 2002 ASSAD, confidential unit record file, ACT Health. There was no significant difference in the proportion of students who reported lifetime use of alcohol between 1996 (89.7%) and 2002 (89.8%). About three quarters (74.4%) of the students surveyed in 2002 reported having consumed alcohol in the last 12 months. The proportion of students reporting consumption of alcohol in the last 12 months increased significantly with age (p=0.000), but results were similar for males and females (Figure 2). Figure 2: Had a drink in the last 12 months, by age and sex, ACT 1996, 1999 & 2002 (%).
Source: 1996, 1999 & 2002 ASSAD, confidential unit record files, ACT Health. * Estimate has a relative standard error between 25 and 50% and should be interpreted with caution. There was no significant difference in the proportion of students who reported consuming alcohol in the last 12 months, between 1996 (73.6%) and 2002 (74.4%). Almost a half (47.9%) of all students surveyed in 2002 reported having consumed alcohol in the last four weeks. The proportion of students reporting consumption of alcohol in the last four weeks increased significantly with age (p=0.000), but there was no significant difference observed between males and females (Figure 3).
*
0
10
20
30
40
50
60
70
80
90
100
12 years 13 years 14 years 15 years 16 years 17 years
Males
Per c
ent
*
0
10
20
30
40
50
60
70
80
90
100
12 years 13 years 14 years 15 years 16 years 17 years
Females
1996
1999
2002
0%
25%
50%
75%
100%
12 13 14 15 16 17
Student age
Per c
ent
No
Yes few sips
Yes <10 drinks
Yes >10 drinks

25
Figure 3: Had a drink in the last four weeks, by age and sex, ACT 1996, 1999 & 2002 (%).
Source: 1996, 1999 & 2002 ASSAD, confidential unit record files, ACT Health. * Estimate has a relative standard error between 25 and 50% and should be interpreted with caution. ** Estimate has a relative standard error greater than 50% and is considered unreliable for general use. There was no significant difference in the proportion of students who reported consuming alcohol in the last four weeks, between 1996 (45.7%) and 2002 (47.9%).
Recent consumption of alcohol Recent consumption of alcohol has been defined as any alcohol consumption in the week prior to survey. In 2002, 31.2 per cent of students reported that they had consumed alcohol in the last week. A third (32.6%) of males and 29.8 per cent of females reported recent consumption of alcohol. The proportion of male and female students reporting recent alcohol consumption did not change significantly between 1996 and 2002. The proportion of students who reported drinking alcohol during the week prior to the 2002 survey increased significantly with age (p=0.000). Seventeen-year-old males (44.7%) and females (49.7%) were more likely to have consumed alcohol in the last week than students of any other age and sex (Figure 4).
**
**0
10
20
30
40
50
60
70
80
12 years 13 years 14 years 15 years 16 years 17 years
Males
Per c
ent
*
**
*
**0
10
20
30
40
50
60
70
80
12 years 13 years 14 years 15 years 16 years 17 years
Females
1996
1999
2002
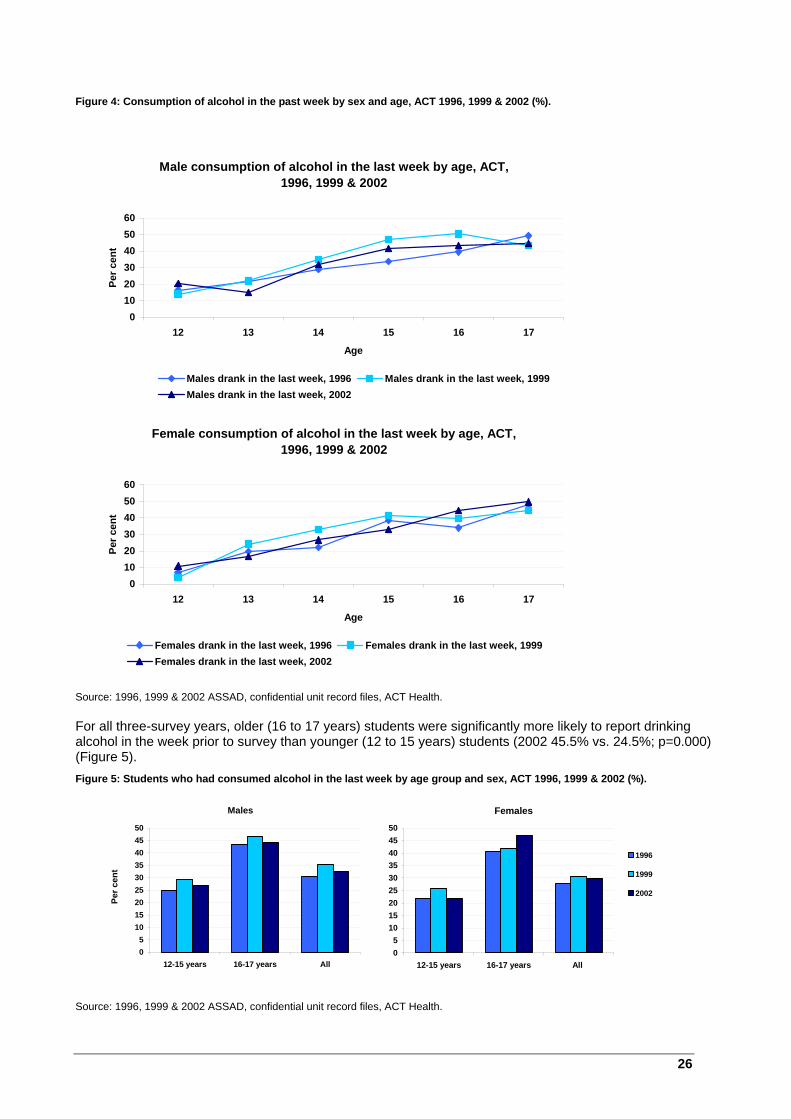
26
Figure 4: Consumption of alcohol in the past week by sex and age, ACT 1996, 1999 & 2002 (%).
Source: 1996, 1999 & 2002 ASSAD, confidential unit record files, ACT Health. For all three-survey years, older (16 to 17 years) students were significantly more likely to report drinking alcohol in the week prior to survey than younger (12 to 15 years) students (2002 45.5% vs. 24.5%; p=0.000) (Figure 5). Figure 5: Students who had consumed alcohol in the last week by age group and sex, ACT 1996, 1999 & 2002 (%).
Source: 1996, 1999 & 2002 ASSAD, confidential unit record files, ACT Health.
Male consumption of alcohol in the last week by age, ACT, 1996, 1999 & 2002
0102030405060
12 13 14 15 16 17
Age
Per c
ent
Males drank in the last week, 1996 Males drank in the last week, 1999Males drank in the last week, 2002
Female consumption of alcohol in the last week by age, ACT, 1996, 1999 & 2002
0102030405060
12 13 14 15 16 17
Age
Per c
ent
Females drank in the last week, 1996 Females drank in the last week, 1999Females drank in the last week, 2002
Females
05
101520253035404550
12-15 years 16-17 years All
1996
1999
2002
Males
05
101520253035404550
12-15 years 16-17 years All
Per c
ent

27
In 2002, males aged 12 to15 years (27.1%) were significantly more likely to report that they had consumed alcohol in the week prior to the survey than females aged 12 to 15 years (21.8%) (p=0.009). However, there was no significant difference in recent alcohol consumption observed between males and females in the 16 to 17 year age group (males 44.1%, females 47.0%).
Harmful alcohol consumption The current alcohol consumption guidelines recommend that females not consume more than four alcoholic drinks on any one day, and that males not consume more than six alcoholic drinks on any one day.3 Consumption above these levels is thought to significantly increase the short-term risk of health and social problems. In the analysis which follows, ‘harmful’ alcohol consumption has been defined as five or more drinks on any one day in the week prior to the survey for females, and seven or more drinks on any one day in the week prior to the survey for males. There was no significant change in the proportion of students reporting harmful alcohol consumption in the week prior to survey, between 1996 and 2002. In 1996, 6.4 per cent of all students reported harmful drinking on at least one day of the week prior to survey, compared to 8.1 per cent in 1999 and 8.0 per cent in 2002. There was no significant difference in the proportion of students reporting harmful alcohol consumption in the week prior to the 2002 survey between the sexes (males 8.5%, females 7.5%). However, sixteen year old male (17.2%) and female (15.7%) students were significantly more likely to report harmful alcohol consumption in the week prior to the 2002 survey than students of any other age and sex (p=0.000) (Figure 6). Figure 6: Proportion of all students reporting harmful alcohol consumption in the week prior to survey, by age and sex, ACT 1996, 1999 & 2002.
Source: 1996, 1999 & 2002 ASSAD, confidential unit record files, ACT Health. Students were also asked how often they engaged in harmful alcohol consumption over a two-week period. They were asked to report the number of times they had consumed five, seven and eleven drinks, on any one occasion in the two weeks prior to the survey. Males were significantly more likely than females to report consuming five (p=0.003), seven (p=0.000) or eleven drinks (p=0.000), at least once, on any one occasion, in the two weeks prior to the 2002 survey (Table 4). Older students (16 to 17 years) were also significantly more likely than younger students (12 to 15 years) to report consuming five (44.8% vs. 29%; p=0.000), seven (29.8% vs. 17%; p=0.000) or eleven drinks (17.7% vs. 11%; p=0.005), at least once, on any one occasion, in the two weeks prior to the 2002 survey. Although eight per cent of students reported harmful levels of alcohol consumption in the week prior to the 2002 survey, almost a third (31.1%) of female students and about a quarter (25.9%) of male students reported harmful levels of alcohol consumption, on at least one occasion, in the two-week period prior to the survey. In addition, 13.5 per cent of all students in 2002 reported consuming 11 or more drinks, at least once, on any one occasion, in the two-week period prior to the survey.
3 National Health and Medical Research Council. 2001. Australian Alcohol Guidelines: Health Risks and Benefits. Canberra, AusInfo.
0
5
10
15
20
25
12 13 14 15 16 17
Females
1996
1999
2002
0
5
10
15
20
25
12 13 14 15 16 17
Males
Per c
ent
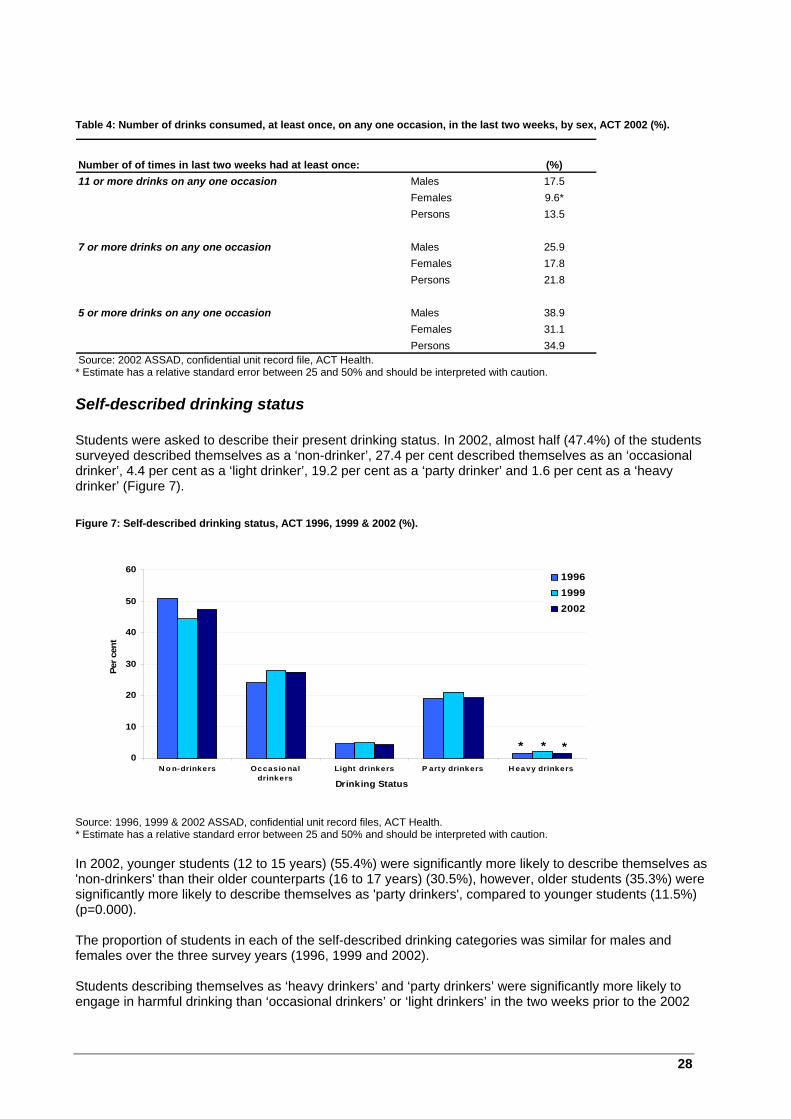
28
Table 4: Number of drinks consumed, at least once, on any one occasion, in the last two weeks, by sex, ACT 2002 (%).
Source: 2002 ASSAD, confidential unit record file, ACT Health. * Estimate has a relative standard error between 25 and 50% and should be interpreted with caution.
Self-described drinking status Students were asked to describe their present drinking status. In 2002, almost half (47.4%) of the students surveyed described themselves as a ‘non-drinker’, 27.4 per cent described themselves as an ‘occasional drinker’, 4.4 per cent as a ‘light drinker’, 19.2 per cent as a ‘party drinker’ and 1.6 per cent as a ‘heavy drinker’ (Figure 7). Figure 7: Self-described drinking status, ACT 1996, 1999 & 2002 (%).
Source: 1996, 1999 & 2002 ASSAD, confidential unit record files, ACT Health. * Estimate has a relative standard error between 25 and 50% and should be interpreted with caution. In 2002, younger students (12 to 15 years) (55.4%) were significantly more likely to describe themselves as 'non-drinkers' than their older counterparts (16 to 17 years) (30.5%), however, older students (35.3%) were significantly more likely to describe themselves as 'party drinkers', compared to younger students (11.5%) (p=0.000). The proportion of students in each of the self-described drinking categories was similar for males and females over the three survey years (1996, 1999 and 2002). Students describing themselves as ‘heavy drinkers’ and ‘party drinkers’ were significantly more likely to engage in harmful drinking than ‘occasional drinkers’ or ‘light drinkers’ in the two weeks prior to the 2002
Number of of times in last two weeks had at least once: (%)11 or more drinks on any one occasion Males 17.5
Females 9.6*Persons 13.5
7 or more drinks on any one occasion Males 25.9Females 17.8Persons 21.8
5 or more drinks on any one occasion Males 38.9Females 31.1Persons 34.9
* * *0
10
20
30
40
50
60
N o n-drinkers Occasio naldrinkers
Light drinkers P arty drinkers H eavy drinkers
Drinking Status
Per c
ent
199619992002

29
survey (p=0.000) (Figure 8). Almost all (94.3%) of the ‘heavy drinkers’ and more than half (56.1%) of the ‘party drinkers’ reported consuming seven or more drinks, at least once, on any one occasion in the two-week period. In addition, 85.8 per cent of ‘heavy drinkers’ and more than a third (34.9%) of ‘party drinkers’ reported consuming 11 or more drinks at least once. Figure 8: Self-described drinking status, by number of drinks consumed, at least once, on any one occasion, in the last two weeks, ACT 2002 (%).
Source: 2002 ASSAD, confidential unit record file, ACT Health. * Estimate has a relative standard error between 25 and 50% and should be interpreted with caution. ** Estimate has a relative standard error greater than 50% and is considered unreliable for general use.
Table 5: Recent and harmful drinkers by self-described drinking status, ACT 2002 (%).
Source: 2002 ASSAD, confidential unit record file, ACT Health. * Estimate has a relative standard error between 25 and 50% and should be interpreted with caution. ** Estimate has a relative standard error greater than 50% and is considered unreliable for general use. Although 42.4 per cent of recent drinkers described themselves as a 'party drinker' and about a third (35.1%) described themselves as an 'occasional drinker', one in ten (9.5%) students who had consumed alcohol in the week prior to the survey described themselves as a 'non-drinker' (Table 5). Although the majority of harmful drinkers described themselves as either a 'party drinker' (61.9%) or a 'heavy drinker' (12.2%), 13.7 per cent of harmful drinkers described themselves as an 'occasional drinker'.
Source of alcohol Students who had tried alcohol at least once in their lifetime were asked to report where or from whom they obtained their last alcoholic drink. Students who reported purchasing their last drink from a retailer were asked where they had purchased their last drink. Students who did not buy their last drink from a retailer were asked to report from where, or from whom, they had obtained their last drink.
****
*
***
*
0
10
20
30
40
50
60
70
80
90
100
N o n-drinkers Occasio naldrinkers
Light drinkers P arty drinkers H eavy drinkers
Drinking Status
Per c
ent
C o nsumed 5 o r mo redrinks, at least o nce, o nany o ne o ccasio n
C o nsumed 7 o r mo redrinks, at least o nce, o nany o ne o ccasio n
C o nsumed 11 o r mo redrinks, at least o nce, o nany o ne o ccasio n
Recent & harmful drinkers by self-described drinking status: (%)
Recent drinkers non-drinker 9.5 occasional drinker 35.1
light drinker 8.9*party drinker 42.4heavy drinker 4.0*
Harmful drinkers non-drinker **
occasional drinker 13.7* light drinker **
party drinker 61.9heavy drinker 12.2*

30
In 2002, the majority of students (94.4%) who had ever tried alcohol reported that they did not buy their last alcoholic drink from a retailer. Only a very small proportion of students (5.6%), who had ever tried alcohol, reported purchasing their last alcoholic drink from a retailer themselves. In comparison, 8.8 per cent of recent drinkers and 20.6 per cent of harmful drinkers reported purchasing their last drink from a retailer. There was a significant decrease in the proportion of students reporting they had purchased their last alcohol drink from a retailer, between 1996 and 2002 (1996 8.9%; 1999 6.6%; 2002 5.6%) (p=0.001). Almost half (48.8%) the students who had ever tried alcohol and did not purchase their last alcoholic drink from a retailer themselves, reported being given their last drink by parents. One in five (20.3%) reported being given their last drink by a friend, and 15.3 per cent reported that they got someone else to buy their last drink for them (Table 6). Table 6: Where and from whom student got last alcoholic drink, by class of drinker, ACT 2002 (%).
Source: 2002 ASSAD, confidential unit record file, ACT Health. * Estimate has a relative standard error between 25 and 50% and should be interpreted with caution. Students who reported purchasing their last alcoholic drink from a retailer themselves purchased from a wide variety of retail venues, however, almost a half (47.1%) of those who purchased their last drink from a retailer reported purchasing from a liquor store or supermarket. More than a third (37.6%) of recent drinkers who reported not purchasing their last alcoholic drink reported being given their last alcoholic drink by parents. About one in five (21.8%) reported being given their last drink by a friend, and about one in five (22.8%) reported that they got someone else to buy their last drink for them. Among harmful drinkers, the pattern of access was slightly different. More than a third (39.8%) of harmful drinkers who reported not purchasing their last alcoholic drink from a retailer themselves got someone else to buy their last drink for them. About one in five (20.2%) reported being given their last drink by a friend, and about one in four (24%) reported that they were given their last alcoholic drink by parents.
Where student got last alcoholic drink (%)
Lifetime drinker Did not buy Not buy - parents gave 48.8(Ever tried alcohol) last drink Not buy - brother or sister gave 8.1
from a retailer Not buy - friend gave 20.3Not buy - got someone to buy 15.3Other not buy 7.5
Bought Bought licenced liquor store/supermarket 47.1last drink Bought hotel/pub/bar/tavern/RSL 15.1*from a retailer Other 37.8
Recent drinker Did not buy Not buy - parents gave 37.6(Consumed alcohol last drink Not buy - friend gave 21.8in the last week) from a retailer Not buy - got someone to buy 22.8
Other not buy 17.8
Bought Bought licenced liquor store/supermarket 58.8last drink Other bought 41.2*from a retailer
Harmful drinker Did not buy Not buy - parents gave 24.0*(Females = 5+ drinks last drink Not buy - friend gave 20.2*& males = 7+ drinks from a retailer Not buy - got someone to buy 39.8in the last week) Other not buy 16.0*
Bought Bought licenced liquor store/supermarket 66.6last drink Other bought 33.4*from a retailer
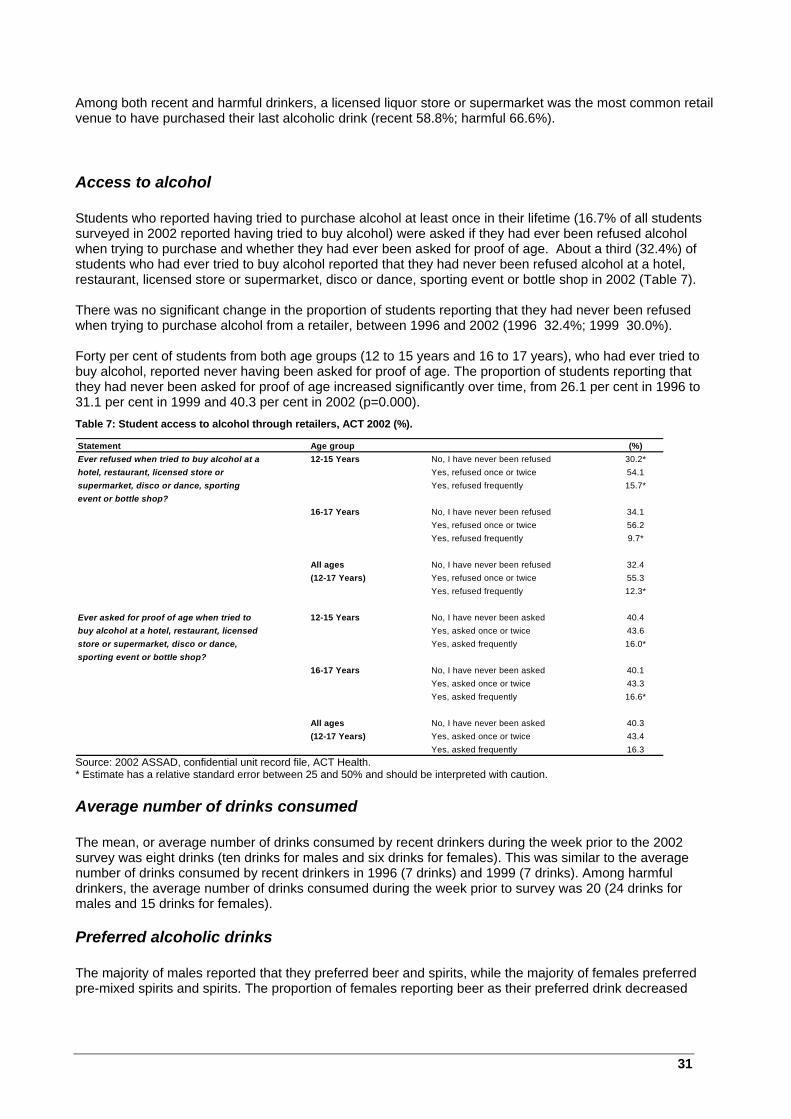
31
Among both recent and harmful drinkers, a licensed liquor store or supermarket was the most common retail venue to have purchased their last alcoholic drink (recent 58.8%; harmful 66.6%).
Access to alcohol Students who reported having tried to purchase alcohol at least once in their lifetime (16.7% of all students surveyed in 2002 reported having tried to buy alcohol) were asked if they had ever been refused alcohol when trying to purchase and whether they had ever been asked for proof of age. About a third (32.4%) of students who had ever tried to buy alcohol reported that they had never been refused alcohol at a hotel, restaurant, licensed store or supermarket, disco or dance, sporting event or bottle shop in 2002 (Table 7). There was no significant change in the proportion of students reporting that they had never been refused when trying to purchase alcohol from a retailer, between 1996 and 2002 (1996 32.4%; 1999 30.0%). Forty per cent of students from both age groups (12 to 15 years and 16 to 17 years), who had ever tried to buy alcohol, reported never having been asked for proof of age. The proportion of students reporting that they had never been asked for proof of age increased significantly over time, from 26.1 per cent in 1996 to 31.1 per cent in 1999 and 40.3 per cent in 2002 (p=0.000). Table 7: Student access to alcohol through retailers, ACT 2002 (%).
Source: 2002 ASSAD, confidential unit record file, ACT Health. * Estimate has a relative standard error between 25 and 50% and should be interpreted with caution.
Average number of drinks consumed The mean, or average number of drinks consumed by recent drinkers during the week prior to the 2002 survey was eight drinks (ten drinks for males and six drinks for females). This was similar to the average number of drinks consumed by recent drinkers in 1996 (7 drinks) and 1999 (7 drinks). Among harmful drinkers, the average number of drinks consumed during the week prior to survey was 20 (24 drinks for males and 15 drinks for females).
Preferred alcoholic drinks The majority of males reported that they preferred beer and spirits, while the majority of females preferred pre-mixed spirits and spirits. The proportion of females reporting beer as their preferred drink decreased
Statement Age group (%)Ever refused when tried to buy alcohol at a 12-15 Years No, I have never been refused 30.2*hotel, restaurant, licensed store or Yes, refused once or twice 54.1supermarket, disco or dance, sporting Yes, refused frequently 15.7*event or bottle shop?
16-17 Years No, I have never been refused 34.1Yes, refused once or twice 56.2Yes, refused frequently 9.7*
All ages No, I have never been refused 32.4(12-17 Years) Yes, refused once or twice 55.3
Yes, refused frequently 12.3*
Ever asked for proof of age when tried to 12-15 Years No, I have never been asked 40.4buy alcohol at a hotel, restaurant, licensed Yes, asked once or twice 43.6store or supermarket, disco or dance, Yes, asked frequently 16.0*sporting event or bottle shop?
16-17 Years No, I have never been asked 40.1Yes, asked once or twice 43.3Yes, asked frequently 16.6*
All ages No, I have never been asked 40.3(12-17 Years) Yes, asked once or twice 43.4
Yes, asked frequently 16.3

32
from 20.1 per cent in 1996 to 12.8 per cent in 2002. The popularity of pre-mixed spirits among female students is evident (Table 8). In 2002, almost a half (46.8%) of recent drinkers expressed a preference for spirits, 36.6 per cent reported a preference for premixed spirits and 30.4 per cent reported a preference for ordinary beer. The order of preference for harmful drinkers was similar, with 58.2 per cent reporting a preference for spirits, 41.3 per cent reporting a preference for premixed spirits and 30 per cent reporting a preference for ordinary beer. Table 8: Type of alcohol preferred by students, ACT 1996, 1999 & 2002 (%).
Source: 1996, 1999 & 2002 ASSAD, confidential unit record files, ACT Health. *Previously included as ‘alcoholic sodas’.
Places where alcohol was consumed Students who reported that they had consumed alcohol at least once in their lifetime were asked where they had consumed their last drink. Students aged 12 to 15 years were most likely to report that they had consumed their last drink at home (49.9%), or at a party, function or at the home of an adult other than their parents (23.5%). Other locations reported by students are presented in Figure 9. Figure 9: Places where students reported consuming their last alcoholic drink, 12-15 years of age, ACT 2002 (%).
Source: 2002 ASSAD, confidential unit record file, ACT Health. * Estimate has a relative standard error between 25 and 50% and should be interpreted with caution. ** Estimate has a relative standard error greater than 50% and is considered unreliable for general use. The majority of 16 to 17 year olds reported consuming alcohol at a party or other adults home (37%); at home (30.3%); with friends at home/in car or at work (19.2%); and at a hotel/restaurant (5.1%) (Figure 10).
Where had last drink - 12-15 years (%)
at school**
Party/celebration/other
function/other adults/relat ions
home24%
Dance venue/dance party/night club
4%
Hotel/bar/pub/tavern/RSL
club/restaurant4%
Beach/park/recreat ion area
5%
other **
at f riend's home/car/work
10%
at home50%
Sport ing event/club/public
place**
M a le 1 9 9 6 1 9 9 9 2 0 0 2O rd in a ry b e e r 4 2 4 2 .8 4 1 .4S p ir its 3 0 .5 3 5 .7 3 6 .7P re m ix e d s p ir its * * 2 2 .3W in e 2 0 .6 1 8 .2 1 8 .4L o w a lc o h o lic b e e r 1 0 .3 1 2 .6 1 0 .6F e m a le 1 9 9 6 1 9 9 9 2 0 0 2P re m ix e d s p ir its * * 4 2 .2S p ir its 3 1 .9 3 5 .9 3 0 .7W in e 2 1 .2 2 4 .2 1 8 .8O rd in a ry b e e r 2 0 .1 1 5 .9 1 2 .8L iq u e u rs 1 3 .2 1 2 .7 1 1 .1
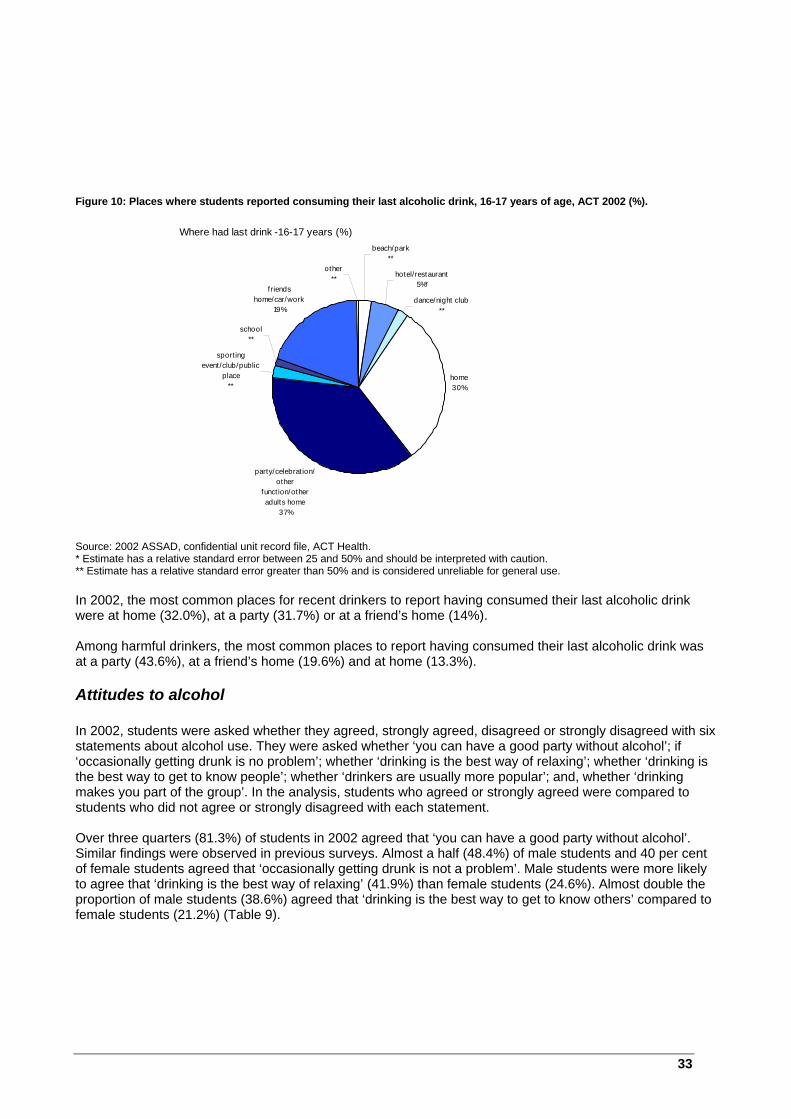
33
Figure 10: Places where students reported consuming their last alcoholic drink, 16-17 years of age, ACT 2002 (%).
Source: 2002 ASSAD, confidential unit record file, ACT Health. * Estimate has a relative standard error between 25 and 50% and should be interpreted with caution. ** Estimate has a relative standard error greater than 50% and is considered unreliable for general use. In 2002, the most common places for recent drinkers to report having consumed their last alcoholic drink were at home (32.0%), at a party (31.7%) or at a friend’s home (14%). Among harmful drinkers, the most common places to report having consumed their last alcoholic drink was at a party (43.6%), at a friend’s home (19.6%) and at home (13.3%).
Attitudes to alcohol In 2002, students were asked whether they agreed, strongly agreed, disagreed or strongly disagreed with six statements about alcohol use. They were asked whether ‘you can have a good party without alcohol’; if ‘occasionally getting drunk is no problem’; whether ‘drinking is the best way of relaxing’; whether ‘drinking is the best way to get to know people’; whether ‘drinkers are usually more popular’; and, whether ‘drinking makes you part of the group’. In the analysis, students who agreed or strongly agreed were compared to students who did not agree or strongly disagreed with each statement. Over three quarters (81.3%) of students in 2002 agreed that ‘you can have a good party without alcohol’. Similar findings were observed in previous surveys. Almost a half (48.4%) of male students and 40 per cent of female students agreed that ‘occasionally getting drunk is not a problem’. Male students were more likely to agree that ‘drinking is the best way of relaxing’ (41.9%) than female students (24.6%). Almost double the proportion of male students (38.6%) agreed that ‘drinking is the best way to get to know others’ compared to female students (21.2%) (Table 9).
Where had last drink -16-17 years (%)
home30%
friends home/car/work
19%
party/celebrat ion/other
funct ion/other adults home
37%
sport ing event/club/public
place**
school**
dance/night club**
hotel/ restaurant5%*
other**
beach/park**

34
Table 9: Attitudes to drinking, per cent agreeing or strongly agreeing, by sex, ACT 1996, 1999 & 2002 (%).
Source: 1996, 1999 & 2002 ASSAD, confidential unit record files, ACT Health. The proportion of students – male students in particular - reporting that ‘drinking makes you part of the group’ increased significantly between 1999 and 2002 (p=0.000), while the proportion of students agreeing that ‘drinking is the best way of relaxing’ (p=0.048) and ‘occasionally getting drunk is no problem’ (p=0.002) decreased significantly between 1999 and 2002. Older students (16 to 17 years) were more likely to agree or strongly agree with statements playing down the risks associated with alcohol than younger students (12 to 15 years). For instance, 57.2 per cent of students aged 16 to 17 years agreed or strongly agreed that ‘occasionally getting drunk is no problem’, compared to 38.2 per cent of students aged 12 to 15 years, and older students (38.2%) were more likely to agree or strongly agree that ‘drinking is the best way to get to know people’ than younger students (25.9%). Recent harmful drinkers were also more likely to agree or strongly agree with statements playing down the risks associated with alcohol than all recent drinkers in 2002. For instance, 75.3 per cent of harmful drinkers agreed or strongly agreed that ‘occasionally getting drunk is no problem’, compared to 67.8 per cent of all recent drinkers, and harmful drinkers (64.9%) were more likely to agree or strongly agree that ‘drinking is the best way to get to know people’ than all recent drinkers (51.0%). Students were also asked about the level of danger they perceived for themselves in having five or more drinks of beer, wine or spirits in a row. Students were asked to rank this level of alcohol consumption in terms of perceived levels of danger, on a three-point scale (‘not dangerous’, ‘a little dangerous’, ‘very dangerous’). In the analysis, students who perceived this level of drinking as ‘very dangerous’ were compared to those who opted for lower levels of danger. Perceptions of danger associated with five or more drinks differed between age groups and between males and females. Although 39.9 per cent of all students reported that they perceived this level of alcohol consumption as ‘very dangerous’ in 2002, only 29.3 per cent of students aged 16 to 17 years perceived this as ‘very dangerous’, compared to 45.0 per cent of students aged 12 to 15 years (Table 10). Similarly, 34.5 per cent of males perceived this level of alcohol consumption as ‘very dangerous’, compared to 45.0 per cent of females in 2002. About one in five (19.4%) recent drinkers perceived having five or more drinks of beer, wine or spirits in a row as ‘very dangerous’, compared to 15.1 per cent of harmful drinkers.
MALES 1996 1999 2002Agree or strongly agree that:You can have a good party without alcohol 79.6 74.0 74.8Occasionally getting drunk is no problem 43.5 52.6 48.4Drinking is the best way of relaxing 37.2 45.4 41.9Drinking is the best way to get to know people 34.3 42.6 38.6Drinkers are usually more popular 26.3 30.2 33.6Drinking makes you part of the group 13.2 14.9 30.3FEMALES 1996 1999 2002Agree or strongly agree that:You can have a good party without alcohol 86.3 81.9 87.8Occasionally getting drunk is no problem 43.1 47.1 40.4Drinkers are usually more popular 19.6 30.0 25.8Drinking is the best way of relaxing 24.3 27.4 24.6Drinking is the best way to get to know people 21.9 23.3 21.2Drinking makes you part of the group 6.1 10.2 16.4

35
Table 10: Level of perceived danger in having five or more drinks of beer, wine or spirits in a row, by age group, ACT 1996,
1999 & 2002 (%).
Source: 1996, 1999 & 2002 ASSAD, confidential unit record files, ACT Health. * Estimate has a relative standard error between 25 and 50% and should be interpreted with caution.
Education in class on alcohol In 2002, 80.7 per cent of students surveyed recalled receiving at least part of a lesson in class on alcohol in the previous year (Table 11). The proportion of students receiving lessons on alcohol varied significantly with age, ranging from 72.8 per cent of 12 year olds to 87.5 per cent of 15 year olds (p=0.001). The proportion of students recalling a lesson was highest among students 14 to 16 years of age. Overall, the proportion of students who recalled having received at least part of a lesson on alcohol was similar for the three survey years. However, reported education in class on alcohol has decreased significantly among 12 to 13 year olds since 1996 and increased significantly among students 14 to 17 years of age (p=0.001). Table 11: Received at least part of a lesson in class on alcohol by age and year, ACT 1996, 1999 & 2002 (%).
Source: 1996, 1999 & 2002 ASSAD, confidential unit record files, ACT Health. The results for recent and harmful drinkers in 2002 were very similar to the results for all students, with 83.9 per cent of recent drinkers and 84.3 per cent of harmful drinkers reporting at least part of a lesson in class in the previous year.
1996 1999 200212-15 Years Not dangerous 8.9 11.3 11.1
A little dangerous 34.7 39.6 38.2Very dangerous 47.9 41.8 45.0Don't know 8.5 7.3 5.6*
16-17 Years Not dangerous 20.0 23.4 20.6A little dangerous 45.9 47.5 46.5Very dangerous 30.6 25.9 29.3Don't know 3.6* 3.3* 3.6*
All ages Not dangerous 12.3 15.2 14.2(12-17 Years) A little dangerous 38.2 42.1 40.9
Very dangerous 42.5 36.6 39.9Don't know 7.0 6.0 5.0
AGE 12 13 14 15 16 17 TotalDuring 2002 72.8 74.7 86.1 87.5 86.5 75.8 80.7During 1999 74.3 77.3 83.3 83.2 84.1 66.9 78.3During 1996 76.4 81.4 80.1 73.9 78.4 63.7 76.1
36
Tobacco use by ACT secondary students Key results: In 2002, nearly half (45.9%) of all students surveyed reported having used tobacco at least once in their
lifetime; 31.8 per cent reported use of tobacco in the last 12 months; 17.6 per cent of students reported use of tobacco in the last month and 15.3 per cent in the last week (recent, or current tobacco use).
There was a significant decrease in the proportion of students reporting lifetime use of tobacco, use of tobacco in the last 12 months, the last four weeks and the last week, between 1996 and 2002.
In 2002, older students (16 to 17 years) were more likely to be recent, or current smokers than younger students (12 to 15 years), although the proportion of older students who were recent, or current smokers decreased significantly between 1996 and 2002.
Females were more likely to be recent, or current smokers than males, although the proportion of females who were recent, or current smokers decreased significantly between 1996 and 2002.
Almost a quarter (23.7%) of recent, or current smokers in 2002 described themselves as ‘heavy’ smokers.
The median number of cigarettes smoked by recent, or current smokers was 12, the median for students who described themselves as ‘heavy smokers’ in the week prior to the 2002 survey, was 70 cigarettes. Older students were more likely to report smoking more cigarettes than younger students.
The proportion of recent, or current smokers who purchased their last cigarette from a retailer decreased significantly between 1996 (25.8%) and 2002 (19.1%). In 2002, 22.5 per cent of ‘heavy smokers’ purchased their last cigarette from a retailer.
The majority of recent or current smokers who did not purchase their last cigarette from a retailer obtained their last cigarette from friends (36.5%), or they asked someone to purchase their last cigarette for them (21%), or were given their last cigarette by parents or siblings (13.4%).
More than a third (37.8%) of students who had ever tried to purchase cigarettes from a retailer reported never being refused cigarettes by a retailer, and more than a third (36.7%) of all students who had ever tried to purchase cigarettes from a retailer reported never having been asked for proof of age by a retailer.
The proportion of recent or current smokers who had purchased a single cigarette or cigarettes that were not in a packet (either from a retailer, friend, adult etc), in the four weeks prior to survey, increased significantly from 21.3% in 1996 to 40.4% in 2002.
Students who had ever tried smoking reported that they usually smoked at dance venues, dance parties and nightclubs (14.6%); at parties (13.8%); at my friends home (10.8%); at my home (9.9%); and about one in ten (10.8%) reported that they usually smoked on school grounds during school hours.
Males, younger students (12 to 15 years) and ‘heavy smokers’ were more likely than their counterparts to regard smokers as popular or mature and play down the dangers associated with smoking and exposure to environmental tobacco smoke.
The majority (83.7%) of ‘heavy smokers’ indicated that they were likely to be smoking in 12 months, compared to almost a half (46.3%) of recent, or current smokers.
There was a significant increase in the proportion of students who recalled having received at least part of a lesson on smoking in the previous year, between 1996 and 2002.
Use of tobacco In 2002, 45.9 per cent of secondary students in the ACT reported having used tobacco at least once in their lifetime, with similar results observed for males (44.9%) and females (46.9%). These proportions equate to an estimated 12,890 secondary students in the ACT (6,430 males and 6,460 females). The reported lifetime use of tobacco increased significantly with age in 2002. (p=0.000) (Figure 11).
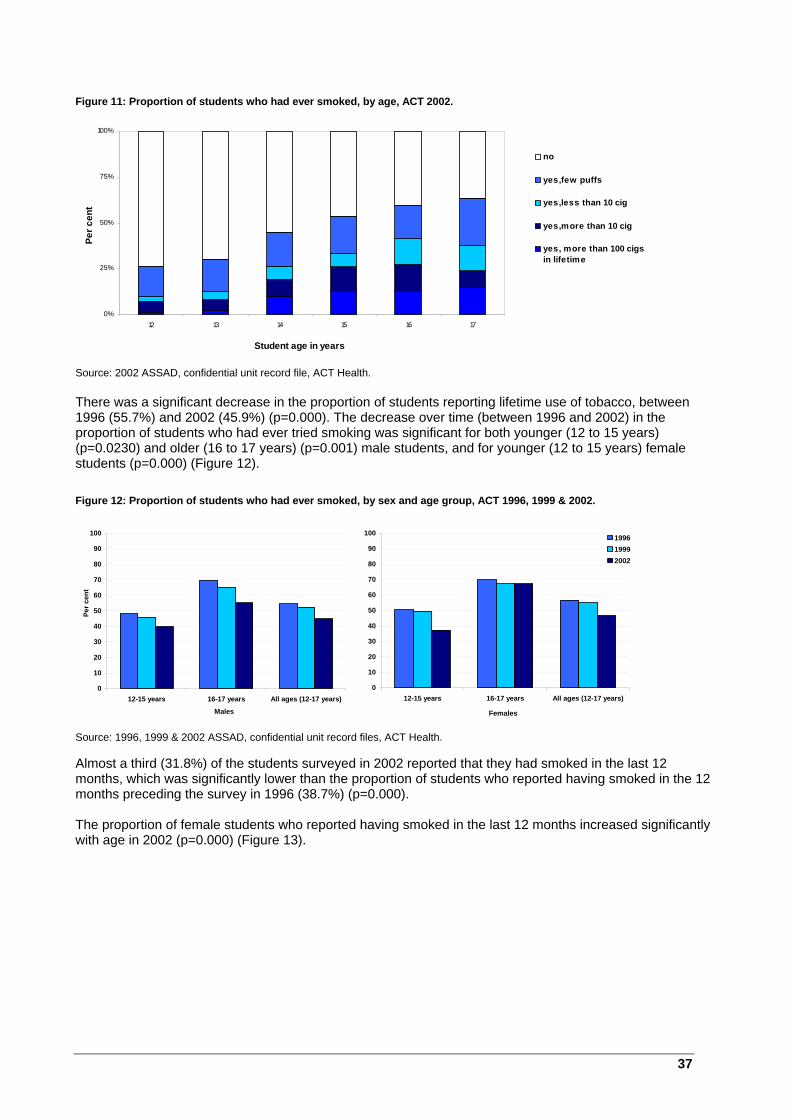
37
Figure 11: Proportion of students who had ever smoked, by age, ACT 2002.
Source: 2002 ASSAD, confidential unit record file, ACT Health. There was a significant decrease in the proportion of students reporting lifetime use of tobacco, between 1996 (55.7%) and 2002 (45.9%) (p=0.000). The decrease over time (between 1996 and 2002) in the proportion of students who had ever tried smoking was significant for both younger (12 to 15 years) (p=0.0230) and older (16 to 17 years) (p=0.001) male students, and for younger (12 to 15 years) female students (p=0.000) (Figure 12). Figure 12: Proportion of students who had ever smoked, by sex and age group, ACT 1996, 1999 & 2002.
Source: 1996, 1999 & 2002 ASSAD, confidential unit record files, ACT Health. Almost a third (31.8%) of the students surveyed in 2002 reported that they had smoked in the last 12 months, which was significantly lower than the proportion of students who reported having smoked in the 12 months preceding the survey in 1996 (38.7%) (p=0.000). The proportion of female students who reported having smoked in the last 12 months increased significantly with age in 2002 (p=0.000) (Figure 13).
0
10
20
30
40
50
60
70
80
90
100
12-15 years 16-17 years All ages (12-17 years)
Males
Per c
ent
0
10
20
30
40
50
60
70
80
90
100
12-15 years 16-17 years All ages (12-17 years)
Females
199619992002
0%
25%
50%
75%
100%
12 13 14 15 16 17
Student age in years
Per c
ent
no
yes,few puffs
yes,less than 10 cig
yes,more than 10 cig
yes, more than 100 cigsin lifetime

38
Figure 13: Proportion of students who had smoked in the last 12 months, by age and sex, ACT 1996, 1999 & 2002.
Source: 1996, 1999 & 2002 ASSAD, confidential unit record files, ACT Health. * Estimate has a relative standard error between 25 and 50% and should be interpreted with caution. ** Estimate has a relative standard error greater than 50% and is considered unreliable for general use. About 18 per cent of the students surveyed in 2002 reported that they had smoked in the last four weeks, which was significantly lower than the proportion of students who reported having smoked in the last four weeks preceding the survey in 1996 (24.6%) (p=0.000). Older (16 to 17 years) male (20.9%) students were significantly more likely to report having smoked in the last four weeks than younger male (14.8%) students (p=0.021) and older female (25.3%) students were significantly more likely to report having smoked in the last four weeks than younger female (15.2%) students in 2002 (p=0.009) (Figure 14). Figure 14: Proportion of students who had smoked in the last four weeks, by age group and sex, ACT 1996, 1999 & 2002.
Source: 1996, 1999 & 2002 ASSAD, confidential unit record files, ACT Health.
Recent, or current use of tobacco Overall, 15.3 per cent of all students (14.6% males, 16.0% females) reported current, or recent use of tobacco in 2002 (ie. they had smoked in the week prior to the survey). Students aged 16 to 17 years (17.8%) were significantly more likely to report recent use of tobacco than students aged 12 to 15 years (14.1%) (p=0.039). The proportion of students reporting that they had smoked in the week prior to survey decreased significantly between 1996 (20.4%) and 2002(15.3%) (p=0.000). Most of this decrease was due to significant reductions in recent tobacco use among female students between 1996 (24%) and 2002 (16%) (p=0.000) (Figure 15), and significant reductions among students 16 to 17 years of age (28.6% in 1996 and 17.8% in 2002) (p=0.000).
* **
*
0
10
20
30
40
50
60
70
80
90
100
12 years 13 years 14 years 15 years 16 years 17 years
Males
Per c
ent
* * *
**0
10
20
30
40
50
60
70
80
90
100
12 years 13 years 14 years 15 years 16 years 17 years
Females
1996
1999
2002
0
5
10
15
20
25
30
35
40
45
50
12-15 years 16-17 years All ages (12-17 years)
Males
Per c
ent
0
5
10
15
20
25
30
35
40
45
50
12-15 years 16-17 years All ages (12-17 years)
Females
1996
1999
2002

39
Figure 15: Proportion of students who had smoked in the last week, by age group and sex, ACT 1996, 1999 & 2002.
Source: 1996, 1999 & 2002 ASSAD, confidential unit record files, ACT Health.
Self-described smoking status Students were asked to describe their smoking status. The majority of all students surveyed in 2002 described themselves as being either ‘non-smokers’ (77.8%), or ‘ex-smokers’ (4.9%). Less than one in five (17.3%) of all students surveyed described themselves as a smoker. Among students who reported smoking in the week prior to the 2002 survey (recent, or current smokers), 13.3 per cent described themselves as either a ‘non-smoker’, or an ‘ex-smoker’. Almost two thirds (63%) described themselves as either a ‘light smoker’ or ‘occasional smoker’, and about a quarter (23.7%) described themselves as a ‘heavy smoker’ (Figure 16). Figure 16: Recent, or current smoker's self-described smoking status, ACT 2002 (%).
Source: 2002 ASSAD, confidential unit record file, ACT Health. * Estimate has a relative standard error between 25 and 50% and should be interpreted with caution. The students who described themselves as ‘heavy smokers’ were more likely to smoke more cigarettes, more likely to have tried purchasing cigarettes from a retailer and were more likely to indicate they would likely be smoking in 12 months time, than other recent or current smokers.
Source of tobacco Students who reported recent, or current tobacco use were asked where they had obtained their last cigarette. In 2002, the majority of recent, or current smokers indicated that they had not bought their last
0
5
10
15
20
25
30
35
40
45
50
12-15 years 16-17 years All ages (12-17 years)
Males
Per c
ent
0
5
10
15
20
25
30
35
40
45
50
12-15 years 16-17 years All ages (12-17 years)
Females
1996
1999
2002
heavy smoker23.7%
occasional smoker29.7%
light smoker33.3%
ex-smoker6.8*%
non-smoker6.5*%

40
cigarette from a retailer themselves (80.9%). A similar result was observed among recent, or current tobacco users who described themselves as ‘heavy smokers’ (77.5%). The most frequently reported sources of tobacco among recent, or current smokers were from friends who gave smokers a cigarette/s (36.5%); asking somebody to buy the cigarette/s for them (21.0%); obtaining cigarette/s from parents (7.5%) or siblings (5.9%); or taking the cigarette/s from home (6.5%). There was a significant decrease in the proportion of recent, or current smokers who reported buying their last cigarette themselves from a retailer, between 1996 (25.8%) and 2002 (19.1%) (p=0.006) (Figure 17). At the same time, there was a significant increase in the proportion of recent or current smokers who reported getting someone else to purchase their last cigarette for them, up from 15.7 per cent in 1996 to 21 per cent in 2002 (p=0.035). Figure 17: Proportion of recent or current smokers who bought their last cigarette from a retailer themselves, by age group, ACT 1996, 1999 & 2002 (%)
.
Source: 1996, 1999 & 2002 ASSAD, confidential unit record files, ACT Health. * Estimate has a relative standard error between 25 and 50% and should be interpreted with caution. Cigarettes that were purchased from retailers were most frequently purchased from supermarkets. In 2002, 5.6 per cent of all recent or current smokers reported buying their last cigarette from a supermarket (the results for other retail outlets were not reliable and are therefore not reported). Vending machines The survey also included a question about purchasing tobacco from vending machines. Recent or current smokers who reported purchasing their last cigarette were asked if they had bought their last cigarette from a vending machine. In 2002, almost all of the recent smokers (and ‘heavy smokers’) who had purchased their last cigarette indicated that they had not bought their last cigarette from a vending machine. The results for this question between 1996 and 2002 were consistent, with the majority of recent smokers indicating that they had not purchased from a vending machine, but the results were also statistically unreliable (RSE >50%) and for that reason, are not discussed or interpreted any further. Single cigarettes The proportion of recent or current smokers who had bought (from any source, including retailers, friends, relatives etc) a single cigarette or cigarettes that were not in a packet, in the four weeks prior to survey, increased significantly from 21.3 per cent in 1996 to 40.4 per cent in 2002 (p=0.000). Almost three quarters (73.5%) of recent or current smokers bought their last single cigarette, or cigarettes from a friend or relative in 2002 and about one in five (19.7%) bought the cigarette/s from another person. Only a very small number of respondents indicated that they bought their last single cigarette, or cigarettes, from a shop (the figure was too small to allow us to reliably estimate how many students had bought their last single cigarette/s from a shop).
*
*
**
0
5
10
15
20
25
30
35
40
45
50
12-15 years 16-17 years All ages (12-17 years)
Per c
ent
1996
19992002
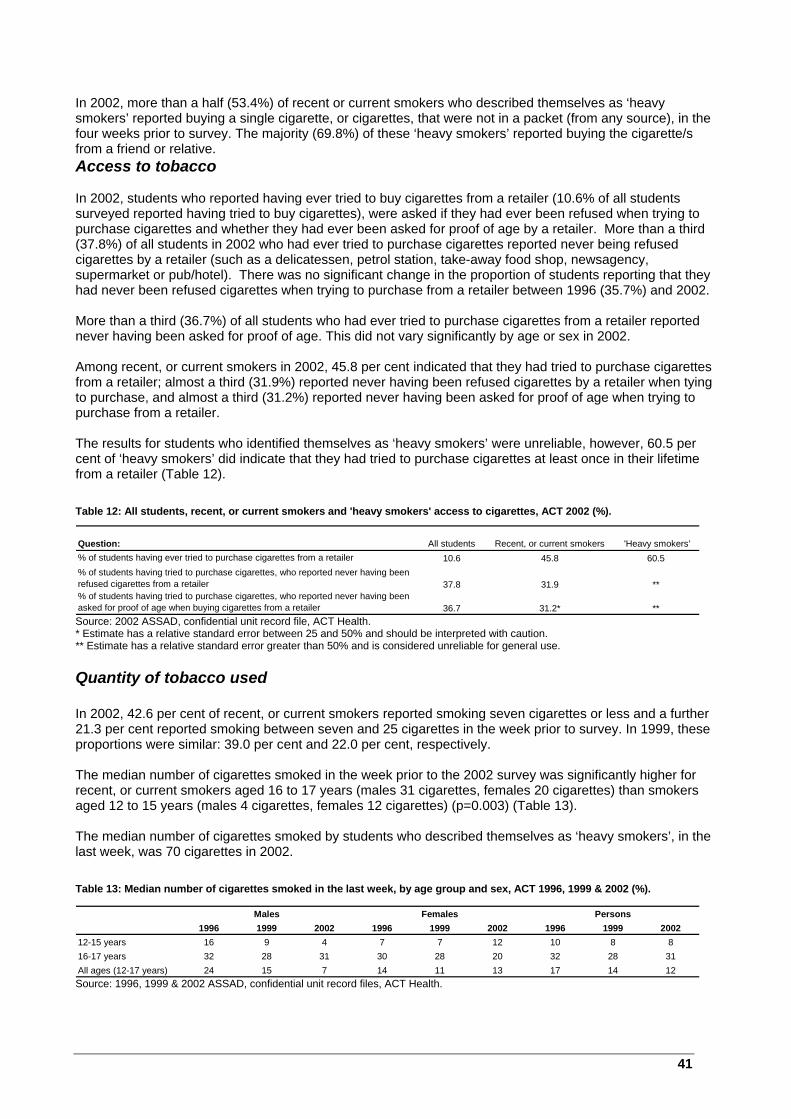
41
In 2002, more than a half (53.4%) of recent or current smokers who described themselves as ‘heavy smokers’ reported buying a single cigarette, or cigarettes, that were not in a packet (from any source), in the four weeks prior to survey. The majority (69.8%) of these ‘heavy smokers’ reported buying the cigarette/s from a friend or relative. Access to tobacco In 2002, students who reported having ever tried to buy cigarettes from a retailer (10.6% of all students surveyed reported having tried to buy cigarettes), were asked if they had ever been refused when trying to purchase cigarettes and whether they had ever been asked for proof of age by a retailer. More than a third (37.8%) of all students in 2002 who had ever tried to purchase cigarettes reported never being refused cigarettes by a retailer (such as a delicatessen, petrol station, take-away food shop, newsagency, supermarket or pub/hotel). There was no significant change in the proportion of students reporting that they had never been refused cigarettes when trying to purchase from a retailer between 1996 (35.7%) and 2002. More than a third (36.7%) of all students who had ever tried to purchase cigarettes from a retailer reported never having been asked for proof of age. This did not vary significantly by age or sex in 2002. Among recent, or current smokers in 2002, 45.8 per cent indicated that they had tried to purchase cigarettes from a retailer; almost a third (31.9%) reported never having been refused cigarettes by a retailer when tying to purchase, and almost a third (31.2%) reported never having been asked for proof of age when trying to purchase from a retailer. The results for students who identified themselves as ‘heavy smokers’ were unreliable, however, 60.5 per cent of ‘heavy smokers’ did indicate that they had tried to purchase cigarettes at least once in their lifetime from a retailer (Table 12). Table 12: All students, recent, or current smokers and 'heavy smokers' access to cigarettes, ACT 2002 (%).
Source: 2002 ASSAD, confidential unit record file, ACT Health. * Estimate has a relative standard error between 25 and 50% and should be interpreted with caution. ** Estimate has a relative standard error greater than 50% and is considered unreliable for general use.
Quantity of tobacco used In 2002, 42.6 per cent of recent, or current smokers reported smoking seven cigarettes or less and a further 21.3 per cent reported smoking between seven and 25 cigarettes in the week prior to survey. In 1999, these proportions were similar: 39.0 per cent and 22.0 per cent, respectively. The median number of cigarettes smoked in the week prior to the 2002 survey was significantly higher for recent, or current smokers aged 16 to 17 years (males 31 cigarettes, females 20 cigarettes) than smokers aged 12 to 15 years (males 4 cigarettes, females 12 cigarettes) (p=0.003) (Table 13). The median number of cigarettes smoked by students who described themselves as ‘heavy smokers’, in the last week, was 70 cigarettes in 2002. Table 13: Median number of cigarettes smoked in the last week, by age group and sex, ACT 1996, 1999 & 2002 (%).
Source: 1996, 1999 & 2002 ASSAD, confidential unit record files, ACT Health.
Males Females Persons1996 1999 2002 1996 1999 2002 1996 1999 2002
12-15 years 16 9 4 7 7 12 10 8 816-17 years 32 28 31 30 28 20 32 28 31All ages (12-17 years) 24 15 7 14 11 13 17 14 12
Question: All students Recent, or current smokers 'Heavy smokers' % of students having ever tried to purchase cigarettes from a retailer 10.6 45.8 60.5% of students having tried to purchase cigarettes, who reported never having been refused cigarettes from a retailer 37.8 31.9 **% of students having tried to purchase cigarettes, who reported never having been asked for proof of age when buying cigarettes from a retailer 36.7 31.2* **

42
Preferred Brands The preferred cigarette packet size reported by recent, or current smokers was 25’s for both males (45.0%) and females (39.5%) in 2002. This was followed by packs of 20 for males (32.9%) and females (24.4%). Younger students between 12 and 15 years (40%) and older students between 16 and 17 years (46.2%) also reported a preference for 25’s, followed by packs of 20 (32.2% for students 12 to 15 years and 22.6% for students 16 to 17 years). Among students who described themselves as ‘heavy smokers’ in 2002, the preferred cigarette packet size was also 25’s (49.5%) (the order of preference for other pack sizes by ‘heavy smokers’ is not discussed here as the results were not reliable for the ACT in 2002). The top five preferred cigarette brands for recent, or current smokers were Winfield; Peter Jackson; Longbeach; Benson & Hedges and Dunhill. Preferences for the Winfield brand cigarettes increased significantly among current, or recent smokers between 1996 (22.2%) and 2002 (42.9%) (p=0.037) In comparison, preference for the Peter Jackson brand of cigarettes declined significantly between 1996 (49.7%) and 2002 (24.3%) (p=0.012). These trends were observed among both males and females (Table 14). The preferred brands of cigarettes reported by students who described themselves as ‘heavy smokers’ in 2002 were very similar, with Winfield the preferred brand, followed by Longbeach, Benson & Hedges, Dunhill and Peter Jackson. Table 14: Recent, or current smokers' preferred brands of cigarettes, by sex, ACT 1996, 1999 & 2002 (%).
Source: 1996, 1999 & 2002 ASSAD, confidential unit record files, ACT Health. * Estimate has a relative standard error between 25 and 50% and should be interpreted with caution. ** Estimate has a relative standard error greater than 50% and is considered unreliable for general use. Places where students usually smoke In 2002, students who had tried smoking were asked where they usually smoked. Students were most likely to report that they usually smoked at a dance venue/dance party/nightclub (14.6%), followed by a party (13.8%), on school grounds during school hours (10.8%), at a friend’s home (10.8%), at home (9.9%), or at a park or recreation area (9.9%) (Figure 18). The order of preference was very similar for recent, or current smokers and for students who described themselves as ‘heavy smokers’.
Males 1996 1999 2002Winfield 28.5 34.0 45.5Longbeach ** 14.7* 30.7*Benson & Hedges 10.1* 20.1* 21.3*Peter Jackson 43.4 42.2 17.8*Dunhill ** 15.8* 15.7*Females 1996 1999 2002Winfield 17.8 34.4 40.2Peter Jackson 54.1 40.0 31.1*Longbeach 5.8* 9.7* 16.7*Benson & Hedges 9.5* 17.1* 13.0*Dunhill ** 7.4* 12.7*Persons 1996 1999 2002Winfield 22.2 34.2 42.9Peter Jackson 49.7 41.0 24.3Longbeach 5.9* 12.0* 23.8Benson & Hedges 9.7* 18.5 17.2*Dunhill 3.5* 11.2* 14.2*

43
Figure 18: Places students usually smoke, ACT 2002 (%).
Source: 2002 ASSAD, confidential unit record file, ACT Health. * Estimate has a relative standard error between 25 and 50% and should be interpreted with caution.
Attitudes to smoking In 2002, students were asked whether they agreed, strongly agreed, disagreed or strongly disagreed with three statements about smoking. They were asked whether ‘passive smoking can affect your health’; whether ‘smokers are usually more popular’; and, whether ‘smokers are usually more mature’. In the analysis, students who agreed or strongly agreed were compared to students who did not agree, or strongly disagreed. Females (92.7%) were significantly more likely than males (83.8%) to agree that ‘passive smoking can affect your health’ (p=0.000) (Table 15). Older students (16 to 17 years) (90.6%) were also significantly more likely than younger students (12 to 15 years) (87.2%) to agree that ‘passive smoking can affect your health’ (p=0.040). Although 86.8 per cent of recent, or current smokers agreed, or strongly agreed that ‘passive smoking can affect your health’, only 63.3 per cent of students who described themselves as ‘heavy smokers’ agreed that ‘passive smoking can affect your health’. The proportion of students who agreed that ‘smokers are usually more popular’ has decreased significantly since 1999 (35.1%), with just over one quarter (28.3%) of all students agreeing that ‘smokers are usually more popular’ in 2002 (p=0.001). Although there was no significant difference between the sexes in 2002 (males 31.4%; females 25.3%), younger students (12 to 15 years) (30.9%) were significantly more likely to agree that ‘smokers are usually more popular’ than older students (16 to 17 years) (22.8%) (p=0.000). A greater proportion of recent, or current smokers (39%) and ‘heavy smokers’ (41.1%) agreed that ‘smokers are usually more popular’, in 2002. The proportion of students who agreed that ‘smokers are usually more mature’ did not change significantly between 1996, 1999 and 2002. In 2002, however, younger students (12 to 15 years) (10.6%) were significantly more likely to agree that ‘smokers are usually more mature’ than older students (16 to 17 years) (5.1%) (p=0.028).
Other30.2%
At my friend's home 10.8% *
On school grounds during school hours
10.8% *
At a party 13.8% *
At my home 9.9% *
At a dance venue/ dance
party/night club 14.6% *
At a park or recreation area
9.9% *
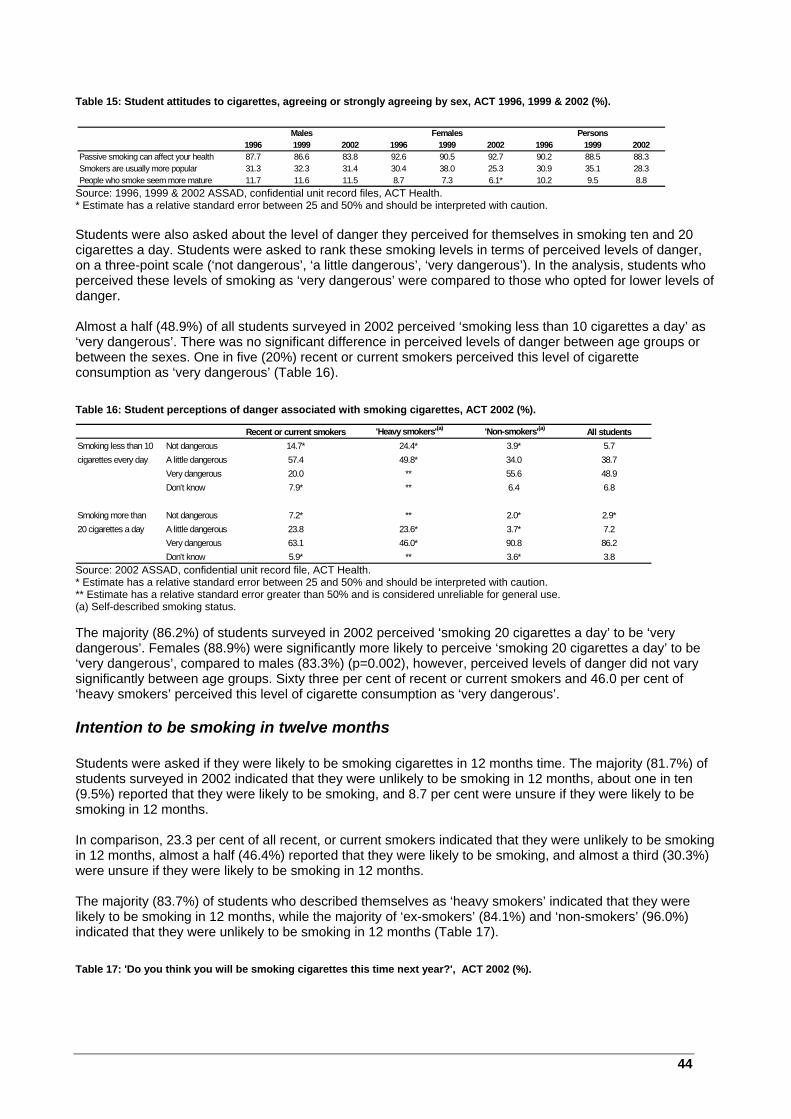
44
Table 15: Student attitudes to cigarettes, agreeing or strongly agreeing by sex, ACT 1996, 1999 & 2002 (%).
Source: 1996, 1999 & 2002 ASSAD, confidential unit record files, ACT Health. * Estimate has a relative standard error between 25 and 50% and should be interpreted with caution. Students were also asked about the level of danger they perceived for themselves in smoking ten and 20 cigarettes a day. Students were asked to rank these smoking levels in terms of perceived levels of danger, on a three-point scale (‘not dangerous’, ‘a little dangerous’, ‘very dangerous’). In the analysis, students who perceived these levels of smoking as ‘very dangerous’ were compared to those who opted for lower levels of danger. Almost a half (48.9%) of all students surveyed in 2002 perceived ‘smoking less than 10 cigarettes a day’ as ‘very dangerous’. There was no significant difference in perceived levels of danger between age groups or between the sexes. One in five (20%) recent or current smokers perceived this level of cigarette consumption as ‘very dangerous’ (Table 16). Table 16: Student perceptions of danger associated with smoking cigarettes, ACT 2002 (%).
Source: 2002 ASSAD, confidential unit record file, ACT Health. * Estimate has a relative standard error between 25 and 50% and should be interpreted with caution. ** Estimate has a relative standard error greater than 50% and is considered unreliable for general use. (a) Self-described smoking status. The majority (86.2%) of students surveyed in 2002 perceived ‘smoking 20 cigarettes a day’ to be ‘very dangerous’. Females (88.9%) were significantly more likely to perceive ‘smoking 20 cigarettes a day’ to be ‘very dangerous’, compared to males (83.3%) (p=0.002), however, perceived levels of danger did not vary significantly between age groups. Sixty three per cent of recent or current smokers and 46.0 per cent of ‘heavy smokers’ perceived this level of cigarette consumption as ‘very dangerous’.
Intention to be smoking in twelve months Students were asked if they were likely to be smoking cigarettes in 12 months time. The majority (81.7%) of students surveyed in 2002 indicated that they were unlikely to be smoking in 12 months, about one in ten (9.5%) reported that they were likely to be smoking, and 8.7 per cent were unsure if they were likely to be smoking in 12 months. In comparison, 23.3 per cent of all recent, or current smokers indicated that they were unlikely to be smoking in 12 months, almost a half (46.4%) reported that they were likely to be smoking, and almost a third (30.3%) were unsure if they were likely to be smoking in 12 months. The majority (83.7%) of students who described themselves as ‘heavy smokers’ indicated that they were likely to be smoking in 12 months, while the majority of ‘ex-smokers’ (84.1%) and ‘non-smokers’ (96.0%) indicated that they were unlikely to be smoking in 12 months (Table 17). Table 17: 'Do you think you will be smoking cigarettes this time next year?', ACT 2002 (%).
Males Females Persons1996 1999 2002 1996 1999 2002 1996 1999 2002
Passive smoking can affect your health 87.7 86.6 83.8 92.6 90.5 92.7 90.2 88.5 88.3Smokers are usually more popular 31.3 32.3 31.4 30.4 38.0 25.3 30.9 35.1 28.3People who smoke seem more mature 11.7 11.6 11.5 8.7 7.3 6.1* 10.2 9.5 8.8
Recent or current smokers 'Heavy smokers'(a) 'Non-smokers'(a) All studentsSmoking less than 10 Not dangerous 14.7* 24.4* 3.9* 5.7cigarettes every day A little dangerous 57.4 49.8* 34.0 38.7
Very dangerous 20.0 ** 55.6 48.9Don't know 7.9* ** 6.4 6.8
Smoking more than Not dangerous 7.2* ** 2.0* 2.9*20 cigarettes a day A little dangerous 23.8 23.6* 3.7* 7.2
Very dangerous 63.1 46.0* 90.8 86.2Don't know 5.9* ** 3.6* 3.8
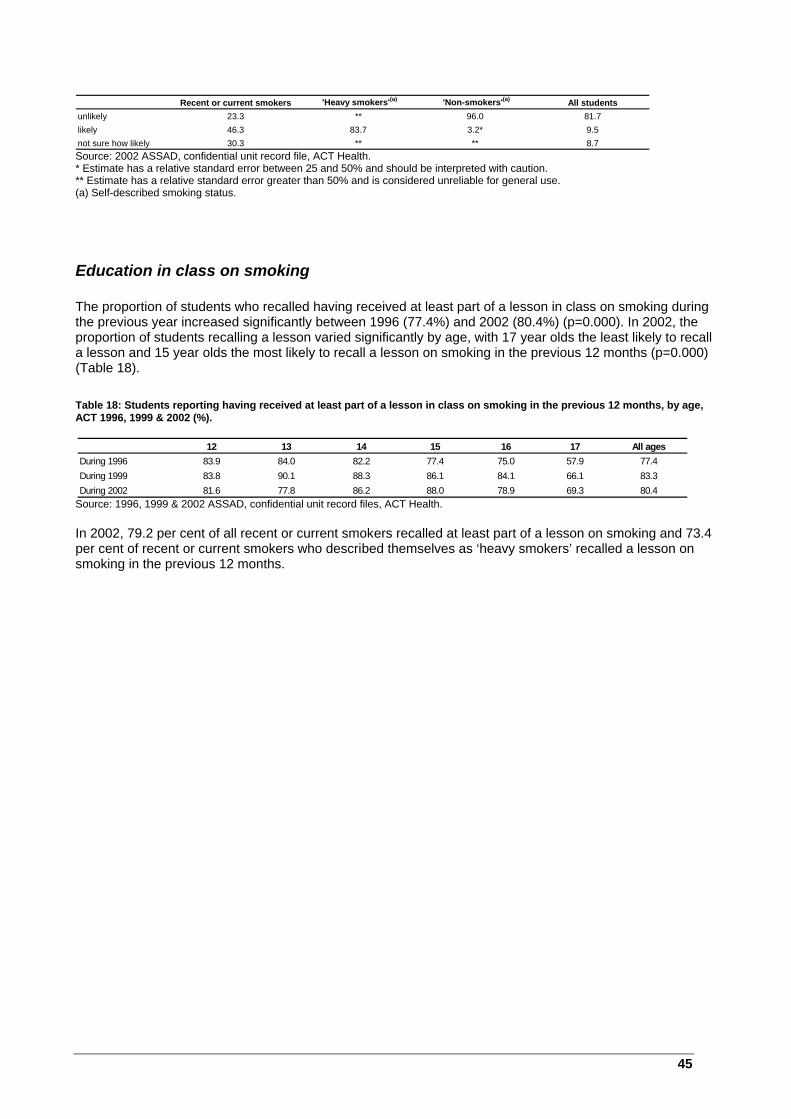
45
Source: 2002 ASSAD, confidential unit record file, ACT Health. * Estimate has a relative standard error between 25 and 50% and should be interpreted with caution. ** Estimate has a relative standard error greater than 50% and is considered unreliable for general use. (a) Self-described smoking status.
Education in class on smoking The proportion of students who recalled having received at least part of a lesson in class on smoking during the previous year increased significantly between 1996 (77.4%) and 2002 (80.4%) (p=0.000). In 2002, the proportion of students recalling a lesson varied significantly by age, with 17 year olds the least likely to recall a lesson and 15 year olds the most likely to recall a lesson on smoking in the previous 12 months (p=0.000) (Table 18). Table 18: Students reporting having received at least part of a lesson in class on smoking in the previous 12 months, by age, ACT 1996, 1999 & 2002 (%).
Source: 1996, 1999 & 2002 ASSAD, confidential unit record files, ACT Health. In 2002, 79.2 per cent of all recent or current smokers recalled at least part of a lesson on smoking and 73.4 per cent of recent or current smokers who described themselves as ‘heavy smokers’ recalled a lesson on smoking in the previous 12 months.
12 13 14 15 16 17 All agesDuring 1996 83.9 84.0 82.2 77.4 75.0 57.9 77.4During 1999 83.8 90.1 88.3 86.1 84.1 66.1 83.3During 2002 81.6 77.8 86.2 88.0 78.9 69.3 80.4
Recent or current smokers 'Heavy smokers'(a) 'Non-smokers'(a) All studentsunlikely 23.3 ** 96.0 81.7likely 46.3 83.7 3.2* 9.5not sure how likely 30.3 ** ** 8.7
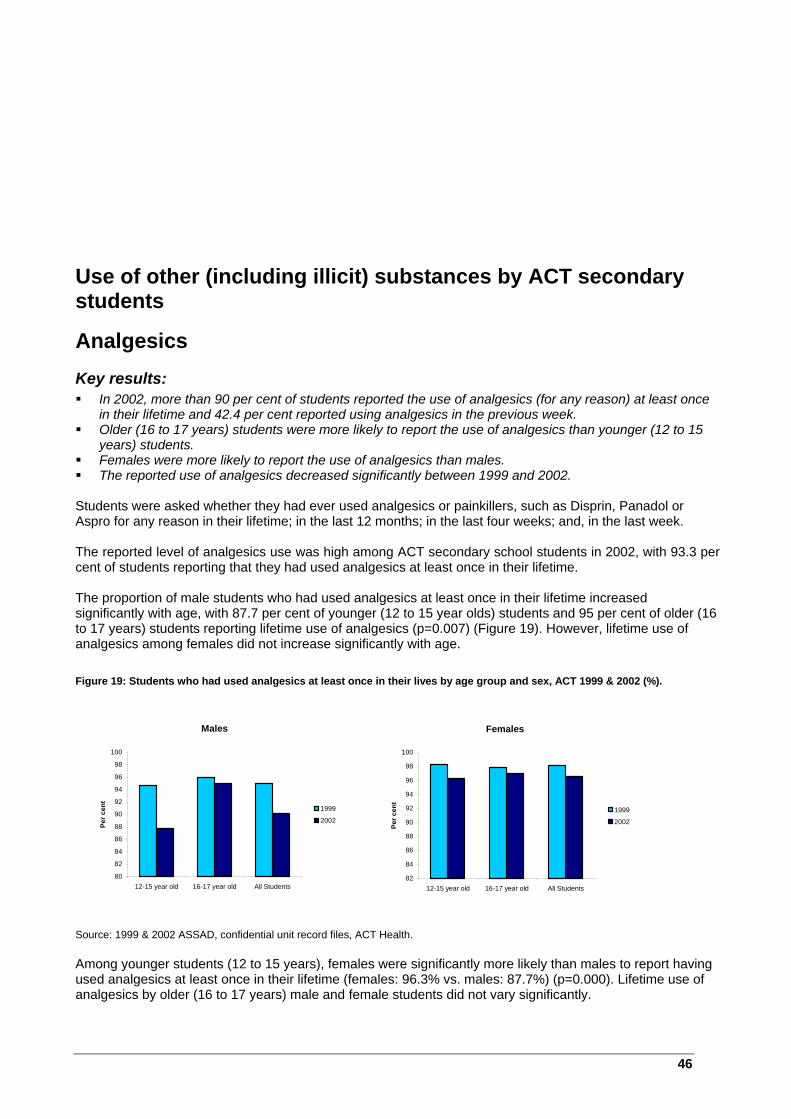
46
Use of other (including illicit) substances by ACT secondary students
Analgesics Key results: In 2002, more than 90 per cent of students reported the use of analgesics (for any reason) at least once
in their lifetime and 42.4 per cent reported using analgesics in the previous week. Older (16 to 17 years) students were more likely to report the use of analgesics than younger (12 to 15
years) students. Females were more likely to report the use of analgesics than males. The reported use of analgesics decreased significantly between 1999 and 2002.
Students were asked whether they had ever used analgesics or painkillers, such as Disprin, Panadol or Aspro for any reason in their lifetime; in the last 12 months; in the last four weeks; and, in the last week. The reported level of analgesics use was high among ACT secondary school students in 2002, with 93.3 per cent of students reporting that they had used analgesics at least once in their lifetime. The proportion of male students who had used analgesics at least once in their lifetime increased significantly with age, with 87.7 per cent of younger (12 to 15 year olds) students and 95 per cent of older (16 to 17 years) students reporting lifetime use of analgesics (p=0.007) (Figure 19). However, lifetime use of analgesics among females did not increase significantly with age. Figure 19: Students who had used analgesics at least once in their lives by age group and sex, ACT 1999 & 2002 (%).
Source: 1999 & 2002 ASSAD, confidential unit record files, ACT Health. Among younger students (12 to 15 years), females were significantly more likely than males to report having used analgesics at least once in their lifetime (females: 96.3% vs. males: 87.7%) (p=0.000). Lifetime use of analgesics by older (16 to 17 years) male and female students did not vary significantly.
Males
80
82
84
86
88
90
92
94
96
98
100
12-15 year old 16-17 year old All Students
Per c
ent
1999
2002
Females
82
84
86
88
90
92
94
96
98
100
12-15 year old 16-17 year old All Students
Per c
ent
1999
2002
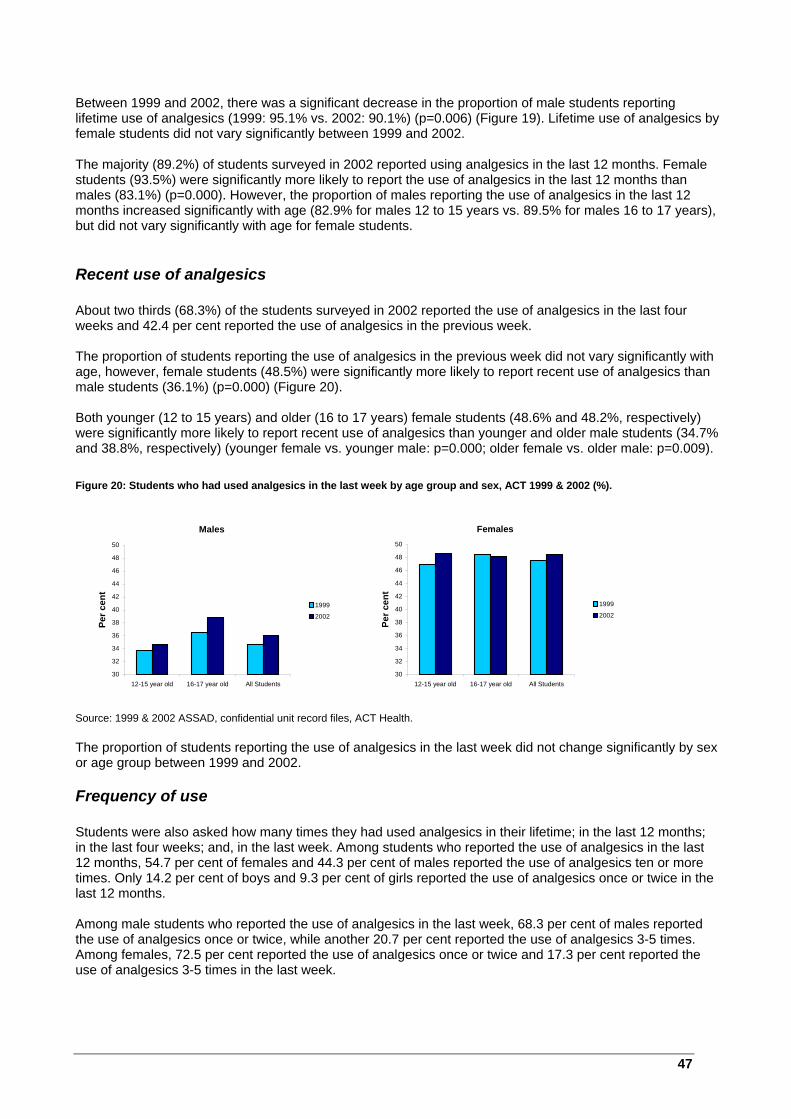
47
Between 1999 and 2002, there was a significant decrease in the proportion of male students reporting lifetime use of analgesics (1999: 95.1% vs. 2002: 90.1%) (p=0.006) (Figure 19). Lifetime use of analgesics by female students did not vary significantly between 1999 and 2002. The majority (89.2%) of students surveyed in 2002 reported using analgesics in the last 12 months. Female students (93.5%) were significantly more likely to report the use of analgesics in the last 12 months than males (83.1%) (p=0.000). However, the proportion of males reporting the use of analgesics in the last 12 months increased significantly with age (82.9% for males 12 to 15 years vs. 89.5% for males 16 to 17 years), but did not vary significantly with age for female students.
Recent use of analgesics About two thirds (68.3%) of the students surveyed in 2002 reported the use of analgesics in the last four weeks and 42.4 per cent reported the use of analgesics in the previous week. The proportion of students reporting the use of analgesics in the previous week did not vary significantly with age, however, female students (48.5%) were significantly more likely to report recent use of analgesics than male students (36.1%) (p=0.000) (Figure 20). Both younger (12 to 15 years) and older (16 to 17 years) female students (48.6% and 48.2%, respectively) were significantly more likely to report recent use of analgesics than younger and older male students (34.7% and 38.8%, respectively) (younger female vs. younger male: p=0.000; older female vs. older male: p=0.009). Figure 20: Students who had used analgesics in the last week by age group and sex, ACT 1999 & 2002 (%).
Source: 1999 & 2002 ASSAD, confidential unit record files, ACT Health. The proportion of students reporting the use of analgesics in the last week did not change significantly by sex or age group between 1999 and 2002.
Frequency of use Students were also asked how many times they had used analgesics in their lifetime; in the last 12 months; in the last four weeks; and, in the last week. Among students who reported the use of analgesics in the last 12 months, 54.7 per cent of females and 44.3 per cent of males reported the use of analgesics ten or more times. Only 14.2 per cent of boys and 9.3 per cent of girls reported the use of analgesics once or twice in the last 12 months. Among male students who reported the use of analgesics in the last week, 68.3 per cent of males reported the use of analgesics once or twice, while another 20.7 per cent reported the use of analgesics 3-5 times. Among females, 72.5 per cent reported the use of analgesics once or twice and 17.3 per cent reported the use of analgesics 3-5 times in the last week.
Males
30
32
34
36
38
40
42
44
46
48
50
12-15 year old 16-17 year old All Students
Per c
ent
1999
2002
Females
30
32
34
36
38
40
42
44
46
48
50
12-15 year old 16-17 year old All Students
Per c
ent
1999
2002
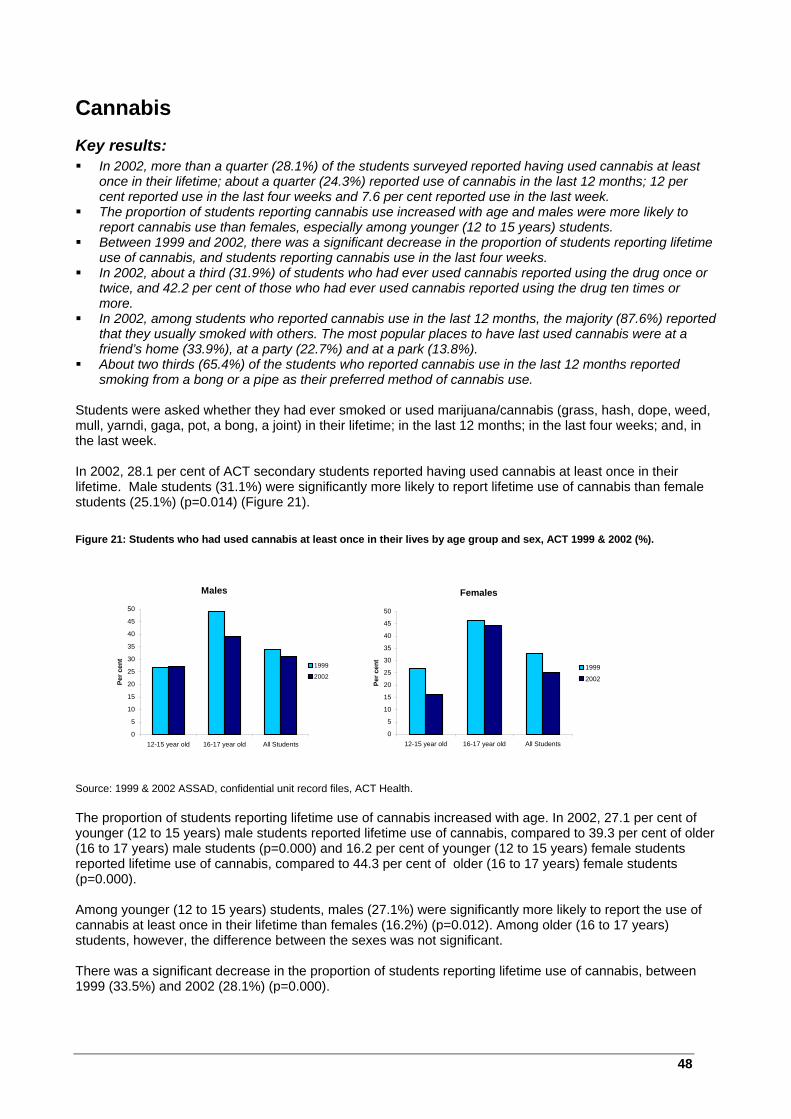
48
Cannabis Key results: In 2002, more than a quarter (28.1%) of the students surveyed reported having used cannabis at least
once in their lifetime; about a quarter (24.3%) reported use of cannabis in the last 12 months; 12 per cent reported use in the last four weeks and 7.6 per cent reported use in the last week.
The proportion of students reporting cannabis use increased with age and males were more likely to report cannabis use than females, especially among younger (12 to 15 years) students.
Between 1999 and 2002, there was a significant decrease in the proportion of students reporting lifetime use of cannabis, and students reporting cannabis use in the last four weeks.
In 2002, about a third (31.9%) of students who had ever used cannabis reported using the drug once or twice, and 42.2 per cent of those who had ever used cannabis reported using the drug ten times or more.
In 2002, among students who reported cannabis use in the last 12 months, the majority (87.6%) reported that they usually smoked with others. The most popular places to have last used cannabis were at a friend’s home (33.9%), at a party (22.7%) and at a park (13.8%).
About two thirds (65.4%) of the students who reported cannabis use in the last 12 months reported smoking from a bong or a pipe as their preferred method of cannabis use.
Students were asked whether they had ever smoked or used marijuana/cannabis (grass, hash, dope, weed, mull, yarndi, gaga, pot, a bong, a joint) in their lifetime; in the last 12 months; in the last four weeks; and, in the last week. In 2002, 28.1 per cent of ACT secondary students reported having used cannabis at least once in their lifetime. Male students (31.1%) were significantly more likely to report lifetime use of cannabis than female students (25.1%) (p=0.014) (Figure 21). Figure 21: Students who had used cannabis at least once in their lives by age group and sex, ACT 1999 & 2002 (%).
Source: 1999 & 2002 ASSAD, confidential unit record files, ACT Health. The proportion of students reporting lifetime use of cannabis increased with age. In 2002, 27.1 per cent of younger (12 to 15 years) male students reported lifetime use of cannabis, compared to 39.3 per cent of older (16 to 17 years) male students (p=0.000) and 16.2 per cent of younger (12 to 15 years) female students reported lifetime use of cannabis, compared to 44.3 per cent of older (16 to 17 years) female students (p=0.000). Among younger (12 to 15 years) students, males (27.1%) were significantly more likely to report the use of cannabis at least once in their lifetime than females (16.2%) (p=0.012). Among older (16 to 17 years) students, however, the difference between the sexes was not significant. There was a significant decrease in the proportion of students reporting lifetime use of cannabis, between 1999 (33.5%) and 2002 (28.1%) (p=0.000).
Males
0
5
10
15
20
25
30
35
40
45
50
12-15 year old 16-17 year old All Students
Per c
ent
1999
2002
Females
0
5
10
15
20
25
30
35
40
45
50
12-15 year old 16-17 year old All Students
Per c
ent
1999
2002

49
About a quarter (24.3%) of all students surveyed in 2002 reported using cannabis in the previous 12 months.
Recent use of cannabis In 2002, 12.0 per cent of ACT secondary students reported using cannabis in the last four weeks. Older (16 to 17 years) students (16.4%) were significantly more likely to report having used cannabis in the last four weeks than younger (12 to 15 years) students (9.9%) (p=0.001) (Figure 22). Younger (12 to 15 years) males (12.6%), in particular, were more likely to report the use of cannabis in the last four weeks than younger females (7.4%) (p=0.018). Among older (16 to 17 years) students, however, the difference between the sexes was not significant. Figure 22: Students who had used cannabis in the last four weeks by age group and sex, ACT 1999 & 2002 (%).
Source: 1999 & 2002 ASSAD, confidential unit record files, ACT Health. *Estimate has a relative standard error between 25 and 50% and should be interpreted with caution. There was a significant decrease in the proportion of students reporting use of cannabis in the last four weeks, between 1999 (16.2%) and 2002 (12.0%) (p=0.000). Less than one in ten (7.6%) students reported using cannabis in the week prior to the 2002 survey. The change in levels of reported use in the last week, between 1999 (8.8%) and 2002, was not significant, although the change in levels of reported use in the last week, between 1996 (10.7%) and 2002, was significant (p=0.000).
Frequency of use Students were also asked how many times they had smoked or used cannabis in their lifetime; in the last 12 months; in the last four weeks; and, in the last week. Among students who reported lifetime use of cannabis in 2002, almost a third (31.9%) indicated that they had only ever used cannabis once or twice in their lifetime. A further 42.2 per cent of students who reported lifetime use of cannabis indicated that they had used it ten times or more. Among students who reported using cannabis in the last four weeks, 41.2 per cent indicated that they had used it only once or twice. Almost a quarter (23.8%) of those students who reported use in the last four weeks indicated that they had used cannabis ten times or more in the last four weeks. Almost half (46.8%) of those students who reported using cannabis in the last week reported that they had used cannabis only once or twice. A quarter (25.3%) of those students who reported use in the last week indicated that they had used cannabis ten times or more in the last week.
Males
0
5
10
15
20
25
12-15 year old 16-17 year old All Students
Per c
ent
1999
2002
Females
*
*
0
5
10
15
20
25
12-15 year old 16-17 year old All Students
Per c
ent
1999
2002

50
Places where cannabis was used In 2002, a third (33.9%) of students who reported cannabis use in the previous 12 months indicated that they had last used cannabis at a friend’s home, 22.7 per cent indicated that they had last used cannabis at a party and 13.8 per cent indicated that they had last used cannabis in a park. The differences observed between age groups and between the sexes were not significant.
Preferred methods of using cannabis In 2002, about two thirds (65.4%) of the students who had used cannabis in the previous 12 months reported smoking from a bong or a pipe as their preferred method of cannabis use and a third (33.2%) reported a preference for smoking cannabis as a joint. Similar results were observed between age groups and between the sexes.
With whom students used cannabis In 2002, the majority (87.6%) of students who had used cannabis in the previous 12 months indicated that they usually smoked cannabis with others, rather than by themselves. Similar results were observed between age groups and between the sexes.
Inhalants Key results: In 2002, one in five (19.6%) students reported having deliberately sniffed inhalants at least once in their
lifetime, 13 per cent reported sniffing inhalants in the last 12 months, 8.6 per cent in the last four weeks and 6.2 per cent in the last week.
The proportion of students reporting deliberate sniffing of inhalants decreased as student age increased, in contrast to the pattern with other illicit substances.
There was a significant decrease in the proportion of students reporting lifetime use of inhalants, between 1999 (25.1%) and 2002 (19.6%).
In 2002, students were asked whether they had ever deliberately sniffed or inhaled from spray cans, or sniffed glue, paint, petrol or thinners, in their lifetime; in the last 12 months; in the last four weeks; and, in the last week. The question excluded sniffing white-out, liquid paper, textas and pens. One in five (19.6%) students surveyed in 2002 reported deliberately sniffing inhalants at least once in their lifetime. Although there was no significant difference in reported levels of use between the sexes, there was a significant difference in the proportion of students reporting lifetime use of inhalants between age groups. Younger (12 to 15 years) students (23.4%) were significantly more likely than older (16 to 17 years) students (11.6%) to report having ever deliberately sniffed inhalants (p=0.000) (Figure 23). Figure 23: Students who had used inhalants at least once in their lives by age group and sex, ACT 1999 & 2002 (%).
Males
*
0
5
10
15
20
25
30
35
12-15 year old 16-17 year old All Students
Per c
ent
1999
2002
Females
*
0
5
10
15
20
25
30
35
12-15 year old 16-17 year old All Students
Per c
ent
1999
2002
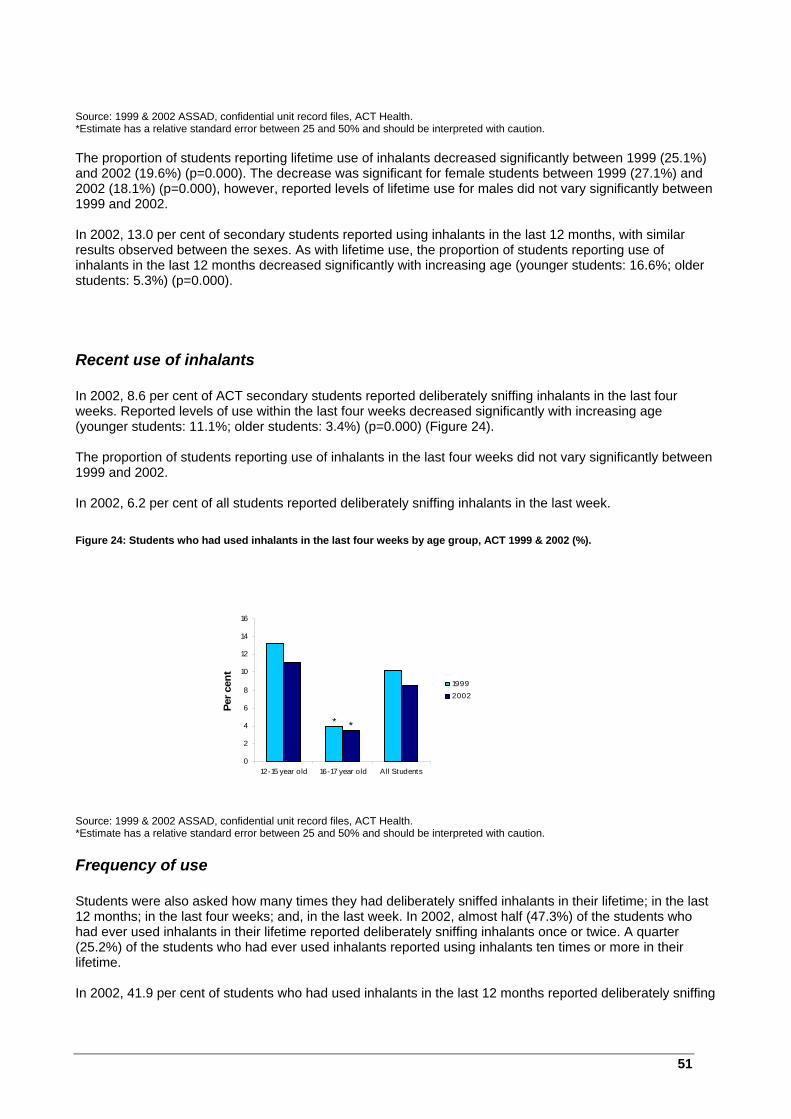
51
Source: 1999 & 2002 ASSAD, confidential unit record files, ACT Health. *Estimate has a relative standard error between 25 and 50% and should be interpreted with caution. The proportion of students reporting lifetime use of inhalants decreased significantly between 1999 (25.1%) and 2002 (19.6%) (p=0.000). The decrease was significant for female students between 1999 (27.1%) and 2002 (18.1%) (p=0.000), however, reported levels of lifetime use for males did not vary significantly between 1999 and 2002. In 2002, 13.0 per cent of secondary students reported using inhalants in the last 12 months, with similar results observed between the sexes. As with lifetime use, the proportion of students reporting use of inhalants in the last 12 months decreased significantly with increasing age (younger students: 16.6%; older students: 5.3%) (p=0.000).
Recent use of inhalants In 2002, 8.6 per cent of ACT secondary students reported deliberately sniffing inhalants in the last four weeks. Reported levels of use within the last four weeks decreased significantly with increasing age (younger students: 11.1%; older students: 3.4%) (p=0.000) (Figure 24). The proportion of students reporting use of inhalants in the last four weeks did not vary significantly between 1999 and 2002. In 2002, 6.2 per cent of all students reported deliberately sniffing inhalants in the last week. Figure 24: Students who had used inhalants in the last four weeks by age group, ACT 1999 & 2002 (%).
Source: 1999 & 2002 ASSAD, confidential unit record files, ACT Health. *Estimate has a relative standard error between 25 and 50% and should be interpreted with caution.
Frequency of use Students were also asked how many times they had deliberately sniffed inhalants in their lifetime; in the last 12 months; in the last four weeks; and, in the last week. In 2002, almost half (47.3%) of the students who had ever used inhalants in their lifetime reported deliberately sniffing inhalants once or twice. A quarter (25.2%) of the students who had ever used inhalants reported using inhalants ten times or more in their lifetime. In 2002, 41.9 per cent of students who had used inhalants in the last 12 months reported deliberately sniffing
* *
0
2
4
6
8
10
12
14
16
12-15 year old 16-17 year old All Students
Per c
ent
19992002

52
inhalants once or twice. About one in five (21.9%) students who used inhalants in the last 12 months reported using inhalants ten times or more during that period. The estimates for other periods (last four weeks and the last week) were not reliable and are therefore not presented.
Tranquillisers Key results: In 2002, 15.1 per cent of ACT secondary students reported having ever used tranquillisers, about one in
ten reported using tranquillisers in the last 12 months and 4.3 per cent reported having used tranquillisers for recreational purposes in the last four weeks.
The proportion of students reporting use of tranquillisers in 2002 did not vary significantly between the sexes or with age.
The proportion of students reporting lifetime use of tranquillisers decreased between 1999 and 2002. Although one in ten students reported using tranquillisers in the last 12 months, about half of these
students reported using tranquillisers only once or twice. Students were asked whether they had ever taken sleeping tablets, tranquillisers or sedatives, such as Valium, Serapax or Rohypnol, other than for medical purposes, in their lifetime; in the last 12 months; in the last four weeks; and, in the last week. In 2002, 15.1 per cent of ACT secondary school students reported having used tranquillisers for non-medical purposes, at least once in their lifetime, with similar results observed between male and female students. The proportion of students reporting lifetime use of tranquillisers in 2002 did not vary significantly with age or sex. However, there was a significant decrease in the proportion of younger (12 to 15 years) male students reporting lifetime use of tranquillisers between 1999 and 2002 (1999: 18.2% vs. 2002: 13.6%) (p=0.006) and a significant decrease in the proportion of younger female students reporting lifetime use of tranquillisers between 1999 and 2002 (1999: 21.1% vs. 2002: 17.0%) (p=0.036) (Figure 25).
Figure 25: Students who had used tranquillisers at least once in their lives by age group and sex, ACT 1999 & 2002 (%).
Source: 1999 & 2002 ASSAD, confidential unit record files, ACT Health. *Estimate has a relative standard error between 25 and 50% and should be interpreted with caution. In 2002, approximately one in ten (9.6%) secondary students reported using tranquillisers in the last 12 months. The proportion of students reporting use of tranquillisers in the last 12 months did not vary significantly with age or sex.
Recent use of tranquillisers In 2002, 4.3 per cent of secondary students reported using tranquillisers for non-medical purposes in the last four weeks. The proportion of students reporting the use of tranquillisers in the last four weeks did not vary
Males
*
02468
10121416182022
12-15 year old 16-17 year old All Students
Per c
ent
1999
2002
Females
*
02468
10121416182022
12-15 year old 16-17 year old All Students
Per c
ent
1999
2002

53
significantly with age or sex, and there was no significant change in levels of reported use between 1999 (4.4%) and 2002. Estimates for the use of tranquillisers in the last week were unreliable and are therefore not reported.
Frequency of use Students were also asked how many times they had taken tranquillisers for non-medical purposes in their lifetime; in the last 12 months; in the last four weeks; and, in the last week. Among students who reported use of tranquillisers at least once in their lifetime, 45.1 per cent reported only using tranquillisers once or twice. Among students who reported use of tranquillisers in the last 12 months, about half (46.3%) indicated that they had only used tranquillisers once or twice. Among females, 48.6 per cent reported the use of tranquillisers once or twice, and 42.5 per cent of males reported using tranquillisers once or twice in the last 12 months. The results for other periods (last four weeks and the last week) and other frequency categories (3-5 times; 6-9 times; 40 times or more etc) were not reliable and are therefore not reported.
Hallucinogens Key results: In 2002, only 4.0 per cent of students reported having used hallucinogens at least once in their lifetime.
About half of these students reported using the substance only once or twice. Magic mushrooms were the most popular type of hallucinogen used by secondary students. The proportion of students reporting lifetime use of hallucinogens decreased significantly between 1999
(7.1%) and 2002 (4.0%). In 2002, students were asked whether they had ever taken hallucinogens, such as LSD, acid, trips, magic mushrooms, datura or angel’s trumpet, in their lifetime; in the last 12 months; in the last four weeks; and, in the last week. Only four per cent of ACT secondary students reported the use of hallucinogens at least once in their lifetime. The proportion of students reporting lifetime use of hallucinogens decreased significantly between 1999 (7.1%) and 2002 (4.0%) (p=0.000) (Figure 26). Figure 26: Students who had used hallucinogens at least once in their lives by age group, ACT 1999 & 2002 (%).
Source: 1999 & 2002 ASSAD, confidential unit record files, ACT Health. *Estimate has a relative standard error between 25 and 50% and should be interpreted with caution.
*
*
0
1
2
3
4
5
6
7
8
9
10
12-15 year old 16-17 year old All Students
Per c
ent
19992002
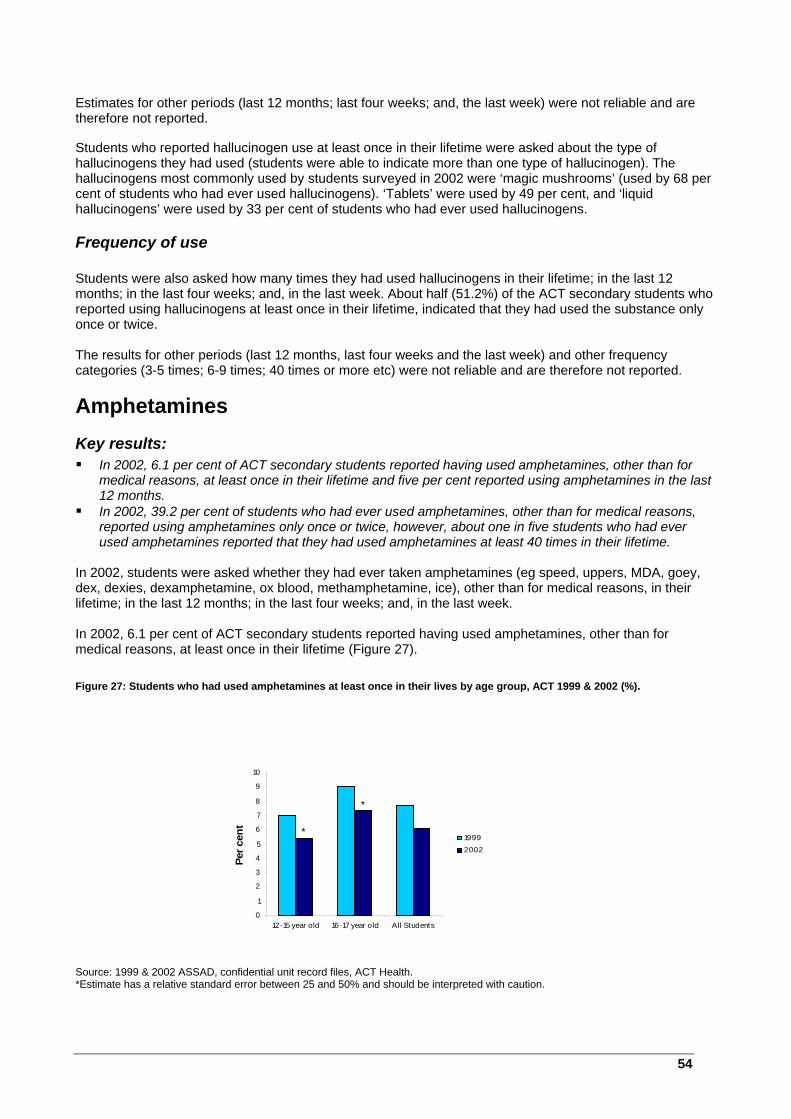
54
Estimates for other periods (last 12 months; last four weeks; and, the last week) were not reliable and are therefore not reported. Students who reported hallucinogen use at least once in their lifetime were asked about the type of hallucinogens they had used (students were able to indicate more than one type of hallucinogen). The hallucinogens most commonly used by students surveyed in 2002 were ‘magic mushrooms’ (used by 68 per cent of students who had ever used hallucinogens). ‘Tablets’ were used by 49 per cent, and ‘liquid hallucinogens’ were used by 33 per cent of students who had ever used hallucinogens.
Frequency of use Students were also asked how many times they had used hallucinogens in their lifetime; in the last 12 months; in the last four weeks; and, in the last week. About half (51.2%) of the ACT secondary students who reported using hallucinogens at least once in their lifetime, indicated that they had used the substance only once or twice. The results for other periods (last 12 months, last four weeks and the last week) and other frequency categories (3-5 times; 6-9 times; 40 times or more etc) were not reliable and are therefore not reported.
Amphetamines Key results: In 2002, 6.1 per cent of ACT secondary students reported having used amphetamines, other than for
medical reasons, at least once in their lifetime and five per cent reported using amphetamines in the last 12 months.
In 2002, 39.2 per cent of students who had ever used amphetamines, other than for medical reasons, reported using amphetamines only once or twice, however, about one in five students who had ever used amphetamines reported that they had used amphetamines at least 40 times in their lifetime.
In 2002, students were asked whether they had ever taken amphetamines (eg speed, uppers, MDA, goey, dex, dexies, dexamphetamine, ox blood, methamphetamine, ice), other than for medical reasons, in their lifetime; in the last 12 months; in the last four weeks; and, in the last week. In 2002, 6.1 per cent of ACT secondary students reported having used amphetamines, other than for medical reasons, at least once in their lifetime (Figure 27).
Figure 27: Students who had used amphetamines at least once in their lives by age group, ACT 1999 & 2002 (%).
Source: 1999 & 2002 ASSAD, confidential unit record files, ACT Health. *Estimate has a relative standard error between 25 and 50% and should be interpreted with caution.
*
*
0
1
2
3
4
5
6
7
8
9
10
12-15 year old 16-17 year old All Students
Per c
ent
19992002
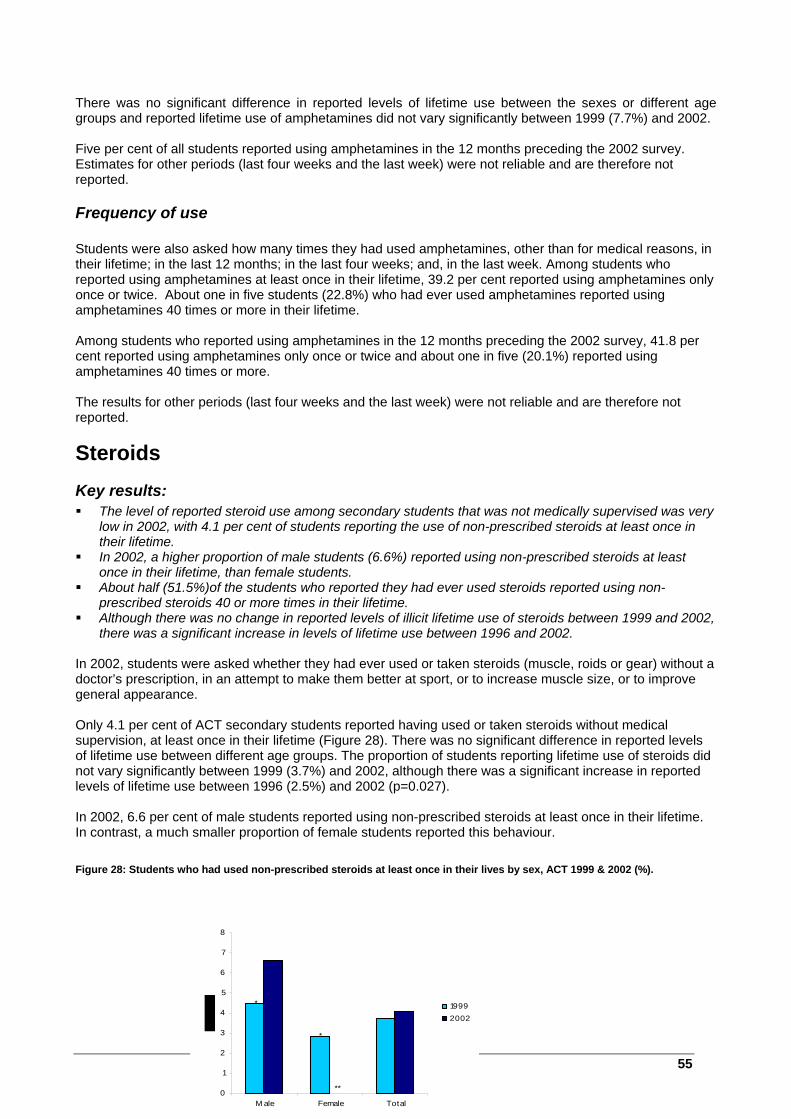
55
There was no significant difference in reported levels of lifetime use between the sexes or different age groups and reported lifetime use of amphetamines did not vary significantly between 1999 (7.7%) and 2002. Five per cent of all students reported using amphetamines in the 12 months preceding the 2002 survey. Estimates for other periods (last four weeks and the last week) were not reliable and are therefore not reported.
Frequency of use Students were also asked how many times they had used amphetamines, other than for medical reasons, in their lifetime; in the last 12 months; in the last four weeks; and, in the last week. Among students who reported using amphetamines at least once in their lifetime, 39.2 per cent reported using amphetamines only once or twice. About one in five students (22.8%) who had ever used amphetamines reported using amphetamines 40 times or more in their lifetime. Among students who reported using amphetamines in the 12 months preceding the 2002 survey, 41.8 per cent reported using amphetamines only once or twice and about one in five (20.1%) reported using amphetamines 40 times or more. The results for other periods (last four weeks and the last week) were not reliable and are therefore not reported.
Steroids Key results: The level of reported steroid use among secondary students that was not medically supervised was very
low in 2002, with 4.1 per cent of students reporting the use of non-prescribed steroids at least once in their lifetime.
In 2002, a higher proportion of male students (6.6%) reported using non-prescribed steroids at least once in their lifetime, than female students.
About half (51.5%)of the students who reported they had ever used steroids reported using non- prescribed steroids 40 or more times in their lifetime.
Although there was no change in reported levels of illicit lifetime use of steroids between 1999 and 2002, there was a significant increase in levels of lifetime use between 1996 and 2002.
In 2002, students were asked whether they had ever used or taken steroids (muscle, roids or gear) without a doctor’s prescription, in an attempt to make them better at sport, or to increase muscle size, or to improve general appearance. Only 4.1 per cent of ACT secondary students reported having used or taken steroids without medical supervision, at least once in their lifetime (Figure 28). There was no significant difference in reported levels of lifetime use between different age groups. The proportion of students reporting lifetime use of steroids did not vary significantly between 1999 (3.7%) and 2002, although there was a significant increase in reported levels of lifetime use between 1996 (2.5%) and 2002 (p=0.027). In 2002, 6.6 per cent of male students reported using non-prescribed steroids at least once in their lifetime. In contrast, a much smaller proportion of female students reported this behaviour. Figure 28: Students who had used non-prescribed steroids at least once in their lives by sex, ACT 1999 & 2002 (%).
*
*
**0
1
2
3
4
5
6
7
8
M ale Female Total
19992002
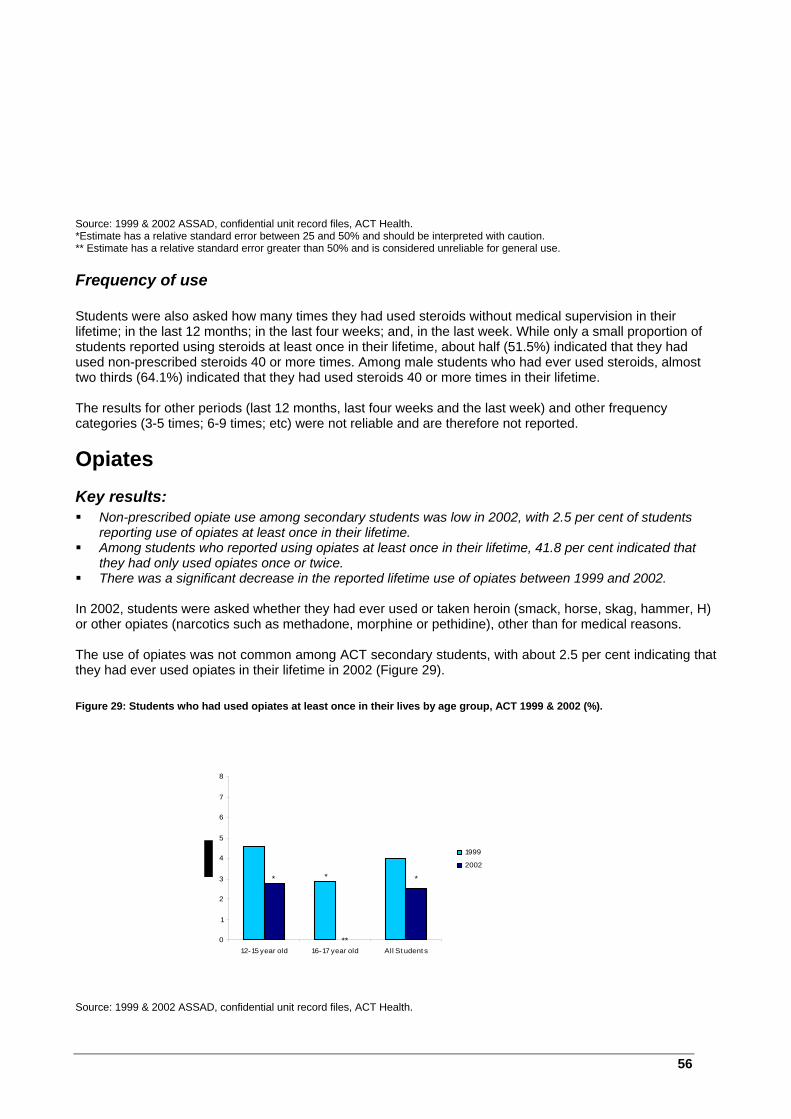
56
Source: 1999 & 2002 ASSAD, confidential unit record files, ACT Health. *Estimate has a relative standard error between 25 and 50% and should be interpreted with caution. ** Estimate has a relative standard error greater than 50% and is considered unreliable for general use.
Frequency of use Students were also asked how many times they had used steroids without medical supervision in their lifetime; in the last 12 months; in the last four weeks; and, in the last week. While only a small proportion of students reported using steroids at least once in their lifetime, about half (51.5%) indicated that they had used non-prescribed steroids 40 or more times. Among male students who had ever used steroids, almost two thirds (64.1%) indicated that they had used steroids 40 or more times in their lifetime. The results for other periods (last 12 months, last four weeks and the last week) and other frequency categories (3-5 times; 6-9 times; etc) were not reliable and are therefore not reported.
Opiates Key results: Non-prescribed opiate use among secondary students was low in 2002, with 2.5 per cent of students
reporting use of opiates at least once in their lifetime. Among students who reported using opiates at least once in their lifetime, 41.8 per cent indicated that
they had only used opiates once or twice. There was a significant decrease in the reported lifetime use of opiates between 1999 and 2002.
In 2002, students were asked whether they had ever used or taken heroin (smack, horse, skag, hammer, H) or other opiates (narcotics such as methadone, morphine or pethidine), other than for medical reasons. The use of opiates was not common among ACT secondary students, with about 2.5 per cent indicating that they had ever used opiates in their lifetime in 2002 (Figure 29).
Figure 29: Students who had used opiates at least once in their lives by age group, ACT 1999 & 2002 (%).
Source: 1999 & 2002 ASSAD, confidential unit record files, ACT Health.
** *
**0
1
2
3
4
5
6
7
8
12-15 year old 16-17 year old All St udent s
1999
2002

57
*Estimate has a relative standard error between 25 and 50% and should be interpreted with caution. ** Estimate has a relative standard error greater than 50% and is considered unreliable for general use. There was a significant decrease in the reported lifetime use of opiates between 1999 (4.0%) and 2002 (p=0.033).
Frequency of use Students were also asked how many times they had used opiates, for non-medical reasons, in their lifetime; in the last 12 months; in the last four weeks; and, in the last week. Among students who reported using opiates at least once in their lifetime, 41.8 per cent indicated that they had only used opiates once or twice. The results for other periods (last 12 months, last four weeks and the last week) and other frequency categories (3-5 times; 6-9 times; 40 times or more etc) were not reliable and are therefore not reported.
Cocaine Key results: Cocaine use among secondary students was low in 2002, with 3.4 per cent of students reporting use of
cocaine at least once in their lifetime. Among students who reported using cocaine at least once in their lifetime, 43.9 per cent indicated that
they had only used the substance once or twice. There was a significant decrease in the reported lifetime use of cocaine between 1999 and 2002,
although there was no significant change in the level of use between 1996 and 2002. In 2002, students were asked whether they had ever used or taken cocaine. The use of cocaine was not common among ACT secondary students, with about 3.4 per cent indicating that they had ever used the substance in their lifetime (Figure 30). Figure 30: Students who had used cocaine at least once in their lives by age group, ACT 1999 & 2002 (%).
Source: 1999 & 2002 ASSAD, confidential unit record files, ACT Health. *Estimate has a relative standard error between 25 and 50% and should be interpreted with caution. There was a significant decrease in the reported lifetime use of cocaine between 1999 (4.7%) and 2002 (p=0.027), although there was no significant change in the level of lifetime use between 1996 (4.2%) and 2002.
Frequency of use Students were also asked how many times they had used cocaine in their lifetime; in the last 12 months; in the last four weeks; and, in the last week. Among students who reported using cocaine at least once in their lifetime, 43.9 per cent indicated that they had only used the substance once or twice.
**
*
*
0
1
2
3
4
5
6
7
8
12-15 year old 16-17 year old All Students
19992002
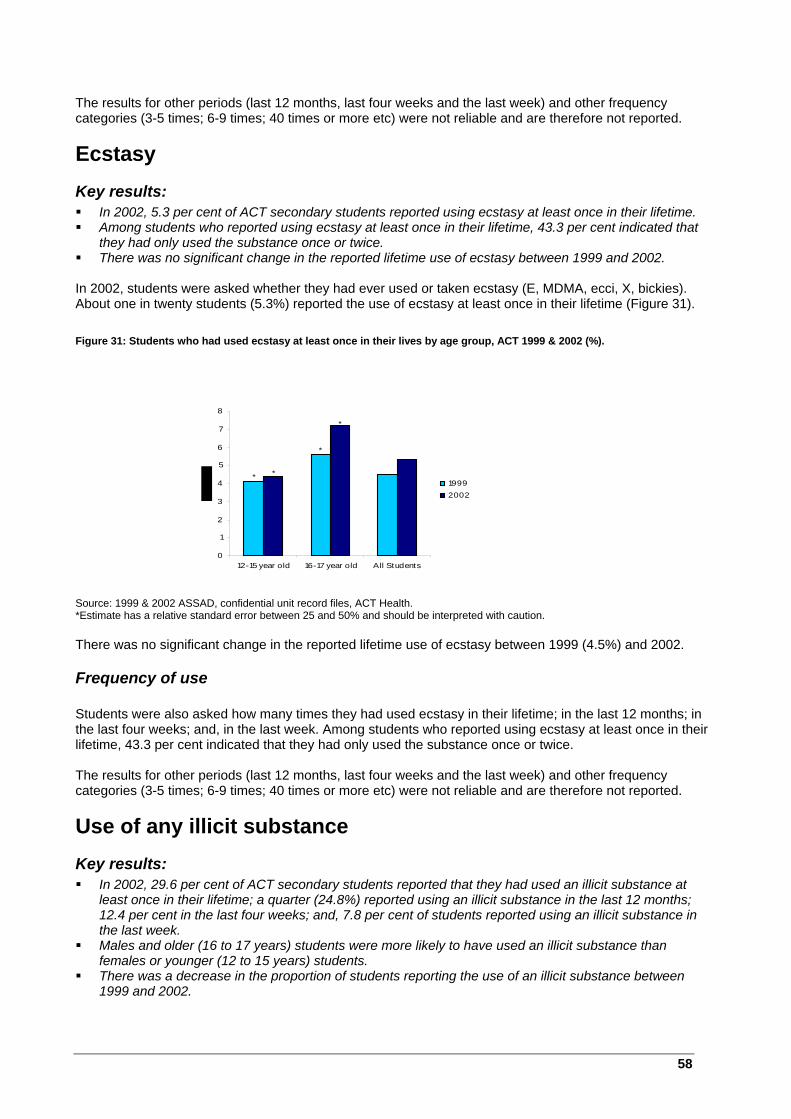
58
The results for other periods (last 12 months, last four weeks and the last week) and other frequency categories (3-5 times; 6-9 times; 40 times or more etc) were not reliable and are therefore not reported.
Ecstasy Key results: In 2002, 5.3 per cent of ACT secondary students reported using ecstasy at least once in their lifetime. Among students who reported using ecstasy at least once in their lifetime, 43.3 per cent indicated that
they had only used the substance once or twice. There was no significant change in the reported lifetime use of ecstasy between 1999 and 2002.
In 2002, students were asked whether they had ever used or taken ecstasy (E, MDMA, ecci, X, bickies). About one in twenty students (5.3%) reported the use of ecstasy at least once in their lifetime (Figure 31). Figure 31: Students who had used ecstasy at least once in their lives by age group, ACT 1999 & 2002 (%).
Source: 1999 & 2002 ASSAD, confidential unit record files, ACT Health. *Estimate has a relative standard error between 25 and 50% and should be interpreted with caution. There was no significant change in the reported lifetime use of ecstasy between 1999 (4.5%) and 2002.
Frequency of use Students were also asked how many times they had used ecstasy in their lifetime; in the last 12 months; in the last four weeks; and, in the last week. Among students who reported using ecstasy at least once in their lifetime, 43.3 per cent indicated that they had only used the substance once or twice. The results for other periods (last 12 months, last four weeks and the last week) and other frequency categories (3-5 times; 6-9 times; 40 times or more etc) were not reliable and are therefore not reported.
Use of any illicit substance Key results: In 2002, 29.6 per cent of ACT secondary students reported that they had used an illicit substance at
least once in their lifetime; a quarter (24.8%) reported using an illicit substance in the last 12 months; 12.4 per cent in the last four weeks; and, 7.8 per cent of students reported using an illicit substance in the last week.
Males and older (16 to 17 years) students were more likely to have used an illicit substance than females or younger (12 to 15 years) students.
There was a decrease in the proportion of students reporting the use of an illicit substance between 1999 and 2002.
*
* *
*
0
1
2
3
4
5
6
7
8
12-15 year old 16-17 year old All Students
19992002
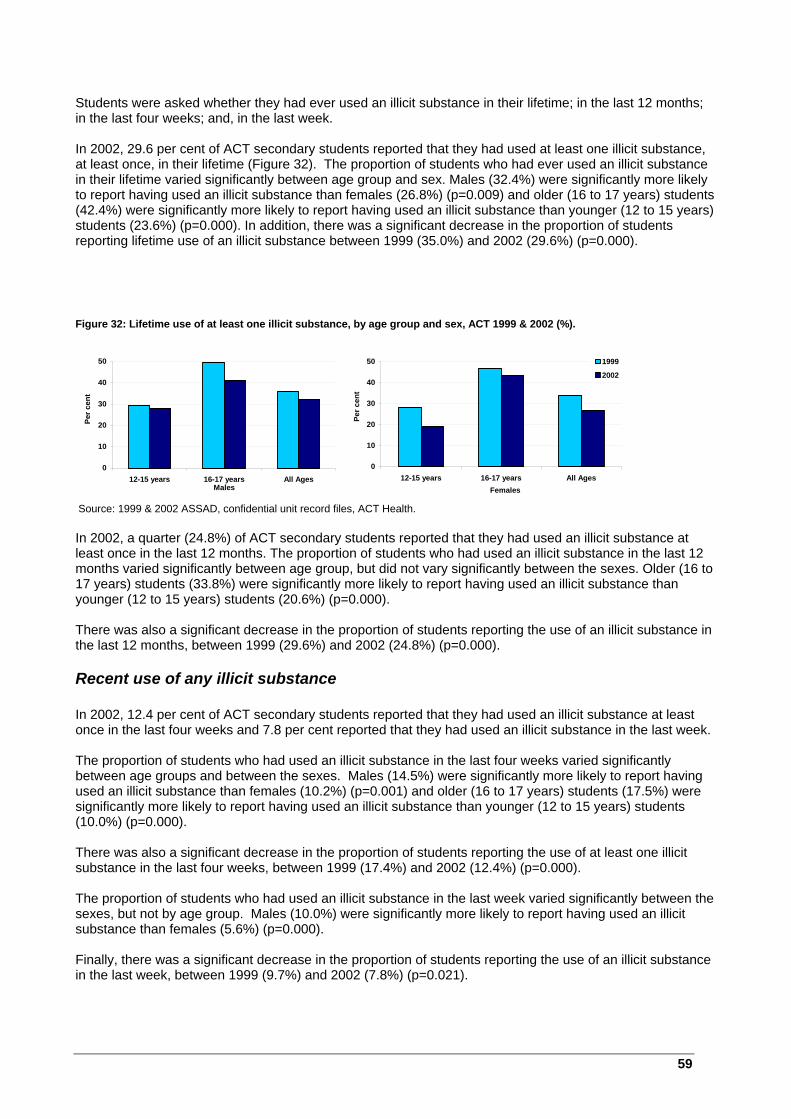
59
Students were asked whether they had ever used an illicit substance in their lifetime; in the last 12 months; in the last four weeks; and, in the last week. In 2002, 29.6 per cent of ACT secondary students reported that they had used at least one illicit substance, at least once, in their lifetime (Figure 32). The proportion of students who had ever used an illicit substance in their lifetime varied significantly between age group and sex. Males (32.4%) were significantly more likely to report having used an illicit substance than females (26.8%) (p=0.009) and older (16 to 17 years) students (42.4%) were significantly more likely to report having used an illicit substance than younger (12 to 15 years) students (23.6%) (p=0.000). In addition, there was a significant decrease in the proportion of students reporting lifetime use of an illicit substance between 1999 (35.0%) and 2002 (29.6%) (p=0.000). Figure 32: Lifetime use of at least one illicit substance, by age group and sex, ACT 1999 & 2002 (%).
Source: 1999 & 2002 ASSAD, confidential unit record files, ACT Health. In 2002, a quarter (24.8%) of ACT secondary students reported that they had used an illicit substance at least once in the last 12 months. The proportion of students who had used an illicit substance in the last 12 months varied significantly between age group, but did not vary significantly between the sexes. Older (16 to 17 years) students (33.8%) were significantly more likely to report having used an illicit substance than younger (12 to 15 years) students (20.6%) (p=0.000). There was also a significant decrease in the proportion of students reporting the use of an illicit substance in the last 12 months, between 1999 (29.6%) and 2002 (24.8%) (p=0.000).
Recent use of any illicit substance In 2002, 12.4 per cent of ACT secondary students reported that they had used an illicit substance at least once in the last four weeks and 7.8 per cent reported that they had used an illicit substance in the last week. The proportion of students who had used an illicit substance in the last four weeks varied significantly between age groups and between the sexes. Males (14.5%) were significantly more likely to report having used an illicit substance than females (10.2%) (p=0.001) and older (16 to 17 years) students (17.5%) were significantly more likely to report having used an illicit substance than younger (12 to 15 years) students (10.0%) (p=0.000). There was also a significant decrease in the proportion of students reporting the use of at least one illicit substance in the last four weeks, between 1999 (17.4%) and 2002 (12.4%) (p=0.000). The proportion of students who had used an illicit substance in the last week varied significantly between the sexes, but not by age group. Males (10.0%) were significantly more likely to report having used an illicit substance than females (5.6%) (p=0.000). Finally, there was a significant decrease in the proportion of students reporting the use of an illicit substance in the last week, between 1999 (9.7%) and 2002 (7.8%) (p=0.021).
0
10
20
30
40
50
12-15 years 16-17 years All AgesMales
Per c
ent
0
10
20
30
40
50
12-15 years 16-17 years All AgesFemales
Per c
ent
1999
2002
60
Use of needles for injecting drugs Key results: Needle use for injecting drugs without medical supervision was not common among ACT secondary
students in 2002, with about 4.1 per cent indicating that they had ever used needles in this manner. Among students who reported using drugs by injection or needles, 41.2 per cent reported they had
shared a needle with someone else and about half (52.7%) reported having obtained equipment from a needle exchange.
Among students who reported using drugs by injection or needles without a prescription, at least once in their lifetime, 31.0 per cent indicated that they had only used needles in this manner once or twice.
In 2002, students were asked whether they had ever used any drug by injection or needles without a doctor’s prescription. The question that was asked explicitly excluded injecting drugs for medical reasons, such as for treating diabetes. The use of drugs by injection or needles without a prescription was not common among ACT secondary students, with about 4.1 per cent indicating that they had ever used needles in this manner. Students who reported use of drugs by injection or needles without a prescription were asked if they had ever shared a needle or syringe with someone else. In 2002, 41.2 per cent of students who had injected drugs without a prescription indicated that they had shared a needle with someone else. Students who reported use of drugs by injection or needles without a prescription were also asked if they had ever got equipment from a needle exchange. In 2002, about half (52.7%) of these students indicated that they had got equipment from a needle exchange.
Frequency of use Students were also asked how many times they had used drugs by injection or needles without a prescription in their lifetime; in the last 12 months; in the last four weeks; and, in the last week. Among students who reported using drugs by injection or needles without a prescription, at least once in their lifetime, 31.0 per cent indicated that they had only used needles in this manner once or twice. The results for other periods (last 12 months, last four weeks and the last week) and other frequency categories (3-5 times; 6-9 times; 40 times or more etc) were not reliable and are therefore not reported.
Perceptions of danger associated with illicit substance use Key results: In 2002, more than 60 per cent of students perceived most behaviour associated with illicit substance
use as ‘very dangerous’. In 2002, students (77.3%) who had never used cannabis in their lifetime were significantly more likely to
perceive regular use of cannabis as ‘very dangerous’, compared to students (31.2%) who had used the substance at least once in their lifetime.
Between 1999 and 2002, there was a significant increase in the proportion of students who perceived ‘using needles and syringes to inject drugs’, ‘occasional amphetamine use’, ‘trying LSD once or twice’, ‘taking drugs like heroin or morphine once or twice’, ‘occasional ecstasy use’, ‘sniffing glue, thinners or petrol regularly’ and ‘smoking marijuana regularly’ as ‘very dangerous’. In most instances, these changes in perception were accompanied by a corresponding decrease in reported use of these substances.
The questionnaire included a section in which students were asked about the level of danger associated with the use of various illicit substances. Students were asked to rank specific behaviours associated with illicit substance use in terms of perceived levels of danger, on a three-point scale (‘not dangerous’, ‘a little dangerous’, ‘very dangerous’). The behaviours included in the questionnaire were: cocaine use,

61
needle and syringe use, occasional amphetamine use, occasional hallucinogen use, occasional and regular narcotic use, occasional and regular ecstasy use, regular inhalant use, and regular cannabis use.
In the analysis, students who perceived these behaviours as ‘very dangerous’ were compared to students who opted for lower levels of danger. In 2002, more than 60 per cent of students perceived most behaviour associated with illicit substance use as ‘very dangerous’. However, only 58.4 per cent of students perceived regular inhalant use as ‘very dangerous’ and about half (48.4%) perceived ‘trying hallucinogens once or twice’ as ‘very dangerous’. Female students were significantly more likely to perceive ‘cocaine use’, ‘needle and syringe use’, ‘occasional amphetamine use’, ‘taking heroin or morphine regularly’, ‘regular ecstasy use’ and ‘regular cannabis use’ as ‘very dangerous’, compared to male students (Table 19). Table 19: Student perceptions of danger associated with substance use, by sex, ACT 2002 (%).
Source: 2002 ASSAD, confidential unit record file, ACT Health. Table 20: Student perceptions of danger associated with substance use, by age group, ACT 2002 (%).
Source: 2002 ASSAD, confidential unit record file, ACT Health In addition, older (16 to 17 years) students were significantly more likely to perceive ‘cocaine use’, ‘occasional amphetamine use’, ‘occasional’ and ‘regular heroin or morphine use’, and ‘regular inhalant use’ as ‘very dangerous’ compared to younger (12 to 15 years) students. In contrast, however, younger (12 to 15 years) students were significantly more likely to perceive ‘smoking marijuana regularly’ as ‘very dangerous’, compared to older (16 to 17 years) students (Table 20).
Perceptions of the level of danger associated with cannabis use among students who had used/not used cannabis at least once in their lifetime Student responses to the level of danger perceived with regular cannabis use were analysed according to whether students’ had/had not used cannabis in their lifetime.
Perceiving as very dangerous: Males Females p -valueSniffing glue, thinners or petrol regularly 58.6 58.2 0.529Smoking marijuana regularly 60.6 68.7 0.000Trying amphetamines (speed) occasionally 60.4 67.9 0.002Trying LSD once or twice 46.4 50.2 0.265Using ecstasy/designer drugs occasionally 70.9 75.3 0.122Using ecstasy/designer drugs regularly 82.2 88.5 0.012Using cocaine 78.2 86.8 0.002Taking drugs like heroin or morphine once or twice 66.4 66.6 0.581Taking drugs like heroin or morphine regularly 81.7 89.8 0.002Using needles and syringes to inject drugs 80.3 87.7 0.001
Perceiving as very dangerous: 12-15 years 16-17 years p -valueSniffing glue, thinners or petrol regularly 53.6 68.1 0.000Smoking marijuana regularly 69.2 55.6 0.000Trying amphetamines (speed) occasionally 61.9 69.1 0.019Trying LSD once or twice 45.3 54.4 0.061Using ecstasy/designer drugs occasionally 72.5 74.4 0.728Using ecstasy/designer drugs regularly 84.8 86.6 0.108Using cocaine 81.3 85.3 0.015Taking drugs like heroin or morphine once or twice 62.5 74.9 0.000Taking drugs like heroin or morphine regularly 84.9 87.6 0.007Using needles and syringes to inject drugs 83.7 84.9 0.157
62
In 2002, students (77.3%) who had never used cannabis were significantly more likely to perceive ‘regular use of cannabis’ as ‘very dangerous’, compared to students (31.2%) who had used cannabis at least once in their lifetime (p=0.000). Females (ever used cannabis: 33.2%; never used cannabis: 80.4%) were significantly more likely to perceive ‘regular cannabis use’ as ‘very dangerous’, compared to males (ever used cannabis: 29.5%; never used cannabis: 73.9%), regardless of whether they had ever used cannabis (males vs. females ever used cannabis: p=0.040; males vs. females never used cannabis: p=0.009). Among students who had never used cannabis in their lifetime, younger (12 to 15 years) students (79.1%) were significantly more likely to perceive regular cannabis use as ‘very dangerous’, compared to older (16 to 17 years) students (72.4%) (p=0.001). However, among those students who had used cannabis at least once in their lifetime, the proportions observed between age groups did not vary significantly.
Changes in perception of the level of danger associated with other substance use Logistic regression was undertaken to determine whether the proportion of students perceiving other substance use as ‘very dangerous’ in 2002 differed from the levels reported in 1999. Between 1999 and 2002, there was a significant increase in the proportion of students who perceived ‘using needles and syringes to inject drugs’, ‘occasional amphetamine use’, ‘trying LSD once or twice’, ‘taking drugs like heroin or morphine once or twice’, ‘occasional ecstasy use’, ‘sniffing glue, thinners or petrol regularly’ and ‘smoking marijuana regularly’ as ‘very dangerous’. In most instances, between 1999 and 2002, these changes in perception were accompanied by a corresponding decrease in the proportion of students reporting use of each substance: Cannabis: Between 1999 and 2002, there was a significant decrease in the proportion of students reporting lifetime use of cannabis. This was accompanied by a significant increase in the proportion of students who perceived ‘smoking marijuana regularly’ as ‘very dangerous’. Inhalants: Between 1999 and 2002, there was a significant decrease in the proportion of students reporting lifetime use of inhalants. This was accompanied by a significant increase in the proportion of students who perceived ‘sniffing glue, thinners or petrol regularly’ as ‘very dangerous’. Hallucinogens: Between 1999 and 2002, there was a significant decrease in the proportion of students reporting lifetime use of hallucinogens. This was accompanied by a significant increase in the proportion of students who perceived ‘trying LSD once or twice’ as ‘very dangerous’. Opiates: Between 1999 and 2002, there was a significant decrease in the proportion of students reporting lifetime use of heroin and other opiates. This was accompanied by a significant increase in the proportion of students who perceived ‘taking drugs like heroin or morphine once or twice’ as ‘very dangerous’. Amphetamines: Between 1999 and 2002, there was a significant increase in the proportion of students who perceived ‘occasional amphetamine use’ as ‘very dangerous’. However, lifetime use of amphetamines did not decrease significantly. Ecstasy: Between 1999 and 2002, there was a significant increase in the proportion of students who perceived ‘occasional ecstasy use’ as ‘very dangerous’. However, lifetime use of ecstasy did not decrease significantly. Needle and syringe use: Between 1999 and 2002, there was a significant decrease in the proportion of students reporting lifetime use of needles and syringes. This was accompanied by a significant increase in the proportion of students who perceived ‘using needles and syringes to inject drugs’ as ‘very dangerous’. Education in class on illicit substance use Key results: In 2002, about three quarters (76.2%) of ACT secondary students recalled receiving at least part of a
lesson on illicit substance use in the previous year.
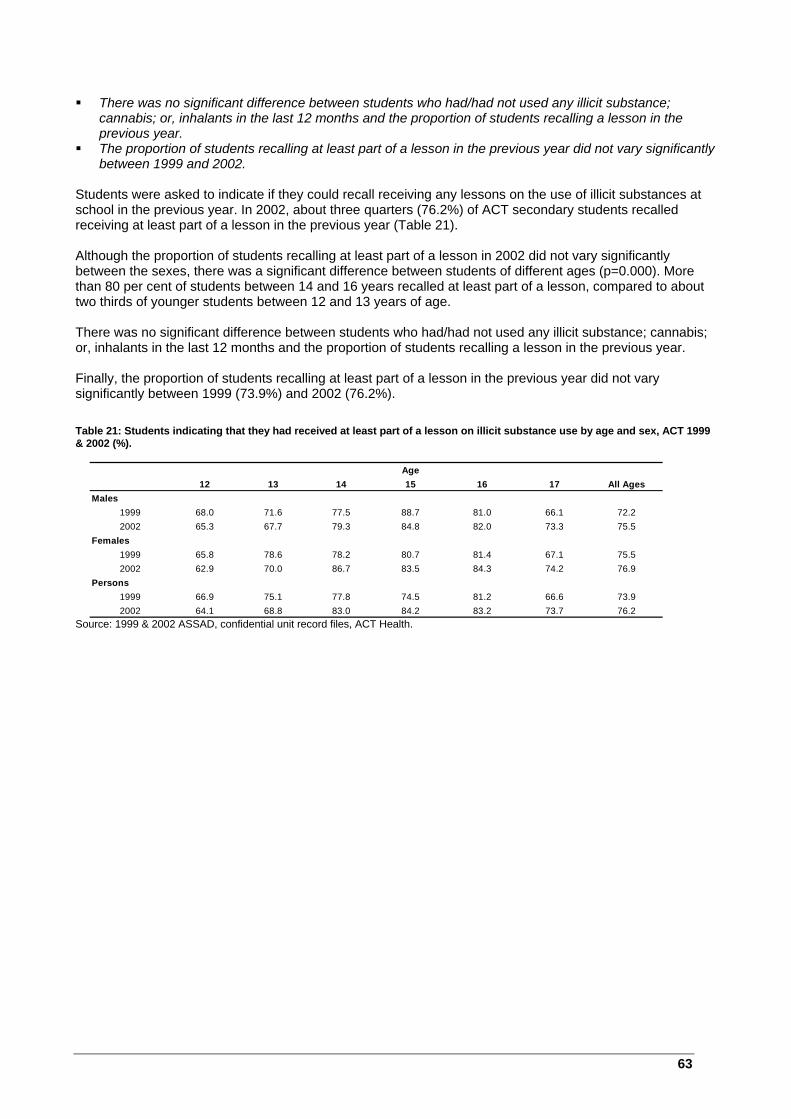
63
There was no significant difference between students who had/had not used any illicit substance; cannabis; or, inhalants in the last 12 months and the proportion of students recalling a lesson in the previous year.
The proportion of students recalling at least part of a lesson in the previous year did not vary significantly between 1999 and 2002.
Students were asked to indicate if they could recall receiving any lessons on the use of illicit substances at school in the previous year. In 2002, about three quarters (76.2%) of ACT secondary students recalled receiving at least part of a lesson in the previous year (Table 21). Although the proportion of students recalling at least part of a lesson in 2002 did not vary significantly between the sexes, there was a significant difference between students of different ages (p=0.000). More than 80 per cent of students between 14 and 16 years recalled at least part of a lesson, compared to about two thirds of younger students between 12 and 13 years of age. There was no significant difference between students who had/had not used any illicit substance; cannabis; or, inhalants in the last 12 months and the proportion of students recalling a lesson in the previous year. Finally, the proportion of students recalling at least part of a lesson in the previous year did not vary significantly between 1999 (73.9%) and 2002 (76.2%). Table 21: Students indicating that they had received at least part of a lesson on illicit substance use by age and sex, ACT 1999 & 2002 (%).
Source: 1999 & 2002 ASSAD, confidential unit record files, ACT Health.
Age12 13 14 15 16 17 All Ages
Males1999 68.0 71.6 77.5 88.7 81.0 66.1 72.22002 65.3 67.7 79.3 84.8 82.0 73.3 75.5
Females1999 65.8 78.6 78.2 80.7 81.4 67.1 75.52002 62.9 70.0 86.7 83.5 84.3 74.2 76.9
Persons1999 66.9 75.1 77.8 74.5 81.2 66.6 73.92002 64.1 68.8 83.0 84.2 83.2 73.7 76.2

64
Poly-substance use by ACT secondary students Key results: In 2002, alcohol and tobacco were the most common substances that were used in conjunction with
cannabis, by students who reported using cannabis in the previous year. More than half of the cannabis users reported using alcohol (57.6%) and about half reported using tobacco (47.7%), at least once, in conjunction with cannabis in the previous year.
Two thirds (66.5%) of the students who reported using amphetamines in the previous year also reported using alcohol at the same time, on at least one occasion. More than half of these amphetamine users reported the use of cannabis (56.4%) or tobacco (59.5%), at the same time, on at least one occasion.
More than half of the students who reported using hallucinogens in the previous year also reported using alcohol (62.1%) or tobacco (54.5%) at the same time, on at least one occasion. About a third (35.3%) of these hallucinogen users reported the use of cannabis, at the same time, on at least one occasion.
More than half of the students who reported using ecstasy in the previous year also reported using alcohol (59.6%); 40.2 per cent reported using tobacco; and, about a third (31.0%) reported the use of cannabis, at the same time, on at least one occasion.
In 2002, 4.4 per cent of all students reported the use of tobacco, alcohol and at least one other illicit substance in the week prior to survey.
Dietary inadequacies, insufficient physical activity levels, large amounts of time (four hours or more on an average school day) spent watching TV or video and ‘below average’ self-described school performance were the major factors associated with students who reported the recent use of tobacco, alcohol and at least one other illicit substance in 2002.
In 2002, students who reported using cannabis, amphetamines, hallucinogens and ecstasy in the previous year were asked if they had used any other substances on the same occasion. As more than one other substance may have been used on any one occasion, or different substances may have been used on different occasions, students were able to indicate the use of multiple substances. Alcohol and tobacco were the most commonly used substances that were used in conjunction with cannabis, by students who had reported cannabis use in the previous year (Table 22).
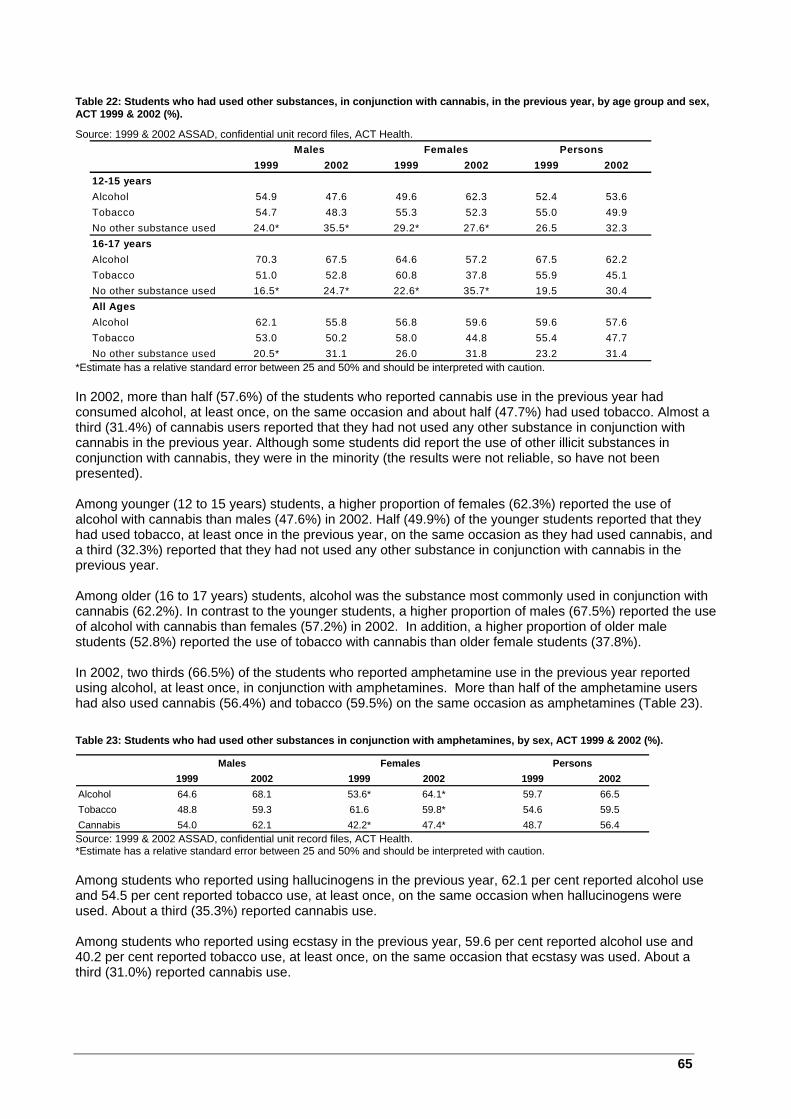
65
Table 22: Students who had used other substances, in conjunction with cannabis, in the previous year, by age group and sex, ACT 1999 & 2002 (%).
Source: 1999 & 2002 ASSAD, confidential unit record files, ACT Health.
*Estimate has a relative standard error between 25 and 50% and should be interpreted with caution. In 2002, more than half (57.6%) of the students who reported cannabis use in the previous year had consumed alcohol, at least once, on the same occasion and about half (47.7%) had used tobacco. Almost a third (31.4%) of cannabis users reported that they had not used any other substance in conjunction with cannabis in the previous year. Although some students did report the use of other illicit substances in conjunction with cannabis, they were in the minority (the results were not reliable, so have not been presented). Among younger (12 to 15 years) students, a higher proportion of females (62.3%) reported the use of alcohol with cannabis than males (47.6%) in 2002. Half (49.9%) of the younger students reported that they had used tobacco, at least once in the previous year, on the same occasion as they had used cannabis, and a third (32.3%) reported that they had not used any other substance in conjunction with cannabis in the previous year. Among older (16 to 17 years) students, alcohol was the substance most commonly used in conjunction with cannabis (62.2%). In contrast to the younger students, a higher proportion of males (67.5%) reported the use of alcohol with cannabis than females (57.2%) in 2002. In addition, a higher proportion of older male students (52.8%) reported the use of tobacco with cannabis than older female students (37.8%). In 2002, two thirds (66.5%) of the students who reported amphetamine use in the previous year reported using alcohol, at least once, in conjunction with amphetamines. More than half of the amphetamine users had also used cannabis (56.4%) and tobacco (59.5%) on the same occasion as amphetamines (Table 23). Table 23: Students who had used other substances in conjunction with amphetamines, by sex, ACT 1999 & 2002 (%).
Source: 1999 & 2002 ASSAD, confidential unit record files, ACT Health. *Estimate has a relative standard error between 25 and 50% and should be interpreted with caution. Among students who reported using hallucinogens in the previous year, 62.1 per cent reported alcohol use and 54.5 per cent reported tobacco use, at least once, on the same occasion when hallucinogens were used. About a third (35.3%) reported cannabis use. Among students who reported using ecstasy in the previous year, 59.6 per cent reported alcohol use and 40.2 per cent reported tobacco use, at least once, on the same occasion that ecstasy was used. About a third (31.0%) reported cannabis use.
1999 2002 1999 2002 1999 200212-15 years Alcohol 54.9 47.6 49.6 62.3 52.4 53.6Tobacco 54.7 48.3 55.3 52.3 55.0 49.9No other substance used 24.0* 35.5* 29.2* 27.6* 26.5 32.316-17 yearsAlcohol 70.3 67.5 64.6 57.2 67.5 62.2Tobacco 51.0 52.8 60.8 37.8 55.9 45.1No other substance used 16.5* 24.7* 22.6* 35.7* 19.5 30.4All AgesAlcohol 62.1 55.8 56.8 59.6 59.6 57.6Tobacco 53.0 50.2 58.0 44.8 55.4 47.7No other substance used 20.5* 31.1 26.0 31.8 23.2 31.4
Males Females Persons
1999 2002 1999 2002 1999 2002Alcohol 64.6 68.1 53.6* 64.1* 59.7 66.5Tobacco 48.8 59.3 61.6 59.8* 54.6 59.5Cannabis 54.0 62.1 42.2* 47.4* 48.7 56.4
Males Females Persons
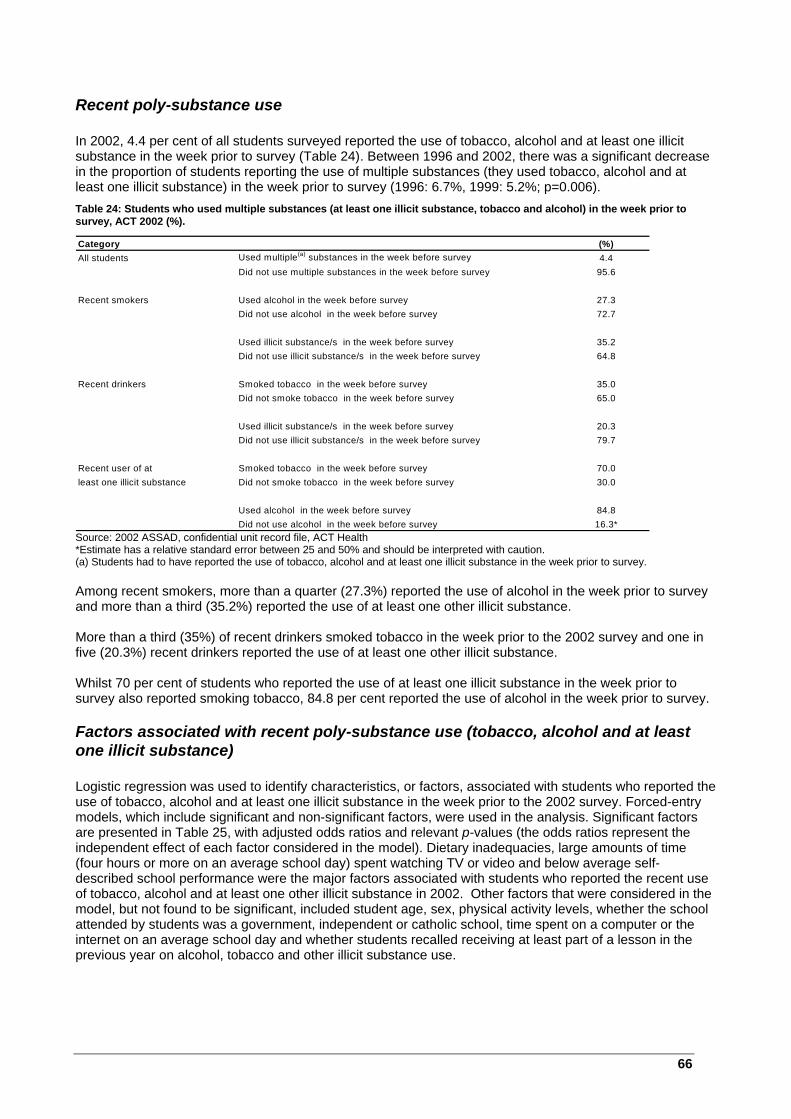
66
Recent poly-substance use In 2002, 4.4 per cent of all students surveyed reported the use of tobacco, alcohol and at least one illicit substance in the week prior to survey (Table 24). Between 1996 and 2002, there was a significant decrease in the proportion of students reporting the use of multiple substances (they used tobacco, alcohol and at least one illicit substance) in the week prior to survey (1996: 6.7%, 1999: 5.2%; p=0.006). Table 24: Students who used multiple substances (at least one illicit substance, tobacco and alcohol) in the week prior to survey, ACT 2002 (%).
Source: 2002 ASSAD, confidential unit record file, ACT Health *Estimate has a relative standard error between 25 and 50% and should be interpreted with caution. (a) Students had to have reported the use of tobacco, alcohol and at least one illicit substance in the week prior to survey. Among recent smokers, more than a quarter (27.3%) reported the use of alcohol in the week prior to survey and more than a third (35.2%) reported the use of at least one other illicit substance. More than a third (35%) of recent drinkers smoked tobacco in the week prior to the 2002 survey and one in five (20.3%) recent drinkers reported the use of at least one other illicit substance. Whilst 70 per cent of students who reported the use of at least one illicit substance in the week prior to survey also reported smoking tobacco, 84.8 per cent reported the use of alcohol in the week prior to survey.
Factors associated with recent poly-substance use (tobacco, alcohol and at least one illicit substance) Logistic regression was used to identify characteristics, or factors, associated with students who reported the use of tobacco, alcohol and at least one illicit substance in the week prior to the 2002 survey. Forced-entry models, which include significant and non-significant factors, were used in the analysis. Significant factors are presented in Table 25, with adjusted odds ratios and relevant p-values (the odds ratios represent the independent effect of each factor considered in the model). Dietary inadequacies, large amounts of time (four hours or more on an average school day) spent watching TV or video and below average self-described school performance were the major factors associated with students who reported the recent use of tobacco, alcohol and at least one other illicit substance in 2002. Other factors that were considered in the model, but not found to be significant, included student age, sex, physical activity levels, whether the school attended by students was a government, independent or catholic school, time spent on a computer or the internet on an average school day and whether students recalled receiving at least part of a lesson in the previous year on alcohol, tobacco and other illicit substance use.
Category (%)All students Used multiple(a) substances in the week before survey 4.4
Did not use multiple substances in the week before survey 95.6
Recent smokers Used alcohol in the week before survey 27.3Did not use alcohol in the week before survey 72.7
Used illicit substance/s in the week before survey 35.2Did not use illicit substance/s in the week before survey 64.8
Recent drinkers Smoked tobacco in the week before survey 35.0Did not smoke tobacco in the week before survey 65.0
Used illicit substance/s in the week before survey 20.3Did not use illicit substance/s in the week before survey 79.7
Recent user of at Smoked tobacco in the week before survey 70.0least one illicit substance Did not smoke tobacco in the week before survey 30.0
Used alcohol in the week before survey 84.8Did not use alcohol in the week before survey 16.3*

67
Table 25: Factors associated with students who reported using alcohol, tobacco and at least one other illicit substance in the week prior to survey, ACT 2002.
Source: 2002 ASSAD, confidential unit record file, ACT Health Among poly-substance users, the odds of reporting insufficient daily consumption of fruit, vegetables and breads and cereals to meet the Dietary Guidelines for Children and Adolescents in Australia, were about 2.4 times higher than the odds of reporting an adequate diet. Further, among poly-substance users, the odds of describing school performance as ‘below average’ or ‘a lot below average’ were about 3.5 times higher than the odds of describing school performance as ‘average’, ‘above average’, or ‘a lot above average’. Finally, among poly-substance users, the odds of watching at least four hours of TV or video on an average school day were about 3.8 times higher than the odds of watching less than four hours of TV or video.
Odds Ratio p valueDiet
Adequate consumption of fruits, vegetables and/or breads/cereals to meet the Dietary Guidelines 1.000
Inadequate consumption of fruits, vegetables and/or breads/cereals to meet the Dietary Guidelines 2.323 ( 1.049 - 5.142 ) 0.038
Self-described school performance
'Average' or 'above average' or a lot above average' 1.000 'Below average' or 'a lot below average' 3.359 ( 1.826 - 6.176 ) 0.000
TV/video viewing timeWatching less than four hours of TV or video on an average school day 1.000Watching at least four hours of TV or video on an average school day. 3.732 ( 2.211 - 6.299 ) 0.000
Odds Ratio 95% CI
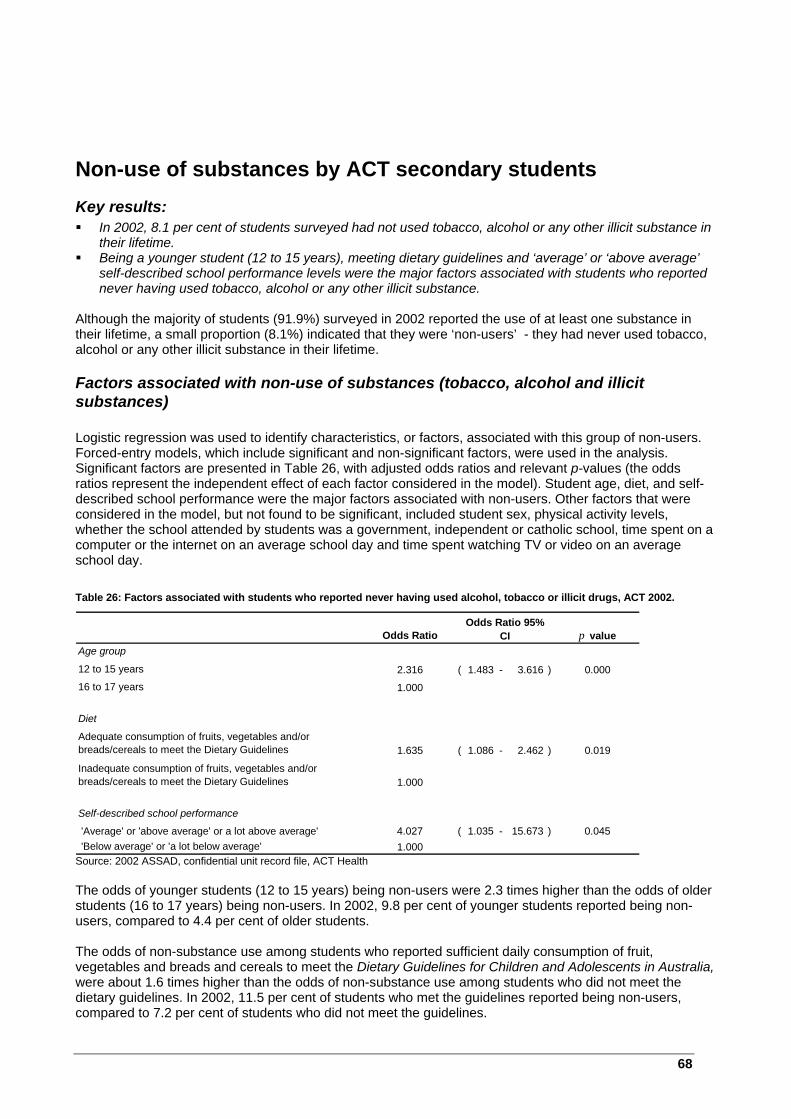
68
Non-use of substances by ACT secondary students Key results: In 2002, 8.1 per cent of students surveyed had not used tobacco, alcohol or any other illicit substance in
their lifetime. Being a younger student (12 to 15 years), meeting dietary guidelines and ‘average’ or ‘above average’
self-described school performance levels were the major factors associated with students who reported never having used tobacco, alcohol or any other illicit substance.
Although the majority of students (91.9%) surveyed in 2002 reported the use of at least one substance in their lifetime, a small proportion (8.1%) indicated that they were ‘non-users’ - they had never used tobacco, alcohol or any other illicit substance in their lifetime.
Factors associated with non-use of substances (tobacco, alcohol and illicit substances) Logistic regression was used to identify characteristics, or factors, associated with this group of non-users. Forced-entry models, which include significant and non-significant factors, were used in the analysis. Significant factors are presented in Table 26, with adjusted odds ratios and relevant p-values (the odds ratios represent the independent effect of each factor considered in the model). Student age, diet, and self-described school performance were the major factors associated with non-users. Other factors that were considered in the model, but not found to be significant, included student sex, physical activity levels, whether the school attended by students was a government, independent or catholic school, time spent on a computer or the internet on an average school day and time spent watching TV or video on an average school day. Table 26: Factors associated with students who reported never having used alcohol, tobacco or illicit drugs, ACT 2002.
Source: 2002 ASSAD, confidential unit record file, ACT Health The odds of younger students (12 to 15 years) being non-users were 2.3 times higher than the odds of older students (16 to 17 years) being non-users. In 2002, 9.8 per cent of younger students reported being non-users, compared to 4.4 per cent of older students. The odds of non-substance use among students who reported sufficient daily consumption of fruit, vegetables and breads and cereals to meet the Dietary Guidelines for Children and Adolescents in Australia, were about 1.6 times higher than the odds of non-substance use among students who did not meet the dietary guidelines. In 2002, 11.5 per cent of students who met the guidelines reported being non-users, compared to 7.2 per cent of students who did not meet the guidelines.
Odds Ratio p valueAge group
12 to 15 years 2.316 ( 1.483 - 3.616 ) 0.00016 to 17 years 1.000
Diet
Adequate consumption of fruits, vegetables and/or breads/cereals to meet the Dietary Guidelines 1.635 ( 1.086 - 2.462 ) 0.019
Inadequate consumption of fruits, vegetables and/or breads/cereals to meet the Dietary Guidelines 1.000
Self-described school performance
'Average' or 'above average' or a lot above average' 4.027 ( 1.035 - 15.673 ) 0.045 'Below average' or 'a lot below average' 1.000
Odds Ratio 95% CI

69
Further, the odds of non-substance use among students who described their school performance as ‘average’, ‘above average’ or ‘a lot above average’ were about four times higher than the odds of non-substance use among students who described their school performance as ‘below average’ or ‘a lot below average’. In 2002, 8.5 per cent of students who described their school performance as ‘average’, ‘above average’ or ‘a lot above average’ reported being non-users, compared to 2.8 per cent of students who described their school performance as ‘below average’ or ‘a lot below average’.
70
Other health-related behaviours among ACT secondary students Nutrition Key results: Almost three-quarters (73.8%) of the students who were surveyed in 2002 did not consume enough of at
least one of the food types (fruit, vegetables, bread/cereals) included in the survey, to meet the Dietary Guidelines for Children and Adolescents in Australia.
Meeting the National Physical Activity Guidelines for Australians and ‘average’ or ‘above average’ self-described school performance levels were the major factors associated with students who met the Dietary Guidelines for Children and Adolescents in Australia.
Almost a third (32.4%) of students reported consuming less than the recommended daily serves of fruit. Male students and older students, between 16 to 17 years, were significantly more likely to report consuming less than the recommended daily serves of fruit than females and younger students aged 12 to 15 years.
Approximately a third (34%) of students reported consuming less than the recommended daily serves of vegetables.
More than half (58.7%) of the students surveyed in 2002 reported consuming less than the recommended daily serves of breads/cereals. Females and younger students (12 to 15 years) were significantly more likely to report consuming less than the recommended daily serves of breads/cereals than males and older students (16 to 17 years).
Daily fruit consumption Almost a third (32.4%) of students in 2002 reported consuming less than the recommended daily serves of fruit. There were significant differences in inadequate levels of consumption between males and females and between students in different age groups. Males (35.7%) were significantly more likely to report consuming less than the recommended number of fruit serves per day than females (29.1%) (p=0.002) and 16 to 17 year old students (41.4%) were significantly more likely to report consuming less than the recommended number of fruit serves per day than 12 to15 year old students (28%) (p=0.000).
Daily vegetable consumption
Approximately a third (34%) of students in 2002 reported consuming less than the recommended daily intake of vegetables. There was no significant difference in inadequate levels of consumption reported between male and female students, or between students in different age groups (12 to 15 years and 16 to 17 years).
Daily bread and cereal consumption More than half (58.7%) of the students surveyed in 2002 reported consuming less than the recommended daily serves of breads and cereals. There were significant differences in inadequate levels of consumption reported between males and females and between students in different age groups. Females (62.1%) were significantly more likely to report consuming less than the recommended number of serves per day than males (55.4%) (p=0.000) and younger students (12 to 15 years) (60.7%) were significantly more likely to report consuming less than the recommended number of serves per day than older students (16 to 17 years) (54.8%) (p=0.000).
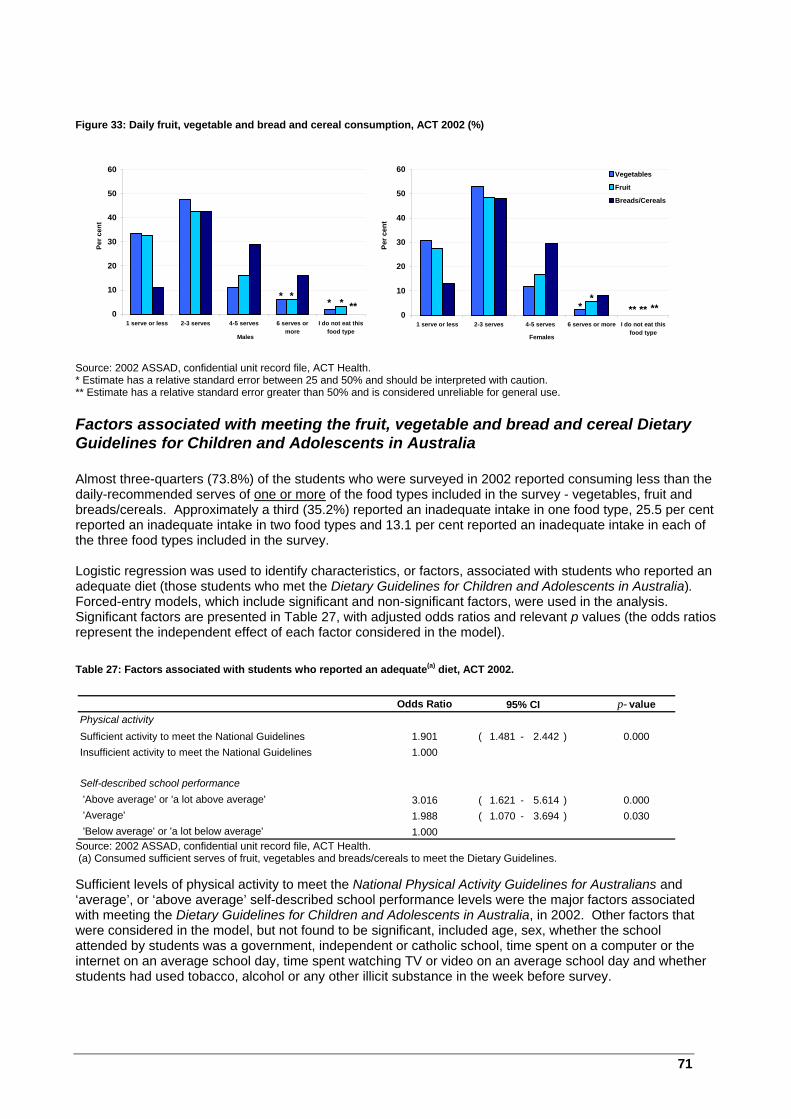
71
Figure 33: Daily fruit, vegetable and bread and cereal consumption, ACT 2002 (%)
Source: 2002 ASSAD, confidential unit record file, ACT Health. * Estimate has a relative standard error between 25 and 50% and should be interpreted with caution. ** Estimate has a relative standard error greater than 50% and is considered unreliable for general use.
Factors associated with meeting the fruit, vegetable and bread and cereal Dietary Guidelines for Children and Adolescents in Australia Almost three-quarters (73.8%) of the students who were surveyed in 2002 reported consuming less than the daily-recommended serves of one or more of the food types included in the survey - vegetables, fruit and breads/cereals. Approximately a third (35.2%) reported an inadequate intake in one food type, 25.5 per cent reported an inadequate intake in two food types and 13.1 per cent reported an inadequate intake in each of the three food types included in the survey. Logistic regression was used to identify characteristics, or factors, associated with students who reported an adequate diet (those students who met the Dietary Guidelines for Children and Adolescents in Australia). Forced-entry models, which include significant and non-significant factors, were used in the analysis. Significant factors are presented in Table 27, with adjusted odds ratios and relevant p values (the odds ratios represent the independent effect of each factor considered in the model). Table 27: Factors associated with students who reported an adequate(a) diet, ACT 2002.
Source: 2002 ASSAD, confidential unit record file, ACT Health. (a) Consumed sufficient serves of fruit, vegetables and breads/cereals to meet the Dietary Guidelines. Sufficient levels of physical activity to meet the National Physical Activity Guidelines for Australians and ‘average’, or ‘above average’ self-described school performance levels were the major factors associated with meeting the Dietary Guidelines for Children and Adolescents in Australia, in 2002. Other factors that were considered in the model, but not found to be significant, included age, sex, whether the school attended by students was a government, independent or catholic school, time spent on a computer or the internet on an average school day, time spent watching TV or video on an average school day and whether students had used tobacco, alcohol or any other illicit substance in the week before survey.
** ****
0
10
20
30
40
50
60
1 serve or less 2-3 serves 4-5 serves 6 serves ormore
I do not eat thisfood type
Males
Per c
ent
*** ***
**0
10
20
30
40
50
60
1 serve or less 2-3 serves 4-5 serves 6 serves or more I do not eat thisfood type
Females
Per c
ent
Vegetables
Fruit
Breads/Cereals
Odds Ratio p- valuePhysical activitySufficient activity to meet the National Guidelines 1.901 ( 1.481 - 2.442 ) 0.000Insufficient activity to meet the National Guidelines 1.000
Self-described school performance 'Above average' or 'a lot above average' 3.016 ( 1.621 - 5.614 ) 0.000 'Average' 1.988 ( 1.070 - 3.694 ) 0.030 'Below average' or 'a lot below average' 1.000
95% CI

72
The odds of students meeting the Dietary Guidelines for Children and Adolescents in Australia, if they reported adequate physical activity levels (met the National Physical Activity Guidelines for Australians - 30 minutes of moderate activity at least six times, and 30 minutes of vigorous activity at least three times in the week prior to the survey), were about 1.9 times higher than the odds for students who reported insufficient levels of physical activity. Indeed, 36.8 per cent of students who met the National Physical Activity Guidelines for Australians also met the Dietary Guidelines for Children and Adolescents in Australia. In comparison, 21.8 per cent of students who did not meet the National Physical Activity Guidelines for Australians, met the Dietary Guidelines for Children and Adolescents in Australia. Inadequate levels of consumption increased as school performance levels declined. The odds of students meeting the Dietary Guidelines for Children and Adolescents in Australia, if they described their school performance as ‘above average’ and ‘a lot above average’, or ‘average’, were between 2-3 times higher than the odds for students who described their school performance as ‘below average’ and ‘a lot below average’. Although 35.8 per cent of students who described their school performance as either ‘a lot above average’ or ‘above average’ met the Dietary Guidelines for Children and Adolescents in Australia, only 20.7 per cent of ‘average’ and 13.7 per cent of ‘a lot below average’ or ‘below average’ students met the Dietary Guidelines for Children and Adolescents in Australia.
73
Physical & Leisure-Time Activity Key results: Although only 15.6 per cent of ACT secondary students reported undertaking at least 30 minutes of
moderate activity at least six times in the week prior to the 2002 survey, about half (52.9%) reported undertaking at least three 30 minute sessions of vigorous activity.
In 2002, 28.5 per cent of students reported undertaking sufficient moderate and vigorous activity to meet the National Physical Activity Guidelines for Australians.
Being male, meeting the Dietary Guidelines for Children and Adolescents in Australia and watching less than four hours of TV or video a day were the major factors associated with students who met the National Physical Activity Guidelines for Australians.
About one in five (18.5%) students reported spending four hours or more watching TV or video on an average school day.
Students were significantly more likely to report spending four hours or more watching TV or video if they were male, if they reported using the internet or playing computer games for four hours or more, if their self-described school performance was poor, or if they reported inadequate consumption of one or more of the food types included in the survey (did not meet the Dietary Guidelines for Children and Adolescents in Australia).
Approximately one in ten (11.3%) students reported spending four hours or more on the Internet or playing computer games on an average school day.
Students were significantly more likely to report spending four hours or more on the internet or playing computer games if they were male, if they reported spending four hours or more watching TV or video, or if their self-described school performance was poor.
Factors associated with meeting the recommendations in the National Physical Activity Guidelines for Australians The National Physical Activity Guidelines for Australians do not provide an explicit set of guidelines for young people between 12 and 17 years of age. However, they do recommend that children and young people less than 18 years of age undertake at least 30 minutes of moderate activity on most days of the week and 30 minutes of vigorous activity 3-4 times a week. At the time of writing, these recommendations were under review. For the purposes of this report, however, students who reported 30 minutes of moderate activity at least six times, and 30 minutes of vigorous activity at least three times in the week prior to the survey were deemed as having met the recommendations in the existing National Physical Activity Guidelines for Australians. In 2002, 28.5 per cent of students reported undertaking sufficient activity in the week prior to the 2002 survey to meet the recommendations for children and young people in the National Physical Activity Guidelines for Australians. Less than one in five (15.6%) students reported undertaking at least 30 minutes of moderate activity at least six times in the week prior to the survey and about half (52.9%) reported undertaking at least three 30 minute sessions of vigorous activity (Figure 34).

74
Figure 34: Number of 30-minute sessions of moderate and vigorous physical activity undertaken in the previous week, by sex, ACT 2002 (%).
Source: 2002 ASSAD, confidential unit record file, ACT Health. * Estimate has a relative standard error between 25 and 50% and should be interpreted with caution. Logistic regression was used to identify characteristics, or factors, associated with students who met the National Physical Activity Guidelines for Australians. Forced-entry models, which include significant and non-significant factors, were used in the analysis. Significant factors are presented in Table 28, with adjusted odds ratios and relevant p-values (the odds ratios represent the independent effect of each factor considered in the model). Table 28: Factors associated with students who reported sufficient physical activity(a), ACT 2002.
Source: 2002 ASSAD, confidential unit record file, ACT Health. (a) Reported at least 30 minutes of moderate activity at least six times, and 30 minutes of vigorous activity at least three times, in the week prior to the survey - sufficient to meet the recommendations for children and adolescents (<18years) in the existing National Physical Activity Guidelines for Australians. An adequate diet (meeting the Dietary Guidelines for Children and Adolescents in Australia), being male and watching less than four hours of TV or video on an average school day were the major factors associated with meeting the National Physical Activity Guidelines for Australians in the week prior to the 2002 survey. Other factors that were considered in the model, but not found to be significant, included student age, whether the school attended by students was a government, independent or Catholic school, time spent on a computer or the internet on an average school day, self-described levels of school performance and whether students had used tobacco, alcohol or any other illicit substance in the week before survey. The odds of students who reported an adequate diet (consumed sufficient serves of each of the food types included in the survey to meet the Dietary Guidelines for Children and Adolescents in Australia) meeting the National Physical Activity Guidelines for Australians were about 1.9 times higher than the odds for students who reported an inadequate diet (reported consuming less than the daily recommended serves of one or more of the food types included in the survey). In 2002, 40.5 per cent of students who met the Dietary Guidelines for Children and Adolescents in Australia also met the National Physical Activity Guidelines for Australians. In comparison, only a quarter (24.5%) of students with an inadequate diet (did not meet the
*
0
5
10
15
20
25
None Once Twice 3 times 4 times 5 times 6 ormoretimesModerate
Per C
ent
*
0
5
10
15
20
25
None Once Twice 3 times 4 times 5 times 6 ormoretimesVigorous
Per C
ent
MalesFemales
Odds Ratio p- valueSexMale 1.506 ( 1.185 - 1.914 ) 0.001Female 1.000
DietAdequate consumption of fruits, vegetables and/or breads/cereals to meet the Dietary Guidelines 1.903 ( 1.482 - 2.445 ) 0.000Inadequate consumption of fruits, vegetables and/or breads/cereals to meet the Dietary Guidelines 1.000
TV/video viewing time
Watching less than four hours of TV or video on an average school day 1.566 ( 1.132 - 2.167 ) 0.007Watching at least four hours of TV or video on an average school day. 1.000
95% CI

75
Dietary Guidelines for Children and Adolescents in Australia) met the National Physical Activity Guidelines for Australians. The odds of students who reported watching less than four hours of TV or video on an average school day meeting the National Physical Activity Guidelines for Australians were about 1.6 times higher than the odds for students who reported watching more than four hours of TV or video. Indeed, 29.6 per cent of students who reported watching less than four hours of TV or video on an average school day met the National Physical Activity Guidelines for Australians, compared to 24.7 per cent of students who reported watching more than four hours of TV or video. In addition, the odds for male students meeting the National Physical Activity Guidelines for Australians were about 1.5 times higher than the odds for female students. About a third of all males (32.2%) met the National Physical Activity Guidelines for Australians compared to a quarter (24.9%) of females.
Time spent watching TV or Video About one in five (18.5%) of the ACT secondary school students who were surveyed in 2002 reported spending four hours or more watching TV or video on an average school day. The majority (77.1%) reported spending 1-3 hours daily, and 4.4 per cent reported not watching TV or video on school days at all (Figure 35). Figure 35: Time spent watching TV/video on an average school day, by sex, ACT 2002 (%)
Source: 2002 ASSAD, confidential unit record file, ACT Health. * Estimate has a relative standard error between 25 and 50% and should be interpreted with caution. Male students (23.1%) were significantly more likely to report spending four or more hours watching TV or video than female students (14.1%) (p=0.007), and students who met the Dietary Guidelines for Children and Adolescents in Australia (ie. they reported consuming the recommended daily serves of fruit, vegetables and breads/cereals)(15.4%) were significantly less likely to report watching TV or video for four hours or more than students with an inadequate diet (19.6%) (p=0.001). In addition, students who reported using the internet or playing computer games for four hours or more on an average school day (43.4%) were significantly more likely to report spending four or more hours watching TV or video than students who reported using the internet or playing computer games for less than four hours (15.2%) (p=0.000). Finally, the proportion of students who reported watching four or more hours of TV or video on an average school day decreased significantly with increasing levels of self-described school performance. For instance, 14.6 per cent of students who reported their school performance as either ‘a lot above average’ or ‘above average’, 19.9 per cent of students who reported their school performance as ‘average’, and 29.6 per cent of students who reported their school performance as either ‘a lot below average’ or ‘below average’, also reported watching four or more hours of TV or video on an average school day (p=0.000).
* **
0
5
10
15
20
25
30
35
None 1 hour orless
2 hours 3 hours 4 hours 5 or morehours
Time
Per c
ent
M alesF emalesP erso ns
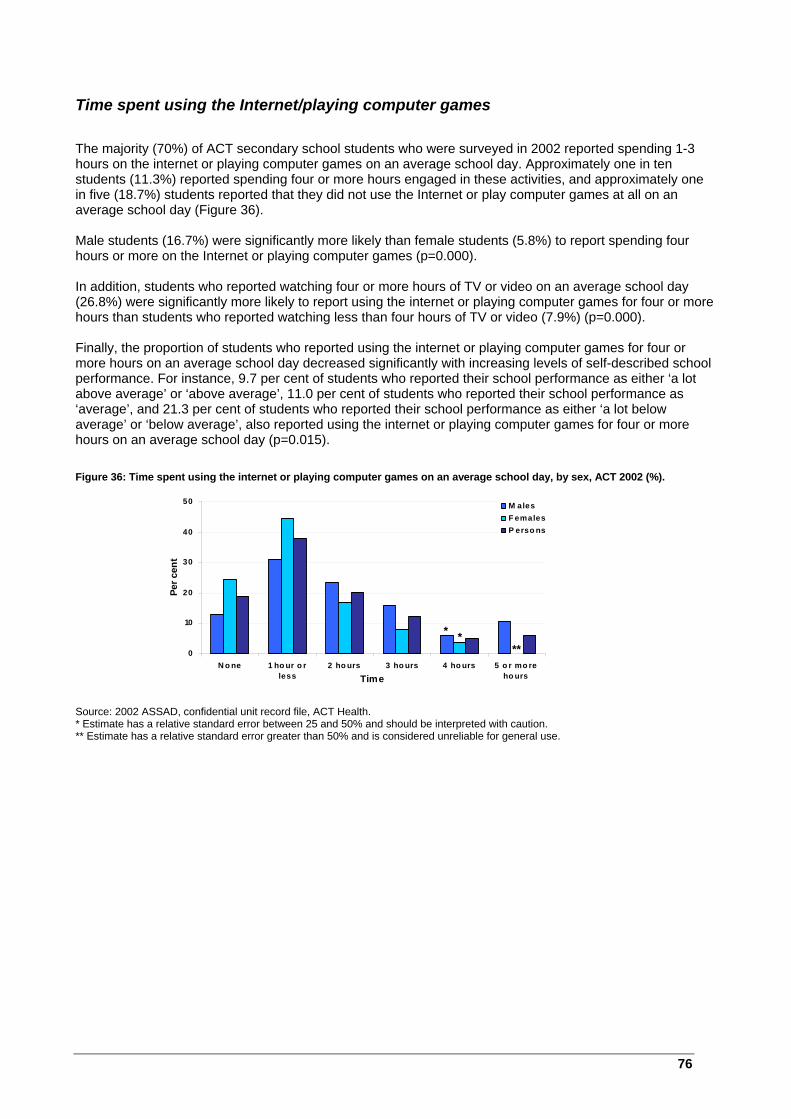
76
Time spent using the Internet/playing computer games
The majority (70%) of ACT secondary school students who were surveyed in 2002 reported spending 1-3 hours on the internet or playing computer games on an average school day. Approximately one in ten students (11.3%) reported spending four or more hours engaged in these activities, and approximately one in five (18.7%) students reported that they did not use the Internet or play computer games at all on an average school day (Figure 36). Male students (16.7%) were significantly more likely than female students (5.8%) to report spending four hours or more on the Internet or playing computer games (p=0.000). In addition, students who reported watching four or more hours of TV or video on an average school day (26.8%) were significantly more likely to report using the internet or playing computer games for four or more hours than students who reported watching less than four hours of TV or video (7.9%) (p=0.000). Finally, the proportion of students who reported using the internet or playing computer games for four or more hours on an average school day decreased significantly with increasing levels of self-described school performance. For instance, 9.7 per cent of students who reported their school performance as either ‘a lot above average’ or ‘above average’, 11.0 per cent of students who reported their school performance as ‘average’, and 21.3 per cent of students who reported their school performance as either ‘a lot below average’ or ‘below average’, also reported using the internet or playing computer games for four or more hours on an average school day (p=0.015). Figure 36: Time spent using the internet or playing computer games on an average school day, by sex, ACT 2002 (%).
Source: 2002 ASSAD, confidential unit record file, ACT Health. * Estimate has a relative standard error between 25 and 50% and should be interpreted with caution. ** Estimate has a relative standard error greater than 50% and is considered unreliable for general use.
* ***0
10
20
30
40
50
N o ne 1 ho ur o rless
2 ho urs 3 ho urs 4 ho urs 5 o r mo reho ursTime
Per c
ent
M alesF emalesP erso ns

77
Sun Protection Key results: Almost two-thirds (63.7%) of students surveyed in 2002 responded correctly to questions about the
causes of skin cancer. Almost two-thirds (64.5%) of students surveyed in 2002 recalled having had at least part of a lesson on
sun protection or skin cancer in the previous year. Two-thirds (66.4%) of students surveyed in 2002 reported receiving a sunburn the previous summer that
was sore or tender the next day, and about half (48.9%) the students surveyed reported receiving a severe sunburn that blistered the previous summer.
There was a general decrease over time in reported self-care practices when outdoors between 11am and 3pm in summer. The proportion of students reporting that they ‘usually’ or ‘always’ wore a hat, wore clothing to cover up, wore a maximum protection sunscreen, wore sunglasses, or mostly stayed inside, decreased significantly between 1996 and 2002. The proportion of students reporting that they ‘usually’ or ‘always’ wore briefer clothing to get sun on their skin increased significantly between 1996 and 2002.
Some self-care practices appeared to be quite unpopular with students. Only one in five students reported ‘usually’ or ‘always’ wearing clothes to cover up when outdoors, or reported mostly staying inside between 11am and 3pm in summer.
The cap was the most popular type of hat preferred by students, and the narrow-brimmed hat and sun-visor gained considerably in popularity between 1996 and 2002. The popularity of the wide-brimmed hat remained relatively constant between 1996 and 2002, preferred by about one in ten students.
The majority of students in 2002 who reported ‘never, ‘rarely’ or only ‘sometimes’ wearing a hat or using a maximum protection sunscreen were unlikely to report ‘usually’ or ‘always’ adopting other sun protective measures.
The majority of students in 2002 who did not report ‘usually’ or ‘always’ adopting any sun protective measures indicated a preference for a suntan. They also indicated that they had had at least part of a sun protection lesson in the previous year and more than half had a reasonable level of knowledge about the need for sun protection.
The Cancer Council Australia advise being ‘SunSmart’ and using a range of measures to protect skin from exposure to the sun’s ultraviolet radiation (UVR). In particular, they advise wearing appropriate clothing to cover most of the body, using a maximum protection broad-spectrum water resistant sunscreen, wearing a wide-brimmed hat, suitable sunglasses and staying in the shade or indoors between 11:00am and 3:00pm4,5.
Knowledge about skin cancer
Students were asked two questions about the causes of skin cancer. Both questions were worded as statements, requiring a true/false response from students. Initially, the responses to each question were analysed separately. Then an overall knowledge index was calculated and analysed, based on correct responses to each question. The first question suggested repeated sunburn was the sole cause of skin cancer. The correct response to this question was ‘false’. In 2002, the majority (70.5%) of students surveyed were aware that sunburn was not the sole cause of skin cancer (Figure 37). The second question stated that most skin cancer was caused by ultraviolet radiation (UVR). The correct response to this question was ‘true’. In 2002, the majority of students (91.9%) provided the correct response to this question. Almost two-thirds (63.7%) of the students surveyed in 2002 responded correctly to both questions and only 1.3 per cent responded incorrectly to both questions. This was similar to the results from the 1999 survey.
4 The Cancer Council Australia. 2001. National Cancer Prevention Policy 2001-03. Sydney, The Cancer Council Australia. 5 www.cancer.org.au

78
Figure 37: Correct responses to true/false questions about the causes of skin cancer, ACT 2002 (%).
Source: 2002 ASSAD, confidential unit record file, ACT Health.
Education on skin cancer In 1996, 1999 and 2002, students were asked if they had had at least part of a lesson on skin cancer or protection from the sun during the previous year. The majority of students reported that they did have at least part of a lesson during the previous year (1996, 60.1%; 1999, 66%; 2002, 64.5%) (Figure 38). Across each of the three surveys (1996, 1999 and 2002), younger students (12 to 15 years) were significantly more likely to report that they had at least part of a lesson in the previous year compared to older students (16 to 17 years). In 2002, for instance, 70.6 per cent of 12 to 15 year old students reported having had at least part of a lesson on skin cancer or protection from the sun during the previous year, compared to 51.8 per cent of 16 to 17 year old students (p=0.000). Figure 38: Students reporting at least part of a lesson on skin cancer in the previous year, by age group, ACT 1996, 1999 & 2002 (%).
Source: 1996, 1999 & 2002 ASSAD, confidential unit record files, ACT Health. For both 1999 and 2002, there was no significant difference in the proportion of students who did or did not have at least part of a lesson in the previous year and knowledge about the causes of skin cancer.
Sunburn Students were asked if they received a sunburn the previous summer that was sore or tender the next day. In 2002, 80.6 per cent of students reported receiving a sunburn the previous summer that was sore or tender the next day. Students were also asked to recall the last time they received a severe sunburn that made their skin blister. In 2002, almost half (48.9%) of the students surveyed reported being severely sunburnt the previous summer (Figure 39). Younger students (12 to 15 years) (51.6%) were more likely to report being severely sunburnt the previous summer than older students (16 to 17 years) (44.5%) (p=0.001).
0102030405060708090
100
St at ement 1: 'Y o u o nlyg et skin cancer if yo u g et
b urnt o f t en'
St at ement 2 : 'M ost skincancer is caused b y U V R
f rom t he sun'
B ot h st at ement s
Statement
Per c
ent
M alesF emalesP erso ns
0
10
20
30
40
50
60
70
80
12-15 years 16-17 years A ll A ges (12-17 years)
Age group
Per c
ent
1996
1999
2002
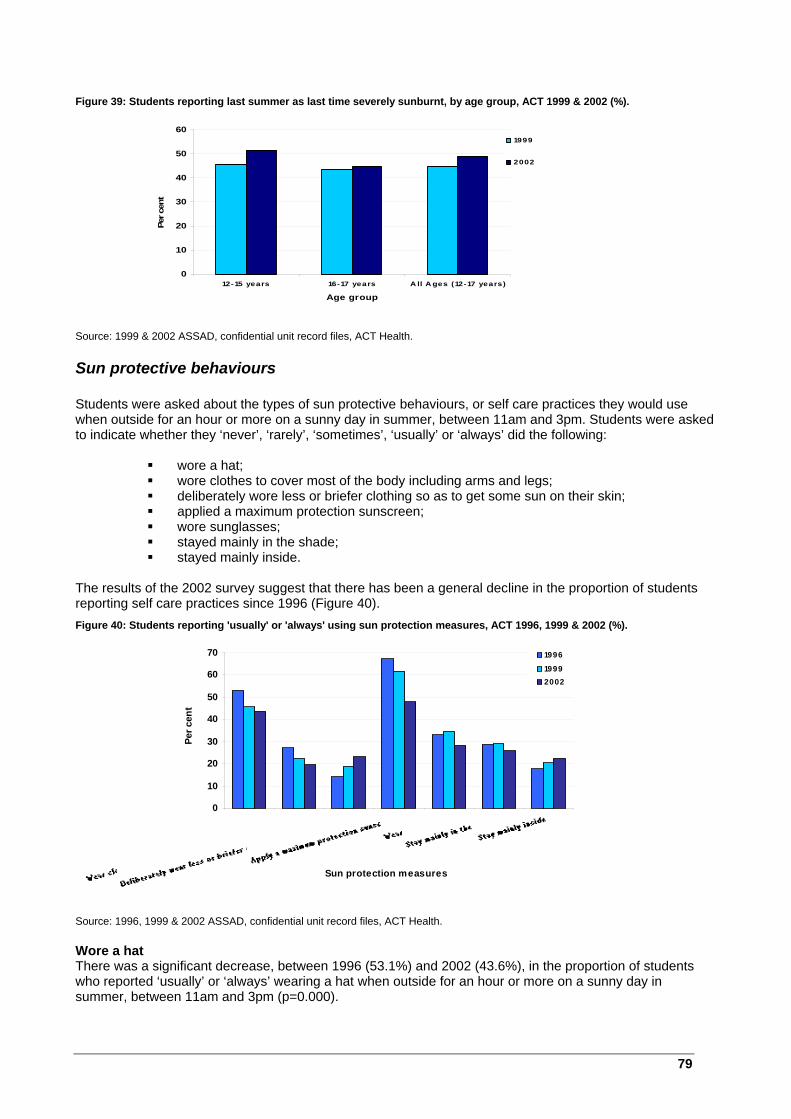
79
Figure 39: Students reporting last summer as last time severely sunburnt, by age group, ACT 1999 & 2002 (%).
Source: 1999 & 2002 ASSAD, confidential unit record files, ACT Health.
Sun protective behaviours Students were asked about the types of sun protective behaviours, or self care practices they would use when outside for an hour or more on a sunny day in summer, between 11am and 3pm. Students were asked to indicate whether they ‘never’, ‘rarely’, ‘sometimes’, ‘usually’ or ‘always’ did the following:
wore a hat; wore clothes to cover most of the body including arms and legs; deliberately wore less or briefer clothing so as to get some sun on their skin; applied a maximum protection sunscreen; wore sunglasses; stayed mainly in the shade; stayed mainly inside.
The results of the 2002 survey suggest that there has been a general decline in the proportion of students reporting self care practices since 1996 (Figure 40). Figure 40: Students reporting 'usually' or 'always' using sun protection measures, ACT 1996, 1999 & 2002 (%).
Source: 1996, 1999 & 2002 ASSAD, confidential unit record files, ACT Health. Wore a hat There was a significant decrease, between 1996 (53.1%) and 2002 (43.6%), in the proportion of students who reported ‘usually’ or ‘always’ wearing a hat when outside for an hour or more on a sunny day in summer, between 11am and 3pm (p=0.000).
0
10
20
30
40
50
60
12-15 years 16-17 years A ll A ges (12-17 years)
Age group
Per c
ent
1999
2002
0
10
20
30
40
50
60
70
Sun protection measures
Per c
ent
1996
19992002

80
Younger students (12 to 15 years) were significantly more likely to report wearing a hat than older students (16 to 17 years), for each of the three survey years. In 2002, for instance, 47.7 per cent of students between 12 and 15 years reported ‘usually’ or ‘always’ wearing a hat, compared to 34.9 per cent of students between 16 and 17 years (p=0.000). Males were also significantly more likely to report ‘usually’ or ‘always’ wearing a hat than females, for each of the three survey years. In 2002, 52.4 per cent of males reported wearing a hat, compared to 35.3 per cent of females (p=0.000). Analysis was also undertaken to determine whether students who reported not usually wearing a hat adopted other sun protection measures. In 2002, students who reported they were unlikely to wear a hat on a sunny day were also unlikely to report they adopted other sun protection measures. For instance, only about a third (36.3%) of students who reported they were unlikely to wear a hat reported that they were likely to use a maximum protection sunscreen and only 15 per cent reported they were likely to wear clothes to protect themselves from the sun. The popularity of different hat types appears to have changed over time with changes in fashion. In 1996, the most popular types of hat reported by students were the ‘cap’ (72%) and the ‘wide brimmed hat’ (7.2%). The ‘cap’ (56.6%) and the ‘wide brimmed hat’ (11.6%) were also the most popular types of hat in 1999. By 2002, however, the ‘cap’ (44.2%) and the ‘wide brimmed hat’ (8.6%) had declined in popularity and the ‘narrow brimmed hat’ (11.7%), and ‘sun-visor’ (6.4%) were becoming more popular (Figure 41). Figure 41: Type of hat most often worn on a sunny day in summer, ACT 1996, 1999 & 2002 (%).
Source: 1996, 1999 & 2002 ASSAD, confidential unit record files, ACT Health. * Estimate has a relative standard error between 25 and 50% and should be interpreted with caution. ** Estimate has a relative standard error greater than 50% and is considered unreliable for general use. Wore clothes to cover most of the body including arms and legs There was a significant decrease between 1996 (27.3%) and 2002 (19.8%) in the proportion of students who reported ‘usually’ or ‘always’ wearing clothes to cover most of their body (p=0.000). Males were significantly more likely to report ‘usually’ or ‘always’ wearing clothes to cover most of their body, than females, for each of the three survey years. In 2002, for instance, 25.7 per cent of males reported wearing clothes to cover most of their body, compared to 14.3 per cent of females (p=0.000). Deliberately wore less or briefer clothing Students were asked if they deliberately wore less or briefer clothing so as to get some sun on their skin. There was a significant increase in the proportion of students who reported ‘usually’ or ‘always’ wearing less or briefer clothing in order to expose their skin to the sun between 1996 (14%) and 2002 (23.2%) (p=0.000). Females were significantly more likely to report ‘usually’ or ‘always’ wearing briefer clothing than males, for each of the three survey years. In 2002, for instance, 30.2 per cent of females reported wearing briefer clothing, compared to 15.8 per cent of males (p=0.000).
* ** *** *0
10
20
30
40
50
60
70
80
W id eb rimmed hat
N arrowb rimmed hat
C ap Sun- viso r Ot her t yp eo f hat
N o hat wo rn
Hat type
Per c
ent
1996
1999
2002
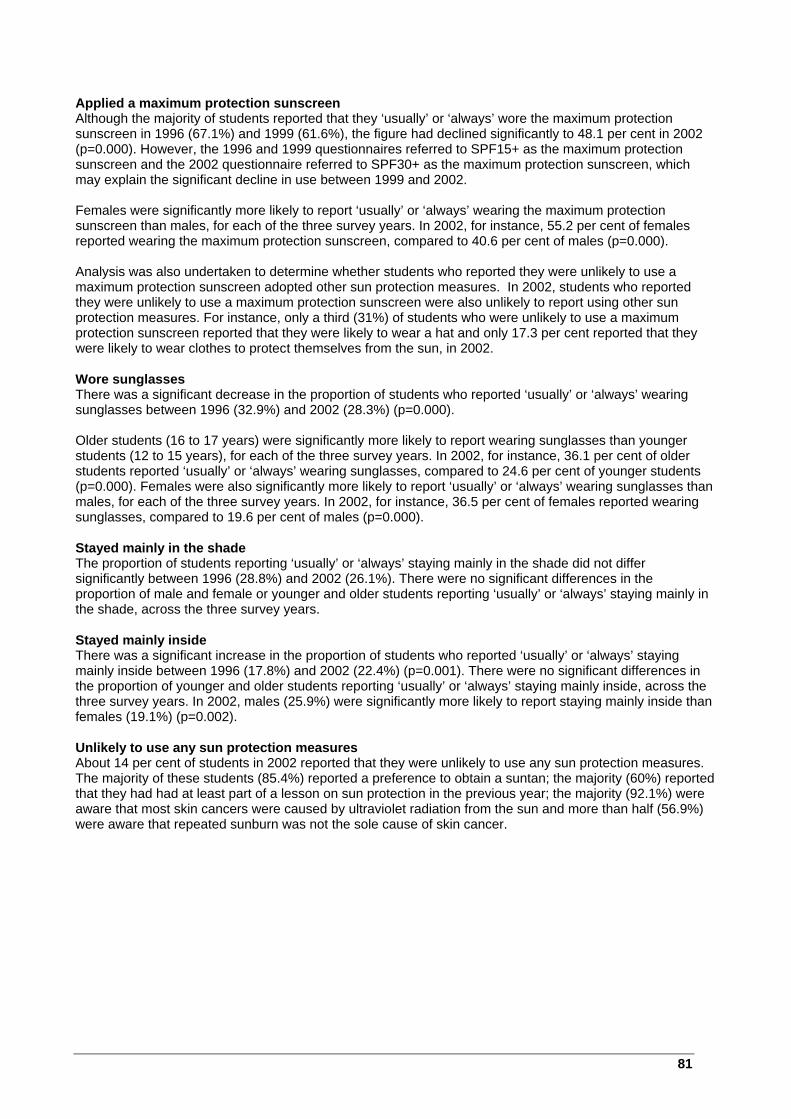
81
Applied a maximum protection sunscreen Although the majority of students reported that they ‘usually’ or ‘always’ wore the maximum protection sunscreen in 1996 (67.1%) and 1999 (61.6%), the figure had declined significantly to 48.1 per cent in 2002 (p=0.000). However, the 1996 and 1999 questionnaires referred to SPF15+ as the maximum protection sunscreen and the 2002 questionnaire referred to SPF30+ as the maximum protection sunscreen, which may explain the significant decline in use between 1999 and 2002. Females were significantly more likely to report ‘usually’ or ‘always’ wearing the maximum protection sunscreen than males, for each of the three survey years. In 2002, for instance, 55.2 per cent of females reported wearing the maximum protection sunscreen, compared to 40.6 per cent of males (p=0.000). Analysis was also undertaken to determine whether students who reported they were unlikely to use a maximum protection sunscreen adopted other sun protection measures. In 2002, students who reported they were unlikely to use a maximum protection sunscreen were also unlikely to report using other sun protection measures. For instance, only a third (31%) of students who were unlikely to use a maximum protection sunscreen reported that they were likely to wear a hat and only 17.3 per cent reported that they were likely to wear clothes to protect themselves from the sun, in 2002. Wore sunglasses There was a significant decrease in the proportion of students who reported ‘usually’ or ‘always’ wearing sunglasses between 1996 (32.9%) and 2002 (28.3%) (p=0.000). Older students (16 to 17 years) were significantly more likely to report wearing sunglasses than younger students (12 to 15 years), for each of the three survey years. In 2002, for instance, 36.1 per cent of older students reported ‘usually’ or ‘always’ wearing sunglasses, compared to 24.6 per cent of younger students (p=0.000). Females were also significantly more likely to report ‘usually’ or ‘always’ wearing sunglasses than males, for each of the three survey years. In 2002, for instance, 36.5 per cent of females reported wearing sunglasses, compared to 19.6 per cent of males (p=0.000). Stayed mainly in the shade The proportion of students reporting ‘usually’ or ‘always’ staying mainly in the shade did not differ significantly between 1996 (28.8%) and 2002 (26.1%). There were no significant differences in the proportion of male and female or younger and older students reporting ‘usually’ or ‘always’ staying mainly in the shade, across the three survey years. Stayed mainly inside There was a significant increase in the proportion of students who reported ‘usually’ or ‘always’ staying mainly inside between 1996 (17.8%) and 2002 (22.4%) (p=0.001). There were no significant differences in the proportion of younger and older students reporting ‘usually’ or ‘always’ staying mainly inside, across the three survey years. In 2002, males (25.9%) were significantly more likely to report staying mainly inside than females (19.1%) (p=0.002). Unlikely to use any sun protection measures About 14 per cent of students in 2002 reported that they were unlikely to use any sun protection measures. The majority of these students (85.4%) reported a preference to obtain a suntan; the majority (60%) reported that they had had at least part of a lesson on sun protection in the previous year; the majority (92.1%) were aware that most skin cancers were caused by ultraviolet radiation from the sun and more than half (56.9%) were aware that repeated sunburn was not the sole cause of skin cancer.
82
APPENDICES

83
TABLES ALCOHOL CONSUMPTION Table 29: Previous and recent alcohol consumption by age group and sex, ACT 2002 (%).
Source: 2002 ASSAD, confidential unit record file, ACT Health. * Estimate has a relative standard error between 25 and 50% and should be interpreted with caution.
Age GroupDrinker category and sex. 12-15 years 16-17 years Total
Never drank Male 12.0 5.7* 10.0 Female 12.3 6.5* 10.5
Drank in last year Male 69.0 88.4 75.3 Female 67.4 86.6 73.5
Drank in last month Male 41.8 62.8 48.6 Female 38.1 66.7 47.2
Drank in last week (recent drinker) Male 27.1 44.1 32.6 Female 21.8 47.0 29.8
Mean number of alcoholic drinks perweek among recent drinkers Male 6.3 13.5 9.5 Female 6.8 5.3 6.1
Describe self as an 'occasional drinker' Male 28.6 27.5 28.3 Female 24.9 30.1 26.5
Describe self as a 'party drinker' Male 10.4* 32.9 17.8 Female 12.7 38.0 20.7
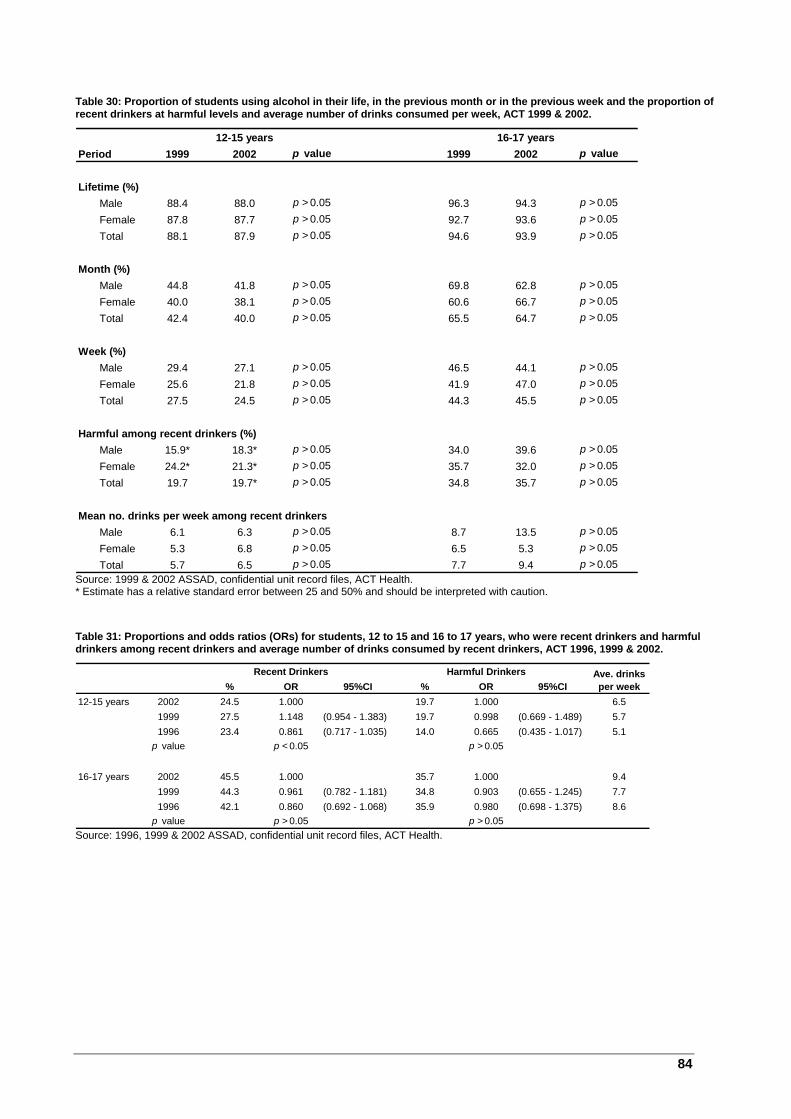
84
Table 30: Proportion of students using alcohol in their life, in the previous month or in the previous week and the proportion of recent drinkers at harmful levels and average number of drinks consumed per week, ACT 1999 & 2002.
Source: 1999 & 2002 ASSAD, confidential unit record files, ACT Health. * Estimate has a relative standard error between 25 and 50% and should be interpreted with caution.
Table 31: Proportions and odds ratios (ORs) for students, 12 to 15 and 16 to 17 years, who were recent drinkers and harmful drinkers among recent drinkers and average number of drinks consumed by recent drinkers, ACT 1996, 1999 & 2002.
Source: 1996, 1999 & 2002 ASSAD, confidential unit record files, ACT Health.
12-15 years 16-17 yearsPeriod 1999 2002 p value 1999 2002 p value
Lifetime (%) Male 88.4 88.0 p > 0.05 96.3 94.3 p > 0.05 Female 87.8 87.7 p > 0.05 92.7 93.6 p > 0.05 Total 88.1 87.9 p > 0.05 94.6 93.9 p > 0.05
Month (%) Male 44.8 41.8 p > 0.05 69.8 62.8 p > 0.05 Female 40.0 38.1 p > 0.05 60.6 66.7 p > 0.05 Total 42.4 40.0 p > 0.05 65.5 64.7 p > 0.05
Week (%) Male 29.4 27.1 p > 0.05 46.5 44.1 p > 0.05 Female 25.6 21.8 p > 0.05 41.9 47.0 p > 0.05 Total 27.5 24.5 p > 0.05 44.3 45.5 p > 0.05
Harmful among recent drinkers (%) Male 15.9* 18.3* p > 0.05 34.0 39.6 p > 0.05 Female 24.2* 21.3* p > 0.05 35.7 32.0 p > 0.05 Total 19.7 19.7* p > 0.05 34.8 35.7 p > 0.05
Mean no. drinks per week among recent drinkers Male 6.1 6.3 p > 0.05 8.7 13.5 p > 0.05 Female 5.3 6.8 p > 0.05 6.5 5.3 p > 0.05 Total 5.7 6.5 p > 0.05 7.7 9.4 p > 0.05
Recent Drinkers Harmful Drinkers% OR 95%CI % OR 95%CI
12-15 years 2002 24.5 1.000 19.7 1.000 6.51999 27.5 1.148 (0.954 - 1.383) 19.7 0.998 (0.669 - 1.489) 5.71996 23.4 0.861 (0.717 - 1.035) 14.0 0.665 (0.435 - 1.017) 5.1
p value p < 0.05 p > 0.05
16-17 years 2002 45.5 1.000 35.7 1.000 9.41999 44.3 0.961 (0.782 - 1.181) 34.8 0.903 (0.655 - 1.245) 7.71996 42.1 0.860 (0.692 - 1.068) 35.9 0.980 (0.698 - 1.375) 8.6
p value p > 0.05 p > 0.05
Ave. drinks per week

85
Table 32: Ever had a drink, by age, ACT 2002 (%).
Source: 2002 ASSAD, confidential unit record file, ACT Health. * Estimate has a relative standard error between 25 and 50% and should be interpreted with caution. ** Estimate has a relative standard error greater than 50% and is considered unreliable for general use. Table 33: Had a drink in the last 12 months, by age and sex, ACT 1996, 1999 & 2002 (%).
Source: 1996, 1999 & 2002 ASSAD, confidential unit record files, ACT Health. * Estimate has a relative standard error between 25 and 50% and should be interpreted with caution. Table 34: Had a drink in the last four weeks, by age and sex, ACT 1996, 1999 & 2002 (%).
Source: 1996, 1999 & 2002 ASSAD, confidential unit record files, ACT Health. * Estimate has a relative standard error between 25 and 50% and should be interpreted with caution. ** Estimate has a relative standard error greater than 50% and is considered unreliable for general use. Table 35: Students who had consumed alcohol in the last week by age and sex, ACT 1996, 1999 & 2002 (%).
Source: 1996, 1999 & 2002 ASSAD, confidential unit record files, ACT Health. * Estimate has a relative standard error between 25 and 50% and should be interpreted with caution. ** Estimate has a relative standard error greater than 50% and is considered unreliable for general use.
Students' age in years12 13 14 15 16 17 All ages
No 18.1* 15.8* 9.3* 5.4* 5.4* 6.7* 10.2Yes few sips 58.3 52.9 35.4 24.9 16.2 12.2* 33.8Yes <10 drinks ** 17.0* 22.0 25.3 17.9 13.7* 18.1Yes >10 drinks ** 14.3* 33.3 44.5 60.5 67.3 37.9
Males Females1996 1999 2002 1996 1999 2002
12 years 63.5 60.2 56.8* 42.3 49.3 50.7*13 years 64.5 68.8 60.9 60.0 68.7 57.714 years 73.4 76.5 75.4 72.8 77.9 79.415 years 75.7 85.3 83.1 86.2 88.3 82.216 years 83.8 88.1 88.0 88.2 88.7 85.217 years 89.3 90.6 88.9 92.1 85.6 88.0
Males Females1996 1999 2002 1996 1999 2002
12 years 63.5 60.2 56.8* 42.3 49.3 50.7*13 years 64.5 68.8 60.9 60.0 68.7 57.714 years 73.4 76.5 75.4 72.8 77.9 79.415 years 75.7 85.3 83.1 86.2 88.3 82.216 years 83.8 88.1 88.0 88.2 88.7 85.217 years 89.3 90.6 88.9 92.1 85.6 88.0
Males Females1996 1999 2002 1996 1999 2002
12 years 63.5 60.2 56.8* 42.3 49.3 50.7*13 years 64.5 68.8 60.9 60.0 68.7 57.714 years 73.4 76.5 75.4 72.8 77.9 79.415 years 75.7 85.3 83.1 86.2 88.3 82.216 years 83.8 88.1 88.0 88.2 88.7 85.217 years 89.3 90.6 88.9 92.1 85.6 88.0
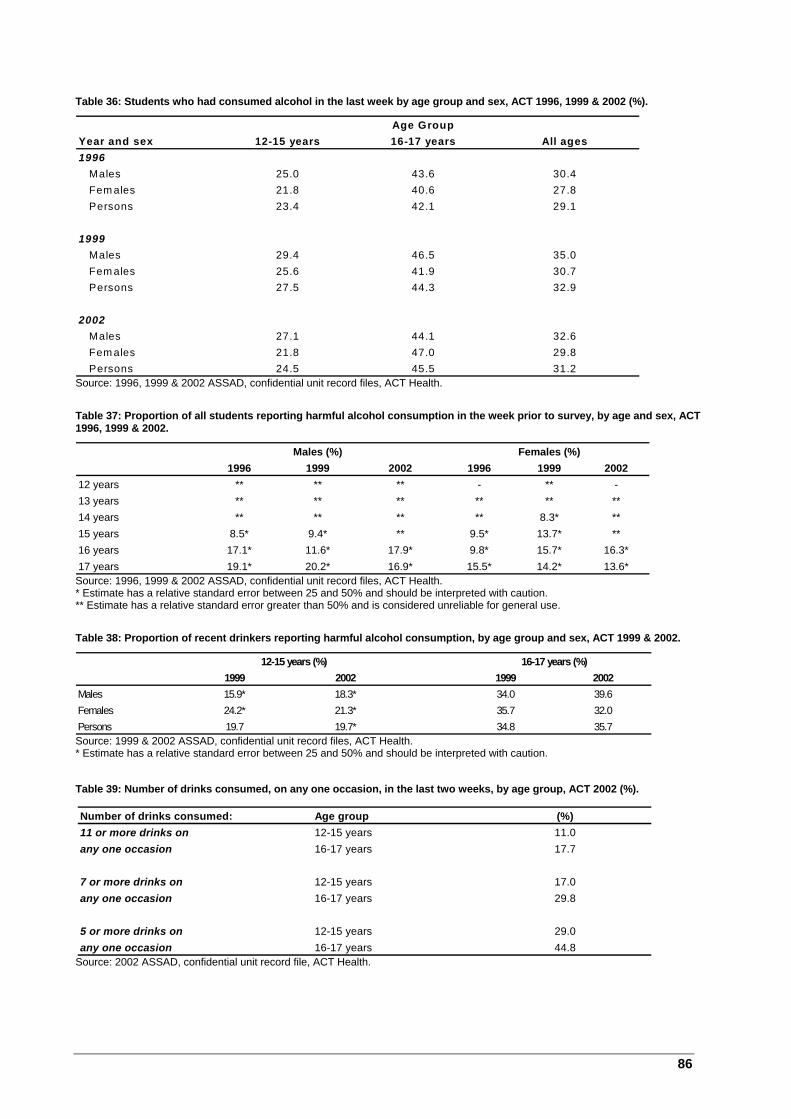
86
Table 36: Students who had consumed alcohol in the last week by age group and sex, ACT 1996, 1999 & 2002 (%).
Source: 1996, 1999 & 2002 ASSAD, confidential unit record files, ACT Health.
Table 37: Proportion of all students reporting harmful alcohol consumption in the week prior to survey, by age and sex, ACT 1996, 1999 & 2002.
Source: 1996, 1999 & 2002 ASSAD, confidential unit record files, ACT Health. * Estimate has a relative standard error between 25 and 50% and should be interpreted with caution. ** Estimate has a relative standard error greater than 50% and is considered unreliable for general use.
Table 38: Proportion of recent drinkers reporting harmful alcohol consumption, by age group and sex, ACT 1999 & 2002.
Source: 1999 & 2002 ASSAD, confidential unit record files, ACT Health. * Estimate has a relative standard error between 25 and 50% and should be interpreted with caution. Table 39: Number of drinks consumed, on any one occasion, in the last two weeks, by age group, ACT 2002 (%).
Source: 2002 ASSAD, confidential unit record file, ACT Health.
Males (%) Females (%)1996 1999 2002 1996 1999 2002
12 years ** ** ** - ** -13 years ** ** ** ** ** **14 years ** ** ** ** 8.3* **15 years 8.5* 9.4* ** 9.5* 13.7* **16 years 17.1* 11.6* 17.9* 9.8* 15.7* 16.3*17 years 19.1* 20.2* 16.9* 15.5* 14.2* 13.6*
Age GroupYear and sex 12-15 years 16-17 years All ages1996 Males 25.0 43.6 30.4 Fem ales 21.8 40.6 27.8 Persons 23.4 42.1 29.1
1999 Males 29.4 46.5 35.0 Fem ales 25.6 41.9 30.7 Persons 27.5 44.3 32.9
2002 Males 27.1 44.1 32.6 Fem ales 21.8 47.0 29.8 Persons 24.5 45.5 31.2
1999 2002 1999 2002Males 15.9* 18.3* 34.0 39.6Females 24.2* 21.3* 35.7 32.0Persons 19.7 19.7* 34.8 35.7
12-15 years (%) 16-17 years (%)
Number of drinks consumed: Age group (%)11 or more drinks on 12-15 years 11.0any one occasion 16-17 years 17.7
7 or more drinks on 12-15 years 17.0any one occasion 16-17 years 29.8
5 or more drinks on 12-15 years 29.0any one occasion 16-17 years 44.8

87
Table 40: Number of drinks consumed in the last two weeks, by frequency of occasions, ACT 2002 (%).
Source: 2002 ASSAD, confidential unit record file, ACT Health. * Estimate has a relative standard error between 25 and 50% and should be interpreted with caution. ** Estimate has a relative standard error greater than 50% and is considered unreliable for general use. Table 41: Self-described drinking status, ACT 1996, 1999 & 2002 (%).
Source: 1996, 1999 & 2002 ASSAD, confidential unit record files, ACT Health. * Estimate has a relative standard error between 25 and 50% and should be interpreted with caution. Table 42: Self-described drinking status, by number of drinks consumed, at least once, on any one occasion, in the last two weeks, ACT 2002 (%).
Source: 2002 ASSAD, confidential unit record file, ACT Health. * Estimate has a relative standard error between 25 and 50% and should be interpreted with caution. ** Estimate has a relative standard error greater than 50% and is considered unreliable for general use.
1996 1999 2002Non-drinkers 50.8 44.3 47.4Occasional drinkers 24.1 27.8 27.4Light drinkers 4.6 4.9 4.4Party drinkers 19.0 21.1 19.2Heavy drinkers 1.5* 1.9* 1.6*
Consumed 5 or Consumed 7 or Consumed 11 or more drinks more drinks more drinks
Non-drinkers 4.6* ** **Occasional drinkers 28.7 11.9* 6.8*Light drinkers 56.4 28.8* 22.1*Party drinkers 73.7 56.1 34.9Heavy drinkers 100.0 94.3 85.8
Number of of times in last two weeks had: (%)11 or more drinks on any one occasion None 86.5
Once 5.8Twice 3.0*3-6 times 2.2*7-9 times **10 or more times 2.1*
7 or more drinks on any one occasion None 78.2Once 9.3Twice 5.43-6 times 3.4*7-9 times 1.5*10 or more times 2.3*
5 or more drinks on any one occasion None 65.1Once 15.4Twice 8.53-6 times 4.5*7-9 times 2.6*10 or more times 3.9*
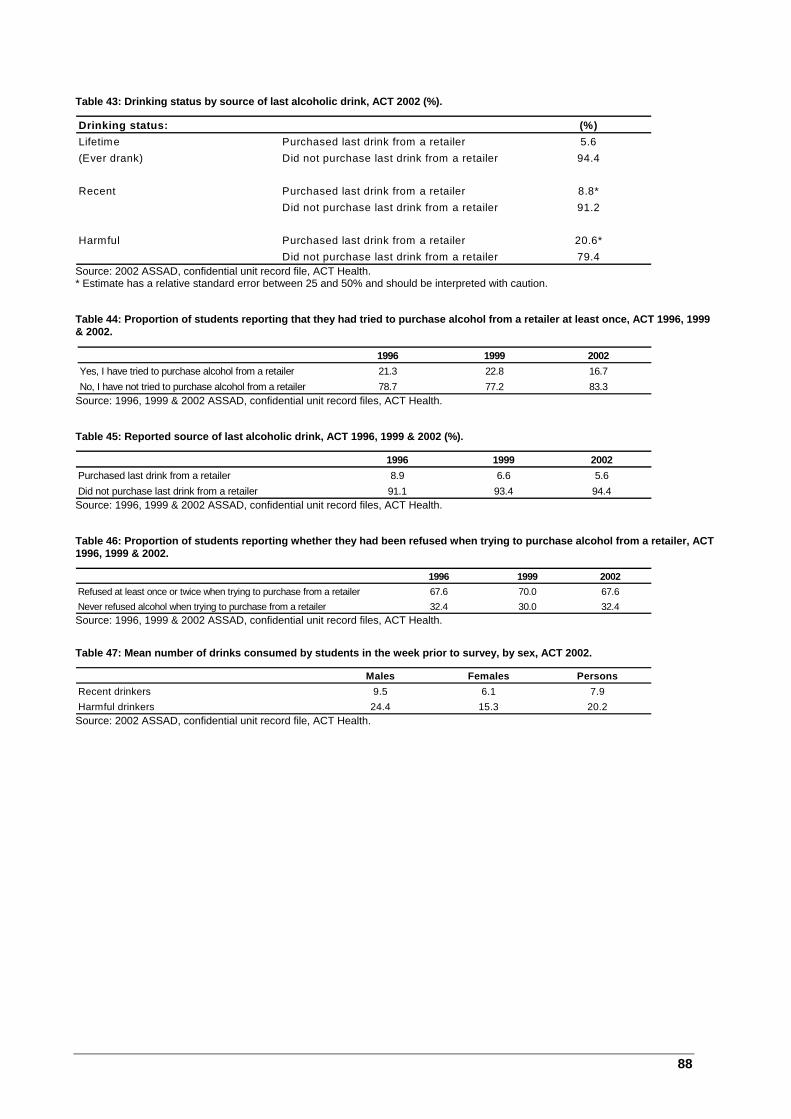
88
Table 43: Drinking status by source of last alcoholic drink, ACT 2002 (%).
Source: 2002 ASSAD, confidential unit record file, ACT Health. * Estimate has a relative standard error between 25 and 50% and should be interpreted with caution. Table 44: Proportion of students reporting that they had tried to purchase alcohol from a retailer at least once, ACT 1996, 1999 & 2002.
Source: 1996, 1999 & 2002 ASSAD, confidential unit record files, ACT Health. Table 45: Reported source of last alcoholic drink, ACT 1996, 1999 & 2002 (%).
Source: 1996, 1999 & 2002 ASSAD, confidential unit record files, ACT Health. Table 46: Proportion of students reporting whether they had been refused when trying to purchase alcohol from a retailer, ACT 1996, 1999 & 2002.
Source: 1996, 1999 & 2002 ASSAD, confidential unit record files, ACT Health.
Table 47: Mean number of drinks consumed by students in the week prior to survey, by sex, ACT 2002.
Source: 2002 ASSAD, confidential unit record file, ACT Health.
Drinking status: (%)Lifetime Purchased last drink from a retailer 5.6(Ever drank) Did not purchase last drink from a retailer 94.4
Recent Purchased last drink from a retailer 8.8*Did not purchase last drink from a retailer 91.2
Harmful Purchased last drink from a retailer 20.6*Did not purchase last drink from a retailer 79.4
1996 1999 2002Yes, I have tried to purchase alcohol from a retailer 21.3 22.8 16.7No, I have not tried to purchase alcohol from a retailer 78.7 77.2 83.3
1996 1999 2002Purchased last drink from a retailer 8.9 6.6 5.6Did not purchase last drink from a retailer 91.1 93.4 94.4
1996 1999 2002Refused at least once or twice when trying to purchase from a retailer 67.6 70.0 67.6Never refused alcohol when trying to purchase from a retailer 32.4 30.0 32.4
Males Females PersonsRecent drinkers 9.5 6.1 7.9Harmful drinkers 24.4 15.3 20.2
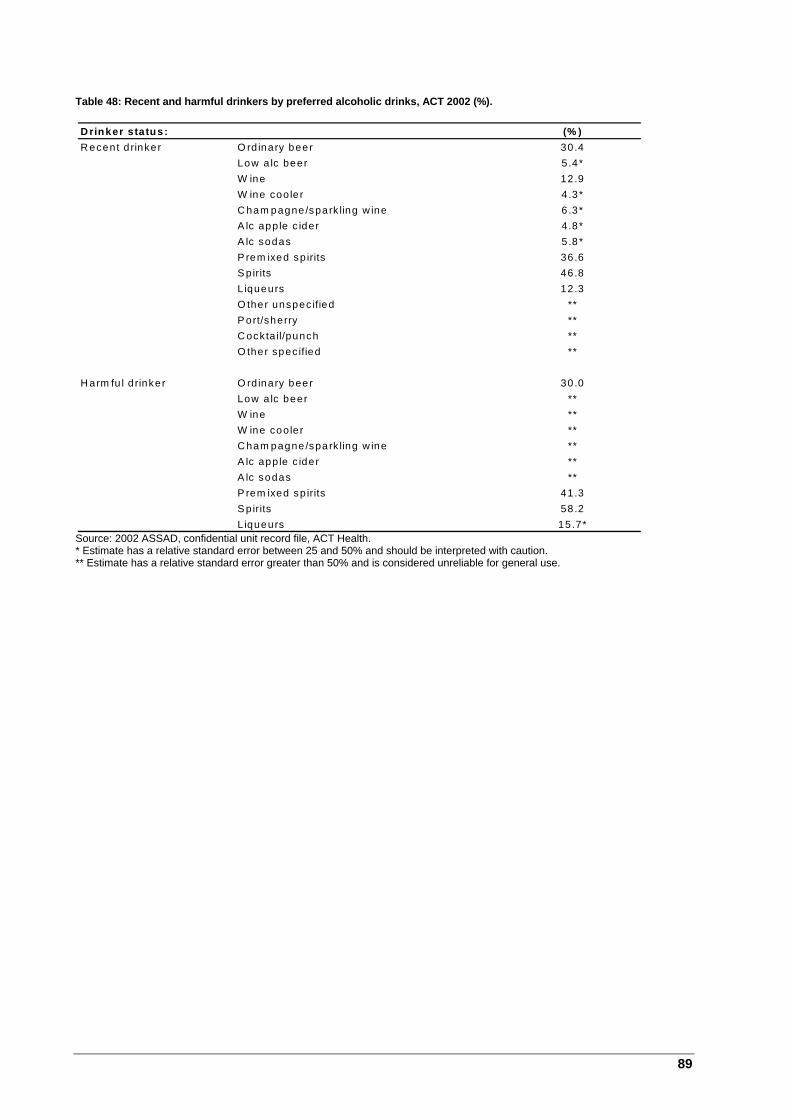
89
Table 48: Recent and harmful drinkers by preferred alcoholic drinks, ACT 2002 (%).
Source: 2002 ASSAD, confidential unit record file, ACT Health. * Estimate has a relative standard error between 25 and 50% and should be interpreted with caution. ** Estimate has a relative standard error greater than 50% and is considered unreliable for general use.
D rinker status: (% )R ecent d rinker O rd inary beer 30 .4 Low a lc beer 5 .4*
W ine 12.9W ine coo le r 4 .3*C ham pagne/spark ling w ine 6 .3*A lc app le c ider 4 .8*A lc sodas 5 .8*P rem ixed sp irits 36 .6S pirits 46 .8L iqueurs 12 .3O ther unspec ified **P ort/sherry **C ockta il/punch **O ther spec ified **
H arm fu l d rinker O rd inary beer 30 .0 Low a lc beer **
W ine **W ine coo le r **C ham pagne/spark ling w ine **A lc app le c ider **A lc sodas **P rem ixed sp irits 41 .3S pirits 58 .2L iqueurs 15.7*
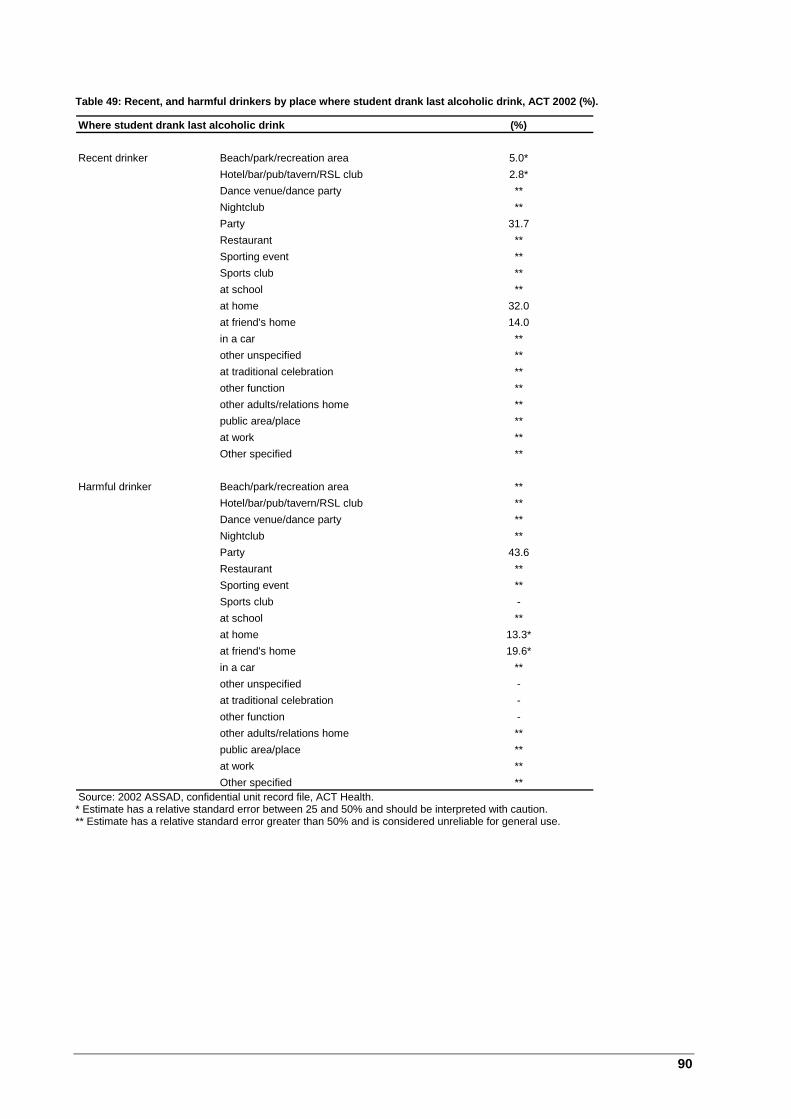
90
Table 49: Recent, and harmful drinkers by place where student drank last alcoholic drink, ACT 2002 (%).
Source: 2002 ASSAD, confidential unit record file, ACT Health. * Estimate has a relative standard error between 25 and 50% and should be interpreted with caution. ** Estimate has a relative standard error greater than 50% and is considered unreliable for general use.
Where student drank last alcoholic drink (%)
Recent drinker Beach/park/recreation area 5.0* Hotel/bar/pub/tavern/RSL club 2.8* Dance venue/dance party ** Nightclub ** Party 31.7 Restaurant ** Sporting event ** Sports club ** at school ** at home 32.0 at friend's home 14.0 in a car ** other unspecified ** at traditional celebration ** other function ** other adults/relations home ** public area/place ** at work ** Other specified **
Harmful drinker Beach/park/recreation area ** Hotel/bar/pub/tavern/RSL club ** Dance venue/dance party ** Nightclub ** Party 43.6 Restaurant ** Sporting event ** Sports club - at school ** at home 13.3* at friend's home 19.6* in a car ** other unspecified - at traditional celebration - other function - other adults/relations home ** public area/place ** at work ** Other specified **

91
Table 50: Recent, and harmful drinkers' attitudes to drinking, ACT 2002 (%).
Source: 2002 ASSAD, confidential unit record file, ACT Health. Table 51: Student attitudes to drinking, by age group, ACT 2002 (%).
Source: 2002 ASSAD, confidential unit record file, ACT Health. Table 52: Perceived danger in having five or more drinks of beer, wine or spirits in a row, by sex, ACT 2002 (%).
Source: 2002 ASSAD, confidential unit record file, ACT Health. * Estimate has a relative standard error between 25 and 50% and should be interpreted with caution.
Agree or strongly agree that: (%)Recent drinkers Occasionally getting drunk is no problem 67.8
Drinking is the best way of relaxing 52.7Drinking is the best way to get to know people 51.0Drinking makes you part of the group 32.8You can have a good party without alcohol 74.1Drinkers are usually more popular 35.4
Harmful drinkers Occasionally getting drunk is no problem 75.3Drinking is the best way of relaxing 56.3Drinking is the best way to get to know people 64.9Drinking makes you part of the group 39.2You can have a good party without alcohol 68.6Drinkers are usually more popular 39.7
Agree or strongly agree that: (%)12-15 years Occasionally getting drunk is no problem 38.2
Drinking is the best way of relaxing 31.4Drinking is the best way to get to know people 25.9Drinking makes you part of the group 22.0You can have a good party without alcohol 82.9Drinkers are usually more popular 31.0
16-17 years Occasionally getting drunk is no problem 57.2Drinking is the best way of relaxing 37.3Drinking is the best way to get to know people 38.2Drinking makes you part of the group 26.1You can have a good party without alcohol 78.0Drinkers are usually more popular 27.1
L eve l o f p e rce ived d an g er: (% )M a les N o t da nge rous 18 .3
A litt le dange rous 41 .2V e ry dange rous 34 .5D on 't know 6 .0 *
F em a les N o t da nge rous 10 .3A litt le dange rous 40 .6V e ry dange rous 45 .0D on 't know 4 .0 *

92
Table 53: Recent and harmful drinkers by perceived danger in having five or more drinks of beer, wine or spirits in a row, ACT 2002 (%).
Source: 2002 ASSAD, confidential unit record file, ACT Health. * Estimate has a relative standard error between 25 and 50% and should be interpreted with caution. ** Estimate has a relative standard error greater than 50% and is considered unreliable for general use. Table 54: Recent and harmful drinkers having received at least part of a lesson in class on alcohol in the previous 12 months, by age, ACT 1996, 1999 & 2002 (%).
Source: 1996, 1999 & 2002 ASSAD, confidential unit record files, ACT Health. * Estimate has a relative standard error between 25 and 50% and should be interpreted with caution. ** Estimate has a relative standard error greater than 50% and is considered unreliable for general use.
Recent drinkers Harmful drinkers1996 1999 2002 1996 1999 2002
12 years 68.9* 77.5 74.3* - - -13 years 87.6 76.1 85.5 ** 80.2* -14 years 77.5 86.0 83.9 - 92.7 -15 years 76.0 84.6 92.1 75.1 86.4 82.816 years 76.2 86.1 85.2 75.5 89.4 82.217 years 67.0 70.8 78.6 64.2 67.5 76.0All ages 75.2 81.0 83.9 72.8 82.1 84.3
L e v e l o f p e rc e iv e d d a n g e r: (% )R e c e n t d rin k e rs N o t d a n g e ro u s 2 5 .5
A litt le d a n g e ro u s 5 0 .8V e ry d a n g e ro u s 1 9 .4D o n 't k n o w 4 .3 *
H a rm fu l d rin ke rs N o t d a n g e ro u s 3 0 .2A litt le d a n g e ro u s 4 9 .4V e ry d a n g e ro u s 1 5 .1 *D o n 't k n o w **
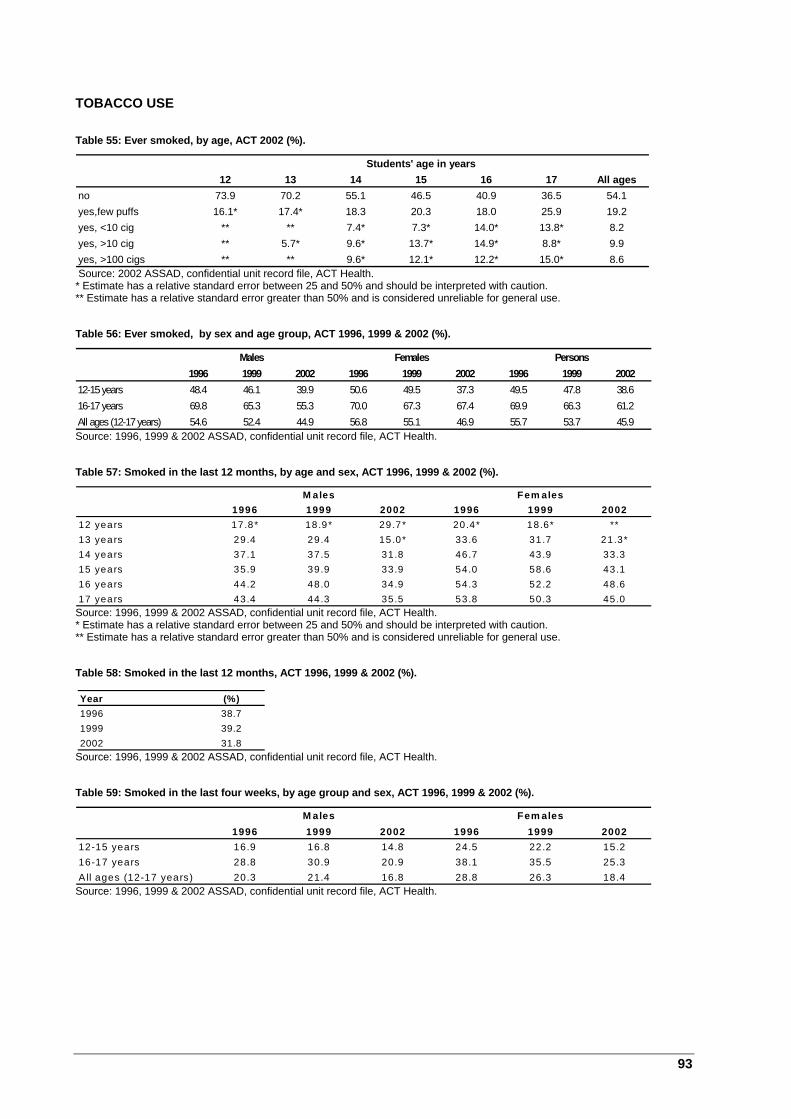
93
TOBACCO USE Table 55: Ever smoked, by age, ACT 2002 (%).
Source: 2002 ASSAD, confidential unit record file, ACT Health. * Estimate has a relative standard error between 25 and 50% and should be interpreted with caution. ** Estimate has a relative standard error greater than 50% and is considered unreliable for general use. Table 56: Ever smoked, by sex and age group, ACT 1996, 1999 & 2002 (%).
Source: 1996, 1999 & 2002 ASSAD, confidential unit record file, ACT Health. Table 57: Smoked in the last 12 months, by age and sex, ACT 1996, 1999 & 2002 (%).
Source: 1996, 1999 & 2002 ASSAD, confidential unit record file, ACT Health. * Estimate has a relative standard error between 25 and 50% and should be interpreted with caution. ** Estimate has a relative standard error greater than 50% and is considered unreliable for general use. Table 58: Smoked in the last 12 months, ACT 1996, 1999 & 2002 (%).
Source: 1996, 1999 & 2002 ASSAD, confidential unit record file, ACT Health. Table 59: Smoked in the last four weeks, by age group and sex, ACT 1996, 1999 & 2002 (%).
Source: 1996, 1999 & 2002 ASSAD, confidential unit record file, ACT Health.
Students' age in years12 13 14 15 16 17 All ages
no 73.9 70.2 55.1 46.5 40.9 36.5 54.1yes,few puffs 16.1* 17.4* 18.3 20.3 18.0 25.9 19.2yes, <10 cig ** ** 7.4* 7.3* 14.0* 13.8* 8.2yes, >10 cig ** 5.7* 9.6* 13.7* 14.9* 8.8* 9.9yes, >100 cigs ** ** 9.6* 12.1* 12.2* 15.0* 8.6
Males Females Persons1996 1999 2002 1996 1999 2002 1996 1999 2002
12-15 years 48.4 46.1 39.9 50.6 49.5 37.3 49.5 47.8 38.616-17 years 69.8 65.3 55.3 70.0 67.3 67.4 69.9 66.3 61.2All ages (12-17 years) 54.6 52.4 44.9 56.8 55.1 46.9 55.7 53.7 45.9
M ales Fem ales1996 1999 2002 1996 1999 2002
12 years 17.8* 18.9* 29.7* 20.4* 18.6* **13 years 29.4 29.4 15.0* 33.6 31.7 21.3*14 years 37.1 37.5 31.8 46.7 43.9 33.315 years 35.9 39.9 33.9 54.0 58.6 43.116 years 44.2 48.0 34.9 54.3 52.2 48.617 years 43.4 44.3 35.5 53.8 50.3 45.0
Year (%)1996 38.71999 39.22002 31.8
M ales Fem ales1996 1999 2002 1996 1999 2002
12-15 years 16.9 16.8 14.8 24.5 22.2 15.216-17 years 28.8 30.9 20.9 38.1 35.5 25.3A ll ages (12-17 years) 20.3 21.4 16.8 28.8 26.3 18.4
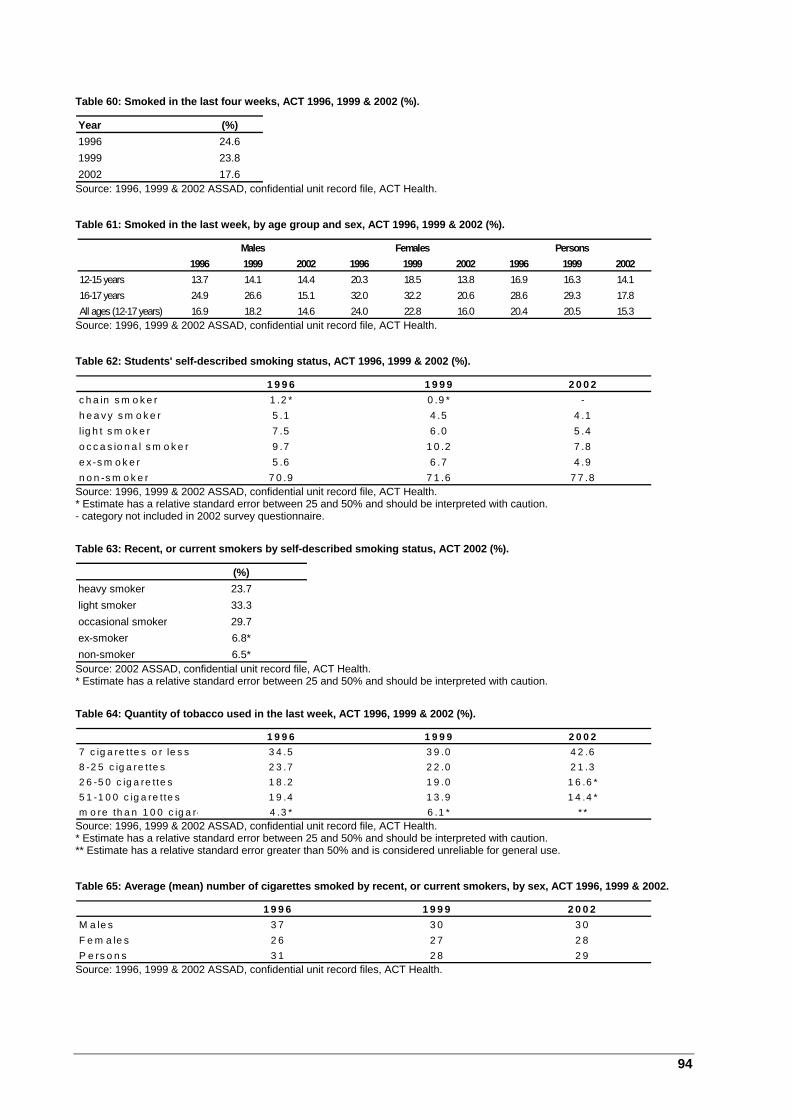
94
Table 60: Smoked in the last four weeks, ACT 1996, 1999 & 2002 (%).
Source: 1996, 1999 & 2002 ASSAD, confidential unit record file, ACT Health. Table 61: Smoked in the last week, by age group and sex, ACT 1996, 1999 & 2002 (%).
Source: 1996, 1999 & 2002 ASSAD, confidential unit record file, ACT Health. Table 62: Students' self-described smoking status, ACT 1996, 1999 & 2002 (%).
Source: 1996, 1999 & 2002 ASSAD, confidential unit record file, ACT Health. * Estimate has a relative standard error between 25 and 50% and should be interpreted with caution. - category not included in 2002 survey questionnaire.
Table 63: Recent, or current smokers by self-described smoking status, ACT 2002 (%).
Source: 2002 ASSAD, confidential unit record file, ACT Health. * Estimate has a relative standard error between 25 and 50% and should be interpreted with caution.
Table 64: Quantity of tobacco used in the last week, ACT 1996, 1999 & 2002 (%).
Source: 1996, 1999 & 2002 ASSAD, confidential unit record file, ACT Health. * Estimate has a relative standard error between 25 and 50% and should be interpreted with caution. ** Estimate has a relative standard error greater than 50% and is considered unreliable for general use. Table 65: Average (mean) number of cigarettes smoked by recent, or current smokers, by sex, ACT 1996, 1999 & 2002.
Source: 1996, 1999 & 2002 ASSAD, confidential unit record files, ACT Health.
Year (%)1996 24.61999 23.82002 17.6
Males Females Persons1996 1999 2002 1996 1999 2002 1996 1999 2002
12-15 years 13.7 14.1 14.4 20.3 18.5 13.8 16.9 16.3 14.116-17 years 24.9 26.6 15.1 32.0 32.2 20.6 28.6 29.3 17.8All ages (12-17 years) 16.9 18.2 14.6 24.0 22.8 16.0 20.4 20.5 15.3
1 9 9 6 1 9 9 9 2 0 0 2c h a in s m o k e r 1 .2 * 0 .9 * -h e a v y s m o k e r 5 .1 4 .5 4 .1lig h t s m o k e r 7 .5 6 .0 5 .4o c c a s io n a l s m o k e r 9 .7 1 0 .2 7 .8e x-s m o k e r 5 .6 6 .7 4 .9n o n -s m o k e r 7 0 .9 7 1 .6 7 7 .8
(%)heavy smoker 23.7light smoker 33.3occasional smoker 29.7ex-smoker 6.8*non-smoker 6.5*
1 9 9 6 1 9 9 9 2 0 0 27 c ig a re t te s o r le s s 3 4 .5 3 9 .0 4 2 .68 -2 5 c ig a re t te s 2 3 .7 2 2 .0 2 1 .32 6 -5 0 c ig a re t te s 1 8 .2 1 9 .0 1 6 .6 *5 1 -1 0 0 c ig a re t te s 1 9 .4 1 3 .9 1 4 .4 *m o re th a n 1 0 0 c ig a re 4 .3 * 6 .1 * * *
1 9 9 6 1 9 9 9 2 0 0 2M a le s 3 7 3 0 3 0F e m a le s 2 6 2 7 2 8P e rs o n s 3 1 2 8 2 9
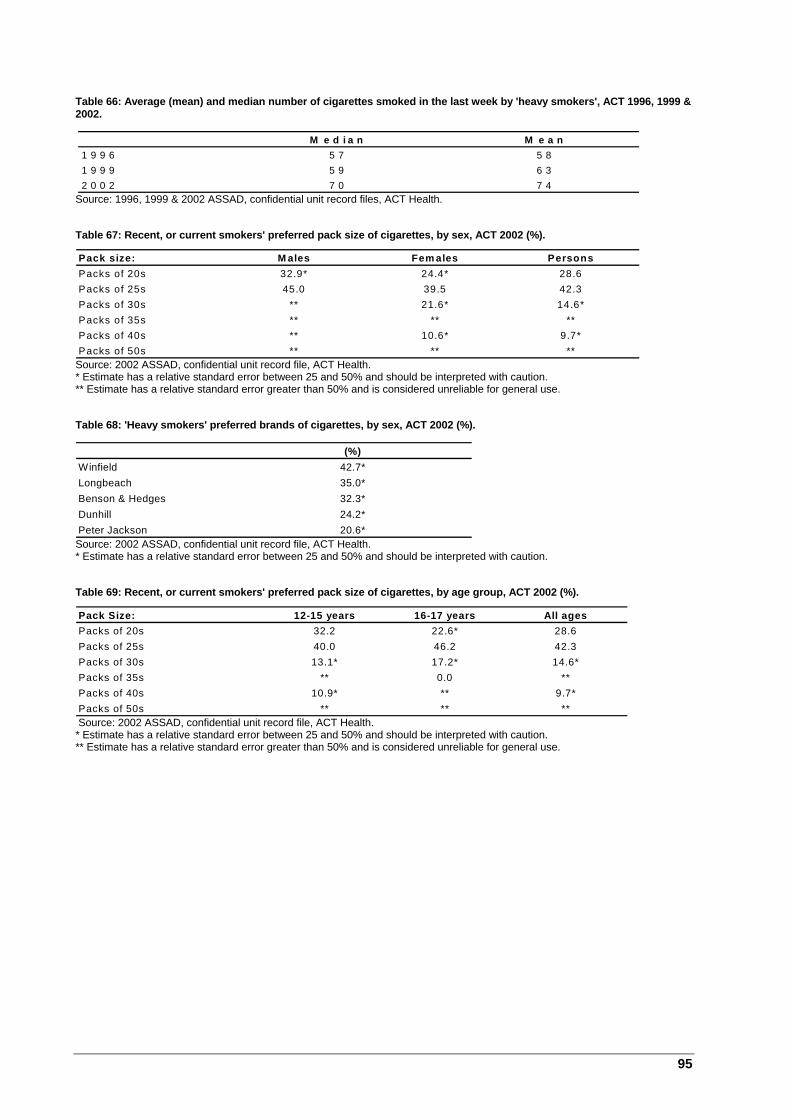
95
Table 66: Average (mean) and median number of cigarettes smoked in the last week by 'heavy smokers', ACT 1996, 1999 & 2002.
Source: 1996, 1999 & 2002 ASSAD, confidential unit record files, ACT Health. Table 67: Recent, or current smokers' preferred pack size of cigarettes, by sex, ACT 2002 (%).
Source: 2002 ASSAD, confidential unit record file, ACT Health. * Estimate has a relative standard error between 25 and 50% and should be interpreted with caution. ** Estimate has a relative standard error greater than 50% and is considered unreliable for general use. Table 68: 'Heavy smokers' preferred brands of cigarettes, by sex, ACT 2002 (%).
Source: 2002 ASSAD, confidential unit record file, ACT Health. * Estimate has a relative standard error between 25 and 50% and should be interpreted with caution. Table 69: Recent, or current smokers' preferred pack size of cigarettes, by age group, ACT 2002 (%).
Source: 2002 ASSAD, confidential unit record file, ACT Health. * Estimate has a relative standard error between 25 and 50% and should be interpreted with caution. ** Estimate has a relative standard error greater than 50% and is considered unreliable for general use.
M e d i a n M e a n1 9 9 6 5 7 5 81 9 9 9 5 9 6 32 0 0 2 7 0 7 4
Pack size: M ales Fem ales PersonsPacks of 20s 32.9* 24.4* 28.6Packs of 25s 45.0 39.5 42.3Packs of 30s ** 21.6* 14.6*Packs of 35s ** ** **Packs of 40s ** 10.6* 9.7*Packs of 50s ** ** **
Pack Size: 12-15 years 16-17 years All agesPacks of 20s 32.2 22.6* 28.6Packs of 25s 40.0 46.2 42.3Packs of 30s 13.1* 17.2* 14.6*Packs of 35s ** 0.0 **Packs of 40s 10.9* ** 9.7*Packs of 50s ** ** **
(%)Winfield 42.7*Longbeach 35.0*Benson & Hedges 32.3*Dunhill 24.2*Peter Jackson 20.6*
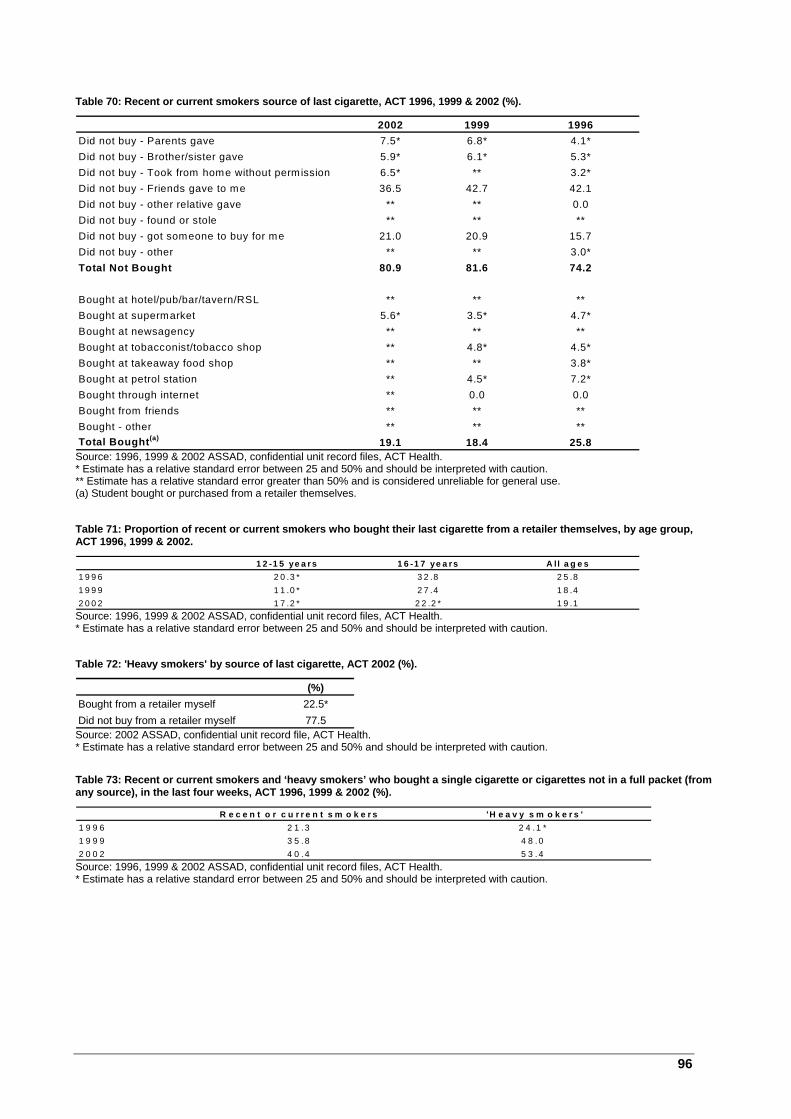
96
Table 70: Recent or current smokers source of last cigarette, ACT 1996, 1999 & 2002 (%).
Source: 1996, 1999 & 2002 ASSAD, confidential unit record files, ACT Health. * Estimate has a relative standard error between 25 and 50% and should be interpreted with caution. ** Estimate has a relative standard error greater than 50% and is considered unreliable for general use. (a) Student bought or purchased from a retailer themselves. Table 71: Proportion of recent or current smokers who bought their last cigarette from a retailer themselves, by age group, ACT 1996, 1999 & 2002.
Source: 1996, 1999 & 2002 ASSAD, confidential unit record files, ACT Health. * Estimate has a relative standard error between 25 and 50% and should be interpreted with caution. Table 72: 'Heavy smokers' by source of last cigarette, ACT 2002 (%).
Source: 2002 ASSAD, confidential unit record file, ACT Health. * Estimate has a relative standard error between 25 and 50% and should be interpreted with caution.
Table 73: Recent or current smokers and ‘heavy smokers’ who bought a single cigarette or cigarettes not in a full packet (from any source), in the last four weeks, ACT 1996, 1999 & 2002 (%).
Source: 1996, 1999 & 2002 ASSAD, confidential unit record files, ACT Health. * Estimate has a relative standard error between 25 and 50% and should be interpreted with caution.
2002 1999 1996Did not buy - Parents gave 7.5* 6.8* 4.1*Did not buy - Brother/sister gave 5.9* 6.1* 5.3*Did not buy - Took from home without permission 6.5* ** 3.2*Did not buy - Friends gave to me 36.5 42.7 42.1Did not buy - other relative gave ** ** 0.0Did not buy - found or stole ** ** **Did not buy - got someone to buy for me 21.0 20.9 15.7Did not buy - other ** ** 3.0*Total Not Bought 80.9 81.6 74.2
Bought at hotel/pub/bar/tavern/RSL ** ** **Bought at supermarket 5.6* 3.5* 4.7*Bought at newsagency ** ** **Bought at tobacconist/tobacco shop ** 4.8* 4.5*Bought at takeaway food shop ** ** 3.8*Bought at petrol station ** 4.5* 7.2*Bought through internet ** 0.0 0.0Bought from friends ** ** **Bought - other ** ** **Total Bought(a) 19.1 18.4 25.8
(%)Bought from a retailer myself 22.5*Did not buy from a retailer myself 77.5
R e c e n t o r c u r r e n t s m o k e r s 'H e a v y s m o k e r s '1 9 9 6 2 1 . 3 2 4 .1 *1 9 9 9 3 5 . 8 4 8 . 02 0 0 2 4 0 . 4 5 3 . 4
1 2 -1 5 ye a r s 1 6 -1 7 ye a rs A ll a g e s1 9 9 6 2 0 .3 * 3 2 .8 2 5 .81 9 9 9 1 1 .0 * 2 7 .4 1 8 .42 0 0 2 1 7 .2 * 2 2 .2 * 1 9 .1
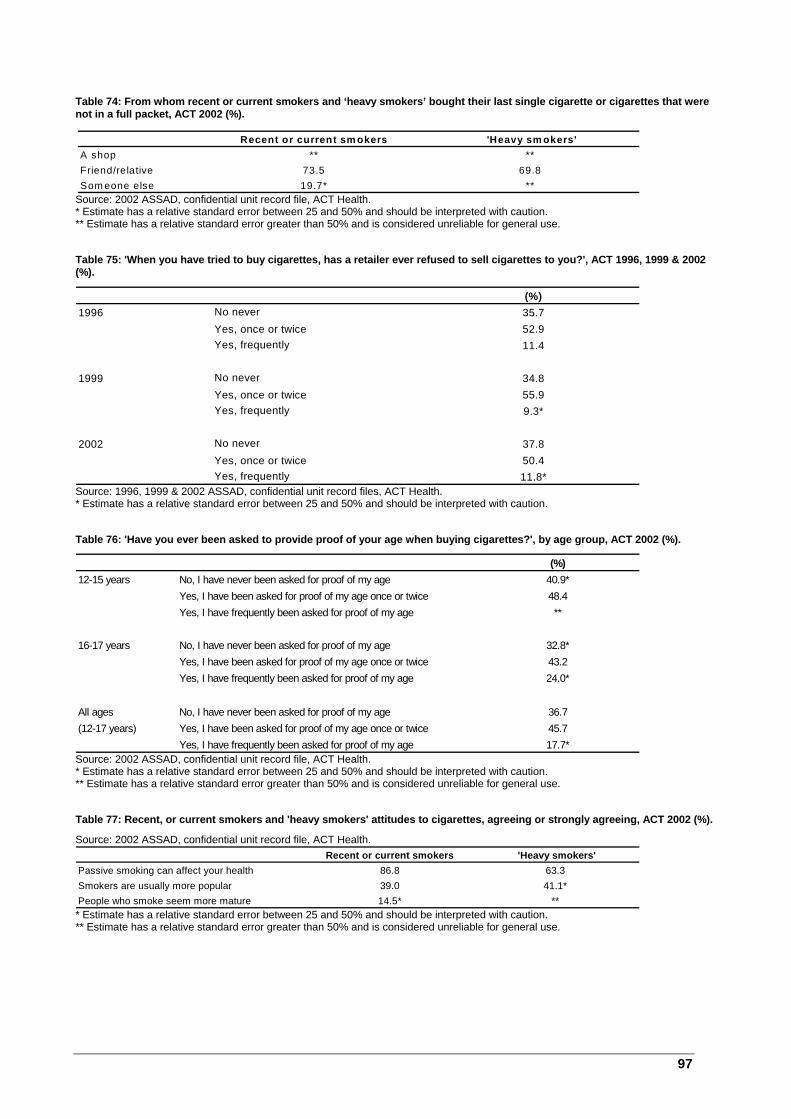
97
Table 74: From whom recent or current smokers and ‘heavy smokers’ bought their last single cigarette or cigarettes that were not in a full packet, ACT 2002 (%).
Source: 2002 ASSAD, confidential unit record file, ACT Health. * Estimate has a relative standard error between 25 and 50% and should be interpreted with caution. ** Estimate has a relative standard error greater than 50% and is considered unreliable for general use. Table 75: 'When you have tried to buy cigarettes, has a retailer ever refused to sell cigarettes to you?', ACT 1996, 1999 & 2002 (%).
Source: 1996, 1999 & 2002 ASSAD, confidential unit record files, ACT Health. * Estimate has a relative standard error between 25 and 50% and should be interpreted with caution. Table 76: 'Have you ever been asked to provide proof of your age when buying cigarettes?', by age group, ACT 2002 (%).
Source: 2002 ASSAD, confidential unit record file, ACT Health. * Estimate has a relative standard error between 25 and 50% and should be interpreted with caution. ** Estimate has a relative standard error greater than 50% and is considered unreliable for general use. Table 77: Recent, or current smokers and 'heavy smokers' attitudes to cigarettes, agreeing or strongly agreeing, ACT 2002 (%).
Source: 2002 ASSAD, confidential unit record file, ACT Health.
* Estimate has a relative standard error between 25 and 50% and should be interpreted with caution. ** Estimate has a relative standard error greater than 50% and is considered unreliable for general use.
Recent or current sm okers 'Heavy sm okers'A shop ** **Friend/relative 73.5 69.8Som eone else 19.7* **
(%)1996 No never 35.7
Yes, once or twice 52.9Yes, frequently 11.4
1999 No never 34.8Yes, once or twice 55.9Yes, frequently 9.3*
2002 No never 37.8Yes, once or twice 50.4Yes, frequently 11.8*
(%)12-15 years No, I have never been asked for proof of my age 40.9*
Yes, I have been asked for proof of my age once or twice 48.4Yes, I have frequently been asked for proof of my age **
16-17 years No, I have never been asked for proof of my age 32.8*Yes, I have been asked for proof of my age once or twice 43.2Yes, I have frequently been asked for proof of my age 24.0*
All ages No, I have never been asked for proof of my age 36.7(12-17 years) Yes, I have been asked for proof of my age once or twice 45.7
Yes, I have frequently been asked for proof of my age 17.7*
Recent or current smokers 'Heavy smokers'Passive smoking can affect your health 86.8 63.3Smokers are usually more popular 39.0 41.1*People who smoke seem more mature 14.5* **
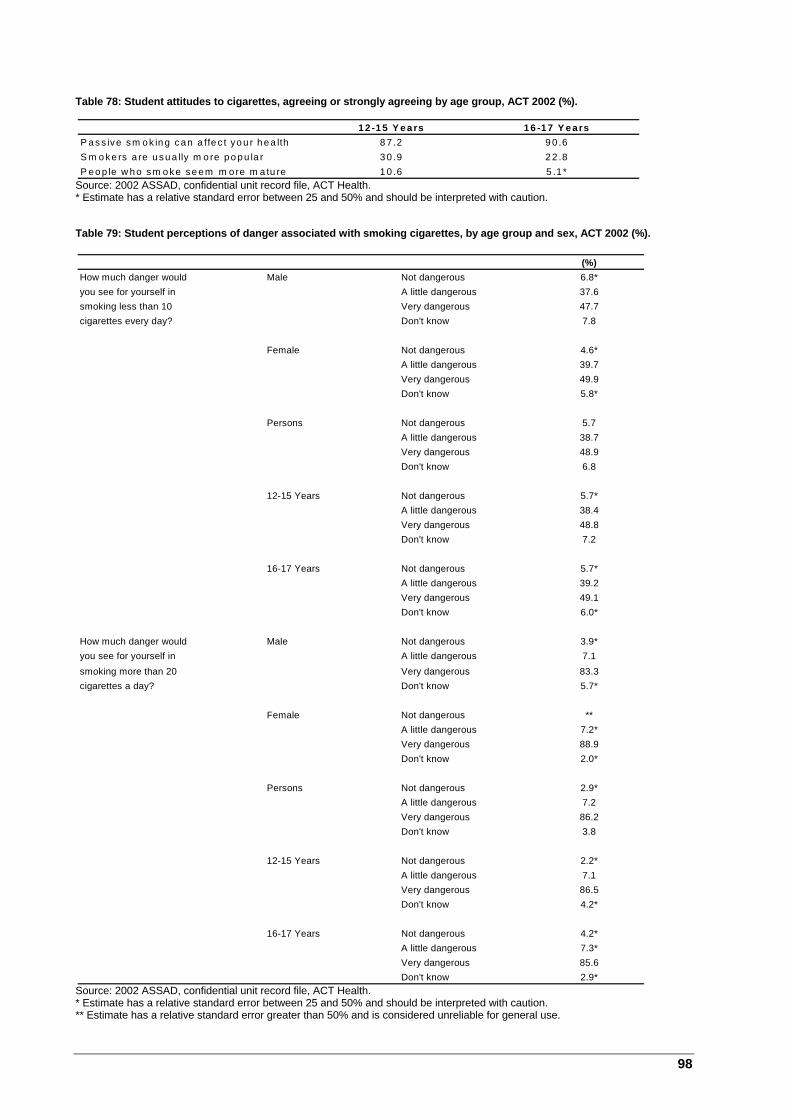
98
Table 78: Student attitudes to cigarettes, agreeing or strongly agreeing by age group, ACT 2002 (%).
Source: 2002 ASSAD, confidential unit record file, ACT Health. * Estimate has a relative standard error between 25 and 50% and should be interpreted with caution. Table 79: Student perceptions of danger associated with smoking cigarettes, by age group and sex, ACT 2002 (%).
Source: 2002 ASSAD, confidential unit record file, ACT Health. * Estimate has a relative standard error between 25 and 50% and should be interpreted with caution. ** Estimate has a relative standard error greater than 50% and is considered unreliable for general use.
12 -1 5 Y ea rs 16 -17 Y earsP as s ive sm ok ing c an a ffe c t yo u r h ea lth 8 7 .2 9 0 .6S m o ke rs a re us ua lly m o re po pu la r 3 0 .9 2 2 .8P eo p le w ho s m oke se em m ore m a tu re 1 0 .6 5 .1 *
(%)How much danger would Male Not dangerous 6.8*you see for yourself in A little dangerous 37.6smoking less than 10 Very dangerous 47.7cigarettes every day? Don't know 7.8
Female Not dangerous 4.6*A little dangerous 39.7Very dangerous 49.9Don't know 5.8*
Persons Not dangerous 5.7A little dangerous 38.7Very dangerous 48.9Don't know 6.8
12-15 Years Not dangerous 5.7*A little dangerous 38.4Very dangerous 48.8Don't know 7.2
16-17 Years Not dangerous 5.7*A little dangerous 39.2Very dangerous 49.1Don't know 6.0*
How much danger would Male Not dangerous 3.9*you see for yourself in A little dangerous 7.1smoking more than 20 Very dangerous 83.3cigarettes a day? Don't know 5.7*
Female Not dangerous **A little dangerous 7.2*Very dangerous 88.9Don't know 2.0*
Persons Not dangerous 2.9*A little dangerous 7.2Very dangerous 86.2Don't know 3.8
12-15 Years Not dangerous 2.2*A little dangerous 7.1Very dangerous 86.5Don't know 4.2*
16-17 Years Not dangerous 4.2*A little dangerous 7.3*Very dangerous 85.6Don't know 2.9*
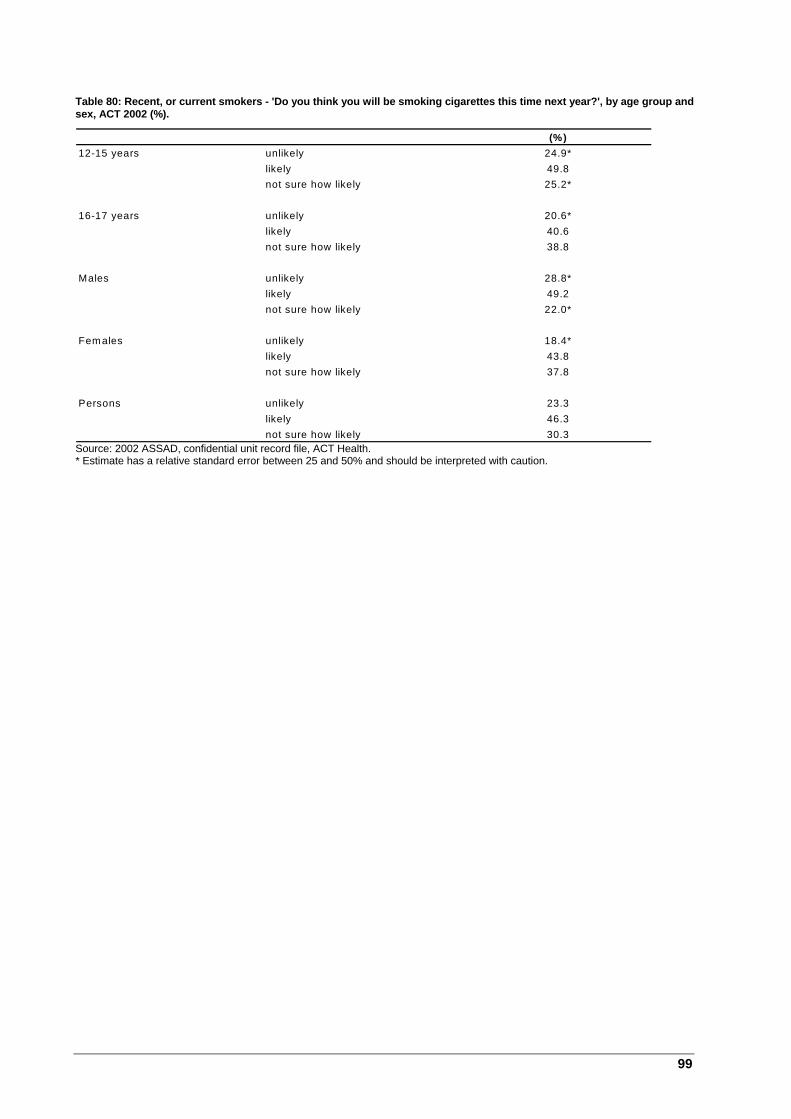
99
Table 80: Recent, or current smokers - 'Do you think you will be smoking cigarettes this time next year?', by age group and sex, ACT 2002 (%).
Source: 2002 ASSAD, confidential unit record file, ACT Health. * Estimate has a relative standard error between 25 and 50% and should be interpreted with caution.
(%)12-15 years unlikely 24.9*
likely 49.8not sure how likely 25.2*
16-17 years unlikely 20.6*likely 40.6not sure how likely 38.8
Males unlikely 28.8*likely 49.2not sure how likely 22.0*
Fem ales unlikely 18.4*likely 43.8not sure how likely 37.8
Persons unlikely 23.3likely 46.3not sure how likely 30.3
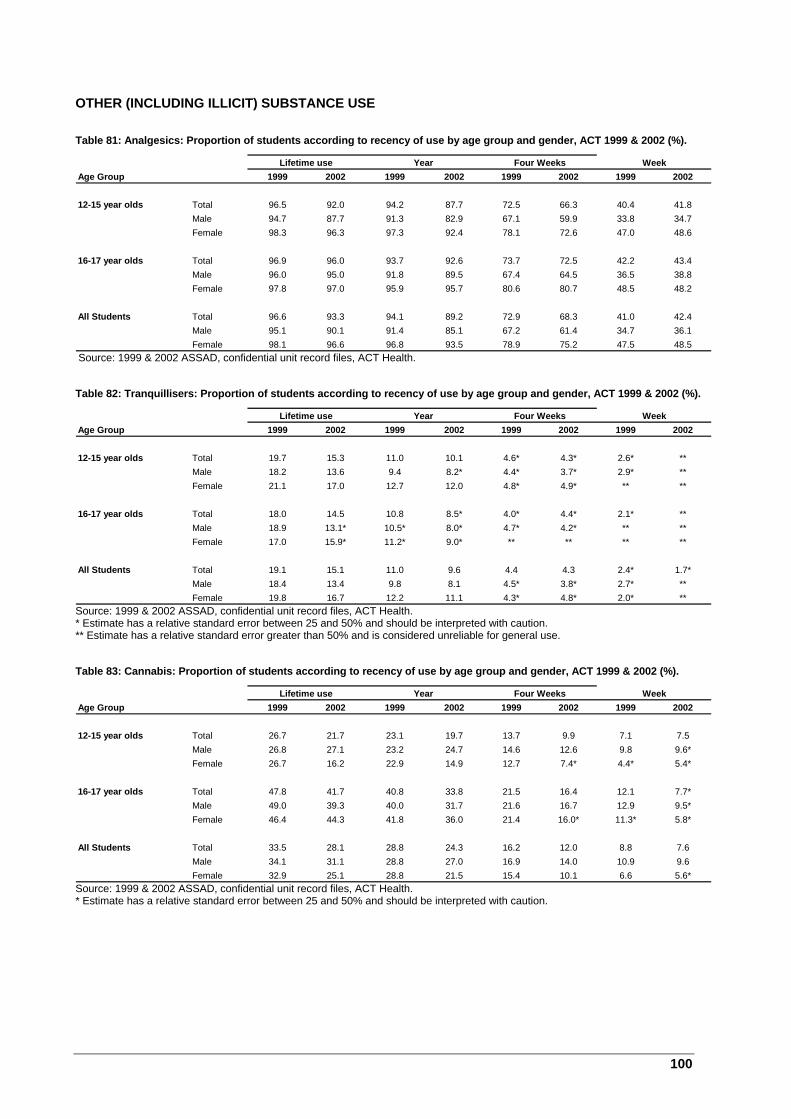
100
OTHER (INCLUDING ILLICIT) SUBSTANCE USE Table 81: Analgesics: Proportion of students according to recency of use by age group and gender, ACT 1999 & 2002 (%).
Source: 1999 & 2002 ASSAD, confidential unit record files, ACT Health. Table 82: Tranquillisers: Proportion of students according to recency of use by age group and gender, ACT 1999 & 2002 (%).
Source: 1999 & 2002 ASSAD, confidential unit record files, ACT Health. * Estimate has a relative standard error between 25 and 50% and should be interpreted with caution. ** Estimate has a relative standard error greater than 50% and is considered unreliable for general use. Table 83: Cannabis: Proportion of students according to recency of use by age group and gender, ACT 1999 & 2002 (%).
Source: 1999 & 2002 ASSAD, confidential unit record files, ACT Health. * Estimate has a relative standard error between 25 and 50% and should be interpreted with caution.
Age Group 1999 2002 1999 2002 1999 2002 1999 2002
12-15 year olds Total 96.5 92.0 94.2 87.7 72.5 66.3 40.4 41.8Male 94.7 87.7 91.3 82.9 67.1 59.9 33.8 34.7Female 98.3 96.3 97.3 92.4 78.1 72.6 47.0 48.6
16-17 year olds Total 96.9 96.0 93.7 92.6 73.7 72.5 42.2 43.4Male 96.0 95.0 91.8 89.5 67.4 64.5 36.5 38.8Female 97.8 97.0 95.9 95.7 80.6 80.7 48.5 48.2
All Students Total 96.6 93.3 94.1 89.2 72.9 68.3 41.0 42.4Male 95.1 90.1 91.4 85.1 67.2 61.4 34.7 36.1Female 98.1 96.6 96.8 93.5 78.9 75.2 47.5 48.5
Lifetime use Year Four Weeks Week
Age Group 1999 2002 1999 2002 1999 2002 1999 2002
12-15 year olds Total 19.7 15.3 11.0 10.1 4.6* 4.3* 2.6* **Male 18.2 13.6 9.4 8.2* 4.4* 3.7* 2.9* **Female 21.1 17.0 12.7 12.0 4.8* 4.9* ** **
16-17 year olds Total 18.0 14.5 10.8 8.5* 4.0* 4.4* 2.1* **Male 18.9 13.1* 10.5* 8.0* 4.7* 4.2* ** **Female 17.0 15.9* 11.2* 9.0* ** ** ** **
All Students Total 19.1 15.1 11.0 9.6 4.4 4.3 2.4* 1.7*Male 18.4 13.4 9.8 8.1 4.5* 3.8* 2.7* **Female 19.8 16.7 12.2 11.1 4.3* 4.8* 2.0* **
Lifetime use Year Four Weeks Week
Age Group 1999 2002 1999 2002 1999 2002 1999 2002
12-15 year olds Total 26.7 21.7 23.1 19.7 13.7 9.9 7.1 7.5Male 26.8 27.1 23.2 24.7 14.6 12.6 9.8 9.6*Female 26.7 16.2 22.9 14.9 12.7 7.4* 4.4* 5.4*
16-17 year olds Total 47.8 41.7 40.8 33.8 21.5 16.4 12.1 7.7*Male 49.0 39.3 40.0 31.7 21.6 16.7 12.9 9.5*Female 46.4 44.3 41.8 36.0 21.4 16.0* 11.3* 5.8*
All Students Total 33.5 28.1 28.8 24.3 16.2 12.0 8.8 7.6Male 34.1 31.1 28.8 27.0 16.9 14.0 10.9 9.6Female 32.9 25.1 28.8 21.5 15.4 10.1 6.6 5.6*
Lifetime use Year Four Weeks Week

101
Table 84: Inhalants: Proportion of students according to recency of use by age group and gender, ACT 1999 & 2002 (%).
Source: 1999 & 2002 ASSAD, confidential unit record files, ACT Health. * Estimate has a relative standard error between 25 and 50% and should be interpreted with caution. ** Estimate has a relative standard error greater than 50% and is considered unreliable for general use. Table 85: Hallucinogens: Proportion of students according to recency of use by age group and gender, ACT 1999 & 2002 (%).
Source: 1999 & 2002 ASSAD, confidential unit record files, ACT Health. * Estimate has a relative standard error between 25 and 50% and should be interpreted with caution. ** Estimate has a relative standard error greater than 50% and is considered unreliable for general use. Table 86: Amphetamines: Proportion of students according to recency of use by age group and gender, ACT 1999 & 2002 (%).
Source: 1999 & 2002 ASSAD, confidential unit record files, ACT Health. * Estimate has a relative standard error between 25 and 50% and should be interpreted with caution. ** Estimate has a relative standard error greater than 50% and is considered unreliable for general use.
Age Group 1999 2002 1999 2002 1999 2002 1999 2002
12-15 year olds Total 30.3 23.4 24.3 16.6 13.3 11.1 8.3 8.3Male 27.5 25.0 21.4 17.1 13.2 11.3* 8.6 8.5*Female 33.2 21.9 27.3 16.1 13.4 10.8* 7.9* 8.2*
16-17 year olds Total 14.0 11.6 8.9 5.3* 3.9* 3.4* 2.5* **Male 14.2 13.2* 7.7* 7.9* 3.7* 5.6* ** **Female 13.9 10.0* 10.2* 2.6* 4.2* ** ** **
All Students Total 25.1 19.6 19.4 13.0 10.3 8.6 6.4 6.2Male 23.2 21.1 16.9 14.1 10.1 9.4 6.6 6.6*Female 27.1 18.1 22.0 11.8 10.6 7.7 6.2 5.8*
Lifetime use Year Four Weeks Week
Age Group 1999 2002 1999 2002 1999 2002 1999 2002
12-15 year olds Total 6.3 2.8* 5.1 2.0* 3.0* ** 2.1* 0.9*Male 7.1* ** 5.6* ** 4.2* ** 2.9* **Female 5.4* ** 4.5* ** ** ** ** **
16-17 year olds Total 8.9 6.5* 5.9* 4.8* 2.1* ** ** **Male 9.7* 9.7* 6.9* 7.7* 3.6* ** ** **Female 8.1* ** 4.8* ** ** ** - -
All Students Total 7.1 4.0 5.3 2.9* 2.7* 1.4* 1.7* 1.1*Male 7.9 5.3* 6.0 3.9* 4.0* 2.1* 2.6* **Female 6.3 2.7* 4.6* ** ** ** ** **
Lifetime use Year Four Weeks Week
Age Group 1999 2002 1999 2002 1999 2002 1999 2002
12-15 year olds Total 7.0 5.4* 5.4 4.6* 3.2* 3.1* 2.2* 2.3*Male 8.5 6.5* 6.5* 5.3* 4.3* 4.2* 2.8* 3.5*Female 5.5* 4.4* 4.3* 3.9* ** ** ** **
16-17 year olds Total 9.0 7.4* 6.9 6.0* 3.2* 3.4* ** **Male 10* 10.3* 7.4* 8.6* 3.4* 6.0* ** **Female 8.0* ** 6.2* ** ** ** ** -
All Students Total 7.7 6.1 5.9 5.0 3.2 3.2* 2.0* 2.0*Male 9.0 7.8 6.8 6.4* 4.0* 4.8* 2.5* 3.2*Female 6.3 4.4* 4.9* 3.7* 2.3* ** ** **
Lifetime use Year Four Weeks Week
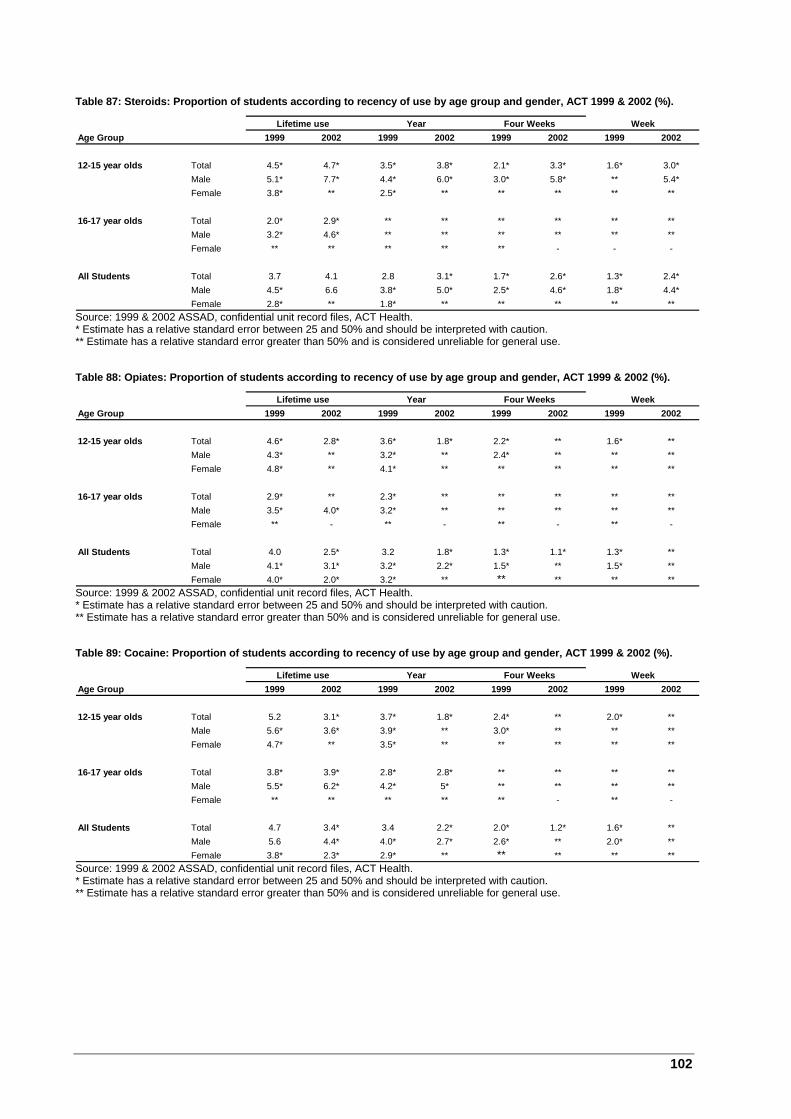
102
Table 87: Steroids: Proportion of students according to recency of use by age group and gender, ACT 1999 & 2002 (%).
Source: 1999 & 2002 ASSAD, confidential unit record files, ACT Health. * Estimate has a relative standard error between 25 and 50% and should be interpreted with caution. ** Estimate has a relative standard error greater than 50% and is considered unreliable for general use. Table 88: Opiates: Proportion of students according to recency of use by age group and gender, ACT 1999 & 2002 (%).
Source: 1999 & 2002 ASSAD, confidential unit record files, ACT Health. * Estimate has a relative standard error between 25 and 50% and should be interpreted with caution. ** Estimate has a relative standard error greater than 50% and is considered unreliable for general use. Table 89: Cocaine: Proportion of students according to recency of use by age group and gender, ACT 1999 & 2002 (%).
Source: 1999 & 2002 ASSAD, confidential unit record files, ACT Health. * Estimate has a relative standard error between 25 and 50% and should be interpreted with caution. ** Estimate has a relative standard error greater than 50% and is considered unreliable for general use.
Age Group 1999 2002 1999 2002 1999 2002 1999 2002
12-15 year olds Total 4.5* 4.7* 3.5* 3.8* 2.1* 3.3* 1.6* 3.0*Male 5.1* 7.7* 4.4* 6.0* 3.0* 5.8* ** 5.4*Female 3.8* ** 2.5* ** ** ** ** **
16-17 year olds Total 2.0* 2.9* ** ** ** ** ** **Male 3.2* 4.6* ** ** ** ** ** **Female ** ** ** ** ** - - -
All Students Total 3.7 4.1 2.8 3.1* 1.7* 2.6* 1.3* 2.4*Male 4.5* 6.6 3.8* 5.0* 2.5* 4.6* 1.8* 4.4*Female 2.8* ** 1.8* ** ** ** ** **
Lifetime use Year Four Weeks Week
Age Group 1999 2002 1999 2002 1999 2002 1999 2002
12-15 year olds Total 4.6* 2.8* 3.6* 1.8* 2.2* ** 1.6* **Male 4.3* ** 3.2* ** 2.4* ** ** **Female 4.8* ** 4.1* ** ** ** ** **
16-17 year olds Total 2.9* ** 2.3* ** ** ** ** **Male 3.5* 4.0* 3.2* ** ** ** ** **Female ** - ** - ** - ** -
All Students Total 4.0 2.5* 3.2 1.8* 1.3* 1.1* 1.3* **Male 4.1* 3.1* 3.2* 2.2* 1.5* ** 1.5* **Female 4.0* 2.0* 3.2* ** ** ** ** **
Lifetime use Year Four Weeks Week
Age Group 1999 2002 1999 2002 1999 2002 1999 2002
12-15 year olds Total 5.2 3.1* 3.7* 1.8* 2.4* ** 2.0* **Male 5.6* 3.6* 3.9* ** 3.0* ** ** **Female 4.7* ** 3.5* ** ** ** ** **
16-17 year olds Total 3.8* 3.9* 2.8* 2.8* ** ** ** **Male 5.5* 6.2* 4.2* 5* ** ** ** **Female ** ** ** ** ** - ** -
All Students Total 4.7 3.4* 3.4 2.2* 2.0* 1.2* 1.6* **Male 5.6 4.4* 4.0* 2.7* 2.6* ** 2.0* **Female 3.8* 2.3* 2.9* ** ** ** ** **
Lifetime use Year Four Weeks Week

103
Table 90: Ecstasy: Proportion of students according to recency of use by age group and gender, ACT 1999 & 2002 (%).
Source: 1999 & 2002 ASSAD, confidential unit record files, ACT Health. * Estimate has a relative standard error between 25 and 50% and should be interpreted with caution. ** Estimate has a relative standard error greater than 50% and is considered unreliable for general use. Table 91: Needle use: Proportion of students according to recency of use by age group and gender, ACT 2002 (%).
Source: 2002 ASSAD, confidential unit record file, ACT Health. * Estimate has a relative standard error between 25 and 50% and should be interpreted with caution. ** Estimate has a relative standard error greater than 50% and is considered unreliable for general use.
Age Group 1999 2002 1999 2002 1999 2002 1999 2002
12-15 year olds Total 4.1* 4.4* 3.3* 3.7* 2.4* 1.9* 1.8* **Male 5.0* 6.0* 4.2* 4.9* 3.1* ** 2.3* **Female 3.2* ** ** ** ** ** ** **
16-17 year olds Total 5.6* 7.2* 4.4* 4.5* 1.9* 3.1* ** **Male 6.3* 9.5* 5.5* 6.1* ** 5.2* ** **Female 4.8* ** ** ** ** ** ** -
All Students Total 4.5 5.3 3.7 4.0 2.2* 2.3* 1.5* 1.5*Male 5.4 7.2 4.6* 5.3* 2.8* 3.5* 1.9* 2.6*Female 3.7* 3.5* 2.7* 2.7* ** ** ** **
Lifetime use Year Four Weeks Week
Age Group Lifetime Year Four Weeks Week
12-15 year olds Total 4.6* 3.1* 2.8* **Male 6.4* 5.2* 4.9* **Female ** ** ** **
16-17 year olds Total 3.0* ** ** **Male 5.1* ** ** **Female ** ** ** **
All Students Total 4.1 2.8* 2.5* 1.5*Male 6.0* 4.7* 4.4* 2.5*Female 2.3* ** ** **

104
Table 92: Information on cannabis use by students who had reported using cannabis in the last 12 months, ACT 2002 (%).
Source: 2002 ASSAD, confidential unit record file, ACT Health. * Estimate has a relative standard error between 25 and 50% and should be interpreted with caution. ** Estimate has a relative standard error greater than 50% and is considered unreliable for general use.
Age12-15 year olds 16-17 year olds All ages
MalesAt my friend's place 38.2 33.0* 36.1At a party 16.9* 17.9* 17.3*In a park 13.5* 13.9* 13.6*At my home ** 11.6* 9.0*On school grounds 13.0* 13.5* 13.2* during school time
FemalesAt my friend's place 32.2* 30.6* 31.4At a party 21.8* 35.4 29.0In a park ** 15.3* 14.1*At my home ** ** 11.2*On school grounds ** ** ** during school time
PersonsAt my friend's place 35.8 31.7* 33.9At a party 18.9* 27.2 22.7In a park 13.2* 14.6* 13.8At my home 9.3* 10.9* 10.0*On school grounds 10.8* 8.1* 9.5* during school time
cannabis 12-15 year olds 16-17 year olds All agesMalesSmoking from a bong or pipe 64.8 61.6 63.5smoking as a joint 33.8* 37.2 35.1
FemalesSmoking from a bong or pipe 66.7 68.5 67.7smoking as a joint 31.4* 30.3* 30.8
PersonsSmoking from a bong or pipe 65.5 65.2 65.4smoking as a joint 32.9* 33.5 33.2
cannabis 12-15 year olds 16-17 year olds All agesMalesWith others 83.2 83.3 83.3
16.4* 15.3* 16.0*
FemalesWith others 89.1 96.6 93.0
** ** **
PersonsWith others 85.5 90.2 87.6
14.0* 9.1* 12.0*
By myself and with others eqully often
By myself and with others eqully often
By myself and with others eqully often
Places where studentssmoked cannabis
Method of using
With whom students used
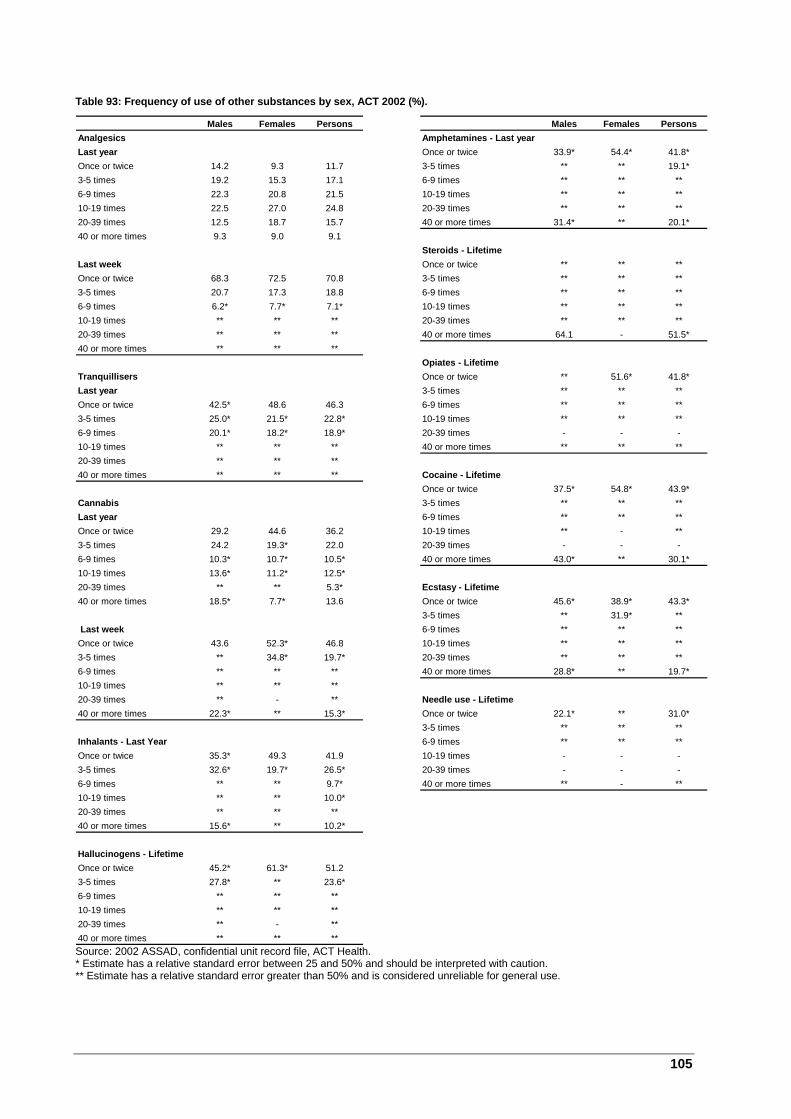
105
Table 93: Frequency of use of other substances by sex, ACT 2002 (%).
Source: 2002 ASSAD, confidential unit record file, ACT Health. * Estimate has a relative standard error between 25 and 50% and should be interpreted with caution. ** Estimate has a relative standard error greater than 50% and is considered unreliable for general use.
Males Females Persons Males Females PersonsAnalgesics Amphetamines - Last yearLast year Once or twice 33.9* 54.4* 41.8*Once or twice 14.2 9.3 11.7 3-5 times ** ** 19.1*3-5 times 19.2 15.3 17.1 6-9 times ** ** **6-9 times 22.3 20.8 21.5 10-19 times ** ** **10-19 times 22.5 27.0 24.8 20-39 times ** ** **20-39 times 12.5 18.7 15.7 40 or more times 31.4* ** 20.1*40 or more times 9.3 9.0 9.1
Steroids - LifetimeLast week Once or twice ** ** **Once or twice 68.3 72.5 70.8 3-5 times ** ** **3-5 times 20.7 17.3 18.8 6-9 times ** ** **6-9 times 6.2* 7.7* 7.1* 10-19 times ** ** **10-19 times ** ** ** 20-39 times ** ** **20-39 times ** ** ** 40 or more times 64.1 - 51.5*40 or more times ** ** **
Opiates - LifetimeTranquillisers Once or twice ** 51.6* 41.8*Last year 3-5 times ** ** **Once or twice 42.5* 48.6 46.3 6-9 times ** ** **3-5 times 25.0* 21.5* 22.8* 10-19 times ** ** **6-9 times 20.1* 18.2* 18.9* 20-39 times - - -10-19 times ** ** ** 40 or more times ** ** **20-39 times ** ** **40 or more times ** ** ** Cocaine - Lifetime
Once or twice 37.5* 54.8* 43.9*Cannabis 3-5 times ** ** **Last year 6-9 times ** ** **Once or twice 29.2 44.6 36.2 10-19 times ** - **3-5 times 24.2 19.3* 22.0 20-39 times - - -6-9 times 10.3* 10.7* 10.5* 40 or more times 43.0* ** 30.1*10-19 times 13.6* 11.2* 12.5*20-39 times ** ** 5.3* Ecstasy - Lifetime40 or more times 18.5* 7.7* 13.6 Once or twice 45.6* 38.9* 43.3*
3-5 times ** 31.9* ** Last week 6-9 times ** ** **Once or twice 43.6 52.3* 46.8 10-19 times ** ** **3-5 times ** 34.8* 19.7* 20-39 times ** ** **6-9 times ** ** ** 40 or more times 28.8* ** 19.7*10-19 times ** ** **20-39 times ** - ** Needle use - Lifetime40 or more times 22.3* ** 15.3* Once or twice 22.1* ** 31.0*
3-5 times ** ** **Inhalants - Last Year 6-9 times ** ** **Once or twice 35.3* 49.3 41.9 10-19 times - - -3-5 times 32.6* 19.7* 26.5* 20-39 times - - -6-9 times ** ** 9.7* 40 or more times ** - **10-19 times ** ** 10.0*20-39 times ** ** **40 or more times 15.6* ** 10.2*
Hallucinogens - LifetimeOnce or twice 45.2* 61.3* 51.23-5 times 27.8* ** 23.6*6-9 times ** ** **10-19 times ** ** **20-39 times ** - **40 or more times ** ** **
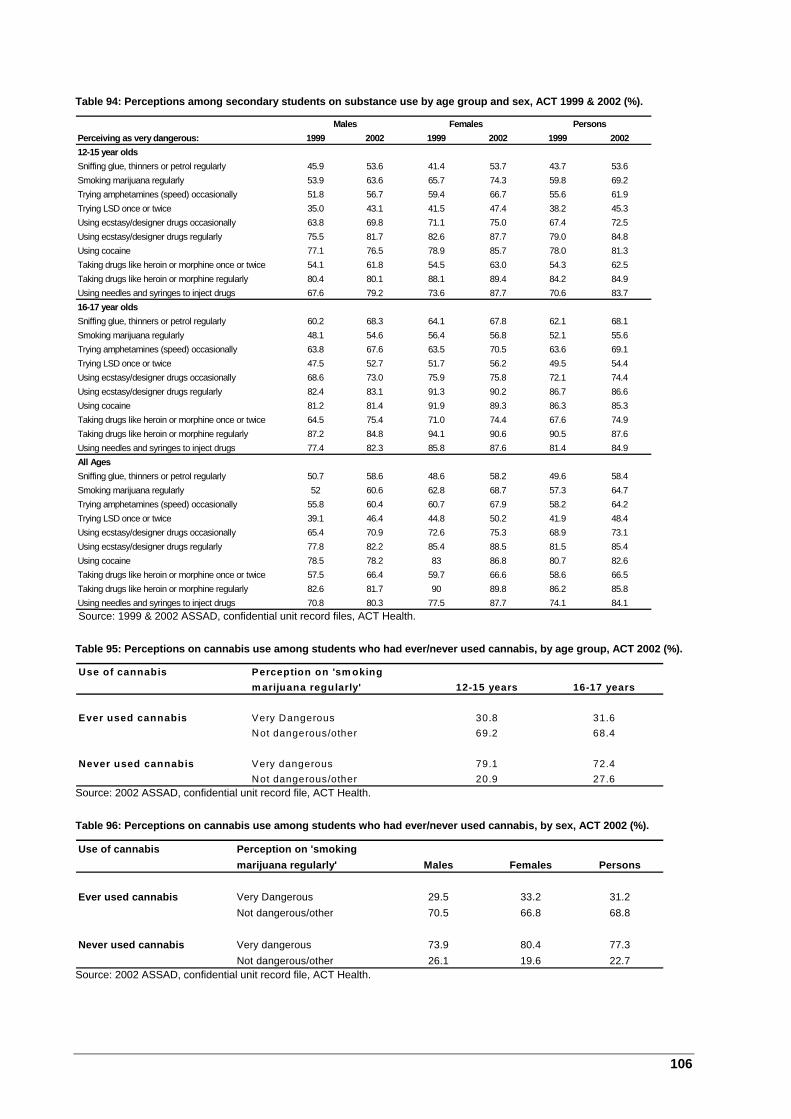
106
Table 94: Perceptions among secondary students on substance use by age group and sex, ACT 1999 & 2002 (%).
Source: 1999 & 2002 ASSAD, confidential unit record files, ACT Health.
Table 95: Perceptions on cannabis use among students who had ever/never used cannabis, by age group, ACT 2002 (%).
Source: 2002 ASSAD, confidential unit record file, ACT Health.
Table 96: Perceptions on cannabis use among students who had ever/never used cannabis, by sex, ACT 2002 (%).
Source: 2002 ASSAD, confidential unit record file, ACT Health.
Use of cannabis Perception on 'sm oking m arijuana regularly' 12-15 years 16-17 years
Ever used cannabis Very Dangerous 30.8 31.6Not dangerous/other 69.2 68.4
Never used cannabis Very dangerous 79.1 72.4Not dangerous/other 20.9 27.6
Use of cannabis Perception on 'smoking marijuana regularly' Males Females Persons
Ever used cannabis Very Dangerous 29.5 33.2 31.2Not dangerous/other 70.5 66.8 68.8
Never used cannabis Very dangerous 73.9 80.4 77.3Not dangerous/other 26.1 19.6 22.7
Perceiving as very dangerous: 1999 2002 1999 2002 1999 200212-15 year oldsSniffing glue, thinners or petrol regularly 45.9 53.6 41.4 53.7 43.7 53.6Smoking marijuana regularly 53.9 63.6 65.7 74.3 59.8 69.2Trying amphetamines (speed) occasionally 51.8 56.7 59.4 66.7 55.6 61.9Trying LSD once or twice 35.0 43.1 41.5 47.4 38.2 45.3Using ecstasy/designer drugs occasionally 63.8 69.8 71.1 75.0 67.4 72.5Using ecstasy/designer drugs regularly 75.5 81.7 82.6 87.7 79.0 84.8Using cocaine 77.1 76.5 78.9 85.7 78.0 81.3Taking drugs like heroin or morphine once or twice 54.1 61.8 54.5 63.0 54.3 62.5Taking drugs like heroin or morphine regularly 80.4 80.1 88.1 89.4 84.2 84.9Using needles and syringes to inject drugs 67.6 79.2 73.6 87.7 70.6 83.716-17 year oldsSniffing glue, thinners or petrol regularly 60.2 68.3 64.1 67.8 62.1 68.1Smoking marijuana regularly 48.1 54.6 56.4 56.8 52.1 55.6Trying amphetamines (speed) occasionally 63.8 67.6 63.5 70.5 63.6 69.1Trying LSD once or twice 47.5 52.7 51.7 56.2 49.5 54.4Using ecstasy/designer drugs occasionally 68.6 73.0 75.9 75.8 72.1 74.4Using ecstasy/designer drugs regularly 82.4 83.1 91.3 90.2 86.7 86.6Using cocaine 81.2 81.4 91.9 89.3 86.3 85.3Taking drugs like heroin or morphine once or twice 64.5 75.4 71.0 74.4 67.6 74.9Taking drugs like heroin or morphine regularly 87.2 84.8 94.1 90.6 90.5 87.6Using needles and syringes to inject drugs 77.4 82.3 85.8 87.6 81.4 84.9All AgesSniffing glue, thinners or petrol regularly 50.7 58.6 48.6 58.2 49.6 58.4Smoking marijuana regularly 52 60.6 62.8 68.7 57.3 64.7Trying amphetamines (speed) occasionally 55.8 60.4 60.7 67.9 58.2 64.2Trying LSD once or twice 39.1 46.4 44.8 50.2 41.9 48.4Using ecstasy/designer drugs occasionally 65.4 70.9 72.6 75.3 68.9 73.1Using ecstasy/designer drugs regularly 77.8 82.2 85.4 88.5 81.5 85.4Using cocaine 78.5 78.2 83 86.8 80.7 82.6Taking drugs like heroin or morphine once or twice 57.5 66.4 59.7 66.6 58.6 66.5Taking drugs like heroin or morphine regularly 82.6 81.7 90 89.8 86.2 85.8Using needles and syringes to inject drugs 70.8 80.3 77.5 87.7 74.1 84.1
Males Females Persons

107
Table 97: Proportions, odds ratios (ORs), 95% confidence intervals (95%CI) and p-values where student perceptions of danger associated with other substance use were 'very dangerous', ACT 1999 & 2002 (%).
Source: 1999 & 2002 ASSAD, confidential unit record files, ACT Health. NS - Not significant.
12-15 year olds 16-17 year olds All ages% OR 95% CI Sig. % OR 95% CI Sig. % OR 95% CI Sig.
Taking two or three aspirins or other analgesics nearly every dayTotal 2002 45.9 1 46.9 1 46.2 1
1999 40.4 0.837 0.704-0.995 <0.05 44.0 0.892 0.723 - 1.100 NS 41.6 0.857 0.750 - 0.979 <0.05Male 2002 41.1 1 48.5 1 43.6 1
1999 39.4 1.052 0.822-1.345 NS 41.6 0.769 0.583 - 1.014 NS 40.1 0.91 0.758 - 1.093 NSFemale 2002 50.3 1 45.2 1 48.7 1
1999 41.5 0.681 0.533-0.870 <0.05 46.6 1.085 0.785 - 1.499 NS 43.1 0.808 0.665 - 0.982 <0.05Smoking marijuana regularly
Total 2002 69.2 1 55.6 1 64.7 11999 59.8 0.678 0.564-0.815 <0.05 52.1 0.872 0.707 - 1.076 NS 57.3 0.759 0.661 - 0.871 <0.05
Male 2002 63.6 1 54.6 1 60.6 11999 53.9 0.699 0.544-0.898 <0.05 48.1 0.779 0.591 - 1.026 NS 52.0 0.737 0.612 - 0.886 <0.05
Female 2002 74.3 1 56.8 1 68.7 11999 65.7 0.653 0.497-0.858 <0.05 56.4 1.024 0.739 - 1.418 NS 62.8 0.789 0.641 - 0.972 <0.05
Sniffing glue, thinners or petrol regularlyTotal 2002 53.6 1 68.1 1 58.4 1
1999 43.7 0.644 0.542-0.765 <0.05 62.1 0.781 0.627 - 0.972 <0.05 49.6 0.691 0.604 - 0.792 <0.05Male 2002 53.6 1 68.3 1 58.6 1
1999 45.9 0.761 0.597-0.971 <0.05 60.2 0.71 0.533 - 0.947 <0.05 50.7 0.736 0.611 - 0.886 <0.05Female 2002 53.7 1 67.8 1 58.2 1
1999 41.4 0.554 0.434-0.709 <0.05 64.1 0.887 0.631 - 1.246 NS 48.6 0.646 0.530 - 0.789 <0.05Trying amphetamines (speed) occasionally
Total 2002 61.9 1 69.1 1 64.2 11999 55.6 0.828 0.696-0.986 <0.05 63.6 0.819 0.656 - 1.023 NS 58.2 0.819 0.714 - 0.939 <0.05
Male 2002 56.7 1 67.6 1 60.4 11999 51.8 0.931 0.730-1.188 NS 63.8 0.872 0.651 - 1.168 NS 55.8 0.899 0.746 - 1.083 NS
Female 2002 66.7 1 70.5 1 67.9 11999 59.4 0.74 0.575-0.941 <0.05 63.5 0.755 0.535 - 1.065 NS 60.7 0.742 0.606 - 0.909 <0.05
Trying LSD once or twiceTotal 2002 45.3 1 54.4 1 48.4 1
1999 38.2 0.716 0.602-0.852 <0.05 49.5 0.849 0.685 - 1.040 NS 41.9 0.764 0.668 - 0.873 <0.05Male 2002 43.1 1 47.5 1 46.4 1
1999 35.0 0.712 0.555-0.913 <0.05 52.7 0.831 0.630 - 1.095 NS 39.1 0.758 0.630 - 1.033 <0.05Female 2002 47.4 1 56.2 1 50.2 1
1999 41.5 0.736 0.576-0.940 <0.05 51.7 0.873 0.632 - 1.265 NS 44.8 0.782 0.646 - 0.951 <0.05Using ecstasy/designer drugs occasionally
Total 2002 72.5 1 74.4 1 73.1 11999 67.4 0.833 0.690-1.005 NS 72.1 0.923 0.729 - 1.169 NS 68.9 0.863 0.745 - 0.999 <0.05
Male 2002 69.8 1 73.0 1 70.9 11999 63.8 0.868 0.670-1.123 NS 68.6 0.84 0.619 - 1.139 NS 65.4 0.848 0.697 - 1.033 NS
Female 2002 75.0 1 75.8 1 75.3 11999 71.1 0.804 0.611-1.088 NS 75.9 1.051 0.722 - 1.530 NS 72.6 0.887 0.711 - 1.106 NS
Using ecstasy/designerdrugs regularlyTotal 2002 84.8 1 86.6 1 85.4 1
1999 79.0 0.736 0.588-0.921 <0.05 86.7 1.044 0.770 - 1.413 NS 81.5 0.829 0.692 - 0.992 <0.05Male 2002 81.7 1 83.1 1 82.2 1
1999 75.5 0.785 0.584-1.056 NS 82.4 0.98 0.681 - 1.410 NS 77.8 0.85 0.676 - 1.069 NSFemale 2002 87.7 1 90.2 1 88.5 1
1999 82.6 0.691 0.490-0.973 <0.05 91.3 1.196 0.688 - 2.078 NS 85.4 0.802 0.599 - 1.072 NSUsing cocaine occasionally
Total 2002 81.3 1 85.3 1 82.6 11999 78.0 0.885 0.715-1.095 NS 86.3 1.118 0.833 - 1.501 NS 80.7 0.961 0.809 - 1.142 NS
Male 2002 76.5 1 81.4 1 78.2 11999 77.1 1.164 0.872-1.554 NS 81.2 1.002 0.706 - 1.422 NS 78.5 1.095 0.877 - 1.368 NS
Female 2002 85.7 1 89.3 1 86.8 11999 78.9 0.644 0.467-0.887 <0.05 91.9 1.433 0.827 - 2.483 NS 83.0 0.785 0.596 - 1.034 NS
Taking drugs like heroin or morphine once or twiceTotal 2002 62.5 1 74.9 1 66.5 1
1999 54.3 0.739 0.621-0.880 <0.05 67.6 0.699 0.552 - 0.879 <0.05 58.6 0.732 0.628 - 0.829 <0.05Male 2002 61.8 1 75.4 1 66.4 1
1999 54.1 0.772 0.604-0.988 <0.05 64.5 0.603 0.445 - 0.817 <0.05 57.5 0.695 0.575 - 0.841 <0.05Female 2002 63.0 1 74.4 1 66.6 1
1999 54.5 0.706 0.552-0.904 <0.05 71.0 0.859 0.598 - 1.232 NS 59.7 0.749 0.611 - 0.919 <0.05Taking drugs like heroin and morphine regularly
Total 2002 84.9 1 87.6 1 85.8 11999 84.2 1.002 0.790-1.270 NS 90.5 1.383 0.995 - 1.923 NS 86.2 1.118 0.923 - 1.355 NS
Male 2002 80.1 1 84.8 1 81.7 11999 80.4 1.169 0.860-1.588 NS 87.2 1.229 0.829 - 1.820 NS 82.6 1.187 0.932 - 1.512 NS
Female 2002 89.4 1 90.6 1 89.8 11999 88.1 0.827 0.562-1.211 NS 94.1 1.806 0.980 - 3.327 NS 90.0 1.03 0.747 - 1.419 NS
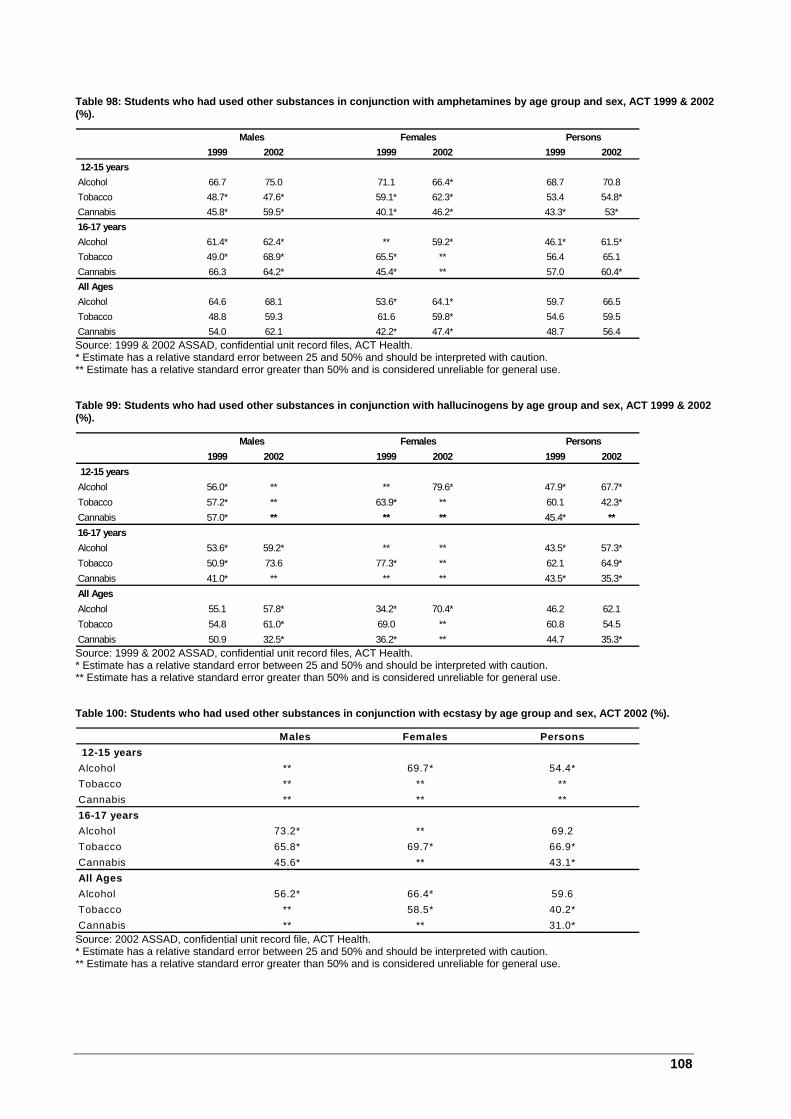
108
Table 98: Students who had used other substances in conjunction with amphetamines by age group and sex, ACT 1999 & 2002 (%).
Source: 1999 & 2002 ASSAD, confidential unit record files, ACT Health. * Estimate has a relative standard error between 25 and 50% and should be interpreted with caution. ** Estimate has a relative standard error greater than 50% and is considered unreliable for general use. Table 99: Students who had used other substances in conjunction with hallucinogens by age group and sex, ACT 1999 & 2002 (%).
Source: 1999 & 2002 ASSAD, confidential unit record files, ACT Health. * Estimate has a relative standard error between 25 and 50% and should be interpreted with caution. ** Estimate has a relative standard error greater than 50% and is considered unreliable for general use. Table 100: Students who had used other substances in conjunction with ecstasy by age group and sex, ACT 2002 (%).
Source: 2002 ASSAD, confidential unit record file, ACT Health. * Estimate has a relative standard error between 25 and 50% and should be interpreted with caution. ** Estimate has a relative standard error greater than 50% and is considered unreliable for general use.
1999 2002 1999 2002 1999 200212-15 years
Alcohol 66.7 75.0 71.1 66.4* 68.7 70.8Tobacco 48.7* 47.6* 59.1* 62.3* 53.4 54.8*Cannabis 45.8* 59.5* 40.1* 46.2* 43.3* 53*16-17 yearsAlcohol 61.4* 62.4* ** 59.2* 46.1* 61.5*Tobacco 49.0* 68.9* 65.5* ** 56.4 65.1Cannabis 66.3 64.2* 45.4* ** 57.0 60.4*All AgesAlcohol 64.6 68.1 53.6* 64.1* 59.7 66.5Tobacco 48.8 59.3 61.6 59.8* 54.6 59.5Cannabis 54.0 62.1 42.2* 47.4* 48.7 56.4
Persons Females Males
1999 2002 1999 2002 1999 200212-15 yearsAlcohol 56.0* ** ** 79.6* 47.9* 67.7*Tobacco 57.2* ** 63.9* ** 60.1 42.3*Cannabis 57.0* ** ** ** 45.4* **16-17 yearsAlcohol 53.6* 59.2* ** ** 43.5* 57.3*Tobacco 50.9* 73.6 77.3* ** 62.1 64.9*Cannabis 41.0* ** ** ** 43.5* 35.3*All AgesAlcohol 55.1 57.8* 34.2* 70.4* 46.2 62.1Tobacco 54.8 61.0* 69.0 ** 60.8 54.5Cannabis 50.9 32.5* 36.2* ** 44.7 35.3*
Persons Males Females
Males Females Persons12-15 years
Alcohol ** 69.7* 54.4*Tobacco ** ** **Cannabis ** ** **16-17 yearsAlcohol 73.2* ** 69.2Tobacco 65.8* 69.7* 66.9*Cannabis 45.6* ** 43.1*All AgesAlcohol 56.2* 66.4* 59.6Tobacco ** 58.5* 40.2*Cannabis ** ** 31.0*

109
OTHER HEALTH-RELATED BEHAVIOURS Table 101: Daily fruit, vegetable and bread/cereal consumption by sex, ACT 2002 (%).
Source: 2002 ASSAD, confidential unit record file, ACT Health. * Estimate has a relative standard error between 25 and 50% and should be interpreted with caution. ** Estimate has a relative standard error greater than 50% and is considered unreliable for general use. Table 102: Number of 30-minute sessions of moderate and vigorous physical activity undertaken in the previous week, by sex, ACT 2002 (%).
Source: 2002 ASSAD, confidential unit record file, ACT Health. * Estimate has a relative standard error between 25 and 50% and should be interpreted with caution. Table 103: Time spent watching TV/Video on an average school day, by sex, ACT 2002 (%).
Source: 2002 ASSAD, confidential unit record file, ACT Health. * Estimate has a relative standard error between 25 and 50% and should be interpreted with caution. Table 104: Time spent using the internet or playing computer games on an average school day, by sex, ACT 2002 (%).
Source: 2002 ASSAD, confidential unit record file, ACT Health. * Estimate has a relative standard error between 25 and 50% and should be interpreted with caution. ** Estimate has a relative standard error greater than 50% and is considered unreliable for general use. Table 105: Students reporting at least part of a lesson on skin cancer in the previous year, by age group, ACT 1996, 1999 & 2002 (%).
Source: 1996, 1999 & 2002 ASSAD, confidential unit record files, ACT Health.
Males FemalesVegetables Fruit Breads/Cereals Vegetables Fruit Breads/Cereals
1 serve or less 33.5 32.5 10.9 30.9 27.6 12.92-3 serves 47.6 42.4 42.8 53.2 48.6 48.34-5 serves 10.9 16.0 28.8 11.9 16.6 29.76 serves or more 5.9* 5.9* 15.9 2.6* 5.7* 8.2I do not eat this food type 2.1* 3.1* ** ** ** **
12-15 years 16-17 years All Ages 1996 65.3 48.1 60.11999 71.4 54.7 66.02002 70.6 51.8 64.5
Moderate Vigorous Moderate VigorousNone 14.1 11.1 11.0 14.0Once 18.9 14.4 15.8 16.2Twice 18.3 16.0 22.6 22.43 times 12.1 17.7 17.6 17.04 times 13.0 13.2 11.9 10.65 times 7.6 9.2 5.9* 7.2*6 or more times 16.1 18.4 15.2 12.7
Males Females
Males Females PersonsNone 4.9* 3.9* 4.41 hour or less 21.0 28.9 25.02 hours 31.0 32.6 31.83 hours 20.0 20.5 20.34 hours 10.2 7.8 9.05 or more hours 12.9 6.2* 9.5
Males Females PersonsNone 12.9 24.5 18.71 hour or less 30.9 44.6 37.82 hours 23.5 16.8 20.13 hours 16.0 8.2 12.14 hours 6.1* 3.9* 5.05 or more hours 10.6 ** 6.2
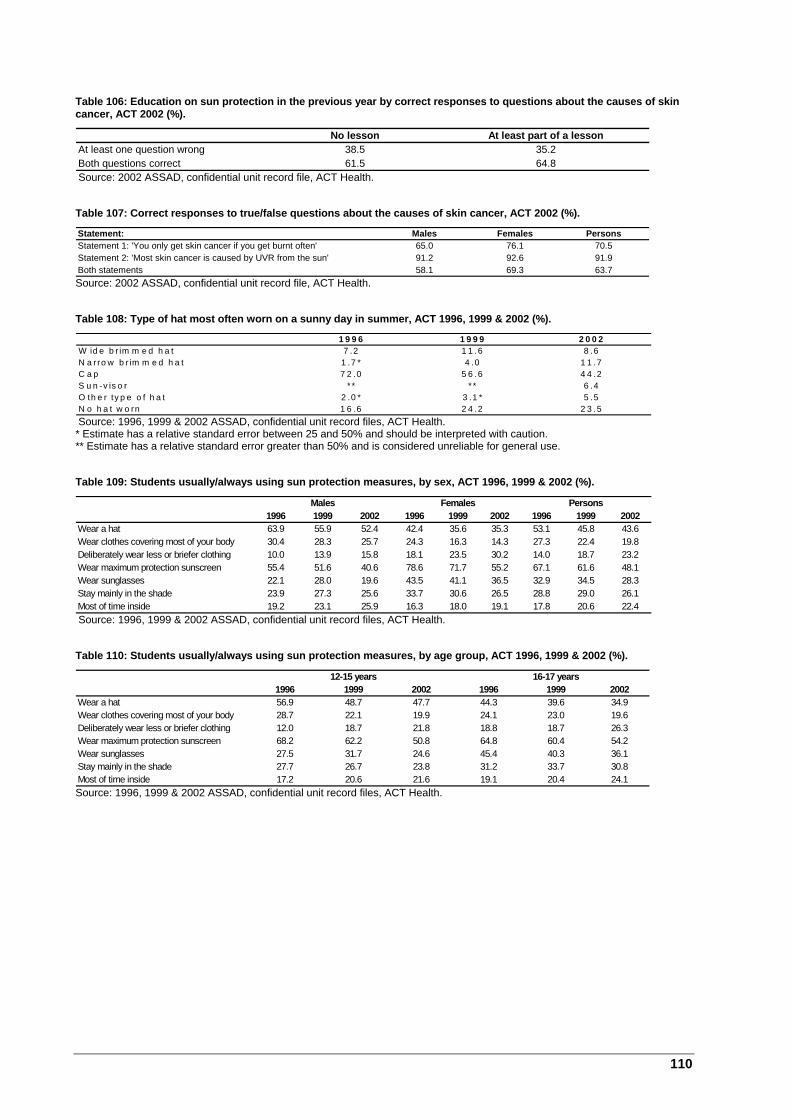
110
Table 106: Education on sun protection in the previous year by correct responses to questions about the causes of skin cancer, ACT 2002 (%).
Source: 2002 ASSAD, confidential unit record file, ACT Health. Table 107: Correct responses to true/false questions about the causes of skin cancer, ACT 2002 (%).
Source: 2002 ASSAD, confidential unit record file, ACT Health. Table 108: Type of hat most often worn on a sunny day in summer, ACT 1996, 1999 & 2002 (%).
Source: 1996, 1999 & 2002 ASSAD, confidential unit record files, ACT Health. * Estimate has a relative standard error between 25 and 50% and should be interpreted with caution. ** Estimate has a relative standard error greater than 50% and is considered unreliable for general use. Table 109: Students usually/always using sun protection measures, by sex, ACT 1996, 1999 & 2002 (%).
Source: 1996, 1999 & 2002 ASSAD, confidential unit record files, ACT Health. Table 110: Students usually/always using sun protection measures, by age group, ACT 1996, 1999 & 2002 (%).
Source: 1996, 1999 & 2002 ASSAD, confidential unit record files, ACT Health.
Males Females Persons1996 1999 2002 1996 1999 2002 1996 1999 2002
Wear a hat 63.9 55.9 52.4 42.4 35.6 35.3 53.1 45.8 43.6Wear clothes covering most of your body 30.4 28.3 25.7 24.3 16.3 14.3 27.3 22.4 19.8Deliberately wear less or briefer clothing 10.0 13.9 15.8 18.1 23.5 30.2 14.0 18.7 23.2Wear maximum protection sunscreen 55.4 51.6 40.6 78.6 71.7 55.2 67.1 61.6 48.1Wear sunglasses 22.1 28.0 19.6 43.5 41.1 36.5 32.9 34.5 28.3Stay mainly in the shade 23.9 27.3 25.6 33.7 30.6 26.5 28.8 29.0 26.1Most of time inside 19.2 23.1 25.9 16.3 18.0 19.1 17.8 20.6 22.4
No lesson At least part of a lessonAt least one question wrong 38.5 35.2Both questions correct 61.5 64.8
Statement: Males Females PersonsStatement 1: 'You only get skin cancer if you get burnt often' 65.0 76.1 70.5Statement 2: 'Most skin cancer is caused by UVR from the sun' 91.2 92.6 91.9Both statements 58.1 69.3 63.7
1 9 9 6 1 9 9 9 2 0 0 2W id e b r im m e d h a t 7 .2 1 1 .6 8 .6N a rro w b r im m e d h a t 1 .7 * 4 .0 1 1 .7C a p 7 2 .0 5 6 .6 4 4 .2S u n -v is o r * * * * 6 .4O th e r ty p e o f h a t 2 .0 * 3 .1 * 5 .5N o h a t w o rn 1 6 .6 2 4 .2 2 3 .5
12-15 years 16-17 years1996 1999 2002 1996 1999 2002
Wear a hat 56.9 48.7 47.7 44.3 39.6 34.9Wear clothes covering most of your body 28.7 22.1 19.9 24.1 23.0 19.6Deliberately wear less or briefer clothing 12.0 18.7 21.8 18.8 18.7 26.3Wear maximum protection sunscreen 68.2 62.2 50.8 64.8 60.4 54.2Wear sunglasses 27.5 31.7 24.6 45.4 40.3 36.1Stay mainly in the shade 27.7 26.7 23.8 31.2 33.7 30.8Most of time inside 17.2 20.6 21.6 19.1 20.4 24.1

111
ASSAD 2002 Questionnaire
SURVEY
• Please do not write your name on this paper. • The information you give is private and will only be seen
by the people putting all the answers together. • Answer every question you can. • If you can’t answer a question or if you do not want to
answer a question, leave it out and go on to the next one. • For most questions, there is a choice of answers. Pick the
one that’s true for you and tick the box next to it. • If you make a mistake or wish to change your answer,
cross out the mistake and tick the new response. • Some questions ask you to write a short answer in the
space provided. Office use only STATE 6 SCHOOL ID PCODE LEVEL CAMPUS PATTERN SCHSEX STRATA TEACH DAY ORDER 1 INITIALS DATE MONTH YEAR 2002 1. (a) What suburb or town do you live in? ______________________________
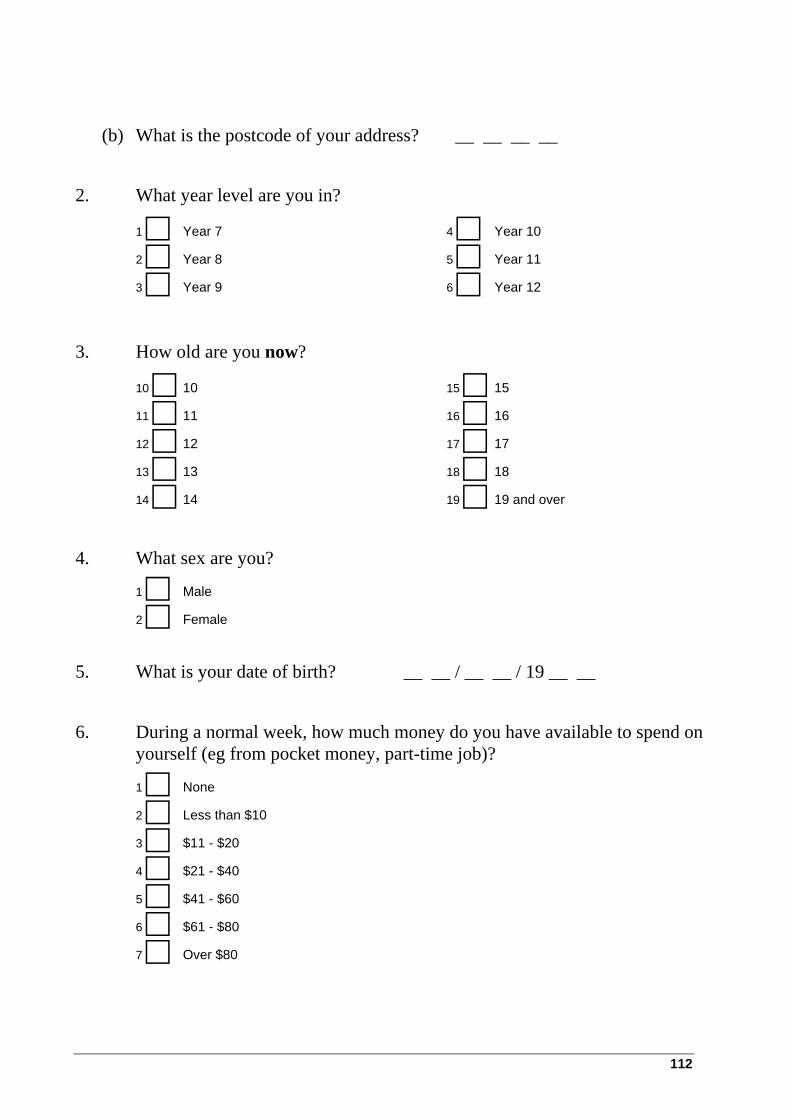
112
(b) What is the postcode of your address? __ __ __ __ 2. What year level are you in?
1 Year 7 4 Year 10
2 Year 8 5 Year 11
3 Year 9 6 Year 12
3. How old are you now?
10 10 15 15
11 11 16 16
12 12 17 17
13 13 18 18
14 14 19 19 and over 4. What sex are you?
1 Male
2 Female 5. What is your date of birth? __ __ / __ __ / 19 __ __ 6. During a normal week, how much money do you have available to spend on
yourself (eg from pocket money, part-time job)?
1 None
2 Less than $10
3 $11 - $20
4 $21 - $40
5 $41 - $60
6 $61 - $80
7 Over $80

113
7. At school work, do you consider yourself:
1 A lot above average?
2 Above average?
3 Average?
4 Below average?
5 A lot below average? 8. (a) Were you at school on the last school day?
1 Yes Go to QUESTION 9
2 No Go to QUESTION 8(b) (b) If No: Why were you away?
1 You were ill or had some other health problem
2 Study day or other school-related activities
3 Family reasons
4 Other (specify) ________________________________________________________________ 9. Are you of Aboriginal or Torres Strait Islander descent?
1 No
2 Yes - Aboriginal descent
3 Yes - Torres Strait Islander descent
4 Yes - both Aboriginal and Torres Strait Islander descent 10. What is the main language spoken at home? Tick only one box.
1 English
2 Another language only (specify which language) _____________________________________
3 English and another language (specify the other language) _____________________________________________________
114
THE NEXT FEW QUESTIONS ARE ABOUT DRINKING ALCOHOL - BEER, WINE, WINE COOLERS, ALCOHOLIC SODAS, SPIRITS, LIQUEURS, ALCOHOLIC APPLE CIDER, SHERRY OR PORT.
11. At the present time, do you consider yourself:
1 A non-drinker?
2 An occasional drinker?
3 A light drinker?
4 A party drinker?
5 A heavy drinker? 12. Have you ever had even part of an alcoholic drink?
1 No
2 Yes, just a few sips
3 Yes, I have had fewer than 10 alcoholic drinks in my life
4 Yes, I have had more than 10 alcoholic drinks in my life 13. Have you had an alcoholic drink in the last twelve months?
1 Yes
2 No 14. Have you had an alcoholic drink in the last four weeks?
1 Yes
2 No

115
15. This question is about the number of alcoholic drinks you had during the last seven days, including yesterday.
Put a tick near yesterday. Then in the space provided, write the number of alcoholic drinks you had yesterday. If you didn't have any alcoholic drinks, put in '0'. Start filling in the spaces beginning with yesterday, and follow the arrows.
Answer for every day of the week.
Write the number of alcoholic drinks you had each day in the circle.
Put '0' for each day you didn't drink any alcoholic drinks.
Monday
Tuesday
Wednesday
ThursdayFriday
Saturday
Sunday
116
QUESTIONS 16, 17, 18 AND 19 ARE FOR ANYONE WHO HAS HAD AN ALCOHOLIC DRINK. IF YOU HAVE NEVER HAD AN ALCOHOLIC DRINK, GO TO QUESTION 20.
16. What alcoholic drink do you usually have? Tick the box near the drink you usually have. If that drink is not listed here, tick the box next to
"Other" and write the name of the drink in the space provided.
01 Ordinary beer
02 Low alcohol beer
03 Wine
04 Wine Cooler (eg West Coast Coolers)
05 Champagne or sparkling wine (eg Spumante, Passion Pop)
06 Alcoholic Apple Cider (eg Strongbow)
07 Alcoholic Sodas (eg Two Dogs)
08 Premixed spirits (eg Bacardi Breezer, Lemon Ruski, UDL Drinks, Sub Zero)
09 Spirits (eg rum, brandy, whisky, gin, vodka)
10 Liqueurs (eg Tia Maria, Kahlua, Midori, etc)
** Other (specify) ________________________________________________________________
You should have ticked only one box.
117
17. Where, or from whom, did you get your last alcoholic drink?
Fill in the space beside "Other" if you can't find your answer.
Tick only one box.
I didn't buy it .... OR I bought it ....
01 My parent(s) gave it to me
02 My brother or sister gave it to me
03 I took it from home without my parent(s) permission
04 Friends gave it to me
05 I got someone to buy it for me
** Other (specify)
_____________________
51 At a hotel, pub, bar, tavern, RSL Club
52 At a licensed liquor store or supermarket
53 At a walk-in bottle-shop at a pub or hotel
54 At a drive-in bottle-shop
55 At a restaurant
56 At a dance venue/dance party
57 At a nightclub
58 At a sporting event
59 At a sports club (eg Leagues, surfing, football)
60 Through the Internet
61 By phone, fax, mail order
** Other (specify)________________________
You should have ticked only one box.
118
18. Where did you drink your last alcoholic drink? Fill in the space beside "Other" if you can't find your answer.
Tick only one box. I drank it .…
01 At a beach, park or recreation area
02 At a hotel, pub, bar, tavern or RSL club
03 At a dance venue/dance party
04 At a nightclub
05 At a party
06 At a restaurant
07 At a sporting event
08 At a sports club (eg Leagues, surfing, football)
09 On school grounds during school hours
10 On school grounds after hours
11 At my home
12 At my friend's home
13 In a car
** Other (specify) ________________________________________________________________
You should have ticked only one box. 19. Think back over the last two weeks. How many times, if any, have you had
the following number of alcoholic drinks on any one occasion when you have been drinking in the last two weeks?
3-6 7-9 10 or more None Once Twice times times times
(i) 11 or more drinks in a row 1 2 3 4 5 6 (ii) 7 or more drinks in a row 1 2 3 4 5 6 (iii) 5 or more drinks in a row 1 2 3 4 5 6
119
THE NEXT QUESTIONS ARE FOR EVERYONE AND ARE ABOUT SMOKING CIGARETTES.
20. At the present time, do you consider yourself: 1 A heavy smoker?
2 A light smoker?
3 An occasional smoker?
4 An ex-smoker?
5 A non-smoker? 21. Have you ever smoked even part of a cigarette?
1 No
2 Yes, just a few puffs
3 Yes, I have smoked fewer than 10 cigarettes in my life
4 Yes, I have smoked more than 10 but fewer than 100 cigarettes in my life
5 Yes, I have smoked more than 100 cigarettes in my life 22. Have you smoked cigarettes in the last twelve months?
1 Yes
2 No 23. Have you smoked cigarettes in the last four weeks?
1 Yes
2 No

120
24. This question is about the number of cigarettes you had during the last seven days, including yesterday. Put a tick near yesterday. Then in the space provided, write the number of cigarettes you had yesterday. If you didn't smoke any cigarettes, put in '0'. Start filling in the spaces beginning with yesterday, and follow the arrows.
Answer for every day of the week. Write the number of cigarettes you smoked each day in the circle. Put '0' for each day you didn't smoke any cigarettes.
25. Do you think you will be smoking cigarettes this time next year?
1 Certain not to be smoking
2 Very unlikely to be smoking
3 Unlikely to be smoking
4 Can't decide how likely
5 Likely to be smoking
6 Very likely to be smoking
7 Certain to be smoking
Monday
Tuesday
Wednesday
ThursdayFriday
Saturday
Sunday
121
26. Have you ever smoked even part of a cigar?
1 No
2 Yes, a few puffs but not as much as one cigar
3 Yes, I have smoked at least one cigar in my life QUESTIONS 27, 28 AND 29 ARE ONLY FOR THOSE WHO HAVE SMOKED A CIGARETTE IN THE PAST WEEK. IF YOU HAVE NOT SMOKED A CIGARETTE IN THE PAST WEEK, GO TO QUESTION 30.
27. (a) What brand of cigarettes do you usually smoke? Tick the box near the brand you usually smoke. If that brand is not listed here, tick the box next to "Other" and write the name of the brand in the space provided.
01 Alpine
02 Benson & Hedges
03 Dunhill
04 Escort
05 Fortune
06 Holiday
07 Horizon
08 Longbeach
09 Marlboro
10 Peter Jackson
11 Sterling
12 Stradbroke
13 Vogue
14 Wills Super Mild
15 Winfield
16 Freedom
** Other (specify) ________________________________________________________________
You should have ticked only one box.
122
(b) Do the cigarettes you usually smoke come from packets of ....? 1 20s?
2 25s?
3 30s?
4 35s?
5 40s?
6 50s? You should have ticked only one box.
28. (a) Where, or from whom, did you get the last cigarette that you smoked?
Fill in the space beside "Other" if you can't find your answer.
Tick only one box.
I didn't buy it .... OR I bought it ....
01 My parent(s) gave it to me 02 My brother or sister gave it to me 03 I took it from home without my
parent(s) permission
04 Friends gave it to me 05 I got someone to buy it for me ** Other (specify) ______________________
51 At a hotel, pub, bar, tavern, RSL Club
52 At a supermarket
53 At a newsagency
54 At a milk bar or delicatessen
55 At a convenience store (eg Food Plus) 56 At a tobacconist/tobacco shop
57 At a take-away food shop
58 At a petrol station
59 Through the Internet
** Other (specify)_____________________
You should have ticked only one box. (b) If you bought your last cigarette, was it from a coin-operated (vending) machine?
1 Yes
2 No

123
29. (a) Sometimes people break open a packet of cigarettes and sell single cigarettes. In the last four weeks, have you bought cigarettes that were not in a full packet (for example, buying one or more cigarette(s) at a time)?
1 Yes Go to QUESTION 29(b)
2 No Go to QUESTION 30 Thinking of the last time you bought cigarettes that were not in a full packet, who
did you buy the cigarette(s) from?
1 I bought the cigarette(s) at a shop
2 I bought the cigarette(s) from a friend or relative
3 I bought the cigarette(s) from someone else
THE NEXT QUESTIONS ARE FOR EVERYONE AND ARE ABOUT OTHER THINGS YOU MIGHT USE. For each substance, tick the box which shows how many times you have used the substance during the specified time period. There should only be one tick for each line of boxes.
30. How many times, if ever, have you used or taken pain killers/analgesics such
as Disprin, Panadol or Aspro, for any reason:
Once or 3-5 6-9 10-19 20-39 40 or more None twice times times times times times
(i) In the last week? 1 2 3 4 5 6 7 (ii) In the last four weeks? 1 2 3 4 5 6 7 (iii) In the last year? 1 2 3 4 5 6 7 (iv) In your lifetime? 1 2 3 4 5 6 7
124
31. How many times, if ever, have you used or taken sleeping tablets, tranquillisers or sedatives, such as Valium, Serepax or Rohypnol (rohies, barbs) other than for medical reasons:
Once or 3-5 6-9 10-19 20-39 40 or more None twice times times times times times
(i) In the last week? 1 2 3 4 5 6 7 (ii) In the last four weeks? 1 2 3 4 5 6 7 (iii) In the last year? 1 2 3 4 5 6 7 (iv) In your lifetime? 1 2 3 4 5 6 7 32. (a) How many times, if ever, have you smoked or used marijuana/cannabis
(grass, hash, dope, weed, mull, yarndi, ganga, pot, a bong, a joint):
Once or 3-5 6-9 10-19 20-39 40 or more None twice times times times times times
(i) In the last week? 1 2 3 4 5 6 7
(ii) In the last four weeks? 1 2 3 4 5 6 7
(iii) In the last year? 1 2 3 4 5 6 7
(iv) In your lifetime? 1 2 3 4 5 6 7
If you have NOT used marijuana/cannabis in the last year, go to QUESTION 33. (b) In the last year, did you use any other substance or substances on the same
occasion that you used marijuana/cannabis?
Tick all that apply.
01 Tobacco
02 Alcohol
03 Pain killers/analgesics
04 Sedatives/tranquillisers/sleeping tablets
05 Hallucinogens (eg LSD, acid, trips, magic mushrooms)
06 Amphetamines (eg speed, uppers, goey, MDA, dex, dexies, dexamphetamines, ox blood, methamphetamine, ice)
07 Ecstasy (XTC, E, MDMA, ecci, X, bickies)
** Other (what substance?) ________________________________________________________
08 I did not use any other substance on the same occasion

125
You should have ticked all that apply.
(c) When you use cannabis (marijuana) do you usually: Tick only one box
1 Smoke it as a joint (reefer, spliff)?
2 Smoke it from a bong or a pipe?
3 Eat it (eg in hash cookies)?
4 Other (specify) ________________________________________________________________
You should have ticked only one box. (d) Do you usually use cannabis (marijuana) by yourself or with others?
1 By myself
2 With others
3 By myself and with others about equally often (e) Where did you last use cannabis?
Fill in the space beside “Other” if you can’t find your answer
I used it….
01 At a hotel, pub, bar, tavern or RSL club
02 At a dance venue, dance party, rave
03 At a nightclub
04 At a party
05 At my home
06 At my friend’s home
07 At a sports club (eg Leagues, surfing, football)
08 At the beach
09 In a park
10 In a car
11 On school grounds during school time
12 On school grounds after hours
** Other (specify) ________________________________________________________________
You should have ticked only one box.
126
33. How many times, if ever, have you used or taken steroids (muscle, roids, or gear) without a doctor's prescription in an attempt to make you better at sport, to increase muscle size or to improve your general appearance:
Once or 3-5 6-9 10-19 20-39 40 or more None twice times times times times times
(i) In the last week? 1 2 3 4 5 6 7 (ii) In the last four weeks? 1 2 3 4 5 6 7 (iii) In the last year? 1 2 3 4 5 6 7 (iv) In your lifetime? 1 2 3 4 5 6 7 34. How many times, if ever, have you deliberately sniffed (inhaled) from spray
cans or sniffed things like glue, paint, petrol or thinners in order to get high or for the way it makes you feel:
This does not include sniffing white-out, liquid paper, textas or pens.
Once or 3-5 6-9 10-19 20-39 40 or more None twice times times times times times
(i) In the last week? 1 2 3 4 5 6 7 (ii) In the last four weeks? 1 2 3 4 5 6 7 (iii) In the last year? 1 2 3 4 5 6 7 (iv) In your lifetime? 1 2 3 4 5 6 7 35. (a) How many times, if ever, have you used or taken amphetamines (eg speed,
uppers, MDA, goey, dex, dexies, dexamphetamine, ox blood, methamphetamine, ice) other than for medical reasons:
Once or 3-5 6-9 10-19 20-39 40 or more None twice times times times times times
(i) In the last week? 1 2 3 4 5 6 7 (ii) In the last four weeks? 1 2 3 4 5 6 7 (iii) In the last year? 1 2 3 4 5 6 7 (iv) In your lifetime? 1 2 3 4 5 6 7 If you have NOT used amphetamines in the last year, go to QUESTION 36(a).

127
(b) In the last year, did you use any other substance or substances on the same occasion that you used amphetamines (eg speed, uppers, goey, MDA, dex, dexies, dexamphetamine, ox blood, methamphetamine, ice)?
Tick all that apply.
01 Tobacco
02 Alcohol
03 Pain killers/analgesics
04 Sedatives/tranquillisers/sleeping tablets
05 Hallucinogens (eg LSD, acid, trips, magic mushrooms)
06 Marijuana/cannabis
07 Ecstasy (XTC, E, MDMA, ecci, X, bickies) ** Other (what substance?) ________________________________________________________
08 I did not use any other substance on the same occasion
You should have ticked all that apply 36. (a) How many times, if ever, have you used or taken ecstasy or XTC (E,
MDMA, ecci, X, bickies): Once or 3-5 6-9 10-19 20-39 40 or more None twice times times times times times
(i) In the last week? 1 2 3 4 5 6 7 (ii) In the last four weeks? 1 2 3 4 5 6 7 (iii) In the last year? 1 2 3 4 5 6 7 (iv) In your lifetime? 1 2 3 4 5 6 7 If you have NOT used ecstasy in the last year, go to QUESTION 37.
128
(b) In the last year, did you use any other substance or substances on the same occasion that you used ecstasy (XTC, E, MDMA, ecci, X, bickies)?
Tick all that apply.
01 Tobacco
02 Alcohol
03 Pain killers/analgesics
04 Sedatives/tranquillisers/sleeping tablets
05 Hallucinogens (eg LSD, acid, trips, magic mushrooms)
06 Amphetamines (eg speed, uppers, goey, MDA, dex, dexies, dexamphetamines, ox blood, methamphetamine, ice)
07 Marijuana/cannabis ** Other (what substance?) ________________________________________________________
08 I did not use any other substance on the same occasion
You should have ticked all that apply.
37. How many times, if ever, have you used or taken cocaine:
Once or 3-5 6-9 10-19 20-39 40 or more None twice times times times times times
(i) In the last week? 1 2 3 4 5 6 7 (ii) In the last four weeks? 1 2 3 4 5 6 7 (iii) In the last year? 1 2 3 4 5 6 7 (iv) In your lifetime? 1 2 3 4 5 6 7

129
38. How many times, if ever, have you used or taken heroin (smack, horse, skag, hammer, H), or other opiates (narcotics) such as methadone, morphine or pethidine other than for medical reasons:
Once or 3-5 6-9 10-19 20-39 40 or more None twice times times times times times
(i) In the last week? 1 2 3 4 5 6 7 (ii) In the last four weeks? 1 2 3 4 5 6 7 (iii) In the last year? 1 2 3 4 5 6 7 (iv) In your lifetime? 1 2 3 4 5 6 7 39. (a) How many times, if ever, have you used or taken hallucinogens (eg LSD,
acid, trips, magic mushrooms, datura, angel’s trumpet):
Once or 3-5 6-9 10-19 20-39 40 or more None twice times times times times times
(i) In the last week? 1 2 3 4 5 6 7 (ii) In the last four weeks? 1 2 3 4 5 6 7 (iii) In the last year? 1 2 3 4 5 6 7 (iv) In your lifetime? 1 2 3 4 5 6 7
If you have NOT used hallucinogens in the last year, go to QUESTION 40. (b) In the last year, what forms of hallucinogens did you use?
Tick all that apply.
1 Tablets
2 Paper tabs 3 Liquids 4 Magic Mushrooms
5 Datura / Angel’s trumpet
6 Other (please write in) __________________________________________________________

130
(c) In the last year, did you use any other substance or substances on the same occasion that you used hallucinogens (eg LSD, acid, trips, magic mushrooms, datura, angel’s trumpet)?
Tick all that apply. 01 Tobacco
02 Alcohol
03 Pain killers/analgesics
04 Sedatives/tranquillisers/sleeping tablets
05 Marijuana/cannabis
06 Amphetamines (eg speed, uppers, goey, MDA, dex, dexies, dexamphetamines, ox blood, methamphetamine, ice)
07 Ecstasy (XTC, E, MDMA, ecci, X, bickies) ** Other (what substance?) ________________________________________________________
08 I did not use any other substance on the same occasion
You should have ticked all that apply.
THESE QUESTIONS ARE FOR EVERYONE.
40. During 2001 (last year), did you have any lessons or parts of lessons at school that were about smoking?
1 No, not even part of a lesson
2 Yes, part of a lesson
3 Yes, one lesson
4 Yes, more than one lesson 41. During 2001 (last year), did you have any lessons or parts of lessons at
school that were about drinking?
1 No, not even part of a lesson
2 Yes, part of a lesson
3 Yes, one lesson
4 Yes, more than one lesson
131
42. During 2001 (last year), did you have any lessons or parts of lessons at school that were about illicit drugs such as marijuana, ecstasy, heroin, amphetamines, hallucinogens, cocaine?
1 No, not even part of a lesson
2 Yes, part of a lesson
3 Yes, one lesson
4 Yes, more than one lesson
Remember, last year was 2001.
THE NEXT FEW QUESTIONS ARE ABOUT SOME OTHER TOPICS.
43. You only get skin cancer if you get burnt often.
1 True
2 False 44. Most skin cancer is caused by ultraviolet radiation (UVR) from the sun.
1 True
2 False 45. During 2001 (that is last year), did you have any lessons or parts of lessons
at school that were about skin cancer or protection from the sun?
1 No, not even part of a lesson
2 Yes, part of a lesson
3 Yes, one lesson
4 Yes, more than one lesson
132
46. Over the last summer, did you get sunburn that was sore or tender the next day?
1 Yes, just once
2 Yes, 2 or 3 times
3 Yes, 4 or more times
4 No, not at all 47. (a) Have you ever had severe sunburn, which has blistered?
1 Yes Go to QUESTION 47(b)
2 No Go to QUESTION 48
(b) If yes, how long ago was the last time you were severely sunburnt?
1 Last summer
2 1 to 2 years ago
3 More than 2 years ago 48. What type of hat do you most often wear on a sunny day in summer?
1 Wide brimmed hat
2 Narrow brimmed hat
3 Legionnaire hat
4 Cap
5 Sun-visor
6 Other (what kind?)
7 None

133
49. What is the SPF (Sun Protection Factor) of the sunscreen you usually use on a sunny day in summer? 1 I don’t use sunscreen
2 SPF 12 or lower 3 SPF 15
4 SPF 30+
5 Can’t remember / don’t know 50. Suppose your skin was exposed to strong sunshine at the beginning of
summer with no protection at all. If you stayed in the sun for 30 minutes, would your skin:
1 Just burn or go red
2 Burn or go red first, then tan afterwards
3 Just tan
4 Nothing would happen because I was born with dark skin
51. Do you like to get a suntan?
1 No
2 Yes, a light tan
3 Yes, a moderate tan
4 Yes, a dark tan
5 Yes, a very dark tan
134
52. Thinking about sunny days in summer, when you are outside for an hour or more between 11 am and 3 pm, how often would you:
Never Rarely Sometimes Usually Always
(i) Wear a hat? 1 2 3 4 5 (ii) Wear clothes covering most of your
body (including arms and legs)? 1 2 3 4 5 (iii) Deliberately wear less or briefer clothing so
as to get some sun on your skin? 1 2 3 4 5
(iv) Wear maximum protection sunscreen (SPF 30+)? 1 2 3 4 5
(v) Wear sunglasses? 1 2 3 4 5 (vi) Stay mainly in the shade? 1 2 3 4 5 Thinking about sunny days in summer between 11 am and 3 pm:
Never Rarely Sometimes Usually Always (vii) How often would you spend most
of the time inside? 1 2 3 4 5
THE NEXT FEW QUESTIONS ARE ABOUT FOOD YOU MIGHT HAVE EATEN
53. How many serves of vegetables do you usually eat each day? (A serve is
equal to 1/2 cup of cooked vegetables or 1 cup of salad vegetables)
1 1 serve or less
2 2-3 serves
3 4-5 serves
4 6 serves or more
5 I do not eat vegetables 54. How many serves of fruit do you usually eat each day? (A serve is equal to
1 medium piece or 2 small pieces of fruit or 1 cup of diced pieces of fruit)
1 1 serve or less
2 2-3 serves
3 4-5 serves
4 6 serves or more
5 I do not eat fruit

135
55. How many serves of bread and/or cereal do you usually eat each day? (A serve is 1 slice of bread, 1/2 bread roll, 1/2 cup of breakfast cereal or 1/2
cup of pasta, rice, or noodles)
1 1 serve or less
2 2-3 serves
3 4-5 serves
4 6 serves or more
5 I do not eat bread or cereals
THE NEXT FEW QUESTIONS ARE ABOUT SOME ACTIVITIES YOU MIGHT HAVE DONE IN THE LAST WEEK
56. How many times in the last week did you:
3 4 5 6 or more None Once Twice times times times times
(i) do any vigorous physical activity for at least 30 minutes that made you sweat and breathe hard? (eg basketball, netball, soccer, football, running, fast bike riding, aerobics) 1 2 3 4 5 6 7
for at least 30 minutes that did not make you sweat or breathe hard? (eg slow bike riding, housework, brisk walking, pushing a lawnmower) 1 2 3 4 5 6 7
57. On an average school day, about how many hours a day do you do the following
when you are not at school: 1 hour 2 3 4 5 or more None or less hours hours hours hours
(i) homework 1 2 3 4 5 6
(ii) watching TV/videos 1 2 3 4 5 6
(iii) using Internet/playing computer games? (Don’t include computer use for homework) 1 2 3 4 5 6

136
THE FOLLOWING QUESTIONS ARE ABOUT CIGARETTES AND ALCOHOL.
58. Here are some statements about smoking cigarettes and drinking alcoholic
drinks. How much do you agree or disagree with each of the following statements?
Strongly Disagree Agree Strongly Don’t disagree agree know
(a) Kids who smoke seem more grown up than non-smokers 1 2 3 4 5
(b) Smokers are usually more popular than non-smokers 1 2 3 4 5
(c) The health of non-smokers can be affected by breathing other people’s cigarette smoke 1 2 3 4 5
(d) Getting drunk every now and then is not a problem 1 2 3 4 5
(e) Having a few drinks is one of the best ways of relaxing 1 2 3 4 5
(f) Having a few drinks is one of the best ways of getting to know people 1 2 3 4 5
(g) Having a few drinks makes you part of the group 1 2 3 4 5
(h) You can have a good time at a party where there is no alcohol 1 2 3 4 5
(i) People who drink alcohol are usually more popular than people who don’t 1 2 3 4 5
137
THE FOLLOWING QUESTIONS ARE ABOUT ACCESS TO ALCOHOL AND TOBACCO
59. Have you ever tried to buy alcohol at a hotel, club, restaurant, licensed store
or supermarket, disco or dance, sporting event or bottleshop?
Please tick one box only.
1 No GO TO QUESTION 62 2 Yes GO TO QUESTION 60
60. Have you ever been refused alcohol at a hotel, club, restaurant, licensed store or supermarket, disco or dance, sporting event or bottleshop?
Please tick one box only.
1 No, I have never been refused alcohol 2 Yes, I have been refused alcohol once or twice 3 Yes, I have been refused alcohol frequently
61. Have you ever been asked to provide proof of your age at a hotel, club, restaurant, licensed store or supermarket, disco or dance, sporting event or bottleshop?
Please tick one box only.
1 No, I have never been asked for proof of my age 2 Yes, I have been asked for proof of my age once or twice 3 Yes, I have frequently been asked for proof of my age
62. Have you ever tried to buy cigarettes from a retailer (such as a delicatessen, petrol station, take-away food shop, newsagency, supermarket or pub/hotel)?
Please tick one box only.
1 No GO TO QUESTION 66 2 Yes GO TO QUESTION 63

138
63. When you have tried to buy cigarettes, has a retailer ever refused to sell cigarettes to you?
Please tick one box only.
1 No, I have never been refused cigarettes 2 Yes, I have been refused cigarettes once or twice 3 Yes, I have been refused cigarettes frequently
64. Have you ever been asked to provide proof of your age when buying cigarettes?
Please tick one box only.
1 No, I have never been asked for proof of my age 2 Yes, I have been asked for proof of my age once or twice
3 Yes, I have frequently been asked for proof of my age
65. Where do you usually smoke? Fill in the space beside "Other" if you can't find your answer.
Tick more than one box if necessary. I usually smoke .…
01 At a park or recreation area
02 At a dance venue/dance party
03 At a nightclub
04 At a party
05 At a restaurant
06 At a sporting event
07 On school grounds during school hours
08 On school grounds after hours
09 At my home
10 At my friend's home
11 In a car
12 At my job
** Other (specify) ________________________________________________________________

139
THE FOLLOWING QUESTIONS ARE ABOUT USING NEEDLES OR SYRINGES
66. How many times, if at all, have you used any drug by injection or needles without a doctor’s prescription?
This does not include injecting for medical reasons, such as diabetes. Never Once or 3-5 6-9 10-19 20-39 40 or twice times times times times more times
(a) In the last week? 1 2 3 4 5 6 7 (b) In the last four weeks? 1 2 3 4 5 6 7 (c) In the last year? 1 2 3 4 5 6 7 (d) In your lifetime? 1 2 3 4 5 6 7
If you have NEVER injected drugs without a doctor’s prescription, go to QUESTION 70
67. Have you ever shared a needle or syringe with someone else?
1 Yes 2 No
68. Have you ever obtained clean injecting equipment from a needle and syringe outlet?
1 Yes 2 No
69. Have you ever been informed about safe injecting practices?
1 Yes 2 No

140
THE NEXT QUESTIONS ARE ABOUT SOME OTHER THINGS YOU MIGHT USE
70. How much danger would you see for yourself in the following? Not A little Very Don’t dangerous dangerous dangerous know
(a) Smoking less than 10 cigarettes every day 1 2 3 4
(b) Using LSD regularly 1 2 3 4
(c) Using cocaine 1 2 3 4
(d) Smoking more than 20 cigarettes a day 1 2 3 4 (e) Trying drugs like heroin or morphine
(narcotics) once or twice 1 2 3 4
(f) Using needles and syringes to inject drugs 1 2 3 4
(g) Trying amphetamines (speed) occasionally 1 2 3 4 (h) Taking drugs like heroin or morphine
(narcotics) regularly 1 2 3 4
(i) Sniffing glue, thinners or petrol regularly 11 2 3 4 (j) Taking two or three aspirins or other
analgesic tablets nearly every day 1 2 3 4 (k) Using ecstasy/designer drugs (XTC, E,
MDMA, Ecci) occasionally 1 2 3 4
(l) Smoking marijuana regularly 1 2 3 4
(m) Trying LSD once or twice 1 2 3 4 (n) Having five or more drinks of beer,
wine or spirits in a row 1 2 3 4 (o) Using ecstasy/designer drugs (XTC, E,
MDMA, Ecci) regularly 1 2 3 4 (p) Mixing a number of drugs (including
alcohol and other drugs) 1 2 3 4
Thank you very much for your help.

141
GLOSSARY ACT – Australian Capital Territory. ASSAD – Australian Secondary Students Alcohol and Drug survey (1996, 1999 and 2002). Chi square (χ2) – An over all measure of the association or discrepancy between an expected and observed set of values, within categories, in which a distribution has been divided. ‘Ex-smoker’ – self-described smoking status. Harmful drinker – defined by level of alcohol consumption. Defined for females as consumption of five or more drinks on any one day in the week prior to survey and seven or more drinks on any one day in the week prior to survey for males. ‘Heavy drinker’ - self-described drinking status. ‘Heavy smoker’ – self-described smoking status. Inadequate diet – Insufficient consumption of one or more of any of the following food types: fruit, vegetables, bread and cereals, to meet the Dietary Guidelines for Children and Adolescents in Australia. Insufficient physical activity – insufficient activity to meet the National Physical Activity Guidelines for Australians (existing recommendations for children and adolescents less than 18 years of age) - 30 minutes of moderate activity at least six times, and 30 minutes of vigorous activity at least three times in the week prior to the survey. Lifetime use – defined as having ever used a substance in lifetime. ‘Light drinker’ – self-described drinking status. ‘Light smoker’ – self-described smoking status. Logistic regression – statistical procedure used to estimate how closely two or more variables are related. Median – a measure of central tendency - the point between the upper and lower halves of a set of values. Moderate physical activity – activity which did not make students sweat or breathe hard, such as slow bike riding, housework, brisk walking, pushing a lawnmower etc. ‘Non-drinker’ – self-described drinking status. ‘Non-smoker’ – self-described smoking status. ‘Occasional drinker– self-described drinking status. ‘Occasional smoker’ – self-described smoking status. ‘Party drinker’ – self-described drinking status. P-value – The probability that the hypothesis under test is correct. Passive smoking – exposure to second hand smoke, environmental tobacco smoke. Recent, or current smoker - defined as cigarette smoking in the week prior to survey. Recent drinker - defined as any alcohol consumption in the week prior to survey.

142
Relative standard error – a value that expresses a standard error as a proportion of an estimate. The relative standard error provides an indication of the reliability of an estimate. Vigorous physical activity – activity which made students sweat or breathe hard, such as basketball, netball, soccer, football, running, fast bike riding, aerobics etc.
143
REFERENCES Active Australia and Commonwealth Department of Health and Aged Care. 1999. National Physical Activity Guidelines For Australians. Canberra, AusInfo. Australian Bureau of Statistics. 2001. Measuring Dietary Habits in the 2001 National Health Survey, Australia. Occasional Paper: 4814.0.55.001. Canberra, Australian Bureau of Statistics. Australian Bureau of Statistics. 2003. 2002 Schools Australia. Cat. No. 4221.0. Canberra, Australian Bureau of Statistics. Barkess JL, Sherriff JL. 2003. Relative validity of two brief sets of questions to assess vegetable intake behaviours. Asia Pac J Clin Nutr.12 Suppl: S23. National Health and Medical Research Council. 2001. Australian Alcohol Guidelines: Health Risks and Benefits. Canberra, AusInfo. National Health and Medical Research Council and Commonwealth Department of Health and Aged Care. 2003. Dietary Guidelines for Children and Adolescents in Australia. Canberra, AusInfo. The Cancer Council Australia. 2001. National Cancer Prevention Policy 2001-03. Sydney, The Cancer Council Australia.