subsidence at houston, texas - home | national geodetic …€¦ · subsidence at houston, texas...
TRANSCRIPT

N O M Technical Report NOS 131 NGS 44
Subsidence at Houston, Texas 1973-87 Sandford R. Holdahl Joseph C. Holzschuh David B. Zilkoski
Rockville, MD August 1989
U.S. DEPARTMENT OF COMMERCE National Oceanic and Atmospheric Administration National Ocean Service Chatting and Geodetic Services

NOAA TECHNICAL PUBLICATIONS
National Ocean Service/National Geodetic Survey Subseries
The National Geodetic Survey (NGS), Office of Charting and Geodetic Services, the National Ocean Service (NOS), N O M , establishes and maintains the basic national horizontal, vertical, and gravity networks of geodetic control, and provides Government-wide leadership in the improvement of geodetic surveying methods and instrumentation, coordinates operations to assure network development, and provides specifications and criteria for survey operations by Federal, State, and other agencies.
NGS engages in research and development for the improvement of knowledge of the figure of the Earth and its gravity field, and has the responsibility to procure geodetic data from all sources, process these data, and make them generally available to users through a central data base.
NOAA geodetic publications and relevant geodetic publications of the former U.S. Coast and Geodetic Survey are sold in paper form by the National Geodetic Information Branch. To obtain a price list or to place an order, contact:
National Geodetic Information Branch (N/CG174) Charting and Geodetic Services National Ocean Service National Oceanic and Atmospheric Administration Rockville, MD 20852
Telephone: 1 301 443 8631
When placing an order, make check or money order payable to: National Do not send cash or stamps. Geodetic Survey.
Visa or Master Card, or purchased over the counter at the National Geodetic Information Branch, 11400 Rockville Pike, Room 24, Rockville, MD.
Publications can be charged to
An excellent reference source for all Government publications is the National Depository Library Program, a network of about 1,400 designated libraries. through your local library. available from the Library Division, U . S . Government Printing Office, Washington, DC 20401 (telephone: 1 2 0 2 275 3635).
Requests for borrowing Depository Library material may be made A free listing of libraries in this system is

N O M Technical Report NOS 131 NGS 44
gpMB*9. Subsidence at -1 Houston, Texas
1973187 [Wi 5-p %14iln,ofccFI'
Sandford R. Holdahl Joseph C. Holzschuh David B. Zilkoski
National Geodetic Survey Rockville, MD August 1989
U.S. DEPARTMENT OF COMMERCE Robert A. Mosbacher, Secretary
National Oceanic and Atmospheric Administration John A. Knauss, Under Secretary
National Ocean Service Virginia K. Tippie, Assistant Administrator
Charting and Geodetic Services R. Adm. Wesley V. Hull, Director
For sale by the National Geodetic Information Branch, N O M , Rackville, MD 20852

Blank page r e t a i n e d for p a g i n a t i o n

CONTENTS
Mathematical develo~ent.................................................. .... 4 The quadratic height function...............................................4 Time districting..... ....................................................... 5
Application to the Houston level network......................................6
Results and model validation..................................................g
Sulll[nary......................................................................l7
Acknowled~ent.. ............................................................. 20
Referencee...................................................................20
Mention of a commercial company or product does not con- stitute an endorsement by the National Oceanic and Atmospheric Administration. of information from this publication concerning proprietary products or the test of such products is not authorized.
Use for publicity or advertisement purposes
iii
Sandford R. Holdahl and David B. Zilkoski
National Ocean Service, NOAA, Rockville, MD 20852 National Geodetic Survey, Charting and Geodetic Services
Joseph C. Holzschuh Harris-Galveston Coastal Subsidence District, Houston, TX 77058
ABSTRACT. Models of vertical deformation are needed for calculation of vertical motion corrections to leveling data in areas like Houston, TX, where significant subsidence results
nouston have been used as test data to refine and evaluate modeling techniques. For the last 10 years, surface-fitting methods have been used in scientific studies to quantify and interpolate crustal motion and subsidence. modeling procedures are used to create a data base of coeffi- cients that are the basis for correcting old leveling measure- ments forward in time, to allow simultaneous adjustment with recent measurements.
from withdrawal of groundwater. The repeated leveling8 at
Now the same
The regional subsidence pattern at Houston, TX, has been derived from repeated levelings and extensometer data. The leveling surveys were performed in distinct epochs: 1973, 1978, 1983, and 1987. The earliest extensometer records date from 1973. The Houston region was divided into two zones according to whether water levels in artesian wells had recently risen (east zone) or fallen (west zone). The west zone shows mildly nonlinear and increasing subsidence rates ranging up to -72 mm/yr in 1987, just 7 miles west of downtown Houston. The east zone was characterized by rates of up to -70 mm/yr from 1973 to 1978, followed by 60-90 percent decreases in these rates by 1987. The sharp decrease has been caused by regulated declines (44-84 percent) in pumping of groundwater, as well as importation of surface water from Lake Houston. The Subsidence model for Houston was derived at the same time its level network was adjusted, using multiquadric (MQ) analysis for spatial interpolation of subsidence velocit- ies. A quadratic height function was used for west Houston, with one set of unknown coefficients to describe regional variation of subsidence velocity and another to describe acceleration. Subsidence in east Houston was modeled as a sequence of regionally variable velocities; one set of MQ coefficients describes the velocity pattern between 1973 and 1978, and a second set describes the subsidence from 1978 to 1987. The coefficients that define the Houston subsidence model were placed in a data base, and then accessed to suc- cessfully calculate corrections for old leveling data.

INTRODUCTION
The National Geodetic Survey is presently developing improved methods for modeling vertical motion. national level network which extends into many areas of crustal motion and subsidence. in vertically deforming areas to be corrected to the rough equivalent of recent measurements. traditional static adjustment model in the adjustment of the national net. The nonlinear eubsidence at Houston is a good example to illustrate some of the new techniques that may be applied in the national project.
This development must precede readjustment of the
The geodetic objective of these models is to allow old leveling data
This improves the reliability of the leveling and allows use of the
The phenomenon of land surface subsidence has long been recognized as a serious problem i n the area near HOUBtOn. (See f ig . 1 . ) As early as 1926, a meter of subsidence wae reported at Goose Creek oil field at the north end of Galveston Bay. The Subsidence at Goose Creek was due to the withdrawal of oil from shallow reservoirs and was confined to the small area of the oil field itself.
Since that time, the nearby cities of Houston and Galveston, as well as a large petrochemical industry, have all seen dramatic growth. This growth was supported exclusively by large withdrawals of groundwater from vast aquifers which underlie most of this Gulf Coast region. These Withdrawals lowered water pressures in the aquifers allowing the many clay beds to compress, resulting in the lowering of the land surface (subsidence) up to 3 m in some areas. Thousands of acres of valuable land have been submerged due to subsidence and even larger areas are now subject to flooding from hurricane storm surge or overflow of freshwater streams and bayous during periods of heavy rainfall.
Land subeidence continues to the present at Houaton and is being studied intensively by the Harris-Galveston Coastal Subsidence District, an organization whose task is to balance the sometimes conflicting requirements for water resources and stable land surface.
Between 1963 and 1978, all of the region within 20 miles of Houston had subsided at least 3 dm. A maximum change, exceeding 1.5 m for that time interval, was centered east of Houston about halfway to Baytown (Balazs, 1980). This is the area in which the heaviest groundwater withdrawals were occurring for Houston's growing petrochemical industry.
Balazs (1980) compared level survey results from 1963, 1973, 1976, and 1978. A significant conclusion in that report was that subsidence rates between 1973 and 1978 had slowed by 25 percent on the east side of Houston where maximum change had occurred for the prior period 1963-73. The lowering of subsidence rates in that region was attributed to reduced withdrawal of water for industrial use. Increasing amounts of surface water brought in by newly constructed canal eystems have continued to replace water previously taken from underground.
During the period from 1978 to present, groundwater withdrawals continued to decrease on the east side of Houston due to the continued regulation of groundwat- er and the availability of surface water to replace it. Houston, however, was continuing a period of rapid growth which was supported solely by groundwater withdrawals. The means to supply surface water to west Houston have not yet been implemented. After a partial releveling of the Houston network in 1983, Zilkoski (1984) also calculated a decrease in subsidence eaet of
The area to the west of
2

-960 0' -95O30 ' -950 0 ' I
n
I I I
I
u la8 t E8
T 1149, SPRING /FA-$
W
30° 0'
29O30'
-95O30 ' -9+ 0 '
- 30° 0'
I
I
- 29O30'
Figure 1.--Locations of level lines and extensometers - Houston, TX. Solid symbols are used to distinguish east Houston modeling district.

Houston and noted continued rapid Subsidence on the west side of Houston (328.6 nun between Houston and Addicks) since 1978. the pumping patterns.
This result seemed to conform well with
The present analysis of the 1987 leveling survey is aimed at determining the most recent subsidence velocities as well as to quantify and document how the subsidence pattern has shifted during the period from 1973 to 1987. measurements made in 1973, 1978, 1983, and 1987 were the basis of the investiga- tion. The 1973 and 1978 surveys were undoubtedly biased by magnetic errors that were not known to exist in 1978. in the present analysis have been corrected for magnetic error using a procedure based on empirical calibrations (Holdahl et al., 1987).
The leveling
All of the Zeiss Ni-1 leveling measurements used
The computation of Houston's elevations has become complicated because sub- Most computer progranla for calculating sidence rates are changing with time.
motion utilize simple models which assume that motion is constant in time. this study, more advanced techniques are used to model accelerations in the Subsidence rates. model, and gives the resulte of the investigation to determine the recent character of subsidence at Houston. The model established for Houston can be ueed to interpolate subsidence rates to points where no repeat leveling data exist, and allows short term predictions of future Subsidence. ueed a geotechnical model to predict subsidence with good results, but data are available for only 20 widely spaced locations in the area. The model described herein can be used to fill in the "holes" between those locations, and together, both models should yield better results.
In
This report documents significant aspects of this mathematical
The Subsidence District has
MATHEMATICAL DEVELOPMENT
In the usual adjustment of a static level network, where the land surface is assumed to be stable, it is only necessary to solve for heights considered constant in time. All historical level measurements in the network are collected and a least squares adjustment is performed to remove any inconsistencies caused by random errors or small residual systematic errors. This is not done at Houston because Subsidence causes large inconsistencies, and such an adjustment would only result in average heights that would be difficult to associate with any particular date.
The Quadratic Height Function
Furthermore, acceleration of Houston*s subsidence with time must be allowed by the selected mathematical model for height. given below:
One acceptable height function is
HI Ho + H* (tl - to) + H" (tl - to)'. The height HI corresponds to time t,. Ho is the height at a specified reference
time to. H* is the velocity at time to, and H" is half the acceleration. Modeling of the subsidence is a surface fitting exercise in which
4

The (xJ,yi) and (x,,y,) are coordinate8 of "nodal points," in the terminology of multiquadric (MQ) analysis. The nodal pointe are located at bench mark8 which, after review of profilee, are known to indicate maximums and minimume of motion or are otherwiee critical to the description of the movement pattern. Expressions ( 2 ) and ( 3 ) are used to calculate the velocity and acceleration a t location ( x # y ) . The coefficients vl (corresponding to velocity) and a, (corresponding to accelera- tion) are unknowns to be solved for in the adjustment of a mixed-age network of repeated levelinge. The reference-time heights for all etations, Hot are aleo unknown8 . Expreeeion (2) gives the velocity at the reference time, to. The more general
expression for velocity, for any time ti is
and the expreseion for acceleration ie
acceleration = 2H". ( 5 )
Leveling meaeuree difference8 in height between two pointe, for example P, and P2. In our model, this meaeurement ie expreseed mathematically as
+ (%" - H,") (ti - to)2 . ( 6 )
In expression ( 6 ) , H,, denotes the height at P, at time to# and H,' denote8 the velocity at P, at time to# etc. quadratic height function, i.e.8 expreeeion (1).
West Houeton can be reliably modeled with the
Exteneometer record8 show that subsidence eaat of Houston has slowed to almost zero in some locatione. The Paeadena extensometer.record indicates a eharp decreaee in 1978, at about the time when significant amounts of imported eurface water from Lake Houeton allowed pressure in aquifer8 to be maintained or rise. The eharp change in eubsidence velocity in 1978 motivated the modeling technique for east Houston.
Time Districting
Eaet Houston ie defined to be the zone that encompaaeee the The part of thie boundary eeparating east and weet figure 1.
uee of a different
to the line of zero net change in the Chico and Evangeline aquifer levele. the east zone, water levels have rebounded or remained unchanged. In the weet zone, water levels continue to be lowered.
Within
5

This spatial districting of the region allows distinct coefficients to describe the subsidence east of Houston, and allows use of a different height function for the east zone. will call "time districting," which is similar to the technique used by Vanicek et al. (1979), to model vertical motions in southern California. The motion in the east zone was assumed to be rapid and linear prior to 1978, followed by slower linear motion after 1978. the vertical motion before and after 1978.
However, the east zone data also required a modeling strategy we
Separate sets of MQ coefficients were used to describe
The expression for height, when using time districting, is as follows:
"t
k=l H, - Ho + C Hk'Tk (7)
where each T, is some fraction of the time interval tktl-t,. to = t,, and ti < t,, where t, is the latest time boundary, then
For simplicity, assume
0 , if ti > tktl
T, = ti - tktlr if t, < ti < tktl
t, - tktl, if ti < t,
For east Houston, the two time districts (intervals) are defined to be 1972- 1978, and 1978-1987.3. The reference time, to, was taken to be 1987.3.
APPLICATION TO THE HOUSTON LEVEL NETWORK
Figure 1 shows the Houston level network that was leveled all or in part in 1973, 1978, 1983, and 1987. An initial height for the network is obtained from the tide gauge at Galveston. Mean sea level (MSL) is equated with zero height and MSL is related to the nearby tide gauge bench mark by leveling. velocity is obtained by fitting a straight line through the plot of mean sea level with time. (See fig. 2.) This plot shows that annual mean sea level has been rising at Galveston by an average rate of 6.3 mm/yr. The eustatic (global) rise of sea level can account for 1.0 mm/yr; therefore, the remainder is attributed to coastal subsidence of the land. Thus, an initial estimate for velocity of -5.3 f 0.3 m/yr and an acceleration of 0.0 fO.l mm/yr* were assigned to the tide gauge at Galveston.
An initial
Well outside of Houston, bench marks K 87 (RIVERSIDE) and Z 6 (SEALY) were constrained to be stable (zero velocity and acceleration). These two points, too far to the north and west of Houston to be shown in figure 1, were concluded to be outside the zone of significant subsidence. This conclusion was arrived at after reviewing profiles of relative elevation change made from comparisons of the unadjusted repeated levelings. Closer in, bench marks U 1216, and D 1282 in the northwest sector of figure 1 were also constrained to have zero velocity in 1987.
Compaction data from six extensometer locations (see large square symbols in fig. 1) were also used to control the adjustment to determine the reference-time heights and motion coefficients which constitute the subsidence model. conceptual example of an extensometer (compaction recorder) installation is
A
6

HEIGHT - GAUGE NO. 8771450
8771450 - GALVESTON PIER 21. TX
&
40
30
20
10 t
REGRESSION LINE STD. DEV. ABOUT REGRESSION ~ 4 . 8 9 5 ,- ANNUALMEAN SLOPE = A27 CWEAR. STD. DEVIATION = .026
Y-INTERCEPT -9.1 1 7 CM. STD. DNlATlON = 1 .117
Figure 2.--Sea leve l record a t Galveston, TX. Fitted straight l i n e corresponds to A f t e r rate a t which the vert ical relationship between sea and land is changing.
correction for eustat ic rise of sea leve l ( l .Om/yr), land i e shown t o b e subsiding (5 .3 mm/yr) at Galveston.

+J 0 a,
L L
c .r(
c 0 -r(
+J 0 (13 a E 0 u
.o
. 2
. 4
.6
.8 1.0
1.2
1 . 4
1.6
1.8
2.0
- RECORDING DEVICE
L
APPROXIMATELY 3000'
-CONCRETE PLUQ
STRATA WHICH ARE NOT COMPACTINQ
Figure 3.--Typical borehole extensometer.
Figure 4.--Recorde from deep exteneometere located in Houston region.
8

illustrated in figure 3. contributing installations. surrounded by a segmented pipe casing. installation is lowered with respect to the base of the inner pipe. shortening is measured by means of a wire/tape rolling over a drum. the wire is attached to the bottom of the well and the other end is heavily weighted to keep it taut. of soil above the base of the well. Addicke, Pasadena, Northeast, Southwest, and Lake Houston installations were considered deep enough to provide good estimates of subsidence, meaning that no compaction is believed to occur below the base of the well. The Clear Lake, Pasadena, and Addicks installations have been in existence for several relevelings and are known to provide accurate indications of Subsidence. The Northeast, Southwest, and Lake Houston installations were more recently constructed to the same standards, and their reliability is still being investigated.
Figure 4 shows the records of compaction from the s i x Each installation consists of a rigid central pipe,
As the ground layers compact, the surface The amount of One end of
The measured compaction is attributable to the layers The compaction records from the Clear Lake,
The compaction data from the Clear Lake, Addicke, and Pasadena recorders showed nonlinear eubeidence, and accordingly were input to the level net adjuetment as a sequence of monthly observed heights. 1987 leveling survey provided heights for the inner pipes at these gauges. compaction data then were used to compute heights of a second point (at the same location) which is moving vertically by the amount of the compaction, but has the identical 1987.3 height as the top of the non-moving inner pipe. The inner pipe should not move because it presumably extends below the lowest compacting layers. However, the ground around the site is subsiding because of compaction. observed heights correspond to the subsiding ground surface.
But first, a free adjustment of only the The
The
The compaction records at Northeast, Southwest, and Lake Houston show linear subsidence, and accordingly, were input to the Houston level net adjustment as velocities with zero accelerations. The velocities and weights were derived from a straight line fit to those compaction records. East End, NASA, Seabrook, and Texas City (not shown in fig. 1) all show nonlinear and decreasing rates of compaction, but these installations are not considered deep enough to reveal total subsidence.
Compaction recorders at Baytown,
The above-described boundary and interior controls, together with the leveling data, were used to determine the subsidence model.
RESULTS AND MODEL VALIDATION
The velocity surfaces for 1973 and 1987.3 are shown in figures 5a and 5b. Figure Sb shows more rapid subsidence west of Houston for 1987, while at the same time subsidence has slowed or terminated for areas to the east. The eastern locality that showed the greatest reduction is near La Porte. 1978, this area was subsiding at a rate of 65 mm/yr or more. By 1981, these rates had been reduced by at least 90 percent near the coast and lesser percentages near central Houston. To the west of Houston, the 1973 velocities for bench marks Y 1281, C 1149, and C 805 were respectively -52, -328 and 4 mm/yr. By 1987, these same velocities had increased to -76, -61, and -31 mm/yr. The dramatic reduction of subsidence east of Houston and the significant increase of subsidence west of Houston become graphically evident by comparing figures Sa and 5b, as well as 5c and 5d. Table 1 contains the subsidence velocities and standard deviations for specific points ehown in figure 1.
Between 1973 and
9

I- O
30° 0 '
29O30'
-9e 0' -95O30 ' - 9 9 0' I I 1
0
- 1
0
-95O30 ' -950 0'
- 30° 0'
- 2930 '
Figure 5a.--1973 Subsidence Velocitiee (mm/yr) - Houston, TX. Solution derived from 1973, 1978, 1983, and 1987 leveling data.

30° 0 '
29O30 '
-9e 0 ' -95O30 ' - 9 9 0 '
I I I . I
30° 0'
29%0'
\r F i g u r e 5b.--~987 Subaidence Velocities (m/yr) - Houston, TX. solution derived from 1973, 1978, 1983, and 1987 leveling data.

I I I
I I I
I I ' I I I
Figure 5c.--Velocity surface corresponding to subsidence in 1973.
-4 v/ :: 'I
I I m
I
I
I I
I I I I I I
I I
I m I I
'I
Figure 5d.--Velocity surface corresponding to subsidence in 1987.
1.2

Table 1.--Subsidence Velocities, Houston, TX (See fig. 1 for locations of bench marke.)
WEST ZONE
VELOCITY fm/v r l BCCELERATION f m/vr2 1
Tidal 19, Galveeton S 1214 C 805 w 1212 Y 1148 Y 1210 E 1151 SOUTHWEST ** ADDICKS ** N 1211 J 1215 W 767 B 1221 F 1221 CYPRESS Y 1281 T 1149 R 00 V 1281 Y 1216
EAST ZONE
BM NAME
L 305 P 1183 Q 1146 z 53 Q 639 RE '63 CLEAR LAKE ** 5 8 W 661 V 1215 F 55 D 1218 PASADENA ** D 54 NORTHEAST ** 0 54 LAKE HOUSTON **
- 5.5 -29.6 -31 1 -16.6 -19.2 -29.8 -32.5 -47.2 -54.6 -51.4 -31.5 -12.7 -18.8 -64.8 -16.5 -76.1 -17.9 - 4.1 -53.6 -50. S
f 0.4* 4.9 4.2 4.6 3.6 4.2 4.5 0.8 1.2 3.0 3.7 3.8 3.5 4.0 2.2 2.8 4.1 5.5 2.8 3.0
- 2.5 -43.0 -66.8
-41.5 -26.7 -34.8 - 5.8 -41.7 -19.3 -50.2 -31.5 -32.2 -42.0 -47.6 -22.2
-14.1
3.7* 5.1 5.0 4.8 4.6 4.3 4.3 5.8 5.0 5.5 5.3 2.9 5.3 4.4 4.7 5.5
0.02 -2 14 -1.88 -1.43 -0.67 3.30 0.55
-0.01 -1.65 -0.53 -1.78 -1.40 -0.06 0.30 -0.37 -1.73 -0.19 0.05 -2.31 -1.71
f 0.14* 0.83 0.71 0.75 0.60 0.69 0.75 0.16 0.18 0.52 0.63 0.89 0.62
0.41 0.45 0.67 0.00 0.47 0.64
0.66
POST-1978 VELOCITY Imm/vrl
- 3.1 f - 3.6 - 7.1 -14.1 -15.1 -13.2 -24.1 - 5.1 -26.4 - 8.0 - 9.8 - 2.5 -18.1 -21.0 -34.6 -11.3
1.3* 2.3 1.6
1.5 0.4 1.4 1.9 1.4 1.7 1.6 0.5 1.8 0.3 1.6 0.3
1.6
*Standard deviation **Extensometer
13

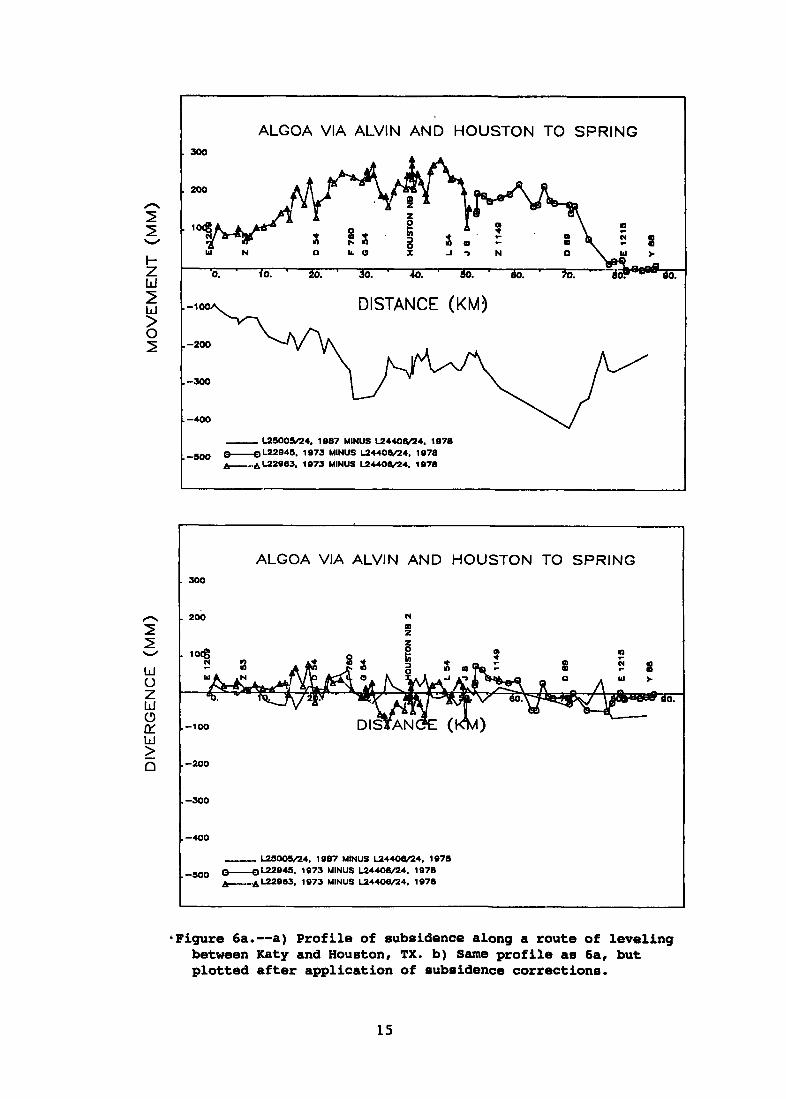
The modeled vertical motione ehould accurately reflect the obeerved subsidence along a path. Figure 6a ia a eubeidence profile which comparea 1973, 1976, and 1987 eurveye to the 1978 survey between Katy (bench mark Y 1148) and central HOUBtOn (bench mark J 8). 1973 and 1978, and additional bubeidence of 500 mm between 1978 and 1987.
There ia approximately 200 mm of eubeidence between
It ie interesting to see if the eubeidence model can be ueed to remove the motione eeen in profilee like figure 6a. After atoring the velocity and accelera- tion coefficient; in a proper data etructure, along with other pertinent parameters,-the coefficiente were accessed to evaluate subsidence for any point in the HOuBtOn region. The date, ti# and point poeition (Xly) were provided to a eubroutine which calculated the elevation change since time to. Using thie procedure for pairs of bench marks, it is poseible to formulate subsidence corrections for leveling measurements. For example, the 1973.3 meaeuremente in figure 6a can be reduced to 1978.3. profile can be made where all leveling8 are reduced to the same point in time. Figure 6b, the 1973, 1976, and 1987 leveling0 have all been reduced to to = 1978. The regional trend of motion ia removed from the profile. Notice, however, that only the regional trend of motion ie removed. It would be possible to remove all minor localized motion by adding more MQ nodal points, but thie ie not done in order to keep the model compact and meaningful. HOUBtOn, there ie motion at the 1-3 cm level caused by alternate wetting (rain) and drying of clay bedB near the eurface. The rme (root mean square) scatter of heights reduced to 1978, relative to the obeerved heights of 1978, are 2-48 1.0, and 3.8 cm for the 1973, 1976, and 1987 eurveye, reepectively.
After applying subeidence corrections, a new In
In the region eurrounding
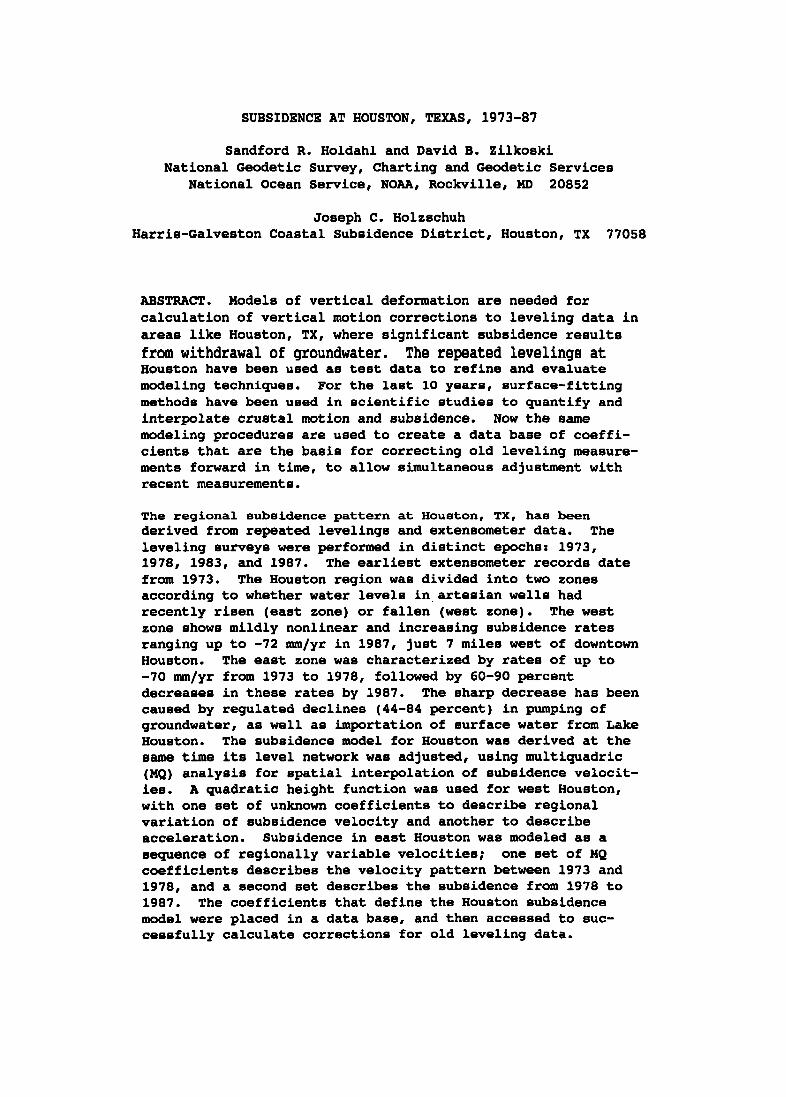
Figuree 7a and 7b are the "before corrections" and "after corrections" profilee Before eubsidence for the level line from Algoa via Alvin and Houston to Spring.
corrections, there ie approximately 600 mm of movement between 1973 and 1987. The regional trend of motion ie removed well by the addition of corrections as shown in figure 7b. eurvey, is 3-28 and 3.4 cm for the two corrected 1973 surveye, and 2.8 cm for the corrected 1987 survey.
The m e about the horizontal axis, which corresponds to the 1978
After application of subsidence corrections, which removes the 50-60 cm of eubeidence eeen in the "before-corrections" profilee (figs. 6a and 7a) it is etill likely that corrected height dif ferencee between adjacent bench marke will be in error at the 1-3 cm level in the Houston region because of the emall random local motion associated with seasonal rainfall. As seen in figures 6b and 7b, die- crepanciee may occasionally be ae large ae 10 cm. Coneequently, the modeling proceee cannot completely reetore old levelinge'to their original precision of 1 mm per kilometer. In HOUStOn, any leveling which ie eeveral yeare old and between adjacent bench marke about 1 km apart should have an assigned uncertainty of 1-3 cm, even if water is not being pumped nearby.
Figure 8 ehows how eaet Houston's 1978 time boundary permite a eequence of velocitiee that fit the data at the Pasadena extensometer. The later velocity value ahould be good for predicting height changee into the near future. previous eolution ueing a parabolic fit for the same locality did not predict well. The firat of the two velocities in figure 8 underpredicte slightly, but this Blight miefit may occur because other monitored pointa in the vicinity of the Paeadena exteneometer were experiencing somewhat less subsidence prior to 1978.
A
14
ALGOA VIA ALVIN AND HOUSTON TO SPRING 300
200
10
0 c o 4 - N
'0. - f 0. . 2 0. ' 30. - 40. . Jo. . Bo. - DISTANCE (KM)
-300
-400
- L25005/24. 1087 MINUS L2440W24. 1078
--500 L22045. 1073 MINUS L24408/24. 1078 + - .~~220e3 . 1073 MINUS ~ 2 4 4 0 ~ 2 4 . 1078
ALGOA VIA ALVIN AND HOUSTON TO SPRING I 300
200 N
z m
-200
-300
-400
- L25005/24. 1087 MINUS U440W24. 1078 ~ L 2 2 9 4 5 . 1073 MINUS L24408/24. 1078 +--.A L22063. 1073 MINUS L24408/24, 1978
--500
'Figure 6a.--a) Profile of subsidence along a route of leveling between Katy and Houston, TX. b) Same profile as 6a, but plotted after application of subsidence corrections.
15

n t t
t- Z W 2 w
I
U
6
n I I W 0 Z W c3 LT w
v
L n
ALGOA VIA ALVIN AND HOUSTON TO SPRING 300
200
-10 DISTANCE (KM)
-200
-300
-400
- L25005/24. 1987 MINUS L24408/24. 1978 L22945. 1973 MINUS L24408/24. 1878
*.~L22983. 1973 MINUS L244QW24. 1978 --500
7a.
ALGOA VIA ALVIN AND HOUSTON TO SPRING 300
200 N
z m
n
-100
-200
-300
-400
- L2500M4. 1987 MINUS L24408/24. 1978 ~ L 2 2 9 4 5 . 1973 MINUS L2440W24. 1978 e - . ~ L 2 2 9 8 3 . 1973 MINUS L2440W24. 1978
-500 7b.
Figure 7.--a) Profile of subsidence along a route of leveling from Algoa via Alvin and Houston to Spring, TX; b) Same profile as 7a, but plotted after application of Subsidence corrections.
16

40 SUBSIDENCE AT PASADENA EXTENSOMETER.
.-1- - 7 1 . d6.
--
YEAR
-40
-80
-120
-- MODELED HEIGHT - OBSERVED HEIGHT
Figure 8.--Extensometer record showing subsidence at Pasadena, TX. Slopes of straight line segments correspond to modeled rates of motion before and after 1978.
SUMMARY
The techniques for modeling nonlinear vertical motion described here adapt well to the subsidence problem in Houston. Houston's subsidence model enables the production of a variety of computer generated graphics such as the subsidence contour maps shown in figures 5a and 5b. future can be accomplished using velocities calculated for 1987.
Predictions of subsidence into the near
The compaction data from deep extensometer installations were valuable for subsidence modeling. Periodic leveling from a stable point or tide gauge confirms the consistency of these two data types. error, and the extensometer installation extends below all compacting layers, both measurement systems should give a similar estimate of subsidence. But the greater frequency of recorded height change at deep extensometers provides better information as to when major changes are occurring. The extensometer results also prevent small systematic leveling errors, accumulated over long distances, from negatively impacting the model derivation.
If leveling data are free of systematic
Regulated reductions of pumping east of Houston are responsible for the dramatic decrease in subsidence there since 1978. The Coastal Water Authority Canal System has provided alternative surface water since 1978. No alternative source of water
17

-20- Llne of equal water-level change in meter8
KILOMETERS
(AFTER OABRYSCH, 1982)
Figure Sa.--Approximate water-level declines in the Evangeline Aquifer, 1943-77.
-20-Line of equal water-level change in meter8
0 20 40 KILOMETERS
Figure 9b.--Approximate water-level changes in the
18 Evangeline Aquifer, 1977-83.

is available for the area west of Houston, which has experienced rapid residential and commercial growth. increased significantly due to expansion and growth since 1973. and 9b from Neighbors and Thompson (1984), and Gabrysch (1982), which show lines of water level change for the periods 1943-77 and 1977-83, respectively. contrasts velocities calculated for 1973 and 1987 at selected points in HOUStOn. The changes in velocity have a direct correspondence with regional changes in water level. Figure 10 shows accumulated subsidence since 1906.
All water comes from deep aquifers and pumping has See figures 9a
Table 1
TO monitor the subsidence at Houston, it has been necessary to reobserve a large In each
By performing the leveling quickly, it has been
percentage of the regional level network in periodic intensive campaigns. campaign, the measurements were made in a ehort time interval to preclude bias of the results caused by subsidence. possible to use a simple static height model to adjust each individual survey campaign. ally been compared to the preceding set to calculate subsidence. approach, subsidence can be calculated along the routes of releveling without a dynamic height model such as described in this report.
The set of adjusted heights resulting from each project has tradition- With this
Figure 10.--Land subsidence (feet) near HOUStOn, TX, 1906-87.
19

However, a good model for height change can be very useful. The Harris- Galveston area is so large that it has become increasingly difficult to organize a rapid survey campaign to relevel the entire subsiding region. Because the dynamic model accounts for height change, it is not necessary to level all parts of the network at exactly the same time. observations of any dates. This facilitates the management of monitoring activities by allowing more flexibility in planning. of low economic importance can be measured less frequently.
The model determination process permits
Slow-moving areas or zones
The model can be used to interpolate or predict height at locations which are not on a line of releveling, while recognizing that interpolation reliability decreases as distance from surrounding levelings increases. be necessary to resolve legal or engineering problems. made economically for any desired time.
Such information may The calculations can be
From the geodetic point of view, it is necessary that a first- and second-order
But in a subsiding area, most levelings may be biased level network be useful for control of large engineering projects, mapping, and related survey activities. by motion soon after the adjusted heights are determined., Consequently, a mechanism such as Houston's subsidence model must be available to correct for motion 80 old measurements can be made useful. corrected old measurements in the Houston area can be incorporated in a national or broad regional adjustment of the area without biasing newer survey results, provided the corrected measurements are given a realistic weight.
Figures 6 and 7 show that
To properly serve geodetic purposes, the subsidence velocity surface should be made to taper down to zero velocity near a well defined outer boundary of the region. Outside that boundary, terrain height can be considered unchanging. The outer boundary for Houston is adequately defined on the east by Galveston Bay, and to the north it can pass through bench mark R 88. But to the southwest, it is unclear where the line of zero velocity should be placed. Further study is required. account for motion prior to 1973.
For completeness, the model should also be extended backward in time to
Future subsidence computations at Houston will utilize the Global Positioning System (GPS) data. Simultaneous with the 1987 leveling project, many points in Houston were positioned three-dimensionally by GPS measurements. monitoring of those points is anticipated, and planned combinations of leveling and GPS measurements will allow subsidence to be monitored even more efficiently.
Further
ACKNOWLEDGMENT
John Chase and Janice Bengston of NGS assisted with organization and profiling
REFERENCES of the leveling data.
Balazs, E.I., 1980: The 1978 Houston-Galveston and Texas Gulf Coast vertical control surveys, N O M Technical Memorandum NOS NGS 27, National Geodetic Information Branch, NOAA, Rockville, MD, 64 pp.
Gabrysch, R.K., 1982: Groundwater withdrawals and land-surface subsidence in the Houston-Galveston region, Texas, 1906-80: ODen-File ReDOrt 82-571, United States Geological Survey, 68 pp.
20

Holdahl, s . R . 8 Strange, W.E., and Harris, R . J . , 1987: Empirical calibration of ZeLss Ni-1 level instruments to account for magnetic errors, ManuscriDta Geodaetica, 12:28-39.
Neighbors, R . J . and Thompson, R.E., 1984: Subsidence in the Houston-Galveston area of Texas, Proceedinus of the Third International SvmDosium on Land Sub- sidence, Venice, Italy, March 18-25, 10 pp.
Vanicek, P.8 Elliott, M.R., and Castle, R . O . , 1979: Four-dimensional modelling of recent vertical movements in the area of the Southern California uplift. In: C.A. Whitten, R. Green and B.K. Meade (Editors) Recent Crustal Movements, 1977. TectonoPhYsics, 52; 287-300.
Zilkoski, D.B.8 1984: The 1983 Houston-Galveston Subsidence Network, Proceedinus of 1984 ASP-ASCM Fall Convention, San Antonio, TX, pp.147-156.
21 a U . S . G O V E R N M E N T P R I N T I N G OFFICE~1989-242-202/00044