10-q 7 …iheartmedia.com/investors/investors/ccu-10q-1q-2004.pdf · (exact name of registrant as...
TRANSCRIPT

<SUBMISSION><TYPE> 10-Q<DOCUMENT-COUNT> 7<LIVE><FILER-CIK> 0000739708<FILER-CCC> ########<CONTACT-NAME> Edgar Filing Group<CONTACT-PHONE-NUMBER> 214-651-1001 ex 5300<SROS> NYSE<PERIOD> 03-31-2004<NOTIFY-INTERNET> [email protected]

<DOCUMENT><TYPE> 10-Q<FILENAME> d15277e10vq.htm<DESCRIPTION> Form 10-Q<TEXT>
Table of Contents
FORM 10-Q
SECURITIES AND EXCHANGE COMMISSIONWashington, D.C. 20549
QUARTERLY REPORT PURSUANT TO SECTION 13 AND 15(D)OF THE SECURITIES EXCHANGE ACT OF 1934
CLEAR CHANNEL COMMUNICATIONS, INC.(Exact name of registrant as specified in its charter)
200 East Basse RoadSan Antonio, Texas 78209
(210) 822-2828
(Address and telephone numberof principal executive offices)
Indicate by check mark whether the registrant (1) has filed all reports required to be filed by Section 13 or 15(d) of the Securities ExchangeAct of 1934 during the preceding 12 months (or for such shorter period that the registrant was required to file such reports), and (2) has beensubject to such filing requirements for the past 90 days. Yes� No�
Indicate by check mark whether the registrant is an accelerated filer (as defined in Rule 12b-2 of the Exchange Act). Yes � No�
Indicate the number of shares outstanding of each class of the issuer’s classes of common stock, as of the latest practicable date.
For the quarter ended March 31, 2004 Commission file number 1-9645
Texas(State of Incorporation)
74-1787539(I.R.S. Employer Identification No.)
Class Outstanding at May 7, 2004
Common Stock, $.10 par value 614,289,742

CLEAR CHANNEL COMMUNICATIONS, INC. AND SUBSIDIARIES
INDEX
Part I — Financial InformationItem 1. Unaudited Financial StatementsConsolidated Balance Sheets at March 31, 2004 and December 31, 2003 3Consolidated Statements of Operations for the three months ended March 31, 2004 and 2003 5Consolidated Statements of Cash Flows for the three months ended March 31, 2004 and 2003 6Notes to Consolidated Financial Statements 7Item 2. Management’s Discussion and Analysis of Financial Condition and Results of Operations 13Item 3. Quantitative and Qualitative Disclosures About Market Risk 24Item 4. Controls and Procedures 24
Part II — Other InformationItem 1. Legal Proceedings 25Item 2. Changes in Securities, and Use of Proceeds and Issuer Purchases of Equity Securities 25Item 5. Other Information 25Item 6. Exhibits and reports on Form 8-K 25
(a) Exhibits(b) Reports on Form 8-K
Signatures 26Index to Exhibits 27
Statement re: Computation of Earnings Per ShareStatement re: Computation of RatiosCertification of Principal Executive OfficerCertification of Chief Financial OfficerCertification of Principal Executive OfficerCertification of Chief Financial Officer

Table of Contents
PART I
Item 1. UNAUDITED FINANCIAL STATEMENTS
CLEAR CHANNEL COMMUNICATIONS, INC. AND SUBSIDIARIESCONSOLIDATED BALANCE SHEETS
ASSETS(In thousands)
See Notes to Consolidated Financial Statements
-3-
March 31, December 31,2004 2003
(Unaudited) (Audited)
Current AssetsCash and cash equivalents $ 194,046 $ 123,334Restricted cash 4,900 —Accounts receivable, less allowance of $56,173 at March 31, 2004 and $56,586
December 31, 2003 1,519,994 1,703,393Prepaid expenses 296,797 196,494Other current assets 181,761 162,461
Total Current Assets 2,197,498 2,185,682Property, Plant and Equipment
Land, buildings and improvements 1,653,803 1,635,611Structures 2,865,746 2,888,834Towers, transmitter and studio equipment 832,749 829,488Furniture and other equipment 710,176 694,163Construction in progress 162,276 161,973
6,224,750 6,210,069Less accumulated depreciation 2,056,482 1,949,154
4,168,268 4,260,915Intangible Assets
Definite-lived intangibles, net 688,045 717,181Indefinite-lived intangibles — licenses 11,843,671 11,797,742Indefinite-lived intangibles — permits 424,617 424,640Goodwill 7,295,866 7,306,338
Other AssetsNotes receivable 18,463 19,389Investments in, and advances to, nonconsolidated affiliates 365,046 353,132Other assets 481,543 361,306Other investments 316,464 926,368
Total Assets $27,799,481 $28,352,693
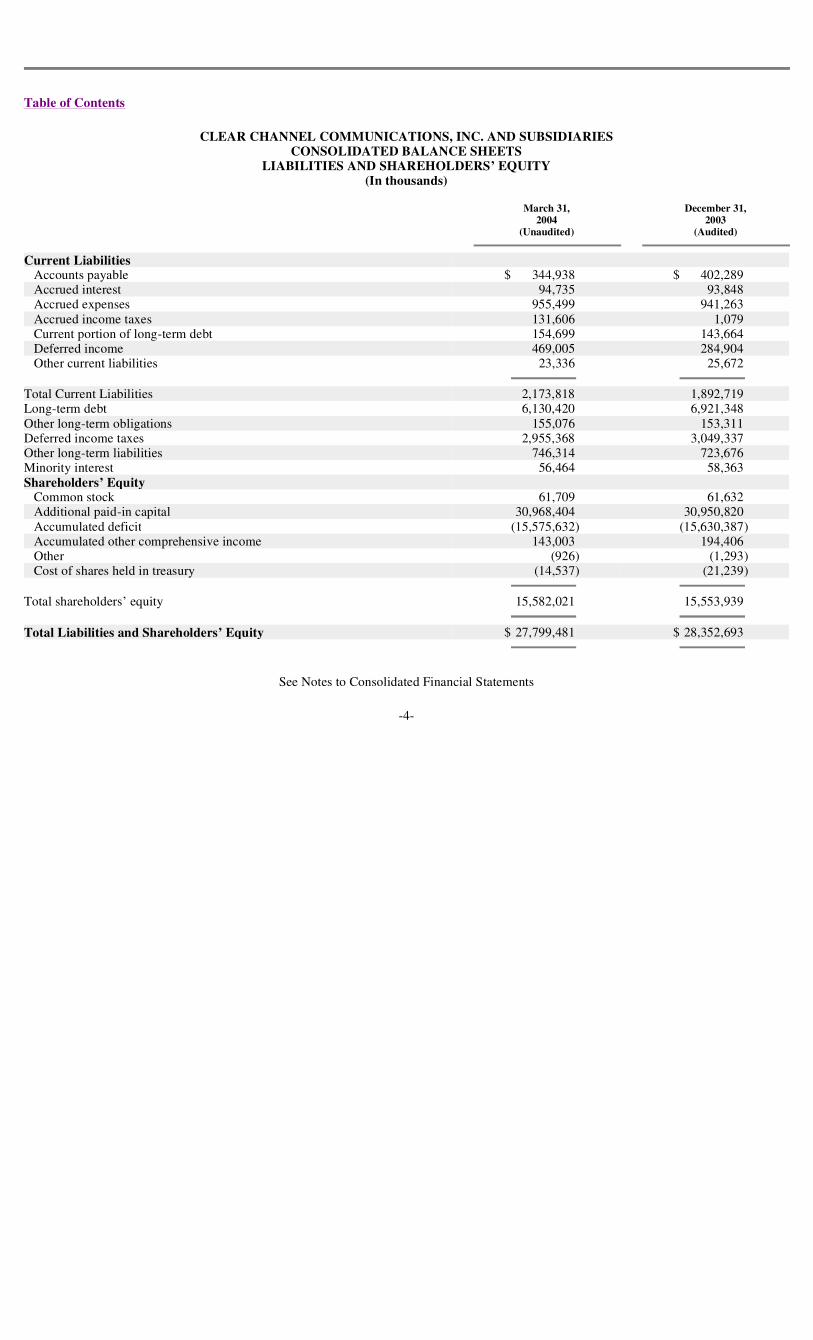
Table of Contents
CLEAR CHANNEL COMMUNICATIONS, INC. AND SUBSIDIARIESCONSOLIDATED BALANCE SHEETS
LIABILITIES AND SHAREHOLDERS’ EQUITY(In thousands)
See Notes to Consolidated Financial Statements
-4-
March 31, December 31,2004 2003
(Unaudited) (Audited)
Current LiabilitiesAccounts payable $ 344,938 $ 402,289Accrued interest 94,735 93,848Accrued expenses 955,499 941,263Accrued income taxes 131,606 1,079Current portion of long-term debt 154,699 143,664Deferred income 469,005 284,904Other current liabilities 23,336 25,672
Total Current Liabilities 2,173,818 1,892,719Long-term debt 6,130,420 6,921,348Other long-term obligations 155,076 153,311Deferred income taxes 2,955,368 3,049,337Other long-term liabilities 746,314 723,676Minority interest 56,464 58,363Shareholders’ Equity
Common stock 61,709 61,632Additional paid-in capital 30,968,404 30,950,820Accumulated deficit (15,575,632) (15,630,387)Accumulated other comprehensive income 143,003 194,406Other (926) (1,293)Cost of shares held in treasury (14,537) (21,239)
Total shareholders’ equity 15,582,021 15,553,939
Total Liabilities and Shareholders’ Equity $ 27,799,481 $ 28,352,693

Table of Contents
CLEAR CHANNEL COMMUNICATIONS, INC. AND SUBSIDIARIESCONSOLIDATED STATEMENTS OF OPERATIONS
(UNAUDITED)(In thousands, except per share data)
See Notes to Consolidated Financial Statements
-5-
Three Months Ended March 31,
2004 2003
Revenue $1,969,566 $1,779,443Operating expenses:
Divisional operating expenses (excludes non-cash compensation expenses of $261 and $516 in2004 and 2003, respectively) 1,499,718 1,361,075
Non-cash compensation expense 918 799Depreciation and amortization 173,158 159,562Corporate expenses (excludes non-cash compensation expenses of $657 and $283 in 2004 and
2003, respectively) 49,364 42,779
Operating income 246,408 215,228Interest expense 89,805 100,952Gain (loss) on marketable securities 49,723 2,792Equity in earnings of nonconsolidated affiliates 6,675 2,335Other income (expense) — net (17,270) 2
Income before income taxes 195,731 119,405Income tax (expense) benefit:
Current (145,985) 17,995Deferred 66,714 (66,354)
Net income 116,460 71,046Other comprehensive income, net of tax:
Foreign currency translation adjustments 2,914 7,207Unrealized gain (loss) on securities:
Unrealized holding gain (loss) (6,177) 25,037Unrealized holding gain (loss) on cash flow derivatives (16,565) —Reclassification adjustment for (gains) losses included in net income (31,575) (1,723)
Comprehensive income $ 65,057 $ 101,567
Net income per common share:Basic $ .19 $ .12
Diluted $ .19 $ .12
Dividends declared per share $ .10 $ —

Table of Contents
CLEAR CHANNEL COMMUNICATIONS, INC. AND SUBSIDIARIESCONSOLIDATED STATEMENTS OF CASH FLOWS
(UNAUDITED)(In thousands)
See Notes to Consolidated Financial Statements
-6-
Three Months Ended March 31,
2004 2003
Cash Flows from operating activities:Net income $ 116,460 $ 71,046
Reconciling Items:Depreciation and amortization 173,158 159,562Deferred taxes (66,714) 66,354(Gain) loss on disposal of assets (10,731) 3,381(Gain) loss on sale of other investments (46,973) (2,779)(Gain) loss on forward exchange contract (1,684) 3,988(Gain) loss on trading securities (1,066) (4,001)Increase (decrease) accrued income and other taxes 134,249 (16,369)Increase (decrease) other, net 23,302 (1,421)Changes in other operating assets and liabilities, net of effects of acquisitions 210,761 156,081
Net cash provided by (used in) operating activities 530,762 435,842Cash flows from investing activities:
(Investment) in liquidation of restricted cash (4,900) —Decrease (increase) in notes receivable — net 376 2,928Decrease (increase) in investments in and advances to nonconsolidated affiliates — net (2,794) 3,195Purchases of investments (615) (2,079)Proceeds from sale of investments 599,426 10,332Purchases of property, plant and equipment (70,784) (64,432)Proceeds from disposal of assets 2,499 3,196Proceeds from divestitures placed in restricted cash 13,138 —Acquisition of operating assets (82,146) (30,792)Acquisition of operating assets with restricted cash (12,951) —Decrease (increase) in other — net (5,527) (19,738)
Net cash (used in) provided by investing activities 435,722 (97,390)Cash flows from financing activities:
Draws on credit facilities 1,349,018 242,209Payments on credit facilities (1,635) (829,799)Proceeds from long-term debt — 999,164Payments on long-term debt (2,193,716) (581,399)Proceeds from exercise of stock options, stock purchase plan and common stock warrants 12,185 10,529Dividends paid (61,624) —
Net cash used in financing activities (895,772) (159,296)
Net increase in cash and cash equivalents 70,712 179,156Cash and cash equivalents at beginning of period 123,334 170,086
Cash and cash equivalents at end of period $ 194,046 $ 349,242
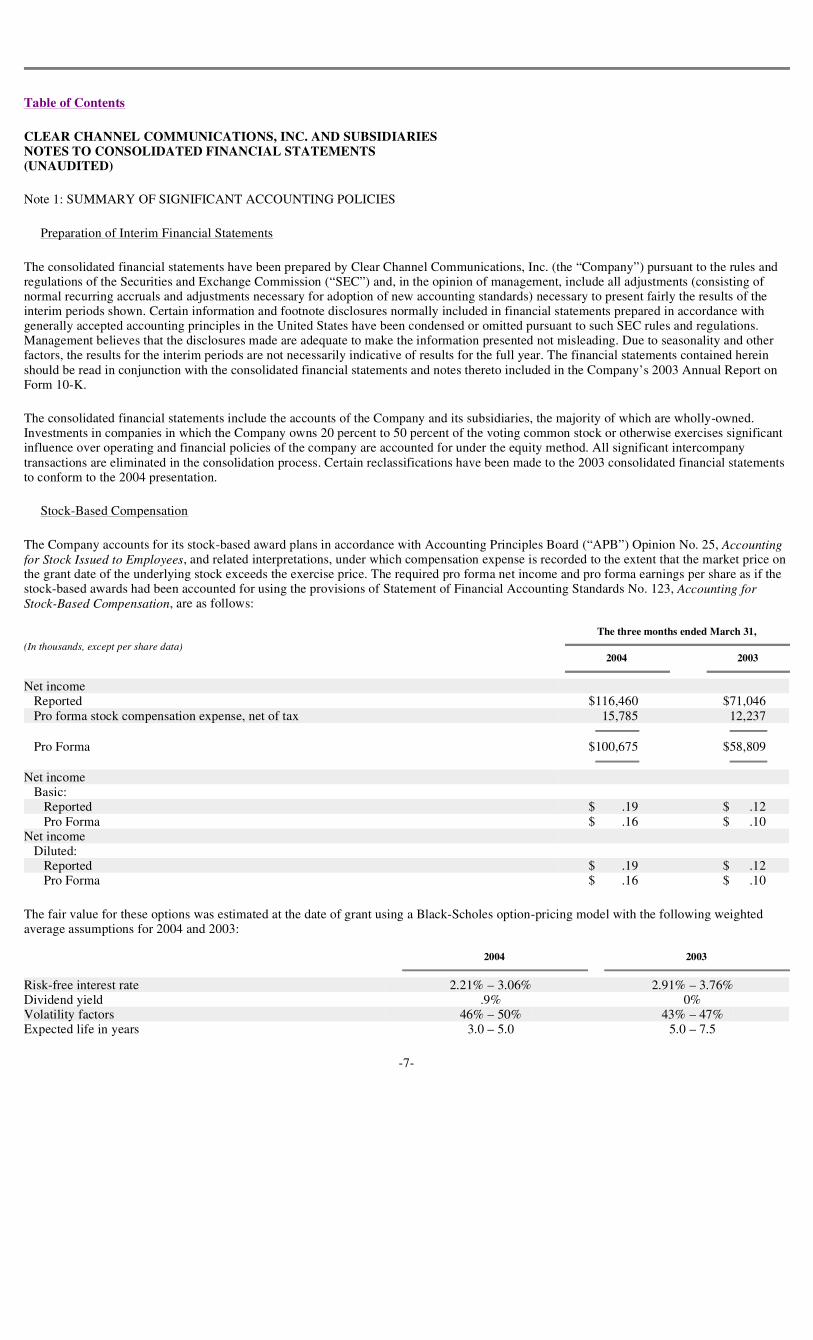
Table of Contents
CLEAR CHANNEL COMMUNICATIONS, INC. AND SUBSIDIARIESNOTES TO CONSOLIDATED FINANCIAL STATEMENTS(UNAUDITED)
Note 1: SUMMARY OF SIGNIFICANT ACCOUNTING POLICIES
Preparation of Interim Financial Statements
The consolidated financial statements have been prepared by Clear Channel Communications, Inc. (the “Company”) pursuant to the rules andregulations of the Securities and Exchange Commission (“SEC”) and, in the opinion of management, include all adjustments (consisting ofnormal recurring accruals and adjustments necessary for adoption of new accounting standards) necessary to present fairly the results of theinterim periods shown. Certain information and footnote disclosures normally included in financial statements prepared in accordance withgenerally accepted accounting principles in the United States have been condensed or omitted pursuant to such SEC rules and regulations.Management believes that the disclosures made are adequate to make the information presented not misleading. Due to seasonality and otherfactors, the results for the interim periods are not necessarily indicative of results for the full year. The financial statements contained hereinshould be read in conjunction with the consolidated financial statements and notes thereto included in the Company’s 2003 Annual Report onForm 10-K.
The consolidated financial statements include the accounts of the Company and its subsidiaries, the majority of which are wholly-owned.Investments in companies in which the Company owns 20 percent to 50 percent of the voting common stock or otherwise exercises significantinfluence over operating and financial policies of the company are accounted for under the equity method. All significant intercompanytransactions are eliminated in the consolidation process. Certain reclassifications have been made to the 2003 consolidated financial statementsto conform to the 2004 presentation.
Stock-Based Compensation
The Company accounts for its stock-based award plans in accordance with Accounting Principles Board (“APB”) Opinion No. 25, Accountingfor Stock Issued to Employees, and related interpretations, under which compensation expense is recorded to the extent that the market price onthe grant date of the underlying stock exceeds the exercise price. The required pro forma net income and pro forma earnings per share as if thestock-based awards had been accounted for using the provisions of Statement of Financial Accounting Standards No. 123, Accounting forStock-Based Compensation, are as follows:
The fair value for these options was estimated at the date of grant using a Black-Scholes option-pricing model with the following weightedaverage assumptions for 2004 and 2003:
-7-
(In thousands, except per share data)
The three months ended March 31,
2004 2003
Net incomeReported $116,460 $71,046Pro forma stock compensation expense, net of tax 15,785 12,237
Pro Forma $100,675 $58,809
Net incomeBasic:
Reported $ .19 $ .12Pro Forma $ .16 $ .10
Net incomeDiluted:
Reported $ .19 $ .12Pro Forma $ .16 $ .10
2004 2003
Risk-free interest rate 2.21% – 3.06% 2.91% – 3.76%Dividend yield .9% 0%Volatility factors 46% – 50% 43% – 47%Expected life in years 3.0 – 5.0 5.0 – 7.5

Table of Contents
Recent Accounting Pronouncements
On January 1, 2004, the Company adopted Financial Accounting Standards Board Interpretation No. 46, Consolidation of Variable InterestEntities (“FIN 46”). The Interpretation addresses consolidation of business enterprises of variable interest. The adoption of FIN 46 did not havea material impact on the Company’s financial position or results of operations.
Note 2: INTANGIBLE ASSETS AND GOODWILL
Definite-lived Intangibles
The Company has definite-lived intangible assets recorded that continue to be amortized in accordance with Statement of Financial AccountingStandards No. 142, Goodwill and Other Intangible Assets (“Statement 142”). These assets consist primarily of transit and street furniturecontracts and other contractual rights in the outdoor segment, talent and program rights contracts in the radio segment, and, in the Company’sother segment, representation contracts for non-affiliated television and radio stations, all of which are amortized over the respective lives ofthe agreements. Other definite-lived intangible assets are amortized over the period of time the assets are expected to contribute directly orindirectly to the Company’s future cash flows. The following table presents the gross carrying amount and accumulated amortization for eachmajor class of definite-lived intangible asset at March 31, 2004 and December 31, 2003:
(In thousands)
Total amortization expense from definite-lived intangible assets for the three months ended March 31, 2004 and for the year endedDecember 31, 2003 was $32.3 million and $138.2 million, respectively. The following table presents the Company’s estimate of amortizationexpense for each of the five succeeding fiscal years for definite-lived intangible assets:
As acquisitions and dispositions occur in the future and as purchase price allocations are finalized, amortization expense may vary.
Indefinite-lived Intangibles
The Company’s indefinite-lived intangible assets consist of FCC broadcast licenses and billboard permits. FCC broadcast licenses are grantedto both radio and television stations for up to eight years under the Telecommunications Act of 1996. The Act requires the FCC to renew abroadcast license if: it finds that the station has served the public interest, convenience and necessity; there have been no serious violations ofeither the Communications Act of 1934 or the FCC’s rules and regulations by the licensee; and there have been no other serious violationswhich taken together constitute a pattern of abuse. The licenses may be renewed indefinitely at little or no cost. The Company does not believethat the technology of wireless broadcasting will be replaced in the foreseeable future. The Company’s billboard permits are issued inperpetuity by state and local governments and are transferable or renewable at little or no cost. Permits typically include the location for whichthe permit allows the Company the right to operate an advertising structure. The Company’s permits are located on either owned or leasedland. In cases where the Company’s permits are located on leased land, the leases are typically from 10 to 30 years and typically have beenrenewed indefinitely, with rental payments generally escalating at an inflation based index. Should the Company lose its lease, the Companywill typically obtain permission to relocate the permit or bank it with the municipality for future use.
-8-
March 31, 2004 December 31, 2003
Gross Carrying Accumulated Gross Carrying AccumulatedAmount Amortization Amount Amortization
Transit, street furniture, and other outdoor contractualrights $ 648,170 $302,184 $ 655,775 $289,821
Talent contracts 202,161 138,263 202,161 132,421Representation contracts 247,876 68,891 238,951 62,678Other 213,343 114,167 213,506 108,292
Total $1,311,550 $623,505 $1,310,393 $593,212
(In thousands)2005 $115,2172006 95,1902007 65,8222008 53,5482009 45,186

Table of Contents
In accordance with Statement 142, the Company does not amortize its FCC broadcast licenses or billboard permits. The Company tests theseindefinite-lived intangible assets for impairment at least annually. The Company generally uses an income approach to value FCC licenses andbillboard permits, which involves estimating future cash flows expected to be generated from the licenses or billboard permits, discounted totheir present value using a risk-adjusted discount rate. Terminal values are also estimated and discounted to their present value. The Companyperformed impairment tests at October 1, 2003 and 2002, which resulted in no impairment charge.
Goodwill
Statement 142 requires the Company to test goodwill for impairment using a two-step process. The first step, used to screen for potentialimpairment, compares the fair value of the reporting unit with its carrying amount, including goodwill. The second step, used to measure theamount of the impairment loss, compares the implied fair value of the reporting unit goodwill with the carrying amount of that goodwill. TheCompany completed the two-step impairment test at October 1, 2003 and 2002, which resulted in no impairment charge. Consistent with theCompany’s approach to fair valuing FCC licenses and billboard permits, an income approach was used to determine the fair value of each ofthe Company’s reporting units. The following table presents the changes in the carrying amount of goodwill in each of the Company’sreportable segments for the three-month period ended March 31, 2004:
Note 3: DERIVATIVE INSTRUMENTS
The Company holds a net purchased option (the “collar”) under a secured forward exchange contract that limits its exposure to and benefitfrom price fluctuations in XM Satellite Radio Holding, Inc. (“XMSR”) over the term of the contract. The collar is accounted for as a hedge ofthe forecasted sale of the underlying shares. At March 31, 2004 and December 31, 2003, the fair value of the collar was a liability of$128.7 million and $101.7 million, respectively. The amount recorded in other comprehensive income, net of tax, related to the collar was$16.6 million and $63.5 million as of March 31, 2004 and December 31, 2003, respectively.
The Company also holds options under two secured forward exchange contracts that limit its exposure to and benefit from price fluctuations inAmerican Tower Corporation (“AMT”) over the terms of the contracts. These options are not designated as hedges of the underlying shares ofAMT. The AMT contracts had a value of $49.0 million and $47.3 million at March 31, 2004 and December 31, 2003, respectively. For thethree months and year ended March 31, 2004 and December 31, 2003, respectively, the Company recognized a gain of $1.7 million and a lossof $17.1 million in “Gain (loss) on marketable securities” related to the change in fair value of the options.
On February 25, 2004, the Company entered into a United States dollar — Euro cross currency swap with a Euro notional amount of€497.0 million and a corresponding U.S. dollar notional amount of $629.0 million. The swap requires the Company to make fixed cashpayments on the Euro notional amount while it receives fixed cash payments on the equivalent U.S. dollar notional amount, all on a semiannualbasis. The Company has designated the swap as a hedge of its net investment in Euro denominated assets. The Company selected the forwardmethod under the guidance of the Derivatives Implementation Group Statement 133 Implementation Issue H8, Foreign Currency Hedges:Measuring the Amount of Ineffectiveness in a Net Investment Hedge. The forward method requires all changes in the fair value of the crosscurrency swap and the semiannual cash payments to be reported as a cumulative translation adjustment in other comprehensive income in thesame manner as the underlying hedged net assets. As of March 31, 2004, an $8.3 million gain was recorded as a cumulative translationadjustment to other comprehensive income related to the cross currency swap.
Note 4: RECENT DEVELOPMENTS
Company Share Repurchase Program
On March 30, 2004, the Company’s Board of Directors authorized a share repurchase program of up to $1.0 billion effective immediately. Theshare repurchase program will be conducted over the next 12 months. As of March 31, 2004, no shares had been repurchased.
-9-
(In thousands)
Radio Outdoor Entertainment Other Total
Balance as of December 31, 2003 $6,419,191 $710,815 $147,590 $28,742 $7,306,338Acquisitions 4,215 1,928 852 — 6,995Foreign currency — (5,856) (6,242) — (12,098)Adjustments (2,537) 2,223 (5,055) — (5,369)
Balance as of March 31, 2004 $6,420,869 $709,110 $137,145 $28,742 $7,295,866

Table of Contents
Recent Legal Proceedings
At the Senate Judiciary Committee hearing on July 24, 2003, an Assistant United States Attorney General announced that the Department ofJustice (the “DOJ”), is pursuing two separate antitrust inquiries concerning the Company. One inquiry is whether the Company has violatedantitrust laws in one of its radio markets. The other is whether the Company has limited airplay of artists who do not use its concert services inviolation of antitrust laws. The Company is cooperating fully with all DOJ requests.
On September 9, 2003, the Assistant United States Attorney for the Eastern District of Missouri caused a Subpoena to Testify before GrandJury to be issued to the Company. The Subpoena requires the Company to produce certain information regarding commercial advertising runby it on behalf of offshore and/or online (Internet) gambling businesses, including sports bookmaking and casino-style gambling. TheCompany is cooperating with such requirements.
The Company is among the defendants in a lawsuit filed on June 12, 2002 in the United States District Court for the Southern District ofFlorida by Spanish Broadcasting System. The plaintiffs alleged that the Company is in violation of Section One and Section Two of theSherman Antitrust Act as well as various other claims, such as unfair trade practices and defamation, among other counts. This case wasdismissed with prejudice on January 31, 2003. The plaintiffs filed an appeal with the 11th Circuit Court of Appeals and oral argument was heldin the case in February 2004. A decision has not yet been issued.
The Company is currently involved in certain legal proceedings and, as required, has accrued its estimate of the probable costs for theresolution of these claims. These estimates have been developed in consultation with counsel and are based upon an analysis of potentialresults, assuming a combination of litigation and settlement strategies. It is possible, however, that future results of operations for anyparticular period could be materially affected by changes in the Company’s assumptions or the effectiveness of its strategies related to theseproceedings.
Note 5: RESTRUCTURING
As a result of the Company’s merger with The Ackerley Group, Inc. (“Ackerley”) in June 2002, the Company recorded a $40.0 million accrualrelated to the restructuring of Ackerley’s operations. Of the $40.0 million, $19.0 million is related to severance and $21.0 million is related tolease terminations. The Ackerley corporate office closed in July 2002. Also, in connection with the Company’s mergers in 2000 with SFXEntertainment, Inc. (“SFX”) and AMFM Inc. (“AMFM”), the Company restructured the SFX and AMFM operations. The AMFM corporateoffices in Dallas and Austin, Texas were closed on March 31, 2001 and a portion of the SFX corporate office in New York was closed onJune 30, 2001. Other operations of AMFM have either been discontinued or integrated into existing similar operations. As of March 31, 2004,the restructuring has resulted in the actual termination of approximately 800 employees. The Company has recorded a liability in purchaseaccounting for Ackerley, SFX and AMFM, primarily related to severance for terminated employees and lease terminations as follows:
The remaining severance and lease accrual is comprised of $39.1 million of severance and $17.6 million of lease termination. The severanceaccrual includes amounts that will be paid over the next several years related to deferred payments to former employees as well as othercompensation. The lease termination accrual will be paid over the next five years. During the first quarter of 2004, $.1 million was paid andcharged to the restructuring reserve related to severance. The Company made adjustments to finalize the purchase price allocation for both theAMFM and SFX mergers during 2001 and the purchase price allocation related to the Ackerley merger was finalized in 2003. All adjustmentshave been made, and any future potential excess reserves will be recorded as an adjustment to the purchase price.
In addition to the restructuring described above, the Company restructured its outdoor advertising operations in France during the secondquarter of 2003. As a result, the Company has recorded a $13.8 million accrual in divisional operating expenses. Of the $13.8 million,$12.5 million was related to severance and $1.3 million was related to lease terminations and consulting costs. As of March 31, 2004, thisaccrual balance was $2.9 million. This restructuring resulted in the termination of 134 employees.
-10-
(In thousands) Three Months Ended Year EndedMarch 31, 2004 December 31, 2003
Severance and lease termination costs:Accrual at January 1 $57,140 $ 73,573Adjustments to restructuring accrual — —Payments charged against restructuring accrual (455) (16,433)
Ending balance of severance and lease termination accrual $56,685 $ 57,140
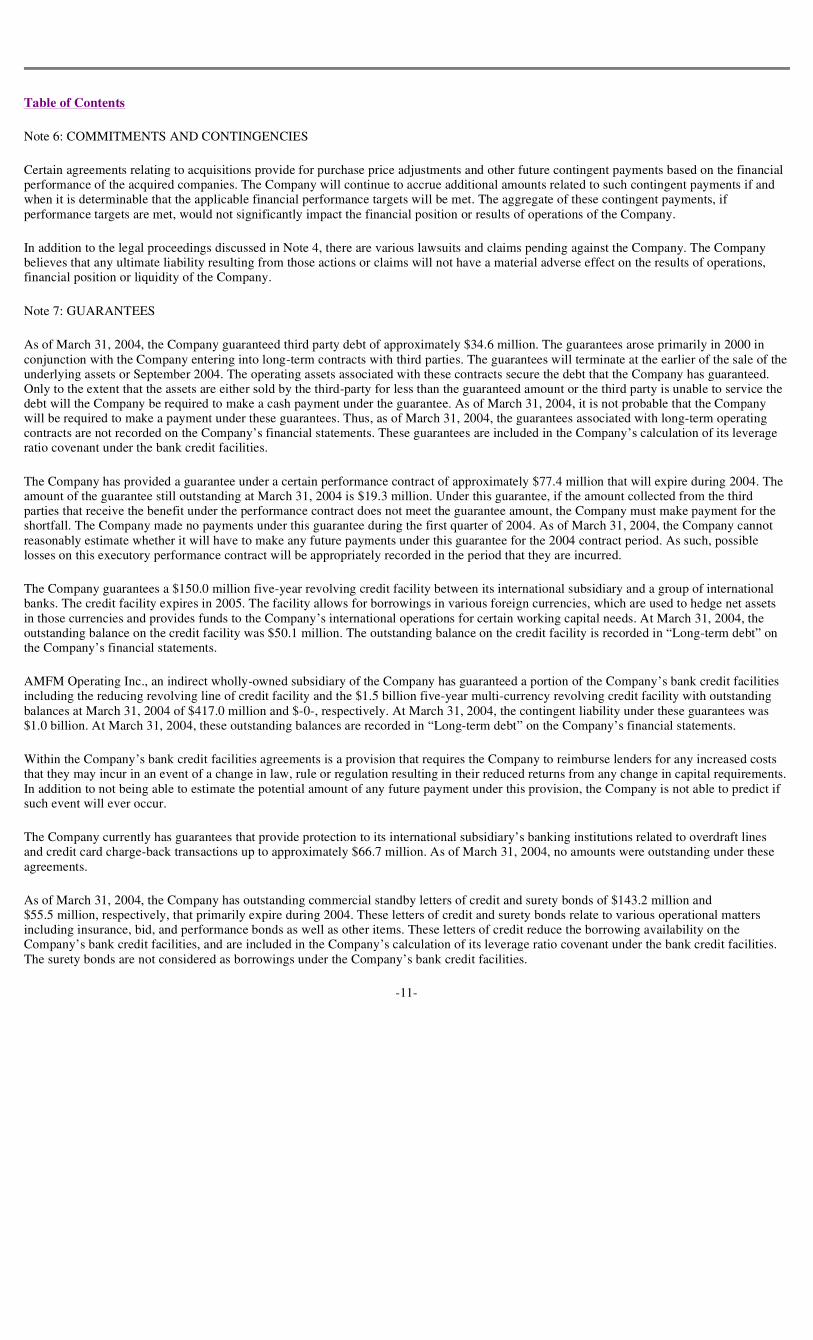
Table of Contents
Note 6: COMMITMENTS AND CONTINGENCIES
Certain agreements relating to acquisitions provide for purchase price adjustments and other future contingent payments based on the financialperformance of the acquired companies. The Company will continue to accrue additional amounts related to such contingent payments if andwhen it is determinable that the applicable financial performance targets will be met. The aggregate of these contingent payments, ifperformance targets are met, would not significantly impact the financial position or results of operations of the Company.
In addition to the legal proceedings discussed in Note 4, there are various lawsuits and claims pending against the Company. The Companybelieves that any ultimate liability resulting from those actions or claims will not have a material adverse effect on the results of operations,financial position or liquidity of the Company.
Note 7: GUARANTEES
As of March 31, 2004, the Company guaranteed third party debt of approximately $34.6 million. The guarantees arose primarily in 2000 inconjunction with the Company entering into long-term contracts with third parties. The guarantees will terminate at the earlier of the sale of theunderlying assets or September 2004. The operating assets associated with these contracts secure the debt that the Company has guaranteed.Only to the extent that the assets are either sold by the third-party for less than the guaranteed amount or the third party is unable to service thedebt will the Company be required to make a cash payment under the guarantee. As of March 31, 2004, it is not probable that the Companywill be required to make a payment under these guarantees. Thus, as of March 31, 2004, the guarantees associated with long-term operatingcontracts are not recorded on the Company’s financial statements. These guarantees are included in the Company’s calculation of its leverageratio covenant under the bank credit facilities.
The Company has provided a guarantee under a certain performance contract of approximately $77.4 million that will expire during 2004. Theamount of the guarantee still outstanding at March 31, 2004 is $19.3 million. Under this guarantee, if the amount collected from the thirdparties that receive the benefit under the performance contract does not meet the guarantee amount, the Company must make payment for theshortfall. The Company made no payments under this guarantee during the first quarter of 2004. As of March 31, 2004, the Company cannotreasonably estimate whether it will have to make any future payments under this guarantee for the 2004 contract period. As such, possiblelosses on this executory performance contract will be appropriately recorded in the period that they are incurred.
The Company guarantees a $150.0 million five-year revolving credit facility between its international subsidiary and a group of internationalbanks. The credit facility expires in 2005. The facility allows for borrowings in various foreign currencies, which are used to hedge net assetsin those currencies and provides funds to the Company’s international operations for certain working capital needs. At March 31, 2004, theoutstanding balance on the credit facility was $50.1 million. The outstanding balance on the credit facility is recorded in “Long-term debt” onthe Company’s financial statements.
AMFM Operating Inc., an indirect wholly-owned subsidiary of the Company has guaranteed a portion of the Company’s bank credit facilitiesincluding the reducing revolving line of credit facility and the $1.5 billion five-year multi-currency revolving credit facility with outstandingbalances at March 31, 2004 of $417.0 million and $-0-, respectively. At March 31, 2004, the contingent liability under these guarantees was$1.0 billion. At March 31, 2004, these outstanding balances are recorded in “Long-term debt” on the Company’s financial statements.
Within the Company’s bank credit facilities agreements is a provision that requires the Company to reimburse lenders for any increased coststhat they may incur in an event of a change in law, rule or regulation resulting in their reduced returns from any change in capital requirements.In addition to not being able to estimate the potential amount of any future payment under this provision, the Company is not able to predict ifsuch event will ever occur.
The Company currently has guarantees that provide protection to its international subsidiary’s banking institutions related to overdraft linesand credit card charge-back transactions up to approximately $66.7 million. As of March 31, 2004, no amounts were outstanding under theseagreements.
As of March 31, 2004, the Company has outstanding commercial standby letters of credit and surety bonds of $143.2 million and$55.5 million, respectively, that primarily expire during 2004. These letters of credit and surety bonds relate to various operational mattersincluding insurance, bid, and performance bonds as well as other items. These letters of credit reduce the borrowing availability on theCompany’s bank credit facilities, and are included in the Company’s calculation of its leverage ratio covenant under the bank credit facilities.The surety bonds are not considered as borrowings under the Company’s bank credit facilities.
-11-
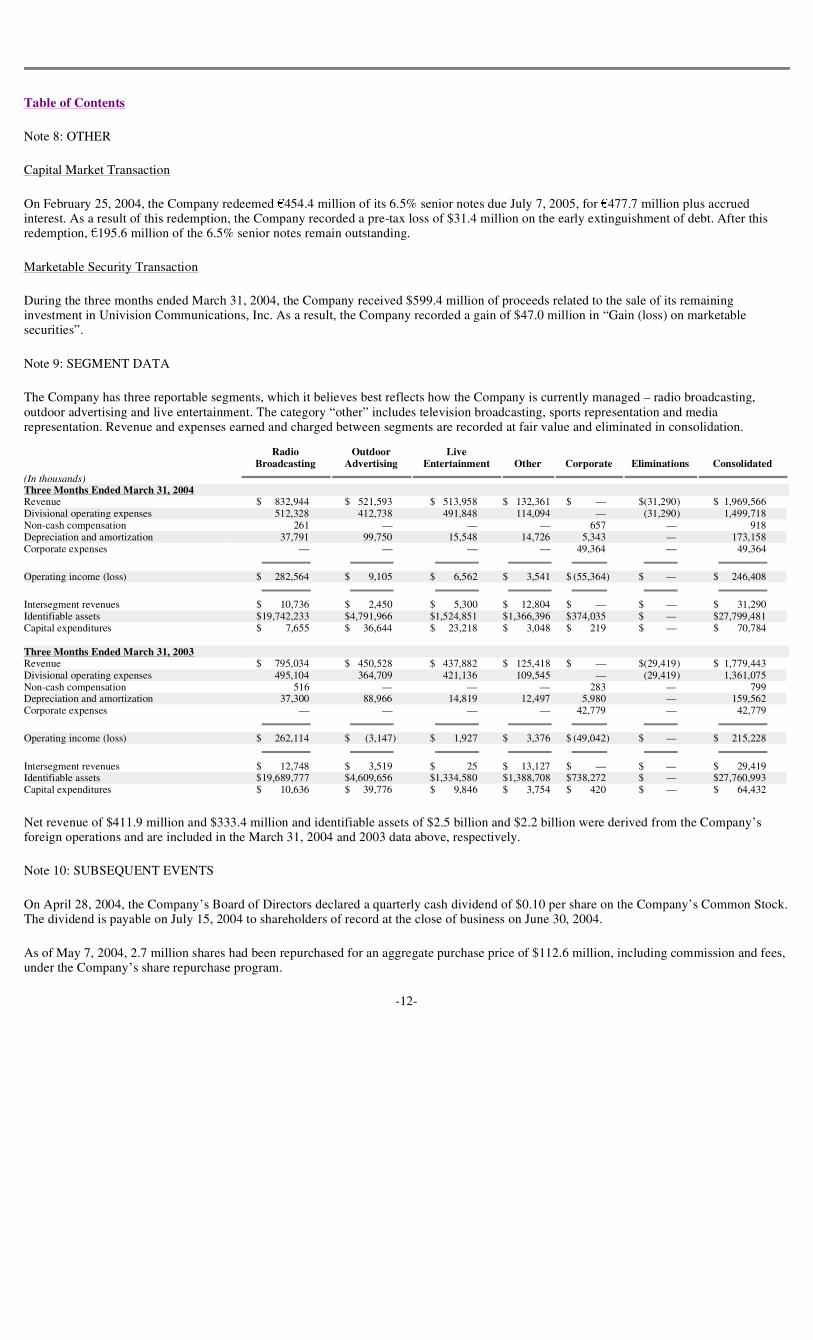
Table of Contents
Note 8: OTHER
Capital Market Transaction
On February 25, 2004, the Company redeemed €454.4 million of its 6.5% senior notes due July 7, 2005, for €477.7 million plus accruedinterest. As a result of this redemption, the Company recorded a pre-tax loss of $31.4 million on the early extinguishment of debt. After thisredemption, €195.6 million of the 6.5% senior notes remain outstanding.
Marketable Security Transaction
During the three months ended March 31, 2004, the Company received $599.4 million of proceeds related to the sale of its remaininginvestment in Univision Communications, Inc. As a result, the Company recorded a gain of $47.0 million in “Gain (loss) on marketablesecurities”.
Note 9: SEGMENT DATA
The Company has three reportable segments, which it believes best reflects how the Company is currently managed – radio broadcasting,outdoor advertising and live entertainment. The category “other” includes television broadcasting, sports representation and mediarepresentation. Revenue and expenses earned and charged between segments are recorded at fair value and eliminated in consolidation.
Net revenue of $411.9 million and $333.4 million and identifiable assets of $2.5 billion and $2.2 billion were derived from the Company’sforeign operations and are included in the March 31, 2004 and 2003 data above, respectively.
Note 10: SUBSEQUENT EVENTS
On April 28, 2004, the Company’s Board of Directors declared a quarterly cash dividend of $0.10 per share on the Company’s Common Stock.The dividend is payable on July 15, 2004 to shareholders of record at the close of business on June 30, 2004.
As of May 7, 2004, 2.7 million shares had been repurchased for an aggregate purchase price of $112.6 million, including commission and fees,under the Company’s share repurchase program.
-12-
Radio Outdoor Live
(In thousands)
Broadcasting Advertising Entertainment Other Corporate Eliminations Consolidated
Three Months Ended March 31, 2004Revenue $ 832,944 $ 521,593 $ 513,958 $ 132,361 $ — $(31,290) $ 1,969,566Divisional operating expenses 512,328 412,738 491,848 114,094 — (31,290) 1,499,718Non-cash compensation 261 — — — 657 — 918Depreciation and amortization 37,791 99,750 15,548 14,726 5,343 — 173,158Corporate expenses — — — — 49,364 — 49,364
Operating income (loss) $ 282,564 $ 9,105 $ 6,562 $ 3,541 $ (55,364) $ — $ 246,408
Intersegment revenues $ 10,736 $ 2,450 $ 5,300 $ 12,804 $ — $ — $ 31,290Identifiable assets $19,742,233 $4,791,966 $1,524,851 $1,366,396 $374,035 $ — $27,799,481Capital expenditures $ 7,655 $ 36,644 $ 23,218 $ 3,048 $ 219 $ — $ 70,784
Three Months Ended March 31, 2003Revenue $ 795,034 $ 450,528 $ 437,882 $ 125,418 $ — $(29,419) $ 1,779,443Divisional operating expenses 495,104 364,709 421,136 109,545 — (29,419) 1,361,075Non-cash compensation 516 — — — 283 — 799Depreciation and amortization 37,300 88,966 14,819 12,497 5,980 — 159,562Corporate expenses — — — — 42,779 — 42,779
Operating income (loss) $ 262,114 $ (3,147) $ 1,927 $ 3,376 $ (49,042) $ — $ 215,228
Intersegment revenues $ 12,748 $ 3,519 $ 25 $ 13,127 $ — $ — $ 29,419Identifiable assets $19,689,777 $4,609,656 $1,334,580 $1,388,708 $738,272 $ — $27,760,993Capital expenditures $ 10,636 $ 39,776 $ 9,846 $ 3,754 $ 420 $ — $ 64,432
Table of Contents
Item 2. MANAGEMENT’S DISCUSSION AND ANALYSIS OF FINANCIAL CONDITION AND RESULTS OF OPERATIONS
Overview
Management’s discussion and analysis of our results of operations and financial condition should be read in conjunction with theconsolidated financial statements and related footnotes. Our discussion is presented on both a consolidated and segment basis. Corporateexpenses, Interest expense, Gain (loss) on sale of marketable securities, Equity in earnings of nonconsolidated affiliates, Other income(expense) – net, and Income tax benefit (expense) are managed on a total company basis and are, therefore, reflected only in our discussion ofconsolidated results.
We manage our operating segments primarily on their operating income. Therefore, our discussion of the results of operations of ouroperating segments focuses on their operating income. Our reportable operating segments are Radio Broadcasting, which includes our nationalsyndication business, Outdoor Advertising and Live Entertainment. Included in the “other” segment are television broadcasting, sportsrepresentation and our media representation business, Katz Media.
Radio Broadcasting
Our local radio markets are run predominantly by the local management team who control the formats they select for their programming.The formats are designed to reach audiences with targeted demographic characteristics that appeal to our advertisers. Our advertising rates areprincipally based on how many people in a targeted audience are listening to our stations, as measured by an independent ratings service. Thesize of the market influences rates as well, with larger markets typically receiving higher rates than smaller markets. Also, our advertising ratesare influenced by the time of day the advertisement airs, with morning and evening drive-time hours typically the highest. We sell a certainnumber of radio advertising spots per hour to our advertisers. Radio advertising contracts are typically less than one year.
Due to the geographic diversity and autonomy of our markets, we have a multitude of different advertising rates and audience demographicsthat are market specific. Therefore, our discussion of the results of operations of our radio broadcasting segment focuses on the macro levelindicators that management monitors to assess our radio segment’s financial condition and results of operations.
Management looks at our radio operations’ overall revenues as one of its main performance metrics. Management also looks at localadvertising, which is sold predominately in a station’s local market, and national advertising, which is sold across multiple markets. Localadvertising is sold by our local radio stations’ sales staff while national advertising is sold, for the most part, through our nationalrepresentation firm.
Local and national advertising revenues are tracked separately because these revenue streams have different sales forces, respond differentlyto changes in the economic environment and because local advertising is the primary driver of our radio revenues. During the first quarter of2004, growth in our local advertising revenue outpaced the growth in our national advertising revenue.
Management also looks at radio revenue by market size, as defined by Arbitron. Typically, larger markets can reach bigger audiences withwider demographics than smaller markets. Over half of our radio revenue and divisional operating expenses comes from our 50 largestmarkets. During the first quarter of 2004, our top 50 markets grew in-line with the overall revenue growth in our radio segment.
Additionally, management reviews our share of listeners in target demographics listening to the radio in an average quarter hour. Thismetric gauges how well our formats are doing attracting and keeping listeners. Our overall share of listeners 12 years and older and age 25 to54 was up slightly in the first quarter of 2004 over the first quarter of 2003.
A significant portion of our radio segment’s expenses vary in connection with changes in revenue. These variable expenses primarily relateto costs in our sales department, such as salaries, commissions, and bad debt. Our costs that do not vary as much in relation to revenue aremostly in our programming and general and administrative departments, such as talent costs, rights fees, utilities and office salaries. Lastly, ourcosts that are highly discretionary are costs in our marketing and promotions department, which we primarily incur to maintain and/or increaseour audience and market share.
-13-

Table of Contents
Outdoor Advertising
Our outdoor advertising revenues are generated from selling advertisements on our display faces, which consist of bulletins, posters andtransit displays as well as street furniture panels. Our advertising rates are based on a particular display’s impressions in relation to thedemographics of a particular market and its location within a market. Our outdoor advertising contracts are typically based on the number ofmonths or weeks the advertisement is displayed on our inventory.
To monitor the health of our outdoor business, management reviews average rates, average occupancy and inventory levels of each of ourdisplay faces by market. In addition, because a significant portion of our outdoor advertising is conducted in foreign markets, principallyEurope, management looks at revenues from our foreign operations on a constant dollar basis. A constant dollar basis allows for comparison ofoperations independent of foreign exchange movements. Our outdoor advertising revenue and divisional operating expenses increased in thefirst quarter of 2004 as compared to the first quarter of 2003 by approximately $37.7 million and $34.1 million, respectively, as a result offluctuations in foreign currency exchange rates.
Our significant outdoor expenses include production expenses, revenue sharing or minimum guarantees on our transit and street furniturecontracts and site lease expenses, primarily for land under our advertising displays. Our site lease terms vary from monthly to yearly, can be forterms of 20 years or longer and typically provide for renewal options. Our street furniture contracts are usually won in a competitive bid andgenerally have terms of between 10 and 20 years.
Live Entertainment
We derive live entertainment revenues primarily from promoting or producing music and theater events. Revenues from these events aremainly from ticket sales, rental income, corporate sponsorships, concessions and merchandise. We typically receive, for each event we host, allthe ticket sales, or just a fixed fee. We also receive fees representing a percentage of total concession sales from vendors and total merchandisesales from the performer or tour producer.
We generally receive higher music profits when an event is at a venue we own rather than a venue we rent. The higher music profits are dueto our ability to share in a percentage of the revenues received from concession and merchandise sales as well as the opportunity to sellsponsorships for venue naming rights and signage.
To judge the health of our music business, management monitors the number of shows, average paid attendance, talent cost as a percent ofrevenue, sponsorship dollars and ticket revenues. In addition, because a significant portion of our live entertainment business is conducted inforeign markets, management looks at revenues from our foreign operations on a constant dollar basis. A constant dollar basis allows forcomparison of operations independent of foreign exchange movements. Our live entertainment revenue and divisional operating expensesincreased in the first quarter of 2004 as compared to the first quarter of 2003 by approximately $16.4 million and $15.5 million, respectively, asa result of fluctuations in foreign currency exchange rates.
The primary expense driver for live entertainment is talent cost. Talent cost is the amount we pay to a musical artist or theatrical productionto perform at an event. This is a negotiated amount primarily driven by what the artist or production requires to cover their direct costs andvalue of their time. These fees are typically agreed to at a set minimum amount with the potential for additional profit sharing if the eventexceeds set revenue targets.
-14-

Table of Contents
The comparison of Three Months Ended March 31, 2004 to Three Months Ended March 31, 2003 is as follows:
Consolidated
Consolidated Revenue
Revenue increased $190.1 million for the three months ended March 31, 2004 from the same period of 2003. Excluding the effect ofmovement in foreign currency exchange rates, our entertainment segment contributed $59.7 million, the radio segment contributed$37.9 million and the outdoor segment contributed $33.4 million towards this growth. The revenue increase is primarily attributable toincreased ticket revenue in our live entertainment segment, growth in local advertising demand in our radio segment and growth in domesticbillboard and international street furniture revenues in our outdoor advertising segment. Also contributing to the increase was $54.1 millionresulting from foreign currency exchange rate movement.
Consolidated Divisional Operating Expenses
Divisional operating expenses increased $138.6 million for the three months ended March 31, 2004 as compared to the same period of 2003.Excluding the effect of movement in foreign currency exchange rates, our entertainment segment contributed $55.2 million, the radio segmentcontributed $17.2 million and the outdoor segment contributed $13.9 million towards this growth. This increase is primarily attributable toadditional variable costs related to the mix of events in our live entertainment business, increased production costs and bonus expenses in ourradio segment and site lease expenses and acquisition activity in our outdoor advertising segment. Also contributing to the increase was$49.6 million resulting from foreign currency exchange rate movement.
Depreciation and Amortization
Depreciation and amortization expense increased $13.6 million for the three months ended March 31, 2004 as compared to the same periodof 2003. The increase is primarily related to $4.5 million from foreign exchange as well as $4.4 million from increased accelerated depreciationon display takedowns and abandonments in our outdoor advertising segment. We also saw increased amortization as a result of the purchase ofcertain national representation contracts during the latter part of 2003.
Corporate Expenses
Corporate expenses increased $6.6 million for the three months ended March 31, 2004 as compared to the same period of 2003. Theincrease is primarily the result of a higher bonus accrual in the current period related to our improved operating performance.
Interest Expense
Interest expense was $89.8 million and $101.0 million for the three months ended March 31, 2004 and 2003, respectively, a decrease of$11.2 million. This decrease for the three months ended March 31, 2004 was due to the decrease in our total debt outstanding. At March 31,2004 and 2003, outstanding debt was $6.3 billion and $8.6 billion, respectively.
-15-
(In thousands)
Three Months Ended March 31,
2004 2003 % Change
Revenue $1,969,566 $1,779,443 11%Operating expenses:
Divisional operating expenses (excludes non-cash compensation expenses of $261and $516 in 2004 and 2003, respectively) 1,499,718 1,361,075 10%
Non-cash compensation expense 918 799 15%Depreciation and amortization 173,158 159,562 9%Corporate expenses (excludes non-cash compensation expenses of $657 and $283 in
2004 and 2003, respectively) 49,364 42,779 15%
Operating income 246,408 215,228 14%Interest expense 89,805 100,952Gain (loss) on marketable securities 49,723 2,792Equity in earnings of nonconsolidated affiliates 6,675 2,335Other income (expense) – net (17,270) 2
Income before income taxes 195,731 119,405Income tax benefit (expense):
Current (145,985) 17,995Deferred 66,714 (66,354)
Net income $ 116,460 $ 71,046

Table of Contents
Gain (loss) on Marketable Securities
During the three months ended March 31, 2004, a $49.7 million gain on marketable securities was recorded primarily from a $47.0 milliongain on the sale of our remaining investment in Univision Communications. The remaining $2.7 million gain relates to the change in the fairvalue of a secured forward exchange contract and its underlying investment.
Equity in Earnings of Nonconsolidated Affiliates
Equity in earnings of nonconsolidated affiliates was $6.7 million and $2.3 million for the three months ended March 31, 2004 and 2003,respectively. This $4.4 million increase is primarily the result of an investment in our live entertainment segment that benefited from additionalweeks of performances in 2004.
Other Income (Expense) — Net
For the three months ended March 31, 2004, other income (expense) – net was expense of $17.3 million. The expense recognized for thethree months ended March 31, 2004 related to a $31.4 million loss on the early extinguishment of debt, partially offset by an $11.6 million gainon the disposal of radio operating assets and a $2.5 million net gain on various other items.
Income Tax Benefit (Expense)
During the three months ended March 31, 2004, current tax expense includes $195.0 million related to our sale of our remaining investmentin Univision. Although the book gain recorded during the current quarter related to this sale was only $47.0 million, for tax purposes a muchlarger gain was realized as our basis in our Univision investment was the carryover basis from our shares of Hispanic BroadcastingCorporation. Upon receiving Univision shares as a result of the Univision acquisition of Hispanic, we converted our investment from an equitymethod investment to a cost method investment and thus began to carry our investment on our balance sheet at fair value. Also, included incurrent tax expense for the three months ended March 31, 2004 is a tax benefit of approximately $67.5 million related to the tax loss on ourearly extinguishment of debt.
Deferred taxes for the three months ended March 31, 2004 includes a $195.0 million deferred tax benefit related to our Univisioninvestment. Upon the conversion of our investment to a cost method investment, a large non-taxable gain was recorded during the three monthsended September 30, 2003, which resulted in a large deferred tax asset. As a result of the sale of this investment, this deferred tax assetreversed resulting in the recognition of a deferred tax benefit. In addition to the deferred tax asset recognized at the time of the conversion, anadditional deferred tax asset was recorded related to the net unrealized gain recorded subsequent to the conversion of our investment on theultimate sale of our investment. Finally, deferred taxes for the quarter ended March 31, 2004 includes a $54.3 million expense related to ourearly extinguishment of debt.
Segment Revenue and Divisional Operating Expenses
Radio Broadcasting
Our radio broadcasting revenue increased $37.9 million to $832.9 million during the first quarter of 2004 compared to the first quarter of2003. Revenue growth was lead mainly by resurgent local advertising, with growth in traffic revenue and growth in network revenue primarilyfrom our syndicated radio programs contributing to a lesser extent. Revenue grew sequentially throughout the first quarter of 2004, with Marchbeing the strongest month. During the first quarter of 2004, the majority of our markets grew in-line with the overall revenue growth in ourradio segment. Strong local and national advertising categories during the first quarter included services, automotive, entertainment andconsumer products.
Divisional operating expenses increased $17.2 million to $512.3 million during the first quarter of 2004 as compared to the first quarter of2003. The increase is primarily from a 6% increase in programming and promotion costs, increased sales related expenses driven bycommission and accrued bonus expenses and an increase in general and administrative expenses associated with an increase in the cost ofemployee healthcare benefits.
-16-
(In thousands)
Three Months Ended March 31,
% Change2004 2003 2004 v. 2003
Revenue $832,944 $795,034 5%Divisional operating expenses 512,328 495,104 3%Non-cash compensation 261 516 (49%)Depreciation and amortization 37,791 37,300 1%
Operating income $282,564 $262,114
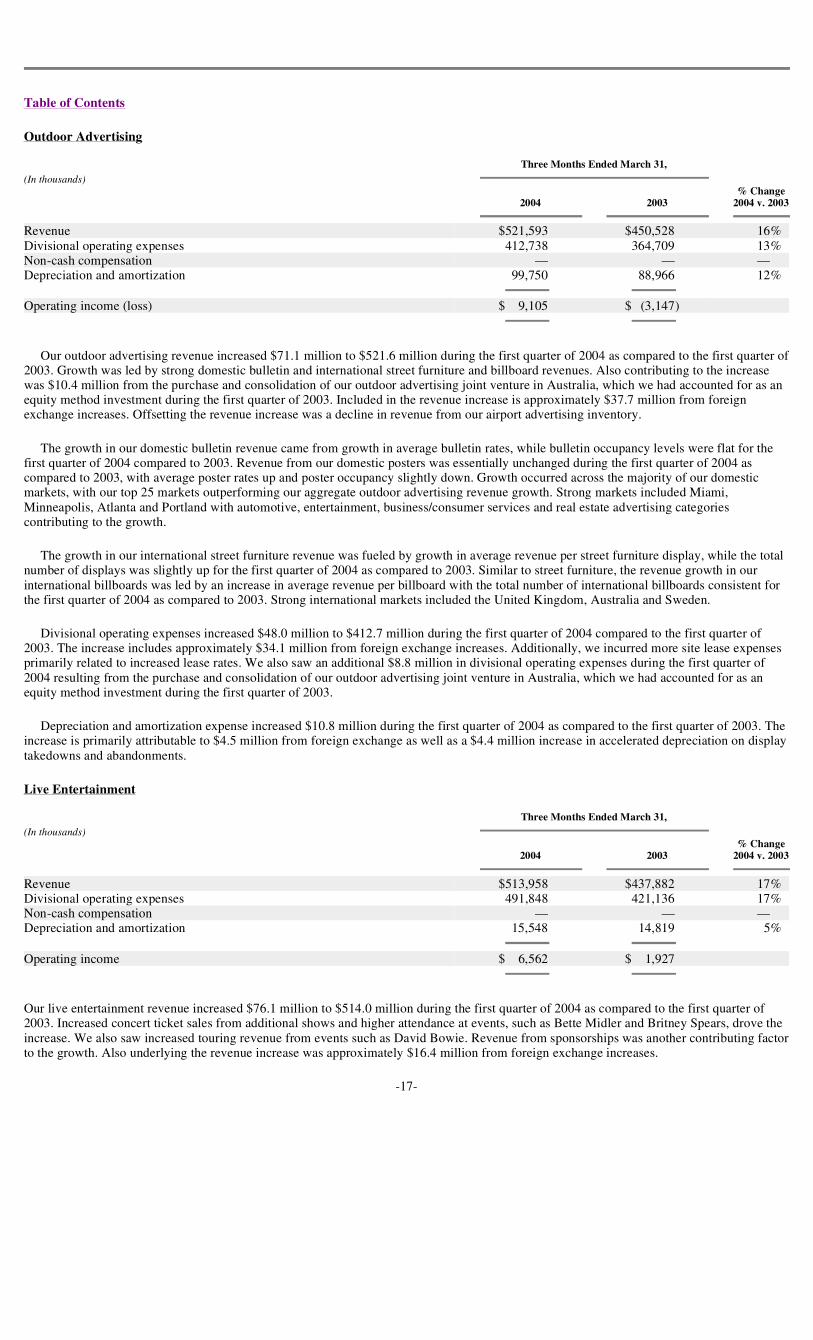
Table of Contents
Outdoor Advertising
Our outdoor advertising revenue increased $71.1 million to $521.6 million during the first quarter of 2004 as compared to the first quarter of2003. Growth was led by strong domestic bulletin and international street furniture and billboard revenues. Also contributing to the increasewas $10.4 million from the purchase and consolidation of our outdoor advertising joint venture in Australia, which we had accounted for as anequity method investment during the first quarter of 2003. Included in the revenue increase is approximately $37.7 million from foreignexchange increases. Offsetting the revenue increase was a decline in revenue from our airport advertising inventory.
The growth in our domestic bulletin revenue came from growth in average bulletin rates, while bulletin occupancy levels were flat for thefirst quarter of 2004 compared to 2003. Revenue from our domestic posters was essentially unchanged during the first quarter of 2004 ascompared to 2003, with average poster rates up and poster occupancy slightly down. Growth occurred across the majority of our domesticmarkets, with our top 25 markets outperforming our aggregate outdoor advertising revenue growth. Strong markets included Miami,Minneapolis, Atlanta and Portland with automotive, entertainment, business/consumer services and real estate advertising categoriescontributing to the growth.
The growth in our international street furniture revenue was fueled by growth in average revenue per street furniture display, while the totalnumber of displays was slightly up for the first quarter of 2004 as compared to 2003. Similar to street furniture, the revenue growth in ourinternational billboards was led by an increase in average revenue per billboard with the total number of international billboards consistent forthe first quarter of 2004 as compared to 2003. Strong international markets included the United Kingdom, Australia and Sweden.
Divisional operating expenses increased $48.0 million to $412.7 million during the first quarter of 2004 compared to the first quarter of2003. The increase includes approximately $34.1 million from foreign exchange increases. Additionally, we incurred more site lease expensesprimarily related to increased lease rates. We also saw an additional $8.8 million in divisional operating expenses during the first quarter of2004 resulting from the purchase and consolidation of our outdoor advertising joint venture in Australia, which we had accounted for as anequity method investment during the first quarter of 2003.
Depreciation and amortization expense increased $10.8 million during the first quarter of 2004 as compared to the first quarter of 2003. Theincrease is primarily attributable to $4.5 million from foreign exchange as well as a $4.4 million increase in accelerated depreciation on displaytakedowns and abandonments.
Live Entertainment
Our live entertainment revenue increased $76.1 million to $514.0 million during the first quarter of 2004 as compared to the first quarter of2003. Increased concert ticket sales from additional shows and higher attendance at events, such as Bette Midler and Britney Spears, drove theincrease. We also saw increased touring revenue from events such as David Bowie. Revenue from sponsorships was another contributing factorto the growth. Also underlying the revenue increase was approximately $16.4 million from foreign exchange increases.
-17-
(In thousands)
Three Months Ended March 31,
% Change2004 2003 2004 v. 2003
Revenue $521,593 $450,528 16%Divisional operating expenses 412,738 364,709 13%Non-cash compensation — — —Depreciation and amortization 99,750 88,966 12%
Operating income (loss) $ 9,105 $ (3,147)
(In thousands)
Three Months Ended March 31,
% Change2004 2003 2004 v. 2003
Revenue $513,958 $437,882 17%Divisional operating expenses 491,848 421,136 17%Non-cash compensation — — —Depreciation and amortization 15,548 14,819 5%
Operating income $ 6,562 $ 1,927

Table of Contents
Divisional operating expenses increased $70.7 million to $491.8 million during the first quarter of 2004 as compared to the first quarter of2003. The increase includes approximately $15.5 million from foreign exchange increases. The remaining increase primarily relates to variablecosts associated with the volume and mix of events in 2004 as compared to 2003.
Reconciliation of Segment Operating Income to Consolidated Operating Income
LIQUIDITY AND CAPITAL RESOURCES
Cash Flow
Operating Activities:
Net cash flow from operating activities of $530.8 million for the three months ended March 31, 2004 principally reflects a net income of$116.5 million plus depreciation and amortization of $173.2 million. Cash flow from operations also reflects a positive change in workingcapital of approximately $210.8 million primarily due to an increase in deferred income and a decrease in accounts receivable. Net cash flowfrom operating activities of $435.8 million for the three months ended March 31, 2003 principally reflects a net income of $71.0 million plusdepreciation and amortization of $159.6 million. Cash flow from operations also reflects a positive change in working capital of approximately$156.1 million primarily due to an increase in deferred income and a decrease in accounts receivable.
Investing Activities:
Net cash provided by investing activities of $435.7 million for the three months ended March 31, 2004 principally reflects proceeds fromthe sale of our remaining investment in Univision of $599.4 million, partially offset by capital expenditures of $70.8 million related topurchases of property, plant and equipment and $95.1 million primarily related to acquisitions of radio and outdoor assets. Net cashexpenditures used in investing activities of $97.4 million for the three months ended March 31, 2003 principally reflect capital expenditures of$64.4 million related to purchases of property, plant and equipment and $30.8 million primarily related to acquisitions of radio and outdoorassets.
Financing Activities:
Net cash used in financing activities for the three months ended March 31, 2004 principally reflect the net reduction in debt of$846.3 million and $61.6 million in dividend payments, partially offset by proceeds of $12.2 million related to the exercise of stock options.Financing activities for the three months ended March 31, 2003 principally reflect the net reduction in debt of $169.8 million and proceeds of$10.5 million related to the exercise of stock options.
We expect to fund anticipated cash requirements (including payments of principal and interest on outstanding indebtedness andcommitments, acquisitions, anticipated capital expenditures, dividends and share repurchases) for the foreseeable future with cash flows fromoperations and various externally generated funds.
-18-
(In thousands)
Three Months Ended March 31,
2004 2003
Radio Broadcasting $282,564 $262,114Outdoor Advertising 9,105 (3,147)Live Entertainment 6,562 1,927Other 3,541 3,376Corporate (55,364) (49,042)
Consolidated Operating Income $246,408 $215,228

Table of Contents
SOURCES OF CAPITAL
As of March 31, 2004 and December 31, 2003 we had the following debt outstanding:
(In millions)
Domestic Credit Facilities
We currently have two separate domestic credit facilities. These provide cash for working capital needs, funding dividends and sharerepurchases, certain acquisitions and refinancing of public debt securities.
The first credit facility is a reducing revolving credit facility, originally in the amount of $2.0 billion. At March 31, 2004, $417.0 millionwas outstanding and $423.6 million was available for future borrowings. The amount available for future borrowings under this credit facilitybegan reducing on September 30, 2000, with quarterly reductions to continue through the last business day of June 2005. The reductions inamounts available for future borrowings total $109.4 million per quarter in 2004, $131.3 million in the first quarter of 2005 and $381.3 millionin the second quarter of 2005.
The second facility is a $1.5 billion five-year multi-currency revolving credit facility. At March 31, 2004, there was no outstanding balanceand, taking into account letters of credit of $142.3 million, $1.4 billion was available for future borrowings, with the entire balance to be repaidon August 30, 2005.
During the three months ended March 31, 2004, we made principal payments totaling $1.6 billion and drew down $1.3 billion on thesecredit facilities. As of May 7, 2004, the credit facilities’ aggregate outstanding balance was $398.0 million and, taking into account outstandingletters of credit, $1.8 billion was available for future borrowings.
International Credit Facility
We have a $150.0 million five-year revolving credit facility with a group of international banks. This facility allows for borrowings invarious foreign currencies, which are used to hedge net assets in those currencies and provides funds to our international operations for certainworking capital needs. At March 31, 2004, $50.1 million was outstanding. This credit facility expires on December 8, 2005.
Sale of Investments
During the three months ended March 31, 2004, we received $599.4 million of proceeds related to the sale of our remaining investment inUnivision. As a result, we recorded a gain of $47.0 million in “Gain (loss) on marketable securities”.
Shelf Registration
On April 22, 2004, we filed a Registration Statement on Form S-3/A covering a combined $3.0 billion of debt securities, juniorsubordinated debt securities, preferred stock, common stock, warrants, stock purchase contracts and stock purchase units (the “shelfregistration statement”). The shelf registration statement also covers preferred securities that may be issued from time to time by
-19-
March 31, December 31,2004 2003
Credit facilities – domestic $ 417.0 $ 660.5Credit facility – international 50.1 50.1Long-term bonds (a) 5,621.3 6,159.4Other borrowings 196.7 195.0
Total Debt (b) 6,285.1 7,065.0Less: Cash and cash equivalents 194.0 123.3
$6,091.1 $6,941.7
(a) Includes $16.0 million and $16.8 million in unamortized fair value purchase accounting adjustment premiums related to the merger withAMFM Inc. at March 31, 2004 and December 31, 2003, respectively. Also includes $48.0 million and $7.0 million related to fair valueadjustments for interest rate swap agreements at March 31, 2004 and December 31, 2003, respectively.
(b) Total face value of outstanding debt was $6.3 billion and $7.0 billion at March 31, 2004 and December 31, 2003, respectively.

Table of Contents
our three Delaware statutory business trusts and guarantees of such preferred securities by us. The SEC declared this shelf registrationstatement effective on April 26, 2004.
Debt Covenants
Our only significant covenants relate to leverage and interest coverage contained and defined in the credit facilities. The leverage ratiocovenant requires us to maintain a ratio of total debt to EBITDA (as defined by the credit facilities) of less than 5.50x through June 30, 2003and less than 5.00x from July 1, 2003 through the maturity of the facilities. The interest coverage covenant requires us to maintain a minimumratio of EBITDA (as defined by the credit facilities) to interest expense of 2.00x. In the event that we do not meet these covenants, we areconsidered to be in default on the credit facilities at which time the credit facilities may become immediately due. At March 31, 2004, ourleverage and interest coverage ratios were 2.77x and 6.12x, respectively. Including our cash and cash equivalents recorded at March 31, 2004,our leverage on a net debt basis was 2.68x. Our bank credit facilities have cross-default provisions among the bank facilities only. No otherClear Channel debt agreements have cross-default or cross-acceleration provisions.
Additionally, the AMFM long-term bonds contain certain restrictive covenants that limit the ability of AMFM Operating Inc., a wholly-owned subsidiary of Clear Channel, to incur additional indebtedness, enter into certain transactions with affiliates, pay dividends, consolidate,or affect certain asset sales.
Our $1.5 billion, five-year multi-currency revolving credit facility includes a provision for an increase in fees of 12.5 basis points onborrowings and five basis points on amounts available for future borrowings in the event that both of our long-term debt ratings drop below ourcurrent ratings of BBB-/Baa3. Conversely, if our long-term debt ratings improve, we have a proportionate decrease in fees. Our internationalsubsidiary’s $150.0 million international credit facility includes a put option to us in the event that our long-term debt ratings fall belowBB+/Ba1. We believe there are no other agreements that contain provisions that trigger an event of default upon a change in long-term debtratings that would have a material impact to our financial statements.
At March 31, 2004, we were in compliance with all debt covenants. We expect to remain in compliance throughout 2004.
USES OF CAPITAL
Long-Term Bonds
On February 25, 2004, we redeemed €454.4 million of our 6.5% senior notes due July 7, 2005, for €477.7 million plus accrued interest. Asa result of this redemption we recorded a pre-tax loss of $31.4 million on the early extinguishment of debt. After this redemption,€195.6 million of the 6.5% senior notes remain outstanding.
Dividends
On October 23, 2003 and February 19, 2004, our Board of Directors declared a quarterly cash dividend of $0.10 per share on our CommonStock. Dividend payments of $61.6 million and $61.7 million were disbursed on January 15, 2004 and April 15, 2004, respectively, toshareholders of record at the close of business on December 31, 2003 and March 31, 2004, respectively. Additionally, on April 28, 2004 ourBoard of Directors declared a quarterly cash dividend of $0.10 per share of our Common Stock to be paid on July 15, 2004 to shareholders ofrecord on June 30, 2004.
Acquisitions
During the three months ended March 31, 2004 we acquired 16 radio stations for $26.6 million in cash and $13.0 million in restricted cash.We also acquired approximately 100 outdoor display faces for $44.5 million in cash. Our live entertainment segment made cash payments of$.8 million during the quarter ended March 31, 2004, primarily related to various earn-outs and deferred purchase price consideration on prioryear acquisitions. Also, our national representation business acquired new contracts for a total of $10.2 million in cash during the three monthsended March 31, 2004.
-20-

Table of Contents
Capital Expenditures
Capital expenditures were $70.8 million and $64.4 million in the quarters ended March 31, 2004 and 2003, respectively.
Radio broadcasting capital expenditures declined $3.0 million in the quarter ended March 31, 2004 as compared to the same quarter of 2003due to fewer non-revenue producing project related expenditures.
Outdoor advertising capital expenditures during the quarter ended March 31, 2004 decreased $3.2 million as compared to the same quarterof 2003 primarily due to fewer revenue producing capital expenditures.
Live entertainment capital expenditures during the quarter ended March 31, 2004 increased $13.4 million as compared to the same quarterof 2003 due to the construction of new venues.
Capital expenditures listed under Corporate and Other declined $.8 million during quarter ended March 31, 2004 as compared to the samequarter of 2003.
Company Share Repurchase Program
As of May 7, 2004, 2.7 million shares had been repurchased for an aggregate purchase price of $112.6 million, including commission andfees, under our share repurchase program.
Commitments, Contingencies and Guarantees
In accordance with generally accepted accounting principles in the United States, we do not record the following transactions on ourbalance sheet:
Commitments and Contingencies
We were among the defendants in a lawsuit filed on June 12, 2002 in the United States District Court for the Southern District of Florida bySpanish Broadcasting System. The plaintiffs alleged that we were in violation of Section One and Section Two of the Sherman Antitrust Act aswell as various other claims, such as unfair trade practices and defamation, among other counts. This case was dismissed with prejudice onJanuary 31, 2003. The plaintiffs filed an appeal with the 11th Circuit Court of Appeals and oral argument was held in the case inFebruary 2004. A decision has not yet been issued.
There are various other lawsuits and claims pending against us. We believe that any ultimate liability resulting from those actions or claimswill not have a material adverse effect on our results of operations, financial position or liquidity.
Certain agreements relating to acquisitions provide for purchase price adjustments and other future contingent payments based on thefinancial performance of the acquired companies generally over a one to five year period. We will continue to accrue additional amountsrelated to such contingent payments if and when it is determinable that the applicable financial performance targets will be met. The aggregateof these contingent payments, if performance targets are met, would not significantly impact our financial position or results of operations.
Guarantees
As of March 31, 2004, we guaranteed the debt of third parties of approximately $34.6 million primarily related to long-term operatingcontracts. The third parties’ associated operating assets secure a substantial portion of these obligations. As of May 7, 2004, we have reducedour guarantee of third party debt to $13.3 million.
-21-
(In millions) Three Months Ended March 31, 2004 Capital Expenditures
Radio Outdoor Entertainment Corporate and Other Total
Non-revenue producing $7.6 $13.1 $ 6.6 $ 3.3 $30.6Revenue producing — 23.6 16.6 — 40.2
$7.6 $36.7 $23.2 $ 3.3 $70.8

Table of Contents
At March 31, 2004, we guaranteed the third-party performance under a certain contract for up to approximately $19.3 million that expires in2004.
Market Risk
Interest Rate Risk
At March 31, 2004, approximately 30% of our long-term debt, including fixed rate debt on which we have entered into interest rate swapagreements, bears interest at variable rates. Accordingly, our earnings are affected by changes in interest rates. Assuming the current level ofborrowings at variable rates and assuming a two percentage point change in the year’s average interest rate under these borrowings, it isestimated that our interest expense would have changed by $38.3 million and that our net income would have changed by $23.7 million duringthe first three months of 2004. In the event of an adverse change in interest rates, management may take actions to further mitigate ourexposure. However, due to the uncertainty of the actions that would be taken and their possible effects, the analysis assumes no such actions.Further the analysis does not consider the effects of the change in the level of overall economic activity that could exist in such anenvironment.
At March 31, 2004, we had entered into interest rate swap agreements with a $1.3 billion aggregate notional amount that effectively floatinterest at rates based upon LIBOR. These agreements expire from February 2007 to March 2012. The fair value of these agreements atMarch 31, 2004 was an asset of $48.0 million.
Equity Price Risk
At March 31, 2004, the carrying value of our available-for-sale and trading equity securities was $247.7 million and $38.2 million,respectively. These investments are affected by changes in their quoted market prices. It is estimated that a 20% change in the market prices ofthese securities would change their carrying value at March 31, 2004 by $57.2 million and would change accumulated comprehensive income(loss) and net income (loss) by $30.7 million and $4.7 million, respectively. At March 31, 2004, we also held $30.6 million of investments thatdo not have a quoted market price, but are subject to fluctuations in their value.
Foreign Currency
We have operations in countries throughout the world. Foreign operations are measured in their local currencies except in hyper-inflationarycountries in which we operate. As a result, our financial results could be affected by factors such as changes in foreign currency exchange ratesor weak economic conditions in the foreign markets in which we have operations. To mitigate a portion of the exposure to risk of internationalcurrency fluctuations, we maintain a natural hedge through borrowings in currencies other than the U.S. dollar. In addition, we have a U.S.dollar – Euro cross currency swap which is also designated as a hedge of our net investment in foreign denominated assets. These hedgepositions are reviewed monthly. Our foreign operations reported a net loss of $23.2 million for the three months ended March 31, 2004. It isestimated that a 10% change in the value of the U.S. dollar to foreign currencies would change net loss for the three months ended March 31,2004 by $2.3 million.
Our earnings are also affected by fluctuations in the value of the U.S. dollar as compared to foreign currencies as a result of our investmentsin various countries, all of which are accounted for under the equity method. It is estimated that the result of a 10% fluctuation in the value ofthe dollar relative to these foreign currencies at March 31, 2004 would change our equity in earnings of nonconsolidated affiliates by$.7 million and would change our net income for the three months ended March 31, 2004 by approximately $.4 million. This analysis does notconsider the implications that such fluctuations could have on the overall economic activity that could exist in such an environment in the U.S.or the foreign countries or on the results of operations of these foreign entities.
Recent Accounting Pronouncements
On January 1, 2004, we adopted Financial Accounting Standards Board Interpretation No. 46, Consolidation of Variable Interest Entities.The Interpretation addresses consolidation of business enterprises of variable interest. The adoption of FIN 46 did not have a material impacton our financial position or results of operations.
Inflation
Inflation has affected our performance in terms of higher costs for wages, salaries and equipment. Although the exact impact of inflation isindeterminable, we believe we have offset these higher costs in various manners.
-22-

Table of Contents
Ratio of Earnings to Fixed Charges
The ratio of earnings to fixed charges is as follows:
The ratio of earnings to fixed charges was computed on a total enterprise basis. Earnings represent income from continuing operationsbefore income taxes less equity in undistributed net income (loss) of unconsolidated affiliates plus fixed charges. Fixed charges representinterest, amortization of debt discount and expense, and the estimated interest portion of rental charges. We had no preferred stock outstandingfor any period presented.
Risks Regarding Forward Looking Statements
Except for the historical information, this report contains various forward-looking statements that represent our expectations or beliefsconcerning future events, including the future levels of cash flow from operations. Management believes that all statements that expressexpectations and projections with respect to future matters, including the strategic fit of radio assets, expansion of market share, our ability tocapitalize on synergies between the live entertainment and radio broadcasting businesses, the availability of capital resources, and expectedchanges in advertising revenues, are forward-looking statements within the meaning of the Private Securities Litigation Reform Act. Wecaution that these forward-looking statements involve a number of risks and uncertainties and are subject to many variables that could have anadverse effect upon our financial performance. These statements are made on the basis of management’s views and assumptions, as of the timethe statements are made, regarding future events and business performance. There can be no assurance, however, that management’sexpectations will necessarily come to pass.
A wide range of factors could materially affect future developments and performance, including:
This list of factors that may affect future performance and the accuracy of forward-looking statements is illustrative, but by no meansexhaustive. Accordingly, all forward-looking statements should be evaluated with the understanding of their inherent uncertainty.
-23-
Three Months ended
March 31, Year Ended December 31,
2004 2003 2003 2002 2001 2000 1999
2.05 1.65 3.62 2.62 * 2.20 2.04
* For the year ended December 31, 2001, fixed charges exceeded earnings before income taxes and fixed charges by $1.3 billion.
• the impact of general economic conditions in the U.S. and in other countries in which we currently do business, including thoseresulting from recessions, political events and acts or threats of terrorism or military conflicts;
• the impact of the geopolitical environment;
• our ability to integrate the operations of recently acquired companies;
• shifts in population and other demographics;
• industry conditions, including competition;
• fluctuations in operating costs;
• technological changes and innovations;
• changes in labor conditions;
• fluctuations in exchange rates and currency values;
• capital expenditure requirements;
• the outcome of pending and future litigation;
• legislative or regulatory requirements;
• interest rates;
• the effect of leverage on our financial position and earnings;
• taxes;
• access to capital markets; and
• certain other factors set forth in our SEC filings, including our Annual Report on Form 10-K for the year ended December 31, 2003.

Table of Contents
ITEM 3. QUANTITATIVE AND QUALITATIVE DISCLOSURES ABOUT MARKET RISK
Required information is within Item 2
ITEM 4. CONTROLS AND PROCEDURES
Our principal executive and financial officers have concluded, based on their evaluation as of the end of the period covered by this Form10-Q, that our disclosure controls and procedures, as defined under Rules 13a-15(e) and 15d-15(e) of the Securities Exchange Act of 1934, areeffective to ensure that information we are required to disclose in the reports we file or submit under the Exchange Act is recorded, processed,summarized and reported within the time periods specified in the SEC’s rules and forms, and include controls and procedures designed toensure that information we are required to disclose in such reports is accumulated and communicated to management, including our principalexecutive and financial officers, as appropriate to allow timely decisions regarding required disclosure.
Subsequent to our evaluation, there were no significant changes in internal controls or other factors that could significantly affect theseinternal controls.
-24-

Table of Contents
Part II — OTHER INFORMATION
Item 1. Legal Proceedings
We are among the defendants in a lawsuit filed on June 12, 2002 in the United States District Court for the Southern District of Florida bySpanish Broadcasting System. The plaintiffs allege that we are in violation of Section One and Section Two of the Sherman Antitrust Act aswell as various other claims, such as unfair trade practices and defamation, among other counts. This case was dismissed with prejudice onJanuary 31, 2003. The plaintiffs filed an appeal with the 11th Circuit Court of Appeals and oral argument was held in the case inFebruary 2004. A decision has not yet been issued.
There are various other lawsuits and claims pending against us. We believe that any ultimate liability resulting from those actions or claimswill not have a material adverse effect on our results of operations, financial position or liquidity.
We are currently involved in certain legal proceedings and, as required, have accrued our estimate of the probable costs for the resolution ofthese claims. These estimates have been developed in consultation with counsel and are based upon an analysis of potential results, assuming acombination of litigation and settlement strategies. It is possible, however, that future results of operations for any particular period could bematerially affected by changes in our assumptions or the effectiveness of our strategies related to these proceedings.
Item 2. Changes in Securities, and Use of Proceeds and Issuer Purchases of Equity Securities
On March 30, 2004, we publicly announced that our Board of Directors authorized a share repurchase program of up to $1.0 billioneffective immediately. This share repurchase program will expire on March 30, 2005, although prior to such time, the program may bediscontinued or suspended at any time. During the three months ended March 31, 2004, we had not repurchased any shares.
Item 5. Other Information
On April 30, 2004, Lowry Mays, our Chairman and Chief Executive Officer, awoke with numbness on his left side and was admitted to thehospital for testing. Doctors found that he had suffered a subdural hematoma. Surgery was performed to alleviate the pressure caused by thehematoma. The surgery was successful. His doctors expect a complete recovery.
On May 7, 2004, our Board of Directors appointed Mark P. Mays as interim CEO, effective immediately.
Item 6. Exhibits and Reports on Form 8-K
(a) Exhibits. See Exhibit Index on Page 27
(b) Reports on Form 8-K
-25-
Filing Date Items Reported Financial Statements Reported
8-K 1/12/04 Item 5 - Other None8-K 2/25/04 Item 12 & 7 Earnings Release8-K 3/31/04 Item 5 - Other None

Table of Contents
Signatures
Pursuant to the requirements of the Securities Exchange Act of 1934, the registrant has duly caused this report to be signed on its behalf by theundersigned thereunto duly authorized.
-26-
CLEAR CHANNEL COMMUNICATIONS, INC.
May 10, 2004 /s/ Randall T. MaysRandall T. MaysExecutive Vice President and Chief FinancialOfficer
May 10, 2004 /s/ Herbert W. Hill, Jr.Herbert W. Hill, Jr.Senior Vice President and Chief Accounting Officer

Table of Contents
INDEX TO EXHIBITS
-27-
ExhibitNumber Description
2.1 Agreement and Plan of Merger dated as of October 2, 1999, among Clear Channel,CCU Merger Sub, Inc. and AMFM Inc. (incorporated by reference to the exhibits ofClear Channel’s Current Report on Form 8-K filed October 5, 1999).
2.2 Agreement and Plan of Merger dated as of February 28, 2000, among Clear Channel,CCU II Merger Sub, Inc. and SFX Entertainment, Inc. (incorporated by reference tothe exhibits of Clear Channel’s Current Report on Form 8-K filed February 29,2000).
2.3 Agreement and Plan of Merger dated as of October 5, 2001, by and among ClearChannel, CCMM Sub, Inc. and The Ackerley Group, Inc. (incorporated by referenceto the exhibits of Clear Channel’s Current Report on Form 8-K filed October 9,2001).
3.1 Current Articles of Incorporation of the Company (incorporated by reference to theexhibits of the Company’s Registration Statement on Form S-3 (Reg. No. 333-33371) dated September 9, 1997).
3.2 Third Amended and Restated Bylaws of the Company (incorporated by reference tothe exhibits of the Company’s Registration Statement on Form S-4 (Reg. No. 333-74196) dated November 29, 2001).
3.3 Amendment to the Company’s Articles of Incorporation (incorporated by referenceto the exhibits to the Company’s Quarterly Report on Form 10-Q for the quarterended September 30, 1998).
3.4 Second Amendment to Clear Channel’s Articles of Incorporation (incorporated byreference to the exhibits to Clear Channel’s Quarterly Report on Form 10-Q for thequarter ended March 31, 1999).
3.5 Third Amendment to Clear Channel’s Articles of Incorporation (incorporated byreference to the exhibits to Clear Channel’s Quarterly Report on Form 10-Q for thequarter ended May 31, 2000).
4.1 Agreement Concerning Buy-Sell Agreement by and between Clear ChannelCommunications, Inc., L. Lowry Mays, B.J. McCombs, John M. Schaefer and JohnW. Barger, dated August 3, 1998 (incorporated by reference to the exhibits to ClearChannel’s Schedule 13-D/A, dated October 10, 2002).
4.2 Waiver and Second Agreement Concerning Buy-Sell Agreement by and betweenClear Channel Communications, Inc., L. Lowry Mays and B.J. McCombs, datedAugust 17, 1998 (incorporated by reference to the exhibits to Clear Channel’sSchedule 13-D/A, dated October 10, 2002).
4.3 Waiver and Third Agreement Concerning Buy-Sell Agreement by and between ClearChannel Communications, Inc., L. Lowry Mays and B.J. McCombs, dated July 26,2002 (incorporated by reference to the exhibits to Clear Channel’s Schedule 13-D/A,dated October 10, 2002).
4.4 Waiver and Fourth Agreement Concerning Buy-Sell Agreement by and betweenClear Channel Communications, Inc., L. Lowry Mays and B.J. McCombs, datedSeptember 27, 2002 (incorporated by reference to the exhibits to Clear Channel’sSchedule 13-D/A, dated October 10, 2002).
4.5 Buy-Sell Agreement by and between Clear Channel Communications, Inc., L. LowryMays, B. J. McCombs, John M. Schaefer and John W. Barger, dated May 31, 1977(incorporated by reference to the exhibits of the Company’s Registration Statementon Form S-1 (Reg. No. 33-289161) dated April 19, 1984).
4.6 Senior Indenture dated October 1, 1997, by and between Clear ChannelCommunications, Inc. and The Bank of New York as Trustee (incorporated byreference to the exhibits to the Company’s Quarterly Report on Form 10-Q for thequarter ended September 30, 1997).

Table of Contents
-28-
Exhibit Number Description
4.7 First Supplemental Indenture dated March 30, 1998 to Senior Indenturedated October 1, 1997, by and between the Company and The Bank of NewYork, as Trustee (incorporated by reference to the exhibits to the Company’sQuarterly Report on Form 10-Q for the quarter ended March 31, 1998).
4.8 Second Supplemental Indenture dated June 16, 1998 to Senior Indenturedated October 1, 1997, by and between Clear Channel Communications, Inc.and the Bank of New York, as Trustee (incorporated by reference to theexhibits to the Company’s Current Report on Form 8-K dated August 27,1998).
4.9 Third Supplemental Indenture dated June 16, 1998 to Senior Indenture datedOctober 1, 1997, by and between Clear Channel Communications, Inc. andthe Bank of New York, as Trustee (incorporated by reference to the exhibitsto the Company’s Current Report on Form 8-K dated August 27, 1998).
4.10 Fourth Supplement Indenture dated November 24, 1999 to Senior Indenturedated October 1, 1997, by and between Clear Channel and The Bank of NewYork as Trustee (incorporated by reference to the exhibits of the Company’sAnnual Report on Form 10-K for the year ended December 31, 1999).
4.11 Fifth Supplemental Indenture dated June 21, 2000, to Senior Indenture datedOctober 1, 1997, by and between Clear Channel Communications, Inc. andThe Bank of New York, as Trustee (incorporated by reference to the exhibitsof Clear Channel’s registration statement on Form S-3 (Reg. No. 333-42028)dated July 21, 2000).
4.12 Sixth Supplemental Indenture dated June 21, 2000, to Senior Indenture datedOctober 1, 1997, by and between Clear Channel Communications, Inc. andThe Bank of New York, as Trustee (incorporated by reference to the exhibitsof Clear Channel’s registration statement on Form S-3 (Reg. No. 333-42028)dated July 21, 2000).
4.13 Seventh Supplemental Indenture dated July 7, 2000, to Senior Indenturedated October 1, 1997, by and between Clear Channel Communications, Inc.and The Bank of New York, as Trustee (incorporated by reference to theexhibits of Clear Channel’s registration statement on Form S-3 (Reg.No. 333-42028) dated July 21, 2000).
4.14 Eighth Supplemental Indenture dated September 12, 2000, to SeniorIndenture dated October 1, 1997, by and between Clear ChannelCommunications, Inc. and The Bank of New York, as Trustee (incorporatedby reference to the exhibits to Clear Channel’s Quarterly Report onForm 10-Q for the quarter ended September 30, 2000).
4.15 Ninth Supplemental Indenture dated September 12, 2000, to SeniorIndenture dated October 1, 1997, by and between Clear ChannelCommunications, Inc. and The Bank of New York, as Trustee (incorporatedby reference to the exhibits to Clear Channel’s Quarterly Report onForm 10-Q for the quarter ended September 30, 2000).
4.16 Tenth Supplemental Indenture dated October 26, 2001, to Senior Indenturedated October 1, 1997, by and between Clear Channel Communications, Inc.and The Bank of New York, as Trustee (incorporated by reference to theexhibits to Clear Channel’s Quarterly Report on Form 10-Q for the quarterended September 30, 2001).
4.17 Eleventh Supplemental Indenture dated January 9, 2003, to Senior Indenturedated October 1, 1997, by and between Clear Channel Communications, Inc.and The Bank of New York as Trustee (incorporated by reference to theexhibits to Clear Channel’s Annual Report on Form 10-K for the year endedDecember 31, 2002).
4.18 Twelfth Supplemental Indenture dated March 17, 2003, to Senior Indenturedated October 1, 1997, by and between Clear Channel Communications, Inc.and The Bank of New York, as Trustee (incorporated by reference to theexhibits to Clear Channel’s Current Report on Form 8-K dated March 18,2003).

Table of Contents
-29-
Exhibit Number Description
4.19 Thirteenth Supplemental Indenture dated May 1, 2003, to Senior Indenture datedOctober 1, 1997, by and between Clear Channel Communications, Inc. and The Bank ofNew York, as Trustee (incorporated by reference to the exhibits to Clear Channel’sCurrent Report on Form 8-K dated May 2, 2003).
4.20 Fourteenth Supplemental Indenture dated May 21, 2003, to Senior Indenture datedOctober 1, 1997, by and between Clear Channel Communications, Inc. and The Bank ofNew York, as Trustee (incorporated by reference to the exhibits to Clear Channel’sCurrent Report on Form 8-K dated May 22, 2003).
4.21 Fifteenth Supplemental Indenture dated November 5, 2003, to Senior Indenture datedOctober 1, 1997, by and between Clear Channel Communications, Inc. and The Bank ofNew York, as Trustee (incorporated by reference to the exhibits to Clear Channel’sCurrent Report on Form 8-K dated November 14, 2003).
4.22 Sixteenth Supplemental Indenture dated December 9, 2003, to Senior Indenture datedOctober 1, 1997, by and between Clear Channel Communications, Inc. and The Bank ofNew York, as Trustee (incorporated by reference to the exhibits to Clear Channel’sCurrent Report on Form 8-K dated December 10, 2003).
4.23 Termination Agreement by and among Clear Channel Communications, Inc., L. LowryMays, Thomas O. Hicks and certain other shareholders affiliated with Mr. Hicks datedMarch 10, 2004, terminating that certain Shareholders Agreement dated October 2, 1999(incorporated by reference to the exhibits of Clear Channel’s Annual Report on Form 10-K for the year ended December 31, 2003).
4.24 Shareholder’s Agreement by and between Clear Channel Communications, Inc. and L.Lowry Mays dated March 10, 2004 (incorporated by reference to the exhibits of ClearChannel’s Annual Report on Form 10-K for the year ended December 31, 2003).
4.25 Shareholders’ Agreement by and among Clear Channel Communications, Inc., Thomas O.Hicks and certain other shareholders affiliated with Mr. Hicks dated March 10, 2004(incorporated by reference to the exhibits of Clear Channel’s Annual Report on Form10-K for the year ended December 31, 2003).
10.1 Employment Agreement by and between Clear Channel Broadcasting, Inc. and PaulMeyer dated February 18, 2004 (incorporated by reference to the exhibits of ClearChannel’s Annual Report on Form 10-K for the year ended December 31, 2003).
10.2 Employment Agreement by and between Clear Channel Broadcasting, Inc. and JohnHogan dated February 18, 2004 (incorporated by reference to the exhibits of ClearChannel’s Annual Report on Form 10-K for the year ended December 31, 2003).
10.3 Amendment to Employment Agreement by and between Clear Channel Communications,Inc. and Brian E. Becker dated February 12, 2004 (incorporated by reference to theexhibits of Clear Channel’s Annual Report on Form 10-K for the year endedDecember 31, 2003).
11 Statement re: Computation of Per Share Earnings.
12 Statement re: Computation of Ratios.
31.1 Certification of Principal Executive Officer Pursuant to Rules 13a-14(a) and 15d-14(a)under the Securities Exchange Act of 1934, as Adopted Pursuant to Section 302 of theSarbanes-Oxley Act of 2002.
31.2 Certification of Chief Financial Officer Pursuant to Rules 13a-14(a) and 15d-14(a) underthe Securities Exchange Act of 1934, as Adopted Pursuant to Section 302 of the Sarbanes-Oxley Act of 2002.

Table of Contents
-30-
Exhibit Number Description
32.1 Certification of Principal Executive Officer Pursuant to 18 U.S.C.Section 1350, as Adopted Pursuant to Section 906 of the Sarbanes-OxleyAct of 2002.
32.2 Certification of Chief Financial Officer Pursuant to 18 U.S.C. Section 1350,as Adopted Pursuant to Section 906 of the Sarbanes-Oxley Act of 2002.

<DOCUMENT><TYPE> EX-11<FILENAME> d15277exv11.htm<DESCRIPTION> Statement re: Computation of Earnings Per Share<TEXT>

EXHIBIT 11 – COMPUTATION OF EARNINGS PER SHARE
In thousands of dollars, except per share data
Three Months Ended March 31,
2004 2003
Numerator:Net income (loss) $116,460 $ 71,046Effect of dilutive securities:
Convertible debt — 2.625% issued in 1998 — 2,106*LYONS — 1998 issue — 1,216*Less: Anti-dilutive items — (3,322)
Numerator for net loss per common share — diluted $116,460 $ 71,046Denominator:
Weighted average common shares 616,557 613,557Effect of dilutive securities:
Stock options and common stock warrants 3,071 2,960Convertible debt — 2.625% issued in 1998 — 8,355*LYONS — 1998 issue — 3,046*Less: Anti-dilutive items — (11,401)
Denominator for net income (loss) per common share — diluted 619,628 616,517Net income (loss) per common share:
Basic $ .19 $ .12
Diluted $ .19 $ .12
* Denotes items that are anti-dilutive to the calculation of earnings per share.

<DOCUMENT><TYPE> EX-12<FILENAME> d15277exv12.htm<DESCRIPTION> Statement re: Computation of Ratios<TEXT>

EXHIBIT 12 – COMPUTATION OF RATIO OF EARNINGS TO FIXED CHARGES
(In thousands, except ratio data)
Three Months EndedMarch 31, Year Ended
2004 2003 2003 2002 2001 2000 1999
Income (loss) before income taxes, equity inearnings of non-consolidated affiliates andextraordinary item $189,056 $117,070 $1,903,338 $1,191,261 $(1,259,390) $ 688,384 $220,213
Dividends and other received fromnonconsolidated affiliates 1,150 1,511 2,096 6,295 7,426 4,934 7,079
Total 190,206 118,581 1,905,434 1,197,556 (1,251,964) 693,318 227,292Fixed ChargesInterest expense 89,805 100,952 388,000 432,786 560,077 413,425 192,321Amortization of loan fees * * * 12,077 14,648 12,401 1,970Interest portion of rentals 91,141 82,542 338,965 293,831 270,653 150,317 24,511
Total fixed charges 180,946 183,494 726,965 738,694 845,378 576,143 218,802Preferred stock dividendsTax effect of preferred dividends — — — — — — —After tax preferred dividends — — — — — — —
Total fixed charges and preferred dividends 180,946 183,494 726,965 738,694 845,378 576,143 218,802Total earnings available for payment of
fixed charges $371,152 $302,075 $2,632,399 $1,936,250 $ (406,586) $1,269,461 $446,094
Ratio of earnings to fixed charges 2.05 1.65 3.62 2.62 ** 2.20 2.04
Rental fees and charges 260,403 235,835 968,470 839,516 773,293 429,476 306,393Interest component 35% 35% 35% 35% 35% 35% 8%
* Amortization of loan fees is included in Interest expense beginning January 1, 2003.** For the year ended December 31, 2001, fixed charges exceeded earnings before income taxes and fixed charges by $1.3 billion.

<DOCUMENT><TYPE> EX-31.1<FILENAME> d15277exv31w1.htm<DESCRIPTION> Certification of Principal Executive Officer<TEXT>

I, Mark P. Mays, Interim Chief Executive Officer, President and Chief Operating Officer of Clear Channel Communications, Inc., certify that:
(a) Designed such disclosure controls and procedures, or caused such disclosure controls and procedures to be designed under oursupervision, to ensure that material information relating to the registrant, including its consolidated subsidiaries, is made known to us byothers within those entities, particularly during the period in which this report is being prepared;
(b) Evaluated the effectiveness of the registrant’s disclosure controls and procedures and presented in this report our conclusionsabout the effectiveness of the disclosure controls and procedures, as of the end of the period covered by this report based on suchevaluation; and
(c) Disclosed in this report any change in the registrant’s internal control over financial reporting that occurred during the registrant’smost recent fiscal quarter (the registrant’s fourth fiscal quarter in the case of an annual report) that has materially affected, or isreasonably likely to materially affect, the registrant’s internal control over financial reporting; and
(a) All significant deficiencies and material weaknesses in the design or operation of internal control over financial reporting whichare reasonably likely to adversely affect the registrant’s ability to record, process, summarize and report financial information; and
(b) Any fraud, whether or not material, that involves management or other employees who have a significant role in the registrant’sinternal control over financial reporting.
Date: May 10, 2004
/s/ MARK P. MAYS
Mark P. MaysInterim Chief Executive Officer, Presidentand Chief Operating Officer
EXHIBIT 31.1 - CERTIFICATION OF PRINCIPAL EXECUTIVE OFFICER PURSUANT TO RULES13A-14(A) AND 15D-14(A) UNDER THE SECURITIES EXCHANGE ACT OF 1934, ASADOPTED PURSUANT TO SECTION 302 OF THE SARBANES-OXLEY ACT OF 2002
1. I have reviewed this Quarterly Report on Form 10-Q of Clear Channel Communications, Inc.;
2. Based on my knowledge, this report does not contain any untrue statement of a material fact or omit to state a material fact necessary tomake the statements made, in light of the circumstances under which such statements were made, not misleading with respect to the periodcovered by this report;
3. Based on my knowledge, the financial statements, and other financial information included in this report, fairly present in all materialrespects the financial condition, results of operations and cash flows of the registrant as of, and for, the periods presented in this report;
4. The registrant’s other certifying officer(s) and I are responsible for establishing and maintaining disclosure controls and procedures (asdefined in Exchange Act Rules 13a-15(e) and 15d-15(e)) for the registrant and have:
5. The registrant’s other certifying officer(s) and I have disclosed, based on our most recent evaluation of internal control over financialreporting, to the registrant’s auditors and the audit committee of the registrant’s board of directors (or persons performing the equivalentfunctions):

<DOCUMENT><TYPE> EX-31.2<FILENAME> d15277exv31w2.htm<DESCRIPTION> Certification of Chief Financial Officer<TEXT>

I, Randall T. Mays, Executive Vice President and Chief Financial Officer of Clear Channel Communications, Inc., certify that:
(a) Designed such disclosure controls and procedures, or caused such disclosure controls and procedures to be designed under oursupervision, to ensure that material information relating to the registrant, including its consolidated subsidiaries, is made known to usby others within those entities, particularly during the period in which this report is being prepared;
(b) Evaluated the effectiveness of the registrant’s disclosure controls and procedures and presented in this report our conclusionsabout the effectiveness of the disclosure controls and procedures, as of the end of the period covered by this report based on suchevaluation; and
(c) Disclosed in this report any change in the registrant’s internal control over financial reporting that occurred during theregistrant’s most recent fiscal quarter (the registrant’s fourth fiscal quarter in the case of an annual report) that has materially affected,or is reasonably likely to materially affect, the registrant’s internal control over financial reporting; and
(a) All significant deficiencies and material weaknesses in the design or operation of internal control over financial reporting whichare reasonably likely to adversely affect the registrant’s ability to record, process, summarize and report financial information; and
(b) Any fraud, whether or not material, that involves management or other employees who have a significant role in the registrant’sinternal control over financial reporting.
Date: May 10, 2004
/s/ RANDALL T. MAYS
Randall T. MaysExecutive Vice President andChief Financial Officer
EXHIBIT 31.2 - CERTIFICATION OF CHIEF FINANCIAL OFFICER PURSUANT TO RULES13A-14(A) AND 15D-14(A) UNDER THE SECURITIES EXCHANGE ACT OF 1934, ASADOPTED PURSUANT TO SECTION 302 OF THE SARBANES-OXLEY ACT OF 2002
1. I have reviewed this Quarterly Report on Form 10-Q of Clear Channel Communications, Inc.;
2. Based on my knowledge, this report does not contain any untrue statement of a material fact or omit to state a material fact necessary tomake the statements made, in light of the circumstances under which such statements were made, not misleading with respect to the periodcovered by this report;
3. Based on my knowledge, the financial statements, and other financial information included in this report, fairly present in all materialrespects the financial condition, results of operations and cash flows of the registrant as of, and for, the periods presented in this report;
4. The registrant’s other certifying officer(s) and I are responsible for establishing and maintaining disclosure controls and procedures (asdefined in Exchange Act Rules 13a-15(e) and 15d-15(e)) for the registrant and have:
5. The registrant’s other certifying officer(s) and I have disclosed, based on our most recent evaluation of internal control over financialreporting, to the registrant’s auditors and the audit committee of the registrant’s board of directors (or persons performing the equivalentfunctions):

<DOCUMENT><TYPE> EX-32.1<FILENAME> d15277exv32w1.htm<DESCRIPTION> Certification of Principal Executive Officer<TEXT>

This certification is provided pursuant to Section 906 of the Sarbanes-Oxley Act of 2002 and accompanies the Quarterly Report on Form 10-Q(the “Form 10-Q”) for the quarter ended March 31, 2004 of Clear Channel Communications, Inc. (the “Issuer”). The undersigned herebycertifies that the Form 10-Q fully complies with the requirements of Section 13(a) or Section 15(d) of the Securities Exchange Act of 1934 (15U.S.C. 78m or 78o(d)) and that the information contained in the Form 10-Q fairly presents, in all material respects, the financial condition andresults of operations of the Issuer.
Date: May 10, 2004
By: /s/ MARK P. MAYS
Name: Mark P. MaysTitle: Interim Chief Executive Officer, President and Chief Operating Officer
A signed original of this written statement required by Section 906 has been provided to the Issuer and will be furnished to the Securities andExchange Commission, or its staff, upon request.
EXHIBIT 32.1 – CERTIFICATION OF PRINCIPAL EXECUTIVE OFFICER PURSUANT TO 18 U.S.C. SECTION 1350, ASADOPTED PURSUANT TO SECTION 906 OF THE SARBANES-OXLEY ACT OF 2002

<DOCUMENT><TYPE> EX-32.2<FILENAME> d15277exv32w2.htm<DESCRIPTION> Certification of Chief Financial Officer<TEXT>

This certification is provided pursuant to Section 906 of the Sarbanes-Oxley Act of 2002 and accompanies the Quarterly Report on Form 10-Q(the “Form 10-Q”) for the quarter ended March 31, 2004 of Clear Channel Communications, Inc. (the “Issuer”). The undersigned herebycertifies that the Form 10-Q fully complies with the requirements of Section 13(a) or Section 15(d) of the Securities Exchange Act of 1934 (15U.S.C. 78m or 78o(d)) and that the information contained in the Form 10-Q fairly presents, in all material respects, the financial condition andresults of operations of the Issuer.
A signed original of this written statement required by Section 906 has been provided to the Issuer and will be furnished to the Securities andExchange Commission, or its staff, upon request.
EXHIBIT 32.2 – CERTIFICATION OF CHIEF FINANCIAL OFFICER PURSUANT TO 18 U.S.C. SECTION 1350, AS ADOPTEDPURSUANT TO SECTION 906 OF THE SARBANES-OXLEY ACT OF 2002
Date: May 10, 2004
By: /s/ RANDALL T. MAYSName: Randall T. MaysTitle Executive Vice President and Chief Financial Officer