submillimeter astronomy of the solar system glenn orton jet propulsion laboratory california...
Post on 18-Dec-2015
216 views
TRANSCRIPT
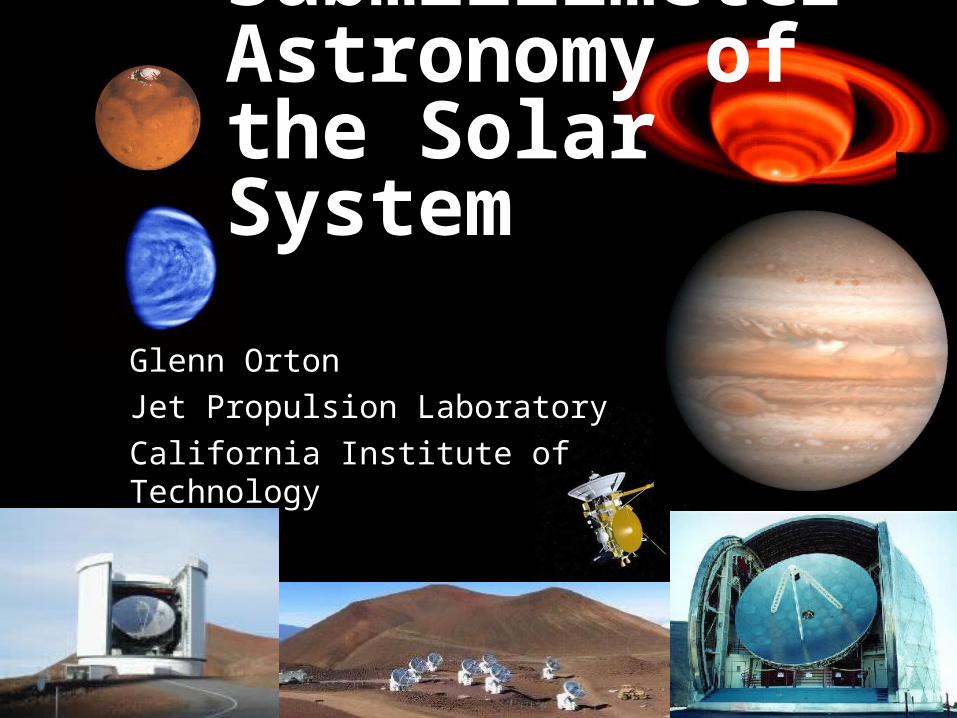
Submillimeter Astronomy of the Solar System
Glenn Orton
Jet Propulsion Laboratory
California Institute of Technology

Thanks for help from many!
Mark Gurwell Cassini Composite Infrared Spectrometer Team
Linda Brown ISO Long-Wavelength Spectrometer Solar-System Team
Bryan Butler Herschel Calibration Workshop Team
Todd Clancy
Gary Davis
Brigette Hesman
Juan Pardo
Gene Serabyn
Linda Spilker
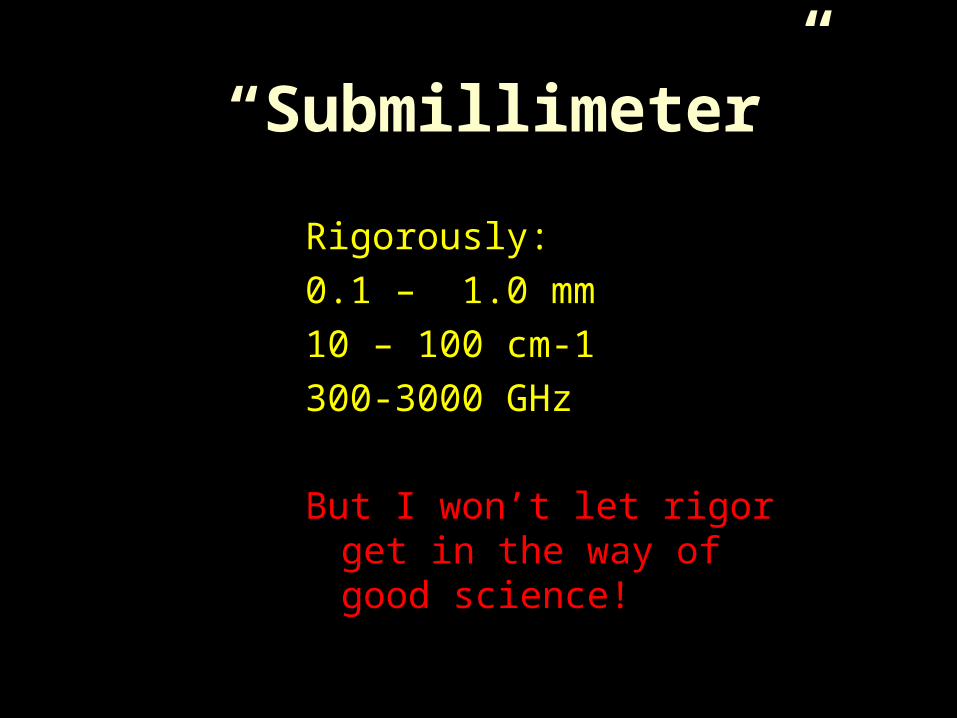
“Submillimeter”
Rigorously:
0.1 – 1.0 mm
10 – 100 cm-1
300-3000 GHz
But I won’t let rigor get in the way of good science!
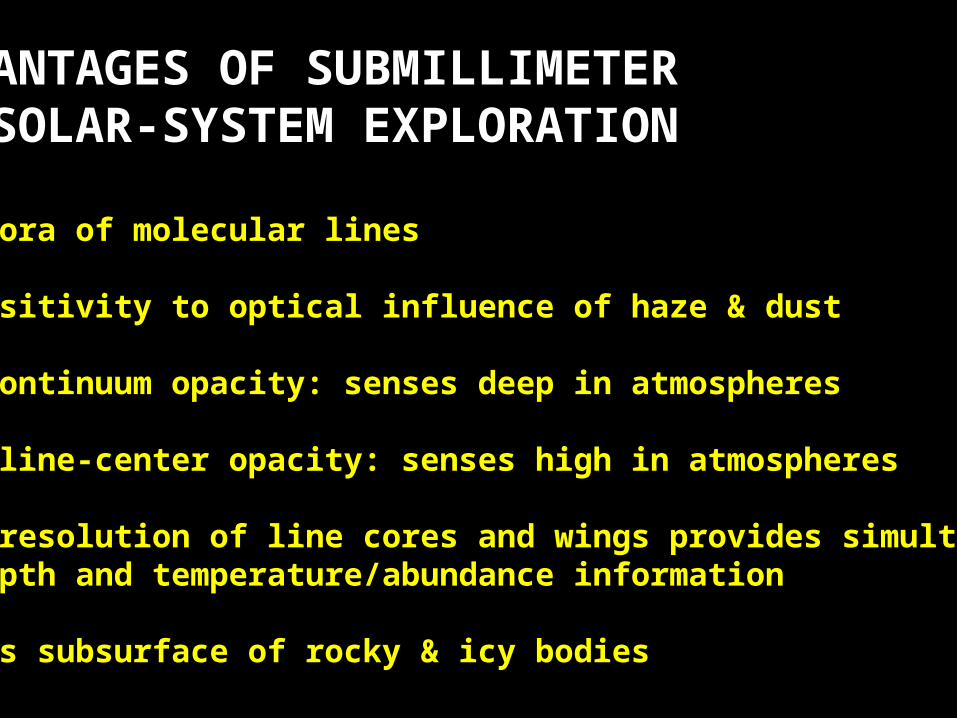
ADVANTAGES OF SUBMILLIMETERIN SOLAR-SYSTEM EXPLORATION
Plethora of molecular lines
Insensitivity to optical influence of haze & dust
Low continuum opacity: senses deep in atmospheres
High line-center opacity: senses high in atmospheres
High-resolution of line cores and wings provides simultaneous depth and temperature/abundance information
Senses subsurface of rocky & icy bodies

Total Lunar eclipse of July 16th, 2000
Expected behavior: Fastest temperature drop at shortest wavelengths due to less penetration.
Pardo, J.R., Serabyn, E., Wiedner, M.C., Icarus, submitted.

Atmosphere of Venus

Pardo and Serabyn: observation of HCl and search for OCS lines in Venus

Venus: submm spectra of SO2 and search for SO
(observations from the JCMT, Clancy et al. – to be given at the Cambridge, UK, AAS/DPS meeting)
[SO2] ~ 2 x 10⁻⁸ [SO] < 1 x 10⁻⁹

Venus: Dayside vs Nightside Mesosphere Temperature Structure
↑temperature inversion in dayside upper atmosphere.
rapid temperaturefalloff in the nightsideupper atmosphere ↓
Surface and Atmosphere of Mars
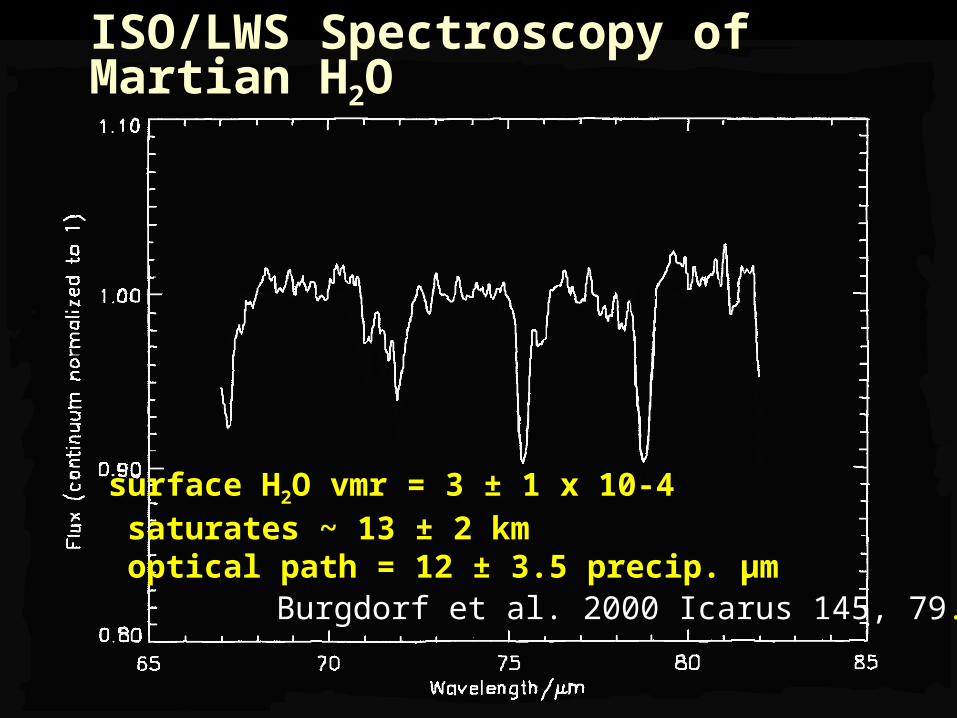
ISO/LWS Spectroscopy of Martian H2O
Burgdorf et al. 2000 Icarus 145, 79.
surface H2O vmr = 3 ± 1 x 10⁻⁴ saturates ~ 13 ± 2 km optical path = 12 ± 3.5 precip. µm

Mars Surface Emissivity Deduced from ISO/LWS Flux (Burgdorf et al. 2000 Icarus 145, 79)

Mars Observations from SWAS
Gurwell et al. 2000. Astrophys. J. 539, L143.
resolved lines allow determination ofT and H2O vapor profiles simultaneously
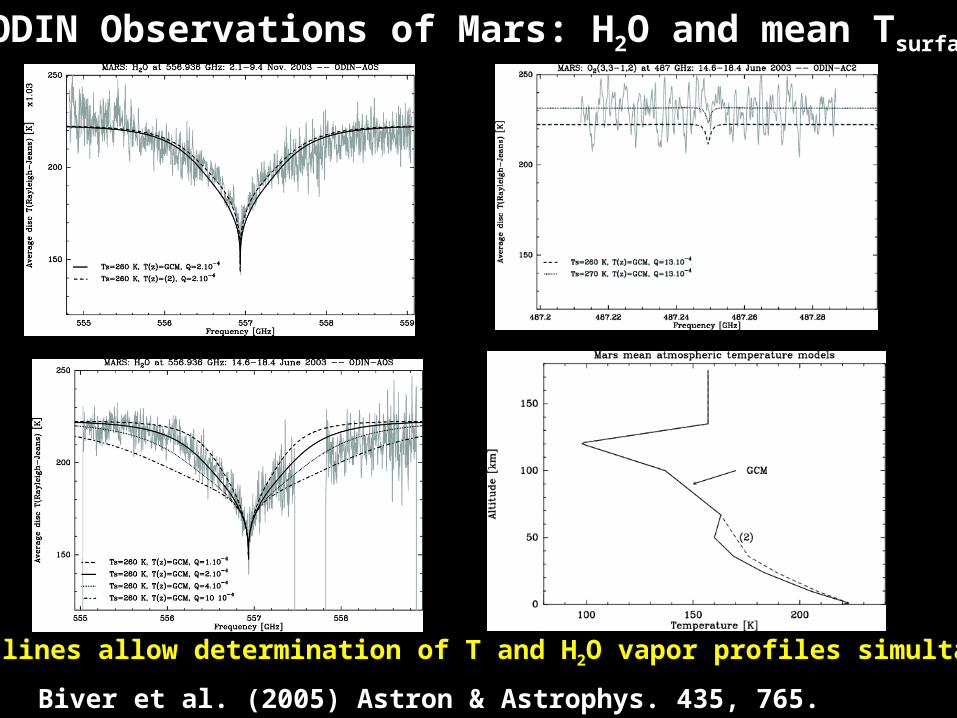
ODIN Observations of Mars: H2O and mean Tsurface
Biver et al. (2005) Astron & Astrophys. 435, 765.
resolved lines allow determination of T and H2O vapor profiles simultaneously

dust-free model

First SMA Image with all 8 Antennas: Mars can be used to map both T(p) and Tsurf
Ho et al. (2004) Astrophys J. 616, 61.

Retrieved easterly zonal flow of Mars southern solstice circulation is stronger and deeper than in dynamical models, although retrieved meridional winds (not shown) are similar.
Mars zonal winds derived from JCMT observations of 12CO and 13CO Doppler line shifts (Clancy et al. 2005).

Detection of H2O2 in Mars (JCMT)
Initial detection of Mars atmospheric H2O2, from JCMT during the favorable Mars opposition of late summer 2003. H2O2 is the most abundant species of the key catalytic HOx family, which effectively controls both the photochemical stability and trace chemical makeup of the global Mars atmosphere (Clancy et al. 2004).Clancy et al. (2004) Icarus 168, 116.

Atmosphere of Jupiter

JUPITER
<------------------------------NH3-------------------------------
H2---

Calibration of spectral continuum to lunar flux (Pardo and Serabyn, ongoing work)

Observation of low-frequency wing of NH3 line
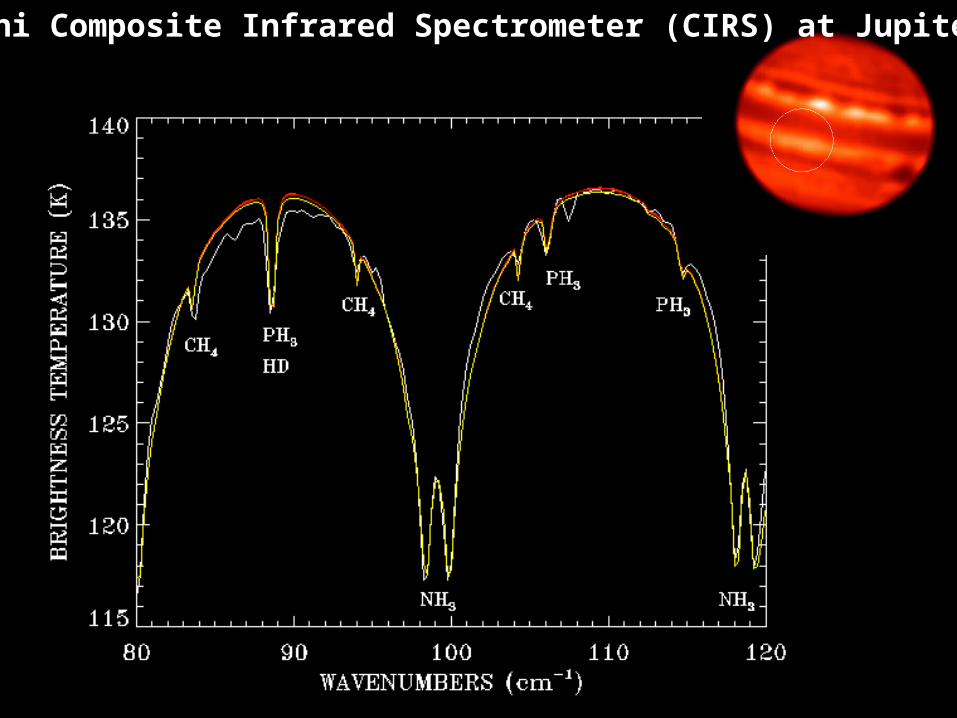
Cassini Composite Infrared Spectrometer (CIRS) at Jupiter

Upper limits for hydrogen halides in JupiterFouchet et al. (2001). Icarus 170, 237.
[HF]<2.7×10⁻¹¹
[HCl]<2.3×10⁻⁹
[HBr]<1.0×10⁻⁹
[HI]<7.6×10⁻⁹

Refit to data of Weisstein, E. W. and E. Serabyn (1996) Icarus 123 23, 23.
(a more detailed analysis by Mark Allen and students, Caltech, to come)
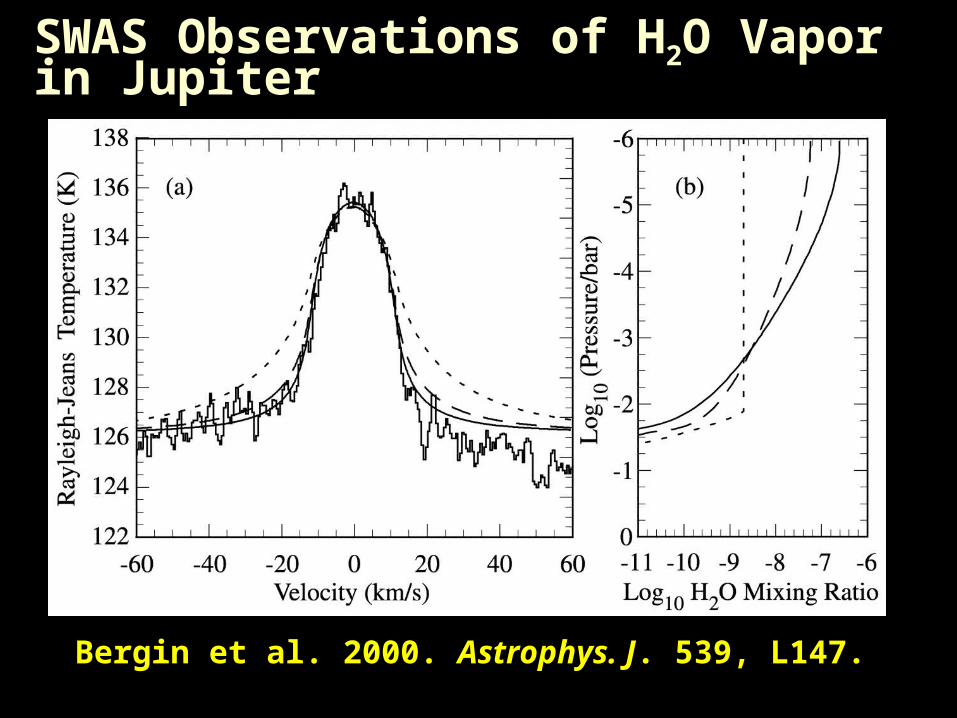
SWAS Observations of H2O Vapor in Jupiter
Bergin et al. 2000. Astrophys. J. 539, L147.
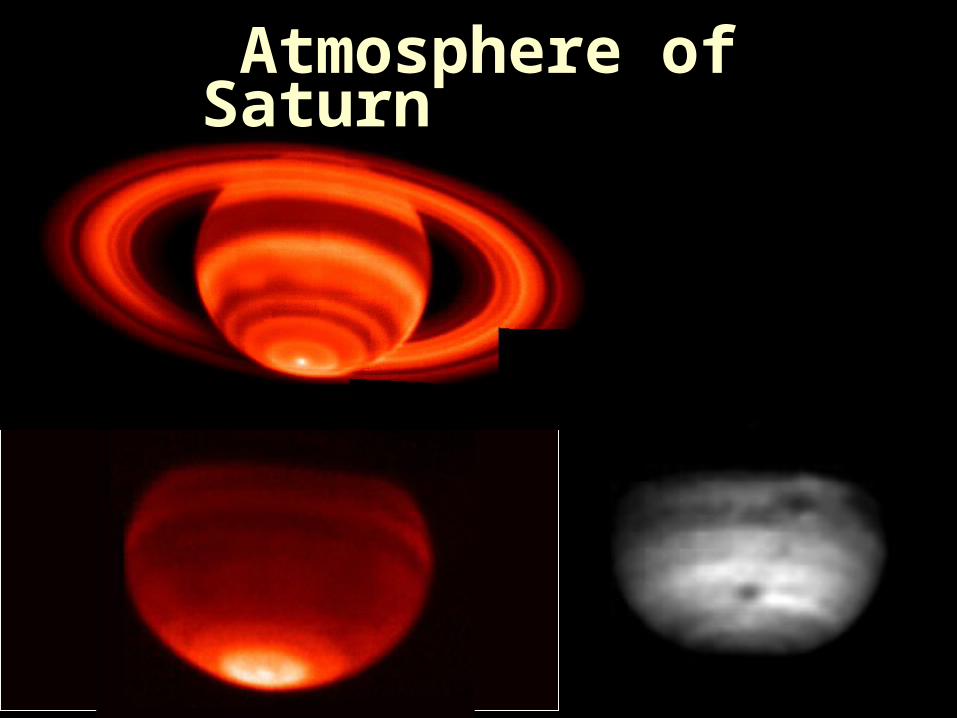
Atmosphere of Saturn
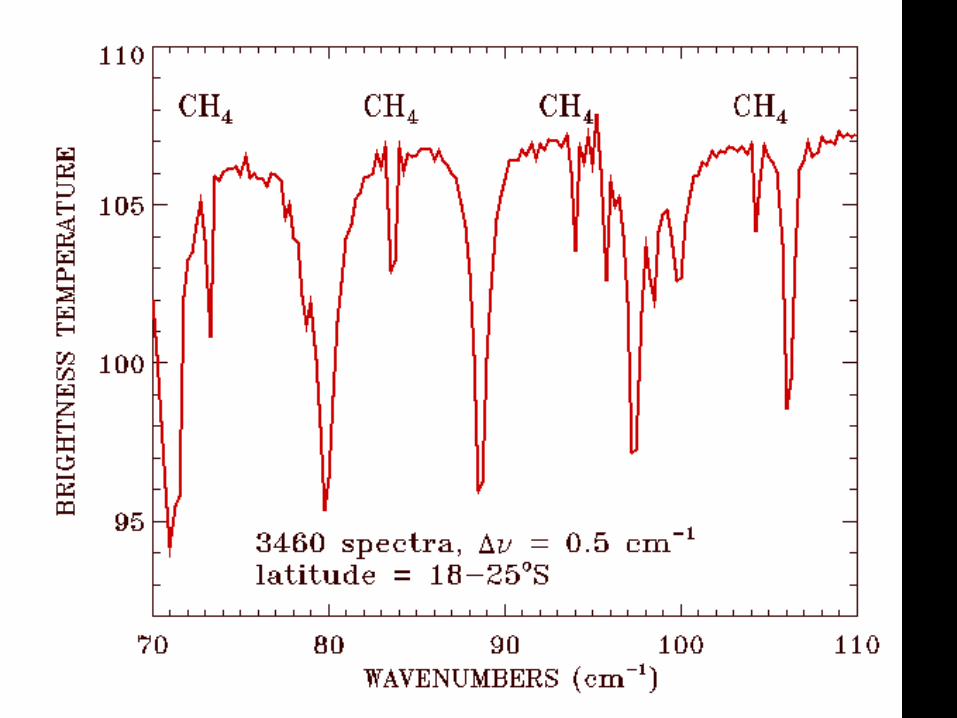
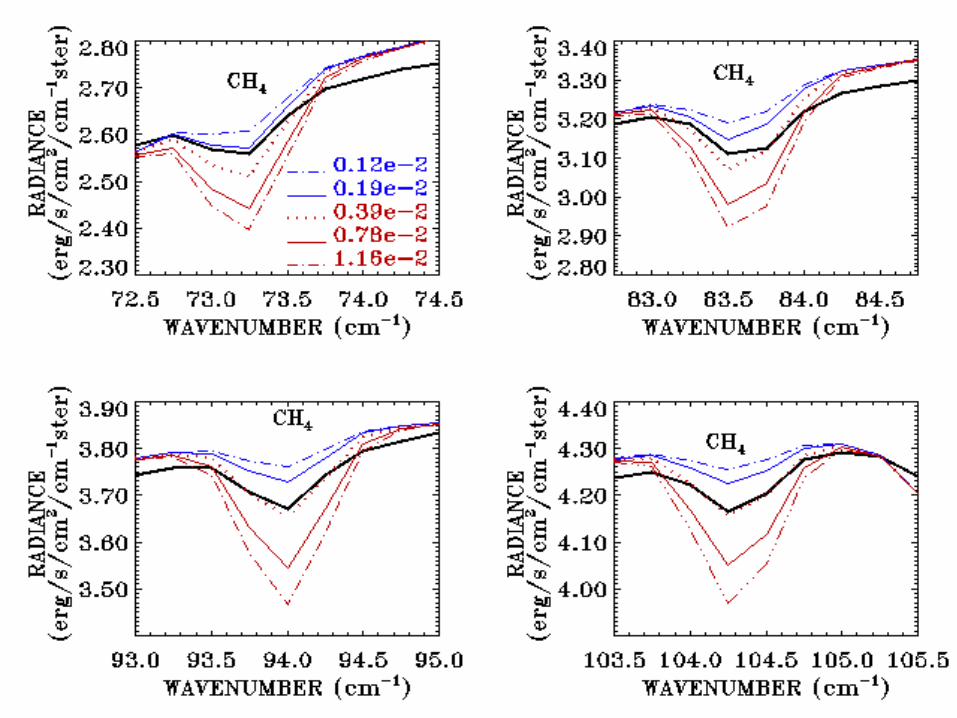

CH4 VMR = 3.9 ± 0.9 x 10⁻³
CH4/H2 = 4.3 ± 1.0 x 10⁻³ (for 88.1% H2)
C/H is 6 ± 2 times solar abundance
This is consistent with an accreting core of 10-12 MEarth (Mizuno 1980; Owen & Encrenaz 2003, 2005)

Orton, Serabyn and Lee(2000) Icarus 146, 48; (2001) Icarus 149, 489.
Reanalysis of data ofWeisstein and Serabyn (1994) Icarus 109, 367.Weisstein and Serabyn (1996) Icarus 123, 23.
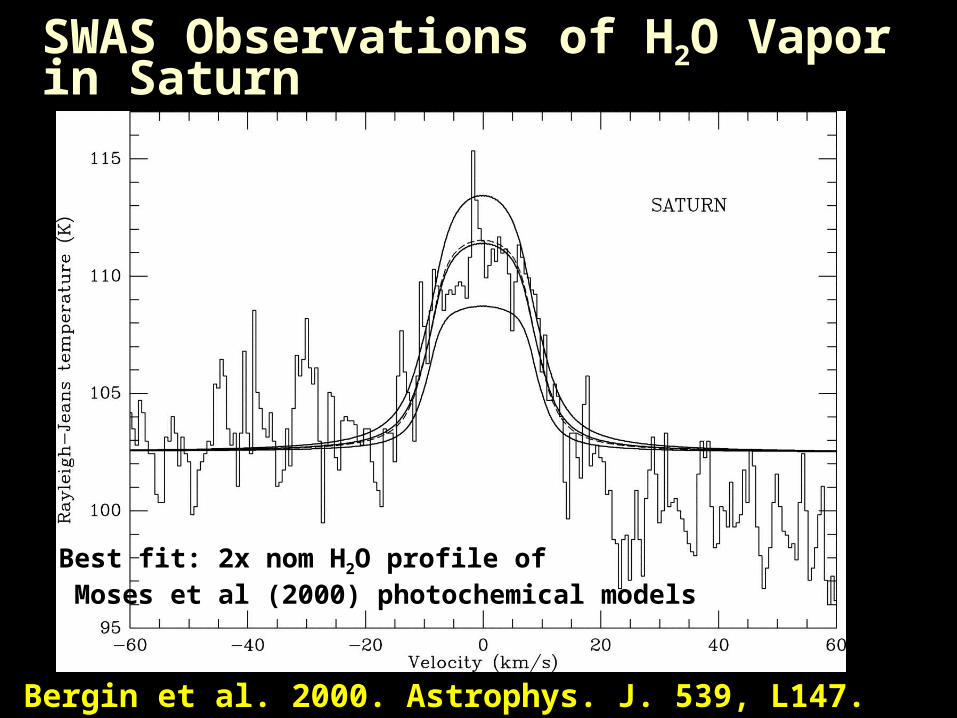
SWAS Observations of H2O Vapor in Saturn
Bergin et al. 2000. Astrophys. J. 539, L147.
Best fit: 2x nom H2O profile of Moses et al (2000) photochemical models

Atmosphere of Uranus

from Griffin and Orton (1993) Icarus 105, 537.
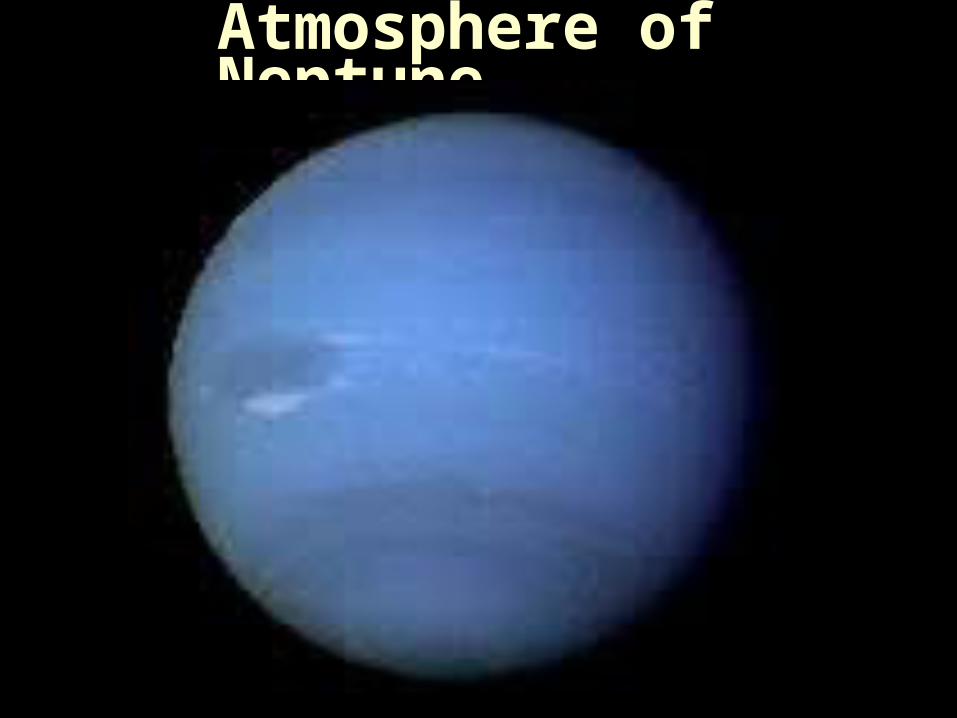
Atmosphere of Neptune
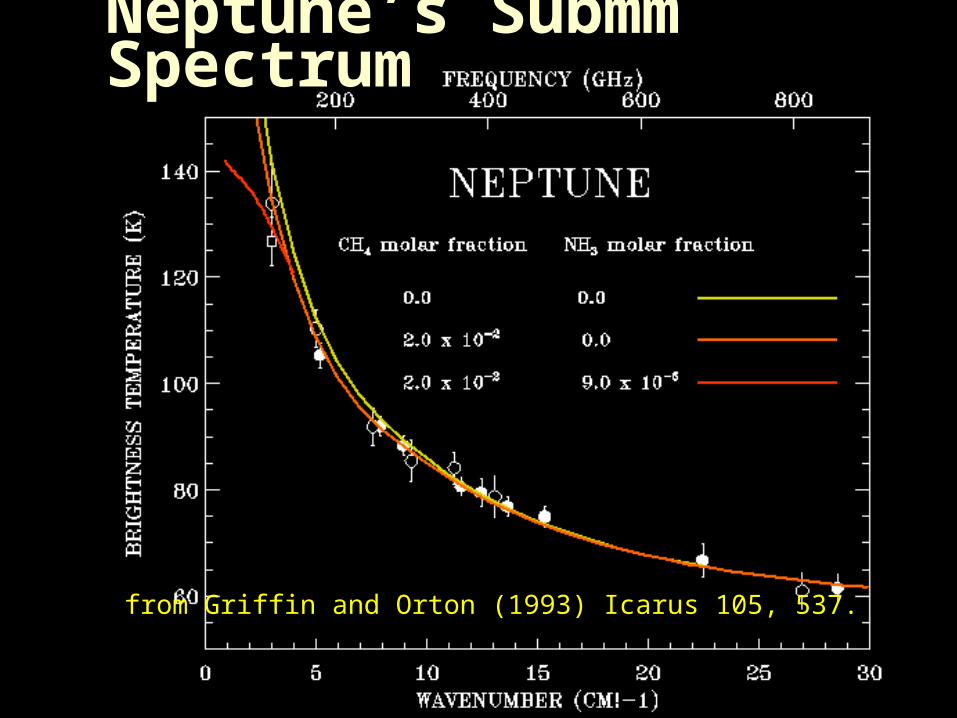
Neptune’s Submm Spectrum
from Griffin and Orton (1993) Icarus 105, 537.

Observations of CO in NeptuneHesman et al. (2005) Submitted to Icarus.
Gurwell (2005) In progress.

Cassini CIRS Observations of Titan
volume mixing ratiosin stratosphere:
CH4 : 1.6 ± 0.5 x 10⁻²
CO : 4.5 ± 1.5 x 10⁻⁵
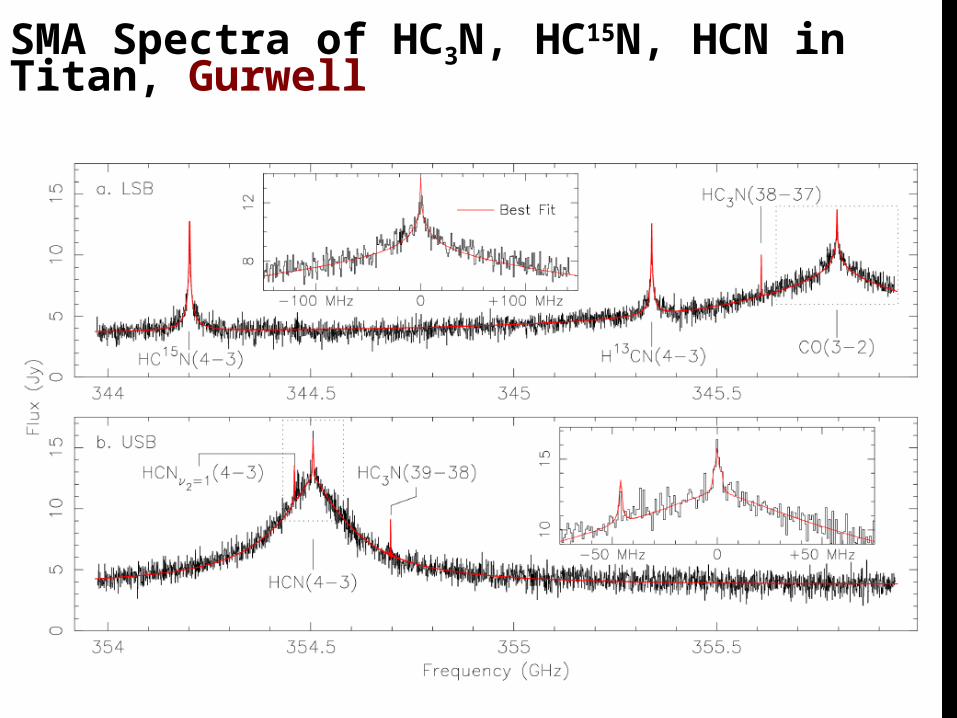
SMA Spectra of HC3N, HC15N, HCN in Titan, Gurwell
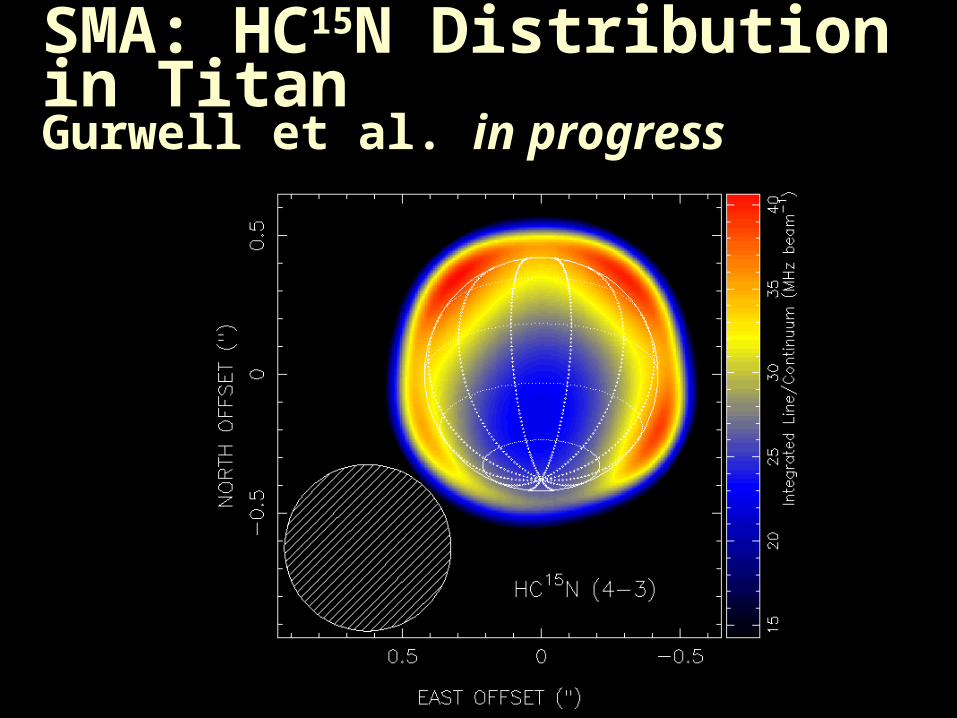
SMA: HC15N Distribution in TitanGurwell et al. in progress
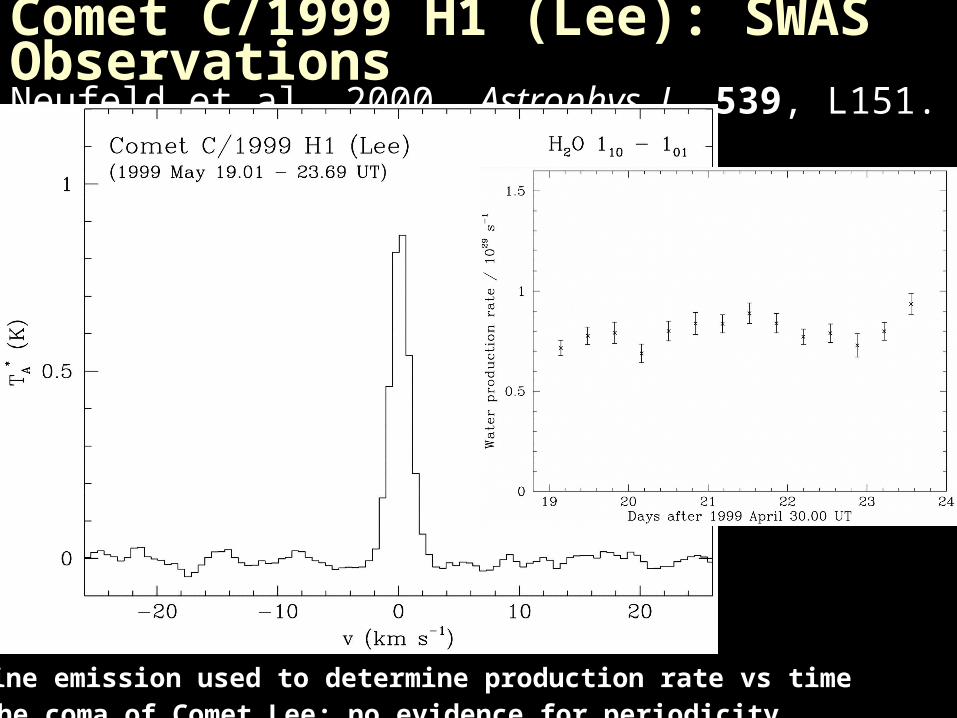
Comet C/1999 H1 (Lee): SWAS ObservationsNeufeld et al. 2000. Astrophys. J. 539, L151.
H2O line emission used to determine production rate vs time in the coma of Comet Lee; no evidence for periodicity

ODIN Observations of Comet Ikeya-Zhang
• 16O/18O ratio is nearly the same as for terrestrial oceans• also consistent with the ratio in Comet Halley

Spectrum is largely consistent with predictions for a standardthermophysical model
ISO LWS observations of Ceres

BB=simple blackbody, eFF=1.0HC=high conductor, rapid rotatorLC=low conductor, slow rotator
From Redman et al. Astron. J. 116, 1478
high conducting, rapid rotating model does best.

From Burgdorf et al. (2000) in “ISO Beyond the Peaks”, 9
ISO/LWS Observations: mineral / ice absorption …or just stray light from Jupiter?

Issues:
Absolute Radiance Calibration
Spectroscopy

Solar-System Objects as Flux Calibrators
Some Herschel instruments plan on using Uranus as a standard submillimeter flux calibrator, with Neptune and Mars as part of a calibration system.
How well-characterized are their fluxes?
How constant are their fluxes?

URANUS STANDARD MODEL SPECTRUM (Griffin and Orton 1993 Icarus 105, 537)
• Based on Voyager-1 IRIS spectra between 200 and 400 cm-1
• Model used to extrapolate spectrum
• Temperature structure derived from 200 – 400 cm-1 spectrum
• Collision-induced H2-H2, H2-He, H2-CH4 absorption
- Molar fraction He = 0.155 ± 0.033 (Conrath et al. 1987 J. Geophys. Res. 92, 15003)
- Molar fraction of CH4 = 0.02 ± 0.01(Orton et al. 1996 Icarus 67, 289, Lindal et al. 1987 J. Geophys. Res. 92, 14987)
• Uncertainty of radiance ~2% between 50 and 500 cm-1
• Extrapolation to longer wavelengths is less certain.

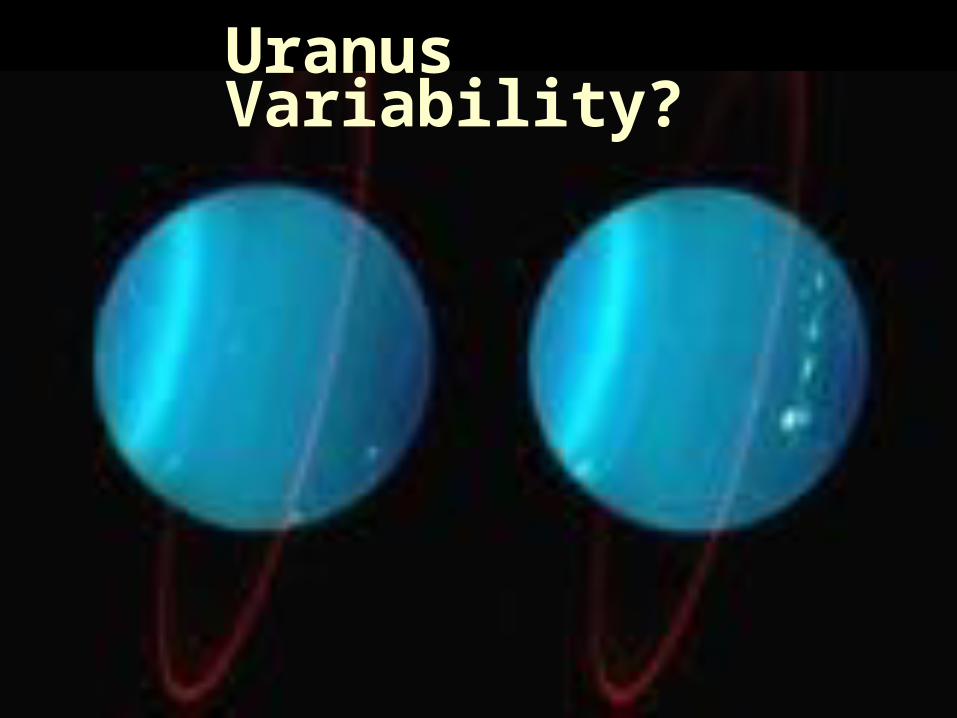
Uranus Variability?

failure of Uranus standard model? (Gurwell)
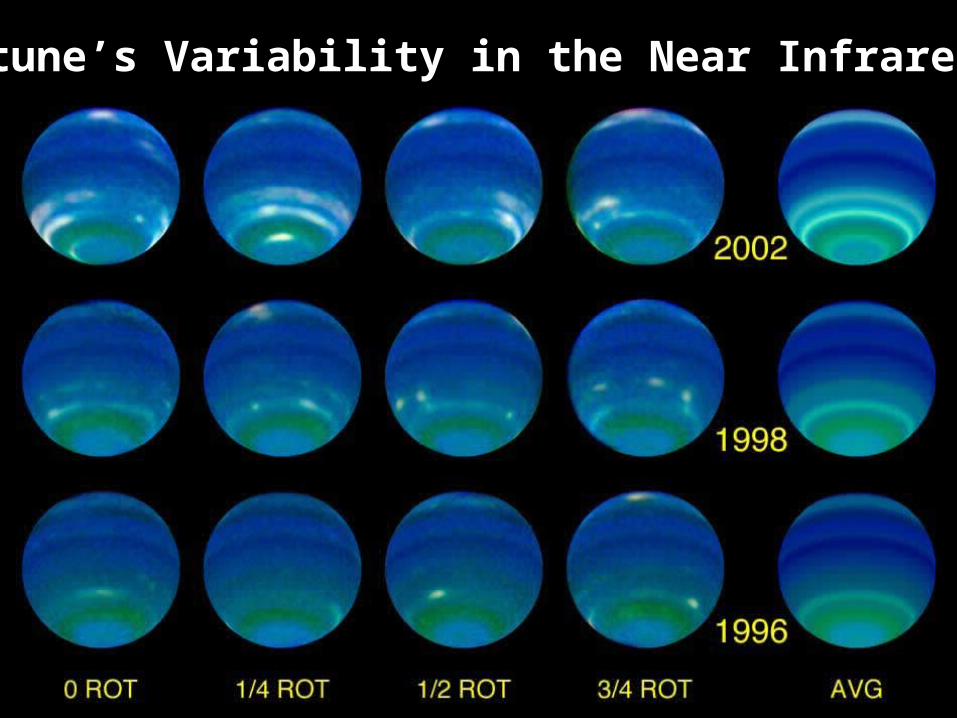
Neptune’s Variability in the Near Infrared

Good correspondence between Rudy Mars thermophysical model and Pardo-Serabyn lunar-based calibration

Rudy et al. thermophysical model for Mars
The model takes into account the viewing geometry and Martian season.
Although it is a good model, there are some problems:-based fundamentally on cm scale (Baars et al.), since measurements were done at 2 & 6 cm at VLA
(though some of it is independent of this);-no roughness;-no subsurface scattering;-no lateral heat transport;-uncertainties with extent and properties of surface CO2 ice;-somewhat outdated surface albedo and emissivity information (based on old Viking information);-no atmosphere.
Despite this, it is probably the state of the art for Mars thermophysical models - but is it good to 1 – 3% (Herschel desire)?

Improvements to the Rudy et al model: incorporate new (in the past 15 years!) spacecraft data.
Wilkinson Microwave Anisotropy Probe observations of the absolute brightness temperature from 20-100 GHz
Cosmic Background Imager data (calibrated against Jupiter, but very accurate, from 28-36 GHz)
VLA observations of bulk dielectric from 5-44 GHz.

Herschel flux calibration strategy, adopted at Dec 2004 workshop:
• Full spectra of Mars and Uranus between 57 and 600 mm for one date (July, 1st, 2007) at 100 MHz resolution
• New workshop!
• Coordinated space- and ground-based observations (cm, mm, submm):
• Simulation of observations Study of various effects (models, pointing, mirror accuracy,
error beam) with output from e.g Mars LMD-Model (R.Moreno)
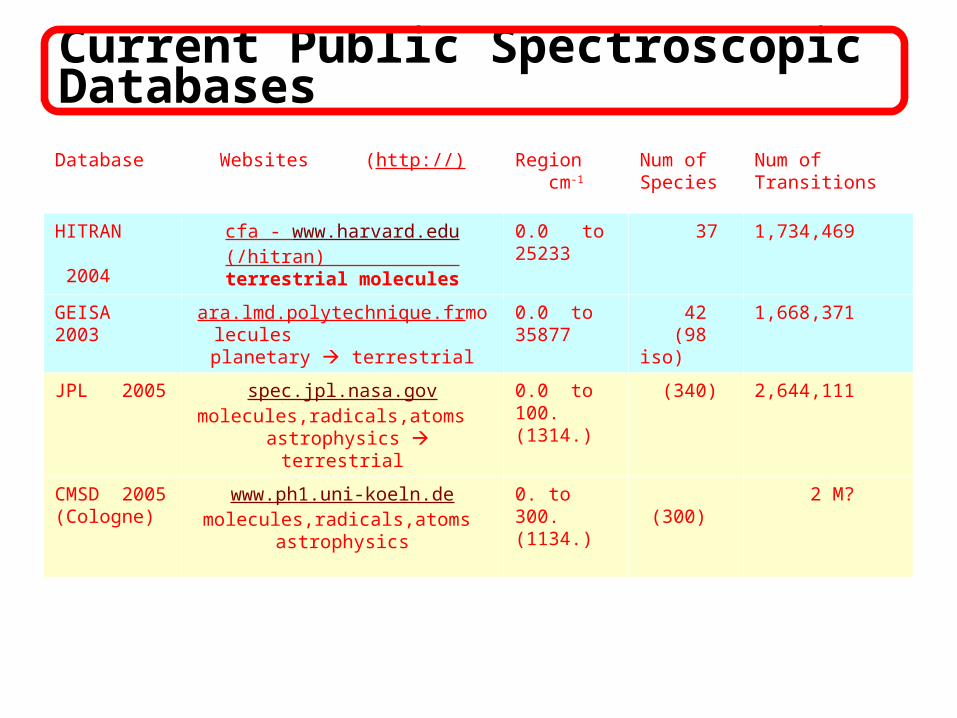
Current Public Spectroscopic Databases
Database Websites (http://) Region cm-1
Num of Species
Num of Transitions
HITRAN 2004
cfa - www.harvard.edu (/hitran) terrestrial molecules
0.0 to 25233
37 1,734,469
GEISA 2003
ara.lmd.polytechnique.frmolecules planetary terrestrial
0.0 to 35877
42 (98 iso)
1,668,371
JPL 2005 spec.jpl.nasa.gov molecules,radicals,atoms astrophysics terrestrial
0.0 to 100. (1314.)
(340) 2,644,111
CMSD 2005 (Cologne)
www.ph1.uni-koeln.de molecules,radicals,atoms
astrophysics
0. to 300. (1134.)
(300)
2 M?

Far-IR CH4 Intensities for ground state transitions in HITRAN and GEISA low by 16%?
HITRAN intensities for Far IR set by one “indirect method”, (calc.) [Hilico et al., J Mol Spec, 122, 381(1987)] with claim of accuracy of ± 30%.
Cassam-Chenai, [JQSRT, 82,251(2003)] predicts ab initio Q branch based on Stark measurements [Ozier et al. Phys Rev Lett, 27,1329, (1971)].The intensities are 16% higher than HITRAN values.
Lab data (left) confirms a higher value for R branch manifolds.
Lab Spectra of Far-IR CH4 (Wishnow)
hitran fit from Orton

Low temperature spectrum of methane
absorption coefficient=-ln(transmission)/(density^2 * path)
First observation of R(3)-R(7) lines
measurements at 0.24 and 0.06 cm-1spectral resolution
Centrifugal distortion dipole lines superposed on collision-induced spectrum.
Dashed line: CH4 Collision-Induced Absorption (CIA) from A. Borysow.
Wishnow, Leung, Gush, Rev. Sci. Inst., 70, 23 (1999)

No public infrared database tailored for submm astronomy
Astronomers often use their own private (undocumented) collections
Basic molecular parameters (positions, intensities) available for dozens, not hundreds, of species
Insufficient attention to line-by-line intensities Pressure broadening coefficients needed (models and
meas.) CIA models need to be validated.