submetering for strategic energy management · approach to energy management ... dominion virginia...
TRANSCRIPT
Submetering For Strategic Energy
Management
August 20, 2003
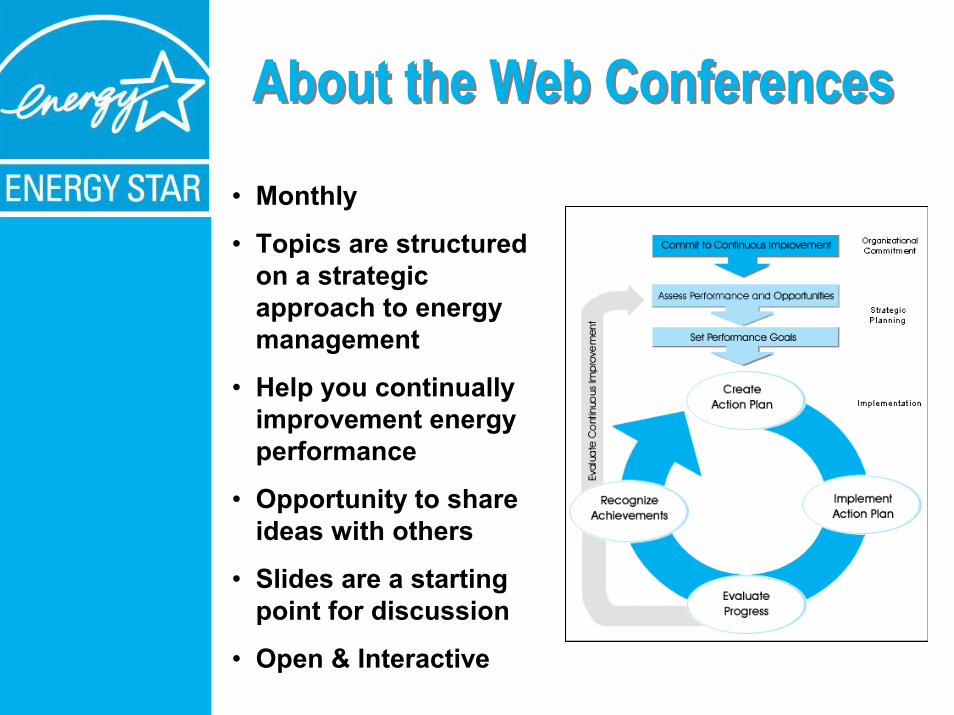
• Monthly
• Topics are structured on a strategic approach to energy management
• Help you continually improvement energy performance
• Opportunity to share ideas with others
• Slides are a starting point for discussion
• Open & Interactive
About the Web ConferencesAbout the Web Conferences

• Welcome• Melinda DeLuca - Miller Brewing Co.• Scott Martin – University of Virginia• Questions & Discussion
Today’s Web ConferenceToday’s Web Conference

• Can provide robust information for setting baselines, benchmarking, and evaluating performance
• Can assist with identifying areas for improvement and trouble shooting
• Can help increase accountability for energy use with an organization
SubmeteringSubmetering

9/11/2003 1
Utility Submetering Program
University of VirginiaFacilities Management
Utilities Department
Submetering Program
University of VirginiaFacilities Management
Utilities Department
Submetering Program

9/11/2003 2
Overview
University of Virginia (UVA) “at a glance”Utility consumption at UVAOrigins and goals of submetering at UVAUVA submetering “at a glance”Submetering decisionsData trackingInformation systemsSubmetering rewardsLessons learnedResources

9/11/2003 3
UVA “At a glance”
Founded by Thomas Jefferson in 1819 – Over 500 facilities including
• Hospital/ patient care• Research/ vivaria• Libraries• Classrooms• Offices
– Over 12 million gross square feet– Over 23,000 students– Over 12,000 faculty and staff

9/11/2003 4
Utility Consumption at UVA
Electricity - Power is primarily distributed to university buildings (almost 90% of the GSF) through four (4) university owned electrical substations. Dominion Virginia power is responsible for their direct service drops to buildings and for the transformer yards in the UVA substations.
• Overall current annual consumption is about 250 million kWh
Steam/ MTHW/ HTHW – Heat is generated at two University plants, the Main Heat Plant, which produces steam, MTHW, and DHW, and the North Grounds plant which produces HTHW.
• Overall current annual production is about 800,000 MMBTU

9/11/2003 5
Utility Consumption at UVA (continued)
Chilled Water– Chilled water is generated at twelve University plants, comprising seven chilled water “loops”, with a combined capacity of almost 25,000 tons.
• Overall current annual production is about 650,000 MMBTU
Natural gas – Overall current consumption is about 400,000 MMBTU

9/11/2003 6
Utility Consumption at UVA (continued)
Oil – Overall current annual consumption is about 12,000 MMBTU
Water - The University owns, maintains, and operates its own storage tanks, pumps and distribution system. Current daily consumption ranges from 0.8 to 1.8 million GPD. Current annual consumption is about 600 million gallons.

9/11/2003 7
Origins and Goals of Submetering at UVA
Origins - Paradigm shift in early 90s – University had few fiscal customers and costs were
apportioned (primarily)– Fiscal complexity grew– Concurrently, the Utilities Department began to dedicate
money to grow the metering base, focusing on larger utility customers and plant systems.
• Utilities director emphasized the need to understand facility consumption to target energy conservation work.
– “You can’t manage what you don’t measure.”

9/11/2003 8
Origins and Goals (continued)
• Energy program is multi-faceted – Traditional Simpler Items (calculated savings)
• lighting retrofits• motor replacements
– Complicated improvements • Studies of infrastructure systems such as
plants or facilities identified as large, or disproportionately large, energy users, through the implementation of metering and comparative reporting.

9/11/2003 9
Origins and Goals (continued)
Goals– Provide Accurate Customer Billing– Target Energy Opportunities– Provide Planning Tool
• Identify plant, infrastructure, and building capacity issues
• Identify production and consumption trends• Benchmarking
– Provide Troubleshooting tool

9/11/2003 10
UVA Submetering “At a glance”
Over 1900 Active Real and Virtual Meters– Over 1300 real meters
• About 750 University meters– About 300 Electric meters– About 200 Water meters (including irrigation,
cooling tower makeup/ blow-down for sewer credits)
– About 100 Chilled water meters– About 50 Steam meters– About 50 MTHW/ HTHW meters

9/11/2003 11
UVA Submetering “At a glance”(continued)
• About 600 Vendor meters, reporting data from utility bills such as periodic consumption information (usually monthly)
– Over 500 virtual meters (Trash Hauling, Building Automation, etc.)
A Variety of Meter Technologies are Installed (all hard-wired or piped)– Ultrasonic, Magnetic, Vortex Shedding, Orifice, Paddle/
Turbine, Venturi, V-Cone, 4-Wire Wye, 3-Wire Delta, Variable Area, Disc

9/11/2003 12
Submetering Decisions
Established priorities for submetering are multifold:– Regulatory requirements.
• Run-time on emergency generators for Title V.• Fuel consumption at heating plants for air-permitting,
etc.– Utility plants to track efficiencies and help reconcile plant
production/distribution to facility use.– Large consumers.– Auxiliary consumers.– Special data needs (especially relates to connecting
metering to BAS such as with vivaria).– Opportunistic (new construction/ renovation).

9/11/2003 13
Data Tracking
Basically a few mechanisms: – In-house meters, read monthly (more and more linked to
BAS for real-time/ near real-time trending).– Vendor bills received either monthly or as commodities
are delivered (oil for example).
On-line examples of meter readings.

9/11/2003 14
Information Systems
In-house developed system– Origins for metering in
• Dbase;• Access, Access w/ Gupta SQLBase, Access w/
Microsoft SQL Server;• Visual Basic w/ SQL Server;• Currently Visual Studio.NET (web-based) w/ SQL
Server.

9/11/2003 15
Submetering Rewards
Jordan Hall (an example)Planning (Plant/ Infrastructure Loading & Profiles)Annual Report (http://utilities.fm.virginia.edu/anrpt.htm)EPA & other awardsDrought– Metering the use of water in closed loop heating and
cooling systems to track leaks and repair them.– Metering the use of water through master meters to
assess progress.Reviewing metering data to target high water consumption (leaks, process cooling, etc.)

9/11/2003 16
Lessons Learned (Tips)
Successful metering takes work! – Contractors may not have familiarity with correctly installing
and configuring meters. They often welcome your help.• Don’t hesitate to get involved with installation/
commissioning.Metering helps bring control problems to forefront (Jordan Hall steam/ chw example).Sometimes we don’t understand what the meters are telling us! Reconciling plants vs consumers helps work out anomalies.Building Automation System (BAS) resets
9/11/2003 17
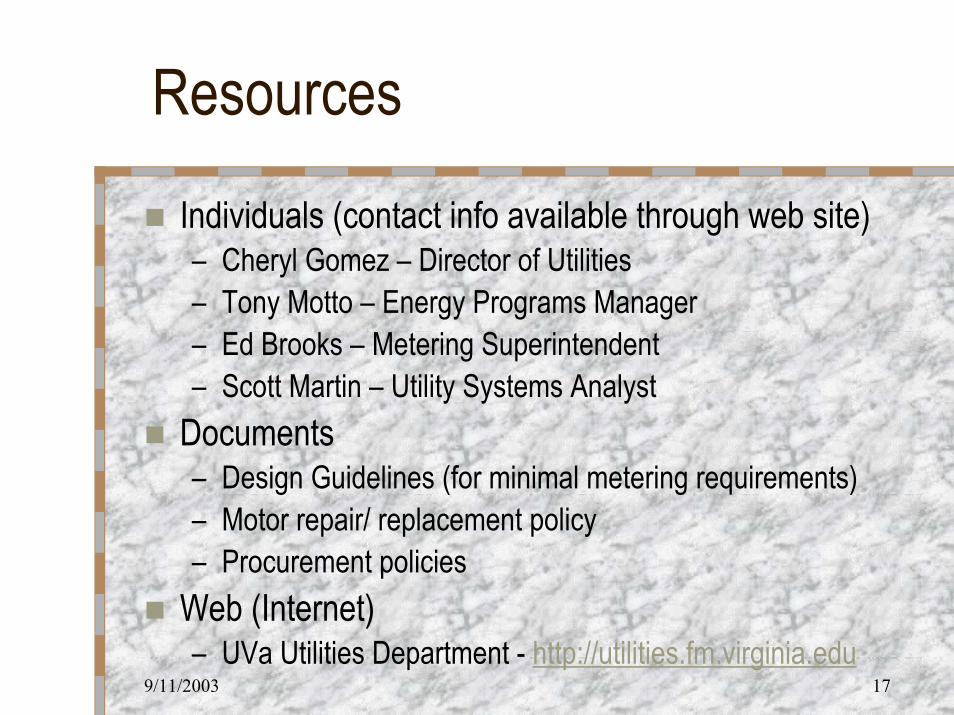
Resources
Individuals (contact info available through web site)– Cheryl Gomez – Director of Utilities– Tony Motto – Energy Programs Manager– Ed Brooks – Metering Superintendent– Scott Martin – Utility Systems Analyst
Documents– Design Guidelines (for minimal metering requirements)– Motor repair/ replacement policy– Procurement policies
Web (Internet)– UVa Utilities Department - http://utilities.fm.virginia.edu

9/11/2003 18
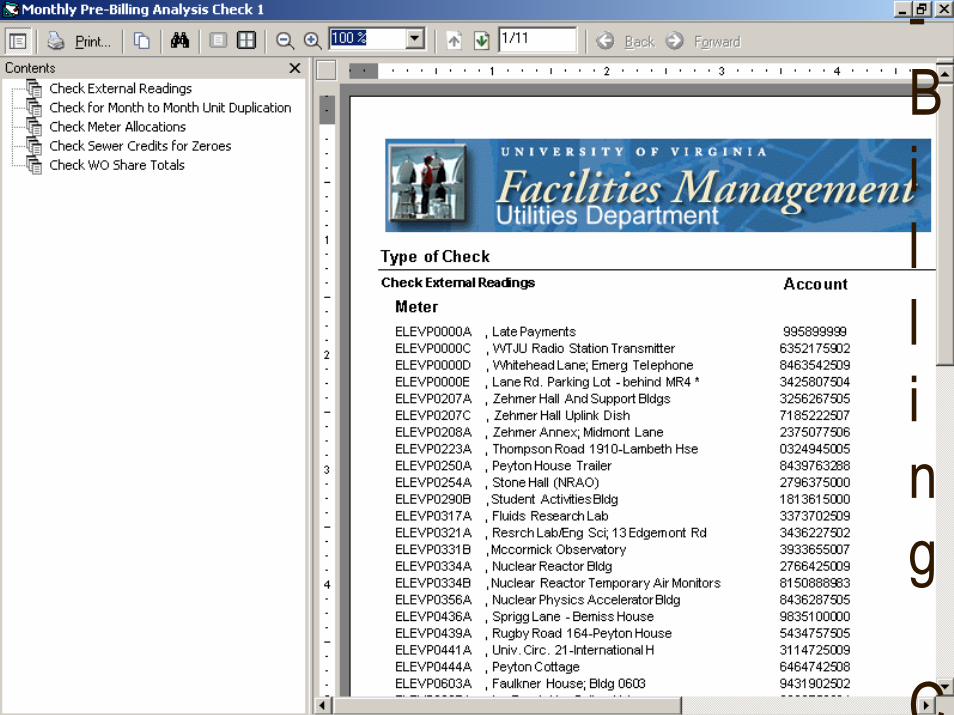
Sample Reports
Meter PlanMeters Needing ActionPlant ReconciliationMonthly Pre-Billing ChecksBuilding Cost SummaryBuilding Cost History

9/11/2003 19
er
Plan

9/11/2003 20
eding
Acti

9/11/2003 21
conciliati
9/11/2003 22
-Billing
C
9/11/2003 23
-Billing
C

9/11/2003 24
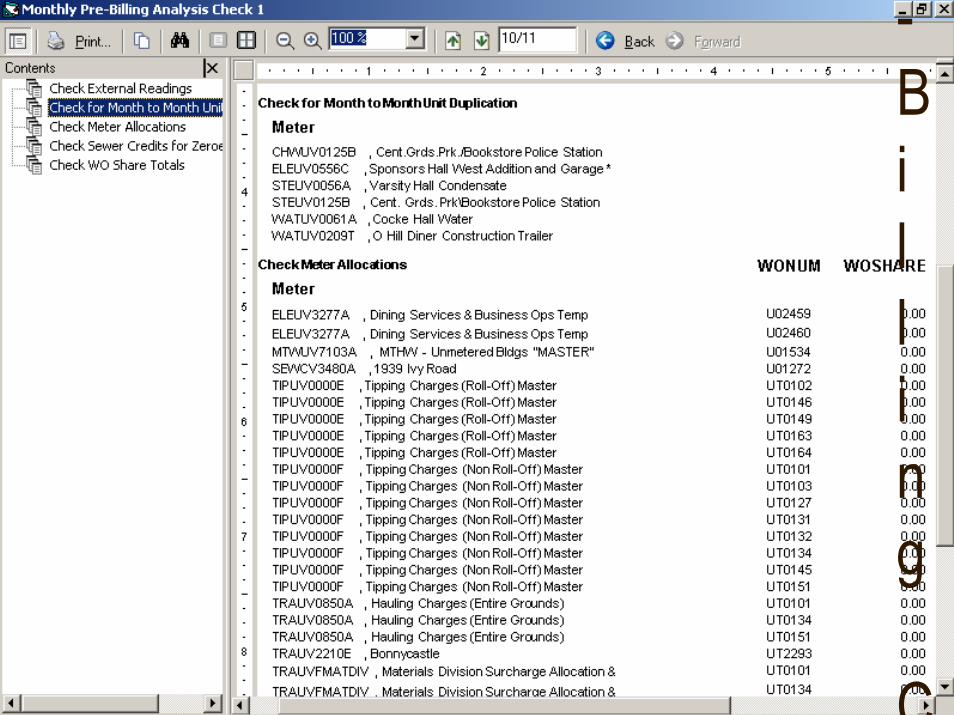
Monthly Pre-Billing Check

9/11/2003 25
Monthly Pre-Billing Check

9/11/2003 26
Monthly Pre-Billing Check

9/11/2003 27
Monthly Pre-Billing Check

9/11/2003 28
Monthly Pre-Billing Check

9/11/2003 29
-Billing
C
9/11/2003 30
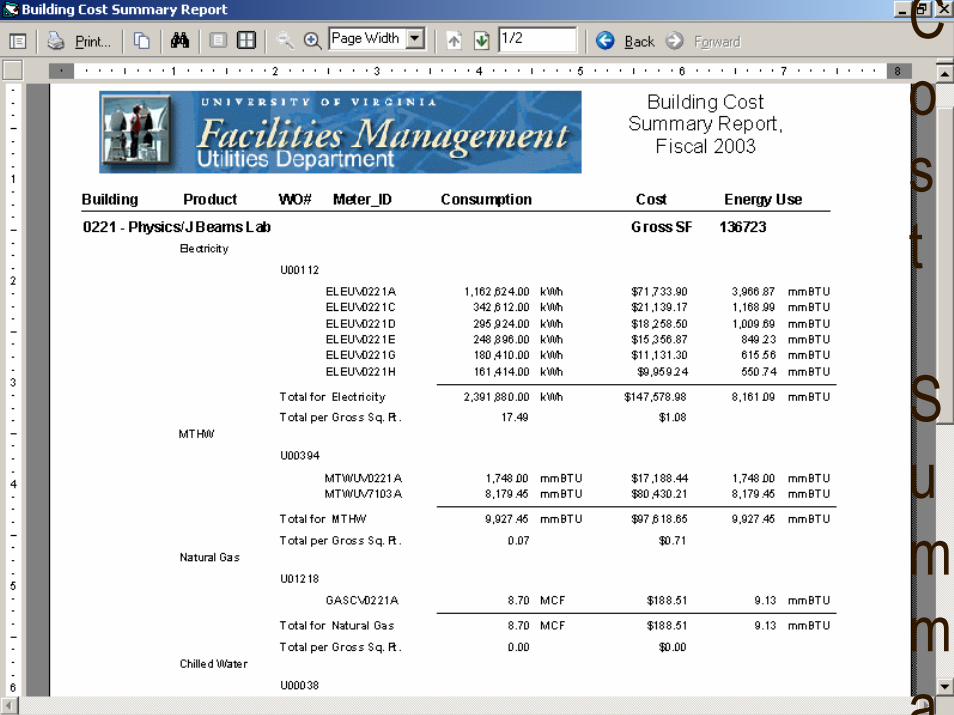
Cost
Summa

9/11/2003 31
Cost
Histo

9/11/2003 32
Graph Samples
Electric Consumption TrendsChiller Plants performanceBenchmarks – Facility EnergyBenchmarks – Facility Energy by Category (Summary)Benchmarks – Facility Energy by Category (Detail)

9/11/2003 33
sumption
T

9/11/2003 34
nts
Perfor

9/11/2003 35
Facility

9/11/2003 36
Benchmarks – Facility Energy by Category (Summary)

9/11/2003 37
Benchmarks – Facility Energy by Category (Detail)

9/11/2003 38
Questions?
Thanks and feel free to ask questions!

ENERGY METERING AND
BENCHMARKING
8/20/2003
08/20/200308/20/2003Melinda DeLucaMelinda DeLuca
Manager Utilities and EnergyManager Utilities and EnergyCorporate EngineeringCorporate Engineering

2August 20, 2003
Miller Brewing Company
• Owned by SABMiller plc
• SABMiller plc is one of the world’s largest brewers, with 2002/03 lager volumes inexcess of 115 million hectolitres. It has a brewing presence in over 40 countriesacross four continents and a portfolio of strong brands and leading market shares inmany of the countries in which it has brewing operations. Outside the USA,SABMiller plc is one of the largest bottlers of Coca-Cola products in the world.
• MBC has 6 major breweries in the US - Headquarters located in Milwaukee, WI
• The process of making beer is very energy intensive.

3August 20, 2003
Brewery Utility Systems
• Steam Boilers
– steam produced at 125, 600 and 850 psig
– co-generation for electric production
• Compressed Air - control systems
• Refrigeration - process and beer aging cellar cooling
• Carbon Dioxide - collection from brewing, purification and used in packaging
• Electricity - purchased, self-generated with gas fired turbines and steam turbinegenerators
• Water Treatment - ensures product taste and mouth feel of beer are consistent forMBC brands
• Waste water - aerobic and anaerobic with methane gas production used in boilers

4August 20, 2003
Metering & Benchmarking - Energy Strategy
• MBC’s 3 year energy strategy will establish criteria for energy efficiency and lowcost operation by benchmarking, and then auditing against the plan while ensuringreliable supply for both purchased and self-generated energy
• Some Components of Strategy
– 1) Benchmark Usage
– 2) Energy user departments held accountable for benchmark goals

5August 20, 2003
Existing Meters
• MBC has not standardized on meters or totalizers
• Data collection from meters includes:
– monthly operator “rounds” to manually read meters
– monthly operator “rounds” to electronically download meters
– Ethernet network system of meters - electrical switchgear for departments
• PowerLogic - Schneider Electric
• Most report generation is into spreadsheets which gets rolled up into Corporatereporting and tracking
• System of metering method not as important as what is done with the data forexisting MBC systems
6August 20, 2003
Metering In the Future for MBC
• Add additional sub-meters to complete metering for all the plants and departments
• Further evaluate web based systems for metering and reporting
• Wireless
• Reduce report generation times

7August 20, 2003
Electricity Metering
• Incoming lines - purchase from local Utility
• Departments within Brewery - some overlapping depending on physical location
– Meters located at substations
– Utilities (air compressors, CO2 purification system, refrigeration)
– Brewing
– Packaging
– Wastewater
• Co-Generation from turbine generators
• Reported as Kwh/ bbl of packaged beer

8August 20, 2003
Water Metering
• Incoming water lines into the plant
• Raw material for the process- metered in the brewing process for product quality
• Reported as bbl of water/ bbl packaged beer
• Wastewater also tracked to complete water balance in the brewery

9August 20, 2003
Fuels Metering
• Coal
– reported based upon delivery
– coal pile inventory 1-3 days so slight variation month to month
• Fuel Oil
– flow meter at boilers
• Natural Gas
– based upon Utility bill
• Fuels reported on therm / bbl of packaged beer (1 therm = 100,000 Btu)

10August 20, 2003
Benefits of Metering
• Provides basis for reducing operating costs
• Establishes a baseline for usage
– When the plant is down what is the usage rate
» - helps to determine losses in the system ie cost savings opportunities
» compressed air leaks, lights on, water and steam leaks
• Metering by department and plant provides
– departmental operating budgeting - cost / bbl of beer
– accountability for troubleshooting system losses
– usage rate trends by processing areas

11August 20, 2003
Spending $’s to Meter Will Not ProvideSavings If:
• Metering of utilities without a clear reason why to meter - example high cost
• Metering sub-headers with low usage - better to install in lines with biggestopportunity, highest cost utility
• Metering without plans to generate meaningful reports are wasted $’s
• Too much data is not necessarily a “good thing” - tracking 15 minutes intervals mayhelp if on Real time pricing and plant is load shedding.
• Purchase the least cost meter to provide wanted results - measurement ofdisturbance monitoring, harmonic analysis may not be needed in areas of reliableelectric supply.
• Meters measuring and reporting power factor may only be helpful if plant can effectthe power factor with synchronous motors, capacitors or generation

12August 20, 2003
Savings Due To Metering More Likely When:
• Results are reported and reviewed at Management level responsible for operatingcosts.
– MBC reports and reviews monthly with VP of Operations
– Brewery and departments are held accountable
• Attainable usage goals for the breweries are established which are based upon pastusage rates and industry benchmarking
• Meters are kept calibrated otherwise may lose confidence in the usage rates
• Difficult to justify spending large capital dollars for installing meters without supportfrom management to reduce operating costs

13August 20, 2003
Questions?

Upcoming Web ConferencesUpcoming Web Conferences
September 17, 2003 Identifying Projects & Creating Effective Action Plans
October 22, 2003 Increasing Energy Performance Across the Organization

Thank you for participating!