submarine venting of liquid carbon dioxide on a … of the overlying water column plumes indicated...
TRANSCRIPT
Submarine venting of liquid carbon dioxide on a MarianaArc volcano
John LuptonNOAA/Pacific Marine Environmental Laboratory, 2115 SE O.S.U. Drive, Newport, Oregon 97365-5258, USA([email protected])
David ButterfieldJISAO/University of Washington, 7600 Sand Point Way NE, Seattle, Washington 98115-6349, USA
Marvin LilleySchool of Oceanography, University of Washington, Seattle, Washington 98195, USA
Leigh EvansCIMRS/Oregon State University, 2115 SE O.S.U. Drive, Newport, Oregon 97365-5258, USA
Ko-ichi NakamuraNational Institute of Advanced Industrial Science and Technology, Tsukuba, Ibaraki 305-8567, Japan
William Chadwick Jr.CIMRS/Oregon State University, 2115 SE O.S.U. Drive, Newport, Oregon 97365-5258, USA
Joseph ResingJISAO/University of Washington, 7600 Sand Point Way NE, Seattle, Washington 98115-6349, USA
Robert EmbleyNOAA/Pacific Marine Environmental Laboratory, 2115 SE O.S.U. Drive, Newport, Oregon 97365-5258, USA
Eric OlsonSchool of Oceanography, University of Washington, Seattle, Washington 98195, USA
Giora ProskurowskiSchool of Oceanography, University of Washington, Seattle, Washington 98195, USA
Now at Department of Marine Chemistry and Geochemistry, Woods Hole Oceanographic Institution, Woods Hole,Massachusetts 02543, USA.
Edward BakerNOAA/Pacific Marine Environmental Laboratory, 7600 Sand Point Way NE, Seattle, Washington 98115-6349, USA
Cornel de RondeInstitute of Geological and Nuclear Sciences, 30 Gracefield Road, P.O. Box 31312, Lower Hutt, New Zealand
Kevin RoeJISAO/University of Washington, 7600 Sand Point Way NE, Seattle, Washington 98115-6349, USA
G3G3GeochemistryGeophysics
Geosystems
Published by AGU and the Geochemical Society
AN ELECTRONIC JOURNAL OF THE EARTH SCIENCES
GeochemistryGeophysics
Geosystems
Article
Volume 7, Number 8
10 August 2006
Q08007, doi:10.1029/2005GC001152
ISSN: 1525-2027
ClickHere
for
FullArticle
Copyright 2006 by the American Geophysical Union 1 of 20

Ronald GreeneCIMRS/Oregon State University, 2115 SE O.S.U. Drive, Newport, Oregon 97365-5258, USA
Geoff LebonJISAO/University of Washington, 7600 Sand Point Way NE, Seattle, Washington 98115-6349, USA
Conrad Young6450 Eagles Crest Road, Ramona, California, 92065, USA
[1] Although CO2 is generally the most abundant dissolved gas found in submarine hydrothermal fluids, itis rarely found in the form of CO2 liquid. Here we report the discovery of an unusual CO2-richhydrothermal system at 1600-m depth near the summit of NW Eifuku, a small submarine volcano in thenorthern Mariana Arc. The site, named Champagne, was found to be discharging two distinct fluids fromthe same vent field: a 103�C gas-rich hydrothermal fluid and cold (<4�C) droplets composed mainly ofliquid CO2. The hot vent fluid contained up to 2.7 moles/kg CO2, the highest ever reported for submarinehydrothermal fluids. The liquid droplets were composed of �98% CO2, �1% H2S, with only traceamounts of CH4 and H2. Surveys of the overlying water column plumes indicated that the vent fluid andbuoyant CO2 droplets ascended <200 m before dispersing into the ocean. Submarine venting of liquid CO2
has been previously observed at only one other locality, in the Okinawa Trough back-arc basin (Sakai etal., 1990a), a geologic setting much different from NW Eifuku, which is a young arc volcano. Thediscovery of such a high CO2 flux at the Champagne site, estimated to be about 0.1% of the global MORcarbon flux, suggests that submarine arc volcanoes may play a larger role in oceanic carbon cycling thanpreviously realized. The Champagne field may also prove to be a valuable natural laboratory for studyingthe effects of high CO2 concentrations on marine ecosystems.
Components: 10,100 words, 12 figures, 3 tables, 2 videos.
Keywords: carbon dioxide; Mariana; submarine; volcano.
Index Terms: 1031 Geochemistry: Subduction zone processes (3060, 3613, 8170, 8413); 3017 Marine Geology and
Geophysics: Hydrothermal systems (0450, 1034, 3616, 4832, 8135, 8424); 4832 Oceanography: Biological and Chemical:
Hydrothermal systems (0450, 1034, 3017, 3616, 8135, 8424).
Received 27 September 2005; Revised 26 April 2006; Accepted 16 May 2006; Published 10 August 2006.
Lupton, J., et al. (2006), Submarine venting of liquid carbon dioxide on a Mariana Arc volcano, Geochem. Geophys. Geosyst.,
7, Q08007, doi:10.1029/2005GC001152.
1. Introduction
[2] While considerable effort has been devoted toexploring for submarine hydrothermal activityalong the global mid-ocean ridge (MOR) systemwhere tectonic plates are diverging, very little isknown about the distribution and intensity ofsimilar submarine activity on volcanic arcs whereplates converge. de Ronde et al. [2001] made thefirst systematic study of hydrothermal activity inthis tectonic setting along the southern KermadecArc. Their water column plume surveys showedthat a substantial portion of the submarine volca-noes there are hydrothermally active [de Ronde etal., 2001]. Furthermore, in contrast to MOR activ-ity that is mainly confined to the depth range of2000–2500 m, the Kermadec Arc volcanoes were
found to be introducing hydrothermal effluent at awide variety of ocean depths, ranging from 100 to1800 m.
[3] During February–March 2003, as part of theSubmarine Ring of Fire (SROF) project funded byNOAA’s Ocean Exploration Program, the R/VThomas G. Thompson conducted a comprehensivesurvey of submarine hydrothermal activity along asecond volcanic arc, the Mariana Arc from 13.5�Nto 22.5�N [Embley et al., 2004]. Plume surveyswere conducted in the water column above �50Mariana Arc submarine volcanoes using a CTD/rosette system that included an Eh sensor formeasuring in-situ oxidation-reduction potential. Atotal of 70 CTD casts were completed, and discretewater samples were collected for analysis of a
GeochemistryGeophysicsGeosystems G3G3
lupton et al.: submarine venting of liquid co2
10.1029/2005GC001152
2 of 20

variety of hydrothermal tracers, including 3He,CH4, CO2, H2S, Fe, Mn, pH, and suspendedparticles. The analysis of these samples showedthat 12 of the Mariana Arc submarine volcanoessurveyed had active hydrothermal discharge. Ofthese, 8 were new sites and 4 were volcanoespreviously known to be hydrothermally active[see Embley et al., 2004]. The newly discoveredactivity included that on NW Eifuku, a smallvolcanic cone located at 21.49�N, 144.04�E thatrises to a depth of �1535 m below sea level(Figures 1 and 2). NW Eifuku is the deepest in acluster of 3 volcanoes that includes the largerneighboring volcanoes Daikoku and Eifuku. Thewater column samples collected over NW Eifukuin 2003 had excess concentrations of 3He, CO2,CH4, Fe, and Mn, as well as pH, light backscat-tering (suspended particle), and Eh anomalies, allconfined to the depth range of 1490 to 1620 m[Lupton et al., 2003; Resing et al., 2003].
2. Discovery of the Champagne Site
[4] The second phase of the SROF project con-sisted of a follow-up expedition aboard the R/VT.G. Thompson in March–April 2004 employingthe remotely-operated vehicle (ROV) ROPOS todirectly explore and sample a selected group of theMariana Arc submarine volcanoes. Three ROVdives were devoted to exploring NW Eifuku.Approximately 8 hours into the first dive, at adepth of 1604 m, ROPOS discovered a remarkable
hydrothermal field (later named Champagne) withsmall white chimneys discharging buoyant milkyfluid. Subsequent surveys with the ROV locatedseveral additional sites of hydrothermal dischargeon NW Eifuku, although the most intense ventingwas found at the Champagne site �80 m WNW ofthe volcano summit. The summit of NW Eifukuwas mapped with an Imagenex scanning sonar onROPOS (Figure 2c), following the methods de-scribed by Chadwick et al. [2001]. The high-resolution bathymetry shows that the Champagnevent field lies in the steep headwall of a gravita-tional slope failure that cuts across the top and SWside of the volcano [Chadwick et al., 2004].Although there were few vent animals right at theChampagne site, an extensive biological commu-nity was found within the surrounding few hundredmeters, including mussels, shrimps, crabs andlimpets.
[5] In addition to the vent fluid discharge atChampagne vent, droplets coated with a milkyskin were rising slowly from the seafloor aroundthe chimneys (Figure 3). The droplets were laterdetermined to consist mainly of liquid CO2, withH2S as a secondary component. The seafloor areaof active CO2 droplet flux was characterized bypumice and whitish/yellowish sulfur-rich material.The droplets were sticky and adhered to the ROVlike clumps of grapes, although they did not tend tocoalesce into larger droplets (Figure 3e). The filmcoating the droplets was assumed to be CO2
hydrate (or clathrate) which is known to form
Figure 1. (a) Location map for NW Eifuku in the Mariana Arc. (b) Oblique 3-D representation of NW Eifukuviewed from the southwest, generated from EM300 bathymetry. No vertical exaggeration. Depths range from 1550 to3000 m.
GeochemistryGeophysicsGeosystems G3G3
lupton et al.: submarine venting of liquid co2
10.1029/2005GC001152lupton et al.: submarine venting of liquid co2
10.1029/2005GC001152
3 of 20

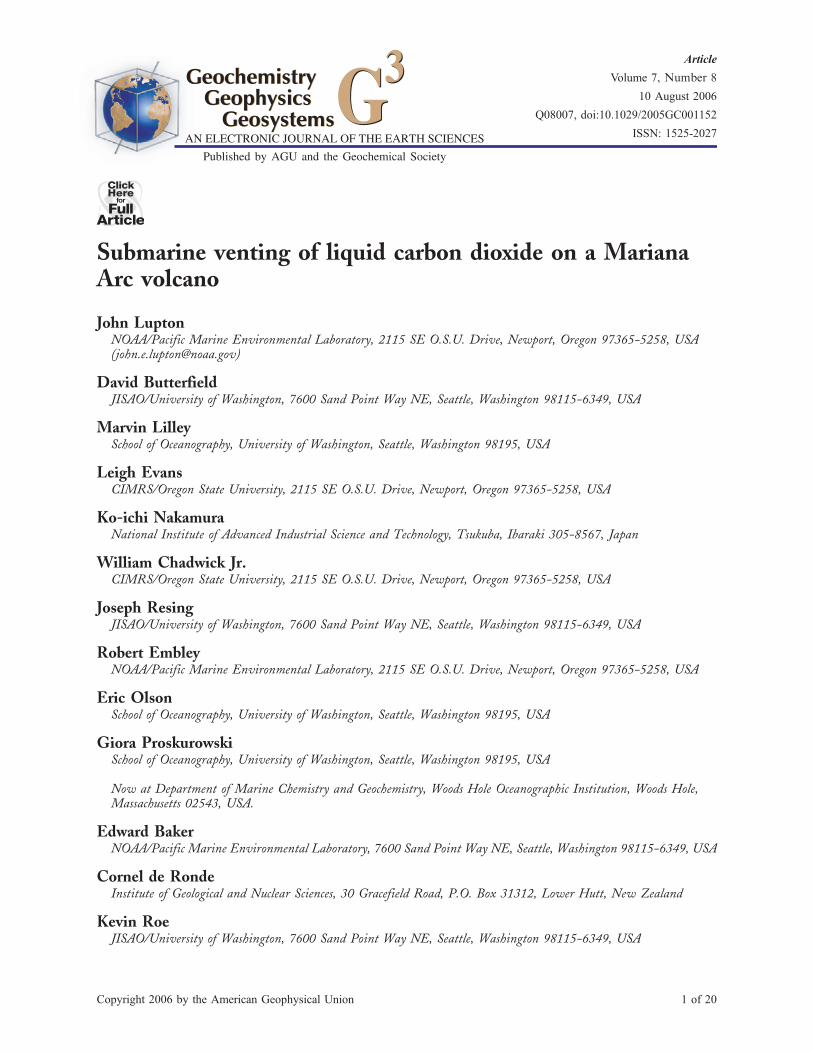
whenever liquid CO2 contacts water under these P,T conditions [Sloan, 1990]. Liquid CO2 should bebuoyant at the depth of the Champagne site, sinceit has a density less than seawater at depthsshallower than about �2600 m [Brewer et al.,1999]. At NW Eifuku, droplets percolated out ofcrevices in the seafloor, and we did not observe theformation of small hydrate pipes as noted at theJADE site in the Okinawa Trough [Sakai et al.,1990a]. The flux of liquid CO2 droplets increaseddramatically whenever the seafloor was disturbedby the ROV. This observation is consistent with thepresence of a layer of liquid CO2 beneath thesurface capped by an impeding layer of CO2
hydrate (see Figure 4). Thus any penetration ofthe hydrate cap releases the buoyant liquid CO2
beneath. These observations are similar to thosereported by Sakai et al. [1990a], who discoveredventing of liquid CO2 in the Okinawa Troughback-arc basin. A comparison of the video fromboth sites indicates a higher flux of CO2-richdroplets at NW Eifuku compared to the JADE site(see Figure 3 caption).
[6] In October–November of 2005 we had asecond opportunity to collect samples at NWEifuku during cruise NT05-18 aboard the R/VNatsushima. During the Natsushima cruise, theROV Hyper-Dolphin completed 6 dives on NWEifuku, 2 on the volcano flanks and 4 on thesummit area. During this expedition, the Hyper-Dolphin collected additional samples of both thevent fluids and liquid droplets at the Champagnesite.
3. Methods
[7] Samples of the Champagne vent fluid werecollected in special gas-tight, all-metal bottlesconstructed of titanium alloy. The bottles, whichhave an internal volume of �150 ml, were initiallyevacuated. After the connecting lines were flushed,the bottle inlet was opened using a hydraulicactuator, and then hydrostatic pressure quicklyforced the vent fluid sample into the bottle. Atthe end of the ROV dive, the samples wereprocessed on board the ship using a high vacuumextraction line equipped with a low temperature(�60�C) trap and an all-metal bellows pump(Figure 5). The sample was first dropped fromthe gas-tight bottle into an evacuated glass flaskcontaining �1 g of sulfamic acid. The acid lowersthe pH of the fluid, thereby aiding in the extractionof CO2 and other dissolved gases. The bellowspump was then used to pump the exsolved gases
Figure 2. (a) Bathymetric map showing locations ofDaikoku, Eifuku, and NW Eifuku submarine volcanoes.Box shows location of Figure 2b. (b) Detailedbathymetric map of NW Eifuku. Box shows locationof Figure 2c. (c) High-resolution bathymetry of thesummit of NW Eifuku, showing location of theChampagne site and Sulfur Dendrite (SD) and CliffHouse (CH) vent sites. This high-resolution bathymetrywas collected using the Imagenex sonar system mountedon the ROPOS ROV [Chadwick et al., 2001, 2005].
GeochemistryGeophysicsGeosystems G3G3
lupton et al.: submarine venting of liquid co2
10.1029/2005GC001152
4 of 20

through the drying trap into a calibrated volume.After the pumping was completed, the totalamount of gas was measured using a high preci-sion capacitance manometer attached to the cali-
brated volume. Then splits of the dry gas weresealed into glass ampoules. For rare gas measure-ments, the ampoules were constructed of type1720 or 1724 aluminosilicate glass with low heli-
Figure 3. Photographs of the Champagne hydrothermal site taken with the ROPOS ROV. (a, b, and c) Smallchimneys venting 103�C vent fluid. Liquid CO2 droplets are also visible. (d) Close-up of liquid CO2 droplets rising ina stream from the seafloor. (e) Liquid CO2 droplets collecting on the underside of the ROV bumper-bar and camera.(f) Mussel bed only tens of meters from the Champagne vent site. See also Movies 1 and 2. Additional photographsand video clips from the 2004 Submarine Ring of Fire expedition and from NW Eifuku in particular are available atthe Ocean Exploration Web site: http://oceanexplorer.noaa.gov/explorations/04fire/logs/april10/april10.html andhttp://oceanexplorer.noaa.gov/explorations/04fire/logs/photolog/photolog.html.
GeochemistryGeophysicsGeosystems G3G3
lupton et al.: submarine venting of liquid co2
10.1029/2005GC001152
5 of 20
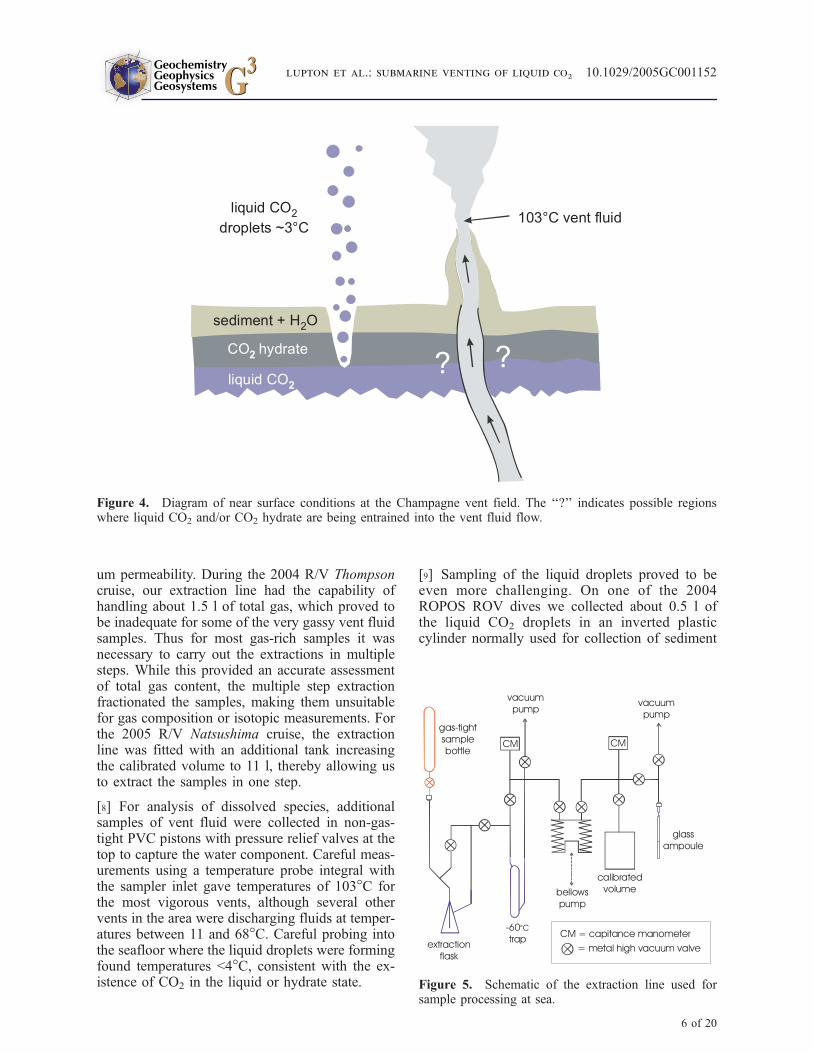
um permeability. During the 2004 R/V Thompsoncruise, our extraction line had the capability ofhandling about 1.5 l of total gas, which proved tobe inadequate for some of the very gassy vent fluidsamples. Thus for most gas-rich samples it wasnecessary to carry out the extractions in multiplesteps. While this provided an accurate assessmentof total gas content, the multiple step extractionfractionated the samples, making them unsuitablefor gas composition or isotopic measurements. Forthe 2005 R/V Natsushima cruise, the extractionline was fitted with an additional tank increasingthe calibrated volume to 11 l, thereby allowing usto extract the samples in one step.
[8] For analysis of dissolved species, additionalsamples of vent fluid were collected in non-gas-tight PVC pistons with pressure relief valves at thetop to capture the water component. Careful meas-urements using a temperature probe integral withthe sampler inlet gave temperatures of 103�C forthe most vigorous vents, although several othervents in the area were discharging fluids at temper-atures between 11 and 68�C. Careful probing intothe seafloor where the liquid droplets were formingfound temperatures <4�C, consistent with the ex-istence of CO2 in the liquid or hydrate state.
[9] Sampling of the liquid droplets proved to beeven more challenging. On one of the 2004ROPOS ROV dives we collected about 0.5 l ofthe liquid CO2 droplets in an inverted plasticcylinder normally used for collection of sediment
Figure 4. Diagram of near surface conditions at the Champagne vent field. The ‘‘?’’ indicates possible regionswhere liquid CO2 and/or CO2 hydrate are being entrained into the vent fluid flow.
Figure 5. Schematic of the extraction line used forsample processing at sea.
GeochemistryGeophysicsGeosystems G3G3
lupton et al.: submarine venting of liquid co2
10.1029/2005GC001152
6 of 20

cores (Figure 6b), and observed the droplets as thesubmersible ascended to the surface at the end ofthe dive (Figure 6c). This was similar to anexperiment conducted by Sakai et al. [1990a] inthe Okinawa Trough. We were able to first observe
the continuous conversion of liquid CO2 into white‘‘sherbet-like’’ hydrate in the cylinder. Then as thesubmersible passed through �400 m depth (at�4�C), we observed rapid conversion of bothliquid CO2 and hydrate into gaseous CO2. This is
Figure 6. Photographs of sampling at the Champagne site in 2004 and 2005. (a) Fluid sampler being inserted into103�C hydrothermal vent. (b) Droplets of liquid CO2 being collected in an inverted plastic cylinder held in theROV arm. (c) Photograph of the plastic cylinder taken at about 400 m depth during the ROV’s ascent to the surface.Most of the liquid droplets have converted to hydrate, and the hydrate is beginning to sublime into gaseous CO2.(d) Close-up of the ‘‘droplet catcher’’ used during the 2005 expedition attached to the small volume gas-tight bottle.(e and f) The ROV Hyper-Dolphin sampling liquid CO2 with the droplet catcher and gas-tight bottle at theChampagne site.
GeochemistryGeophysicsGeosystems G3G3
lupton et al.: submarine venting of liquid co2
10.1029/2005GC001152
7 of 20

precisely the pressure depth at which this phasetransition was expected, thus confirming our hy-pothesis that the droplets were composed mainly ofliquid CO2 (Figure 7). The plastic collection cyl-inder as well as some of the ROV camera faceplates suffered permanent damage as a result ofcontact with the corrosive liquid droplets.
[10] In 2004, liquid CO2 droplets were also col-lected by gluing a length of PEEK2 tubing into theplastic cylinder mentioned above and connectingthe other end to the inlet of a titanium gas-tightbottle. The ROVagain collected about 500 ml of theliquid droplets by holding the plastic cylinderinverted above the buoyant droplet stream. Thenthe gas-tight bottle was opened, drawing liquid CO2
into the bottle. As a safety precaution, we openedthe bottle several times before the ROV surfaced toallow gas to escape and relieve the internal pres-sure. Because there was a mixture of liquid CO2,
hydrate, and water in the bottle, this led to fraction-ation of the sample gas composition. Furthermore,this liquid droplet sample had to be extracted inmultiple steps, leading to further fractionation.However, we were still able to confirm that thedroplets consisted of >90% CO2 by volume.
[11] During the 2005 R/V Natsushima cruise, weemployed a new method for the collection of theliquid droplets that was very successful. One of us(C. Young) designed a special ‘‘droplet catcher’’consisting of a conical metal spring that wasconnected with PEEK2 tubing to a special titani-um gas-tight bottle with low (�10 cc) internalvolume (Figure 6d). The spring coil was first filled
with liquid droplets by holding it over a stream ofCO2 droplets exiting the seafloor (Figure 6e). Weknew from previous experience that the dropletsare sticky and do not tend to coalesce. The dropletswere visible through the spring coils but stayed inplace inside the coils. Then the spring coil wascompressed against a flat surface on the ROV,thereby expelling most of the excess water betweenthe droplets. Finally, the small volume gas-tightbottle was triggered, drawing the droplet sampleinto the bottle. During the Natsushima cruise, wewere able to collect 4 good samples of the liquiddroplets with this technique. Subsequent analysisshowed that each sample contained about 5 cc ofliquid CO2. This converted to about 7 l of gas atSTP in the extraction line, which we were able tohandle quite easily with our enlarged calibratedvolume.
[12] In both 2004 and 2005, water column sampleswere collected using a CTD rosette package. Plumeidentification was accomplished using both a lightscatter sensor and an Eh sensor. Samples werecollected into Niskin type bottles and sub-sampledfor helium isotopes, CO2, and other plumecomponents.
[13] He and Ne concentrations, 3He/4He ratios, and13C/12C ratios were determined by mass spectrom-etry, while CO2, CH4, H2, and other gas concen-trations were determined by gas chromatography.Total CO2 in the water column plume samples wasanalyzed by coulometry. Radiocarbon was mea-sured on selected samples at the Center for Accel-erator Mass Spectrometry at Lawrence LivermoreNational Laboratory. Hydrogen sulfide wasanalyzed on fluid samples collected with the non-gas-tight PVC pistons using the conventionalmethylene blue method. However, due to possiblegas loss from the PVC pistons, these H2S valuesrepresent only a lower limit. As an alternative,splits of the gases from selected gas-tight bottlesamples were sent to Atmospheric Analysis andConsulting (AAC), Inc., Ventura, CA, for analysisof reduced sulfur compounds by sulfur chemi-luminescence (method ASTM D-5504). Inaddition, AAC measured CO2 abundances by con-ventional thermal conductivity gas chromatogra-phy on the same samples, thereby producing ameasure of the H2S/CO2 ratio.
4. Results
[14] The analytical results for the 2004 and 2005samples from NW Eifuku are summarized in
Figure 7. Phase diagram for CO2 showing regionswhere solid, liquid, gas, and super-critical fluid (SCF)exist. PC and TC denote the critical pressure andtemperature. The dashed line denotes the boundary ofhydrate stability [Sloan, 1990]. The P, T conditions forthe Champagne site liquid droplets and for the 103�Cvent fluid are shown.
GeochemistryGeophysicsGeosystems G3G3
lupton et al.: submarine venting of liquid co2
10.1029/2005GC001152
8 of 20
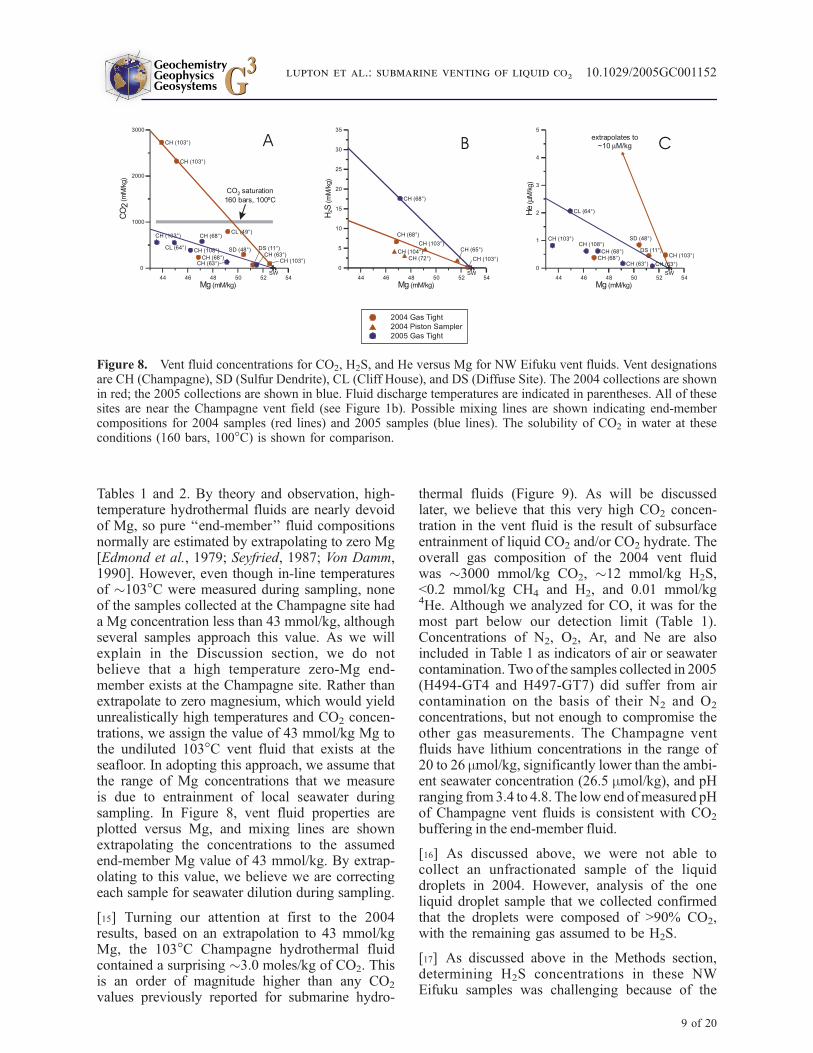
Tables 1 and 2. By theory and observation, high-temperature hydrothermal fluids are nearly devoidof Mg, so pure ‘‘end-member’’ fluid compositionsnormally are estimated by extrapolating to zero Mg[Edmond et al., 1979; Seyfried, 1987; Von Damm,1990]. However, even though in-line temperaturesof �103�C were measured during sampling, noneof the samples collected at the Champagne site hada Mg concentration less than 43 mmol/kg, althoughseveral samples approach this value. As we willexplain in the Discussion section, we do notbelieve that a high temperature zero-Mg end-member exists at the Champagne site. Rather thanextrapolate to zero magnesium, which would yieldunrealistically high temperatures and CO2 concen-trations, we assign the value of 43 mmol/kg Mg tothe undiluted 103�C vent fluid that exists at theseafloor. In adopting this approach, we assume thatthe range of Mg concentrations that we measureis due to entrainment of local seawater duringsampling. In Figure 8, vent fluid properties areplotted versus Mg, and mixing lines are shownextrapolating the concentrations to the assumedend-member Mg value of 43 mmol/kg. By extrap-olating to this value, we believe we are correctingeach sample for seawater dilution during sampling.
[15] Turning our attention at first to the 2004results, based on an extrapolation to 43 mmol/kgMg, the 103�C Champagne hydrothermal fluidcontained a surprising �3.0 moles/kg of CO2. Thisis an order of magnitude higher than any CO2
values previously reported for submarine hydro-
thermal fluids (Figure 9). As will be discussedlater, we believe that this very high CO2 concen-tration in the vent fluid is the result of subsurfaceentrainment of liquid CO2 and/or CO2 hydrate. Theoverall gas composition of the 2004 vent fluidwas �3000 mmol/kg CO2, �12 mmol/kg H2S,<0.2 mmol/kg CH4 and H2, and 0.01 mmol/kg4He. Although we analyzed for CO, it was for themost part below our detection limit (Table 1).Concentrations of N2, O2, Ar, and Ne are alsoincluded in Table 1 as indicators of air or seawatercontamination. Two of the samples collected in 2005(H494-GT4 and H497-GT7) did suffer from aircontamination on the basis of their N2 and O2
concentrations, but not enough to compromise theother gas measurements. The Champagne ventfluids have lithium concentrations in the range of20 to 26 mmol/kg, significantly lower than the ambi-ent seawater concentration (26.5 mmol/kg), and pHranging from3.4 to 4.8. The low end ofmeasured pHof Champagne vent fluids is consistent with CO2
buffering in the end-member fluid.
[16] As discussed above, we were not able tocollect an unfractionated sample of the liquiddroplets in 2004. However, analysis of the oneliquid droplet sample that we collected confirmedthat the droplets were composed of >90% CO2,with the remaining gas assumed to be H2S.
[17] As discussed above in the Methods section,determining H2S concentrations in these NWEifuku samples was challenging because of the
Figure 8. Vent fluid concentrations for CO2, H2S, and He versus Mg for NW Eifuku vent fluids. Vent designationsare CH (Champagne), SD (Sulfur Dendrite), CL (Cliff House), and DS (Diffuse Site). The 2004 collections are shownin red; the 2005 collections are shown in blue. Fluid discharge temperatures are indicated in parentheses. All of thesesites are near the Champagne vent field (see Figure 1b). Possible mixing lines are shown indicating end-membercompositions for 2004 samples (red lines) and 2005 samples (blue lines). The solubility of CO2 in water at theseconditions (160 bars, 100�C) is shown for comparison.
GeochemistryGeophysicsGeosystems G3G3
lupton et al.: submarine venting of liquid co2
10.1029/2005GC001152
9 of 20

high gas content of the samples. Shipboard analy-sis of samples collected with the non-gas-tightPVC pistons shows a roughly linear trend ofincreasing H2S with decreasing Mg, with H2Sreaching approximately 4.5 mmol/kg in the waterphase of the least diluted PVC piston samples(Figure 8b). However, because the PVC pistonsamples have lost significant gas volume in mostcases, these are minimum values for H2S in thefluids. One gas-tight sample collected in 2004(R793-GT5) was analyzed by sulfur chemi-lumi-nescence gas chromatography at AtmosphericAnalysis and Consulting, Inc., and this value lieson the mixing line through the highest of the PVCpiston results (Figure 8c). This suggests that the
end-member concentration (�12.5 mmol/kg H2S)derived from this mixing line (the red mixing line)represents the best estimate for the 2004 Cham-pagne fluid composition. In all of the samplesanalyzed at AAC, H2S was the only sulfur speciesdetected.
[18] During the return visit to NW Eifuku in 2005,while the Champagne site still had a constant flowof vent fluid and liquid droplets, there seemed to beslightly less activity than observed in 2004. Duringour first visits to the Champagne site in 2004, thevent fluid was discharging through several smallwhite chimneys (see Figures 3a, 3b, and 3c). Wewere surprised to find that these chimneys, which
Figure 9. Histogram comparing estimated end-member CO2 concentrations for vent fluids from mid-ocean ridges[Kelley et al., 2004], the Okinawa Trough [Sakai et al., 1990a, 1990b], and NW Eifuku (this work). For the MOR andOkinawa Trough samples, the end-member concentrations were derived in the usual way by extrapolating to zero Mg.For the NW Eifuku samples a value of 43 mmol/kg was used for this end-member extrapolation (see text forexplanation).
GeochemistryGeophysicsGeosystems G3G3
lupton et al.: submarine venting of liquid co2
10.1029/2005GC001152
10 of 20

Table
1.
Gas
CompositionsforVentFluid
andLiquid
DropletSam
plesFrom
NW
Eifukua
Sam
ple
Vent
Collection
Tem
p,
�C.
Mg
CO2
CH4
H2
N2
O2b
Ar
CO
He,
mmolkg�1
Ne,
mmolkg�1
H2S
H2S/CO2
R791-G
T7
Cham
pagne
4/9/04
103
52.52
118
0.0138
0.00011
1.01
ND
0.0194
ND
0.475
0.0182
R791-G
T9
Cham
pagnec
4/9/04
103
45.11
2308
R791-G
T11
Cham
pagnec
4/9/04
103
43.93
2711
R793-G
T5
Cham
pagne
4/11/04
68
46.85
254
0.00017
0.00071
1.63
0.0509
0.0168
ND
0.386
0.0325
6.69d
0.0285
R793-G
T11
SulfurDendrite
4/11/04
48
50.43
306
0.0137
0.00019
0.48
ND
0.0075
0.0104
0.843
0.0077
R793-G
T7
CliffHouse
4/11/04
49
49.20
703
R791-G
T2
Diffuse
Site
4/9/04
11
51.19
76.0
0.0111
0.00010
1.56
0.0040
0.0265
ND
0.460
0.0301
R791-P24
Cham
pagne
4/9/04
104
46.67
4.24e
R791-P4
Cham
pagne
4/9/04
103
49.15
4.76e
R793-P5
Cham
pagne
4/11/04
65
51.68
1.94e
R793-P4
Cham
pagne
4/11/04
72
47.51
3.09e
H494-G
T4
Cham
pagne
10/29/05
68
47.14
564
0.00127
0.108
7.35
ND
0.0583
ND
0.652
0.132
17.87d
0.0317
H497-G
T10
Cham
pagne,
2ndSite
11/1/05
56–63
49.12
136
0.00021
0.00326
0.69
0.0014
0.0599
ND
0.172
0.012
H497-G
T16
Cham
pagne,
2ndSite
11/1/05
63
51.48
72.3
0.00016
0.00089
0.96
0.00018
0.0141
0.00054
0.077
0.014
H497-G
T6
Cham
pagne
11/1/05
108
46.22
405
0.00059
0.00588
1.03
ND
0.0120
ND
0.621
0.027
H497-G
T7
Cham
pagne
11/1/05
103
43.53
591
0.00169
0.0123
36.0
1.50
1.21
0.300
1.07
0.879
H499-G
T5
Cham
pagne
11/2/05
47
48.64
174
0.00041
0.00181
1.01
ND
0.0126
0.103
0.259
0.017
H499-G
T15
CliffHouse
11/2/05
64
44.94
567
0.0136
0.00316
1.15
ND
0.0133
0.0452
2.08
0.029
SW
Seawater
52.8
2.34
0.0000003
0.0000003
0.593
0.050
0.0163
0.0000003
0.0019
0.0080
DetectionLim
it0.0001
0.000002
0.00002
0.004
0.0006
0.0001
0.000002
0.0018
0.0032
%%
%%
%%
%ppm
ppm
%H492-10cc#1
Cham
pagne
dropletsf
10/27/05
�4
98.7
0.00064
0.00032
0.0814
0.00285
0.00034
ND
5.15
0.0123
H494-10cc#1
Cham
pagne
dropletsf
10/29/05
�4
98.6
0.00092
0.00017
0.206
0.0213
0.00103
ND
5.72
0.0460
H497-10cc#2
Cham
pagne
dropletsf
11/1/05
�4
99.6
0.00088
0.00023
0.224
0.0192
0.00114
ND
5.37
0.0474
H499-10cc#1
Cham
pagne
dropletsf
11/2/05
�4
98.9
0.00094
0.00023
0.140
ND
0.00128
ND
6.99
0.0161
0.5–0.8
d0.005
–0.008
aUnitsaremmol/kgunless
notedotherwise.
Fortheconventional
gas
chromatographanalyses(CO2,CH4,H2,N2,O2,Ar,CO),theconcentrationsareprecise
toabout±5%.
bTheO2concentrationisnotareliable
indicatorofaircontaminationsince
O2may
havebeenreducedbyreactingwithH2Sin
theam
poule.
cForthesesamples,thegas
contentwas
more
than
ourextractionsystem
could
easily
handle,andsomefractionationofthegases
occurred.Forthisreasonwearereportingonly
those
gas
compositionsthat
arereliable.
dGas-tightbottle
sample,H2Sanalyzedbysulfur-chem
iluminescence
atAAC.
eSam
plescollectedwiththepistonsampler,H2Sanalyzedbytheconventional
methylenebluemethod.
fFortheliquid
droplets,whichareessentially
pure
gas,wereporttheCO2contentas
avolume%
.
GeochemistryGeophysicsGeosystems G3G3
lupton et al.: submarine venting of liquid co2
10.1029/2005GC001152
11 of 20

were destroyed by the ROV during the 2004sampling, had not re-grown during the intervening18 months. As shown in Tables 1, 2, and 3 and inFigure 8, on the basis of ‘‘end-member’’ extrap-olations, compared to 2004 the CO2 concentrationwas lower in 2005, accompanied by higher H2S,lower He, and higher C/3He ratios. One of themajor accomplishments of the 2005 Hyper-Dolphin dives was the successful collection of4 uncontaminated samples of the liquid droplets(see Methods section above). The liquid dropletshad a gas composition of �98% CO2, <0.01% CH4
and H2, �6 ppm He, and �0.8% H2S (see Tables 1and 3). While this composition is similar to that ofthe vent fluids, the liquid droplets collected in 2005have lower H2S/CO2 and higher He/CO2 ratiosthan the 2005 vent fluids (Table 3).
[19] The helium in both the Champagne vent fluidand in the liquid droplets had an isotopic ratio ofR/RA = 7.31 ± 0.05, a value typical of subductionzone systems (R = 3He/4He and RA = Rair)[Poreda and Craig, 1989; Hilton et al., 2002].During the 2003 water column surveys over NWEifuku, helium samples were collected thatallowed an estimate of the end-member heliumisotope ratio based on the co-variation of [3He]versus [4He]. This estimate gave R/RA = 7.25 ±0.4, in remarkably good agreement with directmeasurements of the vent fluids (see Figure 10).Furthermore, the C/3He ratio estimated from mea-surements of SCO2 and [3He] in the water columnplumes differed only by 10% from that determinedfrom the vent fluids (Figure 10c). This suggeststhat reliable estimates of the ratios of certain ventfluid properties can be made from samples of the
overlying water column plumes, even thoughthese plumes typically contain only 0.1% or lessof the pure vent fluid.
[20] Isotopic analysis of the CO2 in the Champagnevent fluid gave d13C = �1.75%, while the carbonin the liquid droplets was slightly heavier (d13C =�1.24%). The C/3He ratio ranged from 1.6 to9.7 � 1010 for the Champagne vent fluids, andfrom 1.4 to 1.9 � 1010 for the liquid droplets(Table 2). A sample of the CO2 from the Cham-pagne site 103�C vent fluid was analyzed forradiocarbon at the CAMS facility at LawrenceLivermore National Laboratory. The result wasD14C = �998.7%, corresponding to an age of53450 ± 3200 years, or a fraction of modern carbonof only 0.0013 (see Table 2). Analyses of the 68�Cvent fluid and of the liquid CO2 droplets yieldedsimilar results. Thus the carbon in the Eifuku CO2
is ‘‘dead’’ (age � 50,000 years).
5. Discussion
[21] In order to put the very high CO2 concentra-tion of the Champagne vent fluids in perspective,Figure 9 compares the end-member CO2 concen-trations at NW Eifuku with those at the OkinawaTrough and at various mid-ocean ridge hydrother-mal sites. Although Sakai et al. [1990a] observedliquid CO2 venting at the JADE site in the Oki-nawa Trough, the 320�C vent fluid at the JADEsite contained only 200 mmol/kg of CO2. Asshown in Figure 9, the end-member CO2 concen-trations at the Champagne site are an order ofmagnitude higher than any values reported forother hydrothermal fluids, and 100 times higher
Figure 10. Plots showing 3He, 4He, and CO2 data collected in the water column over NW Eifuku in 2003 (filledtriangles) and 2004 (filled circles). (a) [3He] and SCO2 versus depth. The depth of the Champagne vent field isindicated for comparison. (b) [3He] versus [4He] showing an estimate of the end-member 3He/4He ratio based on alinear regression fit. Here R = 3He/4He and RA = Rair = 1.39 � 10�6. (c) SCO2 versus [3He] showing a similarestimate of the end-member CO2/
3He ratio.
GeochemistryGeophysicsGeosystems G3G3
lupton et al.: submarine venting of liquid co2
10.1029/2005GC001152
12 of 20

Table
2.
IsotopeRatiosforVentFluid
andLiquid
DropletSam
plesFrom
NW
Eifuku
Sam
ple
Vent
Collection
Tem
p,
�C.
Mg,
mmol/kg
CO2,
mmol/kg
He,
mmol/kg
3He,
pmol/kg
3He/4Hea
(R/R
A)
C/3He
d13C(CO2),
%D14C,
%
14CAge,
years
R791-G
T7
Cham
pagne
4/9/04
103
52.52
118
0.472
4.81
7.33
1.93E+10
�1.75
R791-G
T9
Cham
pagne
4/9/04
103
45.11
2308
�998.7
53450±3200
R791-G
T11
Cham
pagne
4/9/04
103
43.93
2711
R793-G
T5
Cham
pagne
4/11/04
68
46.85
254
0.379
3.86
7.33
6.06E+10
�1.76
�991.9
38600±520
R793-G
T11
SulfurDendrite
4/11/04
48
50.43
306
0.843
8.45
7.22
3.23E+10
�1.74
R793-G
T7
CliffHouse
4/11/04
49
49.20
703
7.32
R791-G
T2
Diffuse
Site
4/9/04
11
51.19
76.0
0.454
4.63
7.34
1.48E+10
H494-G
T4
Cham
pagne
10/29/05
68
47.14
564
0.614
6.19
7.26
8.99E+10
�1.76
H497-G
T10
Cham
pagne,
2ndSite
11/1/05
56–63
49.12
136
0.168
1.70
7.29
7.77E+10
H497-G
T16
Cham
pagne,
2ndSite
11/1/05
63
51.48
72.3
0.0730
0.742
7.31
9.40E+10
H497-G
T6
Cham
pagne
11/1/05
108
46.22
405
0.613
6.18
7.25
6.31E+10
H497-G
T7
Cham
pagne
11/1/05
103
43.53
591
0.819
8.21
7.22
6.79E+10
H499-G
T5
Cham
pagne
11/2/05
47
48.64
174
0.254
2.57
7.28
6.47E+10
H499-G
T15
CliffHouse
11/2/05
64
44.94
567
2.07
20.9
7.26
2.63E+10
SW
Seawater
52.8
2.34
0.0019
0.0014
0.98
%ppm
ppm
H492-10cc#1
Cham
pagnedroplets
10/27/05
98.7
5.15
5.22E-05
7.31
1.83E+10
�1.28
H494-10cc#1
Cham
pagnedroplets
10/29/05
98.6
5.72
5.82E-05
7.33
1.63E+10
H497-10cc#2
Cham
pagnedroplets
11/1/05
99.6
5.37
5.45E-05
7.30
1.77E+10
H499-10cc#1
Cham
pagnedroplets
11/2/05
98.9
6.99
7.09E-05
7.30
1.32E+10
�1.20
aHelium
isotoperatioexpressed
asR/R
A,whereR=
3He/4HeandRA=Rair=1.39�
10�6.Thesolubilitiesofthetwoisotopes
inwater
areslightlydifferent,withtheresultthatforairsaturatedwaterR/R
A=
0.98.
Table
3.
Estim
ated
End-M
ember
Compositions,Based
onExtrapolatingto
aMgConcentrationof43mmol/kg
Vent
Collection
Tem
p,
�C.
Mg,
mmol/kg
CO2,
mmol/kg
CH4,
mmol/kg
H2,
mmol/kg
H2S,
mmol/kg
He,
mmol/kg
3He/4Hea
(R/R
A)
H2S/CO2
C/3He
d13C(CO2),%
Cham
pagneFluid
2004
103
43
3000
<0.2
<0.2
12.5
10
7.31
0.004
2-4E+10
�1.75
Cham
pagneFluid
2005
108
43
800
<0.2
<0.2
30
2.5
7.31
0.03
6–9E+10
�1.75
Cham
pagnedroplets
2005
<4
-98%
--
0.8%
5–6ppm
7.31
0.008
1.5E+10
�1.24
Seawater
252.8
2.34
0.0003
0.0003
-.0019
0.98
--
-
aHelium
isotoperatioexpressed
asR/R
AwhereR=
3He/4HeandRA=Rair=1.39�
10�6.Thesolubilitiesofthetwoisotopes
inwater
areslightlydifferent,withtheresultthatforairsaturatedwater
R/R
A=
0.98.
GeochemistryGeophysicsGeosystems G3G3
lupton et al.: submarine venting of liquid co2
10.1029/2005GC001152
13 of 20

than average values at MOR systems. The structureof the hydrothermal system at NW Eifuku is clearlydifferent from that at the JADE site, where high-temperature, zero-magnesium fluids are producedin a reaction zone with low water/rock ratio [Sakaiet al., 1990a, 1990b].
[22] The CO2 concentration at NW Eifuku is evenmore remarkable when it is compared against theCO2 solubility at these P, T conditions. The solu-bility of CO2 in seawater at 160 bars, 100�C is�1.0 mole/kg [Wiebe and Gaddy, 1939;Takenouchi and Kennedy, 1964], much lower thanthe concentrations we measured in 2004. The mostplausible explanation for the apparent super-saturation of CO2 is that the Champagne vent fluidis entraining small amounts of liquid CO2 and/orCO2 hydrate as the hot vent fluid penetrates thelayers of CO2 liquid and hydrate that we proposeexist beneath the seafloor (Figure 4). Incorporationof only 6% by volume of liquid CO2 into the ventfluid would increase the CO2 concentration from 1to 2.7 moles/kg, and this liquid CO2 would likelynot be visible as a separate phase in the vent fluidstream.
[23] The 2005 vent fluid samples had lower CO2
concentrations and different relative proportions ofdissolved gases compared to the earlier 2004collections. In fact, none of the 2005 water sampleshad CO2 concentrations above the 1.0 mole/kgsolubility of CO2 at the conditions at the Cham-pagne site. Furthermore, as discussed above, the2005 vent fluid samples had higher end-memberH2S/CO2 ratios, and higher C/3He ratios comparedto the 2004 samples (Table 3). For whateverreason, the liquid droplets have lower H2S/CO2,lower C/3He, and are heavier in d13C compared tothe vent fluids. This difference between the ventfluid compositions in 2005 versus 2004 may bedue to temporal changes in the degree of entrain-ment of liquid CO2 and/or hydrate into the risingvent fluid. Our results indicate that all of the ventfluid samples are actually a mixture of the pure‘‘subsurface’’ hydrothermal fluid combined withvarying amounts of entrained liquid CO2 or CO2
hydrate. The end-member compositions estimatedfor the 2005 samples (see Table 3) may thusrepresent a form of the Champagne vent fluidrelatively un-contaminated with entrained liquidCO2, while the gas-rich 2004 vent fluids had moreentrained liquid CO2. For the 2004 vent fluidsamples with �2.7 moles/kg CO2, most of theCO2 came from the entrained liquid droplets and/or hydrate, while most of the H2S and He was
already dissolved in the hot fluid before it reachedthe near surface liquid CO2 layer.
[24] In many cases, diffuse hydrothermal fluids arelocated near high-temperature fluids or theirchemistry indicates that they are dilutions ofhigh-temperature fluids, with overprinting low-temperature reactions [Edmond et al., 1979;Butterfield and Massoth, 1994; Butterfield et al.,1997, 2004; Sedwick et al., 1992]. That is not thecase at NW Eifuku. If we were to extrapolate thetemperature and fluid composition to a zero-magnesium value, the results would be nothinglike a fluid produced in a high-temperature water/rock reaction zone. For example, a zero-Mgextrapolation at NW Eifuku would yield temper-atures of 500–600�C, CO2 concentrations of 10–20 mol/kg, and zero Li concentration. Theimplication of this is that we are not dealing with ahigh-temperature aqueous system, but with a high-temperature CO2 system, entraining some water thatundergoes incomplete reaction to remove someseawater magnesium and extract some elementsfrom the rock. CO2 migrating upward from a gaspocket in a magma chamber must cool as it ascendsthrough volcanic rock and may entrain smallamounts of seawater (Figure 11). Water and CO2
are immiscible at 500 bars at temperatures below310�C [Takenouchi and Kennedy, 1964; Bowers,1991] and separate into a CO2-rich vapor and awater-rich liquid. As pressure increases, immiscibil-ity of H2O-CO2 occurs at lower temperatures[Bowers, 1991]. In a system dominated by the fluxof hot CO2 from a magma chamber, the penetrationof water into the core of the system will be limited attypical hydrothermal temperatures (up to �350�C)due to the immiscibility. If seawater is not firstheated by hot rock (and the water chemistry at theChampagne site indicates minimal high-T water/rock reaction), then the outer portions of the CO2
column will be in the P-T region of H2O-CO2
immiscibility. As long as the flux of hot CO2 fromthe magma chamber and cooling in the pathway tothe seafloor is maintained, the penetration of waterinto the CO2 –rich zone is inhibited. The presence ofa gas hydrate phase at temperatures below 10�Cmayalso inhibit penetration ofwater into the sub-seafloorCO2-rich zone.
[25] Some insight into the origin of the high CO2
concentrations at NW Eifuku can be gained fromthe isotopic composition of the CO2 and therelation of CO2 to 3He. The d13C of the Cham-pagne vent fluids (�1.75%) is much heavier thanthe d13C = �13 to �4% typical for carbon in MOR
GeochemistryGeophysicsGeosystems G3G3
lupton et al.: submarine venting of liquid co2
10.1029/2005GC001152
14 of 20

vent fluids [Kelley et al., 2004]. The NW EifukuCO2 is also heavier than that reported for the Mid-Okinawa Trough (�5.0 to �3.7%) [Sakai et al.,1990a, 1990b], falls at the heavy end of the rangereported for arc volcanoes in general (�7 to �2%)[Sano and Williams, 1996; van Soest et al., 1998],and at the lighter end of the range for marinecarbonates (�2 to +1%) (Figure 12) [Hoefs,1980]. The C/3He ratio for the Champagne ventfluids and liquid droplets (1.3 to 9.4 � 1010) issimilar to that reported for the Mid-OkinawaTrough [Sakai et al., 1990a, 1990b], but an orderof magnitude higher than the average value of 2 �109 found in MOR vent fluids [Resing et al., 2004].These d13C and C/3He values indicate that themajority of the carbon flux originated from marinecarbonates incorporated into the melt as part of thesubduction zone melting process rather than frommantle carbon. Using the method outlined by Sano
and Marty [1995] based on d13C and C/3He values,and taking sedimentary organic matter to have ad13C value of �30% as did Sano and Marty[1995], we estimate that the NW Eifuku CO2 wasderived 88% from marine carbonates, 9% frommantle carbon, and 3% from sedimentary organicmatter. If instead we assume that the d13C ofsedimentary organic matter is �20%, then wecalculate 87% from marine carbonates, 9% mantle,and 4% from sedimentary organics. These fractionsare similar to those observed at subaerial arcvolcanoes [Hilton et al., 2002]. The fact that theradiocarbon is ‘‘dead’’ suggests that the CO2 flux ismainly derived from subducted carbonates incor-porated into the melt at depth and that local sedi-ments are not responsible.
[26] It is a simple matter to show that the extremelyhigh concentrations of CO2 at NW Eifuku cannot
Figure 11. Diagram showing a model proposed for the gas flux from NW Eifuku, in which a CO2-rich gas isdirectly degassing from the magma chamber. As this hot gas rises through the system, it cools, and CO2 condenses asa separate liquid phase on the periphery of the main conduit. Seawater circulates through the system, but thepenetration of water into the core of the system is limited at temperatures below 250�C due to CO2-H2Oimmiscibility. At the volcano summit the liquid CO2 collects beneath a hydrate ‘‘cap’’ layer that forms where theliquid CO2 comes in contact with seawater. Because the penetration of water is limited and the enthalpy is carried bythe CO2 gas, there is little high-temperature water-rock interaction.
GeochemistryGeophysicsGeosystems G3G3
lupton et al.: submarine venting of liquid co2
10.1029/2005GC001152
15 of 20

be easily derived from either water/rock reaction orfrom dissolution of putative carbonates within thevolcanic edifice. On the first count, it has alreadybeen shown [Butterfield et al., 1990; Sedwick et al.,1994] that by extracting all of the CO2 from 1 kg ofMORB, assuming the maximum reported level of8 mmol CO2/kg rock [Dixon et al., 1988], into 1 kgof water (a typical water/rock ratio), the total CO2
concentration in the aqueous phase wouldnot exceed �8 mmol/kg. However, according toWallace [2005], undegassed arc magmas contain�3000 ppm of CO2. Using the same water/rockratio of 1, this would produce only 68 mmol/kg ofCO2 in the hydrothermal fluid, still far below the900–2700 mmol/kg we observe. Furthermore, theChampagne vent fluids have lithium concentrationslower than the ambient seawater concentration,indicative of minimal high-temperature water-rockreaction (a high water/rock ratio). Thus it appearsto be impossible to extract enough CO2 frombasaltic or andesitic lava by water/rock interaction
to reach the levels of CO2 found in the Champagnevent fluids, or even in some MOR vents (e.g.,Axial Volcano on the Juan de Fuca Ridge or 9�NEast Pacific Rise). On the second count, the lowpH of Champagne vent fluids is inconsistent withcalcium carbonate dissolution. In addition, disso-lution of carbonates is self-limiting unless there isan additional source of acid to drive more dissolu-tion. In that case, the calcium concentration wouldalso be very high, but it is lower than seawaterconcentration in the Champagne vent fluids. Weconclude that the CO2 at this site must be derivedfrom magma degassing, as there is no other plau-sible source.
[27] Although it is clear that the venting at theOkinawa Trough and NW Eifuku Champagne siteslocally produces very high CO2 concentrations, thequestion remains as to how significant the overallcarbon flux is on a global scale. We estimated thevolume flux of liquid CO2 droplets at the Cham-pagne site by examining video collected during the
Figure 12. (a) Chart comparing d13C (%) for CO2 from various MOR sites [Kelley et al., 2004], the OkinawaTrough [Sakai et al., 1990a, 1990b], NW Eifuku (this work), marine carbonates [Hoefs, 1980], and typical volcanicarcs [Sano and Williams, 1996; van Soest et al., 1998]. (b) Similar chart comparing CO2/
3He ratios for MOR vents[Kelley et al., 2004], the Okinawa Trough [Sakai et al., 1990a, 1990b], and typical volcanic arcs [Sano and Williams,1996; van Soest et al., 1998].
GeochemistryGeophysicsGeosystems G3G3
lupton et al.: submarine venting of liquid co2
10.1029/2005GC001152
16 of 20

2004 ROV dives. We first estimated that there wereabout 300 droplet streams rising from the 10 m2
area of the Champagne site, and that each streamcontained 2 droplets/s, each with an average diam-eter of �1.5 cm. This gives a total liquid CO2
flux of �1 liter/s or 1 kg/s (assuming a density of1g/cm3), equivalent to �23 moles CO2/s. Using asimilar method, we estimate the CO2 flux from theChampagne hot vents to be � 0.5 mole/s or onlyabout 2% of the liquid CO2 flux. The CO2 fluxfrom the liquid droplets at the Champagne site (8 �108 moles/yr) approximately equals the combinedcarbon flux from all of the Endeavour Ridge ventfields on the Juan de Fuca Ridge [Rosenberg et al.,1988; Lilley et al., 1993], or about 0.1% of theglobal MOR carbon flux which is estimated at0.5–2.0 � 1012 moles/yr [Resing et al., 2004].The carbon flux from the Champagne site is alsoabout 0.1% of the global CO2 flux from subaerialarc volcanoes, estimated at �1.6 � 1012 moles/y[Hilton et al., 2002]. Although these flux estimatesfor NW Eifuku are admittedly only accurate to afactor of 2 or so, this carbon flux is surprising,since NW Eifuku is a small, young arc volcano andnot a major volcanic edifice. Furthermore, the factthat NW Eifuku is a submarine volcano suggeststhat carbon fluxes based on observations of sub-aerial volcanoes may have underestimated theglobal fluxes from arcs. If there are many suchsubmarine sites active along volcanic arcs and backarcs, then there is potential for a significant impacton oceanic carbon cycling. For completeness itshould be noted that Hilton et al. [2002] estimatedthe carbon flux from an average subaerial arcvolcano at 2 � 1010 moles/y, about 25 times higherthan the carbon flux at NW Eifuku. They arrived atthis estimate by normalizing the CO2 flux to themeasured SO2 flux at various subaerial arc volca-noes, rather than by direct measurements of theCO2 outgassing rate. Thus the carbon flux at NWEifuku may be significant for submarine carboncycling, but not necessarily for the global subaerialcarbon flux.
[28] Additional visits and possibly long-term mon-itoring of the site are required to determine if thishigh CO2 flux is time dependent. For example,Miyakejima volcano (Japan) underwent a months-long extremely high-volume magmatic degassingevent following a caldera collapse in 2000[Kazahaya et al., 2004]. Recent mass-wasting atthe summit of NW Eifuku could have beentriggered by movements along what appears to bea NW-SE fracture underlying the volcano(Figure 2c). Deep conduits could be enlarged and
new ones opened during this process. Alternatively,long-term degassing during non-eruptive periods onsome volcanoes has been tied to endogenous growthby magmatic intrusion [Allard, 1997].
[29] Recently there has been considerable interestin the possible oceanic disposal of fossil fuel CO2
as a means to alleviate the increase of atmosphericCO2 [Brewer, 2000]. One important question con-cerns the fate of the CO2 after it is introduced intothe ocean. Brewer et al. [2002] measured the rateof dissolution of liquid CO2 injected into the oceanat a depth of �800 m, and found that 90% of thebuoyant CO2 droplets dissolved within 200 mabove the injection point. As shown in Figure 10,our water column measurements in the vicinity ofNW Eifuku are in basic agreement with the Breweret al. [2002] results. On several hydrocasts collect-ed over the volcano in 2003 and 2004 we foundlarge excesses in 3He and CO2 that co-variedalmost perfectly [Lupton et al., 2003; Resing etal., 2003]. In every case the excess 3He and CO2
was confined to the depth range of 1490 to 1620 mand returned to background values about 150 mabove the depth of the NW Eifuku vent fields(Figure 10).
6. Summary and Conclusions
[30] In summary, we have discovered a site at�1600 m depth on NW Eifuku, a submarinevolcano on the northern Mariana Arc, which isventing droplets of liquid CO2 at an estimated rateof 8 � 108 moles/yr. This is only the secondlocality where submarine venting of liquid CO2
has been observed, the other being the mid-Oki-nawa Trough [Sakai et al., 1990a, 1990b]. TheChampagne site on NW Eifuku is also venting hot(�100�C) vent fluid with CO2 contents up to2.7 moles/kg, far above the solubility (�1.0 mole/kg)at these P, T conditions. Observations at the siteindicate the presence of a subsurface liquid CO2
layer under a capping layer of CO2 hydrate. Weattribute the apparent CO2 super-saturation in thevent fluid to entrainment of small amounts of liquidCO2 and/or CO2 hydrate into the ascending ventfluid stream. The liquid droplets are composedof >98% CO2, �1% H2S, with only trace amountsof H2 and CH4. The dissolved gases in the ventfluid have a similar composition, with a slightlygreater concentration of H2S (�3%). The d13C(CO2) and CO2/
3He ratios fall in the range typicalfor volcanic arcs, and indicate that the carbon isderived �90% from marine carbonates, the remain-der being mantle carbon and sedimentary organic
GeochemistryGeophysicsGeosystems G3G3
lupton et al.: submarine venting of liquid co2
10.1029/2005GC001152
17 of 20

matter. The fact that the radiocarbon is dead (age �50,000 years) suggests that the source is subductedcarbonates incorporated into the melt at depth in thesubduction zone and not local carbonates on thevolcano edifice.
[31] Sakai et al. [1990a, 1990b] explained theirobservations in the mid-Okinawa Trough in termsof separate CO2-rich and H2O-rich fluids thatformed as the result of magma chamber degassing.They also discussed subsurface boiling as a possi-ble mechanism for generating these two phases. Itis clear that separate cold CO2-rich and hot H2O-rich fluids exist at the same site in close proximityat NW Eifuku. At the vent site, we envision amechanism in which hot water is venting throughan area of liquid CO2 and CO2 hydrate and entrainsthese, generating hot fluids with CO2 contentshigher than predicted by the limits of CO2 solubil-ity. In contrast to the 320�C fluids found in theOkinawa Trough, the 103�C fluid temperatures atNW Eifuku are �250�C below the boiling point at1600-m depth, and thus shallow subsurface boilingis unlikely. The 103�C fluids do not show signs ofintense water/rock interaction, and their low alkalimetal content is indicative of a high water/rockratio. Given that we do not find a zero-magnesium,high-temperature fluid at NW Eifuku, it is impos-sible to extract enough CO2 from the rock intocirculating seawater to form an aqueous fluidsaturated with CO2. Instead, the extreme CO2
concentrations at NW Eifuku require direct degass-ing of CO2 from a magma chamber, cooling andmigration to the seafloor, resulting in the genera-tion of the CO2-rich and H2O-rich fluids that weobserved. The physical/chemical model we haveproposed (Figure 11) differs substantially from themid-ocean ridge model of extraction of gases fromrock by circulating hot water. If our model iscorrect, then elemental and isotopic fractionationsthat occur as a result of magma degassing, CO2
condensation, hydrate formation, H2O-CO2 mix-ing, and phase separation add considerable com-plexity to the interpretation of gas ratios andisotopic ratios.
[32] The Champagne vent field and the other sitesof hydrothermal activity on NW Eifuku clearlymerit further study. As mentioned above, NWEifuku is only the second locality where naturalventing of liquid CO2 has been reported, the otherbeing the Okinawa Trough, a back-arc basin envi-ronment. At the time of its discovery, the Cham-pagne site was the only arc volcano where thephenomenon of liquid CO2 venting had been
found. However, venting of a separate CO2 gas-eous phase was recently observed at 3 othersubmarine arc volcanoes: Nikko volcano in theMariana Arc [Lupton et al., 2005], and Giggenbachvolcano and Volcano 1, both in the Kermadec Arc[Lupton et al., 2005; Stoffers et al., 2006]. Further-more, to our knowledge liquid CO2 venting hasnever been found on mid-ocean ridges, suggestingthat this type of activity is more prevalent onvolcanic arcs and the associated back-arc basins.Experiments are being designed to accurately mea-sure the flux and oceanic dispersal of CO2 at NWEifuku. In addition to physical and chemical meas-urements, the hydrothermal sites on NW Eifuku area valuable natural laboratory for studying theeffects of high CO2 concentrations on marineecosystems.
Acknowledgments
[33] We thank K. Shepard, K. Tamburri, and the other
members of the Canadian ROPOS team, and the captain and
crew of the R/V Thompson for their excellent support during
the 2004 SROF expedition, and K. Chiba and the other
members of the Hyper-Dolphin team and the Captain and
crew of the R/V Natsushima for their support during the
NT05-18 expedition. We thank S. Merle for help with the
figures and Tom Brown and the Natural 14C Group at
the Center for Accelerator Mass Spectrometry at Lawrence
Livermore National Laboratory. V. Salters, D. Hilton,
C. German, and T. Fischer provided constructive reviews of
the manuscript. Radiocarbon measurements were supported in
part by funding from CAMS through the University Collab-
orative Research Program. This publication was partially
funded by the Joint Institute for the Study of the Atmosphere
and Ocean (JISAO) under NOAA cooperative agreement
NA17RJ1232, contribution 1154. This work was supported
by the NOAA Ocean Exploration Program and by the NOAA
VENTS Program. This is PMEL contribution 2843.
References
Allard, P. (1997), Endogenous magma degassing and storage atMount Etna, Geophys. Res. Lett., 24, 2219–2222.
Bowers, T. S. (1991), The deposition of gold and other metals:Pressure-induced fluid immiscibility and associated stableisotope signatures, Geochim. Cosmochim. Acta, 55, 2417–2434.
Brewer, P. G. (2000), Contemplating action: Storing carbondioxide in the ocean, Oceanography, 13, 84–92.
Brewer, P. G., G. Friederich, E. T. Peltzer, and F. M. Orr Jr.(1999), Direct experiments on the ocean disposal of fossilfuel CO2, Science, 284, 943–945.
Brewer, P. G., E. T. Peltzer, G. Friederich, and G. Rehder(2002), Experimental determination of the fate of risingCO2 droplets in seawater, Environ. Sci. Technol., 36,5441–5446.
Butterfield, D. A., and G. J. Massoth (1994), Geochemistry ofnorth Cleft segment vent fluids: Temporal changes in chlori-
GeochemistryGeophysicsGeosystems G3G3
lupton et al.: submarine venting of liquid co2
10.1029/2005GC001152
18 of 20
nity and their possible relation to recent volcanism, J. Geo-phys. Res., 99, 4951–4968.
Butterfield, D. A., G. J. Massoth, R. E. McDuff, J. E. Lupton,and M. D. Lilley (1990), Geochemistry of hydrothermalfluids from Axial Seamount Hydrothermal Emissions StudyVent Field, Juan de Fuca Ridge: Subseafloor boiling andsubsequent fluid-rock interaction, J. Geophys. Res., 95,12,895–12,921.
Butterfield, D. A., I. R. Jonasson, G. J. Massoth, R. A. Feely,K. K. Roe, R. E. Embley, J. F. Holden, R. E. McDuff, M. D.Lilley, and J. R. Delaney (1997), Seafloor eruptions andevolution of hydrothermal fluid chemistry, Philos. Trans.R. Soc. London, Ser. A, 355, 369–386.
Butterfield, D. A., K. K. Roe, M. D. Lilley, J. Huber, J. A.Baross, R. W. Embley, and G. J. Massoth (2004), Mixing,reaction and microbial activity in sub-seafloor revealed bytemporal and spatial variation in diffuse flow vents atAxial Volcano, in The Subseafloor Biosphere at Mid-Ocean Ridges, Geophys. Monogr. Ser., vol. 144, editedby W. S. D. Wilcock et al., pp. 269–289, AGU, Washington,D. C.
Chadwick, W. W., Jr., D. S. Scheirer, R. W. Embley, and H. P.Johnson (2001), High-resolution bathymetric surveys usingscanning sonars: Lava flow morphology, hydrothermalvents and geologic structure at recent eruption sites onthe Juan de Fuca Ridge, J. Geophys. Res., 106(B8),16,075–16,100.
Chadwick, W. W., Jr., R. W. Embley, C. E. J. De Ronde, R. J.Stern, J. Hein, S. G. Merle, and S. Ristau (2004), The geo-logic setting of hydrothermal vents at Mariana Arc submar-ine volcanoes: High-resolution bathymetry and ROVobservations, Eos Trans. AGU, 85(47), Fall Meet. Suppl.,Abstract V43F-06.
de Ronde, C. E. J., E. T. Baker, G. J. Massoth, J. E. Lupton,I. C. Wright, R. A. Feely, and R. R. Greene (2001), Intra-oceanic subduction-related hydrothermal venting, Kermadecforearc, New Zealand, Earth Planet. Sci. Lett., 193, 359–369.
Dixon, J. E., E. Stolper, and J. R. Delaney (1988), Infraredspectroscopic measurements of CO2 and H2O in Juan deFuca Ridge basalt glasses, Earth Planet. Sci. Lett., 90, 87–104.
Edmond, J. M., C. Measures, R. E. McDuff, L. Chan,R. Collier, B. Grant, L. I. Gordon, and J. Corliss (1979),Ridge crest hydrothermal activity and the balances of themajor and minor elements in the ocean: The Galapagos data,Earth Planet. Sci. Lett., 46, 1–18.
Embley, R. W., E. T. Baker, W. W. Chadwick Jr., J. E. Lupton,J. E. Resing, G. L. Massoth, and K. Nakamura (2004),Explorations of Mariana Arc volcanoes reveal new hydro-thermal systemsEos Trans. AGU, 85, 37–40.
Hilton, D. R., T. P. Fischer, and B. Marty (2002), Noble gasesand volatile recycling at subduction zones, in Noble Gases inGeochemistry and Cosmochemistry, Rev. Mineral. Geo-chem., vol. 47, edited by D. Porcelli, C. J. Ballentine, andR. Wieler. pp. 319–370, Mineral. Soc. of Am., Washington,D. C.
Hoefs, J. (1980), Stable Isotope Geochemistry, 208 pp.,Springer, New York.
Kazahaya, K., H. Shinohara, K. Uto, M. Odai, Y. Nakahori,H. Mori, H. Iino, M. Miyashita, and J. Hirabayashi(2004), Gigantic SO2 emission from Miyakejima volcano,Japan, caused by caldera collapse, Geology, 32, 425–428.
Kelley, D. S., M. D. Lilley, and G. L. Fruh-Green (2004),Volatiles in submarine environments: Food for life, in TheSubseafloor Biosphere at Mid-Ocean Ridges, Geophys.
Monogr. Ser., vol. 144, edited by W. Wilcock et al., pp.167–190, AGU, Washington, D. C.
Lilley, M. D., D. A. Butterfield, E. J. Olson, J. E. Lupton, S. A.Macko, and R. E. McDuff (1993), Anomalous CH4 and NH4
+
concentrations at an unsedimented mid-ocean-ridge hydro-thermal system, Nature, 364, 45–47.
Lupton, J. E., E. T. Baker, R. W. Embley, J. A. Resing, G. J.Massoth, K. Nakamura, R. Greene, S. Walker, and G. Lebon(2003), Hydrothermal helium plumes over submarine volca-noes of the Mariana Arc, Eos Trans. AGU, 84(46), AbstractT32A-0916.
Lupton, J., et al. (2005), Carbon fluxes from submarine arcvolcanoes: Examples from the Mariana and Kermadec Arcs,Eos Trans AGU, 86(52), Fall Meet. Suppl., Abstract V51C-1498.
Poreda, R., and H. Craig (1989), Helium isotopes in circum-Pacific volcanic arcs, Nature, 338, 473–478.
Resing, J. A., G. Lebon, E. Baker, J. Lupton, K. Nakamura,G. Massoth, and R. Embley (2003), Geochemical charac-terization of hydrothermal plumes above hydrothermallyactive volcanoes on the Mariana Arc, Eos Trans. AGU,84(46), Abstract T32A-0915.
Resing, J. A., J. E. Lupton, R. A. Feely, and M. D. Lilley(2004), CO2 and 3He in hydrothermal plumes: Implicationsfor mid-ocean ridge CO2 flux, Earth Planet. Sci. Lett., 226,449–464.
Rosenberg, N. D., J. E. Lupton, D. Kadko, R. Collier,M. Lilley, and H. Pak (1988), A geochemical methodfor estimating the heat and mass flux from a seafloorhydrothermal system, Nature, 334, 604–607.
Sakai, H., T. Gamo, E.-S. Kim, M. Tsutsumi, T. Tanaka,J. Ishibashi, H. Wakita, M. Yamano, and T. Oomori (1990a),Venting of carbon dioxide-rich fluid and hydrate formationin Mid-Okinawa Trough backarc basin, Science, 248,1093–1096.
Sakai, H., T. Gamo, S.-E. Kim, K. Shitashima, F. Yanagisawa,and M. Tsutsumi (1990b), Unique chemistry of the hydro-thermal solution in the Mid-Okinawa Trough backarc basin,Geophys. Res. Lett., 17, 2133–2136.
Sano, Y., and B. Marty (1995), Origin of carbon in fumarolicgas from island arcs, Chem. Geol., 119, 265–274.
Sano, Y., and S. N. Williams (1996), Fluxes of mantle andsubducted carbon along convergent plate boundaries, Geo-phys. Res. Lett., 23, 2749–2752.
Sedwick, P. N., G. M. McMurtry, and J. D. MacDougall(1992), Chemistry of hydrothermal solutions from PeleVents, Loihi Seamount, Hawaii, Geochim. Cosmochim. Acta,56, 3643–3667.
Sedwick, P. N., G. M. McMurtry, D. R. Hilton, and F. Goff(1994), Carbon-dioxide and helium in hydrothermal fluidsfrom Loihi Seamount, Hawaii, USA—Temporal variabilityand implications for the release of mantle volatiles, Geochim.Cosmochim. Acta, 58, 1219–1227.
Seyfried, W. E., Jr. (1987), Experimental and theoretical con-straints on hydrothermal alteration processes at mid-oceanridges, Annu. Rev. Earth Planet. Sci., 15, 317–335.
Sloan, E. D., Jr. (1990), Clathrate Hydrates of Natural Gases,CRC Press, Boca Raton, Fla.
Stoffers, P., et al. (2006), Submarine volcanoes and high-tem-perature hydrothermal venting on the Tonga Island Arc, S.W.Pacific, Geology, 34, 453–456.
Takenouchi, S., and G. C. Kennedy (1964), The binary systemH2O-CO2 at high temperatures and pressures, Am. J. Sci.,262, 1055–1074.
van Soest, M. C., D. R. Hilton, and R. Kreulen (1998), Tracingcrustal and slab contributions to arc magmatism in the Lesser
GeochemistryGeophysicsGeosystems G3G3
lupton et al.: submarine venting of liquid co2
10.1029/2005GC001152
19 of 20

Antilles island arc using helium and carbon relationships ingeothermal fluids, Geochim. Cosmochim. Acta, 62, 3323–3335.
Von Damm, K. L. (1990), Sea floor hydrothermal activity:Black smoker chemistry and chimneys, Annu. Rev. EarthPlanet. Sci., 18, 173–204.
Wallace, P. J. (2005), Volatiles in subduction zone magmas:Concentrations and fluxes based on melt inclusion and vol-canic gas data, J. Volcanol. Geotherm. Res., 140, 217–240.
Wiebe, R., and V. L. Gaddy (1939), The solubility of carbondioxide at 50, 75, and 100�, at pressures to 700 atmospheres,J. Am. Chem. Soc., 61, 315–318.
GeochemistryGeophysicsGeosystems G3G3
lupton et al.: submarine venting of liquid co2
10.1029/2005GC001152
20 of 20