style manual (second edition) for california energy ... web viewgeothermal production of electricity...
TRANSCRIPT
Energy Research and Development DivisionFINAL PROJECT REPORTENERGY INNOVATIONS SMALL GRANT PROGRAM: 2004 INDEPENDENT ASSESSMENT REPORTS
JULY 2004CEC-500-2013-028
Prepared for: California Energy CommissionPrepared by:San Diego State Research Foundation
Prepared by:
Primary AuthorRob QueenProgram Administrator
San Diego State Research Foundation5250 Campanile Drive,San Diego, CA 92182-1858(619) 594-1900
Contract Number: 500-98-014
Prepared for:
California Energy Commission
Raquel KravitzProgram Manager
Fernando PinaOffice ManagerEnergy Systems Research Office
Laurie ten HopeDeputy DirectorRESEARCH AND DEVELOPMENT DIVISION
Robert P. OglesbyExecutive Director

DISCLAIMER
This report was prepared as the result of work sponsored by the California Energy Commission. It does not necessarily represent the views of the Energy Commission, its employees or the State of California. The Energy Commission, the State of California, its employees, contractors and subcontractors make no warrant, express or implied, and assume no legal liability for the information in this report; nor does any party represent that the uses of this information will not infringe upon privately owned rights. This report has not been approved or disapproved by the California Energy Commission nor has the California Energy Commission passed upon the accuracy or adequacy of the information in this report.

PREFACE
The California Energy Commission Energy Research and Development Division supports public interest energy research and development that will help improve the quality of life in California by bringing environmentally safe, affordable, and reliable energy services and products to the marketplace.
The Energy Research and Development Division conducts public interest research, development, and demonstration (RD&D) projects to benefit California.
The Energy Research and Development Division strives to conduct the most promising public interest energy research by partnering with RD&D entities, including individuals, businesses, utilities, and public or private research institutions.
Energy Research and Development Division funding efforts are focused on the following RD&D program areas:
Buildings End-Use Energy Efficiency
Energy Innovations Small Grants
Energy-Related Environmental Research
Energy Systems Integration
Environmentally Preferred Advanced Generation
Industrial/Agricultural/Water End-Use Energy Efficiency
Renewable Energy Technologies
Transportation
Energy Innovations Small Grant Program: 2004 Independent Assessment Reports is the interim report for the Energy Innovations Small Grant Program (contract number 500‐98‐014) conducted by San Diego State University Research Foundation. The information from this project contributes to Energy Research and Development Division’s RD&D Programs.
For more information about the Energy Research and Development Division, please visit the Energy Commission’s website at www.energy.ca.gov/research/ or contact the Energy Commission at 916-327-1551.
1

ABSTRACT
The California Energy Commission has been conducting the Public Interest Energy Research (PIER) program through competitive solicitations to advance science or technology in each of the seven PIER program areas to benefit California ratepayers since 1997. In addition, the Energy Commission has also funded and managed the Energy Innovations Small Grant (EISG) Program since 1998. The role of the EISG program is to advance research into new and innovative energy concepts and technologies whose feasibility is not yet sufficiently established to meet traditional research and development (R&D) funding requirements.
The Energy Innovations Small Grant (EISG) program supports early phase development of promising new energy technology concept. This category of projects is not covered by PIER general solicitations that focus primarily on development of established concepts. Qualifying EISG projects address one of the defined PIER RD&D areas. If the feasibility of an innovative energy concept is proven through the EISG project work, then traditional R&D funding may become available to further develop the project.
Independent Assessment Reports (IARs) are written at the completion of every EISG grant project. These reports outline the objectives of the project, discuss the successes and failures, and offer recommendations for potential future work. This report presents a collection of twenty four independent assessment reports for EISG grant projects awarded during 2004.
Keywords: Ratepayer, California Energy Commission, Energy Innovations Small Grant, EISG, Independent Assessment Report, IAR, Public Interest Energy Research, PIER RD&D, electricity, natural gas, transportation, research, energy technology concepts, project, market, outcomes, conclusions, benefits
Please use the following citation for this report:
Queen, Robert. San Diego State University Research Foundation. 2004. Energy Innovations Small Grant Program: 2004 Independent Assessment Reports. California Energy Commission. Publication number: CEC-500-2013-028.
2

TABLE OF CONTENTS
PREFACE........................................................................................................1ABSTRACT.....................................................................................................2TABLE OF CONTENTS...................................................................................3LIST OF FIGURE..........................................................................................11LIST OF TABLES..........................................................................................12EXECUTIVE SUMMARY...............................................................................13CHAPTER 1: Introduction...........................................................................15CHAPTER 2: 2004 Independent Assessment Reports.................................17
2.1 Petrophysical Interpretation of Fractures and Fluids in Geothermal Fields for Improved Energy Generation.........................................................................17
2.1.1 Abstract.................................................................................................17
2.1.2 Introduction..........................................................................................17
2.1.3 Objectives..............................................................................................18
2.1.4 Outcomes..............................................................................................19
2.1.5 Conclusions...........................................................................................20
2.1.6 Recommendations.................................................................................20
2.1.7 Overall Technology Transition Assessment..........................................20
2.2 Solid Acid Fuel Cell Utilizing Natural Gas for Distributive Power..............21
2.2.1 Abstract.................................................................................................21
2.2.2 Introduction..........................................................................................22
2.2.3 Objectives..............................................................................................22
2.2.4 Outcomes..............................................................................................23
2.2.5 Conclusions...........................................................................................23
2.2.6 Recommendations.................................................................................24
2.2.7 Overall Technology Transition Assessment..........................................24
2.3 Ceramic Electrolyte Production on Pre-Formed Intermediate Temperature Solid Oxide Fuel Cell (ITSOFC) Substrates.........................................................25
2.3.1 Abstract.................................................................................................25
2.3.2 Introduction..........................................................................................25
2.3.3 Objectives..............................................................................................27
2.3.4 Outcomes..............................................................................................28
2.3.5 Conclusions...........................................................................................303

2.3.6 Recommendations.................................................................................31
2.3.7 Benefits to California............................................................................31
2.3.8 Overall Technology Transition Assessment..........................................32
2.4 Advanced Cathode Materials for Solid Oxide Electrolyzers........................33
2.4.1 Abstract.................................................................................................33
2.4.2 Introduction..........................................................................................33
2.4.3 Objectives..............................................................................................36
2.4.4 Outcomes..............................................................................................37
2.4.5 Conclusions...........................................................................................37
2.4.6 Recommendations.................................................................................38
2.4.7 Benefits to California............................................................................38
2.5 Evaluation of Molybdenum Removal from Power Plant Waste Streams Using Innovative Nanoparticle Media.................................................................39
2.5.1 Abstract.................................................................................................39
2.5.2 Introduction..........................................................................................39
2.5.3 Objectives..............................................................................................41
2.5.4 Outcomes..............................................................................................41
2.5.5 Conclusions...........................................................................................43
2.5.6 Recommendations.................................................................................43
2.5.7 Benefits to California............................................................................43
2.5.8 Overall Technology Transition Assessment..........................................44
2.6 Low-Level Concentrating Photovoltaic System...........................................45
2.6.1 Abstract.................................................................................................45
2.6.2 Introduction..........................................................................................45
2.6.3 Objectives..............................................................................................47
2.6.4 Outcomes..............................................................................................48
2.6.5 Conclusions...........................................................................................48
2.6.6 Recommendations.................................................................................49
2.6.7 Benefits to California............................................................................50
2.6.8 Overall Technology Transition Assessment..........................................50
2.7 High Efficiency Air Conditioner on Single Phase Electricity......................51
2.7.1 Abstract.................................................................................................51
2.7.2 Introduction..........................................................................................514

2.7.3 Objectives..............................................................................................52
2.7.4 Outcomes..............................................................................................53
2.7.5 Conclusions...........................................................................................53
2.7.6 Recommendations.................................................................................53
2.7.7 Benefits to California............................................................................54
2.7.8 Overall Technology Transition Assessment..........................................54
2.8 Non-restrictive Pressure Relieve Heat Trap...............................................55
2.8.1 Abstract.................................................................................................55
2.8.2 Introduction..........................................................................................56
2.8.3 Objectives..............................................................................................57
2.8.4 Outcomes..............................................................................................58
2.8.5 Conclusions...........................................................................................59
2.8.6 Recommendations.................................................................................59
2.8.7 Benefits to California............................................................................60
2.8.8 Overall Technology Transition Assessment..........................................60
2.9 Alternative Synthetic Fuels Injector Tests..................................................61
2.9.1 Abstract.................................................................................................61
2.9.2 Introduction..........................................................................................62
2.9.3 Objectives..............................................................................................63
2.9.4 Outcomes..............................................................................................63
2.9.5 Conclusions...........................................................................................64
2.9.6 Recommendations.................................................................................65
2.9.7 Benefits to California............................................................................65
2.9.8 Overall Technology Transition Assessment..........................................66
2.10 Ion Sense Based Air/Fuel Ratio Control and Combustion Diagnostics in Stationary I/C Engines.........................................................................................66
2.10.1 Abstract.................................................................................................66
2.10.2 Introduction..........................................................................................67
2.10.3 Objectives..............................................................................................68
2.10.4 Outcomes..............................................................................................68
2.10.5 Conclusions...........................................................................................69
2.10.6 Recommendations.................................................................................70
2.10.7 Benefits to California............................................................................705

2.10.8 Overall Technology Transition Assessment..........................................71
2.11 Development of Optimization Software for an Activated Sludge System 72
2.11.1 Abstract.................................................................................................72
2.11.2 Introduction..........................................................................................72
2.11.3 Objectives..............................................................................................73
2.11.4 Outcomes..............................................................................................74
2.11.5 Conclusions...........................................................................................74
2.11.6 Recommendations.................................................................................75
2.11.7 Benefits to California............................................................................75
2.11.8 Overall Technology Transition Assessment..........................................76
2.12 Hydrogen Micro-Sensor for Real Time Diagnostic of Transformer Oil....76
2.12.1 Abstract.................................................................................................76
2.12.2 Introduction..........................................................................................76
2.12.3 Objectives..............................................................................................78
2.12.4 Outcomes..............................................................................................79
2.12.5 Conclusions...........................................................................................80
2.12.6 Recommendations.................................................................................81
2.12.7 Benefits to California............................................................................82
2.12.8 Overall Technology Transition Assessment..........................................82
2.13 Solar Generator Critical Technology Demonstration...............................83
2.13.1 Abstract.................................................................................................83
2.13.2 Introduction..........................................................................................84
2.13.3 Objectives..............................................................................................86
2.13.4 Outcomes..............................................................................................86
2.13.5 Conclusions...........................................................................................87
2.13.6 Recommendations.................................................................................88
2.13.7 Benefits to California............................................................................88
2.13.8 Overall Technology Transition Assessment..........................................89
2.14 Silicon Nanorod Solar Cells.....................................................................90
2.14.1 Abstract.................................................................................................90
2.14.2 Introduction..........................................................................................90
2.14.3 Objectives..............................................................................................93
6

2.14.4 Outcomes..............................................................................................93
2.14.5 Conclusions...........................................................................................94
2.14.6 Recommendations.................................................................................95
2.14.7 Benefits to California............................................................................96
2.15 Performance Enhancement of Microturbines by Using Wave Rotor Technology...........................................................................................................97
2.15.1 Abstract.................................................................................................97
2.15.2 Introduction..........................................................................................97
2.15.3 Objectives..............................................................................................99
2.15.4 Outcomes..............................................................................................99
2.15.5 Conclusions.........................................................................................100
2.15.6 Recommendations...............................................................................101
2.15.7 Benefits to California..........................................................................101
2.15.8 Overall Technology Transition Assessment........................................102
2.16 An Improved Wind Turbine Blade Design with Advanced Composite Materials and Processes....................................................................................102
2.16.1 Abstract...............................................................................................102
2.16.2 Introduction........................................................................................103
2.16.3 Objectives............................................................................................104
2.16.4 Outcomes............................................................................................104
2.16.5 Conclusions.........................................................................................105
2.16.6 Recommendations...............................................................................105
2.16.7 Benefits to California..........................................................................106
2.16.8 Overall Technology Transition Assessment........................................106
2.17 Concentrating Triple Junction PV Systems for Distributed Power Generation.........................................................................................................107
2.17.1 Abstract...............................................................................................107
2.17.2 Introduction........................................................................................108
2.17.3 Objectives............................................................................................110
2.17.4 Outcomes............................................................................................111
2.17.5 Conclusions.........................................................................................112
2.17.6 Recommendations...............................................................................112
2.17.7 Benefits to California..........................................................................113
7

2.17.8 Overall Technology Transition Assessment........................................113
2.18 Feasibility Study for Ceramic Proton Conductor Based Reversible Solid Oxide Fuel Cells.................................................................................................114
2.18.1 Abstract...............................................................................................114
2.18.2 Introduction........................................................................................115
2.18.3 Objectives............................................................................................116
2.18.4 Outcomes............................................................................................117
2.18.5 Conclusions.........................................................................................117
2.18.6 Recommendations...............................................................................118
2.18.7 Benefits to California..........................................................................118
2.18.8 Overall Technology Transition Assessment........................................118
2.19 High Efficiency Planar Luminescent Solar Concentrators.....................119
2.19.1 Abstract...............................................................................................119
2.19.2 Introduction........................................................................................120
2.19.3 Objectives............................................................................................121
2.19.4 Outcomes............................................................................................122
2.19.5 Conclusions.........................................................................................123
2.19.6 Recommendations...............................................................................123
2.19.7 Benefits to California..........................................................................124
2.19.8 Overall Technology Transition Assessment........................................124
2.20 Laminated Polymer Dye-Sensitized Solar Cells.....................................125
2.20.1 Abstract...............................................................................................125
2.20.2 Introduction........................................................................................125
2.20.3 Objectives............................................................................................126
2.20.4 Outcomes............................................................................................127
2.20.5 Conclusions.........................................................................................127
2.20.6 Recommendations...............................................................................128
2.20.7 Benefits to California..........................................................................129
2.20.8 Overall Technology Transition Assessment........................................129
2.21 Efficient Solar Photovoltaic Mirror Modules for Half the Cost of Today’s Planar Modules..................................................................................................130
2.21.1 Abstract...............................................................................................130
2.21.2 Introduction........................................................................................131
8

2.21.3 Objectives............................................................................................132
2.21.4 Outcomes............................................................................................132
2.21.5 Conclusions.........................................................................................133
2.21.6 Recommendations...............................................................................134
2.21.7 Benefits to California..........................................................................134
2.21.8 Overall Technology Transition Assessment........................................135
2.22 Small Efficient Turbine System for DEG and CHP Applications............136
2.22.1 Abstract...............................................................................................136
2.22.2 Introduction........................................................................................136
2.22.3 Objectives............................................................................................138
2.22.4 Outcomes............................................................................................138
2.22.5 Conclusions.........................................................................................138
2.22.6 Recommendations...............................................................................139
2.22.7 Benefits to California..........................................................................139
2.22.8 Overall Technology Transition Assessment........................................140
2.23 Flexible Hybrid Solar Cell......................................................................140
2.23.1 Abstract...............................................................................................141
2.23.2 Introduction........................................................................................141
2.23.3 Objectives............................................................................................142
2.23.4 Outcomes............................................................................................143
2.23.5 Conclusions.........................................................................................144
2.23.6 Recommendations...............................................................................145
2.23.7 Benefits to California..........................................................................145
2.23.8 Overall Technology Transition Assessment........................................146
2.24 Development of an Energy Efficient, Ultra-Thin Led Luminaire............146
2.24.1 Abstract...............................................................................................146
2.24.2 Introduction........................................................................................147
2.24.3 Objectives............................................................................................148
2.24.4 Outcomes............................................................................................149
2.24.5 Conclusions.........................................................................................151
2.24.6 Recommendations...............................................................................152
2.24.7 Benefits to California..........................................................................153
9

2.24.8 Overall Technology Transition Assessment........................................153
2.25 A Simple and Reliable FACTS Elements for Distributed Generation.....154
2.25.1 Abstract...............................................................................................154
2.25.2 Introduction........................................................................................154
2.25.3 Objectives............................................................................................155
2.25.4 Outcomes............................................................................................155
2.25.5 Conclusions.........................................................................................155
2.25.6 Recommendations...............................................................................156
2.25.7 Benefits to California..........................................................................156
2.25.8 Overall Technology Transition Assessment........................................157
LIST OF FIGURE
Figure 1: Illustrative 3D Subsurface Image......................................................18
Figure 2: Schematic Diagram Showing the Operating Principles of a Solid.....27
Oxide Fuel Cell Running on Natural Gas..........................................................27
Figure 3: Sketch of the Basic Operational Principle for A) the Solid Oxide Fuel Cell (SOFC), and When Operated in Reverse, B) a Solid Oxide Electrolysis Cell (SOEC)...............................................................................................................34
Figure 4: SOEC button cell fabrication.............................................................36
Figure 5: Nanostructured Ferric Oxide Coated to Ottawa Sand (Media #1). . .40
Figure 6: Column Uused in Molybdenum Breakthrough Studies......................40
Figure 7: Modules on Test Rack Showing Reflectors........................................46
Figure 8: Back of Module Showing Heat Sink Fins Unfolded to Vertical Position for Operation.....................................................................................................47
Figure 9: Schematic of Three Phase Motor Converted from Single Phase Operation...........................................................................................................52
Figure 10. Diagram of Pressure Relieve Heat Trap..........................................57
Figure 11: Test System Configuration...............................................................63
Figure 12: Measurement Probe Based on the Spark Plug................................68
Figure 13: Airflow Reduction Due to Optimization...........................................73
Figure 14: Side View of Proposed Hydrogen Sensor........................................78
Figure 15: Completed Sensor............................................................................78
Figure 16: Schematic of SolarCAT Cycle..........................................................85
10

Figure 17: SolarCAT Turbo Alternator Final Design.........................................86
Figure 18: Schematic of Proposed Radial Pn Junction Nanorod Solar Cell......92
Figure 19: Schematic of a Recuperated Gas Turbine Topped by a Four Port Wave Rotor........................................................................................................98
Figure 20: Characteristic Fiberglass Blade Cross Section Showing Sandwich Laminate Hollow Section Construction...........................................................103
Figure 21: Schematic of Modular Concept......................................................109
Figure 22: Optical Design...............................................................................110
Figure 23: Schematic of the Dual Environment Test Stand and Reversible Fuel Cell..................................................................................................................116
Figure 24: Schematic of Luminescent Solar Concentrator.............................121
Cell in Top View (top) and Side View (bottom)...............................................121
Figure 25: DSSC Solar Cell in Testing Setup and Side View..........................126
Figure 26: Panel with Mirrors.........................................................................131
Figure 27: Low Profile Tracker.......................................................................132
Figure 28: Schematic of Device......................................................................137
Figure 29: Schematic of Device......................................................................142
Figure 30: Ultra-Thin LED Luminaire Prototype installed in the Gonio Photometer During Testing.............................................................................148
LIST OF TABLES
Table 1: Comparison of Power and Efficiency...................................................53
Table 2: Combustion Gas Composition..............................................................64
11

EXECUTIVE SUMMARY
The Energy Innovations Small Grant (EISG) program is a component of the Public Interest Energy Research (PIER) Program managed by the California Energy Commission. The PIER Program benefits California electric and gas ratepayers by funding energy research, development, and demonstration (RD&D) projects that are not adequately provided for by the competitive and regulated energy markets.
The Energy Commission recognizes the need for a program to support the early development of promising new energy technology concepts that are not mature enough to be covered by PIER general solicitations. The Energy Commission has established the EISG program to meet this need.
This report is a compilation of the Individual Assessment Reports (IARs) for grant projects that were awarded in 2004 and that have not been previously published.
All data sources for tables and figures are from the author unless otherwise noted.
12


CHAPTER 1: Introduction
2004 EISG Projects with IARs Included in this SectionProject Researchers EISG FundingPetrophysical Interpretation of Fractures and Fluids in Geothermal Fields for Improved Energy Generation
3DGeo Development Inc $75,000
Solid Acid Fuel Cell Utilizing Natural Gas for Distributive Power Applications
Superprotonic Inc. $74,600
Ceramic Electrolyte Production on Pre-Formed Intermediate Temperature Solid Oxide Fuel Cell (ITSOFC) Substrates
University of California, Berkeley
$74,626
Advanced Cathode Materials for Solid Oxide Electrolyzers
Boston University $75000
Evaluation of Molybdenum Removal from Power Plant Waste Streams Using Innovative Nanoparticle Media
Kennedy/Jenks Consultants $74,837
Low level Concentrating Photovoltaic System
J. Schripsema & Associates LLC $75,000
High Efficiency Air Conditioner on Single Phase Electricity
Smith and SunR $75,000
Non-Restrictive Pressure Relieve Heat Trap
Advanced Conservation Technology, Inc.
$75,000
Alternative Synthetic Fuels Injector Tests
Clean Energy Systems Inc. $75,000
Ion Sense Based Air/Fuel Ratio Control and Combustion Diagnostics in Stationary I/C Engines
Advanced Engine Technologies Corporation
$74,011
Development of Optimization Software for an Activated Sludge System
Ekster and Associates $75,000
Hydrogen Micro-Sensor for Real Time Diagnostic of Transformer Oil
Kebaili Corporation $75,000
Solar Generator Critical Technology Demonstration
Brayton Energy, LLC $75,000
Silicon Nanorod Solar Cells California Institute of Technology
$75,000
2

Performance Enhancement of Microturbines by Using Wave Rotor Technology
Michigan State University
.
$75,000
Improved Wind Turbine Blade Design With Advanced Composite Materials and Processes
WebCore Technologies, Inc $75,000
Concentrating Triple-junction PV Systems for Distributed Power Generation
University of California, Merced $75,000
Feasibility Study for Ceramic Proton Conductor-Based Reversible Solid Oxide Fuel Cells
National Fuel Cell Research Center
$74,977
High Efficiency Planar Lumines-cent
Solar Concentrators
University of California, Santa Cruz
$75,000
Laminated Polymer Dye Sensitized Solar Cells
Rutgers, the State University of New Jersey.
$75,000
Efficient Solar Photovoltaic Mirror Modules for Half the Cost of Today’s Planar Modules
JX Crystals, Inc. $75,000
Small Efficient Turbine System for DEG and CHP Applications
Altex Technologies Corporation $74,796
Flexible Hybrid Solar Cell InterPhases Research $75,000
Development of an Energy Efficient, Ultra Thin LED Luminaire
Lighting Research Center at Rensselaer Polytechnic Institute
$75,000
A Simple and Reliable FACTS Elements for Distributed Generation
Power Electronics Laboratory
University of California
$75,000
3

CHAPTER 2:2004 Independent Assessment Reports The Energy Innovations Small Grant (EISG) program awards numerous grants for innovative energy research projects every year. Independent Assessment Reports (IARs) highlight the project outcomes for each of the EISG projects. This chapter includes the IARs from grant projects that were awarded in 2004 that have not previously been published.
2.1 Petrophysical Interpretation of Fractures and Fluids in Geothermal Fields for Improved Energy Generation
Awardee: 3DGeo Development Inc.
Principal Investigator: Dimitri Bevc
2.1.1 AbstractGeothermal production of electricity is an important renewable energy technology in California. Significant development of geothermal has occurred over the years, and geothermal is one of the most mature and most reliable of renewable energy technologies. Geothermal resources are resident in geologic structures that are complex and characterized by faults, rock fractures, and other structures that are not evident at the surface. Improved modeling, or imaging, of the subsurface environment can lead to improved targeting of well drilling and maintenance activity. Drilling and maintenance of geothermal wells are high cost endeavors, and improving their effectiveness and efficiency should lead to overall cost reductions for geothermal energy production.
The researchers demonstrated that two dimensional migration of synthetic seismic data from a typical reservoir model can resolve the geological structure despite extremely strong and sharp velocity contrasts. In addition, this approach can infer small fracture zones.
Keywords: Geothermal reservoir characterization, seismic imaging, seismic attributes, graben structure, direct geothermal indicators, rock physics, petrophysical analysis
2.1.2 IntroductionGeothermal production of electricity is an important renewable energy technology in California. Significant development of geothermal has occurred over the years, and geothermal is one of the most mature and most reliable of renewable energy technologies. Geothermal resources are resident in geologic structures that are complex and characterized by faults, rock fractures, and other structures that are not evident at the surface. Improved modeling, or imaging, of the subsurface environment can lead to improved targeting of well drilling and maintenance activity. Drilling and maintenance of geothermal wells are a high cost endeavor,
4

and improving their effectiveness and efficiency should lead to overall cost reductions for geothermal energy production.
Over the past decade, seismic imaging methods in hydrocarbon exploration have improved greatly. Pre-stack depth migration has become the preferred tool to image complex geological structures. In addition to the structural information, seismic surveys also provide information about reflectivity which depends on the impedance contrast of the rocks and on the seismic wavelength. This information, combined with petrophysical models, provides critical information for the producers of oil and gas. The same methodology may be applicable to geothermal fields to delineate structural features and to obtain petrophysical information.
Geothermal activity also causes rocks to fracture and to crack, which builds preferred pathways for geothermal fluids and can be imaged by seismic methods.
In this project, researchers proposed to develop and demonstrate a procedure and computer software for improving the efficiency of geothermal resource exploration and assessment, permeability detection, mapping and well siting, resource drilling and completion, and reservoir monitoring. The process used seismic waves generated on the surface, with multiple sensors placed in large arrays on the surface. The process measured the reflection and velocity of the seismic waves through the rocks and rock structures and required sophisticated computer modeling to interpret the sensors’ signals. The process differed from that used traditionally in subsurface modeling, which uses electrical pulses that travel at different velocities through different rock structures. Figure 1 shows an example of a subsurface image.
Figure 1: Illustrative 3D Subsurface Image
Light and grey areas show subsurface features evident from seismic reflections.Image shows -500 to -25,000 ft base on modeling seismic wave velocity.
2.1.3 ObjectivesThe goal of this project was to prove the feasibility of using reflection seismic data to better estimate and interpret fracture zones and the nature of fluids in
5

geothermal systems. This would provide energy producers key information that would allow them to greatly increase the efficiency and economy of geothermal energy generation. This project’s primary measurable technical objective was to produce a subsurface image of the Direct Geothermal Indicators (DGI) in the Coso Geothermal Field. The researchers established the following project objectives:
1. Develop a method for obtaining direct geothermal indicators (DGI) from seismic data.
2. Validate the approach against synthetic data of a geothermal reservoir model.
3. Demonstrate the validity of DGI data for the characterization of geother-mal reservoirs by matching predictions from attribute analysis with known geological data.
2.1.4 Outcomes 1. The researchers developed a process and computer program to translate
seismic signals to images of subsurface rock features. That required exten-sive preprocessing of data compared to similar sized data sets in hydrocar-bon exploration. The main preprocessing steps involved were f-k filtering, static correction, pre-stack energy enhancement, turning ray tomography for the shallow velocity model, and migration velocity analysis (MVA) for greater depths. The subsurface at the Coso Geothermal Field shows signifi-cant three dimensional structures. Hence, the researchers developed three dimensional processing to obtain detailed accurate information about the ge-ology. All previously available seismic surveys in the field were acquired in two dimensional fashion. At the intersection of two transects, the re-searchers were able to synthesize a three dimensional image. The re-searchers focused their investigation on a deep reflector at ~16,000 ft depth. They constructed synthetic data of a geothermal reservoir and trans-lated it into a reservoir model. The geothermal reservoir model consisted of a graben structure with exceptionally strong and sharp velocity contrasts. A fractured zone at about 1000 m (~3300 ft) depth in the center of the graben structure identified the zone of interest. The researchers were able to image the structural features with pre-stack depth migration and could infer the fractured zone from the common image signal groups. However, the frac-tured zone was too small compared to the seismic wavelength for a petro-physical analysis.
2. The offset stacks, the energy, and the frequency proved to be the most pow-erful seismic attributes in the Coso Geothermal Field. The far offset stack combined with the energy built an indicator for the seismic response of the deep reflector. The frequency power spectrum showed distinct peaks, which may correlate with the reflector thickness. The researchers applied proce-dures commonly applied in hydrocarbon exploration to identify a Direct Geo-thermal Indicator.
3. There are no well logs available at the desired depth to tie the seismic at-tributes to actual reservoir properties within the Coso Geothermal Field. Consequently, the researchers were not able to directly correlate imaging data with physical well data obtained from core or similar deep hole rock samples. Due to the great depth of the reflector, there is limited geological information available. The deepest borehole in the Coso Geothermal Field
6

reaches 10,500 ft. However, the reflector has been confirmed by tele-seismic events. Wilson, et al1 interpreted the reflector as the top of a single shallow magma reservoir at approximately 16,000 ft depth.
2.1.5 ConclusionsThe methodology for obtaining direct geothermal indicators (DGI) from seismic data is very similar to the methodology applied in hydrocarbon exploration. However, the required preprocessing is much more extensive due to the exceptionally large velocity contrasts for seismic waves and the three dimensional structure of the subsurface in geothermal fields. Three dimensional seismic surveys are required to obtain accurate information about the geological structure, which makes a petrophysical analysis feasible.
This project demonstrated improved processing and analysis of stimulated seismic data in geothermal areas similar to the Coso Geothermal Field. Based on the demonstrated performance of the processing methodology and the petrophysical analysis, the researchers demonstrated the feasibility of performing this type of analysis as a commercial service.
2.1.6 RecommendationsThis study showed that the power factor algorithm was not sufficiently general to be used in varying wind speed conditions. Therefore a more general algorithm should be developed that takes into account this situation.
Also needed is more testing in controlled wind tunnel situations for further verification of the algorithms.
The most important recommendation is in the writing of this report. The technical complexity is too much for the typical reviewer, and effort is needed in making the description of the algorithms and the application of the algorithms more understandable and clear.
After taking into consideration (a) research findings in the grant project, (b) overall development status, and (c) relevance of the technology to California and the PIER program, the Program Administrator has determined that the proposed technology should be considered for follow on funding within the PIER program.
Receiving subsequent funding ultimately depends upon (a) availability of funds, (b) submission of a proposal in response to an invitation or solicitation, and (c) successful evaluation of the proposal.
2.1.7 Overall Technology Transition AssessmentAs the basis for this assessment, the Program Administrator reviewed the researchers’ overall development effort, which includes all activities related to a coordinated development effort, not just the work performed with EISG grant funds.
1 Wilson, C.K., C.H. Jones, and H.J. Gilbert, “Single-Chamber Silicic Magma System Inferred from Shear Wave Discontinuities of the Crust and Uppermost Mantle, Coso Geothermal Area, California,” Journal of Geophysical Research, (2003).
7

2.1.7.1 Marketing/Connection to the Market The findings of this project were presented at the 31st Workshop on Geothermal Reservoir Engineering 2006 at Stanford University.2 The researchers participated in the activities of the Geothermal Resource Council to survey and develop potential market opportunities.
2.1.7.2 Engineering/TechnicalThe researchers planned to conduct a full 3-D demonstration of their technology.
2.1.7.3 Legal/Contractual The researchers had not applied for a patent. As this concept is primarily software coding and trade secret, the researchers intend to protect their intellectual property by not releasing the software source code.
2.1.7.4 Environmental, Safety, Risk Assessments/ Quality Plans Collection of seismic data can create temporary environmental issues from noise associated with the propagation of seismic waves used to probe subsurface rock structures.
2.1.7.5 Production Readiness/Commercialization The researchers defined a path forward that includes development and testing of beta version software and dissemination of results at trade conferences and other venues. They appear ready to launch the service offering within one to two years.
2.2 Solid Acid Fuel Cell Utilizing Natural Gas for Distributive Power
Awardee: Superprotonic Inc.
Principal Investigator: Calum Chisholm
2.2.1 AbstractSolid acid fuel cells (SAFCs) are a new class of fuel cells which operate at intermediate temperatures of between 200°C and 300C and utilize a solid state proton conducting electrolyte. In this work, a SAFC was demonstrated with peak power densities of 415 and 327mW/cm2 while operated at 250C in H2/O2 and H2/air configurations, respectively. Anode platinum catalyst loadings were reduced to 0.15 mg/cm2 with no loss in performance, while cathode loadings were still quite high, 6 mg/cm2. The project demonstrated that performance and catalyst utilization are directly related to the size of the electrolyte particles. Thermal cycling was performed on a SAFC through 15 thermal cycles with no catastrophic failure of the cell. Over 1000 hours of operation demonstrated a degradation rate in peak power density of approximately 64 μW /cm2h.
2 Kaelin, B., M.M. Fliedner, D.Bevc, and F. Monastero, “Seismic Attributes in Geothermal Fields,” 31st Workshop on Geothermal Reservoir Engineering, (2006).
8

Keywords: Solid acid fuel cells, solid acid electrolytes, fuel cells, proton conductors, intermediate temperature fuel cells, cesium dihydrogen phosphate, CsH2PO4
2.2.2 IntroductionAdvanced fuel cell technologies are an environmentally preferred generation approach, offering fuel use efficiency greater than 60 percent and extremely low emissions. Fuel cells need to experience additional and significant advancement to become cost competitive with other advanced power generation technologies. Current fuel cell systems are complicated and costly, in large part because of balance of plant requirements. Innovative concepts can differ from the traditional fuel cell RD&D in that they investigate the balance of plant, controls, materials, and other aspects of fuel cell technology that have not been previously investigated. Innovative and promising concepts include: new fuel cell types, contaminant tolerance (e.g. carbon monoxide, sulfur) water handling and thermal management. Simplifying balance of plant requirements should help drive fuel cells towards cost competitiveness.
The combination of proton transport in the solid state, rather than liquid, and elevated operational temperatures gives a new class of fuel cells, solid acid fuel cells (SAFCs), potential benefits over other fuel cell systems with respect to system complexity and therefore cost. By eliminating the aqueous component, researchers anticipated the water recirculation hardware would not be necessary and thermal management issues would be relieved, greatly simplifying the overall fuel cell system. Elevated temperature of operation should enhance catalyst performance thereby increasing fuel efficiency and further simplify the overall system by improving carbon monoxide tolerance and allow for the possibility of greatly reducing or even replacing the platinum catalyst with another base metal thereby dramatically reducing the cost of the fuel cell stack.
In this project researchers demonstrated a new solid acid fuel cell (SAFC). SAFCs are a new class of fuel cells that operate at intermediate temperatures (between 200°C and 300C) and utilize a solid state proton conducting electrolyte. In this work, a SAFC was demonstrated with peak power densities of 415 and 327mW/cm2
at 250C in H2/O2 and H2/air configurations, respectively. Anode catalyst loadings of platinum were reduced to 0.15 mg/cm2 with no loss in performance, while cathode loadings were still quite high, 6 mg/cm2. Reduction of platinum requirements is a key in reducing costs of advanced fuel cells.
2.2.3 ObjectivesThe goal of this project was to determine the feasibility of improving the performance, cost, and durability of SAFCs to the point of commercial viability. The researchers established the following objectives:
1. Reduce electrolyte thickness to less than 20 μm while increasing power den-sity in H2/O2 configuration to above 1000 mW/cm2.
2. Reduce platinum (Pt) loadings in catalyst layers to less that 0.1 mg/cm2 and reduce cost of Pt in the membrane electrode assembly (MEA) to around one tenth of the state-of-the-art values (approximately $7/m2).
9

3. Measure long-term stability over 100 cycles from 25-250C in H2/O2 configu-ration and record MEA stability over 1000 hours of operation at 250C in H2/O2 configuration, drawing 500mW/cm2.
2.2.4 Outcomes 1. The researchers fabricated SAFC, with electrolyte thicknesses of 200, 100,
75, 50, 35, 25 μm. Unexpectedly, with the thinner electrolyte predicted im-provements in peak power density were not achieved. These results suggest that performance of the SAFC fuel cell at thickness of less 30 μm are domi-nated primarily by activation energy and mass transport losses. The re-searchers achieved high power density of more than 415mW/cm2 on H2/O2 and 327mW/cm2 on H2/air through the development of a slurry casting tech-nique for making ultra-thin electrolyte membranes and by increasing the mass transport through the cathode gas diffusion layer.
2. The researchers reduced platinum catalyst loading on the fuel cell anode to 0.15mg/cm2 by developing a microporous support layer and the incorporation of catalysts supported on high surface area carbons.
3. The researchers demonstrated durability of SAFC through 15 thermal cycles and the operational lifetime of over 1000 hours with a power degradation rate of less than 64μW/cm2h.
2.2.5 ConclusionsThe researchers demonstrated the feasibility of reducing the thickness of electrolyte and established minimum thickness beyond which no further performance enhancements are achieved. The researchers also demonstrated performance with reduced catalyst loading. Thermal cycling and long term durability were measured, and the researchers demonstrated a degradation of 16μW/cm2h in peak power. The goal of achieving low platinum loadings was not achieved. For the anode, the activation over potentials are at least an order of magnitude too high at low platinum loadings, and for the cathode the situation is worse.
The third goal of demonstrating long term stability was not achieved. Even at negative 16μW/cm2h, the degradation was too high and accelerated after only 70 hours.
Performance of the SAFC using air should provide further simplification of the fuel cell system by avoiding the need for pure oxygen. At the operating temperature of 2000C-300 0C, water condensation should not be an issue, but may be under on/off cycles.
Platinum loading of the anode is comparable to loading for other state-of-the-art fuel cell types. Cathode loading are about 10 times that of comparable fuel cells. Cathode loading of platinum catalyst reduces the overall cost savings achieved from reducing catalyst loading in the anode.
Higher power densities and lower peak power degradation (both from thermal cycling and from duration) need to be achieved for SAFC to compete directly with other fuel cell types and become commercial.
The feasibility of improving the performance, cost, and durability of SAFCs to the point of commercial viability was not established.
10

2.2.6 RecommendationsThe researchers should test the SAFC with natural gas or design a system using a reformer. The researchers should work to improve power density, catalyst loading, and durability and ultimately test full scale cell stacks in prototype configuration. The latter should include all necessary balance of plant including fuel and oxidant systems, thermal management, and related electronics, as well as physical shock testing. The researchers should consider other noble or base metals as catalysts. Water condensation at the cathode should be investigated for on/off operation. Given the very thin electrolyte, future work should include short circuit testing.
After taking into consideration (a) research findings in the grant project, (b) overall development status, and (c) relevance of the technology to California and the PIER program, the Program Administrator has determined that the proposed technology should be considered for subsequent funding within the PIER program.
Receiving subsequent funding ultimately depends upon (a) availability of funds, (b) submission of a proposal in response to an invitation or solicitation, and (c) successful evaluation of the proposal.
2.2.7 Overall Technology Transition AssessmentAs the basis for this assessment, the Program Administrator reviewed the researchers’ overall development effort, which includes all activities related to a coordinated development effort, not just the work performed with EISG grant funds.
2.2.7.1 Marketing/Connection to the Market The researchers claimed that they received more than $10 million in venture capital funding after completing this project. Early in 2008, the researchers announced they would ship the first commercial prototypes to energy systems makers. By September of 2008 the researchers claimed their “technology was being tested by customers.” In addition to automotive application, the researchers are targeting the small residential and commercial distributed generation market.
2.2.7.2 Engineering/TechnicalSuperprotonic appears to have made great progress in the engineering/technical areas after the completion of this project. Because the work is privately funded, little has been published to describe that progress.
2.2.7.3 Legal/Contractual The researchers have been issued patents number 6,468,684 and 7,125,621 and applied for five additional patents. They have received venture capital from US Venture Partners, although the specifics of that agreement are not public.
2.2.7.4 Environmental, Safety, Risk Assessments/ Quality Plans These plans must be completed prior to commercialization.
2.2.7.5 Production Readiness/Commercialization At the completion of this project the concept was not ready for production or commercialization. The company prepared a commercialization plan in February 2007. In 2008 it began prototype production.
11

2.3 Ceramic Electrolyte Production on Pre-Formed Intermediate Temperature Solid Oxide Fuel Cell (ITSOFC) Substrates
Awardee: University of California, Berkeley
Principal Investigator: Lutgard De Jonghe
2.3.1 AbstractThe current generation of cerium gadolinium oxide (CGO) based solid oxide fuel cells (SOFCs) reduce the sintering temperature of CGO from 1400C to 1000C using transition metal dopants. The problem with this is that the transition metal dopants remain in the CGO after sintering, and if used in too great a quantity can form detrimental electronically-conducting, grain boundary pathways. A volatile lithium nitrate dopant was used to produce dense, crack free, bulk CGO samples at 800C. Experiments have also shown that lithium is very mobile at elevated temperatures in CGO, indicating it should be possible to remove the lithium dopant after sintering. Microstructural, conductivity, and compositional analyses suggest a Li-Gd-O liquid phase present during sintering induces the low temperature sintering of CGO. Using economical colloidal spray deposition processes along with lithium nitrate dopant, dense, crack free constrained CGO films were produced at 950ºC on an inert ceramic substrate. The processing procedures for firing a constrained, metal supported, lithium doped CGO film in a reducing (pO2=10-17) atmosphere outside CGO’s stability range have also been identified in this project.
Keywords: Cerium gadolinium oxide, low temperature sintering, lithium, dopant, SOFC
2.3.2 IntroductionFuel cells are an attractive power source in distributed electrical resource (DER) systems. In some applications DER can offer the consumer lower costs, higher service reliability, high power quality, increased energy efficiency, and energy independence. Distributed generation can offer utilities the advantage of incremental capacity and the deferral of system upgrades.3 Fuel cell system capacities generally run in the range 5 kW to 250 kW for residential, commercial, and light industry applications, however large scale capacities of 100s of MW sizes are possible.4 The cells operate by combining hydrogen and oxygen to generate electricity. The oxygen can be supplied by air while the hydrogen is either supplied directly or stripped from a hydrogen containing fuel such as methane in a reforming process. The only effluents from cell operation are water vapor and primarily carbon dioxide from the reforming process if a hydrocarbon source of hydrogen is employed. In general the fuel cell effluent stream is largely free of major atmospheric pollutants. Of the five leading types of fuel cells, the solid oxide electrolyte fuel cell (SOFC) is attractive because of its very high efficiency and tolerance for impurities in the fuel. A SOFC system can achieve 50+ percent electrical efficiency. Its overall energy efficiency can be 80 percent with waste heat utilization.5 However, a drawback of present day SOFCs is that they are based on 33 http://energy.ca.gov/distgen/background/background.html4 R.M. Ormerod, “Solid Oxide Fuels Cells”, Chem. Soc. Rev. 32, 17 (2003).5 http://www.electricity-today.com/et/june00/fuel2.htm
12

an ionically conducting solid oxide electrolyte of yttrium stabilized zirconia (YSZ) which must be operated at temperatures above 850oC to have sufficient electrical conductivity. This temperature level requires the internal electrical interconnects and seals to be electronically conducting ceramics2 or expensive metal alloys. If the YSZ electrolyte could be replaced by a lower operating temperature electrolyte and the operating temperature reduced to below 700oC, less expensive interconnects such as stainless steel could be used with significantly lower system costs. Two lower temperature electrolyte alternatives to YSZ have been identified, lanthanum gallate and gadolinia doped ceria (CGO).2 CGO is the subject of this research project.
At the time of this report the cost of a commercial competing type of fuel cell (phosphoric acid electrolyte) is $4000/kW uninstalled and, for a 200kW size unit, is $5500/kW installed.6 SOFC are less well developed but their long term, uninstalled cost is projected to be in the range $1000-1500/kW.4 The U.S. Department of Energy formed the Solid State Energy Conversion Alliance (SECA) with a goal of producing a solid state fuel cell module that would cost no more than $400/kW.7 At this price fuel cells would compete with gas turbine and diesel generators.5 Reducing the cost of high temperature internal interconnects and seals would aid in the effort to reduce the cost of SOFC systems and would lower the cost of electricity to the ratepayer through lower capital and operating costs. It could reduce maintenance costs as well. Another benefit to the ratepayer would be reduced production of atmospheric pollutants compared to conventional fossil fuel combustion generators. Per kilowatt-hour fuel cells release up to 50 percent less CO2 emissions and up to 99 percent less NOx / SOx than fossil fuel power plants.8
The higher level of emission reductions apply when conventional power plants operate at part load where they are less efficient. SOFCs retain high efficiency over a broad load range.
Figure 2 shows a schematic of an SOFC running on methane. Both the anode and cathode must be electronically conducting and permeable to gas. The methane is catalytically reformed at the anode to hydrogen and carbon monoxide by adding steam or oxygen. Oxygen is added at the cathode to produce oxygen ions which diffuse through the electrolyte carrying electric current. The solid electrolyte must be dense and sealed against gas leaking through it. It should be thin to minimize its electrical resistance losses. Cells have a voltage on the order of 0.7V and power densities on the order of 500mW/cm2. Individual cells are interconnected together for increased power and voltage. The key advancement of science needed to per-mit the use of less expensive interconnects in an SOFC is the development of an improved solid oxide electrolyte material that will operate below 700oC. The re-searchers proposed to investigate metal anode supported thin membranes of ce-ramic CGO. The substrates would be preformed porous structures to allow the pas-sage of reactant gases and made of inexpensive stainless steel. A colloidal suspen-sion of CGO and dopant powders would be air brushed onto the substrate and con-strain-sintered to form a supported membrane. Ordinarily CGO must be sintered above 1400oC to obtain dense films of CGO. However at this temperature the por-ous stainless steel substrates would be destroyed. Building on their work at LBNL 6 http://www.energy.ca.gov/distgen/equipment/fuel_cells/cost.html.7 http://www.fossil.energy.gov/programs/powersystems/fuelcells/8 http://www.renewables.ca/h.html.8.
13

the researchers proposed the addition of adding small amounts of lithium as a sin-tering aid to the CGO powders to reduce the sintering temperature below 1000oC, a tolerable level for the stainless steel components.
Figure 2: Schematic Diagram Showing the Operating Principles of a Solid Oxide Fuel Cell Running on Natural Gas
2.3.3 ObjectivesThe goal of this project was to determine the feasibility of forming dense CGO membranes on porous metallic support electrodes and to evaluate their performance in laboratory intermediate temperature SOFCs. The researchers established the following project objectives:
1. Synthesize and evaluate bulk CGO pellets sintered at temperatures between 850°C and 1100C. Demonstrate sintered pellet densities >95 percent of the theoretical density and ionic conductivities within 10 percent of the highest reported in the literature.
2. Identify the best processing atmosphere to achieve sufficient densification at temperatures equal to or below 800C.
3. Prepare porous metal supports (substrates) using powder metallurgy tech-niques. Demonstrate a match between the metal and doped-CGO thermal ex-pansion coefficients to within 10 percent.
4. Colloidally deposit crack free, doped CGO films on (porous) metal sub-strates. Obtain green films devoid of drying cracks.
5. Constrain sinter dense, crack free doped CGO electrolytes on porous metal substrates. Obtain electrolyte films that are free of cracks and intercon-nected pores.
14

6. Determine the influence of the substrate porosity on the critical cracking thickness. Make a plot of critical cracking thickness versus substrate pore size.
7. Fabricate a metal supported doped CGO SOFC.
8. Characterize the metal supported doped CGO SOFC between 500°C and 700C using IV techniques. Demonstrate open circuit potentials of 0.7 V or higher at 650C and power densities greater than 350mW/cm2 between 600°C and 650C.
2.3.4 Outcomes 1. The researchers performed dilatometry measurements from room tempera-
ture to 1400C on CGO pellets doped with various Li salts. They observed rapid densification. A pellet doped with 3 mole percent Li nitrate and sin-tered at 800C for one hour had a relative density of 98.5percent. The re-searchers reported this as the lowest sintering temperature ever recorded in this system. The 3 mole percent lithium nitrate doped CGO pellets sintered at 800C had measured ion conductivities in line with pure CGO at tempera-tures below ~400C. However, above ~400C the samples suffered a loss in conductivity. The researchers found that a Li rich electrically insulating phase accumulated at the sample electrode interface when heated above ~400C. After sintering films, it should be possible to remove Li by evapora-tion and thus the outcome of loss of conductivity in pellets was not consid-ered a serious problem by the investigators.
2. Low temperature sintering was carried out in atmospheres of dry air, ambi-ent air (60 percent relative humidity at 25C), and wet air (100 percent rela-tive humidity at 25C). Bulk dilatometry did not reveal any differences in the densification behavior. However microscopic examination indicated loss of Li at the pellet edges in humid air. Thus dry air was identified as the best processing atmosphere to achieve sufficient densification.
3. The researchers prepared porous metal supports (substrates) using type 446 stainless steel9 and powder metallurgy techniques. They measured a poros-ity of 25 percent. The report gives a dilatometry determined value of 12.5X10⁻⁶/K for the thermal expansion coefficient of doped CGO in the Ap-pendix (a slightly different value of 12X10-6/K is given in the report body) compared to the reported coefficient of “metal” substrate (assumed to be 446 stainless steel) of 12.1X10⁻⁶/K . This difference is 3.3 percent. A problem was found with 446 alloy substrates due to diffusion of Si from the 446 alloy into the supported CGO film which degraded its electrical conductivity. The investigators report that later work with a binary alloy of 70 percentFe-30 percentCr gave better results.
4. This objective was to colloidally deposit crack free, doped CGO films on (por-ous) metal substrates and obtain green films devoid of drying cracks. Due to problems encountered in firing CGO films on 446 stainless steel substrates (see Outcome 5 below), preliminary attention was shifted from colloidal de-position on porous metal substrates to colloidal deposition on dense sub-strates of bulk CGO and 446 metal substrates. It was found with both of the dense substrates that crack free green films of CGO can be colloidally de-posited to thickness of hundreds of microns.
99 http://www.peaksensors.co.uk/sheath-material-fe.html15

5. The objective was to produce dense, doped CGO electrolyte films on porous metal substrates that are free of cracks and interconnected pores. Unfortu-nately, the researchers found that firing CGO directly on Type 446 stainless steel in air resulted in Cr volatilization, Cr migration into the CGO, and the formation of a thick, iron oxide layer on the steel. Subsequent attempts to fire CGO/446 composites at a lower, externally set oxygen partial pressure (of 10-7) at 1000C resulted in severe CGO reduction (indicated by a black, i.e. electronically conducting, color to the CGO, and a porous, cracked CGO layer) even though CGO at 1000C should be stable to lower pO2 levels (as low as 10-11). It was inferred that the CGO was reduced by Cr in the stainless steel in contact with the CGO. The investigators determined that the major challenges in sintering CGO on steel were 1) to sinter at a temperature hot enough to densify the CGO, yet cool enough to prevent the formation of a thick, resistive chromium oxide layer, 2) to sinter with an atmosphere of lithium concentration high enough so that the lithium remained in the CGO during sintering, 3) to sinter in an oxygen partial pressure low enough so that a poorly conducting iron oxide layer was not formed yet not so low that the CGO itself was reduced, and 4) to prevent Cr migration into the CGO electrolyte and other parts of the cell. Due to these initial problems of firing CGO films on stainless steel, constrain sinter studies were limited to dense (non-porous) substrates for simplicity. It was reported that crack free Li doped CGO films can be constrain sintered on pre-formed CGO substrates at temperatures down to 950oC. It was found that the films had to be first cold pressed to 2000psi and firing carried out in a Li saturated atmosphere. The films on CGO substrates were free of cracks at all thicknesses tested (up to 100µ). Above film thickness of 30µ however, they delaminated from the CGO substrate. The thickest film prepared on metal substrate was 12µ, although the film was not fully dense. Importantly, the film on metal was crack and delamination free indicating good mechanical properties, but presumably Cr contamination was still a problem to be solved (see Outcome 9 below).
6. This objective was to determine the influence of the substrate porosity on the critical cracking thickness and make a plot of critical cracking thickness versus substrate pore size. As a result of the problems encountered on sin-tering CGO films on stainless steel this work was not carried out.
7. Due to the above problems of sintering CGO on stainless steel, the objective to fabricate a metal supported doped CGO SOFC was not attempted.
8. Due to the outcome of Objective 7 above, it was not possible to characterize a metal-supported doped CGO SOFC.
9. To circumvent the problems of sintering CGO films in contact with stainless steel, the researchers fired a FeCr|NiO-CGO|15molpercentLi doped CGO|NiO-CGO composite at 900C with an externally set oxygen partial pressure of 10-17. They chose this pO2 because it was the equilibrium Fe/FeO oxygen partial pressure at 900C and should prevent the formation of an extensive iron oxide layer. Even though this pO2 was below the 900C CGO reduction limit of 10-14, it was hoped that the surrounding NiO-CGO layers and the short exposure time at elevated temperature would prevent extensive CGO reduction. Optical micrographs did show that if there was CGO reduction, it was not enough to cause cracking. Unfortunately, the CGO film produced in this experiment was only 80 percent dense (however see Conclusion 9 be-low). The investigators speculated that by increasing the temperature or
16

time at 900C it may be possible to produce a 100 percent dense CGO elec-trolyte in this way.
2.3.5 Conclusions1. Densification of doped CGO pellets was demonstrated after sintering for
only one hour at 800C. Thus the low temperature densification objective was met. Unfortunately these sintered pellets suffered a loss in conductivity above ~400C. Since a SOFC operating temperature would be above 600C, it is concluded that the conductivity goal was not met. The explanation of the investigators is that a Li rich insulating phase accumulates at the sample electrode interface is the problem. They postulate that working SOFC films would not have significant amounts of Li remaining due to its post sintering removal, but this important fact of Li removal still has to be demonstrated.
2. This objective was met. Dry air was identified as the best processing atmos-phere to achieve sufficient densification.
3. Metal substrates were prepared by powder metallurgy with porosity of 25 percent. Thus the porosity objective was met. Also, measurements demon-strated a thermal expansion coefficient match between doped CGO and a metal (presumably 446 stainless steel) substrate material of 3.3 percent eas-ily meeting the goal of a match to within 10 percent.
4. This objective was only partially met. Due to problems encountered in firing CGO films on 446 stainless steel substrates, attention was shifted from depo-sition on porous metal substrates to deposition on dense substrates. It was established that with both non-porous CGO and metal substrates crack free green films of CGO can be colloidally deposited to thickness of hundreds of microns. Crack free films still have to be demonstrated with porous metal substrates.
5. This objective was only partially met in that sintered doped CGO films which were free of cracks and interconnected pores were prepared on dense sub-strates, not porous metal substrates.
6. The objective to determine the influence of the substrate porosity on the critical cracking thickness and plot critical cracking thickness versus sub-strate pore size was not met because films on porous substrates were not in-vestigated.
7. Films on porous substrates were not investigated, thus the objective to fabri-cate a metal supported doped CGO SOFC could not be met.
8. The objective characterizing a metal supported doped CGO SOFC to meet performance targets was not met.
9. To circumvent the problems of sintering CGO films in contact with stainless steel, the investigators fired a FeCr|NiO-CGO|15mole percentLi doped CGO|NiO-CGO composite at 900C with an externally set low oxygen partial pres-sure of 10-17. Even though this pO2 was below the 900C CGO reduction limit of 10-14 there was not apparent CGO reduction. However, a problem was that the CGO film produced in this experiment was only 80 percent dense. It is concluded that this porosity of 20 percent is perhaps not surprising in view of the large amount (15 percent) of Li dopant in the film since it was found earlier that at these concentrations of Li dopants under sintering tempera-
17

tures a liquid phase of lithium gadolinium oxide would sweat out of the CGO. In this experiment it seems likely that much of the liquid phase was drawn into the surrounding NiO-CGO by capillary forces leaving a high percentage of voids in the CGO electrolyte.
In summary, the main goal of this project, to determine the feasibility of forming dense CGO membranes on porous metallic support electrodes, was not achieved. Nevertheless significant progress was made. Lithium nitrate doping allowed CGO to be sintered at a much lower temperature than previously. The Li doping introduced a lithium rich oxide phase which is liquid at the temperature of sintering and promotes reaction rate. Lithium doping allowed CGO films to reach full density when they were fully constrained by an inert substrate, an important accomplishment. Although the ionically insulating lithium rich oxide caused problems with conductivity, it should be possible to evaporate it as an oxide or hydroxide from CGO thin films after sintering. Given the fact that doped CGO films can be fired on dense stainless steel substrates in a low oxygen partial pressure atmosphere without being severely reduced, it still seems possible to produce a metal supported CGO fuel cell at temperatures below 1000C and which cells would operate at 600C to 700C, although more work is required. The technique of colloidal spray deposition of CGO films appears promising at this point.
2.3.6 RecommendationsThe results obtained with the 900C firing of FeCr|NiO-CGO|15mole percentLi doped CGO|NiO-CGO composites with an externally set low oxygen partial pressure of 10-17 were encouraging. The problem of the film produced being only 80 percent dense could be due to the 15 percent of Li dopant in the film. It is recommended that firing with much lower concentrations of Li dopants in a Li saturated atmosphere be investigated. Secondly, it appears to be imperative to remove Li from sintered CGO films to avoid the loss of conductivity that has been observed. The Program Administrator recommends giving high priority to demonstrating adequate Li removal.
2.3.7 Benefits to CaliforniaPublic benefits derived from PIER research and development projects are assessed within the following context:
Reduced environmental impacts of the California electricity supply, trans-mission, or distribution system
Increased public safety of the California electricity system
Increased reliability of the California electricity system
Increased affordability of electricity in California
The primary benefit to the ratepayer from this research is increased affordability of electricity in California. Fuel cells are an attractive power source in distributed electrical resource (DER) systems. DER can complement central electric power generation by providing incremental capacity to the utility grid and to end users. End users and electric utilities benefit by avoiding or reducing the cost of transmission and distribution system upgrades.Another benefit to the ratepayer is reduced environmental impacts of the California electricity supply, transmission, and distribution system. The cells operate by combining externally supplied hydrogen and oxygen to generate
18

electricity. The only effluents from cell operation are water vapor and primarily carbon dioxide if hydrogen is first produced in a reforming process. Significantly the fuel cell effluent stream is largely free of major atmospheric pollutants.
It is not possible to quantify potential benefits until an intermediate temperature SOFC has been built and demonstrated. That cannot happen until the materials under development in this project have been fully developed.
2.3.8 Overall Technology Transition AssessmentAs the basis for this assessment, the Program Administrator reviewed the researchers’ overall development effort, which includes all activities related to a coordinated development effort, not just the work performed with EISG grant funds.
2.3.8.1 Marketing/Connection to the Market The investigators are publishing in the open literature in this area.
2.3.8.2 Engineering/TechnicalThe main goal of this project, to determine the feasibility of forming dense CGO membranes on porous metallic support electrodes, was not achieved. A stumbling block was reaction between the metal support and the CGO. An experiment with a NiO based diffusion barrier gave encouraging results, although the heavily Li doped CGO electrolyte was not adequately dense. This may be due to the high dopant concentration so it is recommended that firing with much lower concentrations of Li dopants in a Li-saturated atmosphere be investigated. Secondly, a high priority should be given to showing that it is possible to remove Li after sintering CGO films to avoid the loss of conductivity that has been observed. The technique of colloidal spray deposition of CGO films appears promising at this point.
2.3.8.3 Legal/Contractual
The researchers report that patents already exist for the use of Li as a sintering aid for CGO. They have published papers in this area and they plan to put their work in the public domain. The researchers do not have any commercialization agreements.2.3.8.4 Environmental, Safety, Risk Assessments/ Quality Plans
Environmental, safety, risk assessments and quality plans have not been accomplished.
2.3.8.5 Production Readiness/Commercialization
Until the feasibility of producing a dense CGO film on a porous metal support has been established it is premature to discuss commercialization plans.
2.4 Advanced Cathode Materials for Solid Oxide Electrolyzers
Awardee: Boston University
Principal Investigator: Srikanth Gopalan
19

2.4.1 AbstractThe main goal of this project was to develop improved cathode materials for solid oxide electrolysis cells (SOEC). These cells which use high temperature steam and electricity to produce hydrogen have the potential to be operated in reverse as solid oxide fuel cells (SOFC). This pair of functions in the same device, electricity to hydrogen and hydrogen to electricity, would provide needed energy storage and time shifted output for solar and wind powered sources. This improvement in out-put would be attractive for both grid tied and grid independent distributed genera-tion. A limiting component in present SOECs is the best cathode available, a Ni-YSZ cermet. Researchers in this project investigated a variety of proposed new cathode materials as replacements. However they found all of them less efficient compared to the baseline Ni-YSZ cermet. Thus the main project goal could not be achieved. Accordingly, they modified the project goal to investigate an alternate process to generate hydrogen from hydrocarbon fuel using a mixed conducting ce-ramic composite (MIEC) membrane. They investigated the membrane both with and without surface catalyst coating. Results are presented for enhanced mem-brane surface exchange kinetics and hydrogen permeation of membranes with cat-alysts.
Keywords: Solid oxide, electrolysis, fuel cell, hydrogen, cathode, cermet, mixed ionic electronic conductor
2.4.2 IntroductionElectrical generation by renewable energy offers many advantages to the ratepayer, including stable prices and greater freedom from pollution. In the case of solar and wind based systems, a disadvantage is the variable or intermittent electrical output. The time variation of output makes it attractive to have a means of storing energy during peak generation and releasing it during times of low output. Many methods for energy storage have been investigated: batteries, pumped hydro, electrolysis production of hydrogen as an energy carrier, and storage by tying into the grid. Grid storage is limited to less than 20 MVA and is not free. A means to pay for the grid, a significant cost, must be found. Batteries still have reliability problems, and pumped hydro is site specific and can have environmental costs. Production of hydrogen gas in an electrolysis cell has desirable features for energy storage and later electrical generation with low pollution. Researchers have employed several methods of generating electricity from hydrogen, including internal combustion (IC) engine and gas turbine powered generators and fuel cells.
High temperature steam based solid oxide electrolysis cells (SOEC) are attractive because the same electrolyzer cell when supplied with hydrogen can be run backwards as a fuel cell to produce electricity, eliminating the capital cost of an additional generator. The basic process is
shown schematically in Figure 3.10 In this project the hydrogen electrode was a Ni-YSZ cermet. In the steam electrolysis cell of Figure 1-B, a hydrocarbon fuel such as methane can be added to the oxygen stream produced at the anode to improve efficiency and be reformed into CO and H2.11
10 http://www.risoe.dk/rispubl/reports/ris-r-1608_327-338.pdf11 Martinez-Frias, J, A. Q. Pham, S. M. Aceves, Int. J. of Hydrogen Energy. 28, 483 (2002).
20

Room temperature electrolyzers generally have low electrical efficiency. If there is a low cost source of heat available, electrolysis can be carried out in high temperature steam. In this case the process becomes more electrically efficient because heat provides part of the energy. In fact at very high temperatures, ~ 2500°C, water dissociates into free hydrogen and oxygen and no electric input is required.12 Solid oxide electrolyzers, with solid oxide electrolytes such as yttria stabilized zirconia (YSZ), operate at relatively high temperatures from 500°C to 1000°C with improved efficiency. However in SOEC mode the cells degrade five times faster than in SOFC mode.13 Thus attention has been focused on the Ni-YSZ cermet cathode of the SOEC as a potential problem.
Figure 3: Sketch of the Basic Operational Principle for A) the Solid Oxide Fuel Cell (SOFC), and When Operated in Reverse, B) a Solid Oxide Electrolysis Cell (SOEC)
If the electrolyzer materials problems could be solved, the payoff in both small scale and large scale hydrogen production, and production for energy storage in distributed generation in particular, would be significant. A reversible SOFC/SOEC cell would enable distributed generation without the requirement of a grid tie or time shifted output to the grid with a tie. In 2007, 11.8 percent of California’s electricity came from renewable sources including solar and wind, and by 2020 that must rise to 33 percent.14 With such a large penetration of intermittently generating sources, there will be a great demand for new time shifting energy storage. Additionally, an efficient SOEC would also find application in the hydrogen economy. Globally, 50 million metric tons (MMT) of hydrogen were produced in 2004.15 In the US in 2004, hydrogen production was 11 MMT. The economic value of all hydrogen produced worldwide in 2005 was $135B. Methods to produce hydrogen from natural gas are well developed and widely used. With fossil fuel,
12 http://en.wikipedia.org/wiki/High-temperature_electrolysis13 Hauch, A, S.H. Jensen, S. Ramousse, and M. Mogensen, Journal of The Electrochemical Society, 153 A1741 (2006).14 http://www.energy.ca.gov/renewables/index.html12
13
14
1515 http://en.wikipedia.org/wiki/Hydrogen_economy21

however, there are the penalties of pollution and carbon dioxide emissions to the atmosphere. About four percent of hydrogen gas produced worldwide is created by electrolysis. Increased hydrogen generation by electrolysis powered by renewable energy sources would be more attractive for its greatly reduced emission of greenhouse gases.
The advancement of science proposed was to determine the feasibility of new materials as cathodes in solid oxide electrolyzer cells (SOECs). Such materials would have improved performance over existing Ni-YSZ cermet cathode materials. A variety of conducting cathode materials was explored. The cathodes consisted of a porous composite of one electronic conducting phase and one ionic conducting phase. The electronic conductors tested included Ni, Co, Ag, and YST (yttria titanate). The ionic conductors consisted of YSZ, Gd-CeO2, BCN (barium calcium niobate), and SSN (strontium scandium niobate). The electrode powders were formulated as a viscous paste and applied as shown in Figure 4. After screening tests on the button cells candidate would be identified and electrochemically tested as cathodes in standard design tubular SOEC cells. The goal was to identify materials with improved performance over existing Ni-YSZ cermet cathode materials.
22

Figure 4: SOEC button cell fabrication.
An electrolyte of YSZ and an anode of fixed composition of LSM (lanthanum strontium manganite) would be common to all test cells. The cathode material would be varied.
2.4.3 ObjectivesThe goal of this project was to determine the feasibility of materials as cathodes in solid oxide electrolyzer cells (SOECs). Such materials would have improved performance over existing Ni-YSZ cermet cathode materials. The researchers established the following project objectives:
1. Synthesize new cathode materials. Demonstrate appropriate particle size distribution suitable for application of functional cathode materials and for-mation of single phase through X-ray diffraction.
2. Fabricate anode/solid electrolyte/cathode tri-layer SOEC button cells. Demonstrate well adhered cathode—yttria zirconia electrolyte (YSZ)—anode tri-layers by scanning electron microscopy (SEM).
3. Demonstrate up to relative 40 percent improvement of new SOEC cathode materials over conventional cathode materials through the screening tests.
4. Apply the best cathode materials from Objective 3 on tubular SOECs from Siemens. Demonstrate replication of microstructure and adherence of cath-odes obtained in Objective 2 on the tubular cells.
5. Fabricate a test stand to test tubular SOECs. Demonstrate that the test stand is capable of measuring performance characteristics of tubular SOECs through voltage current density tests and current interruption tests.
6. Obtain baseline performance of a tubular SOEC with standard Ni-YSZ cath-ode. Demonstrate up to 40 percent improvement in the performance of tubu-lar SOEC cells with the new cathode materials.
Due to difficulties in carrying out Objectives 4-6, the researchers introduced a new Objective 7. Obtain a 40 percent improvement in the performance of catalyst-coated MIEC (mixed ionic and electronic conducting) membrane.
23

2.4.4 Outcomes 1. The researchers synthesized new cathode materials. They did not report X-
ray diffraction results on phase purity.
2. Researchers fabricated six cells with the same anode and electrolyte but different cathode materials. Cathode materials were NiO-YSZ (baseline), NiO-GDC, NiO-SSN, NiO-BCN, YST-SSN, YST-BCN. SEM demonstrated good adherence of the cathode—YSZ—anode tri-layers.
3. The researchers tested the button cells in steam electrolysis mode in the temperature range from 700°C to 900°C. Electrochemical test results were presented on five fabricated SOEC buttons: NiO-YSZ, NiO-GDC, NiO-SSN, NiO-BCN, YST-BCN. The discrepancy between the samples fabricated in Ob-jective 2 and those tested in Objective 3 was not resolved. In any case, the results showed that none of the new materials performed better than the NiO-YSZ baseline. Therefore this important goal was not met.
4. Not performed because it was dependent on a successful Objective 3.
5. Not performed because it was dependent on a successful Objective 3.
6. Not performed because it was dependent on a successful Objective 3.
7. Modified Objective 4. The researchers fabricated thin MIEC membranes con-sisting of an oxygen ion conducting phase GDC and an electronic conducting phase GDST. They reported outcomes in two different areas for the mem-brane. First they measured the rate of oxygen diffusion through and inferred the kinetics of surface exchange on bare and catalyst (Ni-GDC) coated sur-face. They found an order of magnitude increase in surface exchange rate for the catalyst coated surface. Then they fabricated membranes consisting of GDC and GSTA and tested them for the hydrogen production rate with and without Ni-GDC surface catalyst. The catalyst coating increased the hy-drogen production rate by 50 percent. The results were not, however, re-lated to the performance of baseline SOEC materials.
2.4.5 Conclusions1. The researchers successfully synthesized new cathode materials.
2. They successfully fabricated SOEC tri-layer button cells with the intended mechanical properties.
3. Testing of the proposed cells failed to demonstrate an improvement over ex-isting materials.
4. The researchers did not compare the results for the modified MIEC mem-branes to the performance of baseline SOEC cells with Ni-YSZ cathodes.
The researchers did not prove feasibility of new materials with improved performance over existing Ni-YSZ cermet cathode materials.
2.4.6 RecommendationsThe new direction for membrane based hydrogen separation has been an active area of research by academic and industrial groups for more than just a few years. Accordingly, the Program Administrator recommends that the researchers conduct an extensive literature search and worldwide patent search to assess potential prior work roadblocks for their new direction.
24

2.4.7 Benefits to CaliforniaPublic benefits derived from PIER research and development projects are assessed within the following context:
Reduced environmental impacts of the California electricity supply, trans-mission, or distribution system
Increased public safety of the California electricity system
Increased reliability of the California electricity system
Increased affordability of electricity in California
The primary benefit to the ratepayer from this research is in reduced environmental impacts of the California electricity supply or transmission or distribution system. A low cost efficient SOFC/SOEC would allow alternative energy sources with intermittent output such as solar and wind to time shift their output. This would increase the value of such sources to utilities when they are tied into the grid. When not tied to the grid it would increase the attractiveness of these sources to the end user by making steady power available for 24 hour use. Since feasibility was not proven, no benefits will flow to California ratepayers.
2.4.7.1 Overall Technology Transition AssessmentAs the basis for this assessment, the Program Administrator reviewed the researchers’ overall development effort, which includes all activities related to a coordinated development effort, not just the work performed with EISG grant funds.
2.4.7.2 Marketing/Connection to the Market The researchers stated they have given conference presentations.
2.4.7.3 Engineering/TechnicalNo information is available about additional technical work.
2.4.7.4 Legal/Contractual No information is available about legal or contractual arrangements.
2.4.7.5 Environmental, Safety, Risk Assessments/ Quality Plans Since feasibility of the approach was not established, no work is required in these areas.
2.4.7.6 Production Readiness/Commercialization Without proof of feasibility, commercialization efforts cannot be pursued.
2.5 Evaluation of Molybdenum Removal from Power Plant Waste Streams Using Innovative Nanoparticle Media
Awardee: Kennedy/Jenks Consultants
Principal Investigator: Lawrence Y.C. Leong, Ph.D.
25

2.5.1 AbstractMolybdenum has replaced hexavalent chromium as a key constituent in the corrosion control agents used in power plant cooling towers and boilers. As a result, significant levels of molybdenum may be present in cooling tower/boiler and other power plant waste streams. Molybdenum is not readily removed by most conventional wastewater treatment processes. This project evaluated the removal of molybdenum using ferric oxide adsorbents developed using nanotechnology tools. Nanotechnology is an emerging technology that can facilitate optimization of adsorbent characteristics (e.g. surface area, pore distribution, surface chemistry) for contaminant removal. Researchers evaluated three ferric oxide nanoparticles in this project.
Nanoparticles removed molybdenum to below the regulatory limit of 10µg/l in deionized water samples. The specific adsorption capacity was about 2.4 mg Mo/g ferric oxide. In batch tests, adsorption of molybdenum to amorphous ferric oxide nanoparticles was extremely rapid, with about 99 percent removed within one hour. Further refinement of media is required prior to commercialization of this technology. Researchers estimated the capital cost for a 1 MGD treatment facility would be about $1.4 M and annual operating and maintenance cost would be about $450,000.
Keywords: Molybdenum removal, corrosion control, cooling towers, nanoparticles
2.5.2 IntroductionMolybdenum has replaced hexavalent chromium as a key constituent in corrosion control agents used in power plant cooling towers and boilers. Molybdenum is also present in several secondary treated recycled wastewaters used in power plant cooling systems. As a result, significant levels of molybdenum may be present in cooling tower and boiler blowdown streams and other power plant waste streams. Those waste streams need to be cleaned up before discharge.
Molybdenum at elevated levels may be detrimental to crops and livestock. California Regional Water Quality Control Boards (CRWQCB) have numerical standards (10 to 15 g/l) for molybdenum in receiving streams. Until recently these limits were not specifically included in the National Pollution Discharge Elimination System (NPDES) permits. Recently the CRWQCB have begun to address molybdenum levels in waste streams and sludge. Such limits will impact several power plants with NPDES permits and those discharging to sanitary sewers.
To date, very few studies have been performed to remove molybdenum from wastewaters. Molybdenum is not readily removed by most conventional wastewater treatment processes. Coagulation by ferric chloride appears to be the current treatment of choice for molybdenum. However, the limitations of this technology include the requirement of a large coagulant dosage (50–100 mg/l) and trace metal impurities (e.g. lead, cadmium, silver) in the coagulant that may be in excess of recently revised discharge limits for these metals. Adsorption of molybdenum to iron particles in subsurface environment has been reported in literature. However, their ability to adsorb molybdenum from complex power plant blowdown streams and reclaimed waters is not currently known.
Figure 5: Nanostructured Ferric Oxide Coated to Ottawa Sand (Media #1)
26

Figure 6: Column Uused in Molybdenum Breakthrough Studies
In this project the researchers investigated a new approach to removing molybdenum from power plant waste water streams using innovative nanoparticle media. Figure 5 shows one sample of adsorbent nanoparticle coated onto sand particles. Figure 6 shows the test column.
2.5.3 ObjectivesThe goal of this project was to determine the feasibility of using nanoparticles for removal of molybdenum from power plant waste water streams, using ferric oxide nanoparticles containing different surface characteristics. The researchers established the following project objectives:
1. Develop nanoparticle media with two different configurations for optimum removal of molybdenum.
2. Perform batch studies to compare nanoparticle performance with commer-cially available iron based adsorbents.
3. Demonstrate molybdenum removal below 10 g/l and select optimum media configuration
27

4. Establish equilibration time for subsequent batch studies by performing ki-netic studies.
5. Determine the molybdenum baseline adsorption capacity of the nanoparti-cle adsorbent.
6. Evaluate impact of co-constituents of power plant waste streams on molyb-denum removal by ferric oxide nanoparticles.
7. Evaluate molybdenum adsorption in synthetic blowdown stream.
8. Evaluate molybdenum removal from recycled waters that are increasingly used in power plant cooling towers, using synthetic reclaimed water.
9. Perform column studies to evaluate molybdenum removal under dynamic conditions.
10.Develop planning level cost estimate and identify steps required for commer-cialization.
2.5.4 Outcomes 1. The researchers synthesized and evaluated three nanoparticle media during
the project. They developed Media #1 by coating iron oxide nanopar-ticles on Ottawa sand (0.6-0.8 mm size). They prepared a second media (Me-dia #2) where the nanoparticles were coated on micro-sand particles. Fi-nally, they prepared a third media (Media #3) by coating ferric oxide on mi-cro-sand under modified synthesis conditions.
2. The researchers compared adsorption of molybdenum to nanoparticle Me-dia #1 with adsorption to two commercial ferric oxide media used in water treatment for arsenic removal. Results indicated the nanoparticle media had higher adsorption capacity (about twice as high on a mass basis and 5-10 times higher on a unit area basis) than the two commercial iron oxide media. Although Media #1 had high molybdenum capacity, a key limitation in Me-dia #1 was that this media contained an extremely small amount of iron per unit mass of the media (20 mg/g sand). Hence the researchers developed and evaluated another media (Media #2) with improved surface coating (900 mg/g media) and high unit surface area (~40 m2/g) for molybdenum re-moval.
3. Media #2 (3000 mg) effectively removed molybdenum in deionized (DI) water samples from an initial level of 3000 µg/l to 8.6 µg/l. Addition of 750 mg ferric oxide lowered the residual concentration to 160 µg/l from this solution. Since Media #2 had a significantly high amount of ferric oxide per unit mass of bulk media and was capable of lowering the molybdenum level to less than 10µg/l, the researchers selected this media for subsequent tasks.
4. In a batch study to evaluate kinetics of molybdenum adsorption, Media #2 removed more than 99 percent of the molybdenum within 60 minutes. Hence, the researchers selected an equilibration time of four hours for subsequent studies.
5. Researchers performed a batch study to estimate molybdenum adsorption capacity of Media #2 in DI water samples. Adsorption followed Langmuir
28

isotherm trends. The estimated specific adsorption capacity was about 2.4 mg Mo/g Fe2O3.
6. The researchers conducted tests to evaluate impact of carbonate (up to 75 mg/l), silicate (up to 50 mg/l), phosphate (up to 10 mg/l) and natural organic matter (4mg/l total organic carbon (TOC)) on molybdenum adsorption. None of the anions impacted molybdenum adsorption at the levels used. Natural organic matter (~ 4 mg/l TOC), however, reduced molybdenum adsorption by 50 percent under the test conditions used.
7. The researchers evaluated molybdenum adsorption to Media #2 in a syn-thetic reclaimed water sample. They spiked samples (100 ml) with 50 to 5,000 µg/l of molybdenum and incubated them with 3,000 mg media. Resid-ual molybdenum was below detection level (5µg/l) in samples containing up to 200 µg/l molybdenum.
8. Researchers prepared a synthetic blowdown water sample assuming a four cycle cooling tower operation using potable water from a local water agency. They used test conditions similar to those used for Objective 7. The overall adsorption capacity in this solution was approximately 3 to 10 times lower than that observed in synthetic reclaimed water samples.
9. Initial column studies using Media #2 showed some dissolution of iron in the column effluent. Hence, the researchers synthesized a new media (Me-dia #3) with better crystalline properties and higher surface area. This me-dia had better structural integrity than Media #2, but yielded a lower (~15 percent) adsorption capacity when no constituents were present. Further-more, molybdenum adsorption by this media was significantly impacted in the presence of co-constituents (e.g. carbonate, silicate). Column studies us-ing this media indicated that at an empty bed contact time (EBCT) of seven minutes, almost all the adsorption sites were utilized at breakthrough condi-tions.
10. Results from these studies suggested that some refinements are required to improve the media characteristics prior to commercialization. For example, the ideal media would have a higher specific adsorption capacity and be less impacted by co-constituents as observed with Media #2 and have better structural stability and less leakage then Media #3. Future efforts on media development should focus on these issues. Assuming the synthesis of such media, the researchers developed a planning level cost estimate (+30 to – 5 percent) for treatment of wastewater using ferric oxide nanoparticles in packed bed columns. The planning level capital cost estimate for installation of such a polishing unit for a one million gallons per day (MGD) treatment system is about $1.4 million. The annual operating and maintenance cost es-timate for this unit is about $450,000.
2.5.5 ConclusionsThis project demonstrated the feasibility and probable enhanced performance of using nanoparticles for the removal of molybdenum from power plant wastewater streams. The results demonstrated that using ferric iron nanoparticles may be a feasible approach used for removing the molybdenum. However, further analysis and refinement of media is required so the media contains the surface chemistry of the second media (i.e. high adsorption capacity, less impact by co-constituents) and structural integrity. At an empty bed contact time of seven minutes, most of
29

the adsorption sites of the media are likely to be utilized for adsorption providing an optimum use of the media.
2.5.6 RecommendationsThe results suggested that further work is required to improve the surface configuration of the ferric oxide media prior to commercialization. This evaluation should include alternate synthesis conditions in combination with evaluation of pore size distribution, point of zero charge, and batch and flow adsorption studies in the presence of co-constituents.
Future work should expand on the current work to optimize media characteristics, including pore structure and surface chemistry of the nanoparticles. Additional waste streams (actual or synthetic) also should be tested to define the performance envelope and to determine the statistical significance of results obtained thus far. Researchers should carefully document bleed-through of trace elements (within the ferric chloride nanoparticles) or of nanoparticles themselves (wash out) and breakthrough of molybdenum levels. They should investigate mechanisms to regenerate adsorbent materials, including regeneration blowdown disposal requirements. They should investigate media packing requirements and impact on production methods to determine whether channeling occurs with waste stream components not being exposed intimately with adsorbent surfaces. This may be a function of media carrier size consistency. They should also determine water pumping pressure requirements (pressure drop across column) of different media packing and size consistency.
After taking into consideration (a) research findings in the grant project, (b) overall development status, and (c) relevance of the technology to California and the PIER program, the Program Administrator has determined that the proposed technology should be considered for follow on funding within the PIER program.
Receiving follow on funding ultimately depends upon (a) availability of funds, (b) submission of a proposal in response to an invitation or solicitation, and (c) successful evaluation of the proposal.
2.5.7 Benefits to CaliforniaPublic benefits derived from PIER research and development projects are assessed within the following context:
Reduced environmental impacts of the California electricity supply, trans-mission, or distribution system
Increased public safety of the California electricity system
Increased reliability of the California electricity system
Increased affordability of electricity in California
The primary benefit to the ratepayer from this research is reduced environmental impacts of the California electricity supply or transmission or distribution system.
The existing technology for molybdenum removal (e.g. coagulation using ferric chloride) is material intensive (50 – 100 mg/l), generates a large amount of sludge that needs further disposal, and is uneconomic. The use of existing technology is further complicated by the presence of heavy metal impurities in commercial ferric chloride salts that may result in violation of discharge limits for several metals
30

(non molybdenum) under the California Toxicity Regulation (CTR). Hence a clean technology such as adsorption to high surface area iron oxide media is required for molybdenum removal, provided the nanoparticle adsorbent can be produced without other heavy metal leakage.
The direct beneficiaries of this study would be the power plants that discharge blowdown streams from cooling towers and boilers, as well as those planning to use reclaimed water for cooling towers. Industries and commercial establishments using cooling towers would also benefit by this technology to minimize molybdenum discharge into sanitary sewers and receiving streams. Also, iron oxide media are best suited for the treatment of several organic and inorganic constituents (arsenic, natural organic matter) in drinking water systems. Several drinking water utilities in California are expected to install iron based adsorptive treatment processes for arsenic and organic matter removal to comply with new Arsenic and Microbial/Disinfection Byproducts (M/DBP) rules in the next few years. All of these agencies would be benefited by development of nanoparticles based adsorptive media.
2.5.8 Overall Technology Transition AssessmentAs the basis for this assessment, the Program Administrator reviewed the researchers’ overall development effort, which includes all activities related to a coordinated development effort, not just the work performed with EISG grant funds.
2.5.8.1 Marketing/Connection to the Market The researchers developed preliminary commercialization plans in conjunction with NEI Corporation, a consultant to the researchers. That preliminary plan should be updated and formalized after additional data has been gathered and media optimization has been completed.
2.5.8.2 Engineering/TechnicalThe Program Administrator is not aware of any post project engineering work.
2.5.8.3 Legal/Contractual The researchers had not applied for patents on the technology concept. They conducted a patent search and did not identify competing patents. They identified the technology that could be patented.
2.5.8.4 Environmental, Safety, Risk Assessments/ Quality Plans The use of nanoparticles in general poses some poorly defined environmental risks given their unique behavior compared to macro-sized compounds of the same constituents. Producing nano-sized particles of ferric oxide also raises an issue of trace element contamination associated with the source of ferric oxide which needs to be evaluated in the development of production schemes.
2.5.8.5 Production Readiness/Commercialization
A preliminary commercialization plan has been developed in conjunction with NEI Corporation, a consultant to the researchers. The researchers will need to update and formalize this plan after they have gathered additional data and completed media optimization.
31

2.6 Low-Level Concentrating Photovoltaic System
Awardee: J. Schripsema & Associates LLC
Principal Investigator: Jason Schripsema
2.6.1 AbstractThis project designed, built, and tested low level concentrating photovoltaic modules intended to significantly reduce the cost of large, ground mounted systems. Twelve modules were built using SunPower A300 cells laminated to a novel, low cost heat sink. The concentrating solar design used a reflective film capable of greatly reducing the amount of ultraviolet light reflected back onto the cells and produced a two and two tenths times concentration. The modules were tested at Arizona State University East’s Photovoltaic Testing Laboratory for field exposures up to 12 months, as well as in an environmental chamber. Results showed the modules to be very durable, and the heat sink performed well. However, performance of the reflective film degraded more quickly than expected. The modules did not meet the original cost savings objective, although they did demonstrate a production cost that was approximately 60 percent of conventional module cost.
Keywords: Photovoltaic, concentrator, concentrating, reflector, low-level concentration ratio, module, heat sink
2.6.2 IntroductionDespite significant and ongoing efforts to reduce the costs of photovoltaic (PV) systems, their presently high first cost remains a deterrent to the level of widespread deployment envisioned in California’s energy policy. In most cases, subsidies are required to bring PV system costs into parity with conventional electric generation alternatives in today’s market.
Reducing PV costs to a more competitive level can increase penetration of PV alternatives, bringing their environmental benefits and reduced fuel price and supply risks to more California ratepayers. This will help California realize its vision of a more sustainable energy future and free public funds for deployment in other initiatives supporting this vision, such as energy efficiency.
The researchers proposed to design, build, and test a low-level concentrating PV system using a novel heat sink and reflector design that would produce electricity at a significantly lower cost than existing systems. As shown in Figure 7, the reflector is a simple, low cost angled flat plate covered with a reflecting film that selectively reduced reflection of damaging ultraviolet light onto the cells and supporting materials. Figure 8 shows the heat sink, which is laminated to the back of the cells. The heat sink fins are a folded aluminum foil that is folded flat for easy lamination. They are moved to a vertical position for operation.
Figure 7: Modules on Test Rack Showing Reflectors
32

33

Figure 8: Back of Module Showing Heat Sink Fins Unfolded to Vertical Position for Operation
2.6.3 ObjectivesThe goal of this project was to determine the feasibility of a photovoltaic module that would significantly reduce the cost of solar-generated electricity through incorporation of a novel heat sink solution in conjunction with an extremely low cost reflector design and existing “one-sun” photovoltaic cells.16 The researchers established the following project objectives:
1. Finalize the design and performance model of the proposed modules.
2. Work with manufacturers to minimize costs of components. Total materials cost of the concentrating module to be less than $1,000 per kW for annual blanket orders greater than one megawatt.
3. Fabricate a two kW prototype system.
4. Operate the prototype system for at least six months in the Arizona desert and check that power and energy are within five percent of predictions, nor-mal cell operating temperatures are less than 75 degrees Centigrade, and six month performance drop is less than one percent.
5. Perform accelerated lifetime testing via the use of environmental chamber tests, evaluate sample module for power, voltage and current before and af-ter testing as well as physical degradation of all components.
6. Perform manufacturing and installation cost assessments based on real world experience in manufacturing and installing the prototype system with goal of total installed system costs less than $3,000 per kW.
16 SunPower A300 cells were used in the research.34

7. Perform life cycle cost analysis to determine cost per kWh of electricity gen-erated with a goal of $0.07 per kWh.
2.6.4 Outcomes 1. The researchers developed the performance model and used it to complete
the final design of the concentrator. They then validated the model and de-sign through the experimental results from outdoor testing.
2. The researchers consulted with manufacturers of PV laminates, aluminum extrusions, and folded materials to seek ways to reduce component costs through smart design approaches. This resulted in a module production cost of $1500 per kW for this small scale demonstration, compared to the target objective of less than $1000 per kW in annual quantities above one MW.
3. The project manufactured a total of 1.58 kW of PV modules, rather than the targeted two kilowatt. The lower figure was primarily a result of using a con-centration ratio of two and two tenths to avoid damage to module compo-nents, rather than the four to one ratio originally proposed.
4. The researchers installed the array and operated it for slightly over six months to collect performance data. Total exposure time for some modules was as long as 12 months. The modules performed slightly below expecta-tions due to weathering of the reflectors, but the overall system including tracking and mounting hardware proved to be reliable, including surviving winds greater than 50 miles per hour at the test site.
5. The researchers subjected two modules to three different accelerated aging tests using environmental chambers. These tests were thermal cycling, damp heat, and freeze-thaw. The modules easily passed these tests.
6. The researchers developed manufacturing and installation cost estimates and compared them to conventional photovoltaic systems. The system costs were calculated at $3580 per kW, compared to $4350 per kW for a comparable conventional system.
7. Life cycle cost analysis was completed using a 30 year life. Without subsi-dies, the amortized cost of the electricity generated would be approximately $0.10 per kWh, compared to the target of $0.07 per kWh.
2.6.5 Conclusions1. The research validated the mathematical model governing the behavior and
performance of the module, including the heat transfer model for the heat sink. This work has potential application to further refinement of the mod-ules tested in this project, as well as in other designs.
2. Incorporating information gained from consultations with manufacturers into the final designs led to significant cost reductions. However, further work would be needed to determine whether volume efficiencies could yield a final cost meeting the target objective of less than $1000 /kW.
3. The decision to reduce concentration ratio from the targeted four to one to a more conservative two and two tenths to one appears to have been sound, since the modules and supporting structures were very durable under field conditions. However, the lower concentration ratio resulted in a cost per
35

kilowatt above the target objective, suggesting that further refinement of the tradeoff between economics and module longevity would be warranted.
4. The heat sink design performed well, validating its novel approach. This component may be suitable for further testing and development as a stand alone research project. The observed decline in module performance over time in the field is largely attributable to greater than anticipated degradation of the reflective film used in the concentrator array. While the film met the goal of low cost and ability to avoid reflecting most of the damaging ultraviolet radiation back to the module, a more durable substitute would be needed for commercial op-eration.
5. While environmental chamber testing of the modules validated their robust-ness, the limited length of actual field testing leaves room for concern about whether they could perform over many years of actual use. This could be the subject of further research, especially after a better solution for the reflec-tive film is found.
6. The projected system cost of $3580 per kW did not meet the target of less than $3000 per kW. However, there are significant cost savings indicated in the research. On a comparable basis the researchers estimated that a con-ventional system would cost $4350 per kW.
7. The project’s projected life-cycle cost of $0.10 per kWh of electricity gener-ated did not meet its goal of $0.07 over a 30 year calculated life. As a conse-quence, the researchers reported that there has been no interest among PV manufacturers in pursuing further refinement of the design.
2.6.6 RecommendationsAlthough the research did not meet all of its goals, a number of positive innovations were tested with good results, including a novel heat sink design, and an overall module construction design that led to reduced costs over conventional systems. The conservative decision to limit the concentration ratio to two and two tenths to one led to lower cost savings than targeted, although it did avoid any material failures from excessive concentration ratios. Further research may point towards a more cost effective balance between higher concentrations and required material longevity that would enhance the market potential for the innovations studied in this research. Identifying and testing alternative reflector materials would also be important in further research plans.
After taking into consideration (a) research findings in the grant project, (b) overall development status, and (c) relevance of the technology to California and the PIER program, the Program Administrator has determined that the proposed technology should be considered for subsequent funding within the PIER program.
Receiving subsequent funding ultimately depends upon (a) availability of funds, (b) submission of a proposal in response to an invitation or solicitation, and (c) successful evaluation of the proposal.
2.6.7 Benefits to CaliforniaPublic benefits derived from PIER research and development projects are assessed within the following context:
36

Reduced environmental impacts of the California electricity supply, trans-mission, or distribution system
Increased public safety of the California electricity system
Increased reliability of the California electricity system
Increased affordability of electricity in California
The primary benefit to the ratepayer from this research would be reduced environmental impacts of the California electricity supply. Improving the economics of solar systems would increase their market penetration, accelerating California’s transition from a generation mix of approximately one third natural gas fueled generation to a cleaner, more sustainable set of technologies.
2.6.8 Overall Technology Transition AssessmentAs the basis for this assessment, the Program Administrator reviewed the researchers ’s overall development effort, which includes all activities related to a coordinated development effort, not just the work performed with EISG grant funds.
2.6.8.1 Marketing/Connection to the Market The researchers benefited from initial interest and support from manufacturers of solar system components. However, based on the economics demonstrated in this research, they were unable to obtain further commitments from the solar community for continued development of the modules.
2.6.8.2 Engineering/TechnicalThe novel heat sink design has the potential to be used in other solar module applications, since it proved to be a low cost and readily manufactured approach. The rapid degradation in performance of the material chosen for the concentrator’s reflectors suggests a different choice for further research.
2.6.8.3 Legal/Contractual The researchers stated that the heat sink design has received a patent.
2.6.8.4 Environmental, Safety, Risk Assessments/ Quality Plans Additional testing would be required to identify a more robust reflector material capable of reducing the amount of ultraviolet radiation reflected back to the cells. A longer field test would also be important in validating the design’s longevity in commercial applications.
2.6.8.5 Production Readiness/Commercialization
Although the modules were readily assembled and indicated a likely production cost per watt well below conventional designs, the researchers did not find a commercialization partner for the modules as presently designed.
2.7High Efficiency Air Conditioner on Single Phase Electricity
Awardee: Smith and SunR
37

Principal Investigator: Dr. Otto J. M. Smith
2.7.1 AbstractAir conditioning loads in California during summer cooling season place a heavy burden on the power systems and is one of the largest users of electricity. Most residential and small commercial (e.g. motel) air conditioners are designed for a single phase electrical supply. The single phase motor for these compressors is in-efficient, compared to a three phase motor. Improving the efficiency of motors used in air conditioning units would provide significant electrical power and en-ergy savings to California.
Three phase motors are designed to better utilize physical and electrical design for higher efficiency and lower cost than single phase motors. Their torques are smoother with resultant less vibration and do not vary during the shaft rotation. With previous examples proprietary three phase conversion systems, the same power and efficiency benefits for air conditioners may be achieved
This project successfully tested the feasibility of converting motor designs to use three phase power, even though supply line power is single phase.
Keywords: Air conditioner, high efficiency, single phase electricity
2.7.2 IntroductionAir conditioning loads in California during summer cooling season place a heavy burden on the power systems and is one of the largest users of electricity. Most residential and small commercial (e.g. motel) air conditioners are designed for a singl -phase electrical supply. The single phase motor for these compressors is in-efficient compared to a three phase motor. Improving the efficiency of motors used in air conditioning units would provide significant electrical power and en-ergy savings to California.
Three phase motors are designed to better utilize physical and electrical design for higher efficiency and lower cost than single-phase motors. Their torques are smoother with resultant less vibration and do not vary during the shaft rotation. With previous examples proprietary three phase conversion systems, the same power and efficiency benefits for air conditioners may be achieved
This project tested the feasibility of converting motor designs to use three phase power, even though supply line power is single phase. The motor is used to drive compressors in air conditioning units. A schematic of the converted motor is shown in Figure 9.
Figure 9: Schematic of Three Phase Motor Converted from Single Phase Operation
38

2.7.3 ObjectivesThe goal of this project was to determine the feasibility of using three phase motors with single phase line power to improve the efficiency of small to medium sized air conditioning units. The researchers established the following project objectives:
1. Operate a 5.2-kW three phase motor as a four terminal motor (Semi-HexTM) connected to 230 volts single phase line power.
2. Test an identical three terminal three phase motor on balanced three phase supply voltage.
3. Compare power and energy with a similar 5.2 kW compressor equipped with the best A.O. Smith single phase motor available.
4. Measure locked rotor starting currents, full load winding currents, powe -line current, power line watts, power factor, and calorimeter values of cool-ing (BTU/hour) at (ARI-540) standard test conditions.
5. Verify that the starting current is near to the minimum for the desired torque and that the starting current is near to unity power factor.
6. Verify that the full load single phase line current is leading power factor and beneficial to the power company by compensating for the lagging motor loads of other customers and loads.
39

2.7.4 Outcomes The researchers built and tested the three phase motor configuration and tested it in comparison to standard single phase motors. Tests were performed under ARI (American Refrigeration Institute) Standard 540. The test results are shown in Table 1.
Table 1: Comparison of Power and Efficiency
Semi-HexTM EnablerR 3phase motor; 3 phase line
single-phase motor
Power input (watts) 5,053.6 5,197.5 5,580.25Power Factor 81.29percent leading 87.74 percent lag-
gingn.a.
EER 11.19 10.88 10.20
The high efficiency of the three phase control results from the run capacitor inject-ing a specified current into the motor winding. High efficiency and high EER achieved with the low cost run capacitors should be more cost effective in improv-ing efficiency than larger radiators, condensers, larger pipes, flow rates and fans.
2.7.5 ConclusionsThis project verified the feasibility of using three phase motors using single phase line power to reduce power and energy requirements for small to medium sized air conditioning units. The project also demonstrated improved power factor characteristics that should be beneficial for utility distribution systems. If applied to a large number of air conditioning units in California, the energy saving could be significant.
2.7.6 RecommendationsAn independent testing laboratory should verify the results of this project, espe-cially with respect to power and energy draw and cooling efficiency. Independent verification should be performed on multiple motor sizes and makes to determine analytic transferability. A broad based cost and manufacturing analysis should be performed to compare energy savings with manufacturing costs and complexity. Work should begin on identifying service technician training needs for after sales service and maintenance requirements.
After taking into consideration (a) research findings in the grant project, (b) overall development status, and (c) relevance of the technology to California and the PIER program, the Program Administrator has determined that the proposed technology should be considered for subsequent funding within the PIER program.
Receiving subsequent funding ultimately depends upon (a) availability of funds, (b) submission of a proposal in response to an invitation or solicitation, and (c) successful evaluation of the proposal.
2.7.7 Benefits to CaliforniaPublic benefits derived from PIER research and development projects are assessed within the following context:
40

Reduced environmental impacts of the California electricity supply, transmission, or distribution system
Increased public safety of the California electricity system
Increased reliability of the California electricity system
Increased affordability of electricity in California
The primary benefit to the ratepayer from this research is from increased affordability of electricity in California. Secondary benefits are reduced environmental impacts of the electricity system, due to reduced demand for electricity.
Users of the three phase motor air conditioning units should pay less for electricity than users of conventional single phase units, while maintaining comfort levels. A public benefit is that three phase motors in single phase air conditioners can re-duce electricity costs by 9.6 percent of the electricity used for cooling. The Energy Information Administration estimates California air conditioning electricity growth rate as new annual costs of $666 million in 2005. Assuming a market penetration of 50 percent, and an average EnablerR savings of nine percent for all sizes, (about that shown for the 20 ton unit in these tests), an annual savings to California ratepayers in aggregate would be approximately $25 million. That amount would grow over time and be cumulative (i.e. not a one time savings.)
The load serving entity (LSE) will also benefit from high power factor current loads. The leading power factor of these new units will partially compensate for the lagging power factor of nearby refrigerators, freezers, furnace fans, washers and dryers, pumps, and neighbor’s air conditioners. The LSE will see a reduced rate of load growth due to these new air conditioning loads.
Higher efficiency air conditioners will produce less global warming than the re-placed low efficiency single phase compressors because of the reduction in elec-tricity consumption.
2.7.8 Overall Technology Transition AssessmentAs the basis for this assessment, the Program Administrator reviewed the researchers’ overall development effort, which includes all activities related to a coordinated development effort, not just the work performed with EISG grant funds.
2.7.8.1 Marketing/Connection to the Market The researchers reported that both VITRUS Corporation and Bristol Compressors have provided design, construction, manufacturing, and sales guidance to this project. Bristol has assembled and sold a limited number of five ton units similar in design to that developed in this project.
2.7.8.2 Engineering/TechnicalThe project documented the technical feasibility of using three phase motors with single phase line power to reduce the power and energy consumption of motors used in air conditioning applications. The researchers plan to work with a commer-cial air conditioner manufacturer to produce an air conditioner incorporating the technology developed in this project.
41

2.7.8.3 Legal/Contractual No commercialization plans have been developed. No licensing agreements have been completed. Six patents have been issued and two are pending.
2.7.8.4 Environmental, Safety, Risk Assessments/ Quality Plans There are no known or anticipated environmental or safety issues associated with using three phase motors in place of single phase motors. There may be minor issues of service technician training to ensure ongoing quality maintenance and efficiency, considering the motor characteristics (power and current draw) are different than what they are used to.
2.7.8.5 Production Readiness/Commercialization
The technology is ready for commercial application after the verification testing described above and legal/contractual arrangements have been completed. The researchers have strong links to a potential manufacturing partner.
2.8 Non-restrictive Pressure Relieve Heat Trap
Awardee: Conservation Technology, Inc.
Principal Investigator: Larry Acker
2.8.1 AbstractMost of California’s electric customers are using more energy than necessary for domestic water heating due to an insufficient thermal barrier between the tank’s heated water and the inlet and discharge lines that connect to the tank. Current devices employed to reduce heat loss are made of metal (increases losses due to good heat transfer), reduce water flow, and can be noisy in operation.
The researchers s proposed to design, build, and test a cost competitive prototype non-metallic heat trap using a novel spring loaded design that would increase efficiency, reduce pressure drop, and decrease noise compared to commercially available devices,
Results proved the researchers' claims of increased flow rate, acoustical sound (noise factors) reduction, and minimum heat loss. The project heat traps reduced heat loss and increased the energy efficiency to 0.904 versus no heat traps 0.879, ball valve heat traps 0.893, and flap heat traps 0.890. The daily electricity savings using one pair of the project heat traps is 0.38 kWh or 138.7 kWh per year. Assuming five percent of electric water heaters contain these heat traps, the total annual electricity savings to the state of California would be 5,664,792 kWh, with annual dollar savings of $793,071.
Keywords: Water heater, heat loss, heat trap, energy efficiency
2.8.2 IntroductionMost of California’s electric customers are using more energy than necessary for domestic water heating due to an insufficient thermal barrier between the tank’s heated water and the inlet and discharge lines that connect to the tank. Current
42

devices employed to reduce heat loss are made of metal (which increases losses due to heat transfer), reduce water flow, and can be noisy. Improvements in all of these parameters are possible.
If a more efficient heat trap (a device on the inlet and outlet connections to the hot water tank) were developed, Californians could realize immediate energy savings. Using heat traps that are twice as efficient as present commercial models, a typical residential electric water heater could save roughly 0.4 kWh per day (a $20/year savings at $0.14/kWh energy). At likely retail pricing, this would amount to a one year payback. If only 5 percent of electric water heaters had such devices, the annual energy savings would be over 5,000,000 kWh, at a dollar savings near $1 million. Improvements in pressure drop and noise would also enhance customer acceptance.
The researchers s proposed to design, build, and test a cost competitive prototype non-metallic heat trap using a novel spring loaded design that would increase efficiency, reduce pressure drop, and decrease noise compared to presently available devices.
Figure 10 illustrates the device and its operation. Under no flow conditions, water in the tank expands as it is heated and can move into the cold and hot water pipes, resulting in heat loss in addition to losses through thermal conduction in metallic piping. The combination of the spring loaded ball and semi-flexible pressure relieving seat compresses under this pressure, preventing most, but not all flow (some flow is allowed to relieve pressure). Use of non-metallic material for the device limits conduction losses, and the oversize diameter of the unit reduces pressure loss. When there is water demand, the ball moves back against the spring, opening the line.
43

Figure 10. Diagram of Pressure Relieve Heat Trap
2.8.3 ObjectivesThe goal of this project was to determine the feasibility of using a spring loaded ball design for a heat trap made of non-metallic materials to increase the efficiency of current designs for reducing standby losses of electric water heaters while reducing pressure losses and noise across the heat trap. The researchers established the following project objectives:
1. Confirm selected materials are in compliance with NSF-61.
2. Demonstrate it is technologically possible to fabricate heat traps using the spring loaded design and confirm the possibility of mass production.
3. Establish a test procedure and select a laboratory for performance testing.
4. Conduct tests and collect data for analysis.
5. Demonstrate the proposed heat traps can save 0.5 to 1 kWh per day, which is two to four times as efficient as competitive products.
6. Demonstrate the proposed heat traps eliminate at least 90 percent of noise compared to competitive products.
7. Demonstrate the proposed heat traps do not restrict water flow.
8. Demonstrate the proposed heat traps are durable enough to last at least 10 years.
9. Demonstrate the proposed heat traps meet government safety regulations.
10.Demonstrate individual users will obtain at least $20 annual savings if one pair of heat traps is installed.
44

11.Confirm the projected manufacturing and marketing costs can meet the $10 per pair retail price target.
12. Demonstrate the most efficient way(s) to distribute the improved heat traps to California consumers.
2.8.4 Outcomes 1. The materials are in compliance with NSF-61. Original prototypes were PVC,
with final alternative materials under review. Final mold costing and produc-tion molding are underway, with Noryl, nylon, and polysulfone under consid-eration.
2. The researchers found it technologically possible to fabricate heat traps us-ing the proposed design. They fabricated traps using an injected molding of not more than three to four cavities. Assembly proved to be simple, a good candidate for automated mass production.
3. The researchers selected Applied Energy Technology (AET) for lab testing and established a procedure for performance testing and reporting. The pro-cedure involved testing and comparison of performance for three types of heat traps (ball, flap, and the proposed device) against performance of typi-cal steel piping with no heat trap. They tested the devises on a standard height 40 gallon high efficiency electric resistance water heater with top connections.
4. The researchers conducted tests and collected data for analysis.
5. The researchers measured daily electricity savings using the proposed heat traps on both inlet and outlet piping at 0.38 kWh. In comparison to the other two types of heat traps tested, the proposed device saved twice as much en-ergy.
6. Testing indicated there was no appreciable noise below a flow rate of 2.5 GPM. At 2.5 GPM and above, a very slight noise occurred. The ball type heat traps exhibited similar noise at a lower flow rate (0.7 – 1.0 GPM), which dis-appeared above this rate. The flap type heat trap had no noise at the tested flow rates.
7. Researchers found little difference in the flow restriction between the pro-posed and existing heat traps. The proposed device reduced maximum flow to 7.3 GPM compared to 7.9 GPM with no traps installed.
8. The material tested (PVC) has extensive field use in cold water piping sys-tems, which suggests a life in excess of the 10 year target for the cold water heat trap. Usage of PVC for hot water systems is not common. The re-searchers suggested that polysulfone (a material that is currently used in hot water piping systems) may be selected in lieu of PVC. They stated, “The material tests that have been completed indicate that the heat traps should outlast the 10 year life of the water heater,” although there was no descrip-tion of the testing methodology or results to validate this conclusion.
9. The researchers stated the device meets government safety regulations, al-though they observed, “The actual in field tests cannot be accurately mea-sured at this time, but we feel very confident based on existing materials un-der similar conditions.”
45

10.Based on the test result of 0.38 kWh per day, at $0.14 /kWh a typical resi-dential user could save between $18 and $26 annually if one pair of heat traps was installed.
11.Production cost of the new heat traps was projected to be approximately $3 to $4 per pair, resulting in an estimated retail price in the range of $10 to $14 per pair. The researchers presented no data addressing the cost of retrofitting existing water heaters with the devices.
12. To penetrate the market, the researchers plan to work with energy utilities, water heater manufacturers, national plumbing suppliers, and retail chains. They stated work was underway with IAPMO / UPC to develop a plumbing code provision for heat traps.
2.8.5 ConclusionsThe researchers successfully demonstrated the proposed design could be fabricated on a prototype and very likely on a mass production basis using commonly available and tested materials. They had not made a final choice of materials. They need to address the requirement to provide safe, durable service on both cold and hot water piping. There was no data in the final report addressing the likely field life of the design. This remains an item for further study.
An experienced lab tested the devices using a protocol that allowed valid comparisons between the proposed device and several existing alternative heat traps. The lab compared energy savings for the tested devices to a no trap case.
Results showed the proposed device produced energy savings for a standard 40 gallon high efficiency electric resistance water heater that would provide a simple payback of roughly one year for a typical residential customer. The savings are at least twice those of existing alternative devices, with very low noise levels and flow restriction.
Statewide, if 10 percent of the presently installed approximately 800,000 residential electric water heaters used the proposed devices, savings would result in an aggregate reduction of approximately 11,000,000 kWh for water heating. Without data addressing the cost of retrofitting existing water heaters, the potential for this device in that market remains uncertain.
2.8.6 RecommendationsThe results of this project are very encouraging and suggest a series of future steps to bring this product to market:
1. Widen the ongoing field testing of prototypes to include California utilities and explore the potential to qualify these devices for incentive/rebate programs. A test is underway at Embridge Gas Utility in Ontario, Canada, and additional testing has been conducted at Bodycote Materials Testing, Canada, Inc.
2. Ensure that field and laboratory testing addresses safety and longevity of the devices in a rigorous, repeatable manner with published results. Final material selection should follow these tests.
3. Establish standards for use of heat traps in codes such as Uniform Plumbing Code (UPC), International Plumbing Code (IPC), and other relevant codes and standards.
46

4. Study the feasibility, cost, and likely adoption rate for the retrofit market to determine whether the device has potential for this usage or should be targeted exclusively to new installations.
5. Study the applicability and potential energy savings of using the proposed devices on gas-fired water heaters.
After taking into consideration (a) research findings in the grant project, (b) overall development status, and (c) relevance of the technology to California and the PIER program, the Program Administrator has determined that the proposed technology should be considered for follow on funding within the PIER program.
Receiving follow on funding ultimately depends upon (a) availability of funds, (b) submission of a proposal in response to an invitation or solicitation, and (c) successful evaluation of the proposal.
2.8.7 Benefits to CaliforniaPublic benefits derived from PIER research and development projects are assessed within the following context:
Reduced environmental impacts of the California electricity supply, trans-mission, or distribution system
Increased public safety of the California electricity system
Increased reliability of the California electricity system
Increased affordability of electricity in California
The primary benefit to the ratepayer from this research is increased affordability of electricity in California. The proposed device provides a simple payback of approximately one year based on $0.14 /kWh for residential water heating. Statewide, if 10 percent of the present roughly 800,000 residential electric water heaters used these devices, the savings would be at least $1.5 million annually.
2.8.8 Overall Technology Transition AssessmentAs the basis for this assessment, the Program Administrator reviewed the researchers’ overall development effort, which includes all activities related to a coordinated development effort, not just the work performed with EISG grant funds.
2.8.8.1 Marketing/Connection to the Market Given the projected one year payback and relatively low initial cost, the proposed device should find ready adoption if successfully introduced into the market, including becoming a requirement in plumbing codes. It is unclear if there is a potential for use of the device in the retrofit market since the researchers did not study costs or installation readiness among homeowners. The heat trap had not yet appeared on the researchers' website as of early 2010.
2.8.8.2 Engineering/Technical
Additional testing was underway and results from one test tended to confirm benefits. The final choice of materials and a successful field test of their longevity is necessary to confirm the device’s readiness for the market.
47

2.8.8.3 Legal/Contractual
The researchers received a patent for a “Demand Water Heater Heat Trap” (6,302,063 B1).
2.8.8.4 Environmental, Safety, Risk Assessments/ Quality Plans
Further work is needed to establish final material selection and confirm longevity and safety under field test conditions. The researchers plan to solicit utility and other partners in such field tests as a logical next step in development.
2.8.8.5 Production Readiness/Commercialization
At the conclusion of this project the researchers stated the engineering development was 90 percent completed and they were soliciting bids for production and materials. They had a goal of completing development and demonstration within the next year.
2.9Alternative Synthetic Fuels Injector Tests
Awardee: Clean Energy Systems Inc.
Principal Investigator: Ashley Keating
2.9.1 AbstractCalifornia has set a high standard for renewable energy content in the electricity generation sector. At the same time, California generates about 80 million dry tons of biomass from the state’s farms, forests, and landfills. This waste is often hard to dispose of without environmental damage.
In this project the researchers demonstrated a method to convert California central valley biomass waste into electricity and to do so without pollution. The system combusts gasified fuel with oxygen to produce a high quality gas of steam and carbon dioxide (CO2) which is used to drive turbines and produce electrical power. The non-condensable portion of the drive gas, primarily CO2, is readily captured and can either be sequestered in underground formations or used for enhanced oil recovery. The CO2 is more readily captured because of its high concentration in the gas stream.
Should biomass gasification or biogas collection become available on a commercial scale (minimum ~170MWt), it would be economically feasible to build an integrated power plant with this technology. The project technology, in conjunction with gasified biomass or bio-gas, opens a major means of power generation not tied to a single fuel source.
Keywords: Biomass, renewable energy, oxy-fuel, oxy-combustion, gasification, landfill gas, fuel flexible injector
2.9.2 IntroductionIn this project the researchers demonstrated a method to convert California Central Valley biomass waste into electricity and to do so without pollution. The
48

system combusts gasified fuel with oxygen to produce a high quality gas of steam and carbon dioxide (CO2) which is used to drive turbines and produce electrical power. the non-condensable portion of the drive gas, primarily CO2, is more readily captured and can either be sequestered in underground formations or used for enhanced oil recovery. The CO2 is more readily captured because of its high concentration in the gas stream. In addition to other components as shown in Figure 11, the process requires a special burner.
Gasification of waste products from agriculture (biomass and animal wastes) offers an opportunity to provide zero emission electrical power to California while ridding the state of accumulating waste products. The goal of this project was to prove the feasibility of converting low BTU value fuels (biomass and biogas) to electricity using oxy-fuel combustion technology. Prior to this project there had been no scientific combustion data available which described post combustion gas composition when these alternative fuels are combusted with oxygen. Gas composition of the working gas in a power plant affects eventual disposition of captured off gases whether by sequestration, use in enhanced hydrocarbon recovery, or other commercial uses. Using oxygen instead of air in combustion processes can provide cleaner burning, especially with low quality fuels. Low quality fuel includes gasified waste products, landfill gas, and digester gas.
The oxy-fuel combustion process involves a closed loop system and does not emit gases into the atmosphere. The ability to use alternative fuels provides electrical power while reducing demand for and dependence on oil and gas. California could also benefit from the availability of an effective means to dispose of accumulating biomass and waste in a manner supporting economic development without adverse environmental impact.
49

Figure 11: Test System Configuration
2.9.3 ObjectivesThe goal of this project was to determine the feasibility of using alternative fuels in oxygen combustion in the presence of water to test the ability to use fuels such as gasified biomass, landfill gas, and digester gas and to determine the product gas composition. The researchers s established the following project objectives:
1. Fabricate a fuel flexible injector.
2. Assemble and pressure test a single element gas generator (SEGG) assem-bly. The SEGG assembly must not leak at hydraulic pressures up to 600 psig.
3. Conduct combustion tests with alternative fuels. The injector must perform successfully with alternative fuels. Collect performance data including:
Documentation that film cooling protects chamber walls to 2,500°F.
Analysis of combustion pressure and temperature for each fuel.
Measurement of drive gas composition unburned fuel, NOx, SOx, and CO.
2.9.4 Outcomes 1. The researchers designed and fabricated two injectors and a mounting as-
sembly: a syngas (synthesis fuel created by gasifying a solid) injector, a methane (ch4) injector, and an injector housing to interface with the SEGG. To speed fabrication they used drilled gas ports in lieu of platelet injection elements. They fabricated the CH4 injector to enable the creation of a perfor-mance baseline for later comparison with syngas results.
2. The researchers successfully assembled the single element gas generator with the new injection elements. They upgraded the segg based on lessons learned from prior system testing. The generator passed pressure testing at 650 psig.
3. The researchers developed a test plan based on segg test experience using methane. They also used the plan for syngas testing of the segg. The segg in-
50

jector performed successfully with alternative fuels, achieving routine and stable performance. Researchers found film cooling was effective. A small amount of water was sprayed onto the walls of the combustion chamber from the injector. Combustion chamber walls showed no signs of heat dam-age or erosion after operations at combustion temperatures higher than 2,500°F. They measured combustion temperatures above 2,500°F for all fuel combinations. Temperatures ranged from 3,200°f to 4,200°F. Operating pressures averaged 295 psia (± 40 psia) due to gas supply bottle blow down limitations.
Table 2 lists the measured combustion gas (exhaust) composition. Researchers measured CO2 and N2 at 93.9 percent and 6.1 percent, respectively.
In a parallel department of energy (DOE) sponsored project, the researchers tested syngas using a larger (16 MWt) gas generator. Those tests provided corroborative data to this project. DOE syngas composition replicated that of oxygen blown coal gasifiers, which is virtually identical to the fuel composition of oxygen blown biomass gasifiers.
Table 2: Combustion Gas Composition
Fuelunburned
fuel
nox
(ppm)
sox
(ppm)co (ppm)
Methane nil 0 0 0-0.06
Simulated landfill
gasnil 2.88-3.36 nil 0.98-3.33
Simulated coal
Synthesis gas
(syngas)
nil 2.37-3.57 nil 0.09-0.21
Simulated h2-
depleted syngasnil 1.68-2.49 nil 0.01-0.14
2.9.5 ConclusionsThe combustion testing confirmed the feasibility of using oxygen fuel combustion with gasified waste materials including biomass and digester gas. Testing characterized combustion gas composition. Testing demonstrated that the combustion chamber was protected by film cooling and that fuels combusted fully
51

and produced high purity CO2 that needed virtually no further conditioning for capture.
2.9.6 RecommendationsThe researchers calculated extreme test conditions (approximately 4000°F). While the film cooling of the combustion chamber appears to have protected the vessel, longer term testing should be completed to verify that creep or other temperature dependent degradation will not occur.
Researchers should perform scale-up testing on larger test beds and similar synthesis gas makeup to verify performance under industrial scale application. They should document those results in design guidelines for broad application. Similarly, they should test complete systems using gasified biomass or landfill/digester gas, including the ultimate capture of CO2.
After taking into consideration (a) research findings in the grant project, (b) overall development status, and (c) relevance of the technology to California and the PIER program, the Program Administrator has determined that the proposed technology should be considered for subsequent funding within the PIER program.
Receiving subsequent funding ultimately depends upon (a) availability of funds, (b) submission of a proposal in response to an invitation or solicitation, and (c) successful evaluation of the proposal.
2.9.7 Benefits to CaliforniaPublic benefits derived from PIER research and development projects are assessed within the following context:
Reduced environmental impacts of the California electricity supply, trans-mission, or distribution system
Increased public safety of the California electricity system
Increased reliability of the California electricity system
Increased affordability of electricity in California
The primary benefit to the ratepayer from this research is from reduced environmental impacts of the California electricity supply. Secondary benefits are reduced environmental impacts from the disposal of various waste materials. Use of the oxygen-fuel cycle in conjunction with gasified biomass or biogas offers a new source of clean power generation. It also produces concentrated CO2 that is more easily captured than from conventional combustion systems. The CO2 may be sequestered or used for enhanced oil recovery, a major California industry or wherever CO2 is required for industrial use. This demonstration of oxygen fuel combustion of biomass syngas and biogas provides an effective means of eliminating waste materials while generating near zero emissions and carbon capture.
In the intermediate time period (five years), with improved steam turbine technology already available costs approach the costs of Integrated Gasification Combined Cycle (IGCC) systems. In the longer term (10 years), the researchers estimated costs to be competitive with IGCC costs while allowing full carbon capture and sequestration. If future IGCC systems are required to adopt carbon capture and sequestration controls, the project technology would be less costly.
52

The expected cost structure of these early stage commercial plants would be about $0.055/kWh for a 100 MW plant and $0.07/kWh for a 20 MW plant. If the CO2 can be used beneficially to generate revenue, the cost of electricity from an oxy-fuel biomass power plant could be reduced by as much as $0.01/kWh, bringing the cost of electricity as low as $0.045/kWh.
2.9.8 Overall Technology Transition AssessmentAs the basis for this assessment, the Program Administrator reviewed the researchers’ overall development effort, which includes all activities related to a coordinated development effort, not just the work performed with EISG grant funds.
2.9.8.1 Marketing/Connection to the Market Clean Energy Systems (CES) has committed to identifying people in organizations that have large quantities of syngas. It plans to present to them the opportunity to generate electric power from syngas using CES technology. The potential market for this technology is expected to be very large. The researchers are expanding the application of the core technology to other fuels.
2.9.8.2 Engineering/TechnicalCES intends to further develop oxy-fuel syngas combustion applications. The biggest challenge will be in identifying sufficient quantities of syngas that can achieve necessary project economics.
2.9.8.3 Legal/Contractual CES has several patents applicable to this technology, but none as a direct result of this project.
2.9.8.4 Environmental, Safety, Risk Assessments/ Quality Plans Other than the inherent safety considerations of any system using oxygen and high-pressure combustion, there do not appear to be any unique environmental or safety considerations from expanded application of this technology.
2.9.8.5 Production Readiness/Commercialization CES has several strategic partners assisting in developing oxy-fuel combustion opportunities. CES has an ongoing commercialization plan that includes biogas oxy-fuel opportunities.
2.10 Ion Sense Based Air/Fuel Ratio Control and Combustion Diagnostics in Stationary I/C Engines
Awardee: Advanced Engine Technologies Corporation.Principal Investigator: Greg Beshouri
2.10.1 AbstractAccurate air/fuel ratio control and performance monitoring for stationary, gaseous fueled, internal combustion engines offers the potential to lower the cost of environmental compliance, improve operational reliability, reduce maintenance
53

costs, and improve engine efficiency. With partners Mercel and Altronic, the researchers developed special test hardware adapted from similar equipment in commercial use on Saab automobile engines. This equipment was used to map four engines representative of natural gas, pipeline compressor station applications, including rich and lean burn four stroke/cycle (4SC) engines from several mainstream manufacturers. Results for 4SC rich burn engines with non selective catalytic reduction indicated that the sensor proven in this project can determine air/fuel ratios and relative changes in air/fuel ratio, complementing the usual lambda sensor. The project sensor can indicate knock, misfire, cylinder level ignition timing, cylinder level relative power balance, and relative engine output. Results for 4SC lean burn engines with pre-combustion chambers (PCC) showed the sensor can indicate PCC global air/fuel ratio changes, relative air/fuel ratio balance, misfire, and ignition timing. This technology is a good candidate for commercialization, with the next step being development of specific equipment, applications, and techniques for commercial use.Keywords: Environmentally preferred advanced generation, cogeneration engines, compressor engines, engine emission monitoring and control, ion sense, natural gas fueled engines, stationary engines
2.10.2 Introduction Further improvements in combustion stability and engine balance in stationary four stroke, four cycle (4SC) lean and rich burn engines are limited by existing combustion sensing technology. Without the ability to better measure and more closely control combustion parameters within each engine cylinder, improved emissions, efficiency, and availability are less likely to be realized.
Accurate air/fuel ratio control and performance monitoring for stationary gaseous fueled internal combustion engines has the potential to lower the cost of environmental compliance, improve operational reliability, and improve engine efficiency. These benefits could accrue to California in areas such as gas pipeline pumping and electric power generation.
The researchers proposed a sensor based on ion current sensing. The applications of the sensor included air/fuel ratio control and performance monitoring for current production stationary, gaseous fueled, internal combustion engines. While this technology had been in use for automobile engines for some time (Saab), it had not been tested in stationary applications. The researchers investigated correlations between the ionization inside a cylinder and a number of engine parameters indicative of performance
The researchers considered the degree of ionization inside the cylinder as being equivalent to measuring the conductivity of the reacting gases. By introducing a probe with two electrodes connected to a low voltage source, the migration of electrons between electrodes of opposite polarity provided a current in the measuring circuit. This current depended on the number of ions formed. The current was the basis for the resulting data correlations in the project.
A system developed by Mercel AB that utilized the spark plug as the measuring probe was employed in the research (Figure 12). This system eliminated the need for an additional probe and external voltage supply by using the spark itself to generate the potential necessary for ion current measurement.
54

55

Figure 12: Measurement Probe Based on the Spark Plug
2.10.3 ObjectivesThe goal of this project was to determine the feasibility of using an ion sensing device to measure air/fuel ratio control and monitor performance of current production stationary, gaseous fueled, internal combustion engines in power generation/co-generation and pipeline service. The researchers s hypothesized that using this sensor would lower the cost of environmental compliance, improve operational reliability, and improve engine efficiency. The researchers established the following project objectives:
1. Develop a test plan. Identify representative engines, seek end user buy-in, and secure test sites.
2. Define the necessary ignition system modifications to support the ion sensor and to obtain hardware.
3. Temporarily install the hardware and map the engines over their range of operation.
4. Reduce and review the data. Demonstrate correlations between ion sensor parameters and air/fuel ratio. Assess correlations between the ion sensor and other engine parameters and operating conditions.
5. Perform a life cycle cost analysis.
2.10.4 Outcomes 1. A test plan was developed and necessary approvals from representative in-
dustry research and end users were obtained. Both pre-combustion chamber (PCC) fitted lean burn and non-selective catalytic reduction (NSCR) fitted rich burn engines were tested as described below:
56

a. Eastern Municipal Water District at Perris, California (Caterpillar AT G342 SI and Waukesha 9390)
b. El Paso Pipeline at Couldersport, Pennsylvania (Ingersoll Rand KVG 412)
c. Southern California Gas Company at Aliso Canyon, California (Inger-soll Rand KVS 412 IEM Pre-Chamber and KVS 412 Diesel Supply Screw in Pre Chambers)
2. The researchers collaborated with partners (Mercel and Altronic) to obtain the required hardware. Prototype ignition coils and ion sensing hardware developed during a previous test program were integrated into the standard ignition systems of the test engines.
3. The researchers successfully mapped all four engines over their ranges of operation. A total of 61 data sets were collected, with each set consisting of 10-20 engine parameter values, three emissions values, six ion sense values, and approximately 50 calculated parameter values.
4. Data reduction and analysis yielded roughly 12 trends per test engine. This information suggested that:
a. In 4SC rich burn engines fitted with non-selective catalytic reduction, ion sensing may indicate air/fuel ratio and relative changes in air/fuel ratio. This could complement results from the traditional lambda sen-sor if the two were used in tandem. The ion sensor could indicate knock, misfire, cylinder level ignition timing, relative power balance, and relative engine output.
b. In 4SC lean burn engines fitted with pre-combustion chambers (PCC), the ion sensor could indicate PCC global air/fuel ratio changes, rela-tive air/fuel ratio balance, misfire, and ignition timing.
5. Although no specific test data were presented, the researchers estimated that integration of an ion sensor into 4SC rich burn engines could result in a fuel savings of between two and three percent depending on engine output. The researchers claimed the efficiency gains could provide a two to seven year payback in a commercialized system, depending on engine size. A simi-lar estimate presented for 4SC lean burn PCC fitted engines suggested fuel savings of two percent and a payback period of between two and five years.
2.10.5 Conclusions1. A comprehensive test plan was developed and a very good range of test en-
gines arranged with three typical users of stationary engines. The support offered by the host engine owners (identified in Outcome 1) was noteworthy and contributed to the robust range of data obtained, as well as helping to keep total projects down through loaned equipment.
2. The required test hardware was obtained and utilized according to plan. Use of prior equipment and knowledge gained in previous testing helped control project costs and led to superior results.
3. The wide range of test data and excellent data reduction and correlation analysis fully supported the test objective.
57

4. The conclusions summarized in Outcome 4 above provided strong endorse-ment for the proposition that ion sensing technology has benefits for both rich and lean burn stationary 4SC engines. The results are a strong founda-tion for further research and commercialization of this technology.
5. In the absence of test data specifically measuring improvements in fuel effi-ciency, the conclusion that ion sensing technology can result in reduced fuel consumption remains more of an intuitive proof at this point. In particular, the conclusion that such improvement could be quantified to be in the range of two to three percent would require specific test data to validate.
The established practicality of ion sensing technology in automobile engines, as well as its successful utilization in the wide range of testing for this research, strongly suggests that it can be an important tool in stationary engines. The rich data obtained clearly demonstrate that there are useful correlations between ion sensor data and important engine operating parameters. The prospect for successful commercialization of test equipment is very good.
2.10.6 RecommendationsHaving demonstrated that ion sensing technology can provide strong correlations with engine operating parameters, the logical next steps should be directed towards how best to apply the data obtained using this sensor. The target market should be large stationary engines used in natural gas pumping and agricultural applications.
After taking into consideration (a) research findings in the grant project, (b) overall development status, and (c) relevance of the technology to California and the PIER program, the Program Administrator has determined that the proposed technology should be considered for subsequent funding within the PIER program.
Receiving subsequent funding ultimately depends upon (a) availability of funds, (b) submission of a proposal in response to an invitation or solicitation, and (c) successful evaluation of the proposal.
2.10.7 Benefits to CaliforniaPublic benefits derived from PIER research and development projects are assessed within the following context:
Reduced environmental impacts of the California electricity supply, trans-mission, or distribution system
Increased public safety of the California electricity system
Increased reliability of the California electricity system
Increased affordability of electricity in California
The primary benefit to the ratepayer from this research is increased affordability of electricity in California. The engines in gas compressor stations moving natural gas to power plants serving California should exhibit reduced costs of environmental compliance, operation, and maintenance, as well as higher reliability through improved engine diagnostics and testing. These same benefits can accrue to internal combustion engines used to provide electricity or to provide mechanical power in agricultural applications. Numerical estimates of benefits are difficult until further research work to determine actual fuel efficiency gains is completed
58

2.10.8 Overall Technology Transition AssessmentAs the basis for this assessment, the Program Administrator reviewed the researchers’ overall development effort, which includes all activities related to a coordinated development effort, not just the work performed with EISG grant funds.
2.10.8.1 Marketing/Connection to the Market Ion sensing technology is offered in the marketplace by a company known as Ion Sense. There is a clear market for improved engine monitoring and diagnostic equipment as operators of stationary internal combustion engines strive to comply with tighter emissions limits in an era of increased fuel, operating, and maintenance costs. The participants in this research all indicated a strong interest in the potential benefits of Ion Sense technology, as did the Pipe Line Research Council International’s Compressor Committee.
2.10.8.2 Engineering/TechnicalThe research clearly established that adapting existing and proven Ion Sense technology used in automobiles to testing of stationary 4SC and lean burn engines is feasible. The correlations obtained between Ion Sense data and important engine operating parameters point the way to successful commercial application of this technology for these engines.
2.10.8.3 Legal/Contractual One of the technology partners in this research (Mercel) provides Ion Sense technology to Saab for use in their automobile engines, and has a number of patents for this technology. As devices and applications for commercial application of Ion Sense to stationary engines progress, additional legal and contractural arrangements may be needed.
2.10.8.4 Environmental, Safety, Risk Assessments/ Quality Plans While no problems are anticipated, these plans must be completed.
2.10.8.5 Production Readiness/Commercialization
The prospect for commercialization partners appears to be excellent, given the close work of commercial partners with the developers of Ion Sense technology and the strong interest of the potential market in using Ion Sense.
59

2.11 Development of Optimization Software for an Activated Sludge System
Awardee: Ekster and Associates
Principal Investigator: Alex Ekster
2.11.1 AbstractWastewater treatment plants are among the largest publicly owned industrial energy consumers. An activated sludge process consumes approximately 50 percent of the total electrical energy used at such plants. More than 50 percent of the activated sludge plants in California remove only carbonaceous pollutants from wastewater, while the rest remove both carbonaceous pollutants and ammonia. This project addressed reducing the energy demand of an activated sludge system that removed carbonaceous pollutants only. California sewage treatment plants of this type could reduce their electrical energy consumption significantly if they optimized the operation of the blowers supplying air to the activated sludge process while maintaining the treatment level of the effluent. Total energy saving would depend on market penetration of the developed methodology. At 10 percent adoption by all such plants in California, the energy saving could be as high as 150 MWh per day.
The researchers in this project developed a methodology based on optimizing the age of the sludge and calculating dissolved oxygen set points that control sludge blowers at the most energy efficient speed. They then embedded the methodology into system control software. The researchers tested the software on a full scale sewage treatment plant in Oxnard, California. The new control software reduced the demand for oxygenation agents without a negative impact on process performance. The net result was a 25 percent reduction in electrical energy consumed by the blowers supplying the oxidizing agent.
The researchers began the commercialization process at the completion of this project
Keywords: Sewage treatment, energy reduction, dissolved oxygen, activated sludge
2.11.2 IntroductionWastewater treatment plants are among the largest publicly owned industrial energy consumers. An activated sludge process consumes approximately 50 percent of the total electrical energy used at such plants. More than 50 percent of the activated sludge plants in California remove only carbonaceous pollutants from wastewater, while the rest remove both carbonaceous pollutants and ammonia. This project addressed reducing the energy demand of an activated sludge system that removed carbonaceous pollutants only. California sewage treatment plants of this type could reduce their electrical energy consumption significantly if they optimized the operation of the blowers supplying air to the activated sludge process while maintaining the treatment level of the effluent. Total energy saving would depend on market penetration of the developed methodology. At a 10 percent adoption by all such plants in California, the energy saving could be as
60

high as 150 MWh per day. California sewage treatment plants could reduce their electrical energy consumption if they could optimize the operation of the blowers supplying air to the activated sludge process while maintaining the treatment level of the effluent.
The researchers developed a methodology based on optimizing the age of the sludge and dissolved oxygen set points. They embedded the methodology into system control software. The software was tested on a full scale sewage treatment plant in Oxnard, California. The new control software reduced the demand for oxygenation agents without a negative impact on process performance. The result was a reduction in electrical energy consumed by the blowers supplying the oxidizing agent. Figure 13 illustrates reduced airflow resulting from the installation and use of the control software, trade named OPTImasterTM .
Figure 13: Airflow Reduction Due to Optimization
2500
2750
3000
3250
3500
3750
4000
4250
4500
4750
5000
11/29/2006 12/11/2006 12/23/2006 1/4/2007 1/16/2007 1/28/2007 2/9/2007
AIR
FLO
W, C
FM
OPTImaster installed
Optimization started
2.11.3 ObjectivesThe goal of this project was to determine the feasibility of new methodology and software to control and maintain activated sludge parameters so less energy is needed to achieve the desired treatment efficiency in a sewerage treatment plant. The researchers established the following objectives:
1. Develop a methodology that is able to predict average settling velocities with accuracy of one standard deviation and average effluent total sus-pended solids (TSS) with accuracy 2 mg/l under optimum sludge age and mixed liquor suspended solid (MLSS) conditions.
2. Determine a value of dissolved oxygen (DO) below which non-settleable TSS will increase 2 mg/l above noise level.
3. Use a historical database and experiments to show that the developed methodology selects the proper sludge age and DO that maintains the aver-
61

age settling velocity within one standard deviation of a target value, the av-erage effluent TSS within 2 mg/l of target value, and the minimum energy consumption relative to comparable sludge age and DO results.
4. Demonstrate that prototype software can provide at least a 5 percent energy savings under similar input conditions while complying with specified efflu-ent quality requirements.
2.11.4 Outcomes 1. The researchers determined the proper indicator of performance for an acti-
vated sludge system was a sludge volume index (SVI). If the SVI went higher than 150 ml/g, the system suffered a deterioration of sludge settleability. If the SVI went below 60 ml/g, flocculation problems occurred. The optimal values for SVI were less than 150 ml/g and for effluent TSS were less than 8 mg/l. The results of data mining and calculations showed an SVI less than 150 ml/g and an effluent TSS less than 8 mg/l when MLSS was less than 1,130 mg/l and DSA (sludge age) was less than 5.2 days. The project devel-oped a methodology that was able to predict average settling velocity with an accuracy of one standard deviation and average TSS with an accuracy of 2 mg/l under optimum sludge age and range of mixed liquor TSS concentra-tions.
2. The researchers determined when the blower operation resulted in dissolved oxygen less than 0.3 mg/l in all parts of the aeration tank, the total sus-pended solids (TSS) increased from an average of 8 mg/l to more than 12 mg/l. Non-settleable TSS also increased from 6mg/l to more than 10 mg/l.
3. Using the above data for optimal effluent TSS and corresponding DO, re-searchers developed an algorithm to select a sludge age and range of MLSS and DO concentrations that provide conditions to maintain specified aver-ages of SVI over effluent TSS at minimum aeration. The algorithm was based on a combination of data mining and statistical process control. This algo-rithm was tested at the Oxnard Wastewater Treatment Plant over two months. Using this algorithm, the ISO was within one standard deviation of predicted values of 4.4 ft per hour while maintaining the effluent TSS within 85 percent of the targeted range of less than 8 mg/l. The airflow was low-ered from 4,500 cfm to 3,000 cfm, saving power at DO concentrations of .3mg/l to .7 mg/l and thereby minimizing energy consumption.
4. The researchers' software reduced energy consumption to 128 kWh (25 per-cent savings) from 169 kWh while complying with specific effluent quality and settling requirements. This 25 percent savings exceeded the 5 percent goal.
2.11.5 Conclusions1. Based on the outcomes and information presented, the researchers achieved Objective 1.
2. The researchers met Objective 2.
3. The researchers met Objective 3.
4. The researchers' software achieved a 25 percent energy savings at the 28 million gallons a day trickling filter solids contact system by selecting opti-
62

mum set points for sludge age and dissolved oxygen concentrations. The re-searchers greatly surpassed Objective 4.
The researchers proved feasibility of the optimization system to reduce energy consumption for aeration while maintaining the treatment level of wastewater.
2.11.6 RecommendationsThe Program Administrator recommends further testing of this optimization system to prove its capability to control other types of aeration systems besides the one in this study. The capabilities of the methodology should be expanded to nitrification treatment systems by including equations for ammonia and nitrogen removal. Finally, researchers should develop a graphic interface so the program is more user friendly. The researchers should develop a plan for promoting and encouraging sewage plant operators to incorporate this software.
After taking into consideration (a) research findings in the grant project, (b) overall development status, and (c) relevance of the technology to California and the PIER program, the Program Administrator has determined that the proposed technology should be considered for subsequent funding within the PIER program.
Receiving subsequent funding ultimately depends upon (a) availability of funds, (b) submission of a proposal in response to an invitation or solicitation, and (c) successful evaluation of the proposal.
2.11.7 Benefits to CaliforniaPublic benefits derived from PIER research and development projects are assessed within the following context:
Reduced environmental impacts of the California electricity supply, trans-mission, or distribution system
Increased public safety of the California electricity system
Increased reliability of the California electricity system
Increased affordability of electricity in California
The primary benefit to the ratepayer from this research would be increased affordability of electricity in California.
Eighty-nine publicly owned activated sludge plants with capacities larger than 2 million gallons a day (MGD) together treat approximately 2.5 billion gallons of wastewater a day in California. More than half of these plants are not required to remove ammonia. According to Wastewater Engineering (2003), energy consumption for an activated sludge system is at least 1200 kilowatt-hours/MGD. Based on this consumption level, the researchers estimated energy use of non-nitrifying activated sludge systems in California at nearly 1500 megawatt-hours a day (50percent*2500*1200/1000). Assuming 10 percent of this energy can be saved using software developed in this project, 150 megawatt-hours a day can be saved in California. At $0.10 per kWh, this would be an annual savings of over $5 million.
2.11.8 Overall Technology Transition AssessmentAs the basis for this assessment, the Program Administrator reviewed the researchers’ overall development effort, which includes all activities related to a
63

coordinated development effort, not just the work performed with EISG grant funds.
2.11.8.1 Marketing/Connection to the Market The researchers have commercialized SRTmasterTM sludge age control software, OPTImasterTM software, and DOmasterTM using local sales distributors in various geographical areas. SRTControl has announced sales to the cities of Oxnard, California, and Toronto, Canada.
2.11.8.2 Engineering/TechnicalThe researchers plan additional research to apply project technology to other types of activated sludge systems.
2.11.8.3 Legal/Contractual The researchers have not announced the pursuit of any patents. They may utilize other methods of protecting their intellectual property.
2.11.8.4 Environmental, Safety, Risk Assessments/ Quality Plans No evidence exists to suggest that the researchers have worked on these plans.
2.11.8.5 Production Readiness/Commercialization The researchers are offering the software developed in this project for commercial application. Applications of this software are discussed on the researchers’ website, http://srtcontrol.com
The researchers had not developed a comprehensive business plan at the end of this project.
2.12 Hydrogen Micro-Sensor for Real Time Diagnostic of Transformer Oil
Awardee: Kebaili Corporation
Principal Investigator: Mo Kebaili
2.12.1 Abstract Keywords: Transformer, sensor, failure detection, hydrogen sensor, reliability, grid
2.12.2 IntroductionThe cost of electricity to the California consumer could be reduced if the maintenance of transformers on the grid could be based on actual need through real time monitoring instead of on a time based schedule as it is now. Most of California’s electricity is generated far from its point of consumption. For example 19 percent17 of California’s 60 GW demand18 is supplied from out of state. The electrical distribution grid consisting of low loss, high voltage transmission lines 17 http://www.energy.ca.gov/electricity/2003-01-28_OUTLOOK.PDF18 http://www.energy.ca.gov/html/energysources.html
64

operating above 100 kV,19 transformers to change the voltage, and ancillary grid components provide the means to bring the electricity to the consumer. In the grid, the transformers are employed to step up the voltage at the point of generation to the high voltage of the transmission lines and then step down to as low as 120 V close to the point of consumption. These transformers carry large amounts of electrical power and are oil filled for cooling. Over the life of the transformers degradation of the oil due to arcing and deterioration of the wire insulation cause a buildup of fault gases. These gases are either dissolved in the oil or present in the space over the oil. A gas sensor for real time monitoring of one or more of the fault gases in the transformer would allow prediction of incipient transformer failure and the necessity for maintenance or, conversely, avoid the performance of unneeded maintenance.
A sensor for monitoring transformer gases could have a large potential market in number of units. There are approximately 115,000 large transformers in the US (400,000 worldwide) worth above $200B.20 The average transformer age is 35 years with an expected life span of 40-50 years. Approximately 1 percent to 2 percent of these transformers fail each year,21 sometimes catastrophically, leading to wide scale power outages and costly repairs. A large underwriter of transformer insurance estimates that the failure rate will rise to 2 percent by 2008. On the other hand, according to CIGRE (International Council on Large Electric Systems) 30 percent to 50 percent of the current maintenance activity is unnecessary. With real time monitoring, impending transformer failure could be anticipated saving costly repairs and unnecessary time based maintenance activity being done on healthy transformers could be reduced, saving on maintenance costs. In both cases the California ratepayer would benefit by lower electricity costs.
The advancement of science proposed by the investigators to solve this need was the development of an innovative low cost highly sensitive and selective MEMS-based solid state hydrogen micro-sensor to continuously monitor low levels of hydrogen from oil degradation in transformers and oil filled electrical equipment. The device proposed is represented in Figures 14 and 15. Figure 14 shows a schematic side view of the proposed sensor structure. The hydrogen sensitive element is a thin resistive film of hydrogen absorbing Pd whose resistance depends on hydrogen content. It rests upon and is electrically insulated from a Pt micro-heater film which also functions as a calibrated temperature sensor because the electrical resistance of the Pt element depends on temperature. These two components rest on a thin freestanding silicon nitride film which has been etched free from the bulk silicon substrate. Figure 15 displays one of the completed sensor elements that the researchers developed in this project. After a sensing chip such as that shown in Figure 15 is mounted in a standard T0-18 package, it is hermetically sealed by a Teflon membrane. The membrane isolates the chip from transformer oil. Hydrogen gas can freely diffuse through the membrane but not other hydrocarbon gases which might be present in the oil. Thus the sensor is selective to hydrogen gas.
19 http://www.eia.doe.gov/cneaf/pubs_html/feat_trans_capacity/w_sale.html20 http://www.serveron.com/company/news_launch.asp21 http://www.serveron.com/downloads/dl_files/Technologypercent20Corridor.pdf
65

Figure 14: Side View of Proposed Hydrogen Sensor
Figure 15: Completed Sensor
The square in the center is the Pd thin film hydrogen sensing element.
2.12.3 ObjectivesThe goal of this project was to determine the feasibility of developing a low cost, highly sensitive and selective MEMS-based solid state hydrogen micro-sensor to monitor continuously low levels (ppm) of hydrogen generated from oil degradation of transformers and oil filled electrical equipment. The researchers established the following project objectives:
1. Design and fabricate a hydrogen micro-sensor. Demonstrate that a micro-sensor chip size of 1.00 mm x 1.00 mm x 0.50 mm can be achieved.
2. Show that the hydrogen sensor can be fabricated at a cost less than $25 in mass production.
3. Integrate and test the micro-sensor and control circuit. Demonstrate that the micro-sensor electrical power consumption is less than 100mW.
4. Design and fabricate a calibration chamber with gas mixture and tempera-ture controllers. Demonstrate that the test chamber controls H2 gas concen-tration down to 10 ppm and temperature to +/- 1o C.
5. Demonstrate precise control of hydrogen and nitrogen mixture with an accu-racy of +/- 5 percent of flow meter reading.
66

6. Use test chamber to test micro-sensor with H2. Demonstrate micro-sensor response time of less than 30 seconds.
7. Use test chamber to calibrate micro-sensor. Demonstrate that the micro-sen-sor detection range is from 0 to 5000 ppm hydrogen and is insensitive to hy-drocarbon vapors and other combustible gases.
8. Confirm that the micro-sensor accuracy is +/- 5 percent of H2 concentration readings.
2.12.4 OutcomesThe following outcomes were reported by the researchers:
1. Three different hydrogen micro-sensor designs were successfully fabricated in the INRF clean room facilities at UC Irvine. The researchers presented scanning electron micrographs demonstrating that a micro-sensor chip size of 1.00 mm x 1.00 mm x 0.50 mm is achievable.
2. The researchers stated that using the fabrication process employed in the INRF facility the hydrogen sensor can be batch fabricated at a cost less than $25. They provided no supporting discussion or evidence.
3. The micro-sensors contained an integrated control circuit. The micro-sensor electrical power consumption was less than 25 mW. No sensor input volt-ages and current were presented.
4. The researchers fabricated and tested a calibration chamber with gas mix-ture and temperature controllers. While the executive summary of the final report states that the test chamber controls H2 gas concentration down to 10 ppm and temperature to +/- 1o C, no data or discussion are given in the final report body. The lack of data makes it difficult to assess the outcome.
5. The researchers found that hydrogen and nitrogen flow rates could be con-trolled with an accuracy of +/- 5 percent of mass flow meter reading. From this observation they inferred that control over gas composition could be controlled to the same accuracy.
6. The researchers claimed a micro-sensor response time of 15 seconds was observed. This is substantially better than the goal of less than the 30 sec-onds. However, no supporting temporal data were presented. Lack of data makes it difficult to assess the outcome.
7. The researchers measured the resistance of the sensing element, its temper-ature compensating resistor, and its heater for each of the micro-sensors. The micro-sensor with the greatest output in a Wheatstone bridge configura-tion was selected for testing. Testing was carried out in a variable gas mix-ture of hydrogen in buffer gas of nitrogen or laboratory grade air. A nearly linear bridge output voltage was observed as a function of gas concentration from 0 to 5000 ppm hydrogen content. Evidently the mass flow meter set-tings were used to arrive at the gas concentrations. It was stated that even in the presence of oxygen the micro-sensors had no cross-sensitivity to hy-drocarbon and combustible gases consisting of methane, ethane, and propane in the operating temperature range below 80 oC.
8. The report does not state whether the goal of a micro-sensor accuracy of +/- 5 percent of H2 concentration was met.
67

2.12.5 ConclusionsThe main goal of this project was to determine the feasibility of an innovative low cost highly sensitive and selective MEMS-based solid state hydrogen micro-sensor to monitor continuously low levels (ppm) of hydrogen generated from oil degradation of transformers and oil filled electrical equipment. Overall feasibility of the approach was demonstrated. Some questions remain about the establishment of sensor accuracy of +/- 5 percent of H2 concentration.
1. The researchers fabricated three different hydrogen micro-sensor designs establishing that a micro-sensor chip size of 1.00 mm x 1.00 mm x 0.50 mm could be achieved. Thus this objective was met.
2. Using the fabrication process employed in the INRF facility, the researchers stated that the hydrogen sensor could be batch fabricated at a cost less than $25. They provided no details of this cost estimate. Therefore this goal was not established. In addition the researchers should estimate the total cost for the sensor, installation, monitoring equipmen,t and calibration. The total cost will lead to a market price. That price must be tested with utilities.
3. The fabricated sensors consumed about 25 mW of power, substantially less than the 100 mW goal. This success was attributed to the use of thermally isolated and low thermal mass platinum micro-heater on a ceramic silicon ni-tride micro-hot plate.
4. The researchers designed and fabricated a calibration chamber with gas mixture and temperature controllers. However, they did not demonstrate that the test chamber controls H2 gas concentration down to 10 ppm and temperature to +/- 1o C.
5. The researchers stated that hydrogen and nitrogen flow rates could be con-trolled with an accuracy of +/- 5 percent of flow meter reading. While no data were presented on the accuracy of control of the actual composition of the gas mixtures, the inference that a compositional accuracy of the same order could be achieved appears reasonable.
6. The researchers claimed an observed micro-sensor response time of 15 sec-onds. This result substantially improves on the response time goal of less than the 30 seconds. However, the researchers presented no supporting temporal data. For example, they did not specify the criterion for response time (e.g. 1/e time or 10 percent-90 percent change time). The researchers attributed the fast response rate to “nanostructuring” of the palladium alloy sensing element to increase its surface area.
7. The researchers chose the micro-sensor that produced the greatest output in a Wheatstone bridge. Significantly, they observed a linear bridge output as a function of (stated) hydrogen concentration from 0 to 5000 ppm. This is a good result. However, no error bars are shown or sources of error dis-cussed. Also, the sensitivity of the system (how close to 0 ppm could a change be observed) was not explicitly determined. From the bridge output results it would appear that voltage sensitivity might be 20 V which would correspond to ~100 ppm hydrogen. It would be useful to know how 20 V compares to system noise. The researchers claimed that with or without the presence of oxygen the micro-sensors had no cross sensitivity to hydrocar-bon/combustible gases of methane, ethane, or propane within the operating
68

temperature range below 80 oC. However, no experimental data are presented to assess the result.
8. The final report contains no discussion of the micro-sensor accuracy (goal was +/- 5 percent of H2 concentration.) Calibration data presented for bridge output voltage in V vs. hydrogen concentration in ppm appears to be suffi-ciently linear as a function of flow meter settings to support such a conclu-sion. Such a conclusion depends on the calibration accuracy and proper functioning of the flow meters.
2.12.6 RecommendationsThe Program Administrator has the following recommendation if further R&D work is pursued in this area:
1. Sensor accuracy should be better established. The researchers should measure the gas compositions inferred by mass flow meter settings using independent more direct laboratory analysis of gas composition.
2. The sensitivity of the sensor to H2 must be established. Judging from the bridge output results, it appears that sensitivity might be 20 V which would correspond to about 100 ppm H2. Determine how 20 V compares to the present system noise level. Also, what is the Johnson noise of the present sensor resistance and measurement bandwidth?
3. Determine the accuracy of measurements of small voltages signals in a transformer containing perhaps 10-100 kV ac. Is a measurement of a 20 V dc signal practical in terms of shielding and common mode rejection? These tests must be accomplished before the sensor design is finalized.
4. Evaluate the total economic market value for a transformer failure detection system. For the medium to large grid transformer market, the current cost goal seems unduly restrictive since these transformers cost $500,000 to $5M each.4,5 Furthermore, the 115,000 of these in the US at $25/sensor would comprise a sensor market of only $2.9M at 100 percent penetration. This market size is not large compared to the $1M the researchers stated they need to complete “engineering development and demonstration.” The market price of a transformer failure detection system could be considerably higher than the cost of the sensor itself.
5. Determine market pricing (rather than cost based) with a balance of system, overhead, marketing costs, and profit.
6. Determine market potential by transformer size and type.
7. Perform accelerated testing to ensure that the sensors not only survive but remain accurate after 10 or more years of service. Conversely, determine sensor life with a recommended replacement period.
8. Finally the Program Administrator recommends that future reports contain a more complete presentation of data and treatment of experimental errors.
After taking into consideration (a) research findings in the grant project, (b) overall development status, and (c) relevance of the technology to California and the PIER program, the Program Administrator has determined that the proposed technology should be considered for follow on funding within the PIER program.
69

Receiving follow on funding ultimately depends upon (a) availability of funds, (b) submission of a proposal in response to an invitation or solicitation, and (c) successful evaluation of the proposal.
2.12.7 Benefits to CaliforniaPublic benefits derived from PIER research and development projects are assessed within the following context:
Reduced environmental impacts of the California electricity supply, trans-mission, or distribution system
Increased public safety of the California electricity system
Increased reliability of the California electricity system
Increased affordability of electricity in California
The primary benefit to the ratepayer from this research would be from increased reliability of the California electricity system. The incorporation of a sensor to continuously monitor for the presence and amount of gaseous hydrogen as a breakdown product in oil cooled transformers in the electrical grid would allow for the shut down and replacement of a failing transformer before it undergoes a more costly catastrophic failure.
Another benefit to the ratepayer from this research would be from increased affordability of electricity in California due to lower maintenance costs. For safety, transformers are now serviced on a short time based schedule sometimes before the actual need arrives. With real time monitoring, the time between maintenance calls could safely be increased without jeopardizing the transformer and associated equipment. The resultant lower maintenance costs would benefit the ratepayer.
2.12.8 Overall Technology Transition AssessmentAs the basis for this assessment, the Program Administrator reviewed the researchers’ overall development effort, which includes all activities related to a coordinated development effort, not just the work performed with EISG grant funds.
2.12.8.1 Marketing/Connection to the Market The researchers plan to market any product developed as a result of this project through their own small business.
2.12.8.2 Engineering/TechnicalThe main goal of this project was to determine the feasibility of an innovative low cost highly sensitive and selective MEMS-b of hydrogen generated from oil degradation of transformers and oil filled electrical equipment. Overall feasibility of the approach was demonstrated. Questions remain about the establishment of sensor accuracy of +/- 5 percent and sensor sensitivity. Good accuracy and sensitivity values will be necessary to market the sensor.2.12.8.3 Legal/Contractual No patent had been applied for by the close of the project. The researchers indicated a desire to maintain the intellectual property as proprietary trade secrets.
70

2.12.8.4 Environmental, Safety, Risk Assessments/ Quality Plans No studies or plans of this nature were presented. While the developed sensor could be incorporated into safety and environmental monitoring systems, the sensor itself must be thoroughly tested to ensure reliability and stability over decades.
2.12.8.5 Production Readiness/Commercialization At the completion of the project it was premature to have a production readiness plan. Additional tests and development must occur.
2.13 Solar Generator Critical Technology Demonstration
Awardee: Brayton Energy, LLC
Principal Investigator: James Kesseli
2.13.1 AbstractThe goal of this project was to prove feasibility of a critical sub-assembly of a solar energy generator comprised of a high temperature receiver and an underground source of compressed air. The researchers named his concept the SolarCAT. This power conversion technology can generate electricity on a utility size scale. The project was co-funded by the Arizona Public Service (APS). The proposed power system employed a solar heated air turbine driving an electric alternator. The combustor section of the air turbine operated near the focus of a 320 square meter parabolic concentrator dish. The compressed air energy storage, proposed to be underground, was filled by an electrically driven compressor operating during night hours.
The critical sub-assembly under development in this project was a turbo alternator consisting of a high speed, permanent magnet, electrical alternator directly coupled to an air turbine. The one moving part of the sub-assembly, the alternator rotor and coupled turbine rotor, spun at about 100,000 revolutions per minute (RPM) on air bearings. No oil lubrication system was needed. In this project a detailed design of the turbo alternator was completed and a mechanical prototype of the rotor assembly was fabricated for laboratory testing. The mechanical prototype used a simulated alternator and turbine rotor, with exact dynamic mechanical properties of a working unit. In laboratory tests the prototype was operated to 120 percent of design speed. The researchers proved the air bearing rotor system to be practical. Structural analyses, thermal analyses, and cost studies concluded that this solar power conversion technology was technically feasible and could be cost competitive with existing carbon based fuel powered electrical generation in today’s marketplace.
Keywords: Hybrid solar, gas turbine, concentrator, air bearings, solar generator
2.13.2 IntroductionOn average the price of natural gas used to generate electricity in California has been increasing in the past few years. Displacing natural gas used in electrical generation with fixed cost renewable energy sources could reduce the cost of
71

electricity if certain problems were eliminated or reduced. Solar energy powered generation is attractive to both the ratepayer and the utility because it is well matched to California’s electrical demand which peaks in the afternoon. One barrier to wider use of solar power has been the high initial capital cost compared to that of natural gas generation. Concentrated solar generation systems could be lower in cost offering a means to reduce the overall cost of solar electric systems. To do this, the sub-system at the focus of the concentrator must utilize proven and low cost technology. One recognized candidate technology in this application is a gas turbine and electrical alternator (turbo alternator) mounted at the focal point of the concentrator.
The proposed system could lower cost by employing a novel method of pressurizing the working fluid of the turbine. A schematic of the total system is shown in Figure 16. Normally gas turbines (Brayton cycle engines) continuously compress their working fluid during operation resulting in a large parasitic power loss to the turbine output. In the proposed system the working fluid (air) is compressed up to 16 bar by a large separate conventional compressor using inexpensive off peak electricity from the grid and stored at or below ground level. Efficiency is improved by compressing during cooler nighttime hours. In the daytime the stored compressed air is heated by the receiver at the focus of the concentrator and expanded through the turbine to produce more valuable on peak electricity. Except for efficiency losses, the work done to compress the air is recovered during daytime operation because the turbine does not have to compress its working fluid. This consumption of nighttime electricity and production of daytime electricity provides a load leveling function to the electric grid. Furthermore, there is a savings under time of use pricing of electricity.22 For example, in some California utilities summer on peak electricity rates are $0.104 per kilowatt hour (kWh) while summer off peak rates are much lower at $0.065 per kWh (SCE, 2008).23 This 40 percent lower cost of off peak electricity provides the rate payer cost savings. The total cost of electricity produced could be competitive with traditional sources of electricity and could be attractive to utilities for its load shifting feature.
Figure 16: Schematic of SolarCAT Cycle
22 http://www.energy.ca.gov/2005publications/CEC-999-2005-011/CEC-999-2005-011.PDF23 http://www.cpuc.ca.gov/cleanenergy/design/docs/PPT/BruceKaneshiro_DR-forEDF.ppt
72

A central high pressure intercooled air compressor station feeds a plurality of dish modules, each containing a hybrid solar receiver
and a turbo alternator electrical generator. The concentrator design employed in the system is under development by ASU.
The advancement of science proposed for this system is the development of a turbo alternator sub-assembly of novel design consisting of a high speed permanent magnet electrical alternator and air turbine drive operating on air bearings without oil lubrication, as shown in Figure 18. The 320 m2 concentrator would deliver 240 kW of solar power to the receiver. In the event of interruption of solar, the receiver would incorporate a hybrid mode allowing for internal combustion of natural gas. The solar receiver would deliver 211 kW thermal to two nearly identical 100 kW turbo alternators operating in series. The daytime gross electric power to be delivered to the grid, integrated over eight hours, would be 190 kW electric and the nighttime compressed air charge, integrated over eight hours, would be 113 kWe. Thus in solar only mode, the 190 kW output would be achieved with a nighttime input of only 113 kW. Overal, the net power produced is 77 kW, integrated over eight hours. Since the solar input over the same period of time is 240 kW, the system would achieve a 32 percent system solar to electric efficiency. Importantly, the cost of nighttime electricity consumed would be low compared to the value of the daytime electricity produced.
73

Figure 17: SolarCAT Turbo Alternator Final Design
The permanent magnet electrical alternator and axially coupled turbine spin at over 100,000 rpm on low friction air bearings.
2.13.3 ObjectivesThe goal of this project was to determine the feasibility of a turbo alternator as the active component of a novel solar power conversion system. The researchers established the following project objectives:
1. Design and analyze a turbo alternator. Analyze for stress, rotor dynamics, and thermal characteristics. Prepare manufacturing drawings.
2. Fabricate a turbo alternator unit for test. Fabricate prototype alternator in-cluding rotor, stator, and cooling. Prepare test equipment with proximity probes, accelerometers, temperature sensors, power meter, and air turbine to spin rotor from 50,000 to 125,000 RPM. Fabricate a simulated mechanical prototype turbine stage with bearings and seals for dynamic testing.
3. Test turbo alternator and characterize. Map dynamics of system between the sub-critical and super-critical region of the operating range (50,000 RPM to 139,000 RPM). Measure steady state bearing losses with energy balance between cooling air and motor power. Perform endurance test by running to 125 percent speed five times and confirm integrity.
2.13.4 Outcomes 1. The researchers completed preliminary designs for the turbine, alternator,
and bearing assemblies. The researchers also produced manufacturing drawings and submitted those to vendors for quotes.
2. The researchers fabricated a mechanical prototype of a turbo alternator with a non-active simulated alternator rotor and an air turbine driven by shop air. The prototype contained working air bearings and seals for dy-namic testing. Initially the researchers planned to conduct tests on a work-
74

ing alternator, but they decided first to fabricate a mechanical prototype for actual dynamic testing. The researchers also assembled an instrumented test bench with vibration and thermal sensors. Two and four pole alternators and two, three, four, and six stage turbine stages were considered in trade-off studies. The researchers’ final design consisted of four two pole 50 kW al-ternators in series rather than two 100 kW units in series as originally pro-posed. This change was justified as a result of mechanical mode analysis and air bearing considerations. The operating RPM for the four turbo alternators was approximately the same as for the original design. Thermal considera-tions for maintaining the alternator magnet temperature below its Curie point required a thermal separation between the alternator and turbine.
3. The researchers investigated the behavior of the prototype rotor and bear-ing dynamics over the intended operating range of 95,000 to 139,000 RPM. Measured vibration levels were below target levels. Five excursions to 140,000 RPM, 20 percent above the highest intended operating point, showed no structural or fatigue damage. This speed was below the first criti-cal bending mode frequency found in the design analysis. Magnet operating temperature was controlled to an acceptable level by a small cooling air flow.
In addition to addressing the stated project objectives, the researchers conducted a system cost analysis. They concluded that a 208 kW turbo alternator system would cost $120 to $150 per kW in moderate quantities. To include the balance of system costs (concentrator, recuperator, receiver, power electronics), they used economic models from the Arizona Public Service’s STAR laboratories to conclude that a compressed air turbine based power plant could be built at a capital cost of $1000 to $1400 per kW peak and produce electricity at a nominal cost of $0.10 per kWh.
2.13.5 Conclusions1. The researchers completed a design for a turbo alternator. The researchers
subjected the design to stress, rotor dynamics, and thermal analysis. The re-sults of those analyses were positive. The researchers produced a set of manufacturing drawings. This objective was met.
2. The researchers fabricated a simulated mechanical turbo alternator suitable for testing of its dynamical properties. The simulated rotor did not contain a working alternator. The researchers also fabricated a test facility to spin the simulated rotor from 50,000 to 125,000 RPM with an air turbine. This objec-tive was substantially met.
3. The goal of measuring the system dynamics between the sub-critical and su-per-critical region of the operating range (50,000 RPM to 139,000 RPM) was met. The researchers reported that bearing and mechanical losses were measured at two percent without giving additional details. The researchers met the goal of testing system endurance by five excursions to 125 percent of operating speed.
This project made significant progress in proving feasibility of the air bearing turbo alternator sub-assembly concept. There is adequate reason to continue further development of this sub-assembly concept and associated balance of system components.
75

2.13.6 RecommendationsAfter taking into consideration (a) research findings in the grant project, (b) overall development status, and (c) relevance of the technology to California and the PIER program, the Program Administrator has determined that the proposed technology could be considered for subsequent funding within the PIER program.
However the researchers stated that new development funding had been secured, and they described a future development path to be carried out with those funds. Planned development culminates in a one megawatt demonstration plant and assembly site in Glendale, Arizona. In view of the new funding commitments they already secured, the researchers do not request subsequent funding from the PIER program.
The Program Administrator recommends the addition of manufacturing specialists to the research team. If this action is taken early in the system design, substantial cost problems can be avoided. While the team has estimated a favorable system cost, history on related projects shows that cost is difficult to contain without a strong cost discipline during design.
The Program Administrator also recommends a study of potential SolarCAT sites in California. That study should focus on sites that have potential for underground air storage. Sites must have appropriated geologic formations, proximity to transmissions lines, natural gas lines, and abundant insolation. In addition, any mining operations associated with the construction of a SolarCAT power plant cannot harm the environment.
2.13.7 Benefits to CaliforniaPublic benefits derived from PIER research and development projects are assessed within the following context:
Reduced environmental impacts of the California electricity supply, trans-mission, or distribution system
Increased public safety of the California electricity system
Increased reliability of the California electricity system
Increased affordability of electricity in California
The primary benefit to the ratepayer from this research is reduced environmental impacts of the California electricity supply or transmission or distribution system. The SolarCAT system (Solar Compressed Air Turbine) is a hybrid system that operates in either a solar only mode (no fuel backup) or in times of low solar insolation uses natural gas fuel to augment the solar energy. Other fuels, including biomass and landfill derived natural gas, could be used if air emission problems could be eliminated. In its primary solar only mode, SolarCAT would emit no atmospheric pollutants during daytime operation. The design calls for a field of concentrators, each producing 190 kW electric. The compressed air for the entire field is produced by a single efficient air compressor and storage field. The nighttime grid power to compress air is 113 kW electric per concentrator, integrated over eight hours. Thus air pollution per unit electrical output is only 60 percent (113/190) that of a natural gas fueled combined cycle generator.
76

In 2000 CO2 release by carbon based fuel electricity generation was second only to that of road transportation.24 In 2007 61.8 percent of California’s electricity, including out of state imports, was generated by carbon based fuel combustion. This was comprised of 45.2 percent by natural gas and 16.6 percent by coal.25 Each kWh of coal generated electricity releases about two pounds of CO2, while natural gas generated electricity produces close to one pound of CO2
26 per kWh. Thus, for
that mix of fuel sources, each kWh of electricity produced released about 0.78 pound CO2 into the atmosphere. In 2007 California’s total system power was 302,072 GWh27 accounting for an estimated total of 105 million metric tons of CO2 released into the atmosphere. This estimate includes the CO2 released from generation of 30.5 percent of California’s electricity imported from out of state. In 2006 the California legislature effectively banned28 any new electricity contracts that rely on generation of electricity by coal. Thus future CO2 savings will be diminished when coal fueled electricity is no longer available in California.
Depending on market penetration, widespread introduction of SolarCAT power into the electrical grid could reduce power plant produced of CO2 significantly. This compressed air turbines system could also reduce the cost of solar energy.
2.13.8 Overall Technology Transition AssessmentAs the basis for this assessment, the Program Administrator reviewed the researchers’ overall development effort, which includes all activities related to a coordinated development effort, not just the work performed with EISG grant funds.
2.13.8.1 Marketing/Connection to the Market Brayton Energy LLC has formed a new company, SolarCAT Inc., with $15 million of venture capital to develop and market the technology.
2.13.8.2 Engineering/TechnicalSolarCAT Inc. planned to build a one megawatt demonstration plant and assembly facility at a site in Glendale, Arizona, provided by Arizona Public Service.
2.13.8.3 Legal/Contractual In addition to the new venture capital investment, the researchers received contracts from Arizona Public Service and SoCal Gas/Sempra. The U.S. Department of Energy solar Initiative committed two million dollars to a proof of concept demonstration. The researchers have submitted six provisional patent applications two utility patent applications.
2.13.8.4 Environmental, Safety, Risk Assessments/ Quality Plans These plans are critical. The compressed air turbine system has many environmental, safety, risk, and quality issues that must be addressed prior to widespread adoption.
24 http://www.arb.ca.gov/cc/factsheets/ccbackground.pdf25 http://energyalmanac.ca.gov/overview/energy_sources.html26 http://www.seen.org/pages/db/method.shtml27 http://www.energyalmanac.ca.gov/electricity/total_system_power.html28 SB 1368 Perata 2005-2006
77

2.13.8.5 Production Readiness/Commercialization
While the completion and successful demonstration of the planned one megawatt demonstration plant at Glendale, Arizona, will be an important step toward commercialization, the researchers should bring production partners into this project as early as possible.
2.14 Silicon Nanorod Solar Cells
Awardee: California Institute of Technology
Principal Investigator: Nathan S. Lewis
2.14.1 AbstractThe barrier to wider use of PV generation of electricity is the high initial cost of the market dominant high quality crystalline silicon solar cells. A low cost high efficiency PV technology would bring important environmental benefits. In the solar cells developed in this project, solar photons enter from the top and are absorbed along the 100 micron length of the rods. The photons excite pairs of electrons and holes, predominately in the thick p-type region. An excited electron only has to diffuse a distance equivalent to the rod radius before being captured in the n-type region by the electric field in the junction. In this way the required electron diffusion length is in the order of one micron so relatively inexpensive silicon starting material can be used. The less expensive silicon could bring down cell cost significantly and enable a low cost PV cell to be commercialized.
The researchers grew and characterized silicon nanorods of various doping concentrations including nanorods with radial junctions: precursor nanorod solar cells. They grew nanorods by chemical vapor deposition of silane, using both gold and indium as catalysts for the vapor liquid solid (VLS) process. The researchers were able to control doping level between degenerately doped and near intrinsic by varying the quantity of phosphine within the process gas. They grew nanorods with radial intrinsic p-type junctions, easily extensible to radial pn junctions. Thus the researchers demonstrated many of the components required for fabrication of radial pn junction nanorod solar cells with silicon.
Keywords: Solar energy, nanorod, nanowire, radial, pn junction, silicon, low cost solar
2.14.2 IntroductionCalifornia’s environment would improve if its electricity generation could be shifted from carbon based fuels to non-carbon renewable sources. In addition to an improved environment, the cost of electricity in the future would be less dependent on volatile natural gas market prices. In 2008 renewable energy sources accounted for 8.2 percent of the total electricity used, while 48 percent was produced by carbon based fueled generators (in state and imported).29 Of the renewable
29 http://www.energy/almanac.ca.gov/electricity_generation.html78

sources, solar is particularly well matched to California’s electrical demand which peaks in the afternoon on hot summer days. The barrier to wider use of such PV generation of electricity has been the high initial cost of the market dominant high quality crystalline silicon solar cells. These cells accounted for 85.8 percent of the 2008 PV market.30 Because of lower first cost, thin film solar cells are rapidly gaining market share. The goal of this project was to develop a method to reduce the cost of silicon based PV cells.
The dominant cost in a silicon PV cell is the high quality crystalline silicon wafer used to make the cells. Silicon accounts for 65 percent of the cell cost.31 The silicon material must be high quality to allow the photo excited carriers to diffuse through the cell without recombining. Using less silicon of lower quality would lower the cell cost significantly. Commercial silicon solar cell wafers are about 350 microns thick to be robust.32 , the cells only need to be 100-200 microns thick, but at that thickness breakage is high. Because the silicon wafers are sawn from high purity silicon boules, fabricators must start with approximately 600 microns of silicon to account for kerf losses. Even if the cells could be made thinner, the cost savings would not be proportional due to the kerf losses. A thinner silicon cell of less expensive material supported by a cheap substrate could offer many advantages. However, efforts to construct inexpensive crystalline silicon cells have been frustrated because, while the cells must be thick enough to absorb the incident radiation, they must be thin enough that the photo excited carriers which have short lifetimes and short diffusion lengths can diffuse the long absorption path lengths before collection. These competing features of long absorption length and short diffusion length have resulted in low solar conversion efficiency in less inexpensive silicon PV cells. This project developed a microstructure offering promise of a thin, low cost, high efficiency silicon PV cell.
A low cost high efficiency PV technology would bring important environmental benefits. The 48 percent of California generated electricity derived from carbon based fuels is comprised of 85 percent natural gas generation and 15 percent coal generation. On average each kWh of coal generated electricity produces about two pounds of CO2, while natural gas generation produces close to one pound of CO2.
33 Thus, for the total in-state source mix in California, including non-fossil sources, each kWh of electricity generated releases about 0.73 lb CO2 into the atmosphere. Total electricity consumption in California in 2008 was 307x109 kWh34, resulting in 112x106 tons of CO2.
35 In the domestic sector, each California electrical ratepayer
30 http://techon.nikkeibp.co.jp/english/NEWS_EN/20090914/175241/31 http://www.knovel.com/knovel2/Show_Text.jsp?SpaceID=0&VerticalID=0&SetID=5918642&BookID= 1081&NodeID=1885095878&Associated=false, page 25.32 http://www.sciencedirect.com/science?_ob=ArticleURL&_udi=B6V51-4FB941G-1&_user=4429&_coverDate=04percent2F01percent2F2005&_rdoc=1&_fmt=&_orig=search&_sort=d&view=c&_acct=C000059602&_version=1&_urlVersion=0&_userid=4429&md5=09af8b467d30c923814cc1fa8bdabef533 http://www.seen.org/pages/db/method.shtml 34 http://www.seen.org/pages/db/method.shtml 35 http://www.energy.ca.gov/electricity/us_per_ca PI ta_electricity_2005.html
79

on average consumes 7000 kWh per year,36 for an annual production of CO2 of 2.5 tons per ratepayer. Thus, to the individual ratepayer and to the state as a whole, there would be a significant benefit from a new PV technology which displaced fossil fuel powered generation with a low cost high efficiency PV cell.
The key advancement of science proposed by the researchers in this project was a novel microstructure which allowed for the active PV material to be supported by a substrate and to separate the two competing functions of light absorption and photo excited free carrier diffusion. Figure 18 shows a schematic of the microstructure. At the bottom is a thin low cost p-doped layer of (111) Si which serves as one contact. Using metal particle catalyzed vapor liquid solid (VLS), researchers s grew an array of 100 microns long nanorods of p-doped silicon on the base. The nanorods were in the order of one micron in radius. Diffusion doping or changing the composition of the gas mixture at the end of nanorod formation deposited a radial shell of n-type material. The thin n-type shell had thickness of 10-100 nm. In this way a radial p-n junction was formed on the nanorods. Electrical contact to the n-type regions was made by some unspecified means. Solar photons entered from the top and were absorbed along the 100 micron length of the rods. The photons excited pairs of electrons and holes, predominately in the thick p-type region. An excited electron only had to diffuse a distance of the rod radius before being captured in the n-type region by the electric field in the junction. In this way the required electron diffusion length was in the order of one micron, so relatively inexpensive silicon starting material could be used. Less expensive silicon could bring down cost significantly and enable commercialization of a low cost PV cell.
Figure 18: Schematic of Proposed Radial Pn Junction Nanorod Solar Cell
p-typen-type
Optically thick rods
R ≈ Ln
2.14.3 ObjectivesThe goal of this project was to determine the feasibility of fabricating silicon nanorods with radial pn junctions that could be used in a solar cell. The researchers established the following objectives:
36 http://www.energy.ca.gov/2007publications/CEC-200-2007-018/CEC-200-2007-018.PDF
80

1. Synthesize horizontally aligned silicon nanorods on a silicon on insulator (SOI) wafer. Confirm with scanning electron microscopy (SEM) they have a bridge structure with length of tens to hundreds of microns and width in the order of microns with contact pads.
2. Diffusion dope p-type rods to create n-type shells. Confirm with tunneling electron microscopy (TEM) the n-type shell is 10-100 nm thick.
3. Etch the device to reveal the p-type region under the n-type. Confirm with TEM the p-type region is exposed.
4. Make contact to the p- and n-type regions of the rod and perform I-V measurements both in the dark and under air mass 1.5 spectrum, 100 mW/cm2 illumination. Confirm with SEM they have contacted the device appropriately. Demonstrate diodic behavior in this novel geometry. Demonstrate high short circuit current density under AM1.5 illumination (Jsc>30 mA/cm2).
5. Synthesize vertically aligned silicon nanorods on crystalline silicon by VLS growth. Confirm with SEM they are nanorods with lengths of tens to hundreds of microns and radii in the order of microns.
6. Synthesize p-type doped nanorods on crystalline silicon by VLS growth. Confirm with SEM there are nanorods with lengths of tens to hundreds of microns and radii in the order of microns. Confirm doping of approximately 1018 cm-3 with dynamic secondary ion mass spectrometry (SIMS).
7. Diffusion dope p-type rods to create n-type shells. Confirm with TEM the n-type shell is 10-100 nm thick.
2.14.4 Outcomes 1. The researchers made a decision not to pursue this objective which they
called the "top-down" approach to nanorod synthesis. Instead they focused their efforts only on the growth of nanorods by the vapor liquid solid (VLS) technique as specified in Objectives 5-7. While focusing on VLS samples, they did prepare the same type of horizontal structure (but not on a SOI wafer) and address some of the measurement goals as specified for the bridge structures in their original proposal.
2. The researchers did not meet this objective because they did not perform the previous objective to synthesize horizontally aligned silicon nanorods on a SOI wafer.
3. This objective was not met for the same reason the researchers did not execute the first objective to synthesize horizontally aligned silicon nanorods on a SOI wafer.
4. The original objectives were to be carried out on horizontally aligned silicon nanorods on a SOI wafer. Instead the researchers explored making electrical contact to silicon nanorods by first growing multiple vertical rods on silicon wafers by the VLS method, removing individual rods, and placing them horizontally on oxide or nitride coated Si wafers. The researchers did create radial junctions, but they did not make contact to the internal core and external shell of the nanorod. They did not demonstrate diode behavior on pn junctions, and they did not demonstrate high short circuit current.
81

5. The researchers grew undoped nominally intrinsic silicon nanorods on crystalline silicon wafer substrates by the VLS technique with silane gas with two different techniques. In one technique the researchers deposited a small amount (equivalent to a layer of 1-50nm thickness) of metal catalyst (either indium or gold) by thermal evaporation directly on a silicon 111 wafer. In the other technique they applied a pattern of catalyst through a lithographically produced template on the wafer. After catalyst application they placed the wafer in a CVD chamber at elevated temperature with low partial pressure of silane (SiH4) gas. Silicon nanorods grew from the catalyst particles by the VLS mechanism. With indium catalysts the droplets appeared to become unstable even at 100 nm diameter. Thus the researchers achieved multiple rods per hole even at this small length scale. The researchers did demonstrate control over the positions of rod growth.
6. The researchers used diluted silane (5 percent in argon) mixed with small (5 ppm and 140 ppm, respectively) amounts of phosphine and tri methyl boron (TMB) to grow n- and p-type nanorods on crystalline silicon by VLS. They confirmed by SEM the nanorods had lengths of tens to hundreds of microns and radii from hundreds of nanometers to a few microns. There was no significant difference in the growth conditions needed or the morphology of nanorods with these different dopings. The researchers made four point I-V measurements to measure resistivity of a doped nanorod. In the Executive Summary (but not the body of the Report) the researchers stated they achieved electrically active dopant concentrations of up to 1017 cm-3 in p-type nanorods. They did not attempt SIMS analysis.
7. The researchers grew undoped intrinsic nanorods and then a p-type radial shell not by diffusion doping, but simply by changing from intrinsic to TMB doped silane during the VLS growth process. This does not produce a p-type rod with an n-type shell that was the objective. The researchers s were initially surprised that introducing dopant into the gas during growth created a radial, not an axial, junction. They reported this result has precedent, citing previous work stating “radial shell growth can be turned-on by the addition of diborane, which serves both to lower the decomposition temperature of silane and acts as a p-type dopant.” They were not successful in measuring shell thickness by TEM, but from SEM results they inferred a shell of approximately 100 nm thickness.
2.14.5 Conclusions1. The researchers made a decision not to pursue this objective. Therefore
there were no conclusions.
2. Researchers did not meet this objective because they did not pursue the previous objective to synthesize horizontally aligned silicon nanorods on a SOI wafer. Therefore there were no conclusions.
3. Researchers did not meet this objective for the same reason they did not carry out the previous objective to synthesize horizontally aligned silicon nanorods on a SOI wafer. Therefore there were no conclusions.
4. The original objectives were to be carried out on horizontally aligned silicon nanorods on SOI wafer. Instead the researchers explored making electrical contact to individual silicon nanorods grown by the VLS method, removing individual rods, and placing them on an oxide or nitride coated Si wafer. The
82

researchers made some I-V measurements using laser illumination. However they did not meet the goals of measurement, demonstration of diode behavior, and high short circuit current density under AMI 1.5 illumination. Therefore there were no conclusions.
5. This goal was substantially met.
6. The researchers demonstrated synthesis of p-type doped nanorods on crystalline silicon by VLS growth. They confirmed the existence of nanorods with lengths of tens to hundreds of microns and radii in the order of microns. They did not confirm doping ~1018 cm-3with dynamic secondary ion mass spectrometry (SIMS). This goal was only partially met.
7. The researchers did not demonstrate diffusion doping of p-type rods to create n-type shells. This goal was not met.
In summary, a main goal of this project was to establish the feasibility of fabricating silicon nanorods with radial pn junctions that could be used in a solar cell. This goal was met only in part. The researchers were unable to get as far as making quantitative comparisons between the performance of a silicon nanorod solar cell and their theoretical model. In hindsight this goal seems overly ambitious for the time and funds available. Nevertheless the researchers established many interesting and potentially useful results in silicon nanorod growth and doping. While they did not establish feasibility, they demonstrated necessary first steps to growing silicon nanorods on crystalline silicon wafers with radial pn junctions. There is promise in their approach, but important fundamental questions remain on the issues of efficiency, manufacturability, and reliability.
2.14.6 RecommendationsThe goal of this project was to determine the feasibility of silicon nanorods with radial pn junctions for application in solar cells. The researchers believed they demonstrated all the individual elements that would go into the fabrication of a full device. The Program Administrator recommends the researchers:
Establish the capability of growing doped nanorods on a conducting sub-strate.
Determine if a p-type nanorod can be grown on a p-type doped wafer sub-strate.
Develop a method to establish an electrical contact to the free end of the p-type nanorod for testing.
Determine if the minority carrier lifetime can be measured in the structure.
Establish the effects of metal catalyst impurities on carrier lifetime.
2.14.7 Benefits to CaliforniaPublic benefits derived from PIER research and development projects are assessed within the following context:
Reduced environmental impacts of the California electricity supply, trans-mission, or distribution system
Increased public safety of the California electricity system 83

Increased reliability of the California electricity system
Increased affordability of electricity in California
The primary benefit to the ratepayer from this research is reduced environmental impact of the California electricity supply or transmission or distribution system. A low cost high efficiency PV technology would bring important environmental benefits. Carbon based fuels generated 48 percent of California’s electricity in 2008. For the total mix of sources in California, including non-fossil sources, each kWh of electricity consumption releases about 0.73 pound CO2 into the atmosphere. In 2008 the total electricity consumption in California was 307x109 kWh, which produced 112x106 tons of CO2. In the domestic sector, each California electrical ratepayer on average consumes 7000 kWh per year for an annual production of CO2 of about 2.5 tons per ratepayer. Thus there would be a significant benefit from a new PV technology which displaced carbon fuel powered generation with a low cost high efficiency PV cell. Market penetration of a new technology often takes decades. The researchers did not prove feasibility in this project. Therefore no benefits are anticipated.
2.14.7.1 Overall Technology Transition AssessmentAs the basis for this assessment, the Program Administrator reviewed the researchers' overall development effort, which includes all activities related to a coordinated development effort, not just the work performed with EISG grant funds.
2.14.7.2 Marketing/Connection to the Market The researchers published part of their work: Kayes, B.M., N.S. Lewis, and H.A Atwater, Comparison of the Device Physics Principles of Planar and Radial p-n Junction Nanorod Solar Cells, J. Appl. Phys. 97(11), 11402 (2005).
2.14.7.3 Engineering/TechnicalThe researchers may continue technical work in this area.
2.14.7.4 Legal/Contractual The researchers filed a Provisional Patent Application but did not advance it to Patent Application status.
2.14.7.5 Environmental, Safety, Risk Assessments/ Quality Plans
These plans are premature for the current state of the project. Some of the materials used, silane gas and liquid chemicals, have well-known hazard potential. However their proper use is well established.
2.14.7.6 Production Readiness/Commercialization
The researchers reported commercialization discussions with BP Solar.
2.15 Performance Enhancement of Microturbines by Using Wave Rotor Technology
Awardee: Michigan State University
Principal Investigator: Norbert Müller84

2.15.1 AbstractMicroturbines (less than 350 kW) offer a potentially attractive alternative for distributed generation (DG), shaving peak loads and providing clean backup power for critical needs in a reliable manner and at low maintenance costs. However microturbines demonstrate lower efficiencies and have higher installed costs than diesel generators. Wave rotors have been successfully used for topping internal combustion engines, but the higher turbine inlet temperatures of gas turbines make wave rotors difficult to use in this application. NASA has a long history of working on wave rotor turbine technology. The goal of this project was to prove feasibility of the wave rotor using a bench size proof of concept test rig. A cold air test rig was enhanced with a combustion chamber to simulate microturbine operating conditions. The test rig showed the addition of the wave rotor can increase efficiency up to 34 percent while simultaneously lowering the cost from $1100 per kilowatt to $800 per kilowatt generated. In addition to demonstrating the wave rotor, this project successfully developed a new one dimension (1-D) algebraic algorithm for modeling of the wave processes in a wave rotor. This algorithm could be an important development tool as it allows the computation of porting geometry and boundary conditions in a fraction of the time a computational fluid dynamics simulation takes and is nearly as accurate. NASA developed a 1-D computational fluid dynamics simulation code about 10 years ago.
Keywords: Gas turbine, wave rotor, algebraic code, computational fluid dynamics (CFD), generation, test rig, compression, pressure gain, pressure exchange
2.15.2 IntroductionThe California energy problems addressed in this project are the low efficiencies and high costs of microturbines when used as distributed power generators. In contrast, Diesel cycle engines have high efficiency and low installed costs, albeit with relatively high exhaust emission levels. Using the proposed wave rotor in a microturbine could increase the thermal efficiencies and power output by up to 34 percent, considerably reducing cost per kilowatt.
Wave rotor topped microturbines could potentially be a less costly and more efficient method of backup, peak shaving, or distributed power generation, thus benefiting the citizens of California through lower costs, cleaner air, and stabilized power supply. Applying the wave rotor enhancement to a possible 826 megawatts of microturbines that could be installed in California within the next 20 years could reduce emissions by more than 130,000 tons of CO2 and 135 tons of NOx per year.37
The advancement of technology proposed in this project was the wave rotor, a turbomachinery component that accomplishes the compression and expansion processes within a single component. Figure 19 is an illustration of a wave rotor. It is self cooling and aerodynamically compatible with the low corrected flow rates supplied by the compressors of modern, high pressure ratio turboshaft engines. A wave rotor can be embedded concentrically between the high pressure compressor and high pressure turbine to increase the overall pressure ratio of the gas turbine engine by a factor of three and increase the peak temperature by 25 percent
37 ORNL: “Advanced Microturbine System: Market Assessment”. http://www.eere.energy.gov/de/pdfs/microturbine_market_assess.pdf
85

without increasing the temperatures of the rotating machinery components. These thermodynamic increases enhance gas turbine engine power and efficiency significantly. For example, the wave rotor could increase the specific power of the Rolls-Royce Allison model 250 helicopter engine by 18 percent while reducing specific fuel consumption by 15 percent.38 As demonstrated in this project, wave rotor technology uses shock waves induced by hot exhaust gases colliding with fresh air to compress the fresh air for combustion. Data from the test rig showed the addition of the wave rotor can increase efficiency up to 34 percent while simultaneously lowering the cost per kilowatt generated from $1100 per kilowatt to $800 per kilowatt.
Figure 19: Schematic of a Recuperated Gas Turbine Topped by a Four Port Wave Rotor
2.15.3 ObjectivesThe goal of this project was to prove the feasibility of a wave rotor in a microturbine to increase the thermal efficiency while simultaneously lowering the cost per kilowatt. The wave rotor uses shock waves induced by hot exhaust gases colliding with fresh air to compress that fresh air for combustion. The researchers established the following project objectives:
1. Modify a cold air test rig to allow combustion and incorporate the wave ro-tor. Modifications include the addition of a combustion chamber, a fuel deliv-ery system, and exhaust piping. Modify the equipment to withstand tempera-tures of up to 12000K.
2. Perform computer simulations to develop an optimal design of the wave ro-tor. Perform the following simulations:
Vary the rotational speed of the rotor from 5000 rpm to 10000 rpm.
38 http://www.grc.nasa.gov/WWW/RT/RT1999/5000/5810welch.html86

Vary the mass flow rate from 0.2 kilograms per second to 0.35 kilograms per second.
Vary the inlet temperature of fresh air from 3000K to 4500K.
Vary the inlet pressure of fresh air from 2.5 atmospheres to 3.8 atmospheres.
Vary the porting configuration.
3. Fabricate the test rig including the wave rotor. Use the best configuration based on the computer simulation.
4. Operate the wave rotor test rig with a goal of enhancing pressure ratio by at least 1.2.
5. Continue the testing of the wave rotor, using the following guidelines:
Measure inlet and outlet pressures to obtain the pressure gain in the channel of the wave rotor.
Obtain a pressure ratio boost of at least 1.4.
Demonstrate the feasibility of the sealing approach, meaning no wear or damage to the rotor or endplates.
Measure the temperatures of the wave rotor ports and housing.
6. Propose methods of implementation of the wave rotor to a selected microtur-bine.
7. Demonstrate that the capital cost can be $800 per kW and that a one per-cent efficiency increase for a recuperated microturbine is possible by vary-ing wave rotor pressure ratio and/or wave rotor efficiency.
2.15.4 Outcomes 1. The researchers enhanced the cold air test rig by adding a fuel delivery system,
a combustion chamber, and an exhaust system. They modified all other relevant parts to withstand the increased temperatures of combustion. The researchers determined operational points for the wave rotor in terms of rotational speed, pressure and temperature, fuel flow rate, port locations, and width based on the 1-D algebraic algorithm, GT-POWER , and the 2-D CFD code FLUENT.
2. The researchers used simulations with the new algebraic algorithm to explore a test matrix in the following ranges:
5000 rpm to 10000 rpm wave rotor speed
0.2kg/s to 0.35kg/s air mass flow rate
300K to 450K inlet temperature
0.9 atm to 3.8 atm inlet pressure
The simulation also calculated the respective porting configuration in terms of opening angle and time.
3. The researchers successfully added the wave rotor to the modified cold air test rig
87

4. In the first demonstration the researchers met the goal of a pressure ratio boost of 1.2.
5. In the subsequent tests the researchers measured the inlet and outlet pressures of air and exhaust. The intended benchmark pressure ratio boost of 1.8 was obtained. The sealing approach proved feasible showing no wear or damage to the rotor and endplate. The pressure ratio objective was met. The researchers measured the temperature for all ports of the wave rotor and also for selected points on of the housing and ducting. The researchers found no damaging temperatures.
6. The researchers successfully demonstrated wave rotor operation.
7. The researchers estimated the cost of adding a wave rotor to a C30 microtur-bine at $3,000. With this and the performance data, the simple cycle C30 with wave rotor would cost $28,000 and would produce 40 kW. The recuperated C30 with wave rotor would cost $ 33,000 and would produce 41 kW. The efficiency of the simple cycle C30 increases from 15 percent to 20 percent with the additional of the wave rotor. The efficiency of the recuperated C30 increases from 25 per-cent to 26.5 percent. The simple cycle C30 cost drops from $830 per kW to $700 per kW and the recuperated one from $1100 per kW to $800 per kW.
2.15.5 Conclusions1. The design and implementation of the test rig additions allowed for
successful testing of the wave rotor.
2. The test rig can continue to be used as a test bed for other types of wave rotors, turbochargers, micro gas turbines, or a wave disc engine.
3. The algorithm created was successfully implemented and shown to be accurate enough to predict proper qualitative behavior of the designed wave rotor.
4. The wave rotor operated as projected. This goal was met.
5. Testing of the wave rotor showed a promising pressure ratio boost of 1.8 and no seal wear.
6. The researchers met their cost estimate objective.
Although the feasibility of the concept was proven in this project, the wave rotor technology needs much more development before becoming a commercial reality. The main technical issue with recuperated microturbines is the small gain in efficiency, only one to two percent. The output of a recuperated microturbine with a wave rotor could be about 34 percent higher than the rated power of the microturbine before modifications. Higher gains in efficiency are possible with the non-recuperated microturbines, about 33 percent.
2.15.6 RecommendationsFuture work on the wave rotor test rig should include the addition of oxygen sensors to quantify the exhaust gas recirculation. Also, the torque on the wave rotor should be measured to determine whether the wave rotor is extracting energy from the exhaust to drive itself or if the motor is driving it. New endplates with optimized geometry that enable two cycles per revolution are recommended to reduce rotational speed and better distribute thermal loading. Then the wave rotor should be operated in conjunction with a gas turbine, first in open loop and
88

then in closed loop configuration. The one dimensional algebraic algorithm developed in this project should be compared to the NASA one dimensional code.
After taking into consideration (a) research findings in the grant project, (b) overall development status, and (c) relevance of the technology to California and the PIER program, the Program Administrator has determined that the proposed technology should be considered for subsequent funding within the PIER program.
Receiving subsequent funding ultimately depends upon (a) availability of funds, (b) submission of a proposal in response to an invitation or solicitation, and (c) successful evaluation of the proposal.
2.15.7 Benefits to CaliforniaPublic benefits derived from PIER research and development projects are assessed within the following context:
Reduced environmental impacts of the California electricity supply, trans-mission, or distribution system
Increased public safety of the California electricity system
Increased reliability of the California electricity system
Increased affordability of electricity in California
The primary benefit to the ratepayer from this research is the reduced environmental impacts of the California electricity supply system. This would be achieved by the wider application of microturbines in the electricity supply in California. The proposed innovation could increase the efficiency of microturbines, lower the installed cost per kW, and reduce emissions. The U.S Department of Energy (DOE) estimated a total of 826 MW of microturbines, both retrofit and new instllations, may be installed in the next 20 years. The DOE estimated that a typical microturbine produces 1.2 lb CO2 per kWh and 0.0012 lb NOx per kWh. Assuming an operating time of 2000 hours per unit per year and a relative efficiency increase of 15 percent, the air emission reduction in California could be as high as 134,952 tons of CO2 and 135 tons of NOx per year.
2.15.8 Overall Technology Transition Assessment2.15.8.1 Marketing/Connection to the Market NASA continues to have interest in the wave rotor turbine. Participants in the NASA program have included the Army Research Laboratory, Allison Gas Turbine Company (a subsidiary of Rolls-Royce), Coleman Engine Company, Unistry Inc., the University of Washington, the University of Florida, and the National Research Council.
The researchers in this project have several publications in the field of wave rotor turbines. The researchers also reported a possible relationship with Williams International, a manufacturer of small gas turbine engines.
2.15.8.2 Engineering/TechnicalThis technology needs much more development before becoming a commercial reality. In June 2008 AVweb39 reported that Purdue University was starting the testing stage of a wave rotor combustion turbine. Associate Professor Razi Nalim
39 http://avweb.com/avwebflash/news/NewTurbineCleanerMoreEfficient_198158-1.html89

was leading that project. That professor expected the engine to be operational by the end of 2008.
2.15.8.3 Legal/Contractual The researchers applied for one patent based on the work in this project.
2.15.8.4 Environmental, Safety, Risk Assessments/ Quality Plans When this project was completed it was too early in the development cycle to develop these plans.
2.15.8.5 Production Readiness/Commercialization
The researchers have talked to turbine manufacturing companies about commercialization.
2.16 An Improved Wind Turbine Blade Design with Advanced Composite Materials and Processes
Awardee: WebCore Technologies, Inc.
.Principal Investigator: Frederick Stoll
2.16.1 AbstractCalifornia energy policy mandates greater use of renewable energy sources. Wind energy is the lowest cost renewable energy. To provide more electricity from California's wind resources, developers must tap into sites with lower average wind speeds. For this to occur, turbine rotor diameters must be larger without a substantial increase in weight and cost.
The goal of this project was to apply an innovative sandwich core construction to the design and processing of large wind turbine blades to achieve cost and weight reductions. The sandwich core construction begins with a dry foam and fiber core preform manufactured from low cost raw materials with high speed processes. The core preform is used in the layup of composite sandwich laminates that are molded using vacuum infusion processes. The result is a core that features composite webs extending through the thickness of the core and attaching to the two face laminates. The researchers worked in the areas of core property characterization and design optimization, studied core processability for blade component manufacture and layup and molding of a 1 MW scale research blade design, and did development work in support of the use of the core in the shear webs of a new 2+ MW scale blade design which was scheduled to begin production in 2007.
Keywords: Wind turbine blades, web core, core material, sandwich construction, vacuum infusion.
2.16.2 Introduction California energy policy mandates greater use of renewable energy sources. Wind energy is the lowest cost renewable energy. To provide more electricity from
90

California's wind resources, developers must tap into sites with lower average wind speeds. For this to occur, turbine rotor diameters must be larger without a substantial increase in weight and cost.
The researchers in this project proposed a new wind turbine blade design that used a new core material (fiber reinforced core). They also introduced new manufacturing techniques that allowed the construction of a longer wind blade with sufficient strength to operate in lower wind speed areas.
The researchers speculated that the new type of wind turbine blade could save 5 percent of the cost of the overall wind turbine. A savings of this magnitude would result in significant reduction in the cost of wind generated electricity for California consumers.
The proposed innovation was the use of unique fiber architecture of the fiber reinforced core products in conjunction with a new infusion process that enabled the manufacture of longer, higher efficiency, less expensive wind turbine blades for lower wind sites. Figure 20 shows a cross section of a typical wind turbine blade constructed from the fiber reinforced material.
Figure 20: Characteristic Fiberglass Blade Cross Section Showing Sandwich Laminate Hollow Section Construction
2.16.3 ObjectivesThe goal of this project was to prove the feasibility of manufacturing wind turbine blades using a new fiber-reinforced core (FRC) architecture and manufacturing process. The new materials could allow longer blade lengths for the same weight and turbine loads. In addition, the blades should be less expensive and more adaptable to low wind sites. The researchers established the following project objectives:
1. Define requirements for the integration of FRC material into wind turbine blades. Demonstrate through modeling and simulation that TYCOR® enables improved blade performance (stiffness, strength, weight, cost, durability).
2. Design a test plan to characterize the effects of FRC on the integrity of the adjoining sandwich face laminate in a tension-fatigue loading situation. Fab-ricate test panels and subcomponents. Make flat and curved panels for phys-ical and mechanical testing.
3. Explore the knitting and mold processing aspects of FRC and measure key physical and mechanical properties. Evaluate weight stiffness strength and
91

durability (fatigue, impact) characteristics of TYCOR® over baseline materi-als and design.
4. Develop a weight model and perform weight studies. Demonstrate signifi-cant blade weight reduction.
5. Develop a cost model and perform cost studies. Demonstrate significant blade cost reduction.
2.16.4 Outcomes1. The researchers defined specific requirements: a) incorporate FRC in experi-
mental 1 MW scale blades that partner TPI Composites, Inc. (TPI) was plan-ning to construct, and b) have FRC specified as the core in the shear web of a new 2+ MW scale blade design. No modeling results were reported.
2. The researchers developed a test plan and fabricated test panels.
3. The team determined it was necessary to use a core construction for wind turbine blades that provided significant transverse shear stiffness in both in-plane directions, a need that cannot be met by the unidirectional FRC that was originally planned for use. To meet this need while maintaining low core density, the researchers applied a newly developed FRC product. The prod-uct was named GX, and it retained the relative economy of single pass wound FRC while adding a second web structure to provide transverse shear properties in a second direction. The GX style core displayed a higher T-Z transverse shear stiffness than the unidirectional FRC, e.g., 8,000 psi compared to 400 psi. A heavier weight version of FRC called G18 had a higher static strength, 489 psi vs. ~200 psi. This version lost less strength with fatigue than G6. At 1,000,000 cycles, G18 retained about 51 percent of static strength, whereas G6 retained about 44 percent of static strength.
4. For 1 MW blade sizes, the core knitting and infusion processing of FRC re-sulted in 29 percent weight reduction in the shear web compared with balsa wood construction. For 2+ MW blade sizes, the researchers incorporated FRC into the shear web. They tested FRC materials in three different forms: G6, G18, and GX. GX had higher strengths and more balanced properties for transfer shear stiffness in two directions. GX was also acceptable for static stress and elastic buckling.
5. The researchers abandoned this goal because of a lack of interest by TPI.
2.16.5 ConclusionsThe researchers proved feasibility of FRC materials as a core material in wind turbine blades. The substitution of traditional balsa wood core with fiber reinforced core can provide cost savings, weight savings, and more consistent material properties. Although additional testing is necessary to fully characterize and understand the mechanical behavior of the core, the testing performed in this project demonstrated the potential of the core in large wind turbine applications. Because of the potential shown by the results of this project, the researchers reported that a blade manufacturer has shown interest in using the core in the shear webs for a new blade design for 2+ MW applications.
2.16.6 RecommendationsThe Program Administrator recommends additional testing:
92

1. Measure effective core static strength and elastic properties for all major load components.
2. Thoroughly characterize FRC constituent properties (e.g. the foam and the laminated webs) for finite element modeling of the detailed core struc-ture.
3. Generate edgewise compression test data of sandwich laminates, includ-ing fatigue.
4. Perform long beam bending fatigue measurements to characterize the in-teraction of the core with the sandwich skins.
5. Establish design relationships that express core properties and core struc-tural behavior as a function of the core design variables.
6. Explore the effect of various core/facing interface layers (e.g. chopped strand mat) to optimize fatigue performance.
For certification of FRC in large blade manufacture, Webcore must work with Germanischer Lloyd (GL), International Electrotechnical Commission (IEC), and other certification agencies.
After taking into consideration (a) research findings in the grant project, (b) overall development status, and (c) relevance of the technology to California and the PIER program, the Program Administrator has determined that the proposed technology should be considered for subsequent funding within the PIER program.
Receiving subsequent funding ultimately depends upon (a) availability of funds, (b) submission of a proposal in response to an invitation or solicitation, and (c) successful evaluation of the proposal.
2.16.7 Benefits to CaliforniaPublic benefits derived from PIER research and development projects are assessed within the following context:
Reduced environmental impacts of the California electricity supply, trans-mission, or distribution system
Increased public safety of the California electricity system
Increased reliability of the California electricity system
Increased affordability of electricity in California
The primary benefit to the ratepayer from this research is the increased affordability of electricity in California.
Blade production constitutes a major cost component of large wind turbine power systems. Therefore cost reductions to blade materials and manufacturing technology directly contribute toward reducing the expense of wind power systems. Furthermore, the weight of blades has a secondary impact on the design of generators, towers, etc., so technologies that reduce blade weight will reduce the cost of the associated mechanical components. Additionally, the availability of
93

lower weight materials technology is an enabler for the design and manufacture of larger blades, which allows the use of more common lower wind sites, thereby expanding the potential generation capacity of wind energy in a given geographic region. The researchers estimated that the new materials technology could provide a 5 percent cost saving for a wind turbine, thus providing over $40 million in savings to the residents of California in the next five years.
2.16.8 Overall Technology Transition AssessmentAs the basis for this assessment, the Program Administrator reviewed the researchers’ overall development effort, which includes all activities related to a coordinated development effort, not just the work performed with EISG grant funds.
2.16.8.1 Marketing/Connection to the Market The researchers stated that there were discussions with several multinational companies interested in commercializing their technology and products.
2.16.8.2 Engineering/TechnicalThe researchers reported that Objective 1 was accomplished by July 2008. In early 2010 WebCore was engaged with GL to obtain Type Approval of the new TYCOR W family of core designs for wind turbine blade manufacturing. The researchers indicated that continuing the development of the materials and manufacturing processes for wind turbine blades was high priority for their company and would continue.
2.16.8.3 Legal/Contractual In 2007 Ohio Department of Development awarded about $3 million to a consortium led by Owens Corning and WebCore to commercialize advanced composite materials in the wind energy market over the next three years as part of a Research Commercialization Program (RCP). Also in 2007, U.S. Dept of Energy (DOE) awarded a Phase I SBIR grant for $100,000. The researchers applied for 12 patents and received 4 patents.
2.16.8.4 Environmental, Safety, Risk Assessments/ Quality Plans There is no evidence that the researchers had begun these very important assessments and plans. Qualification of production blades requires specialized testing and engineering validation to be submitted by the customer to a certification organization (Germanischer Lloyd).
2.16.8.5 Production Readiness/Commercialization By 2010 WebCore had successfully transitioned its product into blades manufactured by TPI sister company VienTek for sales to the North American market including California. The researchers stated they had developed a commercialization plan. For international markets the researchers plan to establish licensing or joint ventures with multinational companies to manufacture and sell their products.
2.17 Concentrating Triple Junction PV Systems for Distributed Power Generation
Awardee: University of California, Merced94

Principal Investigator: Roland Winston
2.17.1 AbstractThis goal of this project was to prove feasibility of a novel concentrating photovoltaic system. The approach incorporated a small commercial 37 percent efficient triple junction solar cell into a 300 mm diameter concentrator power unit in a compact design. This was accomplished by an ultra-compact dual mirror Cassegrain design with a tapered glass rod receiver to which the solar cell was mounted. The solar cell was located behind and outside the concentrator and was passively cooled with a heat sink. The concentrator delivered a flux of 500 suns to the solar cell. Each power unit achieves the fundamental compactness limit of the depth to diameter ratio of one to four (1:4). Sixteen of the power units, each designed for output power of 15.625 W, were assembled into 250 Wp (peak watt) modules. Nine modules were combined into a prototype system intended for two kilowatt electrical output at one kW/m2 insolation. Under test the prototype produced an electric output of 2.06 kW with 763 W/m2 direct normal insolation and solar tracking. The system had an optical efficiency of 77 percent, and solar to electric output efficiency of 17 percent. The flux distribution on the solar cell was uniform. The off track tolerance of the system was plus or minus one degree. The modular system design accommodates larger optical tolerances and is amenable to low cost, high volume fabrication in a variety of sizes. Fabrication of the first prototype was completed by SolFocus, a California based company.
In a November 2008 press release SolFocus announced a new product that appears to incorporate the concentrating photovoltaic system developed in this project. In addition, SolFocus announced the first customer for the new system. Following commercialization, distributed generation applications in a wide range of loads will be served.
Keywords: Renewable energy, concentrator, PV systems, multi-junction solar cells, distributed energy systems, distributed energy resources
2.17.2 IntroductionDistributed energy resources (DER) offer many advantages to both consumers and utilities.40 For utilities, the installation of DER, also called distributed generation, near or at the end user’s site can be a benefit to the grid by avoiding distribution system upgrades and reducing the need for new central power stations. For the consumer, benefits include a backup electricity source to ensure power availability during grid outages, potentially higher power quality, and increased energy efficiency. Additionally by using on site generation the consumer can avoid purchasing grid electricity during expensive peak rate times. While DER has been available for decades in the three kilowatts to ten megawatts range, it has been primarily comprised of low capital cost natural gas and liquid fueled internal combustion engines and turbine driven generators. Early versions of those engines had relatively high levels of air pollutants (CO2, NOx, SO2, particulates, etc.) and often high operating fuel costs. For these reasons, attention has been directed at distributed renewable energy sources, particularly solar photovoltaics (PV). PV power has the advantage of being coincident with summer afternoon peak demand in California. What has slowed adoption has been the high initial capital cost of PV
40 http://www.energy.ca.gov/distgen/background/background.html95

systems at approximately eight dollars per peak watt ($8/Wp) compared to about one dollar per peak watt for conventional DER systems. At present the dominant technology in PV systems is crystalline silicon modules with about 15 percent efficiency accounting for 93 percent of the PV market.41 In those PV systems the module costs represents around 50 to 60 percent of the total installed cost of a system.42 Accordingly there is great interest in finding a new low cost PV technology to reduce the initial cost of modules. The development of a new low cost technology could bring about a significant increase in penetration of PV into the DER market.
On average natural gas powered electrical generators in the Pacific contiguous di-vision of the U.S. produce CO2 at the rate of 1.238 pounds per kWh (1999).43 For comparison, a one megawatt PV system operating with a capacity factor of 15 per-cent would produce 1.315X10⁶ MWh/year with no CO2 emissions compared to a natural gas powered generator which would produce 1.628 million pounds of CO2 for the same electrical output. Thus one megawatt PV system would avoid 800 tons of CO2 production per year. Another benefit to PV generation is that its fuel is re-newable, providing it freedom from future rising fossil fuel prices. For example in 2008 the U.S. average wellhead price of natural gas was 63 percent higher in the middle of the year than at the end of the year.44,45 Such large rapid fluctuations in fuel price make planning for PV generator pricing much more stable than the natu-ral gas (or liquid) fueled generators.
The advancement of science in this project was to lower the cost of PV modules with a novel type of non-imaging solar concentrator coupled to a very high efficiency triple junction PV cell. The approach is shown in Figures 21 and 22. A PV panel is composed of individual power units shown in the upper left hand corner of Figure 21. The 15.625 W power units are hexagonal in shape allowing for hexagonal packing as shown. The power units are packaged into modules containing groups of 16 with a total power output of 250 W. The optical design of the power unit is a Cassegrain layout in which the large primary mirror focuses solar radiation onto a sub-reflector which reflects it into a tapered glass rod. The PV cell is sandwiched between the glass rod and a large passive heat radiator (not shown). The overall concentration ratio is 500 to 1. The tapered glass rod adds a small additional amount of concentration ratio and provides an important kaleidoscopic function to smooth the solar intensity across the face of the cell. The glass rod allows the cell and heat radiator to be positioned outside the concentrator allowing for passive thermal cooling by the ambient (Figure 22). The commercial cell chosen has an area of one cm2 and an efficiency of 37 percent, about three times that of a commercial silicon PV cell. Although the cell is expensive, the combination of a high concentration ratio and three times greater efficiency reduces the cost per electrical output by a factor of 1500. This cost advantage is reduced by the cost of the concentrator which is designed to be inexpensive. In addition the approach requires a tracking system to keep the solar radiation on the cell. The design is pointing error tolerant. Although the tracking 41 http://www.solarbuzz.com/Technologies.htm42 http://www.solarbuzz.com/ModulePrices.htm43 http://www.eia.doe.gov/cneaf/electricity/page/co2_report/co2report.html#electric44 http://www.eia.doe.gov/steo45 http://www.eia.doe.gov/emeu/steo/pub/5ctab.pdf
96

mechanism adds cost to the system it does have the benefit of producing more energy over a longer period of the day than a fixed non-tracking panel. When compared to a standard design panel, the proposed approach replaces more costly PV cell material with low cost concentrator components.
Figure 21: Schematic of Modular Concept
97

Figure 22: Optical Design
2.17.3 ObjectivesThe goal of this project was to determine the feasibility of high efficiency triple junction solar cells under non-imaging concentration for distributed power generation. The researchers established the following project objectives:
1. Refine and finalize the optical and thermal design to have an off track toler-ance of approximately one degree, be compact, have a uniform cell radiance (up to 10 percent) and a cell temperature less than 40ºC (72ºF) above ambi-ent.
2. Fabricate one to three two kWp prototypes. Demonstrate that each prototype has a capacity of two kilowatt under an insolation of one kW/m2.
3. Measure the PV system’s performance (electric power out) relative to the so-lar energy collected.
4. Monitor the solar insolation and the PV system’s performance in different parts of the solar spectrum.
5. Formulate a test plan that incorporates realistic field conditions and is credi-ble to the PV industry.
6. Monitor the direct solar insolation with at least 10 percent accuracy.
7. Set up a tracking system including control strategies so that the tracking in-accuracy will not degrade the optimal performance by more than five per-cent.
8. Measure the current-voltage curve of the PV array.
9. Verify that the cell temperature is not more than 40ºC (72ºF) above ambient.
10.Measure the multi-spectral response and efficiency of the solar cell.
11.Evaluate stability, robustness, and maintenance requirements of PV system and demonstrate that system performance will not deteriorate by more than 25 percent over 20 years of operation.
12.Demonstrate system cost of one dollar per peak watt and electricity genera-tion cost of $0.10/kWh at an installed capacity of 100 MWp assuming a 10 year lifetime.
98

2.17.4 Outcomes 1. The researchers measured the acceptance angle of an individual power unit
at plus or minus 1.5 degree and of a panel (module) within plus or minus 1.2 degree. By ray tracing analysis, the researchers estimated the variation of the intensity of solar flux over the cell surface at 40 percent. The re-searchers measured the cell temperature under normal insolation of 850 W/m2 at 60oC above ambient.
2. The researchers fabricated one prototype module and measured its output at 2.06 kW at direct normal insolation of 763 W/m2.
3. The researchers measured the power efficiency of the prototype module at 17.06 percent. They defined efficiency as electrical power produced divided by the solar power received.
4. The researchers measured direct and diffuse solar radiation using a tracking normal incidence pyrometer and Eppley precision pyranometer. The re-searchers decided that the spectral decomposition of system performance measurements was not critical and did not take those data.
5. The researchers formulated a test plan that incorporated realistic field con-ditions and was credible to the PV industry.
6. The researchers measured direct solar insolation with at least 10 percent accuracy using a high precision normal incidence pyrheliometer.
7. The researchers investigated several tracking systems in open and closed loop mode. They found tracking accuracy was adequate in closed loop mode. The tracking accuracy of the Wattsun AZ125 dual axis tracker was about 0.25 degrees in each axis, which easily accommodated the angular tolerance of the concentrator system.
8. The researchers measured the current-voltage curve of the PV array at 763 W/m2 insolation. Peak array power was 2.06 k W/m2.
9. The researchers instrumented one power unit with thermocouples and per-formed temperature measurements both on sun and off sun pointing. They also placed a temperature sensor device next to every cell in the system. The cell temperature reached 60ºC (108ºF) above ambient in worst cases.
10. The researchers did not measure the multi-spectral response and efficiency of the solar cell. See Outcome 4 above.
11. This important task was not carried out. An industrial collaborator (SolFo-cus) planned to perform a Highly Accelerated Life Testing (HALT) program on important system components.
12. The researchers concluded that the installed capacity of the experimental system was too low to extrapolate reasonably the system cost at a 100 MWp level.
2.17.5 Conclusions1. The measured acceptance angles of a power unit and of a panel were suffi-
cient to meet this part of the objective. However the inferred distribution of solar flux over the cell surface varied by 40 percent, more than the goal of 10 percent. Thus the uniformity goal of the objective was not met. The cell
99

temperature under normal insolation of 850 W/m2 was measured to be 60oC above ambient, not meeting the goal of a 40oC rise. Thus the temperature rise part of the objective was not met.
2. One prototype module displayed an output of 2.06 kW at direct normal inso-lation of 763 W/m2, meeting this objective.
3. This objective was met.
4. This objective was not attempted.
5. This objective was met.
6. This objective was met.
7. The researchers proved a successful tracking system and control procedure.
8. This objective was met.
9. The temperature goal of this objective was not met.
10. This objective was not attempted.
11. This important objective was not attempted.
12. This objective was not attempted.
The main goal of this project was to determine the feasibility of high efficiency triple junction solar cells under non-imaging concentration for distributed power generation. The results obtained did establish feasibility of the approach. The research project was a success. The objectives that were either not met or not attempted are not viewed as show stoppers at this stage of development. The commercial partner announced (January 2009) $47.5M in venture capital for commercialization of the project concept. This indicates that the project is being advanced aggressively and with the sense of urgency that is required to enter the marketplace in a timely manner.
2.17.6 RecommendationsBased on the results reported, investigating open loop operation is likely to be a waste of time and attention should be focused on closed loop control. The Program Administrator recommends that the issue of accelerated life testing be pursued aggressively. The temperature rise of the cell is as much as 60oC. This rise could shorten lifespan when operating over a timescale of years and calls for substantial changes in thermal management. This issue should be resolved sooner rather than later in product development.
After taking into consideration (a) research findings in the grant project, (b) overall development status, and (c) relevance of the technology to California and the PIER program, the Program Administrator has determined that the proposed technology should be considered for subsequent funding within the PIER program.
Receiving subsequent funding ultimately depends upon (a) availability of funds, (b) submission of a proposal in response to an invitation or solicitation, and (c) successful evaluation of the proposal.
100

2.17.7 Benefits to CaliforniaPublic benefits derived from PIER research and development projects are assessed within the following context:
Reduced environmental impacts of the California electricity supply, trans-mission, or distribution system
Increased public safety of the California electricity system
Increased reliability of the California electricity system
Increased affordability of electricity in California
The primary benefit to the ratepayer from this research is in reduced environmental impacts of the California electricity supply or transmission or distribution system. GHG emissions in electrical generation are a serious concern today. On average, natural gas powered electrical generators in the Pacific contiguous division of the U.S. produce CO2 at the rate of 1.238 pounds per kWh (1999)46. For comparison a 1 MW PV system operating with a capacity factor of 15 percent would produce 1.315X10⁶ MWh/year with no GHG CO2 emissions compared to a natural gas powered generator which would produce 1.628 million pounds of CO2 for the same electrical output. Thus a 1 MW PV system could displace 800 tons of CO2 production in one year.
Another potential benefit for the ratepayer is the increased affordability of electricity in California. Because PV generation is a renewable, it provides freedom from future rising fossil fuel prices. For example in 2008 the U.S. average wellhead price of natural gas was 63 percent higher in the middle of the year than at the end of the year.4748 Such large rapid fluctuations in fuel price make planning for the PV generator pricing much more stable than the natural gas (or liquid) fueled generator and potentially more affordable in the future.
2.17.8 Overall Technology Transition AssessmentAs the basis for this assessment, the Program Administrator reviewed the researchers’ overall development effort, which includes all activities related to a coordinated development effort, not just the work performed with EISG grant funds.
2.17.8.1 Marketing/Connection to the MarketThe commercial partner, SolFocus, is actively marketing the solar energy system proven in this project. SolFocus announced plans to deploy 100 MW of solar energy based on the project concept by the end of 2010. It signed a deal to supply 1.6 MW to Greece by the end of 2009. In November 2008 SolFocus announced a $103 million contract to install 10 MW by the end of 2010. The commercial partner raised $47.5 M in venture capital for commercialization of the concentrating photo voltaic concept developed in this project. This funding was announced in January 2009. These funds are in addition to other venture capital funds that SolFocus has received.
46 http://www.eia.doe.gov/cneaf/electricity/page/co2_report/co2report.html#electric47 http://www.eia.doe.gov/steo48 http://www.eia.doe.gov/emeu/steo/pub/5ctab.pdf
101

2.17.8.2 Engineering/TechnicalAdditional engineering development is likely to take place at SolFocus with private funding. Thus no details on additional engineering work are available.
2.17.8.3 Legal/Contractual The grantee filed one patent application.
2.17.8.4 Environmental, Safety, Risk Assessments/ Quality Plans The researchers' commercial partner appears to be well prepared with reliability and manufacturability analyses. SolFocus will have to evaluate the environmental, risk, and quality issues as it takes this technology into the market. The researchers have formulated a test plan.
2.17.8.5 Production Readiness/Commercialization
SolFocus has announced sales of the technology developed in this project. Press releases by that company imply that it has developed manufacturing capabilities.
2.18 Feasibility Study for Ceramic Proton Conductor Based Reversible Solid Oxide Fuel Cells
Awardee: University of California, Irvine
Principal Investigator: Jacob Brouwer
2.18.1 AbstractA reversible solid oxide fuel cell (SOFC) is an energy conversion/storage device that could complement the development of a hydrogen economy based on renewable energy sources. The reversible SOFC offers dual mode operation capable of distributed electrical power generation in the fuel cell mode and hydrogen production by steam electrolysis in the reverse mode. The SOFC technology used in this project employs a ceramic proton conducting electrolyte. This may solve many challenging issues caused by other oxide-ion conductors. The goal of this project was to determine the feasibility of using ceramic proton conducting electrolytes together with compatible electrodes to develop reversible solid oxide fuel cells for low cost, highly efficient power generation and hydrogen production from renewable energy sources.
In this work the researchers investigated a ceramic proton conductor based reversible SOFC material: Ni-BZY/BZY/SSC-BZY. The researchers tested this material for manufacturability and electrochemical performance. They found this material feasible for reversible SOFCs from the standpoint of manufacturability. The results also suggested that the power density in the fuel cell mode and the current density in the electrolyzer mode may not satisfy technical targets for feasibility of a well performing reversible SOFC.
Keywords: Ceramic proton conductor, doped barium zirconate, reversible fuel cell, energy storage
102

2.18.2 IntroductionAdvanced solid oxide fuel cell technologies are an environmentally preferred generation option offering fuel use efficiency up to 60 percent and extremely low emissions. Fuel cells need to experience additional and significant advancement to become cost competitive with other power generation technologies. Many researchers are investigating innovative concepts that differ from the traditional fuel cell research and development. Innovative concepts include new fuel cell types, contaminant tolerance (e.g. carbon monoxide and sulfur), new fuel cell materials (electrolyte, catalyst, anode, and cathode), new balance of plant (BOP) concepts (reformers, gas cleanup, water handling, etc.).
In addition, energy storage is an increasingly important enabling technology as California increases the amount of intermittent renewable energy such as wind and solar. A reversible solid oxide fuel cell (SOFC) could complement the development of additional renewable energy sources that require energy storage. The reversible SOFC offers dual mode operation capable of distributed electrical power generation in the fuel cell mode and energy storage through hydrogen production by steam electrolysis in the reverse mode. Although the reversible fuel cell concept has been proven feasible by others, no complete reversible fuel cell material set has yet been identified with sufficient performance, robustness, and cost characteristics to enable commercialization. Several organizations are developing reversible fuel cells of various types, including polymer membrane and solid oxide fuel cells.
A reversible fuel cell would facilitate energy management with intermittent renewable energy sources. When energy is abundant from the renewable sources, the reversible fuel cell would produce hydrogen. When an intermittent energy source is in a quiescent state, the fuel cell would consume the hydrogen to produce electricity. In this manner the owner of a renewable energy source could offer firm, dispatchable energy and thereby realize a higher market price. If the reversible fuel cell met economic goals for first price and round trip energy efficiency it would greatly enable the expansion of renewable energy development in California.
In this work the researchers investigated a ceramic proton conductor based reversible SOFC material set: Ni-BZY/BZY/SSC-BZY. They tested this material set for manufacturability and electrochemical performance. The researchers found that this material for reversible SOFCs is feasible from the standpoint of manufacturability. The results also suggested that the power density in the fuel cell mode and the current density in the electrolyzer mode may not satisfy technical targets for feasibility of a well performing reversible SOFC. Figure 23 provides a schematic of the test stand used for electrochemical tests. It also provides a conceptual schematic for the reversible fuel cell.
2.18.3 ObjectivesThe goal of this project was to determine the feasibility of using ceramic proton conducting electrolytes with compatible electrodes to develop reversible solid oxide fuel cells (SOFC) for low cost, high efficiency power generation and hydrogen production from renewable energy sources. Research focused on developing intermediate temperature (500 to 700oC) ceramic proton conductors with adequate protonic conductivity.
103

Air out Fuel gas in
Fuel gas outlet
Sealant Sealant
Ref electrode
Ref electrode
Cathode
Anode
Air in
Figure 23: Schematic of the Dual Environment Test Stand and Reversible Fuel Cell
The researchers established the following project objectives:
1. Investi- gate and use wet chemical fabri-cation routes for Y-doped BaZrO3 (BZY)
ceramic pro-ton con- duc-tors and asso-ciated elec-trode ma- teri-als in glycine ni- trate, sol-gel, and co-precipi- tation processes.
2. Characterize the protonic conductivity of the ceramic proton conductors pro-duced with wet chemical approaches and determine how to improve the pro-tonic conductivity and sinterability. Proton conductivity should be greater than 10 mS/cm at 600oC.
3. Investigate compatible electrodes by constructing one inch button test cells of reversible SOFCs to evaluate electrode performance in dual mode opera-tion, as well as initial chemical and mechanical stability under thermal cy-cling operating conditions.
2.18.4 Outcomes 1. The researchers produced a powder of 20 percent yttrium-doped barium
zirconate (BZY) using the glycine nitrate process (GNP) water soluble pre-cursors of Ba(NO3)2, Y(NO3)36H2O, ZrO(NO3)2xH2O, and glycine (NH2CH2-COOH). X-ray Diffraction (XRD) tests show post-GNP powders must be cal-cined to temperatures above 1100 oC in air for six hours to produce BZY in the desired simple cubic crystalline structure without any other structural phases. The researchers completed the GNP process with a glycine to ni-trate molar ratio of 0.75.
2. The researchers did not report directly on proton conductivity. They did re-port that higher steam concentration promotes protonic conductivity of the BZY electrolyte. They also reported that the power density in the fuel cell mode and the current density in the electrolyzer mode were not large enough to satisfy the technical requirements of a well performing re-versible SOFC. The researchers produced sintered pellets, button cells of BZY using milling, pressingand heat treating.
104

3. The researchers manufactured one inch BZY fuel cells by screen printing electrodes on BZY electrolyte substrates. The researchers did not report on the electrode performance or chemical and mechanical stability under thermal cycling conditions.
4. The researchers installed the BZY full cell on a one inch alumina tube in-side a button cell test rig. The cell was tested in the temperature range of 650 degrees centigrade to 700 degrees centigrade (oC). The researchers measured electrochemical characteristics of the cell at various tempera-tures. They measured power and voltage and current of BZY cell at 650oC and 700oC in humidified hydrogen. The measured open circuit voltage (OCV) at 650oC and 700oC was 0.76V and 0.95V, respectively. The re-searchers speculated that the increase of the OCV value might be due to the better sealing effect of the ceramic cement at higher temperatures. Higher power density was achieved at 700oC, using 50 percent steam than that using 80 percent steam in the fuel cell mode. The results of both cases were very close, and both cases had substandard power densities. In both generation and hydrogen production modes, the current densities were 0.7V fuel cell voltage and 1.4V electrolyzer voltage. The impedance spectra of the BZY full cell at 700oC showed large bulk and interfacial resistance even under 50 percent and 80 percent steam concentrations, resulting in poor electrolysis in the hydrogen production mode.
2.18.5 ConclusionsThe researchers did not demonstrate the feasibility of a solid oxide reversible fuel cell using the BZY proton conductor material. They did demonstrate manufacturability but not electrochemical properties for the mixture tested. The BZY proton conductor material and electrode materials were successfully synthesized by using glycine-nitrate process. The phases of the synthesized materials were determined to be pure using x-ray diffraction. The BZY full button cells were successfully manufactured using dry pressing, screen printing, and co-firing processes.
The electrochemical tests were conducted on the BZY full button cells in both fuel cell mode and electrolyzer mode. The power density in the fuel cell mode at 0.7V and the current density in the electrolyzer mode at 1.4V were insufficient to satisfy technical requirements of a commercial reversible fuel cell. The BZY ceramic proton conductor based materials studied in this work is not feasible for the reversible SOFC at the current research stage.
2.18.6 RecommendationsThe researchers should investigate additional solid oxide materials that may provide improved electrochemical properties in fuel cell mode and electrolysis mode. The researchers should consider abandoning BZY unless electrochemical properties in appropriate manufactured configurations can be significantly improved.
2.18.7 Benefits to CaliforniaPublic benefits derived from PIER research and development projects are assessed within the following context:
Reduced environmental impacts of the California electricity supply, trans-mission, or distribution system
105

Increased public safety of the California electricity system
Increased reliability of the California electricity system
Increased affordability of electricity in California
The primary benefit to the ratepayer from this research is reduced environmental impacts of the California electricity supply system. This would be accomplished by a reversible fuel cell with the capability to assimilate higher levels of intermittent renewable energy into the California grid. Estimating the specific benefits of reversible solid oxide fuel cells using this, or similar, technology is premature until the technology’s feasibility is demonstrated.
2.18.8 Overall Technology Transition AssessmentAs the basis for this assessment, the Program Administrator reviewed the researchers’ overall development effort, which includes all activities related to a coordinated development effort, not just the work performed with EISG grant funds.
2.18.8.1 Marketing/Connection to the Market Other researchers and companies have demonstrated the reversible fuel cell concept. Several organizations are developing reversible fuel cells of various types, including polymer membrane and solid oxide. Reversible fuel cells advancements have been demonstrated by Proton Energy using a polymer membrane fuel cell49 and some researchers have recently studied the use of traditional oxide ion conductor based solid oxide fuel cell (SOFC) materials. The U.S. Department of Energy (DOE) awarded contracts to General Electric to investigate reversible SOFC technology.50
2.18.8.2 Engineering/TechnicalThe National Fuel Cell Research Center (NFCRC), working with Southern California Edison and Primen, has developed an engineering requirements specification for a reversible fuel cell. NFCRC is seeking additional funding to continue the development of reversible fuel cells.
2.18.8.3 Legal/Contractual No patents have been applied for as a result of this project.
2.18.8.4 Environmental, Safety, Risk Assessments/ Quality Plans Until feasibility is established for solid oxide reversible fuel cells using the materials tested or other materials, analysis of environmental or safety risks and development of quality assurance plans is premature.
2.18.8.5 Production Readiness/Commercialization The product is not ready for production or commercialization.49 http://www.protonenergy.com/index.php/html/energysystems/technology/index.html50 http://www.fedgrants.gov/Applicants/DOE/PAM/HQ/DE-PS36-04GO94020/Grant.html
106

2.19 High Efficiency Planar Luminescent Solar Concentrators
Awardee: University of California, Santa Cruz
Principal Investigators: Sue Carter
2.19.1 AbstractThe goal of this project was to fabricate and test a planar luminescent solar concentrator (LSC) cell exhibiting greater than 10 percent power efficiency. The projected solar receiver was designed to be roof mountable and relatively inexpensive. The design did not require a tracking system. The innovation in this project was an improved photo luminescent material for the LSC. The solar concentrator (LSC) cell consisted of a large (approximate one square meter area, approximately one half centimeter thick) planar body of inexpensive photo luminescent (PL) material. The material absorbs solar photons in the visible spectrum and re-emits photons in the near infrared (IR) spectrum. The planar LSC is designed to confine and then channel the emitted IR photons to the edges of the LSC by total internal reflection. Since the PL material was chosen to be non-absorbing in the IR, a majority of the IR photons travel to the edge of the device. Attached to the edges were strips of conventional high efficiency silicon photovoltaic (PV) cells with high sensitivity in the IR spectrum. While this concept had been known for about 20 years, it had been hampered by poor transport of the emitted IR photons, lack of full absorption over the solar spectrum, and poor stability of the organic dyes used as luminescent material.
To overcome these problems the researchers investigated PL materials, including semiconducting polymer solutions and liquid quantum dot suspensions. They then compared these materials to the performance of laser dye LSCs. A primary goal was to reduce self re-absorption of the IR photons. Experimental results were compared to Monte-Carlo simulations to elucidate the role of other material properties. Overall power efficiencies of small test cells were determined. The results suggested commercially available quantum dots cannot serve as viable LSC dyes because of large absorption/emission band overlap and relatively low quantum yield while materials such as a red emitting polyflourene (Red F, a semiconducting polymer with high quantum yield and small absorption/emission band overlap) are excellent candidates for LSCs. For small area test cells (one inch by three inch), experimental results combined with simulations indicate that Red F would yield a maximum power conversion efficiency of approximately 7 percent for a full perimeter silicon based test cell which would drop off to approximately 5.5 percent for a larger area (i.e. one square meter) cell. Higher efficiencies could be obtained by increasing the photoluminescence efficiency of the light emitting polymer to above 90 percent and by utilizing IR emitting polymers with larger absorption in the visible and with greater emission at IR wavelengths where silicon has higher power efficiency. Simulations, combined with the experimental results, indicate that by combining both of these properties in a single polymer material, power efficiencies greater than 10 percent could be obtained for large area cells.
107

Keywords: Luminescent solar concentrator, polymer semiconductors, quantum dots, laser dyes, photo luminescence, solar cells, solar energy
2.19.2 IntroductionSignificant benefits of reduced need for new transmission lines and improved air quality could accrue to California if its electricity generation could be shifted from large scale carbon based fuel electricity sources to local low cost renewable sources. Among renewable sources of energy, solar photovoltaic (PV) systems are attractive because they provide direct conversion of solar energy to electricity and the technology is scalable from small scale distributed generation to large scale central power plants. However barriers to wider use of PV generation of electricity to date have been the high initial cost and limited production capacity of the market dominant bulk crystalline silicon cells which account for 93 percent of the PV market.51 Accordingly, there is great interest in either lowering the production cost of cells or devising means to use fewer cells to produce a unit of electricity.
Although the photovoltaic industry has established a 2010 industry cost goal52 of $1.50 per peak watt for PV modules, which would make PV systems broadly competitive in the residential market without subsidies, the lowest retail price today (2008) for the important crystalline silicon solar module is $4.17 per watt.52 Two general approaches have been taken to lowering the cost of PV systems: finding low cost efficient PV cell materials or developing inexpensive solar concentrator systems. The solar concentrator approach allows high cost efficient cell materials to be used in very small cells with a concentrator. However a drawback to most concentrators has been the necessity of a costly mechanical tracker to maintain the image of the sun on the small PV cell throughout the day.
The key advancement of science proposed by the researchers in this project was a luminescent solar concentrator (LSC) as shown in Figure 24 approximately half centimeter thick) body of photo luminescent (PL) material absorbed solar photons primarily in the visible spectrum from any angle and then re-emitted photons in the near infrared (IR) spectrum. The researchers chose PL materials exhibiting insignificant absorption at the wavelengths of the emitted IR. The planar structure was designed to trap and channel the majority of the emitted IR photons to the edges of the structure where strips of conventional high efficiency silicon PV cells sensitive in the IR spectrum were installed. While this concept had been known for approximately 20 years, it had been hampered by poor transport on the emitted photons, lack of full absorption over the solar spectrum, and poor stability of the organic dyes. To overcome these problems the researchers proposed to investigate novel luminescent materials including semiconducting polymers, organic phosphors, and suspensions of semiconducting quantum dots (QDs). A second goal was to optimize the waveguide design to increase the fraction of wave guided light.
Figure 24: Schematic of Luminescent Solar Concentrator Cell in Top View (top) and Side View (bottom)
51 http://www.solarbuzz.com/Technologies.htm52 http://www.eere.energ y .gov/buildin g s/building_america/pdfs/db/35206.pdf
108

The luminescent material is typically an organic dye imbedded in a polymer matrix or suspended in a liquid. The detector is a strip configuration PV cell such
as high efficiency silicon. If the luminescent cell area is 1 m x 0.5 m by 0.5 cm thick and the thin sides are covered with PV strips, optical gains of 30 to 50 can be obtained.
2.19.3 ObjectivesThe goal of this project was to determine the feasibility of a novel planar luminescent solar concentrator (LSC) cell coupled with silicon strip detectors with over 10 percent power efficiency to create a roof mountable solar cell module for the inexpensive generation of electricity from solar radiation. The researchers established the following project objectives:
1. Identify materials with photo luminescent (PL) efficiency greater than 90 percent, a peak absorption wavelength (max) between 700 and 900 nm (nanometer), and greater than 67 percent absorption across the solar spec-trum.
2. Identify the optimal concentration of the luminescent material. Develop ma-terials and/or solutions with transmission loss less than 1 percent at peak absorption wavelength, while retaining photo luminescence efficiency greater than 90 percent.
3. Demonstrate an optical efficiency for an LSC cell that is greater than 40 per-cent.
4. Demonstrate power efficiency for a fully integrated LSC cell/silicon strip de-tector of 10 percent.
5. Confirm that the planar LSCs can be manufactured for a cost of approxi-mately $0.50 per peak watt.
2.19.4 Outcomes1. Three types of PL materials were selected for study: two new quantum dots
(QD), five new orange or red emitting semiconducting polymers, and three laser dyes. All were studied in the form of liquid suspension or solutions. The type of liquid was unspecified. The researchers included laser dyes, e.g. Rhodamine B., as standards for judging the new polymer and QD materials. At the time of the study none of the materials met the criteria of PL effi-
109

ciency greater than 90 percent and a max between 700 and 900 nm which had been specified for good device performance.
2. The researchers measured absorption and normalized PL emission efficiency as a function of dye concentration (here the term “dye” refers collectively to all three types of materials studied). The concentrations for peak absorption could not be determined for the polymer or laser dyes because the concen-tration for peak absorption exceeded the limit of solubility in the solutions. The absorption peak for QDs could also not be determined because it ex-ceeded the concentration available from vendors. In another set of experi-ments the researchers inferred the amount of re-absorption as a function of distance from the point of excitation.
3. The researchers measured the optical performance in a small one by three inch test cell with a PV cell on one edge only. With the parameters from Task 2 they constructed a simulation model for that cell to compare with ex-periments and extended the model to simulate PV cells on all four edges. The comparison between single edge experiment and single edge model was fair. The researchers found that the material Red F produced the highest op-tical performance of 21.4 percent in simulated four edge collection. Al-though the proposal stated that an improved planar cell with wave guiding enhanced by incorporating glass spheres would be investigated, there was no mention of it in the Final Report.
4. High efficiency silicon strip PV cells were not available at the time of the project so the researchers used low-efficiency amorphous silicon detectors in the measurements. To account for this difference they combined the simu-lated optical efficient results with the spectral response of a high efficiency strip detector and inferred a power efficiency of 7 percent for a small area LSC and 5.5 percent for a large area (one square meter cells). One of the reasons given for this shortfall in efficiency was low index of refraction in the solvent for wave guiding. A new solvent with higher index was tried but materials compatibility problems could not be overcome.
5. The researchers conducted a cost analysis assuming 10 percent power effi-ciency and high efficiency strip detectors. This analysis resulted in a pre-dicted cost of approximately $0.55 per peak watt (Wp). The cost could be lower in large scale production. Adding in a manufacturer’s gross margin of $0.30 per Wp and installation cost of $0.35 per Wp resulted in an overall cost of $1.20 per Wp.
2.19.5 Conclusions1. Good progress was made investigating materials with the potential for photo
luminescent (PL) efficiency greater than 90 percent, a max between 700 and 900 nm, and greater than 67 percent absorption across the solar spectrum. These material parameter goals were not achieved. Thus this objective was not met.
2. The researchers made experimental measurements of data related to ab-sorption, PL, and transmission loss in the materials. Since the results ob-tained were not completely quantitative, the goals for transmission loss less than 1 percent at peak absorption wavelength while retaining photolumines-cence efficiency greater than 90 percent were not met.
110

3. With a combination of experiment and simulation, the researchers demon-strated that Red F LSC cell with four edge collection could have an optical efficiency of 21.4 percent. Thus the goal of an LSC cell with optical effi-ciency greater than 40 percent was not met.
4. The inferred power efficiency of 7 percent for a small area LSC and 5.5 per-cent for a large area LSC did not quite meet the goal of 10 percent, but they are encouraging signs.
5. The cost analysis yielded a cost of goods of ~ $0.55 per Wp in small scale production which could be lower in large scale production. Thus the manu-factured estimated cost goal of ~$0.50 per Wp was met.
Good incremental progress was made in adding to the body of literature on this interesting concept. It is not yet clear if the concept can be made efficient enough to displace technologies currently in the marketplace.
2.19.6 RecommendationsThe researchers indicated they had secured additional funding from Petroleum Research Fund and the U.S. Department of Energy. In future work the EISG Program Administrator recommends following closely the development of new PL materials as they emerge in the literature. Experimentally, the researchers should present direct un-normalized measurements of absorption and IR transmission in fluid dye cells which could be useful in simulations. The researchers could directly examine the IR intensity across an edge of an LSC with a video camera sensitive in the IR spectrum before installing the strip detector. The video images could determine if the intensity is uniform across the edge top to bottom and side to side. It could also determine if there are temporal fluctuations.
2.19.7 Benefits to CaliforniaPublic benefits derived from PIER research and development projects are assessed within the following context:
Reduced environmental impacts of the California electricity supply, trans-mission, or distribution system
Increased public safety of the California electricity system
Increased reliability of the California electricity system
Increased affordability of electricity in California
The primary benefit to the ratepayer from this research is reduced environmental impacts of the California electricity supply or transmission or distribution system. Deployment of cost effective photovoltaic technology could produce improvements in air quality by displacing carbon based fuel electricity generation. The amount of improvement is dependent on several factors. The first factor is the need for natural gas fueled spinning reserve. Without energy storage technology, the California Independent System Operator (CAISO) may have to order several natural gas fueled generators to operate at no load conditions to pick up demand when clouds obscure the sun. A second factor is the physical location of large scale solar energy installations. If the solar energy is not located near load centers, there will be a need for transmission lines and attendant line losses. A third factor
111

is system economics. If the cost goal of this project is achieved in production, significant numbers of these units could be installed locally throughout the state.
2.19.8 Overall Technology Transition AssessmentAs the basis for this assessment, the Program Administrator reviewed the researchers’ overall development effort, which includes all activities related to a coordinated development effort, not just the work performed with EISG grant funds.
2.19.8.1 Marketing/Connection to the Market A paper was published: Journal of Applied Physics 101, 123114 (2007).
2.19.8.2 Engineering/TechnicalAn adequately efficient photo luminescent material and LSC cell still must be demonstrated experimentally.
2.19.8.3 Legal/Contractual The researchers are preparing a Provisional Patent Application.
2.19.8.4 Environmental, Safety, Risk Assessments/ Quality Plans At this stage of development there are no environmental or safety issues evident, and it appears to be premature to develop quality plans.
2.19.8.5 Production Readiness/Commercialization
A photo luminescent material with the characteristics required for a commercial LSC product still has to be found.
2.20 Laminated Polymer Dye-Sensitized Solar CellsAwardee: Rutgers, the State University of New JerseyPrincipal Investigators: Aurelien Du Pasquier
2.20.1 AbstractDye-sensitized solar cells (DSSC) are low cost alternatives for conventional solid state photovoltaic devices. To ensure a successful commercial future for this technology, two conditions must be met: low-cost fabrication and device stability. The first condition may be met by roll to roll coating and lamination process, which requires flexible substrates, while the second item may be achieved by the replacement of liquid electrolyte by a solid or gel electrolyte.
This project evaluated the feasibility of using a poly vinylfluoride-co-hexafluoropropylene (PVDF-HFP) based polymeric electrolyte to build solid state titanium dioxide (TiO2) dye-sensitized solar cells using lamination. The goal was to develop a new class of solar cells that have lower cost yet comparable efficiency as today’s cell types. The test showed that such cells are feasible, but they require additional development work, including improvements to sealing mechanisms.
Keywords: Dye-sensitized solar cell, flexible substrates, dye, solar cell, PVDF-HFP, laminated, polymer electrolyte
112
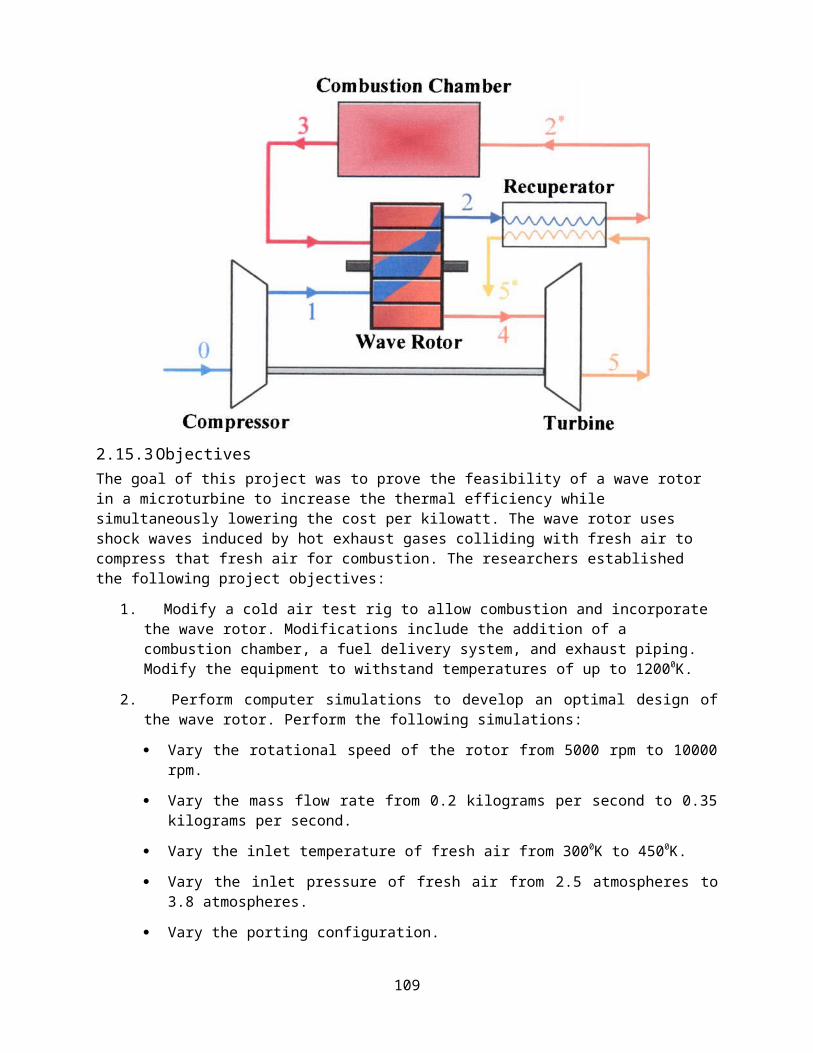
2.20.2 IntroductionSolar photovoltaic (PV) technology is an important option for California’s future electric system, capable of providing emissions free electricity by avoiding carbon based fuel use. Various state and local programs, including the California Solar Initiative,53 encourage significant expansion in the use of PV but are hampered due to high cost and low efficiency. Even after decades of research and development, today’s photovoltaic technology remains relatively costly and exhibits limited efficiency. To accelerate the deployment of PV into the California electrical system, both lower cost and improved efficiency are needed.
Dye-sensitized solar cells (DSSC) are low cost alternatives to conventional solid state photovoltaic devices. To ensure a successful commercial future for this technology, two conditions must be met: very low-cost fabrication and device stability. The first item may be met by a number of approaches, including roll to roll coating and lamination. This requires flexible substrates, while the second item requires the replacement of the liquid electrolyte by a solid or gel electrolyte. Flexible substrates are a departure from the more common use of glass and similarly inflexible substrates.
The goal of the project was to formulate a poly vinylfluoride-co-hexafluoropropylene (PVDF-HFP) based polymeric electrolyte that could be used to build solid state titanium dioxide (TiO2) dye-sensitized solar cells by lamination. The development of such solar cells could benefit the ratepayers of California by offering the consumer a lower cost alternative to silicon based solar cells with comparable efficiency. Figure 25 shows the developed cell in an electrical performance test setup and in side view.
Figure 25: DSSC Solar Cell in Testing Setup and Side View
2.20.3 ObjectivesThe goal of this project was to determine the feasibility of poly vinylfluoride-co-hexafluoropropylene (PVDF-HFP) based dye-sensitized solar cells (DSSC) using 53 www.cpuc.ca.gov/static/energy/solar/index.html
113

flexible transparent substrates. The cells should have a solar conversion efficiency exceeding 5 percent at a projected manufacturing cost lower than one dollar per peak watt. The researchers established the following objectives:
1. Develop a polymer gel electrolyte based on I-/I3- redox couple demonstrating an ionic conductivity greater than one mS/cm (milliSiemens per centimeter).
2. Develop a suitable coating process for titanium dioxide (TiO2) nanoparticles on flexible indium tin oxide on polyethylene terephthalate (ITO/PET). ITO is a transparent conductive oxide substrate that avoids high temperature an-nealing while ensuring good bonding and photo activity similar to TiO2 photo anodes coated on glass and annealed at 450° C.
3. Build one square centimeter DSSC prototypes with flexible anodes and liq-uid electrolyte. Demonstrate current density greater than five milli-amperes per centimeter squared (mA/cm2) under one sun conditions.
4. Build one square centimeter DSSC prototypes with flexible anodes and poly-mer electrolyte. Demonstrate current density greater than three milli-am-peres per centimeter squared under one sun conditions.
5. Demonstrate increased stability of flexible DSSCs with polymer gel elec-trolyte.
6. Demonstrate 16 cm2 laminated flexible DSSC prototypes with efficiency bet-ter than 5 percent.
2.20.4 Outcomes1. The researchers impregnated PVDF-HFP+SiO2 polymeric membranes with
liquid based electrolytes.
2. Bonding and photo activity at an annealing temperature of 130° C were achieved using titanium tetraisopropoxide as an additive to TiO2 nanoparti-cles.
3. DSSC prototypes were fabricated (see Figure 1) with measured short circuit current of 4.84 mA/cm2 under half sun conditions using methoxypropionitrile (MPN) based liquid electrolyte and flexible TiO2 electrodes coated on ITO-PET. Two reference cells were made with the same slurry on FTO glass (a transparent conductive glass): one for 450° C and one for 130° C annealing temperatures. The highest efficiencies were observed at 48.7 mW/cm2 illumi-nation for all cells (approximately one half sun). At this illumination the cells made on FTO glass had similar efficiency: = 4.01 and 4.10 percent for 450° and 130° C annealing temperatures respectively, with higher FF and lower Jsc for the cell annealed at 130° C. (Isc is the cell short circuit current per centimeter squared, and FF is the fill factor. Both are in the numerator of the solar power conversion efficiency equation.) A cell made on ITO/PET substrates had a lower efficiency, = 3.55 percent.
4. ITO-PET electrodes were made with TiO2 P25 0.5g/BuOH 2.5 mL + 25 per-cent TiP4, cast with one layer of thick Kapton (a trademarked polyimide) tape. The results showed that N-methylpyrollidone (NMP) electrolyte (liquid phase) had lower efficiency than MPN liquid electrolyte. However when gelled with PVDF there was no significant loss of efficiency. Furthermore, the devices appeared to be stable and display increased efficiency after one
114

day of storage. The researchers attributed the increase in efficiency to slow diffusion of the very viscous electrolyte into the TiO2.
5. Polymer electrolytes made with NMP solvent were found to be the most sta-ble of those tested.The absence of currents between -500 and +500 mV indicated a good stability of the polymer + electrolyte com-bination, which would not interfere with the solar cell photocurrent.
6. The researchers had difficulty with DSSC cells larger than one centimeter square. In large devices, the sheet resistance of the ITO/PET was a limiting factor. The bonding of the TiO2 coating to the ITO/PET sub-strates was not strong enough, and was an issue.
2.20.5 Conclusions1. The maximum power conversion efficiency achieved in this work for refer-
ence DSSCs using a liquid electrolyte and FTO/glass electrodes was 4.1 percent. With the dye used and the same MPN liquid electrolyte, other laboratories have demonstrated power conversion effi-ciency of 6 to 7 percent. The researchers believe that the baseline TiO2 elec-trodes had not fully optimized because of diffusion issues.
2. The addition of TiP4 to TiO2 nanoparticles dispersions improved the nanoparticles’ electrical connection, resulting in a power conversion efficiency increase of approximately 140 percent. An optimum TiP4 content of approximately 25 weight percent gave the best com-promise between porosity and connectivity. The sol-gel reaction be-tween TiO2 and TiP4 occurs at low temperature, making it possible to use
flexible substrates such as ITO/PET for preparation of more effi-cient DSSC electrodes.
3. The researchers combined the flexible PET/ITO-TiO2 anodes with a polymer electrolyte based on PVDF-HFP+SiO2 film and MPN elec-
trolyte. This caused a drop in device efficiency from approximately3.5 per-cent to approximately 2 percent. This can be attributed to the fact that the polymer electrolytes have only 10 percent the ionic conductivity of the liquid electrolytes. The tests of PVDF-NMP gels indicated that more stable devices can be achieved because of the strong solvent-polymer interactions, but lower efficiencies were also obtained (approximately 0.5 percent) because of a lower I3
- diffusion coefficient. The difficult gel impregnation of the TiO2 mesporous electrodes is another possible reason.
4. Attempts at laminating a complete device with a flexible counter electrode (either graphite or TiO2+ PET-ITO/PEDOT: PSS) were not success-ful.
The project verified the feasibility of using a polyvinylfluoride-co-hexafluoropropylene (PVDF-HFP) based polymeric electrolyte to build solid state TiO2 dye-sensitized solar cells by lamination. Further research and development is needed to improve cell sealing mechanisms, optimize porosity, improve cell efficiency, and refine lamination schemes.
2.20.6 RecommendationsThe researchers should pay particular attention to three areas:
115

1. Improved flexibility versus conductivity of substrates to allow for larger cells to be fabricated within efficiency and stability constraints
2. Increased and easier adhesion of TiO2 to the substrates while maintaining lower temperature annealing
3. Ensuring cell sealing mechanisms are tight from environmental intrusion, stable over long periods, robust to environmental cycling and manufac-turable to replicable specifications.
In addition the tradeoffs in costs and performance of different quality of TiO2
(primary crystallographic makeup of rutile and anatase percentages, particle and pore sizes) should be determined and documented. The researchers should consider other materials and combinations in addition to TiO2.
After taking into consideration (a) research findings in the grant project, (b) overall development status, and (c) relevance of the technology to California and the PIER program, the Program Administrator has determined that the proposed technology should be considered for subsequent funding within the PIER program.
Receiving subsequent funding ultimately depends upon (a) availability of funds, (b) submission of a proposal in response to an invitation or solicitation, and (c) successful evaluation of the proposal.
2.20.7 Benefits to CaliforniaPublic benefits derived from PIER research and development projects are assessed within the following context:
Reduced environmental impacts of the California electricity supply, trans-mission, or distribution system
Increased public safety of the California electricity system
Increased reliability of the California electricity system
Increased affordability of electricity in California
The primary benefit to the ratepayer from this research is from increased affordability of the California electricity supply system. Secondary benefits may accrue from reduced environmental impacts of electricity supply and transmission, especially if deployed on end user premises. Quantifying benefits from this research requires speculation about the ultimate market penetration of the technology versus other photovoltaic technologies and versus conventional power supply technology. If the favorable indications of one dollar per watt prove out through the development and commercialization process, direct cost savings to California ratepayers could be about $300 million per year, assuming an annual market of 300 MW, compared to best estimates of two dollars per watt for other PV technology. The results of this project may also be considered enabling as the results provide useful information for other researchers working on the development of flexible solid state dye-sensitized solar cells. In particular, the benefit of sol-gel additives to decrease annealing temperature of TiO2 electrodes and the benefit of solvents such as NMP that strongly interact with PVDF-HFP polymer membranes to increase device stability are noteworthy.
116

2.20.8 Overall Technology Transition AssessmentAs the basis for this assessment, the Program Administrator reviewed the researchers’ overall development effort, which includes all activities related to a coordinated development effort, not just the work performed with EISG grant funds.
2.20.8.1 Marketing/Connection to the Market The researchers have published their results in Electrochmica Acta. This provides connection and dialogue with other researchers in photovoltaic cells. No known connection to the ultimate user markets exists, but it is early. If cost and efficiency of the DSCC compare favorably with current and future PV technology, connection to the ultimate user market would be expected if appropriate marketing efforts are undertaken. It is too early in the technology’s development cycle to undertake major marketing efforts.
2.20.8.2 Engineering/TechnicalAs noted above, it is crucial that lower resistivity yet flexible substrates be found or developed, and that improved adhesion of the TiO2 to substrates be achieved. As with most PV cells, good device sealing is a potential make or break feature and must be solved. In addition to being mission critical in laboratory tests, all of these characteristics will determine manufacturability and quality in commercial production.
2.20.8.3 Legal/Contractual The researchers had not applied for patents. They performed a patent search and identified patents held by others that may be infringed upon by the technology described here. They intended to apply for a patent once more efficient and stable cells are developed.
2.20.8.4 Environmental, Safety, Risk Assessments/ Quality Plans There are no known environmental or safety risks associated with this technology. Once the technology is optimized for commercial production, quality assurance, including consistent and effective sealing of the PET/PET and PET/Surlyn junctions will be critical to product quality and product life with respect to climatic cycling.
2.20.8.5 Production Readiness/Commercialization At the conclusion of this project the technology was not ready for production or commercialization. It may become so after efficiency, stability, and sealing issues discussed above are resolved.
2.21 Efficient Solar Photovoltaic Mirror Modules for Half the Cost of Today’s Planar Modules
Awardee: JX Crystals, Inc.
Principal Investigators: Dr. Lewis M. Fraas
117

2.21.1 AbstractReducing the cost of photovoltaic systems would increase their application in California and contribute to greenhouse gas reduction. This research project designed, built, and tested a low concentration solar panel using triangular profile mirrors and two-thirds less silicon to achieve output comparable to a conventional 175W panel when mounted on a tracker. The researchers also designed, built, and tested a low profile tracker. This could enhance the prospect for solar installations on flat roofs where visual impacts of traditional trackers can be a barrier to adoption. Both innovations have the potential to reduce the cost per watt and total energy output of photovoltaic systems. They are readily manufactured using existing components and are ready for pilot testing in multiple applications.
Keywords: Concentrating solar collector, CPV, mirrors, trackers, heat sink, heat spreader, solar panels, photovoltaic modules, crystalline silicon
2.21.2 IntroductionDespite significant and ongoing efforts to reduce the costs of photovoltaic (PV) systems, their high first cost remains a deterrent to the widespread deployment envisioned in California’s energy policy. The most cost-intensive component in PV systems is the silicon cells, with worldwide demand keeping pressure on their pricing. Further, limited roof area available for solar installations on buildings constrains the amount of energy that can be recovered at a given site. In most cases subsidies are required to bring PV system costs into parity with conventional electric generation alternatives in today’s market.
Reducing costs to a more competitive level could increase penetration of PV alternatives, bringing their environmental and reduced fuel price and supply risks to more California ratepayers. Increasing the efficiency of the solar array can yield more energy for a given installation. Both would help California realize its vision of a more sustainable energy future and free public funds for deployment in other initiatives supporting energy efficiency.
The researchers proposed to design, build, and test a low level concentrating PV system with output comparable to a conventional module, but using 1/3 the silicon. They laminated an aluminum plate to the back of the panel to maintain cell temperatures within acceptable limits. As shown in Figure 26, a series of linear mirrors with a triangular cross section and fabricated from commercially available coated aluminum provided a 3 sun concentration on SunPower A-300 cells which the researchers s cut into thirds and installed as thin strips between the mirrors. The researchers also developed and successfully tested a novel low profile carousel tracker suitable for installation on commercial flat roofs (Figure 27).
Figure 26: Panel with Mirrors
118

119

Figure 27: Low Profile Tracker
2.21.3 ObjectivesThe goal of this project was to determine the feasibility of a lower cost solar panel that uses mirrors to achieve a 3-sun concentration and requires 1/3 the silicon of a conventional panel of similar output. The researchers established the following project objectives:
1. Perform a detailed CAD design of a 3-sun PV mirror module sized at 200W and incorporating 72 one-third cells in 12 rows of 6 cells with 11 two-faceted reflecting mirrors located between these rows and with two end mirrors at either end of the module.
2. Procure the required materials for six of these 3-sun PV mirror modules, in-cluding cells from SunPower, mirror material from Reflectech, and a tracker from Array Technologies for outdoor testing.
3. Define and implement the mirror module fabrication process. Test modules, measure performance, and send modules for independent testing. Demon-strate 200W at STP (standard test conditions). Demonstrate adequate cool-ing such that the temperature is less than35°C above ambient.
4. Fabricate and integrate four mirror modules into a first system. Design and build carousel tracker for flat rooftop buildings and integrate the four mirror modules with this carousel tracker.
5. Perform initial qualification testing, including testing at remote sites and thermal cycle durability testing.
6. Obtain vendor quotes for module components and re-evaluate and validate cost targets of $1.50/W.
2.21.4 Outcomes1. The researchers used CAD software to design the basic 3-sun mirror mod-
ule. It was sized to the same dimensions as a typical non-concentrating mod-ule of equivalent output (30” X 61.5”), although the mirror array resulted in a thicker profile of six inches. Researchers procured materials for this project as well as a planned pilot demonstration in China, resulting in a total purchase of material for 800 panels. They selected SunPower A300 cells.
120

They obtained coated aluminum for the mirrors from two suppliers, Re-flecTech and Alanod, who offer products designed for solar and outdoor lighting applications. The researchers arranged to use a two-axis tracker from Array Technologies in Albuquerque, New Mexico, for outdoor testing.
2. Lamination of the basic module was completed in China, with mirrors fabri-cated by a lighting fixtures supplier (Ecolite) and installed by the re-searchers. The researchers mounted the test modules and a typical conven-tional module with the same rated output (Sharp 175) side by side on a two-axis tracker at Array Technologies in Albuquerque, New Mexico. Power out-put of the test modules was slightly better than that of the reference module on the bright, sunny, blue sky test day. Further testing showed the modules produced from 185-205W, with output of later production samples being the highest. The researchers s measured cell temperature rise of the modules to be no higher than 25°C above ambient.
3. The researchers mounted the modules on a prototype carousel tracker de-veloped in this project to create a simple test system for evaluation. The modules were integrated into a commercial scale system for installation in China as part of a parallel project. Array Technologies fabricated the proto-type carousel tracker.
4. The researchers conducted limited environmental testing of modules at Ari-zona State University, including 50 thermal cycles, 10 humidity freeze cy-cles, and hail stone exposure. Initial results indicated little performance degradation other than the effects of mirror soiling. It does not appear that the low profile tracker was subjected to testing of mechanical performance or ability to withstand high wind loads.
5. Module cost for the 800 modules tested in this research and the parallel China pilot was $2.79/W. The researchers estimated that high volume pro-duction could reduce costs to roughly $1.72/W.
2.21.5 ConclusionsThis was a very successful project which met its goals and represents an important step towards commercialization of the researchers s’ 3-sun design. Inclusion of information from the China pilot project provided additional insight into the design’s prospects.
1. The researchers successfully completed module design, including mirror geometry and sizing. Incorporation of a removable mirror array allowed for ready maintenance and repair and future upgrades as technology progresses.
2. The researchers successfully completed all required materials and tracker arrangements. The use of existing vendors with proven products helped validate the commercial potential for the modules.
3. The researchers s successfully completed fabrication of the test modules and validated the premise that the design could be readily manufactured using existing technologies and vendors. Test results for module output validated that the design compared favorably with conventional 1-sun panels, while using 1/3 of the silicon. Heat gain for the 3-sun panels was found to be within specification, indicating that the added aluminum panel heat spreader design worked well.
121

4. The modules were successfully integrated into several test systems. Inclusion of information from the China pilot contributed significantly to this objective and helped validate the commercial potential for the module design. The low profile tracker has significant potential to increase the adoption of solar collectors on buildings where visual impacts may preclude use of traditional trackers.
5. Initial environmental testing of the modules was favorable, but further testing under both laboratory and field conditions would be required before commercialization. In particular, the performance of the mirror materials and the lamination of the heat spreader would require longer exposures to ensure durability. Testing of the low profile carousel tracker’s mechanical durability under accelerated cycling, as well as ability to withstand high wind loads, would also be an important follow-on project.
6. Initial costs for the modules were favorable, with a good potential for further reductions in commercial quantities. Unless silicon wafer costs decline substantially, the 3-sun concentration with tracking approach should remain a cost effective alternative.
2.21.6 RecommendationsLogical next steps for the researchers s would be to conduct additional performance and longevity testing of both the modules and the low profile carousel tracker under both laboratory and field conditions. The China pilot that was described in significant detail in the Final Report should provide a good starting point for field evaluation, but additional test partners are needed. Ideally these could be California entities, including both private sector and utility applications.
After taking into consideration (a) research findings in the grant project, (b) overall development status, and (c) relevance of the technology to California and the PIER program, the Program Administrator has determined that the proposed technology should be considered for subsequent funding within the PIER program.
Receiving subsequent funding ultimately depends upon (a) availability of funds, (b) submission of a proposal in response to an invitation or solicitation, and (c) successful evaluation of the proposal.
2.21.7 Benefits to CaliforniaPublic benefits derived from PIER research and development projects are assessed within the following context:
Reduced environmental impacts of the California electricity supply, trans-mission, or distribution system
Increased public safety of the California electricity system
Increased reliability of the California electricity system
Increased affordability of electricity in California
The primary benefit to the ratepayer from this research is reduced environmental impacts of the California electricity supply. As with all solar generation, the contribution to greenhouse gas reduction is straightforward. In addition, since tracking is an integral part of any concentrating approach, this system would provide significantly more energy on a daily basis than a stationary flat system,
122

further increasing the environmental benefit. To the extent that local generation reduces peak electric demand, there would also be potential savings in distribution and transmission expenses for the utility grid.
2.21.8 Overall Technology Transition AssessmentAs the basis for this assessment, the Program Administrator reviewed the researchers’ overall development effort, which includes all activities related to a coordinated development effort, not just the work performed with EISG grant funds.
2.21.8.1 Marketing/Connection to the Market Since this project was completed, the technology has advanced considerably. The commercial and industrial sectors are a large target market for this technology as building owners increasingly look to solar for cost savings and greenhouse gas reductions. The potential lower module cost and improved flat roof aesthetics of the low profile tracker should make these innovations competitive among existing providers of systems. The economics of this approach are driven by the cost of silicon compared to the costs of the concentrating components and the costs/benefits of trackers. There is some risk that future technological advances in other approaches (for example, thin film solar) could overtake the cost/benefit offered by this design.
2.21.8.2 Engineering/TechnicalA module demonstration was underway with a customer in China. With additional funding the low profile tracker design and specifications could be finalized and this innovation moved forward to larger scale testing in the field.
2.21.8.3 Legal/Contractual The researchers indicated that three related patent applications have been filed, with a fourth nearing completion. Underwriters Laboratory approval is pending.
2.21.8.4 Environmental, Safety, Risk Assessments/ Quality Plans The researchers clearly identified the need for additional field testing and pilot demonstrations as the logical next step for the modules and tracker. This is entirely appropriate and, given the rapid pace of innovation in this field, should receive high priority for funding and implementation.
2.21.8.5 Production Readiness/Commercialization The researchers indicated that a commercialization plan had been developed. With successful patent protection, UL approval, and demonstration projects, acquisition of a development partner should be possible.
123

2.22 Small Efficient Turbine System for DEG and CHP ApplicationsAwardee: Altex Technologies Corporation
Principal Investigators: John T. Kelly and George Miller
2.22.1 AbstractLarge gas turbine systems are able to operate at very high turbine inlet gas temperature by cooling turbine vanes and blades. This yields both high efficiency and specific power which allows large gas turbines to be competitive with a range of power systems that supply power to the grid. Unfortunately blade cooling for large turbines is not easy to implement on a microturbine scale because of the small size of the blades and the complex geometries (e.g. radial based turbines). This leaves microturbines at a severe disadvantage in efficiency and specific power versus large power sources. Microturbines are then relegated to niche markets primarily off the grid rather than providing broad applicability across many markets as originally envisioned. The researchers proposed an innovative and cost effective means using woven wire inserts to cool small turbines and thereby achieve more competitive power system efficiencies and specific power levels. Using analysis, the researchers showed a metallic based turbine could be cooled and inlet gas temperature could be raised to a level where efficiency and specific power could be increased by 27 percent for a metallic engine and 61 percent for a ceramic turbine. If achieved, this higher efficiency would translate into power cost reductions that would make microturbines more competitive, particularly when implemented as a combined heat and power system. While analysis and tests focused on metallic based turbine systems, the innovation potentially could work for ceramic turbines. This could lead to even higher temperature, efficiency, and specific power for microturbine systems.
Keywords: Microturbine, turbine inlet temperature, cooling, high efficiency, high specific power
2.22.2 IntroductionThe goal of this project was to increase the efficiency of microturbines to allow them to be viable choices for distributed energy applications in California. One reason microturbine efficiency is less than larger gas turbines is limitations in turbine cooling of the smaller microturbine components. EPA reported that for microturbines (outputs between 30 and 350 KW) maximum electrical efficiency was 28 percent and 31 percent for inlet temperatures of 1,5500F and 1,750°F respectively.54 By comparison, EPA also reported that gas turbines in sizes ranging from 500 kilowatts (kW) to 250 megawatts (MW) can achieve efficiencies of greater than 40 percent in simple cycle operation and 60 percent in combined cycle with steam turbines.55
If more gas microturbine engines are deployed for small distributed energy resources (DER) and combined heat and power (CHP) systems, benefits to California ratepayers include low emissions potential, reliability, low maintenance, and excellent longevity of the microturbines. However for small gas turbine engine
54 http://www.epa.gov/combdhpp/documents/microturbines.pdf55 http://www.epa.gov/CHP/documents/tech_turbines.pdf
124

based systems to be economically viable, electric power generation efficiency must be high and the capital cost must be reasonable. If microturbine efficiency could be increased from 30 percent to 40 percent in non-CHP and CHP systems having 1266 MWe capacity, savings could be $230 and $158 million per year, respectively, based on reduced fuel use. Given higher power output per amount of fuel burned, pollutants (NOx, CO, unburned hydrocarbons) could be reduced by 320 tons per year for either non-CHP or CHP mode. Lastly, to produce the same power the more efficient microturbine would burn less fuel resulting in lower greenhouse gas (CO2) emissions. For either non-CHP or CHP modes, the reductions are 1.2 million tons per year based again on 1266MWe total capacity.
The advancement of technology proposed in this project was the application of an innovative turbine cooling scheme and turbine design to small microturbines. The concept was to place woven wire screens in the compressed air passage to cool the turbine housing. The absorbed heat was used to preheat the air entering the combustor. The cooling of the turbine blade is predominantly transferred via radiation from the blade housing. The researchers projected that the proposed turbine system design would have an electric power generation efficiency of over 40 percent. The special design utilizes components that can be produced by high volume manufacturing techniques reducing system capital costs. Figure 28 shows an illustration of the proposed design.
Figure 28: Schematic of Device
2.22.3 ObjectivesThe goal of this project was to determine the feasibility of increasing the efficiency of a microturbine of less than 350 kW using a new cooling scheme and turbine
125

design. The specific technology is a novel turbine cooling system which allows increased turbine inlet gas temperature and engine efficiency over 40 percent. The researchers established the following project objectives:
1. Allow gas turbine inlet temperatures (TIT) of 1427°C (2600°F) while main-taining turbine material temperatures below 1027oC (1880oF).
2. Show that increased turbine inlet temperatures can result in engine effi-ciency of over 40 percent and fuel utilization of over 80 percent when CHP is utilized.
3. Show the heat transfer enhancement concept can reduce heat exchanger weight by 75 percent and increase heat exchanger durability.
4. Confirm fuel use reductions using analysis and test data.
5. Confirm, using analysis and manufacturers’ cost inputs, that first costs will be less than $1000 per kWe.
2.22.4 Outcomes1. Test results showed gas turbine inlet temperatures up to 1277oC (2330oF)
were
possible without exceeding metallic turbine temperature limits ranging from 982oC to 1121oC (1799oF to 2049oF). Analysis showed gas temperatures up to 1788oC (3250oF) would be possible for ceramic turbine equipped microturbines which have higher temperature limits of 1316oC to 1788oC (2400oF to 3250oF).
2. With these high turbine inlet temperatures, efficiencies were shown to be 39 percent for metallic turbines and 49 percent for ceramic turbines with CHP fuel utilization over 80 percent in both cases.
3. Utilization of high performance fins can reduce heat exchanger weight by 75 percent versus plate fin-based heat exchangers. The design selected was the perforated plate which was found to have a heat exchange efficiency of al-most 34 percent compared with 28 percent for plain plate heat exchangers.
4. Fuel use reductions can be up to 21 percent and 38 percent in the metallic and ceramic turbine wheel cases, respectively.
5. Cost assessment showed capital costs could be reduced to $1,095 per kWe relative to the baseline engine cost with a metallic turbine wheel. This ex-ceeds the proposed target cost by 9.5 percent.
2.22.5 Conclusions1. As shown by proof of concept tests in an operating microturbine, benchtop
static tests, and model analysis, the proposed design can significantly increase turbine inlet temperature for a given turbine material temperature limit, resulting in improved microturbine efficiency and power output.
2. By implementing the new design, microturbines can achieve efficiencies of 40 to 50 percent, making them more competitive with large gas turbine en-gines..
3. These performance improvements translate into fuel use reductions and emissions reductions.
126

4. The improvements in efficiency and power output for a fixed engine mass flow translate to power production cost reductions.
From this analysis and test results, one can conclude that the new design is a feasible way to significantly improve microturbine performance and costs to better compete with large gas turbines and the power grid. The researchers utilized extensive mathematical analysis of rather limited test data to conclude that this new turbine cooling technique could improve microturbine efficiency. Given the limited nature of the actual data collected, this concept will require much more work to bring it to commercial viability.
2.22.6 RecommendationsTo advance the new microturbine design toward commercialization, a more refined prototype version of the system using a metallic turbine should be developed and tested at larger scale. A scale-up of four to one, at minimum, should be considered. For prototype tests materials to be used in the final product should be utilized to test durability as well as performance.
Beyond performance and durability testing, the Program Administrator recommends updating cost estimates. Better estimates of first costs can be combined with improved estimates of operating costs to define lifetime costs. These can then be compared with published microturbine costs to define the cost benefits of the new design. The researchers should evaluate the effects of the higher turbine inlet temperatures on the generation of oxides of nitrogen which generally increase with higher turbine inlet temperatures.
The Program Administrator also recommends evaluation of related recuperated microturbine designs that have achieved significant improvements to efficiency. The project design should be compared to these competing advanced designs. In addition, the researchers should evaluate the potential of ceramic material durability at the higher temperatures. Some ceramic materials do not retain optimum characteristics at the higher temperatures.
After taking into consideration (a) research findings in the grant project, (b) overall development status, and (c) relevance of the technology to California and the PIER program, the Program Administrator has determined that the proposed technology should be considered for subsequent funding within the PIER program.
Receiving subsequent funding ultimately depends upon (a) availability of funds, (b) submission of a proposal in response to an invitation or solicitation, and (c) successful evaluation of the proposal.
2.22.7 Benefits to CaliforniaPublic benefits derived from PIER research and development projects are assessed within the following context:
Reduced environmental impacts of the California electricity supply, trans-mission, or distribution system
Increased public safety of the California electricity system
Increased reliability of the California electricity system
Increased affordability of electricity in California
127

The primary benefit to the ratepayer from this research is increased affordability of electricity in California. The researchers proposed to achieve this benefit by increasing the penetration of microturbines into the mix of distributed electrical generation in California. Use of efficient microturbines could lower the overall cost of generating electricity. Projected savings in the cost of electrical generation assumes a market penetration by the new design of 33 percent in California for distributed energy opportunities which would total 1266 MWe. The use of the new design in non-CHP and CHP systems could save ratepayers $230 and $158 million per year, respectively, versus conventional microturbines. The emissions of criteria pollutants (NOx, CO, unburned hydrocarbons) could be reduced or increased depending on the combustor technology used. Lastly, to produce the same power, the new design burns less fuel, resulting in lower greenhouse gas (CO2) emissions. For either the non-CHP or CHP modes the reductions are 1.2 million tons per year.
2.22.8 Overall Technology Transition Assessment2.22.8.1 Marketing/Connection to the Market No new activity was reported.
2.22.8.2 Engineering/TechnicalThe main technical issue that needs to be resolved is to bridge the gap between rather limited experimental data and the finished product which would be the more efficient microturbine.
2.22.8.3 Legal/Contractual None
2.22.8.4 Environmental, Safety, Risk Assessments/ Quality Plans The researchers have not reported progress in this area.
2.22.8.5 Production Readiness/Commercialization
This concept has several steps to go through before becoming commercially viable. Commercialization plans are premature until more technical progress has been made.
2.23 Flexible Hybrid Solar Cell
Awardee: InterPhases Research
Principal Investigators: Dr. Shalini Menezes
2.23.1 AbstractThis project sought to develop organic-inorganic hybrid photovoltaic (PV) technology. The technical approach merged the photovoltaic properties of inorganic copper indium di-selenide (CIS) with the easy manufacturability of organic semiconductors to achieve optimum performance and cost reduction in an inorganic/organic hybrid device. The researchers developed inexpensive solution based approaches to deposit high quality thin film absorber and buffer layers forming n/p hetero junctions on a flexible metal foil substrate. This approach
128

avoided the use of expensive high vacuum steps common in thin film production. The researchers fabricated various hybrid PV devices by coating thin conducting organic polymer layers on the n/p hetero-junctions. Preliminary measurements of PV performance of the first devices demonstrated potential viability of the low cost non-vacuum fabrication technique. The materials and device structure are adaptable to a lightweight, flexible configuration using large area roll-to-roll coating for high volume production. The researcherss forecast a cost reduction from the current on-grid PV electricity cost of $0.25/kWh to about $0.05/kWh for California’s ratepayers.
Keywords: Organic semiconductor, conjugated polymer, photo-electrochemical, electro-deposition, copper indium selenide compounds, hybrid solar cell, flexible solar cell, energy market
2.23.2 IntroductionAn inexpensive photovoltaic (PV) solar module would bring a variety of benefits to the California ratepayer. Benefits include the displacement of carbon based fuels in electrical utilities with renewable sources and reduced production of carbon dioxide. The chief barrier to wider use of PV power generation has been the lack of an inexpensive alternate to the high initial cost of bulk crystalline silicon solar cells used in solar modules. These modules account for 93 percent of the PV market.56 Due to inherent microscopic properties of crystalline silicon, the cells which make up the modules must be relatively thick to absorb incident light and convert it to long lived free electron and hole charge carriers. Because the silicon cells are thick, the material must be very pure to allow the charge carriers to diffuse over large distances without recombining at impurity sites and thus made unavailable for useful electricity conversion. Less expensive thin film PV materials could be de-posited on flexible metal foil substrates and manufactured by low cost, high volume reel-to-reel methods. The formation of high quality thin films usually requires ex-pensive high vacuum processing for their deposition. Manufacture of high perfor-mance thin film PV material by non-vacuum high volume techniques would be a major step towards an inexpensive PV module.
A thin film PV material that could be manufactured by low cost non-vacuum manufacturing steps could bring many advantages. The crystalline silicon PV modules available today have a capacity cost of $3.17 per watt (2003).57 The photovoltaic industry has established a 2010 industry cost goal58 of $1.50 per peak watt for PV modules. This cost would make PV broadly competitive in the residential market without subsidies. These researchers s, however, estimate a total module cost $34 per square meter, or $0.34 per peak watt at 10 percent efficiency. With 15 percent efficiency and higher production, the cost drops below $23 per square meter (equivalent to $0.23 per peak watt). These manufacturing costs could reduce the installed PV system costs to $1 to $1.50 per peak watt for grid tied PV electricity. If these PV system costs were achieved (equivalent to $0.03 to $0.05 per kWh), PV could compete with conventional electricity.
56 http://www.eia.doe.gov/cneaf/solar.renewables/page/rea_data/chapter2.html57 http://www.eia.doe.gov/cneaf/solar.renewables/page/solarreport/solarsov.pdf58 http://www.eere.energy.gov/buildings/building_america/pdfs/db/35206.pdf
129

production such as natural gas fired combined cycle generating plants of $0.052 per kWh59 with an installed capacity cost about $1 per watt.60,61
The advancement of science proposed in this project was to develop a cost competitive PV system. The proposed system would combine the optimum PV properties of the inorganic n-CIS absorber with the easy processing of organic semiconductors to produce a lightweight, flexible, inorganic/organic hybrid PV (IOHPV) device (Figure 29). Solar radiation enters the foil/n-CIS/p-CuISe3/p-organic layer device from the top and passes through several transparent layers to reach the n-CIS absorber. A one step electro deposition of the n-CIS absorber on a flexible metal foil substrate without the use of vacuum was a key development goal. The CuISe3 buffer layer reduces the density of interface states on the n-CIS absorber which trap charge carriers. Electro deposition was followed by solution based inline surface conversion and junction formation step and then coating of the p-polymer window. The p-polymer window has a wide band gap to transmit solar radiation. These fabrication steps are potentially high volume, low cost, low temperature, and environmentally sound practices that can be scaled for mass production.
Figure 29: Schematic of Device
Foil
p-CuISe3
Transparent contact
n-CIS
p-organic
Foil
p-CuISe3
Transparent contact
n-CIS
p-organic
2.23.3 ObjectivesThe goal of this project was to determine the feasibility of combining the optimum PV properties of an n-CIS (copper indium selenide) absorber with easy processing of organic semiconductors to produce a lightweight, flexible, inorganic/organic hybrid PV (IOHPV) device that could be manufactured in high volume for multiple applications.
The researchers established the following project objectives:
1. Demonstrate one step electro deposition of n-CIS-ODC (copper indium se-lenide – ordered defect chalcopyrite) films on a flexible foil. Reduce absorber
59 http://www.energy.ca.gov/electricity/levelized_cost.html60 http://www.cogeneration.net/CombinedCyclePowerPlant.htm61 http://www.energy.ca.gov/distgen/equipment/combustion_turbines/cost.html
130

layer deposition cost by 90 percent from current CIGS (copper indium gal-lium di-selenide) cost.
2. Demonstrate high crystallinity for CIS films without vacuum treatments. En-hance PV output for n-CIS/p-CuISe3 hetero structure to produce open circuit voltage near 300mV and photocurrent ~ 10mA/cm2 at AM1.
3. Develop conjugated polymers as organic windows. Demonstrate p-type pho-toconductivity for the organic polymers. Maximize offset between selected polymer and CIS. Confirm charge transfer from CIS to polymer.
4. Demonstrate IOHPV device with PV output equal to or greater than the n/p hetero structure. Confirm device stability.
2.23.4 Outcomes1. The researchers devised an electro deposition process to produce
compact, uniform, stoichiometric CIS films with high photocurrents in a sin-gle step on various substrates, including flexible stainless steel (SS), etched steel, Mo foil, Mo/glass, and SnO2/glass. They observed good photocurrent results with an electrochemical front side contact. The researchers esti-mated the cost for electro deposition of the absorber at ~$2/m2 while that for the vacuum deposition at $26/m2. They estimated total module cost at $34/m2, or $0.34/Wp at 10 percent efficiency. With 15 percent efficiency and higher production, the cost dropped below $23/m2 ( 23¢/Wp). These cost estimates depended on assumed but not measured efficiency.
2. A non-vacuum rapid thermal processing (RTP) annealing step improved con-trol over the crystallinity, composition, and performance of the CIS absorber layer on foil. The RTP step improved the film crystallinity, increased its re-sistance and PV performance, and maximized its electronic quality and grain size. The researchers constructed photoactive n/p hetero junctions with new p-type buffer materials and used them in combination with an organic win-dow. P-type buffer layers included CuISe3 and CuI. The buffer layers were uniformly coated on the CIS absorber leading to photoactive n/p hetero junc-tions. The experiments revealed a photocurrent of 11 mA/cm2, photovoltage of 310 mV, and low fill factor for the n-CIS/p-CuISe3 hetero junction (at less that AM1 illumination).
3. A series of polymer and small molecule semiconducting materials (P3OT, M3EH-PPV, PEDOT-PSS, copper phthalocyanine, perrylene tetracorboxilic acid dianhydride, and zinc tetraphenylporphyrin) were formulated and spin coated for the organic window. The researchers identified conjugated poly-mer blends (doped polymers) with p-type photoconductivity and maximum offset between polymer and CIS and confirmed charge transfer from CIS to polymer.
4. The researchers fabricated various hybrid PV devices by doping and spin coating conducting polymer window layers on the n-CIS/p-buffer hetero junctions. The IOHPV device output did not increase substantially over the PV output of the n/p hetero structure. Device stability was not reported.
2.23.5 Conclusions1. The researchers met the first objective. The electro deposition process pro-
duced compact, uniform, stoichiometric CIS films with high photocurrents in a single step on various substrates, including flexible stainless steel. This
131

method has promise for low cost reel-to-reel production. There are indica-tions that substrate roughness may be a problem leading to leakage cur-rents.
2. The researchers met the second objective. Non-vacuum rapid thermal pro-cessing (RTP) improved the crystallinity, composition, and performance of the CIS absorber layer on foil. The RTP step also improved film resistance and PV performance, maximizing its electronic quality and grain size. Mea-surements on n-CIS/p-CuISe3 hetero junction suggest that improvement of PV performance is still needed.
3. The researchers partially met the third objective. They successfully formu-lated and spin coated conducting organic windows composed of polymers and small molecule semiconducting materials (doped polymers). They identi-fied conjugated polymer blends with p-type photoconductivity and maximum offset between polymer and CIS and confirmed charge transfer from CIS to polymer. Indications are that resistivity of the window material is still too high. The doping levels achieved with various formulations are not yet suffi-cient to produce p-polymer/organic layers with resistivity lower than 500Ω/cm2. Lower resistivity is needed for the collection of high current from the device.
4. The researchers did not meet this objective. They fabricated various hybrid PV devices by doping and spin coating conducting polymer window layers on the n-CIS/p-buffer hetero junctions. However, the IOHPV device output did not increase substantially over the PV output of the n/p hetero structure. The researchers’ SIMS profiles and light microscope analyses suggest that shunting due to surface roughness of the stainless steel (SS) substrate and diffusion of metal elements to the p/n junction were possible causes of re-duced PV performance. Device stability was not reported.
The stated goal of this project was to “determine the feasibility of combining the optimum PV properties of an n-CIS (copper indium selenide) absorber with easy processing of organic semiconductors to produce a revolutionary lightweight, flexible, inorganic/organic hybrid PV (IOHPV) device that could be manufactured in high volume for multiple applications.” The researchers established individual steps needed to produce a device, such as non-vacuum deposition and conducting polymer windows. However, “optimum PV properties” in the hybrid device still must be demonstrated for applications.
2.23.6 RecommendationsThe Program Administrator had three recommendations:
1. Improve the polish of the stainless steel substrates prior to device fabrica-tion to determine if surface roughness has a deleterious effect on device shunt resistance/leakage currents. If that test shows the problem is instead due to metal diffusion to the p/n junction, thin layer diffusion barriers on the substrate or new substrate materials should be investigated.
2. Investigate new window materials. Plot resistance per square as a function of window thickness for all window materials. This would determine if resis-
132

tance can be lowered significantly by making the conducting window thicker or if the problem is related to the interface.
3. Perform economic analyses that include the total system cost and typical in-stallation. Total system cost should include mounting hardware, inverters and wiring.
2.23.7 Benefits to CaliforniaPublic benefits derived from PIER research and development projects are assessed within the following context:
Reduced environmental impacts of the California electricity supply, trans-mission, or distribution system
Increased public safety of the California electricity system
Increased reliability of the California electricity system
Increased affordability of electricity in California
The primary benefit to the ratepayer from this research is reduced environmental impacts of the California electricity supply or transmission or distribution system. Meeting this project's goals would make solar PV technology available at a cost equivalent to conventional generation on a peak watt basis. The researchers estimated a total module cost of $0.34 per peak watt at 10 percent efficiency. If 15 percent efficiency and higher production were achieved, the cost could drop below $0.23 per peak watt. These manufacturing costs could reduce installed PV system costs to $1 to $1.50 per peak watt for grid-tied PV electricity. These PV system costs, equivalent to $0.03 to $0.05 per kWh, could compete with conventional electricity costs. Electricity from a natural gas fired, combined cycle generating plant costs about $0.052per kWh62 with an installed capacity cost of about $1 per watt.63,64 A PV system with these cost characteristics could displace traditional natural gas fired generation plants with renewable sources and reduced production of carbon dioxide and other controlled pollutants.
A secondary benefit would be increased affordability of electricity in California. The output from PV generators is almost coincident with peak air conditioner demand for electricity. Solar PV distributed generation could reduce the imbalance between peak electric demand and supply in the state. Thus it would reduce the need for new large-scale utility generating plants and transmission lines.
2.23.8 Overall Technology Transition AssessmentAs the basis for this assessment, the Program Administrator reviewed the researchers' overall development effort, which included all activities related to a coordinated development effort, not just the work performed with EISG grant funds.
2.23.8.1 Marketing/Connection to the Market
The researchers have published extensively in this area for the past ten years.
62 http://www.energy.ca.gov/electricity/levelized_cost.html63 http://www.cogeneration.net/CombinedCyclePowerPlant.htm64 http://www.energy.ca.gov/distgen/equipment/combustion_turbines/cost.html
133

2.23.8.2 Engineering/TechnicalOptimum PV properties in the hybrid device were not achieved in this project. There is no information on the researchers' website indicating continuing work in this area.
2.23.8.3 Legal/Contractual The researchers reported that they had obtained two patents and had one in process.
2.23.8.4 Environmental, Safety, Risk Assessments/ Quality Plans Such plans are premature at this stage of development.
2.23.8.5 Production Readiness/Commercialization The researchers must demonstrate adequate efficiency in a laboratory test device before planning for commercialization.
2.24 Development of an Energy Efficient, Ultra-Thin Led Luminaire
Awardee: Lighting Research Center at Rensselaer Polytechnic Institute
Principal Investigators: Nadarajah Narendran
2.24.1 AbstractThis project evaluated the feasibility of an energy saving ultra-thin light emitting diode (LED) luminaire that could effectively replace recessed halogen lighting while achieving significant energy savings. Lighting applications investigated include down lights, wall wash lights, and accent lights. To improve marketability of the product, the researchers additionally sought to achieve an ultra-low profile solution that could be used in ceilings with a reduced plenum or ceiling tile installation. The researchers also sought to increase the usability of this luminaire by designing interchangeable optics that would allow the same luminaire to function effectively in any of the three lighting applications.
The researchers developed performance specifications and then selected and designed components that met those specifications. The target specifications had photometric characteristics similar to those of a 75 watt incandescent down light. This benchmark led to the development of lighting quality specifications for total light output, color rendering index, correlated color temperature, and beam angle. Additional specifications established to improve marketability and energy efficiency included system efficacy, useful life, and total luminaire depth. Although the prototype met nearly all the target specifications, the researchers found that lighting quality and energy efficiency were inversely related. The researchers opted for a more efficient LED that fell short of the lighting quality targets. They justified this decision by noting that rapid developments in LED technology will soon lead to LEDs that can meet both the energy efficiency and lighting quality targets.
Cost analyses and commercialization plans suggest that LED luminaires are a cost effective solution for commercial installations and may soon be cost effective in
134

residential installations. At the conclusion of this project the researchers secured additional funding for design of the multi-functional optics and identification of manufacturing partners to bring the ultra-thin LED luminaire concept to market. Upon completion of these tasks, additional research will be needed to refine the prototype design and to prepare for manufacture of the luminaire. Other design changes may be necessary to capture advances in rapidly developing LED technology.
Keywords: LED, luminaire, down light, accent light, wall wash light, energy efficient lighting
2.24.2 IntroductionThe researchers focused on building end use energy efficiency by developing a prototype light emitting diode (LED) luminaire that could effectively replace a 75 watt incandescent light fixture. In California lighting comprises almost 30 percent of commercial and 18 percent of residential electricity usage during periods of peak demand.65 Nationally incandescent lamps provide the bulk of lighting energy usage, accounting for 90 percent of residential lighting and 32 percent of commercial lighting. Most of the remaining commercial and residential lighting is provided by fluorescent technology. Down lights, accent lights, and wall wash luminaires using halogen or incandescent lamps are found in 60 percent of all commercial office buildings and a much higher percentage of retail and residential applications.66 Although incandescent and halogen lamps have a significant market share, most consumers must overlook the low efficiencies of such lighting since they have few acceptable alternatives.
The researchers proposed an ultra-thin LED luminaire as an effective alternative to an incandescent or halogen lamp. They proposed to focus on the following features:
Installations in ceilings with virtually no plenum depth
Interchangeable optics to provide for down lighting, wall wash lighting, and accent lighting using the same fixture
Seventy percent less energy use than equivalent incandescent and halogen luminaires
Improved overall energy efficiency through reduced ambient cooling loads
Reduced quantity of materials placed in California landfills since LED lamps last 25 times longer than halogen lamps
LED technology is a rapidly growing field that provides significant promise for energy efficient lighting solutions. LEDs are the only technology available today that can compete as a directional light source. Currently there are two approaches to creating white light with LEDs: color mixing of red, green, and blue LED or 65 "UC Davis Adds California Lighting Technology Center," UC Davis (2004). http://www.news.ucdavis.edu/search/news_detail.lasso?id=7074. Accessed December 4, 2007.
66 Energy Information Administration (EIA), 1995 Commercial Buildings Energy Consumption Survey, Department of Energy (Washington, D.C., 1998).
135

phosphor conversion. Red, green, and blue (RGB) LEDs present significant technical challenges relating to color uniformity. Color mixing is approximately 40 percent less efficient than phosphor conversion LEDs. In particular, green LEDs are the most significant drain on the efficiency of the RGB LED system. Although phosphor conversion LEDs exhibit superior energy efficiency to RGB LEDs, they produce a lower quality white light, as measured by a lower color rendering index and higher correlated color temperature than desired. Light quality can be improved by using warm white phosphor conversion LEDs, but the improvement in light quality comes at the expense of energy efficiency. The introduction of the warm white phosphor conversion LED was critical to the development of the proposed technology. As LED technology advances, the energy efficiency of warm white phosphor conversion LEDs is anticipated to improve.
Figure 30: Ultra-Thin LED Luminaire Prototype installed in the Gonio Photometer During Testing
2.24.3 ObjectivesThe goal of this project was to determine the feasibility of an energy efficient, ultra-thin LED based luminaire that would effectively replace down lights, accent lights, and wall wash luminaires that use incandescent and halogen technologies in commercial and residential applications. The researchers established the following project tasks and objectives:
1. Develop luminaire performance specification relating to:
a. Distribution(s)
b. Beam uniformities
c. Color appearance and color rendering
d. Temperature stability
e. Lumen output
f. Efficiency
g. Life/lumen maintenance
h. Maximum allowable cost
2. Create luminaire component design and development with 92 percent effi-ciency, optimum color mixing, and a variety of candlepower distributions and select high flux colored LEDs with potential efficacy exceeding 45 lu-
136

mens per watt (lm/W). Select heat sink material to maintain LEDs at opti-mum operating temperature
3. Integrate and optimize the system so that prototype optics exhibit 92 per-cent optical efficiency and flexible distributions, prototype heat sink main-tains operating temperature of LED modules at optimum junction tempera-ture, electronics maintain driver efficiency of 80 percent or greater, and lu-minaire system efficiency is equal to or greater than 45 lm/W.
4. Conduct bench scale testing, evaluation, and cost analysis so that the system meets all performance specifications developed in Task 1, the projected cost allows for a less than three year payback through energy and maintenance cost savings, and the luminaire can be designed to be less than one inch deep
5. Identify a funding source for further development and demonstration and identify a potential manufacturing partner.
2.24.4 Outcomes
1. The following performance specifications were developed based on the out-put characteristics of a 75 watt incandescent down light:
a. Fourteen LEDs were necessary to achieve the system target light out-put of 650 lumens.
b. Beam uniformities were defined at eight tilt angles.
b. Color appearance and color rendering were to be 80 or higher.
c. Temperature stability was to be 28000K to 32000K.
d. Output should be equal to 650 lumens.
e. Efficiency was to be 45 lm/W.
f. Life/lumen maintenance should be 50,000 hours before light output is 70 percent of initial light output.
g. At the current estimated cost of $425, payback period for a commer-cial installation is five years. A five year payback is possible in a resi-dential setting only if the ultra-thin LED luminaire costs less than $100.
2. The prototype components were designed and tested with the following re-sults:
a. When using both secondary lenses and micro-lenses, efficiencies ranged from 78 to 85 percent for all beam distributions tested. Use of only the secondary lenses resulted in efficiencies ranging from 80 to 88 percent.
b. LED efficacies were 57 lm/W at 65000K (67 general coloring rendering index) and 35 lm/W at 31000K (80 general color rendering index).
c. The researchers conducted experimental and simulation testing to op-timize a heat sink design that would ensure a 50,000 hour LED life, provide adequate room for positioning 14 LEDs, and maximize heat
137

dissipation. Based on the studies, the researchers selected an alu-minum heat sink with a 5.5 inch radius base plate and 90 radial fins. Computer simulation results were validated with actual data. The cor-relation between the model and the data was within 10 percent error.
3. System integration and optimization results were as follows:
a. The prototype optics exhibited 80.3 percent optical efficiency and flex-ible distributions.
b. The prototype heat sink maintained an operating temperature of LED modules at optimum junction temperature.
c. The electronic driver had a dc-to-dc efficiency of 89.7 percent and an estimated ac-to-dc efficiency of 83.4 percent.
d. The researchers selected the more energy efficient cool white LED for the prototype. The selected LED had an efficacy of 57 lm/W.
4. Bench-scale testing, evaluation, and cost analysis yielded the following:
a. The prototype used 14 LEDs were used in the prototype, beam unifor-mity efficiencies ranged from 78 percent to 85 percent at different an-gles, color appearance and color rendering equaled 67, temperature stability equaled 65000 K, lumen output equaled 645 lumens, efficacy equaled 57 lm/W. Life/lumen maintenance equaled 50,000 hours to 70 percent of initial light output and projected cost was $425 per unit.
b. Payback period would be approximately five years for commercial in-stallations and 28 years for residential installations.
c. Luminaire depth was 0.875 inches.
5. The researchers partnered with RPC Photonics, Inc., a company that spe-cializes in micro-lens design, to secure funding from the New York Energy Research and Development Authority to further develop the concept of the ultra-thin LED luminaire for accent lighting. No potential manufacturing partners were identified.
2.24.5 Conclusions1. The researchers met the goal to develop specifications. Although a maxi-
mum allowable cost was not calculated, it would be reasonable to assume a five year payback period. At present, commercial installations can justify the estimated production cost of $425 with a five year payback period. However current component costs make the required $100 per unit cost in a residen-tial setting unattainable assuming the same payback period. The five year payback assumes the LEDs will be totally reliable over that period of time.
2. The researchers did not meet all objectives in luminaire component design, development and/or selection. They did not meet the target optical efficiency of 92 percent, primarily due to the efficiency of the total internal reflection (TIR)-based secondary lenses. Secondary lenses were used to shape the beam to narrower beam angles and to provide color uniformity. Micro-lenses were used to redirect the beam to different angles. The researchers noted that reflectors can provide better efficiency than TIR-based lenses. However, reflectors need to be more than one inch deep to shape the beam ade-
138

quately. The depth requirement for reflectors conflicted with the more criti-cal objective of maintaining a low profile luminaire, resulting in the selection of TIR-based secondary lenses. The researchers attributed the inability to meet the target optical efficiency to secondary optics and identified this defi-ciency as an area in which additional research is needed.
The researchers did not meet the target LED efficacy of 45 lm/W while maintaining color quality specifications. Although this efficacy was met with a higher correlated color temperature and lower color rendering index, the researchers acknowledged that quality of the output light is instrumental to user acceptance of the product. Given the rapid pace of LED innovation, the researchers argued that LEDs will soon be produced that will meet the tar-get efficacy while maintaining light quality standards. The researchers met the objective to select a heat sink material and design that optimized the LED operating temperature for maximum life of 50,000 hours.
139

3. The researchers met the system integration and optimization objectives. It is important to note that the energy efficiency objective was met at the ex-pense of the light quality objectives determined as part of Task 1. Although meeting the target color rendering and correlated color temperature objec-tives was not specifically addressed as an objective during system integra-tion, such a requirement could be implied if the LED prototype was to be an adequate replacement for an incandescent lighting fixture. In the re-searchers’ attempt to maintain or improve the quality of lighting through use of LEDs as a replacement for halogen or incandescent lamps, the Pro-gram Administrator does not believe cool white LEDs would improve or even maintain the quality of light that users have come to expect. The light qual-ity issue will hinder user acceptance of an LED replacement for halogen or incandescent lamps.
4. The researchers did not meet all bench scale testing, evaluation, and cost analysis objectives. They did not meet all performance specifications devel-oped in Task 1. As previously described, the energy efficiency objective was met at the expense of the color rendering index and correlated color temper-ature. The researchers also fell short of the target optic efficiency of 92 per-cent with efficiencies ranging from 78 to 88 percent. The luminaire light out-put of 645 lumens was only slightly lower than the targeted 650 lumens and would not justify the addition of another LED.
The calculated payback period of 5 years for a commercial installation and 28 years for a residential installation did not meet the target 3 year payback period. The researchers suggested that the payback period could be reduced to three years through high volume manufacturing. Because the researchers used bulk wholesale component pricing to derive the total LED luminaire cost of $450, the Program Administrator assumed the researchers expected high volume manufacturing to result in significant cost savings during prod-uct assembly rather than additional component cost savings. This assumed reduction is not described or justified. The researchers met the luminaire depth objective.
5. The researchers did not meet the commercialization plan development ob-jectives. They identified a need for further development of the luminaire op-tics that will require additional funding. Additional research will focus on de-veloping an efficient holographic micro-lens that could provide a light distri-bution that is tilted from vertical for accent lighting. Selection of a manufac-turing partner was deferred as part of the scope for additional funding.
2.24.6 RecommendationsLED lighting technology shows great promise to improve energy efficiency and decrease landfill burdens. The researchers proved feasibility of an ultra-thin LED luminaire and with few exceptions met the target objectives. The Program Administrator was confident the gap between objectives and outcomes for those exceptions would narrow quickly as LED technology improved. The Program Administrator recommended the following tasks be included in additional research leading toward manufacture of ultra-thin LED luminaires:
1. Perform a thorough state-of-the-art assessment of current research in the area of residential and commercial white light LED luminaires to ensure that proposed follow-on research is not duplicative or presently in progress.
140

2. Repeat the LED optimization and selection task to evaluate any recent en-trants to the LED market since the research was conducted. Particular at-tention should be given to identifying an LED with increased efficiency and decreased cost.
3. Consider assembly approaches that would allow for replacement of LEDs within the luminaire. Conduct additional research to develop efficient micro-lenses for use in accent lighting. This is the primary focus of the additional funding secured by the researchers.
4. Perform market research to determine reasonable expectations for market penetration and user acceptance.
5. Investigate alternate finishes that might make the design more appealing to end users in a variety of décor applications. Determine the impact of finish modifications on the target specifications.
6. Investigate alternate configurations that might replace standard sized ceil-ing tiles entirely (i.e. 1 foot by 1 foot or 2 feet by 2 feet) in a flush mounted configuration similar to fluorescent applications in offices and classrooms.
After taking into consideration (a) research findings in the grant project, (b) overall development status, and (c) relevance of the technology to California and the PIER program, the Program Administrator has determined that the proposed technology should be considered for subsequent funding within the PIER program.
Receiving subsequent funding ultimately depends upon (a) availability of funds, (b) submission of a proposal in response to an invitation or solicitation, and (c) successful evaluation of the proposal
2.24.7 Benefits to CaliforniaPublic benefits derived from PIER research and development projects are assessed within the following context:
Reduced environmental impacts of the California electricity supply, trans-mission, or distribution system
Increased public safety of the California electricity system
Increased reliability of the California electricity system
Increased affordability of electricity in California
The primary benefit to the ratepayer from this research is increased affordability of electricity in California. Assuming an 11 percent market penetration, the researchers estimated a yearly energy savings of 1.2 billion kWh in residential and 1.8 billion kWh in commercial lighting energy. This translates to an annual savings of $144 million and $270 million for the residential and commercial sectors, respectively. These savings will not accrue until the LED luminaire is available in the market at an acceptable price.
2.24.8 Overall Technology Transition AssessmentAs the basis for this assessment, the Program Administrator reviewed the researchers’ overall development effort, which includes all activities related to a coordinated development effort, not just the work performed with EISG grant funds.
141

2.24.8.1 Marketing/Connection to the Market The researchers do not have the capacity to commercialize products and plans to partner with a luminaire manufacturer. The researchers identified a need for this product but have performed very limited market analysis and have not yet developed a marketing plan. They have not yet identified products similar to the proposed technology, particularly with regard to the ultra-thin form.
2.24.8.2 Engineering/TechnicalNone identified.
2.24.8.3 Legal/Contractual The researchers had not yet performed a patent search nor pursued a patent for the technology.2.24.8.4 Environmental, Safety, Risk Assessments/ Quality Plans Because of technology immaturity, plans these have not been developed.
2.24.8.5 Production Readiness/Commercialization The researchers have not yet developed a commercialization plan, but have identified manufacturing costs as a significant commercialization risk.
2.25 A Simple and Reliable FACTS Elements for Distributed Generation
Awardee: Power Electronics Laboratory University of California, Irvine
Principal Investigators: Keyue Smedley
2.25.1 AbstractImproving the electrical performance of distributed generation technologies connected to the grid is just as important as improving the efficiency of individual units. In this project researchers tested a three phase one cycle control automatic power filter and VAR generator capable of 3.7 kVAR reactive power generation with a leading or lagging phase for a 208 volt (rms) power line. They demonstrated a measured energy efficiency of approximately 97 percent. The system reduced line current harmonic distortion from 28 percent to 3.9 percent at full power while processing two kVA real power and 3.7 kVAR reactive power. Dynamic transients with less than 10 percent over or undershoot were demonstrated during load step change. Zero over or undershoot was demonstrated for reactive current command step change. The researchers proved feasibility of his innovation.
Keywords: Energy system integration, one cycle control (OCC), VAR, reactive power generation, VAR compensation, STATCON, voltage support, power flow control, APF, active power filter, power quality control
2.25.2 IntroductionDistributed energy is a preferred technology in California. Many distributed generation technologies such as fuel cells and photovoltaics, while very efficient, have associated issues with connecting to the grid because of power quality problems (e.g. harmonic distortions) caused by associated equipment, including inverters and controllers, and with reactive power considerations.
142

Improving reactive power, measured in VARS, and power quality is key to the expanded use of distributed technologies while maintain and improving overall grid stability. Improving the electrical performance to allow seamless integration with the grid is critical to making distributed generation technologies more than just a niche application and enabling broad acceptance by consumers and grid operators alike.
In this project researchers tested a three phase one cycle controller capable of 3.7 kVAR reactive power generation with a leading or lagging phase for a 208 volt power line, with a measured energy efficiency of approximately 97 percent. This system reduced line current harmonic distortion from 28 percent to 3.9 percent at full power while processing two kVA real power and 3.7 kVAR reactive power. Moreover, a smooth and stable dynamic transition with less than 10 percent over or undershoot and zero over or undershoot was demonstrated during load step change and reactive current command step change, respectively.
2.25.3 ObjectivesThe goal of this project was to determine the feasibility of improving electric transmission and power quality for distributed generation applications using a combined active power filter for power quality purposes with a VAR generator for reactive power purposes and grid stability. The researchers established the following objectives:
1. Verify that a three phase converter with one cycle control [OCC] is able to generate reactive current and eliminate harmonics.
2. Demonstrate AC voltage of 208 volt (rms). This objective was reduced from the original project goal of 1000 volts due to laboratory safety concerns.
3. Demonstrate efficiency of greater than 90 percent.
4. Demonstrate one kVAR reactive current generation.
5. The prototype should reduce the THD [total harmonic distortion] from 30 percent to 5 percent for a two kVA load.
6. The OCC APF-VAR should have very fast, smooth, and stable transient re-sponse to VAR command change and load transient.
2.25.4 Outcomes1. The researchers demonstrated that the device generated 3.7 kVAR reactive
power and eliminated harmonics for a nonlinear load of two kilowatts, re-ducing total harmonic distortion from 28 percent to 3.9 percent at full load.
2. The researchers demonstrated 208 Volts (rms) power line connection.
3. The researchers measured energy efficiency of 97 percent.
4. The researchers demonstrated reactive power generation of 3.7 kVAR.
5. The researchers reduced harmonic distortion from 28 percent to 3.9 per-cent for a 2 kVA load, while processing 3.7 kVAR reactive power.
6. The researchers measured transient response to VAR command change with no over or undershoot and to load transient with less than 10 percent over or undershoot, with a response time within one quarter cycle, and oper-ating stably from zero load to full load and from zero VAR to full VAR.
143
2.25.5 ConclusionsThe researchers demonstrated that the device is capable of generating 3.7 kVAR reactive power with leading or lagging phase for a 208 volt (rms) power line with a measured energy efficiency of approximately 97 percent. It reduced line current THD from 28 percent to 3.9 percent at full power while processing 2 kVA real power and 3.7 kVAR reactive power. Moreover fast, smooth, and stable dynamic transient with less than 10 percent over or undershoot was witnessed during load step change and zero over or undershoot during reactive current command step change.
The OCC AFP-VAR is suitable for power system voltage support, reactive reserve, power flow control, harmonic suppression, and reactive power compensation. The researchers demonstrated the feasibility of improving electric transmission and power quality for distributed generation applications using the device.
2.25.6 RecommendationsThe researchers should test and validate the device’s performance at higher operating voltage of at least 1000 volts. They should demonstrate performance in a pilot demonstration(s) using various distributed generation technologies connected to the grid or a reasonable facsimile of the grid. The researchers or their licensing partners should test the device to failure to establish safe operating parameters. The researchers should develop a manufacturing scheme along with appropriate safety and underwriting standards.
After taking into consideration (a) research findings in the grant project, (b) overall development status, and (c) relevance of the technology to California and the PIER program, the Program Administrator has determined that the proposed technology should be considered for subsequent funding within the PIER program.
Receiving subsequent funding ultimately depends upon (a) availability of funds, (b) submission of a proposal in response to an invitation or solicitation, and (c) successful evaluation of the proposal.
2.25.7 Benefits to CaliforniaPublic benefits derived from PIER research and development projects are assessed within the following context:
Reduced environmental impacts of the California electricity supply, trans-mission, or distribution system
Increased public safety of the California electricity system
Increased reliability of the California electricity system
Increased affordability of electricity in California
The primary benefit to the ratepayer from this research is from reduced environmental impacts of the California electricity supply system. Increased reliability of the California electricity system is a secondary benefit. The expanded deployment of distributed generation technologies can reduce environmental impacts, primarily due to the technologies’ superior energy efficiency and location at the point of use. Quantification of those benefits, however, is speculative and dependent on the exact mix of distributed technologies ultimately chosen by diverse customer types.
144

2.25.8 Overall Technology Transition AssessmentAs the basis for this assessment, the Program Administrator reviewed the researchers’ overall development effort, which includes all activities related to a coordinated development effort, not just the work performed with EISG grant funds.
2.25.8.1 Marketing/Connection to the Market The researchers s have partnered with One-Cycle Control, Inc., which has licensed the technology and patents. The researchers, in collaboration with One-Cycle Control, should also collaborate or otherwise cooperate with electric utility(s) to demonstrate the technology in real world application and ensure ready acceptance. Presentation of research results to technical societies such as the Society of Electrical and Electronic Engineers and their trade journal would greatly accelerate market acceptance.
2.25.8.2 Engineering/TechnicalNo additional information is available on engineering advances beyond the scope of this project.
2.25.8.3 Legal/Contractual The researchers have applied for and been granted patent numbers 6297980 and 6545887 which are held by the University of California. Other patents are pending. License agreements have been signed with One-Cycle Control, Inc.
2.25.8.4 Environmental, Safety, Risk Assessments/ Quality Plans Safety issues associated with high voltage devices need to be addressed, although this is typical for any such device being connected to the grid. Safety plans should be developed and include design and manufacturing requirements and operator and technicians protocols.
2.25.8.5 Production Readiness/Commercialization The device appears ready for production and commercialization once the engineering/technical and safety issues noted above are completed.
145