studying the plant-rhizobia mutualism in the classroom – a guided inquiry activity
TRANSCRIPT

Studying the plant-rhizobia mutualism in the classroom – a guided inquiry activity

Outline
• Brief background– Scientific methods– Study system
• Designing your experiment– Control– Replication– Randomization

Observation
Background Research
Hypothesis/Predictions
Experiment
Data analysis
Not consistent with hypothesis
Consistent with
hypothesis
Scientific Methods
Question
Conclusion
Answer?
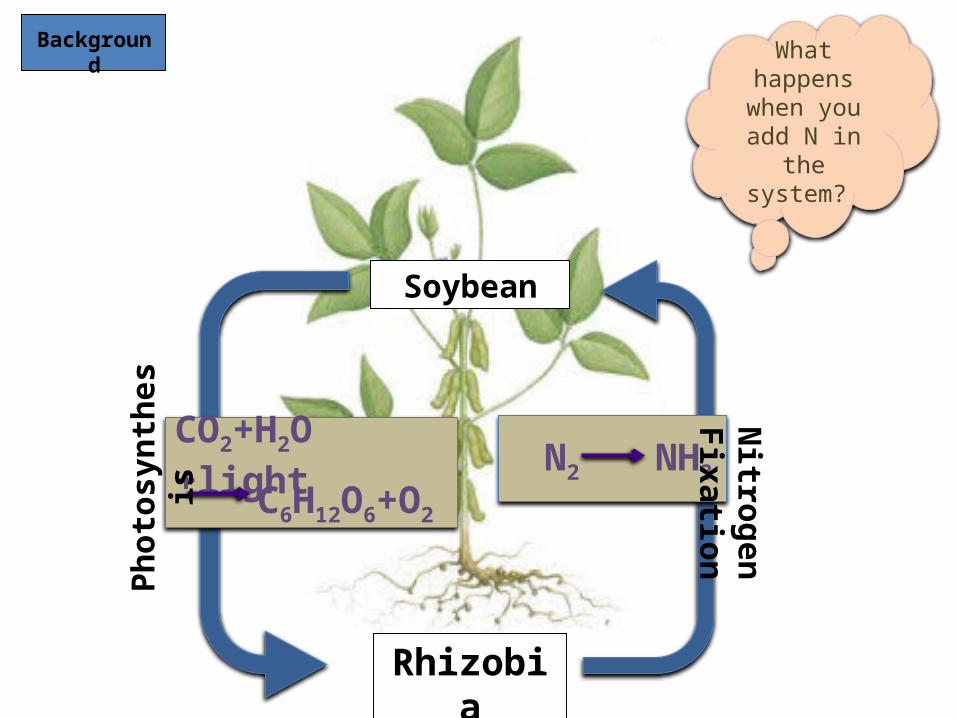
Soybean
Rhizobia
CO2+H2O +light C6H12O6+O2
N2 NH3
Phot
osyn
thes
is N
itrogen Fixation
What happens when you add
N in the system?
Background

Fertilizer in agriculture
“….addition of N fertilizer can lead to lower production of nodules in legumes (Rubio Arias et al. 1999; Vargas, Mendes &Hungeria 2000) as well as lower N2fixation rates per nodule (Denison & Harter 1995).”
Background

Scientific Questions:
1) How do rhizobia affect plant growth?
2)How does nitrogen fertilization affect plant-rhizobia interaction?
Questions
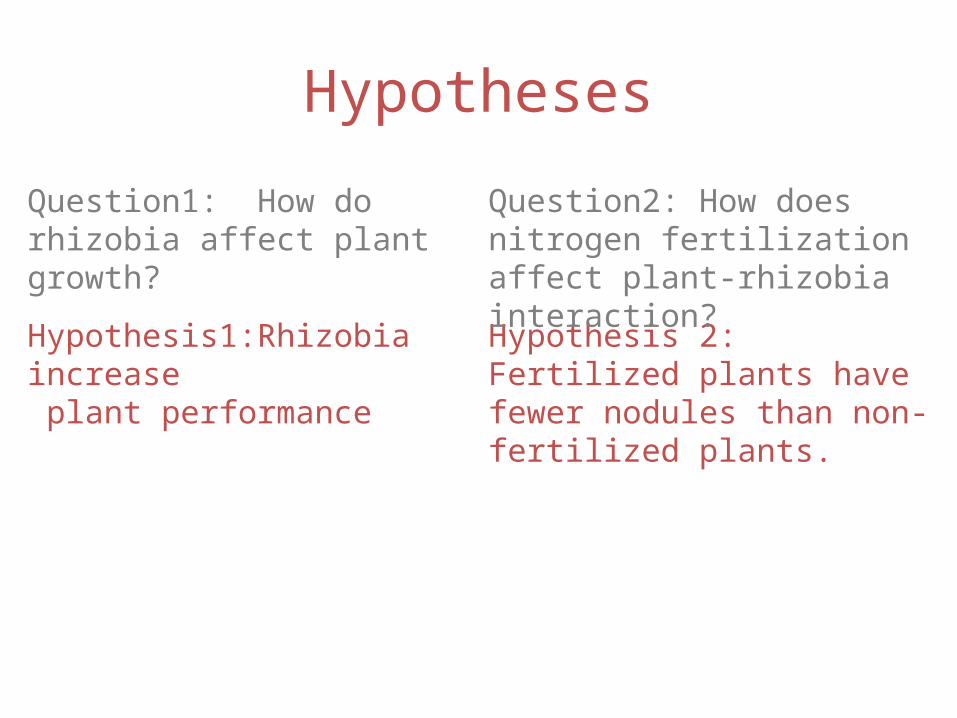
Hypotheses
Question1: How do rhizobia affect plant growth?
Hypothesis1:Rhizobia increase plant performance
Hypothesis 2: Fertilized plants have fewer nodules than non-fertilized plants.
Question2: How does nitrogen fertilization affect plant-rhizobia interaction?

Predictions
Question1: How do rhizobia affect plant growth?
Hypothesis1:Rhizobia increase plant performance
Hypothesis 2: Fertilized plants have fewer nodules than non-fertilized plants.
Question2: How does nitrogen fertilization affect plant-rhizobia interaction?
Prediction 1: Rhizobia inoculated plants will have greater biomass than non-inoculated plants
Prediction 2: fertilized plants will have fewer nodules than non-fertilized plants.

1) How do rhizobia affect plant growth?How can we test it?
The control and experimental groups must be identical in all relevant ways except for the introduction of a suspected causal agent into the experimental group.
+
Control Treatment 1
+
Treatment2
Experiment

Experimental Design
• Control• Replication• Randomization

+ +
Replication
Repetition of a experiment to test the validity of its conclusion + +
+ +
+ +
+ +
Experiment

Randomization
-Assign treatment randomly to an experimental group
-Eliminate researchers’ bias or judgment + +
++ +
+
+ +
+ +
Experiment

Prediction
Control Rhiz (+) Nitrogen (+)
Plan
t Size
???
+ +
Plot a prediction graph on your worksheet
Prediction

2) How does nitrogen fertilization affect plant-rhizobia interaction?
+ ++
Experiment

Predictions:
N (-) N (+)
Plan
t Size
N (-) N (+)
# N
odul
es
Plot prediction graphs on your worksheet
Predictions

Experimental DesignCombining Experiment 1&2
n = 10
n = 10
n = 10
n = 10
Each group: 4 treatments x 2 rep = 8 samples Class total = 40
Question 1
Question 2
Experiment

After 1 month….
Record: - Plant height (cm)- Number of leaves- Number of nodules- Aboveground biomass- Belowground biomass
3) Plot graphs using the class data