studying the complex bal profiles of si iv in 21 hibalqso ... · studying the complex bal profiles...
TRANSCRIPT

Studying the complex BAL profiles of Si IV in 21 HiBALQSO spectra
D. Stathopoulos, E. Danezis1, E. Lyratzi, L.C. Popovic, A. Antoniou, M. Dimitrijevic, D. Tzimeas

Spectral Classification of BALQSOs
➢ High-ionization BALs (HiBALs) contain strong, broad absorption high-ionization lines such as C IV, Si IV, N V, Lyα
➢Low ionization BALQSOs (LoBALs) contain HiBAL features but also haveabsorption from low-ionization lines such as Mg II.
➢ FeloBALQSOs LoBALs with excited-state Fe II or Fe III absorption
Reichard et al. 2003
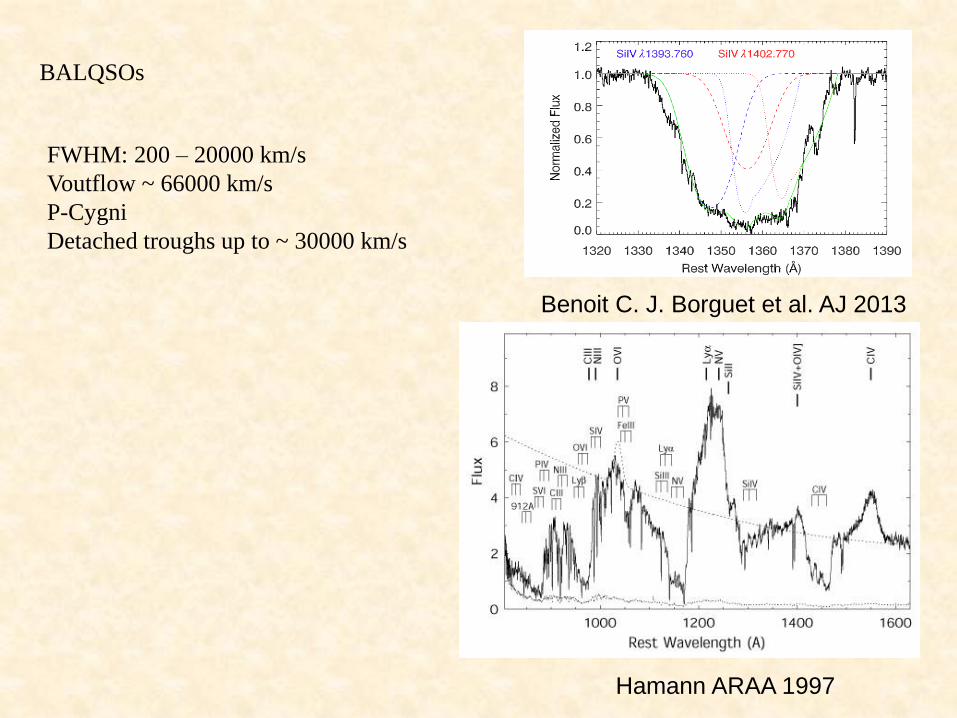
BALQSOs
Benoit C. J. Borguet et al. AJ 2013
Hamann ARAA 1997
FWHM: 200 – 20000 km/s
Voutflow ~ 66000 km/s
P-Cygni
Detached troughs up to ~ 30000 km/s

BALQSO with NALs
E. Y. Vilkoviskij and M. J. Irwin, MNRAS 2001
NALs
FWHM < 200 – 300 km/s
Si IVC IV
narrow lines far from the
emission redshift (za << ze) and
narrow associated lines near the
emission redshift (za ≈ ze).
Narrow lines (za << ze) which
are due to gas clouds unrelated
to the quasar that coincidentally
fall along our line of sight to the
quasar. On the other hand (za ≈
ze) systems could be either
intervening or intrinsic.
Mini - BALs
However there are absorption lines with intermediate widths
(FWHM ~ 300 – 2000 km/s, Hamann & Sabra 2004) which are
called mini-BALs and are as common as BALs (Rodriguez et al.
2011).

# SDSS Object Redshift MJD-Plate-Fiber
1 J023252.80-001351.2 2.025 51820-0407-158
2 J015024.44+004432.9 1.990 51793-0402-485
3 J031828.91-001523.2 1.990 51929-0413-170
4 J001502.26+001212.4 2.857 51795-0389-465
5 J001025.90+005447.6 2.845 51795-0389-332
6 J003551.98+005726.4 1.905 51793-0392-449
7 J015048.83+004126.2 3.703 51793-0402-505
8 J004041.39-005537.3 2.092 51794-0393-298
9 J004732.73+002111.3 2.879 51794-0393-588
10 J005419.99+002727.9 2.522 51876-0394-514
11 J010336.40-005508.7 2.442 51816-0396-297
12 J000103.85-104630.2 2.081 52143-650-133
13 J102517.58+003422.0 1.888 51941-0272-501
14 J004323.43-001552.4 2.806 51794-0393-181
15 J104109.86+001051.8 2.259 51913-0274-482
16 J110041.20+003631.9 2.017 51908-0277-437
17 J000056.89-010409.7 2.111 51791-0387-098
18 J001438.28-010750.1 1.813 51795-0389-211
19 J023908.99-002121.4 3.777 51821-0408-179
20 J104841.03+000042.8 2.022 51909-0276-310
21 J000913.77-095754.5 2.076 52141-651-519
Data

In this work we use the Danezis et al. model (Danezis et al. 2003, 2007 and
Lyratzi et al. 2007) in order to analyze the Si IV absorption troughs.
Fitting
1. Identification of lines. Searching for possible blends.
2. Fitting the continuum (using a power law with spectral indices derived by Trump et al. 2006) .
3. Identification of troughs in the Si IV spectral region: Multiple troughs, detached troughs.
Checking the appropriate distribution among, Gauss, Lorentz, Voigt, Rotation (Danezis et al.
2003) and Gauss – Rotation (Danezis et al. 2006, 2007). In this study performing x2 tests, we
found that the best fit is achieved by using the Gauss distribution.
4. We observed two types of absorption troughs. In the first case the absorption trough is fitted
using only one Si IV doublet, which is created by an individual absorbing region (cloud).
However, in the second case we have troughs which cannot be simulated adequately using only
one Si IV doublet but are fitted by using more than one doublet. In this situation the absorption
trough is produced by more than one cloud.
5. As for the number of doublets, in the trough, we increase them until a standard F – test yields no
further significant gain (95% confidence level) in the goodness of the fit, as measured by the
reduced x2 .
Model and Spectral Fitting

6. During the fitting process we require that for a given trough the Si IV resonance lines
should have almost the same width and the same outflow velocity. The width (FWHM)
and central positions (Voutflow) of the two Gaussians have been fit simultaneously to
reproduce the Si IV absorption troughs.
7. As for the ratio of optical depths between the blue and the red component of a doublet,
according to theory it is ~ 2:1 (Borguet et al. 2013, Arav et al. 2001). So, by relaxing the
constraint of optical depth between the doublet lines, we perform repeated fits and
compare the results by x2 test, in order to conclude to the best fit.
8. The whole Si IV absorbing region comprises of one or more absorption doublets. This
means that the whole Si IV absorbing region is created by more than one discrete cloud. If
we want to fit the whole Si IV spectral region we need to solve the radiative transfer
equation for a complex atmosphere that contains more than one discrete cloud.
9. We use an interpolation polynomial which includes the line functions of every individual
line (Danezis et al., 2003, 2007; Lyratzi et al., 2007).
10. From this interpolation polynomial, in this current analysis we calculate the outflow
velocity (Voutflow), the random velocities (Vrand), the optical depth (τ), the full width at half
maximum (FWHM) and the equivalent width (EW) of each individual blue and red
component of a doublet.
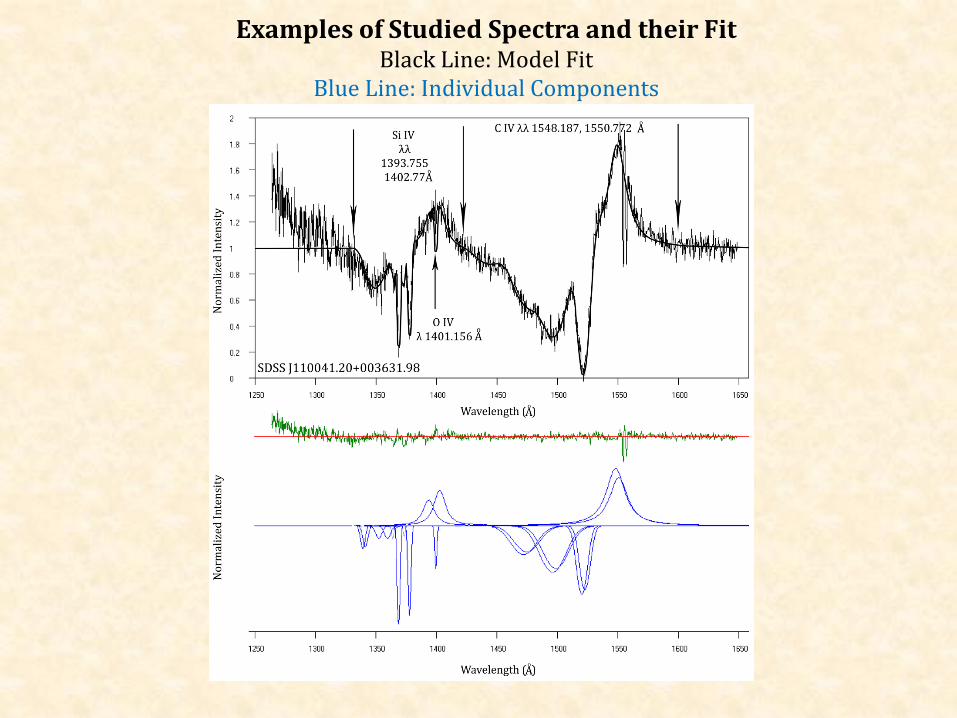
Examples of Studied Spectra and their FitBlack Line: Model Fit
Blue Line: Individual Components
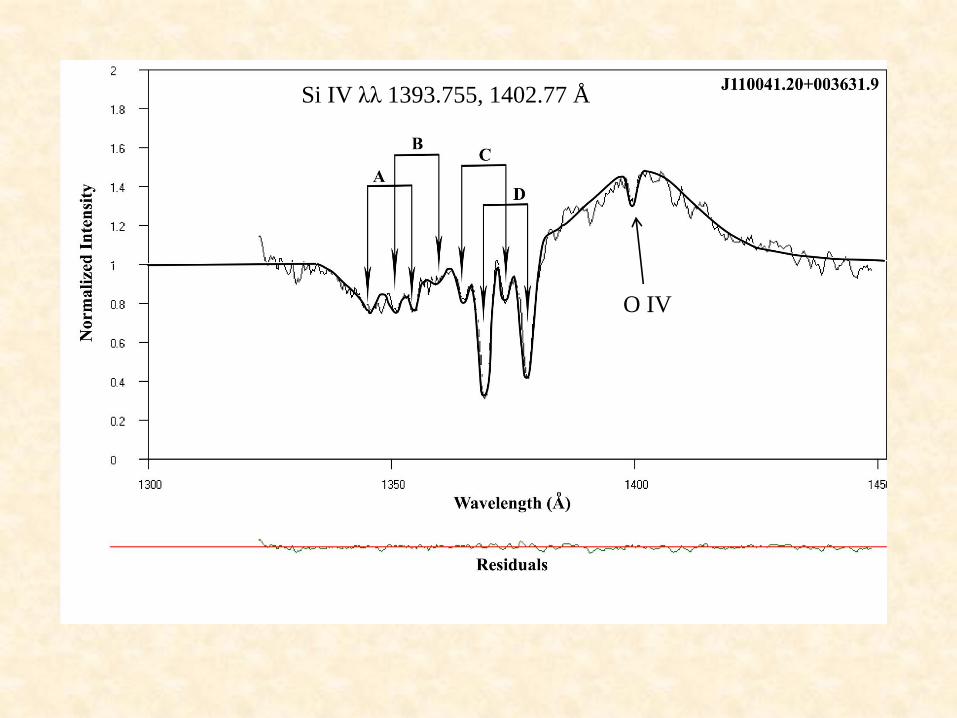
Si IV λλ 1393.755, 1402.77 Å
O IV

Si IV λλ 1393.755, 1402.77 Å
O IV

# SDSS Name
Vrad1
(km/s)
Vrad2
(km/s)
Vrad3
(km/s)
Vrad4
(km/s)
Vrad5
(km/s)
1 J000103.85-104630.2 7959 15487 24091
2J004323.43-001552.4 9034 17208
3J023908.99-002121.42 8819 17208
4J001502.26+001212.4 9034 16778
5J031828.91-001523.17 6883 14627
6J010336.40-005508.7 3657 13551
7J110041.20+003631.98 5377 10325
8J104841.03+000042.81 6023 10217
9 J001025.90+005447.6 9464
10 J004732.73+002111.3 4087 9034
11J004041.39-005537.3 9034
12 102517.58+003422.17 8604
13J104109.86+001051.76 2151 8174
14J023252.80-001351.17 8174
15 J005419.99+002727.9 7744
16J003551.98+005726.4 4409 6668
17J000056.89-010409.7 2581 6238
18J015048.83+004126.29 3656
19J000913.77-095754.5 4732
20J001438.28-010750.1 3226
21J015024.44+004432.99 2796
In this study we calculated for
every one of the 21 HiBALQSOs
the following parameters:
• outflow velocities (Voutflow),
• random velocities (Vrand),
•apparent optical depth (τ),
•full width at half maximum
(FWHM)
•equivalent width (EW)
of each individual blue and red
component of a doublet.
We classify the calculated outflow
velocities in five classes.
Results
In our study we identified up to five Si IV
absorbing clouds.
One HiBALQSO has three clouds,
Eleven HiBALQSOs have two clouds
Nine HiBALQSOs have one cloud.

Class <Voutflow>
(km/s)
<Vrandom>
(km/s)
<FWHM>
(km/s)
<τapp> <EW>
(Å)
1 24090 ± 0 2280 ± 0 4190 ± 0 0.1 ± 0.0 2.4 ± 0.0
2 14430 ± 2865 1550 ± 350 3040 ± 213 0.2 ± 0.1 2.3 ± 0.3
3 8640 ± 551 1630 ± 320 2820 ± 225 0.3 ± 0.2 2.6 ± 0.3
4 6110 ± 610 1430 ± 290 1190 ± 107 0.6 ± 0.2 2.5 ± 0.3
5 3460 ± 921 420 ± 90 960 ± 48 1.2 ± 0.3 3.1 ± 0.4
Based on this classification we also classify the random velocities
(Vrand), the FWHM, the apparent optical depth (τapparent) and the
equivalent width (EW).
DISCUSSION AND CONCLUSIONS
Blended Doublets: By deblending them we calculated the apparent optical depths ofthe blue and red component of each doublet. The ratio τb/τr ≠ 2. In fact it ranges from1.1 – 1.3. Non – Black Saturation.
➢ Non black saturation is an indication of partial coverage of the background source by
the absorbing clouds. This phenomenon occurs when the absorbing clouds are smaller
than the background source, allowing part of the light from the source to reach the
observer unabsorbed. This effect also indicates that all absorption lines are intrinsic to
the QSO.
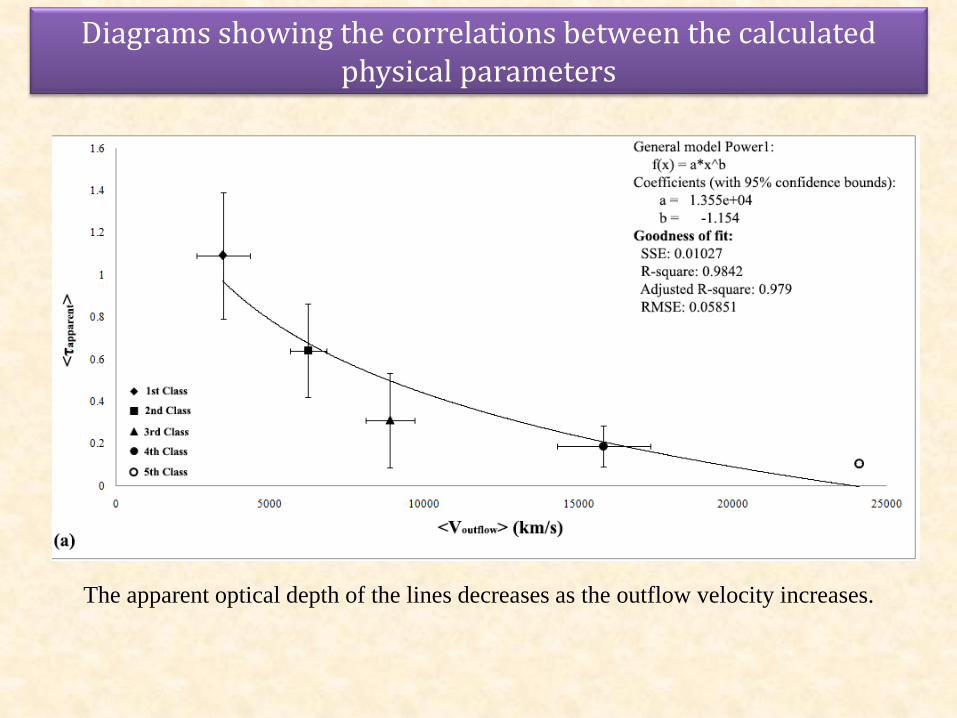
Diagrams showing the correlations between the calculated physical parameters
The apparent optical depth of the lines decreases as the outflow velocity increases.

Possible Explanations
1. As the clouds accelerate outwards its typical density will decrease which can explain why the
optical depths decrease as the outflow velocity increases. According to this picture it seems that
absorption is stronger at lower velocity. This picture is supported by Fig. 1c which shows the
equivalent width of resonance lines decreases with increasing outflow velocity.
2. However, we cannot be sure that this is the real case because the decrease in the apparent optical
depths can be due to a decrease in the covering fraction. So, in order to conclude we need to
calculate the true optical depths as well as the covering fractions.
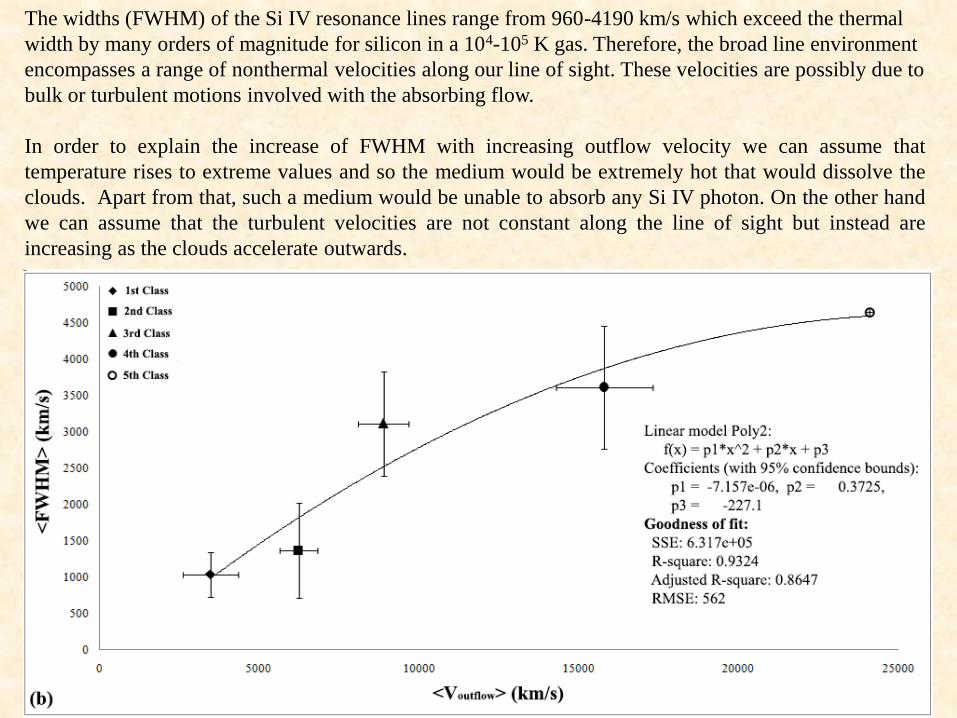
The widths (FWHM) of the Si IV resonance lines range from 960-4190 km/s which exceed the thermal
width by many orders of magnitude for silicon in a 104-105 K gas. Therefore, the broad line environment
encompasses a range of nonthermal velocities along our line of sight. These velocities are possibly due to
bulk or turbulent motions involved with the absorbing flow.
In order to explain the increase of FWHM with increasing outflow velocity we can assume that
temperature rises to extreme values and so the medium would be extremely hot that would dissolve the
clouds. Apart from that, such a medium would be unable to absorb any Si IV photon. On the other hand
we can assume that the turbulent velocities are not constant along the line of sight but instead are
increasing as the clouds accelerate outwards.

Figure 1d indicates that lines with high FWHM (higher FWHM corresponds to higher outflow velocity
according to Fig. 1b) have low values of optical depths. This means that absorption lines at high outflow
velocities tend to be broader but shallower. Whether this is an evolutionary effect of clouds or a
geometrical effect (due to changes in the covering factor) or a combination needs to be checked in order
to reach to conclusions using time variability of independent HiBALQSOs and calculations of the
covering fractions.

Future Work
1.The study of a greater sample of HiBALQSOs
2.Calculation of all the previously mentioned physical parameters in the case
of one more spectral line (Lyα, N V)
3. Calculate the true optical depths, the covering fractions and the apparent
and true column densities for comparisons.
4. Investigate whether clouds cover the continuum source, or the Broad
Emission Line Region or both.
Acknowledgments
This research project is progressing at the University of Athens, Department of Astrophysics,
Astronomy and Mechanics, under the financial support of the Ted and Erica Spyropoulos
Foundation and the Special Account for Research Grants, which we thank very much. Finally, we
would like to thank Prof. Jack Sulentic and Prof. Paola Marziani for kindly providing us with
both VLT BALQSO spectra as well as for their useful and detailed comments on our work.

Thank you very much!