study unit 1 - gimmenotes.co.za · web viewoperational definitions minimise measurement erros and...
TRANSCRIPT
1
Table of Contents
STUDY UNIT 1..........................................................................................................................5
SCIENCE AND RESEARCH.....................................................................................................5
1.1 INTRODUCTION.........................................................................................................................................................51.2. OBJECTIVES.......................................................................................................................................................51.2.1 DESCRIBE SCIENTIFIC APPROACH TO RESEARCH.....................................................................................51.2.2 IDENTIFY FIVE SOURCES OF KNOWLEDGE....................................................................................................51.2.3 FIVE EXAMPLES OF FIVE TYPES OF ERROR IN HUMAN INQUIRY............................................................51.2.4 IMPORTANCE OF FIVE SCIENTIFIC NORMS....................................................................................................61.2.5 SIX CHARACTERISTICS OF THE SCIENTIFIC METHOD................................................................................6
STUDY UNIT 2..........................................................................................................................7
STRATEGIES OF DISCOVERY..............................................................................................7
1 GENOGRAM OF STUDY UNIT 2...........................................................................................................................72.1 INTRODUCTION..................................................................................................................................................82.2 PHILOSOPHICAL GROUNDING OF RESEARCH.............................................................................................82.2.1 KEY ISSUES = ASSUMPTIONS................................................................................................................................82.2.1.1. ONTOLOGY = BRANCH OF PHILOSOPHY DEALING WITH NATURE OF REALITY........................................82.2.1.2. EPISTEMOLOGY = BRANCH OF PHILOSOPHY DEALS WITH NATURE OF KNOWLEDGE...........................92.2.1.3. METHODOLOGY = RULES AND PROCEDURES OF RESEARCH WORK.......................................................................92.2.1.4. APPROACHES..........................................................................................................................................................92.2.2. POSITIVIST APPROACH................................................................................................................................................92.2.3 INTERPRETIVE APPROACH...........................................................................................................................................92.2.4 CRITICAL APPROACH...................................................................................................................................................92.2.5 CONTEMPORARY METHODOLOGICAL CHALLENGES..................................................................................................102.2.5.1 FEMINIST RESEARCH...............................................................................................................................................102.2.5.2 POSTMODERN RESEARCH.......................................................................................................................................102.6 CONCLUDING REMARKS................................................................................................................................................102.3 THEORETICAL GROUNDING OF RESEARCH...............................................................................................112.3.1 DEFINING THEORY......................................................................................................................................................112.3.2 THEORY AS A CONCEPTUAL FRAMEWORK.................................................................................................................112.3.3 PROVIDING THEORETICAL EXPLANATIONS.................................................................................................................112.3.4 SCOPE AND LEVEL OF THEORY.................................................................................................................................122.3.5 RECONSIDERING THE RELATIONSHIP BETWEEN THEORY AND RESEARCH...............................................................132.3.6 CONCLUDING REMARKS.............................................................................................................................................13

2
2.4 CONCEPTUAL GROUNDING OF THEORY.....................................................................................................142.4.1 DECIDING ON A TOPIC TO RESEARCH.......................................................................................................................142.4.2 CONDUCTING A LITERATURE REVIEW........................................................................................................................152.4.3 SPECIFYING A RESEARCH QUESTIONS......................................................................................................................152.4.4 FRAMING AN HYPOTHESES.........................................................................................................................................162.4.5 OPERATIONALISING CONCEPTS.................................................................................................................................162.4.6 CONCLUDING REMARKS............................................................................................................................................172.5 CONCLUSION.....................................................................................................................................................17
STUDY UNIT 3........................................................................................................................18
TYPES OF RESEARCH..........................................................................................................18
3.1 INTRODUCTION.......................................................................................................................................................183.2 FOR WHAT RESEARCH IS USED..............................................................................................................................183.2.1 BASIC RESEARCH.......................................................................................................................................................183.2.2. APPLIED RESEARCH.................................................................................................................................................193.2.2.1. ACTION RESEARCH.................................................................................................................................................193.2.2.2. SOCIAL IMPACT RESEARCH....................................................................................................................................193.2.2.3. EVALUATION RESEARCH.........................................................................................................................................203.3 APPROACHES ON WHICH SOCIAL SCIENTIFIC RESEARCH IS BASED.........................................................................203.3.1 QUANTITATIVE RESEARCH (OBJECT = RESPONDENT)......................................................................................203.3.2 QUALITATIVE RESEARCH (OBJECT = SUBJECT).................................................................................................203.3.3 MULTIPLE RESEARCH OR TRIANGULATION...................................................................................................213.4 WHAT THESE TYPES OF RESEARCH AIM AT...........................................................................................................223.5 TIME DIMENSION IN RESEARCH.............................................................................................................................22
STUDY UNIT 4........................................................................................................................24
ETHICS IN RESEARCH..........................................................................................................24
4.1 WHAT IS THE MEANING OF ‘ETHICS’ IN RESEARCH?...............................................................................................244.2 ETHICAL ISSUES RELATING TO HUMAN RIGHTS:.....................................................................................................244.3 ETHICAL ISSUES RELATED TO DIFFERENT RESEARCH APPROACHES.......................................................................244.4 ETHICAL ISSUES RELATED TO YOU AS A PROFESSIONAL RESEARCHER..................................................................244.5 QUESTIONS TO ASK BEFORE BEGINNING RESEARCH (PG 115)...............................................................................254.6 GENERAL QUESTIONS RELATING TO RESEARCH (PG 116-117)..............................................................................25
STUDY UNIT 5........................................................................................................................25
RESEARCH DESIGN..............................................................................................................25
3
5.1 INTRODUCTION.................................................................................................................................................255.2 RESEARCH DESIGN AS PART OF THE RESEARCH PROCESS................................................................265.3 DESIGN COHERENCE.......................................................................................................................................265.4 DESIGN VALIDITY IN QUANTITATIVE RESEARCH......................................................................................265.4.1 INTERNAL VALIDITY..............................................................................................................................................265.4.2 EXTERNAL VALIDITY.............................................................................................................................................265.5 RESEARCH DESIGNS INVOLVING QUANTITATIVE DATA..........................................................................275.5.1 TRUE EXPERIMENTAL DESIGN..........................................................................................................................275.5.2 PREEXPERIMENTAL DESIGN..............................................................................................................................275.5.3 QUASI-EXPERIMENTAL DESIGN........................................................................................................................275.5.3 NONEXPERIMENTAL RESEARCH INVOLVING QUANTITATIVE DATA......................................................285.6 QUALITATIVE RESEARCH DESIGNS.............................................................................................................285.6.1 SCOPE......................................................................................................................................................................285.6.2 DESIGN FLEXIBILITY.............................................................................................................................................285.6.3 THE RESEARCH RELATIONSHIP.......................................................................................................................285.6.4 INTENDED OUTCOME...........................................................................................................................................295.6.5 EXAMPLES OF QUALITATIVE DESIGN..............................................................................................................295.7 SUMMARY...........................................................................................................................................................29
STUDY UNIT 6........................................................................................................................30
SAMPLING...............................................................................................................................30
6.1 INTRODUCTION.................................................................................................................................................306.2 BASIC SAMPLING CONCEPTS........................................................................................................................306.2.1 POPULATION...........................................................................................................................................................306.2.2 ELEMENT..................................................................................................................................................................306.2.3 PARAMETER............................................................................................................................................................306.2.4 SAMPLE....................................................................................................................................................................306.2.5. SAMPLING FRAME................................................................................................................................................306.2.6. A REPRESENTATIVE SAMPLE...........................................................................................................................306.2.7 SAMPLING ERROR.................................................................................................................................................316.2.8 SAMPLING BIAS......................................................................................................................................................316.3 THE ESSENTIALS OF SAMPLING...................................................................................................................316.4 SAMPLING APPROACHES...............................................................................................................................316.4.1 PROBABILITY SAMPLING.....................................................................................................................................321) SIMPLE RANDOM SAMPLING...................................................................................................................................322) SYSTEMATIC SAMPLING...........................................................................................................................................323) STRATIFIED RANDOM SAMPLING..........................................................................................................................324) CLUSTER SAMPLING..................................................................................................................................................336.4.2 NON-PROBABILITY SAMPLING...........................................................................................................................341) CONVENIENCE OR ACCIDENTAL SAMPLING......................................................................................................342) QUOTA SAMPLING......................................................................................................................................................343) PURPOSIVE OR JUDGMENTAL SAMPLING..........................................................................................................344) SNOWBALL SAMPLING..............................................................................................................................................35
4
7. STUDY UNIT 7....................................................................................................................37
7.1..................................................................................................................................................................................377.2..................................................................................................................................................................................377.2.1........................................................................................................................................................................................377.2.2........................................................................................................................................................................................37
8. STUDY UNIT 8....................................................................................................................37
8.1..................................................................................................................................................................................378.2..................................................................................................................................................................................378.2.1........................................................................................................................................................................................378.2.2........................................................................................................................................................................................37
9. STUDY UNIT 9....................................................................................................................38
9.1..................................................................................................................................................................................385.2..................................................................................................................................................................................389.2.1........................................................................................................................................................................................389.2.2........................................................................................................................................................................................38
10. STUDY UNIT 10..................................................................................................................38
10.1................................................................................................................................................................................3810.2................................................................................................................................................................................3810.2.1......................................................................................................................................................................................3810.2.2......................................................................................................................................................................................38

5
STUDY UNIT 1
SCIENCE AND RESEARCH
1.1 Introduction Collection of information = RESEARCHRules governing research = METHODOLOGY
1.2. OBJECTIVES.
1.2.1 DESCRIBE SCIENTIFIC APPROACH TO RESEARCH1. Use logic, observation and theory2. Logic = Makes sense3. Observation = understanding4. Theory = explanations5. Systematically examine and think about a question
1.2.2 IDENTIFY FIVE SOURCES OF KNOWLEDGEA. Experiential Reality – personalB. Agreement Reality – accept what being told1. Tradition2. Authority3. Mysticism4. Common Sense5. Media Myths
1.2.3 FIVE EXAMPLES OF FIVE TYPES OF ERROR IN HUMAN INQUIRY1. Inaccurate Observation – description of burglar2. Overgeneralization – Dumb blondes; stopped by replication

6
3. Selective Observation – from overgeneralization; seek pattern4. Ego involvement – personal stake/inflection; stopped by science5. Premature closure – ending before total understanding.
1.2.4 IMPORTANCE OF FIVE SCIENTIFIC NORMS
1. Universalism – judge research on scientific merit2. Organised scepticism – question and criticise3. Disinterestedness – be neutral, impartial, and receptive4. Communalism – share knowledge5. Honesty – crucial
1.2.5 SIX CHARACTERISTICS OF THE SCIENTIFIC METHOD1. Empirical Inquiry – observation and measurement & evidence2. Language of science – uses specific scientific rhetoric3. Assumptions of Science – e.g. behaviour governed by social norms4. Perceptibility – understandable – i.e. explanations must be understandable5. Aesthetics – i.e. carefully designed research experiment is beautiful6. Limitations – e.g. human rights, ethics.

7
STUDY UNIT 2
STRATEGIES OF DISCOVERY
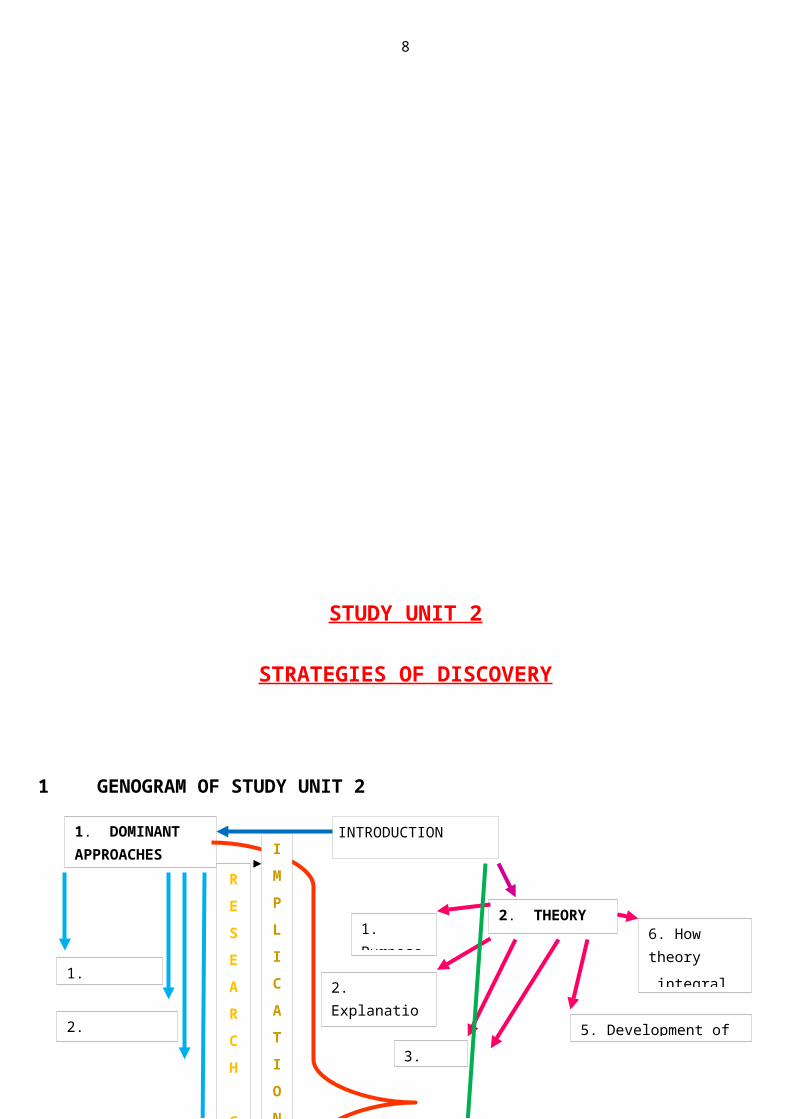
1 GENOGRAM OF STUDY UNIT 2
INTRODUCTION1. DOMINANT APPROACHES
1. Positivism
2. Interpretivism
3. Critical approach
4. Contemporary Methodological Challenges
a. Feminism
b. Postmodernism
RESEARCH
CRITERIA
IMPLICATIONSOFCHOICEE
2. THEORY
2. Explanations
it provides
4. Domains of Social Reality
1. Purpose
5. Development of Theory
6. How theory
integral to
research
3. Scope
8
2.1 INTRODUCTION 1. Dominant approaches
i. Positivismii. Interpretivismiii. Critical approachiv. Contemporary Methodological Approach
1st. Feminism2nd. Postmodernism
b. Above expose to RESEARCH CRITERIA and thereby IMPLICATIONS OF CHOICE2. Relationship between Theory and research
i. Purposeii. Forms of explanationsiii. Scopeiv. Domains of social realityv. NB. Development and how INTEGRAL to research
3. Processes i. Selecting a topicii. Identifying a problemiii. Turning it into a manageable and specific formiv. Key conceptual stages of social inquiryv. Identify and discuss sources of research. NB literature reviewvi. Hypotheses used in research.
2.2 PHILOSOPHICAL GROUNDING OF RESEARCH .Paradigm = model of reality, abstract framework
4. Key Conceptual StagesOf Social Inquiry
1. Select topic
2. Identify problem
3. PROCESSES
3. Make it manageable And specific
6. Hypotheses used in
Research
5. Identify and discuss
Sources of research topics. NB. Literature review

9
2.2.1 Key Issues = ASSUMPTIONS
2.2.1.1. Ontology = Branch of philosophy dealing with NATURE OF REALITY Questions deal with primary issues Important cos have effect on all subsequent decisions made
2.2.1.2. Epistemology = Branch of philosophy deals with NATURE of KNOWLEDGEQuestions deal with how we can know and explain something
Identifies rules and principles that determine HOW. . Social phenomena can be Known and WHAT KIND of explanation
is. .. . . . Satisfactory.
2.2.1.3. Methodology = Rules and procedures of research work
ONTOLOGY, EPISTEMOLOGY & METHODOLOGY all interlinked.
2.2.1.4. ApproachesAre the underlying assumptions research scientists have, start with.
2.2.2. Positivist approach1. Systematic research that emphasises the importance of OBSERVABLE FACTS2. Social reality can be discovered.3. All knowledge is based on facts/.4. Value-free – researcher impartial5. Standardised procedures used6. Knowledge cumulative
2.2.3 Interpretive approach1. Approach to social science that emphasises the importance of INSIDERS’ VIEWPOINTS
to understanding social realities.2. Ability to interpret situation and act accordingly3. Therefore through interaction humans central to defining sit. To make sense of it.4. Research makes social reality intelligible and reveals its inherent meaningfulness.5. Social reality – experienced, interpreted and understood.6. No EXTERNAL social reality.7. Common sense plays NB part.8. Successful research provides outsiders with enough understanding of a situation to enable
them to communicate with insiders. 2.2.4 Critical Approach
1. An approach to social science that emphasise the need to uncover hidden processes and structures within society.
2. Society is Multi-layered.3. There are authorities in power.
10
4. Social reality is HUMAN CONSTRUCT with more than one possibility.5. Rely on theory which is an ABSTRACT FRAMEWORK.6. Truth of social reality goes beyond the empirical facts.7. Researcher actively engages with subjects8. OBJECTIVITY IS NOT A GOAL.9. Praxis = putting theory into practice.10.OBJECTIVITY - CRITICAL APPROACH = Not goal
POSITIVIST APPROACH = means impartialityINTERPRETEVISTS = means consensus agreement.
2.2.5 Contemporary Methodological Challenges
2.2.5.1 Feminist Research1. An approach advocating gender sensitivity in research, esp. Woman2. Makes point that research generally male oriented.3. Issue is power.4. Patriarchal values.5. Particularly critical of positivist approach.6. Balance of power in research is altered by acknowledging the role the subjects
play7. Cuts across interpretive and critical social science approaches.
2.2.5.2 Postmodern Research1. An approach that claims there is no such things as absolute “truth”, no method
or theory better than another at determining truth.2. No “stable” “coherent” study material, subjects.3. Radical form – says need to deconstruct subject matter.4. Rejects REASON as foundation of knowledge.5. Discourses are based on culture within particular social & historical contexts.6. Science one of many discourses, therefore can’t give all answers.7. Beware RELATIVISM.8. Forces social scientists to be self-reflective and self-critical, not so immodest.
2.6 Concluding remarks1. Approaches are IDEAL TYPES 2. Ideal types = mental construction of something that emphasises and even exaggerates its
essential characteristics for the purposes of analysis.3. Approaches (paradigms, perspectives) have history.4. They also evolve and change.

11
2.3 THEORETICAL GROUNDING OF RESEARCH
2.3.1 Defining Theory1. A conceptual framework that provides an explanation of certain occurrences or phenomena.2. Conceptual framework = logical interconnected propositions.3. Scaffolding = organises and generates new ideas.
2.3.2 Theory as a Conceptual Framework1. Concept – i. abstract idea representing a real phenomenon.
ii. Concept = label i.e. term, nameiii. Abstract idea, mental image, linked to label – this identifies
distinguishing key properties/critical features.iv. Concepts are abstract ideas that are related to REAL phenomena.
2. Reification = treat abstractions as real, concrete entities. 3. NB CONCEPTS = REPRESENTATION OF PHENOMENA NOT ACTUAL PHENOMENA
= REIFICATION
RECAP BOX.
1) Concepts – identify and describe phenomena
2) Concepts – starting point of theorising.
3) By calling by precise name, i.e. concept, the mind grasps the social reality and
its relationships.
4) New concepts = new avenues to explore.
5) Freud’s realm of subconscious sensitised researchers to another realm of
social reality.
6) Clusters of concepts build the sentences of theory.
7) Reasoning is used to relate phenomena to each other.

12
2.3.3 Providing Theoretical Explanations1. Theory asks “why” “how”2. Makes sense of information3. Concepts are not explanations in themselves.4. CAUSALITY = one thing leads to another i.e. the presence, absence; change of one
variable affects the presence, absence, change of another variable. 5. If causal relationship established can predict probability.6. Three ways researchers use theories to explain phenomena:
a. Casual explanations: need 4 conditions:i. Cause is apparent/changes before the effect of change
in the effect is observed. I.e. time delay between cause and effect.
ii. Variation should occur in cause and effect. I.e. suggests cause and effect associated.
iii. All influencing factors affecting relationship must be taken into account.
iv. Rationale for proposed relationship between phenomena should be based on careful reasoning.
v. Reductionist i.e. reduces everything to one basic explanation.
b. Structural Explanations:i. Phenomena interrelated in way that they = whole.ii. Analyse phenomena in terms of their constitutive
structures. i.e.iii. Link explained with metaphor, analogy.iv. Holisticv. Time irrelevant because interrelatedness simultaneous.vi. Core phenomena play central role, and their relationship
c. Interpretive Explanations.i. Meaning attributed to particular context in order to
understand this context.ii. Subjective insights of subjects sharediii. To understand properly “involves an act of
interpretation, in which ideas such as structural causality and causal mechanism play no role.”
2.3.4 Scope and Level of Theory1. Scope = how much theory explains.2. Abstract concept can widen applicability and therefore scope of theory.3. Scope reflected in “types of units, cases, or situations to which the theory applies.”4. Range of scope is considered in terms of explanation and generalisabilitiy.5. Distinguish between:
a. EMPIRICAL GENERALISATIONS – which classify, summarise and organise observations.First step to abstraction, close to concrete information collected.

13
Generalisability of relationship betw. Phenomena is limited.b. MIDDLE RANGE THEORY – organises empirical observations so that they can be
explained in more general terms.c. THEORETICAL PERSPECTIVES – give overall explanation; study only gives
partial evidence to support/question some of its propositions.6. Theories explain different levels of social reality:
i. MICRO-LEVEL – small slices of time, space, numbers of peopleii. MACRO-LEVEL – larger aggregates, social institutions, entire cultural
systems, whole societies.7. Is attempt to link micro and macro – holistic integrated research.
2.3.5 Reconsidering the Relationship between Theory and Research
1. Processes of reasoning used to develop theories:i. Deduction:
a. testing general ideasb. Deduce if abstract, logical relationships apply to specific,
concrete ideas.c. General ideas are linked to empirical evidence.
ii. Induction:a. Use specific, concrete observations to develop abstract, logical
relationship between phenomena.b. Implies process of building theory.c. Researcher develops new concepts and specifies the
relationship between them on the basis of evidence collected. d. Evidence generalised.e. BUT: Ammassari says – research more than testing and
verifying of theory – it can confirm, refine and reformulate ideas. New evidence can lead to new theories.
2.3.6 Concluding Remarks
RECAP BOX.
1) Theory – pervasive role in research.
2) Theory – makes empirical facts intelligible.
3) Theory – as conceptual framework = scaffolding because specifies key
concepts.
4) Reciprocal relationship – empirical studies based on theory and theories
based on empirical studies.
RECAP BOX - CONCLUSION
1) Theory explains ACTUAL situations in social reality, not IMAGINARY ones.
2) Theory way of SYSTEMATICALLY thinking about phenomena we observe and
experience.

14
2.4 CONCEPTUAL GROUNDING OF THEORY 1. Initial careful planning essential.
2.4.1 Deciding on a Topic to Research1. Research starts with PROBLEM THAT NEEDS TO BE SOLVED.2. Choice of topic not made in vacuum – researcher and context make impact on each other. i.e.
researcher chooses topic on personal level.3. Other factors = SOCIAL (practical relevance) and SCIENTIFIC (knowledge gathering)
significance of research topic.
RECAP BOX - CONCLUSION
1) Theory explains ACTUAL situations in social reality, not IMAGINARY ones.
2) Theory way of SYSTEMATICALLY thinking about phenomena we observe and
experience.
RECAP BOX.
1) Three broad factors that influence choice of research topic:
i. PERSONAL INTEREST
ii. NEED TO SOLVE PARTICULAR PROBLEM (SOCIAL)
iii. NEED TO DEVELOP THEORIES (SCIENTIFIC)
2) Personal not sufficient to warrant research needs social and scientific
relevance.
3) Solutions to practical problems can contribute to theory.
4) Initially personal interest in research topic,
5) Then overview of known evidence, and consider practical problems.
15
2.4.2 Conducting a Literature Review1. Read theory and research generated from theory.2. Reasons:
a. Identifies gaps.b. Shows potential pitfallsc. Helps avoid duplication
3. NB. To determine FEASIBILTY and CREDIBILITY of topic.4. Places research in broad framework.5. Provides foundation and justification for research.6. Sources of information:
a. Journalsb. Booksc. Dissertationsd. Research reportse. Conference papersf. Government documents g. Policy papersh. Newspaper articlesi. Internet
2.4.3 Specifying a Research Questions1. Quantitative and explanatory research question specified quicker than in 2. Qualitative and exploratory research (question specified slower than above)3. Feasibility, nb.4. Enables researcher to identify ESSENCE of research.
RECAP BOX.
1) Three broad factors that influence choice of research topic:
i. PERSONAL INTEREST
ii. NEED TO SOLVE PARTICULAR PROBLEM (SOCIAL)
iii. NEED TO DEVELOP THEORIES (SCIENTIFIC)
2) Personal not sufficient to warrant research needs social and scientific
relevance.
3) Solutions to practical problems can contribute to theory.
4) Initially personal interest in research topic,
5) Then overview of known evidence, and consider practical problems.

16
5. Think before do6. Once question specified, use questions to STRUCTURE research. 7. Nature of evidence required determines research methodology, i.e. quantitative or qualitative
REST OF STUDY UNIT FOCUS IS ON QUANTITATIVE
2.4.4 Framing an Hypotheses1. Tentative statement of relationship between two + variables i.e. informed guess.2. Start to think of possible answers3. Vagueness not acceptable.4. Requirements of testability = specific, precise and clear.5. Hypothesis directs or focuses the researcher’s attention to particular phenomena and the
RELATIONSHIP between them. 6. Hypothesis guides research by identifying the evidence required. 7. Identify patterns.8. Potential variability in related phenomena , i.e. Can change.9. Gap between abstract conceptual level and the concrete observational level overcome by
converting concepts to variable.10.Starts by identifying CHARACTERISTICS of concept called ATTRIBUTES.11.Variable = logical grouping of attributes.12.Attributes can change quantitatively or qualitatively.13. INDEPENDANT VARIABLE = cause, variable that influences or changes the dependant variable14.DEPENDANT VARIABLE = effect, the variable that is influenced or changed by independent
variable. 15. If relationship is positive it means they change in same direction, i.e. both decrease.16. If relationship is negative it means they change in opposite directions. i.e. one decreases and the
other increases, or vice versa17.Evidence lets us confirm or reject hypothesis. 18. If finding contradict hypothesis then have to modify knowledge. 19. INTERVENING VARIABLE – a variable that is the effect of one variable and the cause of
another variable. E.g. “Women are more in favour of birth control than men.” Intervening variable would be religion.
2.4.5 Operationalising Concepts1. Concepts have to be CLEARLY DEFINED because meanings not always obvious.2. CONCEPTUALISATION = DEFINING THE TERMINOLOGY USED IN A TESTABLE
STATEMENT OF THE PROBLEM (HYPOTHESIS) IN SUCH A WAY THAT THERE IS NO POSSIBILITY OF MISUNDERSTANDING WHAT IT REFERS TO.
3. Measuring concepts is OPERATIONALISING.4. Empirical basis of research depends on ability to Operationalise (make concepts measureable)
key concepts to determine occurrence, strength and frequency.5. Operationalisation means changing a theoretical concept into an empirical variable. 6. Constructs – highly abstract concepts

17
7. E.g. Alienation, measured by covering ALL aspects, egg. Powerlessness, meaninglessness, normlessness, social isolation and self-estrangement. = indicators
8. INDICATOR is an observable measure of a concept or variable. 9. An important part of research is the CONCEPTTUALISING and OPERATIONALISING of core
concepts.10.CONCEPTUALISING = Making sure, with use of appropriate terminology, that there can be no
misunderstanding concerning the concept.11.OPERATIONALISING = making concept measureable.
2.4.6 Concluding Remarks1. Researcher has to make crucial decisions before conducting quantitative research.2. Planning research begins by SELECTING TOPIC.3. LITERATURE REVIEW develops it from vague concept to research proposal and manageable
question.4. Thereby enabling the SPECIFICATIN OF A RESEARCH QUESTION.5. Formulating HYPOTHESIS follows from this and aids the process of quantitative research.6. Have to ensure those variables they claim are related to each other are actually measurable. i.e.
OPERATIONALISATION.
2.5 CONCLUSION A. The following are terms to know and understand (pg73 of study guide)
1. Assumption
2. Causality
3. Deduction
4. Fact
5. Induction
6. Interpretive explanation
7. Intervening variable
8. Methodology
9. Operationalisation
10.Positive relationship
11.Praxis
12.Prediction
13.Spuriousness
14.Structural explanation
15.Theory
16.Variable

18
STUDY UNIT 3
TYPES OF RESEARCH
3.1 Introduction1. Ways of classifying research based on :
i. CATEGORIES – what research USED for.ii. METHODOLOGY – APPROACHES on which research based.iii. AIMS – what these types of research are AIMED ATiv. TIME DIMENSION – TIME INVOLVED in doing research.
2. Process of researching:i. 1st decide TYPE of research to use i.e. basic or applied researchii. 2nd decide APPROACH to follow. i.e. quantitative, qualitative, triangulation.iii. 3rd decide AIM what trying to achieve. I.e. .done by exploring, describing,
explaining problem.iv. 4th decide TIME DIMENSION. i.e. cross-sectional, longitudinal or case-study
Cross-sectional is nonrecurrent investigation into a particular topic Longitudinal and case-study = investigation over time period.
3.2 For what research is used.
Two types of research are a. BASIC b. APPLIED
Basic and Applied Research are NOT mutually exclusive.
BASIC AND APPLIED RESEARCH DIFFER IN ONE MAJOR ASPECT –
BASIC RESEARCHERS - Look for answers that will have an IMPACT on the problem are for a DECADE OR LONGER.
APPLIED RESEARCHERS - Look for answers that are SHORT-TERM, i.e. QUICK FIXES. (6-12 months)
3.2.1 Basic Research1. Expands on fundamental knowledge.
19
2. “academic” research, “pure research” 3. E.g. researcher states what social phenomenon is being researched (street children), then
describes/explains the phenomenon.
BASIC RESEARCH1. Supports, or rejects , theories by2. Explaining social relationships , as well as3. Interpreting changes in communities4. In order to enhance new scientific ideas/knowledge about our social world.
1. Uses – exploratory, descriptive and explanatory research.2. Long-term solutions3. Applied to explanatory research4. Reported in scientific/technological language because meant for scientists.5. Criticism – no short-term solution6. Advantage – creates basis for application of knowledge and insight into social problems,
even policies.
3.2.2. Applied Research1. Solves specific problem2. Addresses a specific practical social problem, which is INVESTIGATED, and TREATED in
SPECIFIC manner by applying acquired research knowledge.3. Focus is on SHORT-term SOLUTIONS therefore not so much on theory4. Descriptive in nature5. Criticism – results not published, because institution, etc wants to keep results for self. 6. Advantage – immediate application7. Results should be presented in way that is accessible to practitioners, i.e. practical and
“usable”8. Types of Applied research:
3.2.2.1. Action Research1. People/organisation actually takes part in research process itself.2. Includes ordinary and everyday knowledge3. Focuses on empowerment4. Tries to foster awareness, or draws attention to awareness5. Directly related to political realities or policy-making research.
3.2.2.2. Social Impact Research1. Environment2. Evaluate planned social change3. State/government use mostly.
a. Community services – clinicsb. Social conditions – elderlyc. Economic impact – factories close

20
d. Demographic consequences – migratione. Environment – preserve old buildingsf. Health – immunisationg. Psychological well-being – traffic rage
3.2.2.3. Evaluation Research1. Wide spectrum2. Value judgements based on evidence3. TWO TYPES:
a. FORMATIVE – continuous evaluationb. SUMMATIVE – reflective, end results, outcomes
4. Both used – formative to evaluate performanceSummative to evaluate results
3.3 Approaches on which social scientific research is based. Positivist school. i.e. cause and effect. – QuantitativeHumanistic school. Qualitative
3.3.1 QUANTITATIVE RESEARCH (object = respondent)1. Formalised2. Structured3. Controlled4. Examine generally accepted phenomena5. Use specific scientific methods and techniques6. I.e. surveys, questionnaires, random sampling.7. Points of departure:
a. Natural/social realities studied same wayb. Scientific knowledge must be able to be MEASURED AND OBSERVED BY
SENSES.c. VALUE-FREE knowledge
8. Preference (methods/techniques)a. Conceptualisation of concepts and Operationalisation of them with MEASURING
INSTRUMENTS (observers, interviews, questionnaires, analysis of existing data)b. Data-collection techniquesc. Data-analysis techniques – from simple to complex.
3.3.2 QUALITATIVE RESEARCH (object = subject)1. Social science needs different approach to other research2. More philosophical3. Points of departure:

21
a. Man within unique meaningful situationb. OBSERVATION important
4. Preference: (Methods/techniques)a. Concepts catch: meaning of experience (situation)b. Unstructured questionnaires and interviewsc. Participant observation, ethnographic studies, case studies.d. Life histories, diaries, autobiographiese. Analysis of data with NON-QUANTITATIVE framework and category systems.
5. GENERAL characteristics:a. Holist investigation in natural setupb. Man primary data-collection instrument (observer)c. Qualitative emphasisd. Subjects selected purposefully, wide varietye. Inductive data analysis (collects, then tried to understand, then deduces)f. Grounded theory can be developedg. Design developed as research grows/changesh. Subject plays part in research. i. Intuition usedj. Emphasis on SOCIAL PROCESS, and meanings attached to social conditions by
participants.6. TYPES of research used with QUALITATIVE set up:
a. Research that can’t be done by experimentb. “in depth inquiries into complexities and processesc. Research relevant variables that still need to be identifiedd. Research that tries to find/explore why current policy/practice not workinge. Research re unknown phenomena
7. Emphasis strong points8. :context, set-up, subject’s frame of reference.9. Different methods of data collection:
QUANTITATIVE QUALITATIVE
1. SYSTEM = point of departure specific structure imposed on phenomenon.
1. SYSTEM = phenomenon self –evident, Phenomenon manifests itself.
2. Looks at phenomenon from a distance, can be difficult to accommodate unexpected behaviour.
2. Involved with subject, open to observation Pinpoint behaviour/conduct accurately.
3.3.3 MULTIPLE RESEARCH or TRIANGULATION1. Can sometimes need to use both quantitative and qualitative2. Surveyors : true fixed point3. Uses various measuring instruments to collect data4. Data-collection techniques: tests, direct observation, interviews, content analysis
Investigate same variables in specific phenomenon

22
5. Reliable/valid if use only one measuring instrument (pg 93)6. Repetition of investigation of same phenomenon.7. Done by:
a. Sequential/simultaneous use of quantitative and qualitative methodsb. Thereby developing hypothesis/ses through QUALITATIVE methodsc. And TESTING through QUALITATIVE
8. Don’t use randomly, i.e. open-ended questions9. General characteristics:
a. Research decisions based on qualitative and quantitative approachb. Style includes quantitative and qualitative methods/techniquesc. Data used i complementary manner.
3.4 What these types of research AIM at.
1. EXPLORATORY RESEARCHa. Familiarise – basic facts, people and problemsb. Develop clear picture of the eventsc. Develop various ideas, tentative theories and postulationsd. Determine desirability of doing additional researche. Formulate questions, refine phenomena with view to more systematic investigationf. Develop techniques and determine the direction of further investigations
2. DESCRIPTIVE RESEARCHa. Give accurate profile of research groupb. Describe process, mechanism or relationshipc. Verbal/numerical picture (stats, percentages)d. Generate information, stimulate possible explanationse. Provide Basic background information or contextf. Compile series of categories or to classify typesg. Explain specific sequences, phases, stepsh. Document information disproving previous findings about a particular topic.
3. EXPLANATORY RESEARCHa. Determine accuracy of principle or a theoryb. Find out which various possible explanations are the bestc. Promote knowledge of an underlying processd. Combine different factors under a general statement or explanatione. Build or expand on a theory to make it more completef. Provide data to prove or disprove an explanation or forecast regarding a specific
topic.

23
3.5 TIME dimension in research
3.5.1 CROSS-SECTIONAL RESEARCH1. All info collected at same time2. Once-off3. Limited by time, here and now4. DISADVANTAGE = can’t include changes in social process, only during period tested5. ADVANTAGE = more cost effective6. Can be exploratory, descriptive and exploratory7. DESCRIPTIVE gives best results.
3.5.2 LONGITUDINAL1. Two or more studies done on specific topic2. Standardised measuring instruments3. E.g. Psychomotor and reasoning abilities of children from infancy to adolescence.4. Longitudinal research is:
a. Descriptive and explanatoryb. Used in applied research, specifically evaluativec. Points out specific tendencies with great certaintyd. Thereby making forecasts possiblee. More complex, expensive than cross=sectional but more indicative of social change
5. Three designs of LONGITUDINAL research:
a. PANEL STUDIESi. Same group, people, organisation over period of time
b. COHORT STUDIESi. Cohort – group of people with something significant in common, e.g.
approximately same dates of birth that are treated the same for re-research purposes
ii. Emphasis on the cohort, not individualiii. I.e. Kids born in prison.
3.5.3 CASE-STUDY RESEARCH1. Falls under TIME dimension2. Investigation of social unit in its entirety3. Logical, analytical induction4. Links micro to macro level5. Researches typical rather than unique element6. Data collected by:
a. Observation of physical characteristics, social qualities, conductb. Questionnaires, psychological testsc. Newspaper reports, court, school reports, etc.
24
7. Should have existing knowledge of topic.8. Use GROUNDED THEORY.9. Require collection of extended data in order to obtain an in-depth understanding of the
entity being studied.
STUDY UNIT 4
ETHICS IN RESEARCH
4.1 What is the meaning of ‘ethics’ in research?1. THAT WHICH IS MORALLY JUSTIFIABLE2. Code of conduct.3. Four situational factors that apply to making judgements about ethics in research:
a. Methods used to collect, analyse, report datab. Purpose, goal of researchc. Personal motives/intentions of individual researcherd. Broad Effects/consequences of research.
4. METHODS, PURPOSE, PERSONAL MOTIVES AND CONSEQUENCES of research are regulated by:
a. UNIVERSALISM – peer judgementb. COMMUNALITY – accurate reportingc. DISINTERESTEDNESS – not done for personal gaind. ORGANISED SCEPTICISM – be critical and honest with all researche. HONESTY – honest with all involved in researchf. RESPECT – participants basic human rights’
4.2 Ethical issues relating to human rights:a. Do no harmb. Obtain consentc. HAWTHORNE EFFECT – the effect on participants on knowing that they are being
researched. Results not validd. Ensure privacy/confidentiality.
4.3 Ethical issues related to different research approaches1. Experimental research is e.g. Of QUANTITATIVE research2. Issues of CONSENT and POTENTIAL HARM

25
3. CONTROL GROUPS – ethical? E.g. No HIV treatment4. PLACEBO – ethical, not receiving treatment
4.4 Ethical issues related to you as a professional researcher1. ABSOLUTISM = a researcher may never LIE2. ANTINOMAINISM = a researcher need not observe moral codes3. INTEGRITY = honesty and trustworthiness
4.5 Questions to ask before beginning research (pg 115)1. Is the topic researchable2. Does the topic merit scientific research3. Does the research merit the time, money, energy and people involve4. Does the researcher have the necessary qualification and/or skills required5. Is the problem formulated in an unbiased manner6. Are the data accessible
4.6 General questions relating to research (pg 116-117)1. Selection of appropriate methods2. Treatment of respondents3. Treatment of data4. Development and application of measuring instruments (internal validity, external validity
and reliability)5. Political and other organisational constraints6. Personal constraints7. Interpretation of data and reporting findings8. Plagiarism9. A report must:
a. Be technically correctb. Serve a useful functionc. Characterised by feasibilityd. Meet legal requirementse. Promote human welfaref. accurate

26
STUDY UNIT 5
RESEARCH DESIGN
5.1 INTRODUCTION1. How research design helps plan a study
5.2 RESEARCH DESIGN AS PART OF THE RESEARCH PROCESS1. HOW do research2. TYPE of research3. SUBJECTS4. TYPE of data5. HOW COLLECT data/analysis6. EXPLANATORY RESEARCH :
a. Experimental researchb. Sequencec. Plannedd. Implemented in context (total situation in which an event exists/occurs)e. PURPOSE – REASONS WHY SOMETHING IS HAPPENING.f. Cause-effect of variables on each otherg. Therefore need to control environment
7. QUALITATIVE RESEARCHa. Open flexibleb. Non-sequentialc. Practical considerations looked atd. Suitable for NOT THEORY-ORIENTATED; QUALITATIVE researchers
5.3 DESIGN COHERENCE1. Coherent = shows unity of thought and purpose.2. Logical3. Consistent4. Interpretative/critical paradigm ask questions about social phenomena
5.4 DESIGN VALIDITY IN QUAN T ITATIVE RESEARCH 1. Cause- effect relationship between Variables2. Needs to control interfering issues3. Two types of validity
5.4.1 INTERNAL VALIDITY1. Independent variable (X) and dependant variable (Y) (Study unit 2)2. “extent to which the study confirms the existence of a cause-effect relationship3. Confusing variable called = confounding variables, nuisance variables or extraneous
variables.4. Threats to INTERNAL VALIDITY:
a. Historyb. Maturation (subject changes)c. Instrumentation change (i.e. change in questionnaire)d. Selection of subjects could influence study

27
e. Mortality – some subjects don’t go to endf. Regression effect – (criminals watching violent movie, aggression scores less after
movie)g. Testing effect – pre-test influence test, i.e. used to procedure, etc.
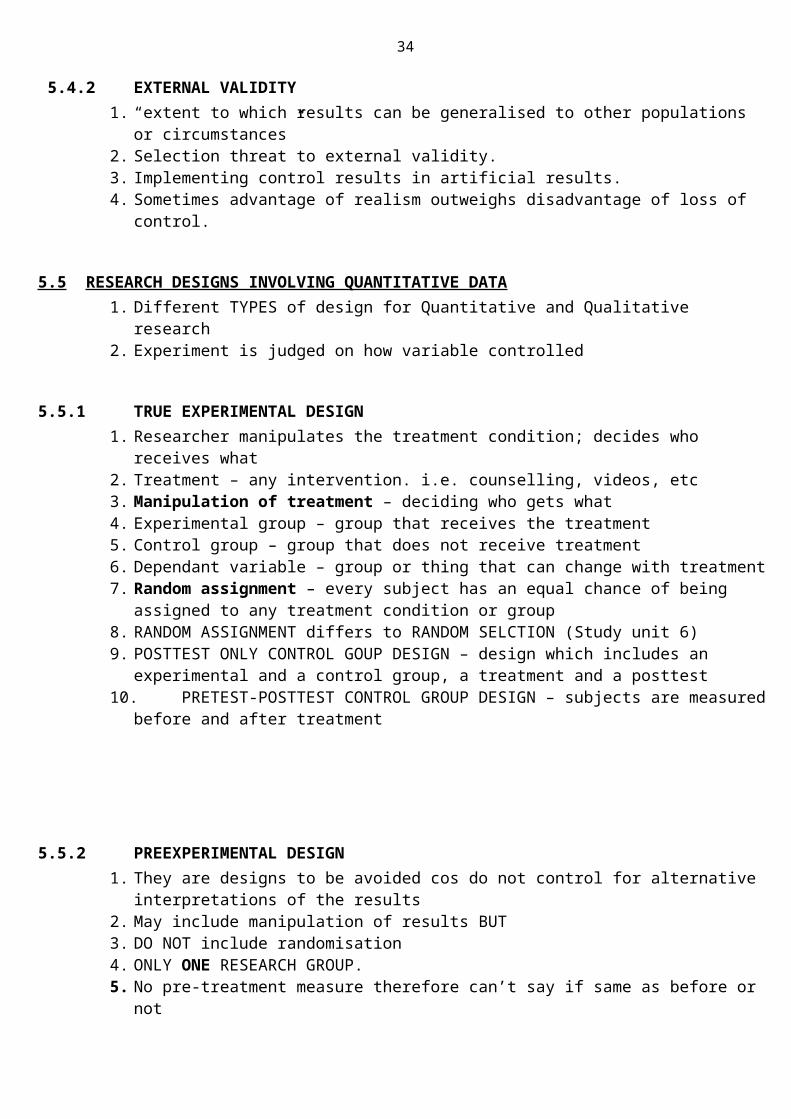
5.4.2 EXTERNAL VALIDITY1. “extent to which results can be generalised to other populations or circumstances”2. Selection threat to external validity.3. Implementing control results in artificial results.4. Sometimes advantage of realism outweighs disadvantage of loss of control.
5.5 RESEARCH DESIGNS INVOLVING QUANTITATIVE DATA1. Different TYPES of design for Quantitative and Qualitative research2. Experiment is judged on how variable controlled
5.5.1 TRUE EXPERIMENTAL DESIGN1. Researcher manipulates the treatment condition; decides who receives what2. Treatment – any intervention. i.e. counselling, videos, etc3. Manipulation of treatment – deciding who gets what4. Experimental group – group that receives the treatment5. Control group – group that does not receive treatment6. Dependant variable – group or thing that can change with treatment7. Random assignment – every subject has an equal chance of being assigned to any
treatment condition or group8. RANDOM ASSIGNMENT differs to RANDOM SELCTION (Study unit 6)9. POSTTEST ONLY CONTROL GOUP DESIGN – design which includes an experimental
and a control group, a treatment and a posttest10.PRETEST-POSTTEST CONTROL GROUP DESIGN – subjects are measured before and
after treatment
5.5.2 PREEXPERIMENTAL DESIGN1. They are designs to be avoided cos do not control for alternative interpretations of the
results2. May include manipulation of results BUT3. DO NOT include randomisation4. ONLY ONE RESEARCH GROUP.5. No pre-treatment measure therefore can’t say if same as before or not
5.5.3 QUASI-EXPERIMENTAL DESIGN1. “resemble”2. Resembles true experimental design in that aims to establish a cause-effect relationship.3. NO RANDOMISATION
4. A quasi-experiment could be a (1) TIME-SERIES designs

28
5. A specific group (only one group measured), is measured over TIME.6. Outcomes are measured at different intervals - called interrupted time-series design7. Time-series – “Comparing a number of observations of the same group over a period of
time.
8. (2) SINGLE-CASE experimental design – assess interventions in educational, clinical and counselling settings.
5.5.3 NONEXPERIMENTAL RESEARCH INVOLVING QUANTITATIVE DATA1. Ex post facto: after the fact2. Survey research : purpose of survey research is to describe the populations’ attitudes,
opinions, etcetera based on sample results.3. If want to classify according to fixed variables, i.e. classification factor. E.g. Is emotional
differences in men and women. Independent variable not manipulated just label groups according to most important difference, here it is gender.
4. NO CONTROL, just RECORDS RESULTS.5. Survey research used to get info on social and behavioural variable.6. CROSS-SECTIONAL surveys = info collected at one point in time. I.e. To see how people
will vote7. LONGITUDINAL study = collecting info at different times over a period of time
5.6 QUALITATIVE RESEARCH DESIGNS1. More personal involvement in study2. Focuses on meaning, experience and understanding3. Researcher interacts with group4. Interviews, observation5. Cyclical rather than linear6. Nonsequential7. Set up situation so that you can become familiar with topic you styling in its natural setting8. Four key issues:
a. Boundaries, scope of the researchb. Design flexibilityc. Research relationshipd. Intended outcome
9. Flexible10.Outcome focuses on understanding rather than predicting general patterns of
behaviour.
5.6.1 SCOPE1. Natural contexts where social events occur.2. Scope = range of situations, techniques, and observations included in the research3. Scope = also = degree to which findings of one study can be generalised to another
setting.4. ‘TRIANGULATION’ collecting data from different sources and using different techniques,
and then analysing the data using more than one type of analysis. Pg 135.

29
5.6.2 DESIGN FLEXIBILITY1. How much and what type of flexibility.2. Flexibility = how adaptable the research process is
5.6.3 THE RESEARCH RELATIONSHIP1. QUALITATIVE research closely associated with interpretive and critical research
paradigms. 2. OBJECTIVITY NB – not imply VALUE-FREEDOM
5.6.4 INTENDED OUTCOME1. Variety of outcomes at outset2. Are you going to REFLECT or CHANGE a phenomenon3. Much social research is reflective, i.e. describes, analyses and interprets.
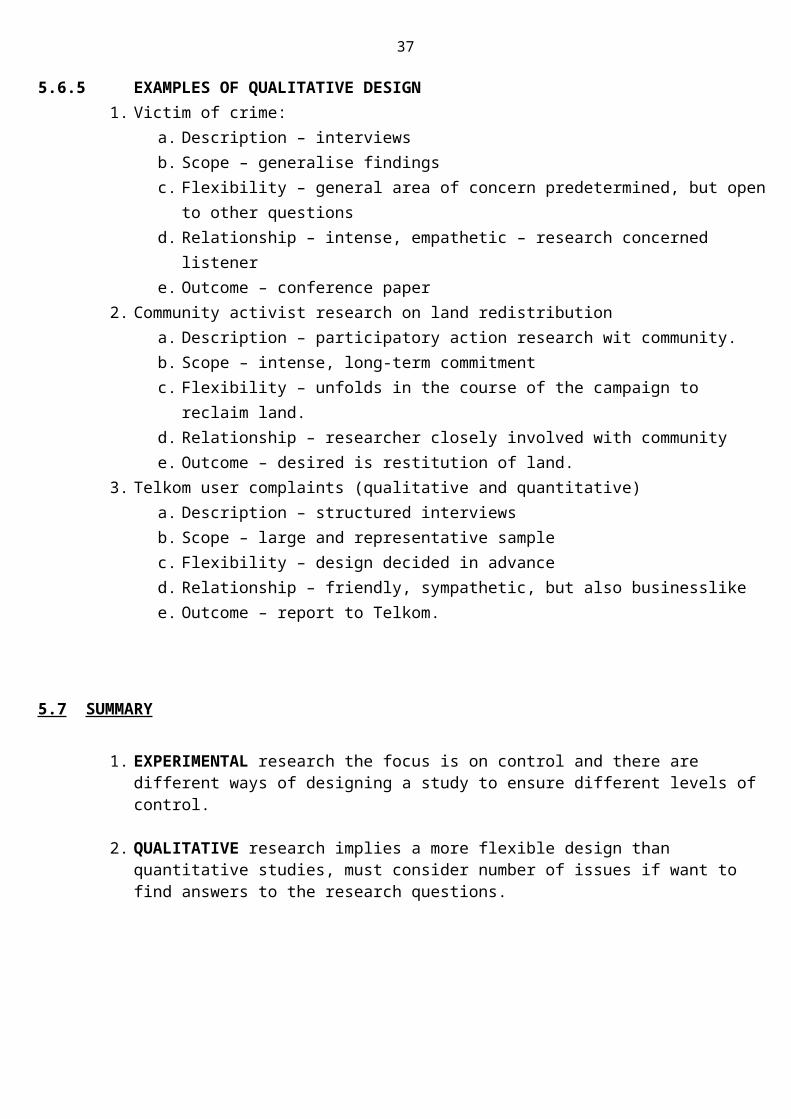
5.6.5 EXAMPLES OF QUALITATIVE DESIGN1. Victim of crime:
a. Description – interviewsb. Scope – generalise findingsc. Flexibility – general area of concern predetermined, but open to other questionsd. Relationship – intense, empathetic – research concerned listenere. Outcome – conference paper
2. Community activist research on land redistributiona. Description – participatory action research wit community.b. Scope – intense, long-term commitmentc. Flexibility – unfolds in the course of the campaign to reclaim land.d. Relationship – researcher closely involved with communitye. Outcome – desired is restitution of land.
3. Telkom user complaints (qualitative and quantitative)a. Description – structured interviewsb. Scope – large and representative samplec. Flexibility – design decided in advanced. Relationship – friendly, sympathetic, but also businesslikee. Outcome – report to Telkom.
5.7 SUMMARY
1. EXPERIMENTAL research the focus is on control and there are different ways of designing a study to ensure different levels of control.
2. QUALITATIVE research implies a more flexible design than quantitative studies, must consider number of issues if want to find answers to the research questions.

30
STUDY UNIT 6
SAMPLING
6.1 INTRODUCTION1. Getting information from a few cases and drawing conclusions about a number of cases.2. Select units of analysis. i.e. samples3. Study of an entire population is called a census.
6.2 BASIC SAMPLING CONCEPTS
6.2.1 POPULATION1) Entire population with all variables, e.g. 1st year students. Single mothers.2) Also called ‘target population’ or ‘universe’.3) Subject must have criteria relevant to study.4) Population that can be reached is called the ‘accessible population’
6.2.2 ELEMENT1) A unit from a defined population, from which get info.2) Must share certain characteristics3) Can also be: objects, documents, organisations, nation states.
6.2.3 PARAMETER1) A characteristic of the elements of a population.2) i.e. a measure or value collected from the population3) Describes a particular characteristic of whole population.
6.2.4 SAMPLE1) A subset of a population2) Part of a whole3) A selected group of elements from a particular group.4) Sampling is feasible, logical way to make statement about a large group.5) See pg. 149-150 SG.
6.2.5. SAMPLING FRAME1) A comprehensive LIST of all units (elements) from which the sample is drawn.

31
6.2.6. A REPRESENTATIVE SAMPLE1) A sample that resembles the population and which enables the researcher to
accurately generalise the results.2) Overriding consideration in assessing a sample is its representativeness.3) Sample should replicate the population proportionately (SG pg 150)
6.2.7 SAMPLING ERROR1) Differences between population parameters and sampling statistics. (e.g. Average
age of population vs. average age of sample)2) Unavoidable, more chance is sample size small3) Two types of errors:
a. Chance factors, i.e. one element included rather than another.i. Can be calculated statistically
b. Bias in selection, i.e. faulty technique.i. May or may not be deliberate,. E.g. Sample of 50% black and 50%
white elements not representative of population.c. Non-response error, element not respond to measuring instrument.eg.
language, illness, refusal to give information.
6.2.8 SAMPLING BIAS1) Not representative of the population2) Caused by failure to consider relevant population criteria:
a. Languageb. Personal viewsc. Time (exclude people not there at that time)d. Place (drug use in college kids, if go to cafeteria only specific kids use
cafeteria)3) Over-representation or Under-representation impacts on the research question.
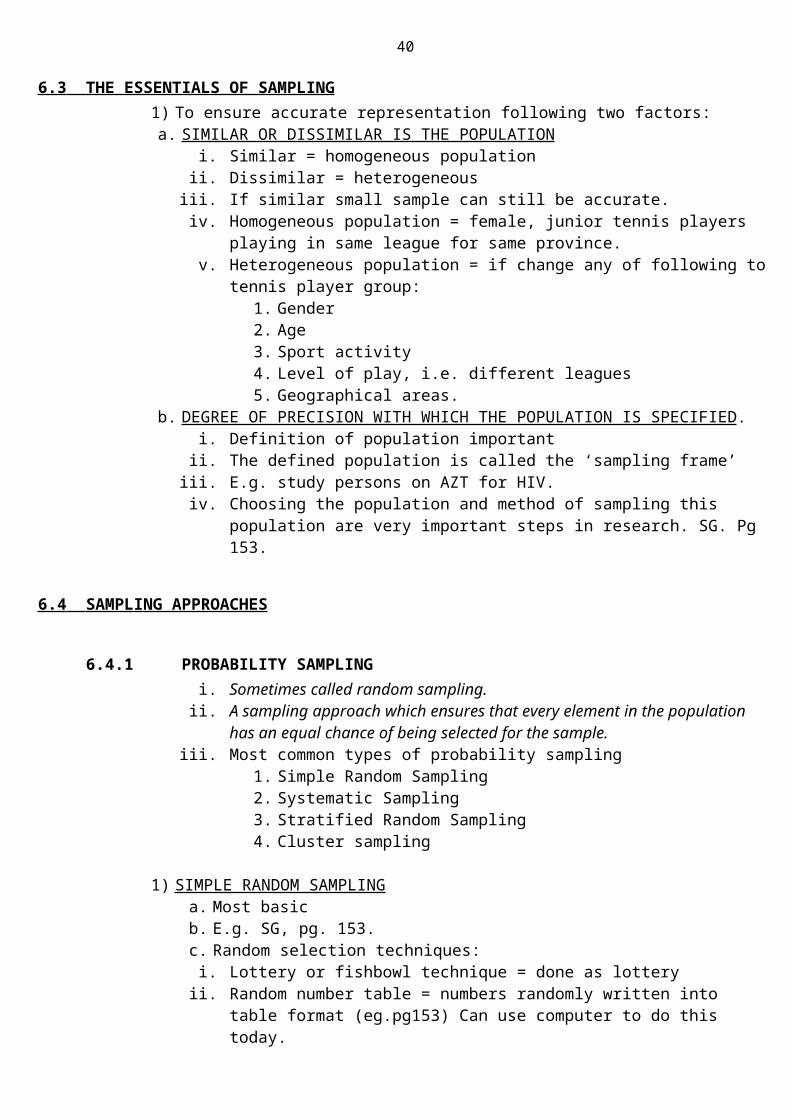
6.3 THE ESSENTIALS OF SAMPLING 1) To ensure accurate representation following two factors:a. SIMILAR OR DISSIMILAR IS THE POPULATION
i. Similar = homogeneous populationii. Dissimilar = heterogeneousiii. If similar small sample can still be accurate.iv. Homogeneous population = female, junior tennis players playing in same
league for same province.v. Heterogeneous population = if change any of following to tennis player
group:1. Gender2. Age3. Sport activity4. Level of play, i.e. different leagues5. Geographical areas.
b. DEGREE OF PRECISION WITH WHICH THE POPULATION IS SPECIFIED .i. Definition of population importantii. The defined population is called the ‘sampling frame’iii. E.g. study persons on AZT for HIV.

32
iv. Choosing the population and method of sampling this population are very important steps in research. SG. Pg 153.
6.4 SAMPLING APPROACHES
6.4.1 PROBABILITY SAMPLINGi. Sometimes called random sampling. ii. A sampling approach which ensures that every element in the population
has an equal chance of being selected for the sample.iii. Most common types of probability sampling
1. Simple Random Sampling2. Systematic Sampling3. Stratified Random Sampling4. Cluster sampling
1) SIMPLE RANDOM SAMPLING a. Most basicb. E.g. SG, pg. 153.c. Random selection techniques:
i. Lottery or fishbowl technique = done as lotteryii. Random number table = numbers randomly written into table format
(eg.pg153) Can use computer to do this today.d. MOST IMPORTANT aspect of RANDOM sampling is that it is a ONE-STAGE
selection process.
2) SYSTEMATIC SAMPLING a. Interval samplingb. I.e. drawing every fth elementc. Equal intervalsd. Quicker, simpler than randome. Limitation=relies on availability of complete population list (sampling frame)f. Works as follows:
i. N = symbol for size of populationii. N = symbol for sample sizeiii. Get list of population size (N)iv. Decide sample size (n)v. Determine sampling interval (k) by dividing the size of population by the
sample size.vi. E.g. Guesthouses listed in portfolio for guest houses in South
Africa1. If 300 guesthouses listed in portfolio and sample size is 60, the
sampling interval is five (5). 2. If use 3 as selected starting point then next one should be 8, 13, 18
up to 298. 3. IF CAREFUL ATTENTION PAID TO OBTAINING UNBIASED LIST
OF THE POPULATION AND THE FIRST ELEMENT IS RANDOMLY SELECTED; SYSTEMATIC SAMPLING IS CLASSIFIED AS PROBABILITY SAMPLING.
3) STRATIFIED RANDOM SAMPLING a. Population divided into different groups/stratab. Each element belongs to ONLY ONE stratum.

33
c. Random sampling done with each stratumd. Characteristics of population that require stratified sampling:
i. Ethnic backgroundii. Ageiii. Sexiv. Educational level.
e. E.g. 4 000 workers working at certain factories in various ranksi. Sample size 800ii. Divide into strata as per rank and select from stratum.iii. Key issue – ENSURE REPRESENTATIVENESS
f. Homogenous strata
g. Two ways of determining number of elements sample from each stratum:i. Proportional stratified sampling – number of elements selected from each
stratum is proportional to the size of the stratum in the population.1. In example of factory: if top management of total work force
= 14% then should be 14% of sample group also2. Does mean need accurate information re representation3. ADVANTAGE OF PROPORTIONAL STRATIFIED RANDOM
SAMPLING:a. Makes representation of a particular segment of pop. Possible
4. DISADVANTAGE OF PROPORTIONAL STRATITIFED RANDOM SAMPLING
a. Extensive knowledge needed of the population parameters + complete list of total population.
b. Also can be complex.
ii. Disproportional stratified sampling – number of elements in each stratum is NOT proportional to the number of elements in each stratum within the population.
1. In example of factory: if top management of total work force = 14% , and top management in sample = 25%.
iii. Useful if not intending to generalise research finding to all workers, but to compare different ranks’ attitudes on certain issues, disproportional stratified sampling can be used.
4) CLUSTER SAMPLING a. Heterogeneous clusters (stratified homogeneous strata)b. Sample divided into groups or clustersc. Used when
i. Complete list of elements (sampling frame) not available.ii. Not enough time to get all persons; names has list of divisions in factoryiii. Not enough money to get all persons’ names, has list of divisions in factory
d. Often used in LARGE-SCALE surveyse. Takes place in STAGES, e.g. Start in city, then residential blocks, then street,
until reaches individuals (final stage)f. Therefore can be called MULTISTAGE SAMPLING.g. Disadvantage : Has more sampling errors than simple or stratified random
samplingh. Advantages: more economical and practical than other types of probability
sampling, especially in large populations.
34
6.4.2 NON-PROBABILITY SAMPLINGi. Procedure where we do not know whether we have included each element
of the population in a sample.ii. Less desirable than probabilityiii. Appropriate where researchers’ aim is to generate a theory and a wider
understanding of social processes.iv. Also used is sampling frame not available. Researchers’ judgement is used
to select subjects who have characteristics relevant to research.v. Major disadvantage – NO FORMAL procedure for generalising the sample
to the population, cos can’t determine sampling error.vi. Advantages: - pragmatic cos save time and money, vii. Disadvantages can be minimised by homogeneous pop. And enlarging
sample.viii. Most common types of probability sampling
1. Convenience (accidental Sampling2. Quota Sampling3. Purposive (judgmental) Sampling4. Snowball Sampling
1) CONVENIENCE OR ACCIDENTAL SAMPLING a. Use of easily accessible elements to reach sample size.b. E.g. First 20 people at interview, people in library at given time
2) QUOTA SAMPLING a. Similar to stratified sampling, EXCEPT final selection NOT random.b. Require each stratum to be represented in the sample in the same proportion
as in total population.c. BUT relies on convenience or accidental choice not random selection.d. E.g. Nurses attitudes to working with HIV patients. _
i. Population = university of 100 student nursesii. Sample size = 40iii. Easy to distribute questionnaires after lecturesiv. BUT all students have different views, (male, females, different classes)v. So guides selection so has correct number of males, females and from
different classes.vi. i.e. the researcher generally stratifies according to criteria he thinks countvii. such stratifying variables include: age, gender, socio-economic status,
educational level.viii. QUOTA SAMPLING IS PROCEDURALLY SIMILAR TO CONVENIENCE
SAMPLING EXCEPT THAT IT IDENTIFIES IMPORTANT STRATA.ix. QUOTA SAMPLING SUPERIOR TO CONVENIENCE SAMPLING.
3) PURPOSIVE OR JUDGMENTAL SAMPLING a. Theoretical samplingb. Selects sample judged to be representative of the total populationc. Made on basis of available information, or researchers;’ knowledge.d. E.g. first 3 days of the month to audit clients’ filese. Relies heavily of SUBJECTIVE considerations of the researcher, not scientific
criteria.

35
f. PURPOSIVE SAMPLING is used in QUALITATIVE RESEARCH and is entirely governed by the need to DEVELOP ADDITIONAL THEORIES in social science.
g. Researcher samples continuously till no more new information
4) SNOWBALL SAMPLING. a. Research respondents obtain other research respondentsb. Used to identify other people who can be included.c. Useful in observational research and community studiesd. Useful in sensitive or hidden populations (sex workers, gays)
Table: Commonly used sampling techniques
SAMPLING PROCEDURE CONDITIONS UNDER WHICH THE PROCEDURE IS TYPICALLY USED
PROBABILITY SAMPLING PROCEDURES
SIMPLE RANDOM SAMPLING Survey research in which the investigator wants to avoid sample bias and ensure that every element has an equal chance of being in the study.
SYSTEMATIC SAMPLING Survey research when a list of the sampling frame is available.
STRATIFIED RANDOM SAMPLING Survey research in which the investigator wants to study particular homogeneous strata or sub-populations.
CLUSTER SAMPLING Survey research when it is difficult and//or expensive to obtain an exhaustive list of the population.
NON-PROBABILITY SAMPLING PROCEDURES
CONVENIENCE SAMPLING Surveys or experiments in which an easily accessible group is required.
SNOWBALL SAMPLING Surveys or experiments in which study participants are difficult to identify, hard to come by , or socially devalued.
PURPOSE OR JUDGMENT SAMPLING Surveys or experiments in which the researcher wants to study a group or

36
groups based on particular characteristics or circumstances.
QUOTA SAMPLING Surveys or experiments in which the investigator has hypotheses about different strata or sub-populations.
6.5 SAMPLE SIZE 1) Number of elements in sample2) Research purpose, the design, size of population factors3) Except for case studies, larger sample size = more accuracy4) Homogeneous population can use smaller sample size5) Sample size unique to particular study.6) Quantitative studies = large size7) Qualitative studies = small/er8) After certain size, increase in size does not give new information.9) Are formulae to determine size10)More heterogeneous a population the larger the sample size needed.11)Larger the population the smaller the SAMPLING RATIO has to be for sample to be
accurate.12)Smaller the population the larger the SAMPLING RATIO has to be.13)Populations under 1000 small – sampling ratio of 30%14)Larger populations – 10 000 – sampling ratio of 10%.
IMPORTANT FACTORS IN CHOOSING A SAMPLE SIZE
FACTOR THINGS TO REMEMBER AND CONSIDER
ACCURACY NEEDED As the sample increases (to a point) the accuracy of the findings increases.
SIZE OF POPULATION As the size of the population increases, a progressively smaller proportion of
37
subjects can be selected.
TYPE OF RESEARCH SUBJECTS Survey designs frequently require large numbers of subjects.
NATURE OF RESEARCH DESIGN Qualitative studies are conducted with fewer subjects.
METHODS OF DATA ANALYSIS A minimum of 30 subjects is needed if we are to apply statistical techniques to the results.
HETEROGENEITY As the variability of the population increases, more subjects are needed.
METHODS OF DATA COLLECTION If methods are not precise, a larger sample is required.
RESEARCH HYPOTHESIS REQUIRED When slight differences are expected, a large sample is required.
FINANCIAL RESOURCES
ATTRITION RATE
6.5 CONCLUSION 1) Integral part of research
STUDY UNIT 7
DATA COLLECTION
7.1 INTRODUCTION1. How do researchers collect data

38
2. Three steps:a. How will it be MEASUREDb. How QUESTIONING can be used to collect datac. How OBSERVATION can be used to collect data
7.2 MEASUREMENT1. MEASUREMENT = GIVING DATA NUMERICAL VALUES.2. Helps get accurate answers3. MEASUREMENT = recording (registering) the value of a particular variable.
7.2.1 LEVELS OF MEASUREMENT1. Nominal level of measurement
a. Discrete = separateb. Mutually exclusive = choosing one category automatically excludes the otherc. Exhaustive = includes all possible responses.d. Numerals used to classify e.g. Yes = 1, no = 2. No QUANTIFICATION
values to numerals.
2. Ordinal level of measurementa. Discreteb. Mutually exclusivec. Exhaustived. RANK = Data arranged in hierarchy
i. E.g. Strongly agree, agree, neutral, disagree, strongly disagreee. Interval (distance between categories) IS NOT EQUAL.
3. Interval level of measurementa. Discreteb. Mutually exclusivec. Exhaustived. Ranke. AND INTERVAL BETWEEN CATEGORIES IS EQUAL.
i. Interval betw. Categories are measured on a quantitative (values set in numbers) instrument (eg. Thermometer)
ii. Does not have an absolute zero point. iii. Zero point is arbitrarily set.
4. Ratio level of measurement.a. Discreteb. Mutually exclusivec. Exhaustived. Ranke. Equal intervalf. HAS ABSULUTE ZERO POINT.g. Used for weight, lenrth, time. h. NOT used for attitudes, perceptions.i. HOW TO DIFFERENTIATE BETWEEN INTERVAL AND RATION LEVELS

39
i. If NO absolute zero = INTERVALii. If IS absolute zero = RATIO.
5. Level of measurement determines what statistical procedures can be applied.
7.2.2 MEASUREMENT ERRORS1. Measurement error – an inaccuracy that influences the measurement of an
attribute. 2. TWO MAIN SOURCES:
a. Systematic error – bias that occurs constantly, and which distorts the measurement in a particular direction
i. Essence of this error is responding to questionnaire in way which makes testers look favourably at them.
ii. E.g. Answer questions in socially appropriate way, not what the believe
b. Random error – haphazard errors due to different factors, which may cancel each other out after a number of cases/measurements.
i. Measures vary .ii. Factors that can influence measurent consistency:
1. Tiredness/illness2. Researcher seems threatening3. Lapse in concentration4. Equipment malfunction
3. Errors can be cancelled out if researcher takes enough measurements.
7.3 USING EXISTING DATA1. Written documents, CD-ROM etc.2. Three advantages of collecting and using existing data:
a. Unobtrusiveb. Practicalc. Accuracy (reliability and validity) can be confirmed.
7.3.1 SOURCES OF EXISTING DATA1. Primary data – information collected at the original source
a. Interviews with people2. Secondary data - information taken from a source that was not involved in the
original investigation.a. Another resesarcher’s reportb. Because it is someone elses interpretation – cross-check for accuracy.
3. Tertiary data - interpretations based on secondary sourcesa. Newspaper accounts.
7.3.2 AUTHENTICITY AND CREDIBILITY OF EXISTING DATA
40
1. Once data collected needs to be checked and verified that sources authentic and credible.
2. Questions that can be used as guidelines to determine authenticity of a person as a source: (directly from SG. Pg 174)
1. How near was the source to the event in terms of time and place?2. Could the source perceive the event clearly?3. Are the data clear? Did the source have the intellectual ability to
perceive and describe the event?4. Does the source have credibility?5. Could the source have been pressurised in any way?6. Is the source aware of the significance of the report?7. Is the source reluctant to share information?8. Does the source have a personal interest in the event and the way in which it was reported?
3. Authenticity = genuineness4. Credibility = having a believable status.
7.4 SURVEYS VERSUS FIELD RESEARCH 1. Survey research = systematic collection of specific information, obtained through
ASKING a sample of respondents the SAME QUESTION at a PARTICULAR POINT IN TIME.
2. Questions and statements apply to specific geographical are a time period.3. Field research = collection of primary data in natural environments.
a. Observing events, people in natural settings.4. Survey = emphasises comparison and generalisation- requires standardisation
7.5 INTERVIEWS 1. Personal contact2. Interaction3. Focuses on developing an understanding of , and fully describing, some event/issue.
7.5.1 STRUCTURED AND UNSTRUCTURED INTERVIEWS1. Decision which to use relies on:
1. The researcher's knowledge and familiarity of the topic2. The purpose of the interview (eg whether to confirm assumptions, or
collect newinformation)
3. The nature and sensitivity of the topic (eg Aids)4. The actual respondent(s) (eg children as rape victims)5. The setting (eg a busy shopping centre)6. The relation between the interviewer and interviewee (eg a
psychologist and a patient2. STRUCTURED –

41
i. specific lists of questionsii. wording similar to questionnaires.
3. UNSTRUCTURED – i. Respondents give own reactions to general issues, in the absence
of specific questions.7.5.2 IN-DEPTH INTERVIEWS
1. Intensive interviews2. Unstructured interviews3. Conversatuional interviews4. Ethnographic interviews 5. Focused interviews 6. Aim = obtain detailed information7. Delve into reason BEHIND answers, opinions or emotions.8. Useful in field research
7.5.3 FOCUS GROUP INTERVIEWS1. Group interviews 6- 12 people2. Semi-structured3. Guided by moderator/leader4. Keep following in mind before deciding on focus group interview:
a. Respondents’ verbal responses might be less honestb. Confidentuiality could be an issue, hard to maintainc. Advantage – can gather variety of opinions about certain issue.
i. Group focus interviews combined with other data collection methods.I. Examples:
a. Effects of internet on family (pretend not doen) i. Unfamiliar fieldii. Focus group interview used to explore content and
format of questions that will be asked in an in-depth interview with individual family members
II. Particularly useful for pretesting a measuring instruments (e.g. Self-administered questionnaires)
III. Assessing wording of questionnaires
IV. Checking instructions are clear.
7.5.4 TYPES OF QUESTIONS ASKED IN INTERVIEWS1. Close-ended = yes/no or choice of languages etc.2. Open-ended = express attitudes, ideas, sentiments, suggestions, opinion in own
words3. Free-narration =open ended; respondent tell own story4. Follow-up = unique to interviews; follow close-ended and open-ended questions5. Probing questions = when, where, what, how, why

42
7.5.5 Conducting an interview1. Before conducting interview:
1. Who should conduct the interview?
2. Will issues such as differences in gender, age, race, physical appearance or language influence the interview? If so, what can be done to minimise these differences?
3. Besides the interviewer, should others be present (eg someone to keep a record
of responses, or someone who is a confidant of the respondent)?4. Who should be interviewed? Apart from requirements such as sample
Representativeness (discussed in study unit 6), this question is best answered by reconsidering the original research questions asked, and the circumstances of the interviews.
2. Next ask:1. Should the interviews be conducted with individuals or groups?2. Is the social setting (ie place) where the interview is conducted
appropriate? For example, parents may find a school intimidating and prefer to be interviewed at home.
3. Is the time chosen for the interviews convenient for respondents?
3. Advanced planning4. Purpose must be clear5. Start with broad questions,6. Start with non threatening questions7. Once type of interview decided on, do pre-test / pilot test which:
i. Draws small sampleii. Conduct interview in similar settingiii. Practise use of equipment
7.5.6 Advantages and limitations of conducting interviews.Interview is social interaction between 2+ people
1. Advantages of interviews:a. Flexible b. Unclear questions can be clarifiedc. Additional information can be obtained with follow-up questiosd. Establish rapport – enables contact at a later stagee. Respondents don’t have to be literatef. Nonverbal communication can be notedg. Random samples can be drawnh. Way questions asked can be standardised.

43
2. Advantages of telephone interviewsa. No travelling, accommodation, duplication, postage expensesb. Data can be collected QUICKLYc. Responses more accurate, no time to formulate considered
replyd. Interview can be monitored.
3. Limitations of both face-to-face and telephone interviewsa. Bias (1) – race, gender, age. Etcb. Bias – when interviewer shows approval/disapprovalc. Lack anonymity (face-to-face)d. Face-to-face costly (2). e. Need training in skills (3) to interviewf. Cannot interview large sample (4)
4. Interviewing is an interactive process5. Need practice to stay calm, ask questions, track responses and ask appropriate
follow-up questions.
7.6 QUESTIONNAIRES (IN SURVEY AND FIELD RESEARCH)1. Printed document2. Differes from interview schedules/guides cos respondents fill in without researchers’ help.
7.6.1 The wording of statements and questionsAvoid the following:
a. Double-barrelled questions = a question that contains two parts; in other words, a question that is two questions in one.
b. Loaded language = phrases that contain misleading implications.c. Loaded language leads to Leading questions “do you agree support ...” d. One logical answer questions, e.g. Can education TV increase learning skills?e. Negative items = e.g. should you not fulfil a public relations portfolio? Can miss
“not”f. Incomplete questions = “should we spend more on social welfare? Confusing cos
not enough detail e.g. what part of social welfare.g. Agents of action = people or institutions that take active steps to implement
policies or plans. E.g. Who is the “we” in “Should be spend more on social welfare”These can be ambiguous.
h. Lengthy/complex questionsi. Abbreviations and acronyms (word made up of the initial letters of other words)
DO the following:a. Everyday languageb. Unambiguous questions/statementsc. Ask one question at a time.
7.6.2 Types of items included in questionnaires
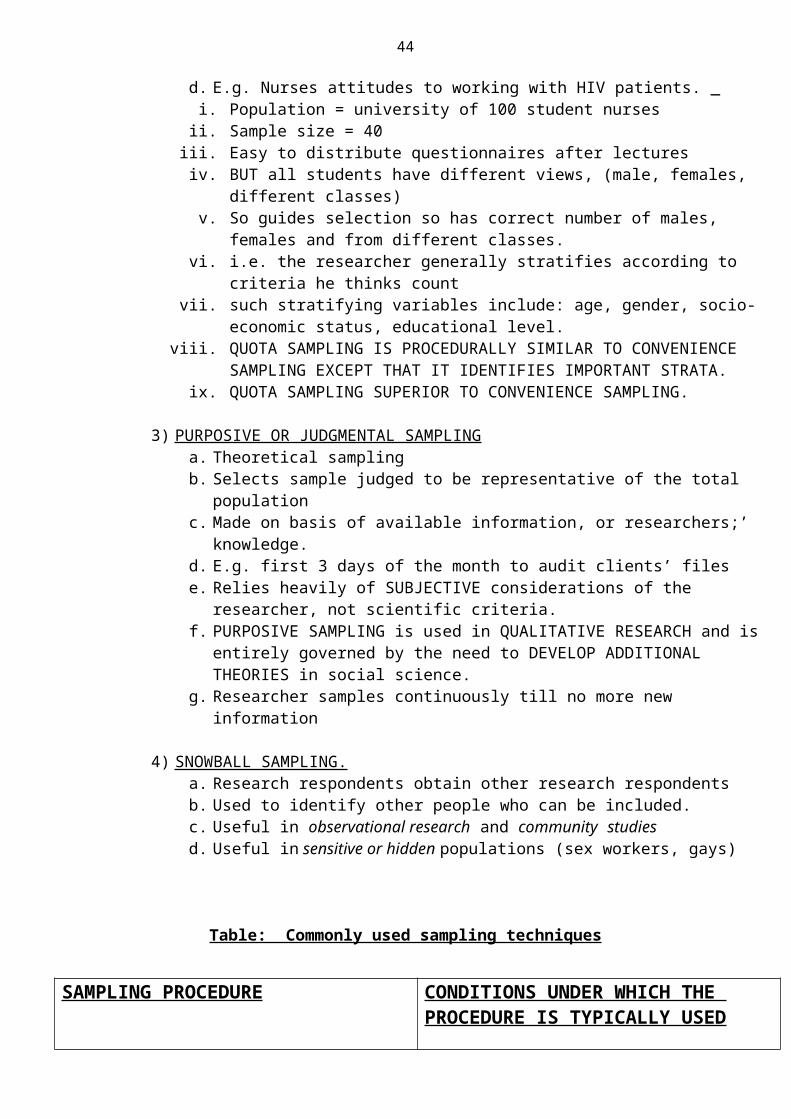
44
i. Open and close ended questionsii. Open ended similar to interviewsiii. Close-ended = 2+ responsesiv. Also called standardised questions, fixed-alternative questions, highly
structured questions.v. Types of questions:
iv. PAIRED-COMPARISON questioni. Selects one answer but must think about options compare
meaningsii. Take into consideration purpose of researchiii. Ie. What hypothesis we testingiv. Options included show research working with certain
ASSUMPTIONS.v. CONTINGENCY questions = only apply to some respondents, must
include clear instructions.i. Depends on answer to previous questions, ii. E.g. Have you....? if yes.....?
vi. RANKING questions = select +1 answers in order or importance, i.e. Most important to least or least important to most important
vii. INVENTORY questions = not limited to selecting ONE optioni. Purpose is to get comprehensive overview of all possible
options that could apply to each respondent.ii. E.g. tick all sources that apply to you....
viii.MULTIPLE-CHOICE questions i. Good to collect demographic data.
vi. Scales that measure weight, height, length can be accurate.vii. Scales that measure stress, bereavement, anxiety can’t be consistent,
accurate.viii.They are self-report measuresix. LIKERT SCALES
iv. Most used.v. Number of statements realted to the attitude being measured are
constructedvi. i.e. strongly agree, agree, neutral, strongly disagree, disagree.vii. Scoring can be reversed, the anser that researchers expect the
respondent to answer most is scored higher.viii.Eg. Strongly disagree (5) means the research expects reponsdents to
to respond negetaively.ix. Eg. Strongly agree (5) means teh research expects respondens to
respond positively.x. Number are important because it is a SUMMATIVE SCALING
PROCEDURE, i.e. numbers added. x. Guttman and Thurstone scales are also used to measure attitudes, etc. but
too elaborate for this module.xi. SEMANTIC DIFFERENTIAL SCALE
iv. Seven-point spaces which have opposite adverbs/adjectives.v. E.g. Honest x x x x x x x Dishonest
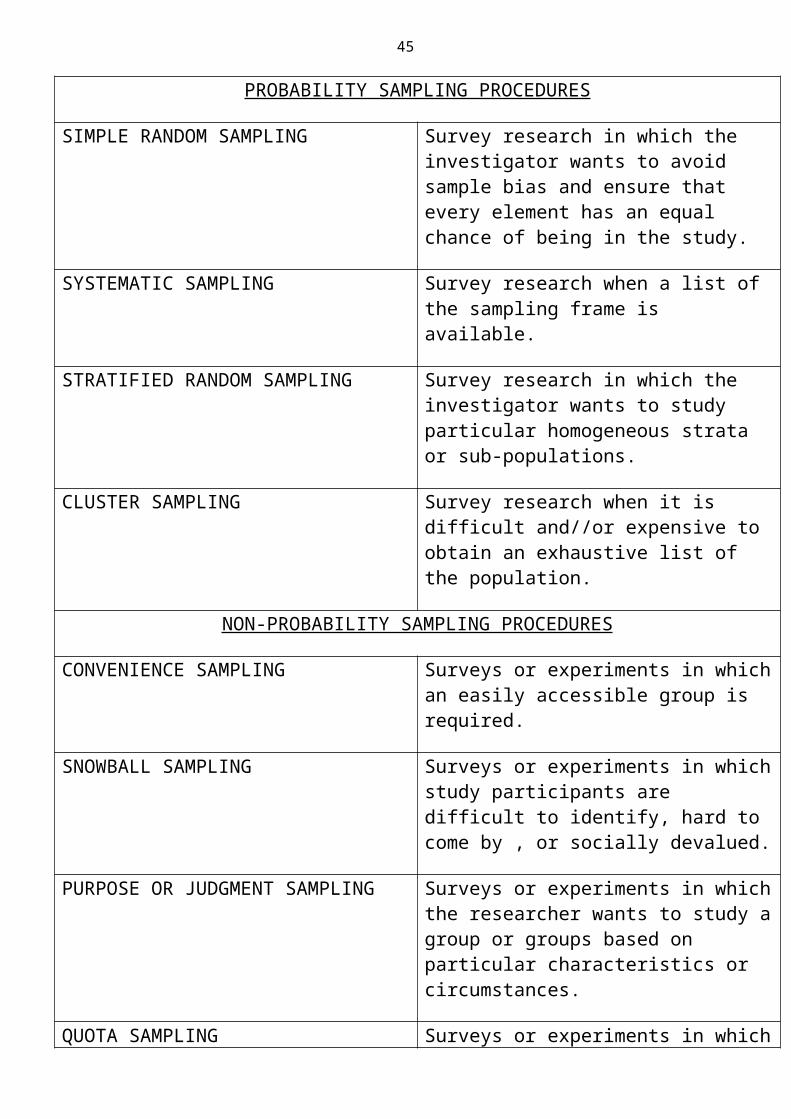
45
vi. Bipolar – two extreme polesvii. Response bias = errors due to individual responses not being truthful.viii.To prevent reponse bias = positive and negative adjectives alternated.ix. This forming of an answering pattern (ie. Marking 2nd x all the time) =
response set.x. Effective measurement of people’s attitudes on certain things.
xii. Both LIKERT and SEMANTIC DIFFERENTIAL scales are ordinal levels of measurement.
xiii.
7.6.3 Properties of scalesProperties = qualities, characteristics, attributesCorrelating = measuring the match between one thing and another.
1. The requirement of reliabilityRELIABILITY = the degree to which a scale yields consistent results/scores.
I.e. if identical investigations are repeated, similar research results will be obtained.
Three EMPIRICAL methods test reliability:1st. TEST-RETEST method
i. Correlating (measuring match between one thing and another) one scale to the same group at different times
ii. Reliability estimated by correlating two sets of scoresiii. ADVANTAGE – one scale used (no unreliability due to
different/many scales used)iv. DISADVANTAGE - respondents might remember answers
Attitudes may change betw. Testsv. Suitable for determining STABILITY component of reliability.
2nd. SPLIT-HALF methodi. Each half scored separately, ie. All odd numbers and all even
numbers, or random selectionii. Reliability estimated according to correlation between scores of
two halves.iii. Suitable for determining the INTERNAL CONSISTENCY
among items.
3rd. EQUIVALENT-FORMS methodi. Also called ALTERNATE-FORMS methodii. Compiling TWO forms that have same items that measure
same phenomenon(any event or experience)iii. Reliability depends on the degree of EQUIVALENCE between
forms.
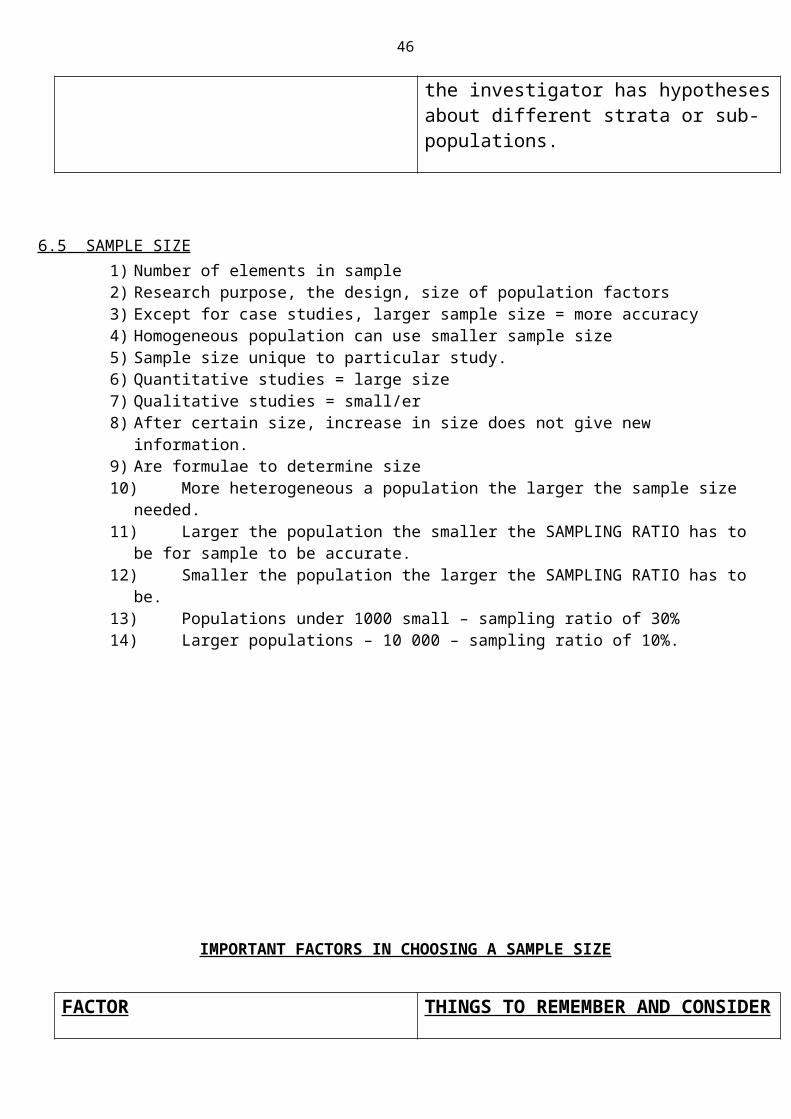
46
iv. Suitable for determining EQUIVALENCY component of instruments’ reliability. I.e. Used when researchers rely on multiple indictors to measure construct.
4th. INTERCODER-reliabilityi. Differs because asks “Do different people interpret (or rate)
things in the same way:” referring to researchers, interviewers.ii. Depends on the extent to which 2+ coders (researchers) are in
agreement.
2. The requirement of validityVALIDITY – a methodological requirement for research methods (such as observation, the use of measuring instruments and other techniques), as well as research results (such as the analysis and interpretation of collected data and conclusions from analysis).
1st. PREDICTIVE validity - instruments ability to measure and predict.1. Eg. IQ will accurately predict how students will perform.2. CRITERION measure is administed at future appropriate time
and compared to predicted scores.3. Degree of validity measured by degree of correlation between
two sets of scores.4. Predictive validity can be determined by comparing results of
one test with another test. Eg. Distribution of demographics can be validated by comparing it to a census bureau.
2nd. CONCURRENT validity similar to predictive validty1. EXCEPT concurrent validity measured by administering
attitude scale and criterion measure at about the SAME time. a. Disadgantage – one data collection activity can
influence the other2. PREDICITIVE and CONCURRENT validity estimated by
measureing how accurately we can PREDICT FUTURE behaviour on an EXTERNAL CRITERION also calledCRITERION VALIDITY
3rd. CONTENT validity – to what degree does the CONTENT of the itemsagree to the CONTENT of the domain (problem, area, field or discipline being researched.
Items can have content validity BUT the scale may not have content validity
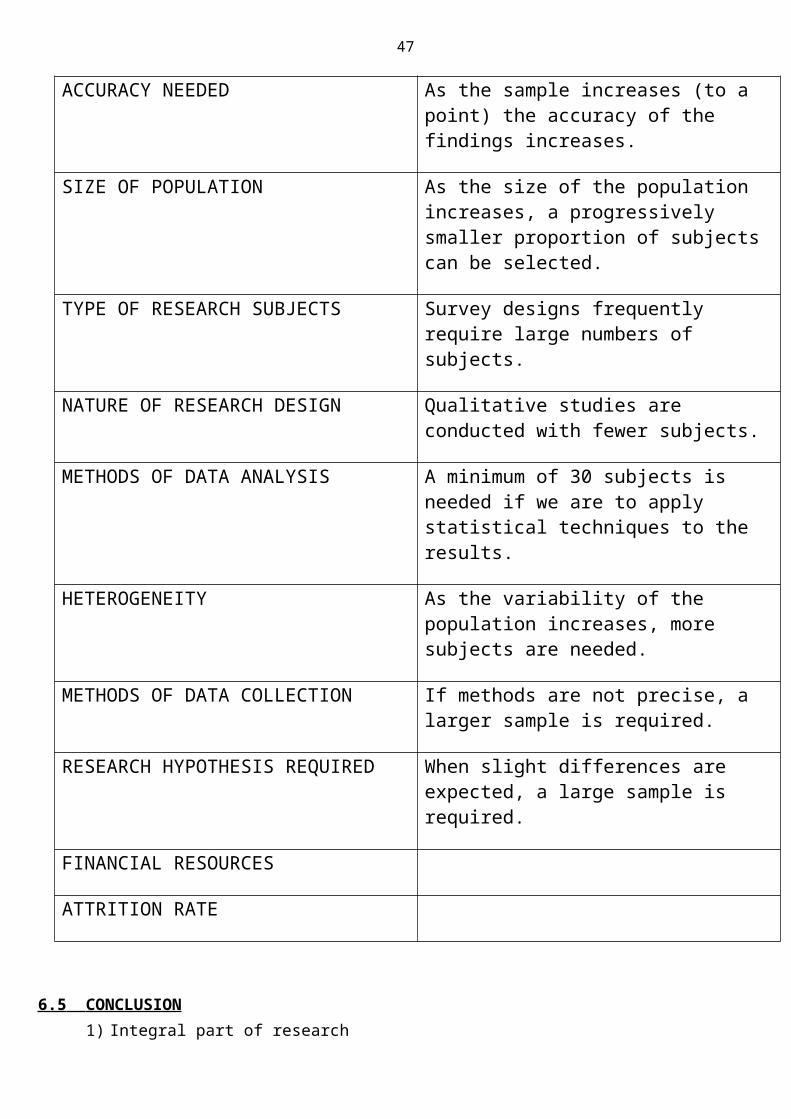
47
To determine is there is content validity need to use subjective procedure
Steps:1. Judge if content of individual item relates to the domain being
researched.2. Judge if total set of items represent all the aspects of the
domain being researched3. Use EXPERT-JURY validity. (use experts in specific domains
to judge content of the scale independently)
4th. CONSTRUCT validity – focuses on WHAT is being measured1. “concerned with the nature of reality adn the nature of
properties being measured”2. Look at CONVERGENCE between associated indicators and
DIVERGENCE between negatively associated indicators.3. Construct validation estimates the extent to which subjects
possess “the characteristic presumed to be reflected by a particular scale or test”
4. Can use multiple measurements of same concepts:a. Eg. People’s attitudes to the death penalty
i. Self-administered questionnairesii. Then face-to-face interviewsiii. Then observe actual behaviour.
7.6.4 Conducting a surveyMust follow steps, but steps NOT fixed.Following are broad guidelines:
1. Construct a measuring instrument, eg. Telephone interview guide, or self-administered questionnaire
2. Conduct a pilot test of the instrument3. Test the reliability and validity of the instrument4. Consider the timing of the survey.
Self-administered questionnaires (posted to respondents) require the following 3 additional guidelines:
5. Self-addressed, stamped envelope6. Covering letter endorsing LEGITIMACY and CREDIBILTY and value of survey7. Follow-up letter to remind about survey.
48
7.6.5 Advantages and limitations of using questionnairesADVANTAGES LIMITATIONS
MAIL1. Cost saving 1. Can’t secure representative sample2. Can reach geographically dispersed people. 2. Slow response3. Via internet and electronic, cheaper. Very useful if doing whole institution.
3. Low response
2. Lack of control over respondents responses
GROUP ADMINISTRATION
1. high response rate 1. not allow follow-up questions2. data collection time short 2. not easy to arrange diverse population to
meet at one place and time3. purpose of survey can be verbally explained4. Questions can be answered.
7.6 OBSERVATIONAL TECHNIQUES (in FIELD RESEARCH)1. To make observations scientific in most cases of field research need to :
a. To have specific purpose, specified by hypothesis/research questionb. Be related to and guided by scientific theoriesc. Procedures must be systematically plannedd. Procedures followed and any deviations must be systematically recoreded.e. Observations must be checked.
2. Three factors that influence researchers observations:a. Selective attentionb. Biasc. Intentions
3. Inferences = making deductions based on, for example, what is observed.4. See SG pg. 197
7.7.1 Forms of field observation1. Participant observation versus nonparticipant observation
a. Participant (field work) – researcher involved in activities, ie. Joins in meals, dancing etc.
b. Nonparticipant – research tapes, records activities.2. Ethnographic research
a. Specific type of participant-observation

49
b. Describes a particular group’s way of life from group’s perspective and point of view
c. Recording devices are used, field notes taken, interviews conductedd. Two forms of ethnographic research:
i. Audience ethnography – describes how audiences experience radio or TV programmes in social context of everyday life
ii. Street ethnography – takes place in certain settings, such as streets, shelter, hostel, studies lives of people like sex workers, drug addicts, etc.
3. Reactive observations versus nonreactive observations .a. Observations that influence the behaviour are called REACTIVE
observations.b. Observations that don’t influence the behaviour are called NONREACTIVE
observations.c. Nonreactive observations = nonparticipant observations and onlooker
observations.d. Nonparticipant observation that is OVERT can have a reactive effecte. If purpose of researcher’s presence not known = UNOBSTRUSIVE
observationf. Group knows researcher there but not why.g. More objectiveh. If hidden recording devices = CONCEALED MEASUREMENTi. Variation called = PARTIAL OBSERVATION = Status of researcher known
but what/who observed is concealed. This limits reactivity.
7.7.2 Conducting field observations1. Whether they are reactive or nonreactive STRUCTURE of observation may vary.2. If knows in advance what is to be observed can structure the observations by
formulating operational definitions andDevising a classification system and measurement scales
3. WHAT IS OBSERVED 1. Depends on research design and theoretical assumptions.2. Eg. If experimental design = observstions can be structured and controlled.3. Four categories of observation in the field in which the researcher exerts NO
control over behaviours:i. EXTERNAL /PHYSICAL SIGNS. Eg. Clothing, jewellery, beards,
tattoosii. KINESICS = facial expressions, gestures and bodily position as
nonverbal communication.iii. PROXEMICS = study of spatial communictiona dn specifically the
distances between two or more peopleProxemics signify status, ownership or control in social interactions.Can use linguistic insulation to enforce ownership of space
iv. LANGUAGE BEHAVIOUR = stuttering, slilps of tongue, silence, who speaks to who, who speaks first.

50
Paralanguage = ‘hhhmmmm’ ‘sshhh’ ‘uh-uh’, etc
4. HOW ARE OBSERVATIONS RECORDED
1. CLASSIFICATION i. Categories, scalesii. Labels given to categories must be operationally defined to ensure
that they clearly reflect:a. What is to be observedb. How the variable to be obervedf will be measuredc. How the measures will be recorded.
iii. Operational definitions of the categories used in classification must meet the discrete, mutually exclulsive adn exhaustive criteria.
iv. It is important to give an operational definition before doing observation because:
a. Operational definitions specify what is to be observed.Makes it easier to replicate research
b. Operational definitions provide exact guidelines on how to measure and record our observations.
c. Operational definitions minimise measurement erros and help us to interpret data more objectively.
2. INSTRUMENTS i. Hardware instruments: audio tape recorders, film cameras,
videotapes, clocks, stopwatches, infrared photography, two-way mirrors electronic eyes.
ii. Software instruments: notepad and pen, interview schedule, classification schemes, check-lists, questionnaire forms. These may contain MEASUREMENT SCALES.
7.7.3 Advantages and limitations of observational techniques.1. ADVANTAGES depend on the following:
i. Difficulties which the researcher may experience to gain entry to the setting
ii. Whether the phenomenon or behaviour being researched occurs with sufficient frequency to make the observation worthwhile.
iii. The technique selected to record the observations.
2. Biggest LIMITATION of field observations is to achieve EXTERNAL validity. I.e. degree to which our findings can be generalised to other similar circumstances.
3. ADVANTAGES of nonreactive observations are that you get more valid information as there are no “false” answers. I.e. subjects not aware they are being observed.

51
4. Field observations ADVANTAGEOUS, because researchers can study behaviour as expressions of deeper values and beliefs and subtle nuances of attitudes. SG. Pg 203
a.
STUDY UNIT 8
DESCRIBING AND INTERPRETING QUANTITATIVE DATA
8.1 INTRODUCTION1. Information often presented in form of numbers2. Quantitative/numerical data
8.2 DESCRIPTIVE STATISTICS1. Procedures used to organise, summarise, visualise quantitative data = DESCRIPTIVE
STATISTICS2. DESCRIPTIVE STATISTICS = MATHEMATICAL TECHNIQUES USED TO SEE
UNDERLYING PATTERNS OF DATA.3. Can be used to support claims 4. Must be verifiable by other researchers .5. Statistics used in popular literature, scientific articles.6. NOT CONCLUSIVE7. Can be abused.8. To stop abuse: clear how data and statistics based on these data have been obtained.9. Also contain sufficient information for other reserarchers to interpret the statistics and reach
own conclusions. SG. Pg 211
8.3 TABLES AND GRAPHS1. Procedures used to compile various descriptive statistics2. SUMMARISE DATA
8.3.1 FREQUENCY DISTRIBUTION GRAPHS.01. Grouping of raw data02. FREQUENCY DISTRIBUTION = TABLE OR GRAPH INDICATING HOW
OBSERVATIONS ARE DISTRIBUTED.03. Frequency distribution table:
a. 1st column = possible scores/relevant categories

52
b. 2nd column = tally (strike through with the 5th mark)c. 3rd column = total frequency, sum of frequency should = number of samples
04. SG pg. 213-21405. Grouped frequency table = scores are grouped into so-called class intervals.06. GROUPED FREQUENCY TABLE: FREQUENCY DISTRIBUTION TABLE WITH A
LIMITED NUMBER OF CATEGORIES.07. CUMULATIVE FREQUENCY = NUMBER OF SCORES BELOW (OR ABOVE) A
CERTAIN VALUE.
8.3.2 PERCENTAGES01. A numerical figure out of 10002. SG. Pg. 215-216
8.3.3 GRAPHIC PRESENTATION OF FREQUENCY DISTRIBUTIONS01. Data can be presented graphically02. Overall impression03. BAR CHARTS
a. Horizontal line = X axis/abscissa = categories/score valuesb. Vertical line = Y axix/ordinate = number of scores/frequenciesc. BAR CHART = GRAPH REPRESENTING THE FREQUENCY
DISTRIBUTION OF CATEGORICAL DATA.d. Reflects DISCRETE data
Male Female0
1
2
3
4
5
6
7
Series 3Series 2Series 1
See SG. Pg. 217
04. HISTOGRAMa. HISTOGRAM = GRAPH REPRESENTING THE FREQUENCY
DISTRIBUTION OF SUCCESSIVE SCORES OR CLASS INTERVALSb. Data is measure on a data/ration interval levelc. Continuous datad. Scores/midpoint of each class interval are marked on the X axis, above
which a bar is drawn
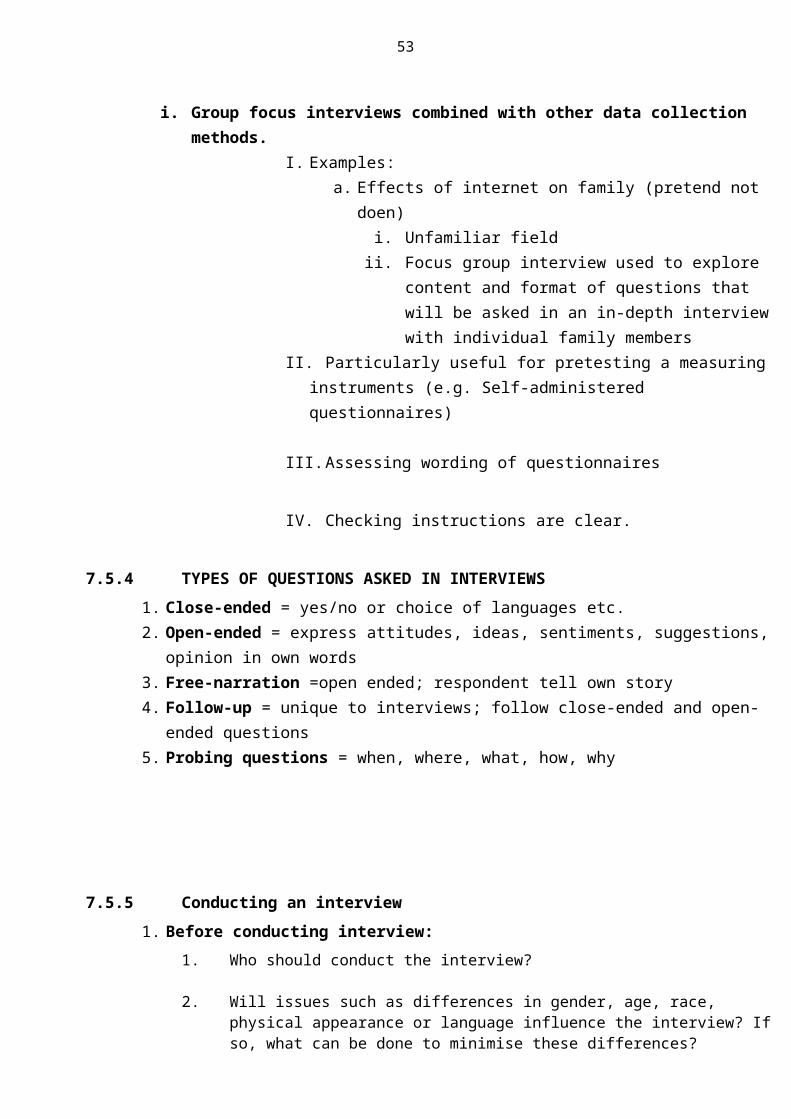
53
e. Y axis is the figure for the frequency or number of cases for that particular score
f. Bars represent successive scores or class intervals NO SPACE between them.
g. The total of the frequencies (Y axis) is the number of cases in our sample.h. Assume class intervals evenly distributed over the range of the interval.
Ag-gress-sion
scores
05
1015202530
Series 1Series 2Series 3
See SG. Pg 218
05. POLYGONa. POLYGON = FREQUENCY POLYGON = GRAPH IN WHICH THE
FREQUENCIES OF CLASS INTERVALS ARE CONNECTED BY STRAIGHT LINES.
b. Marks joined with straight lines.c. Assume that cases are concentrated at the midpoint interval.d. Can accommodate more class intervals than the histogram
Category 1
Category 2
Category 3
Category 4
0
5101520
2530
Series 1Column1Column2
See SG. Pg. 219
8.3.4 SKEWNESS AND KURTOSIS01. Distributions of data differ in CENTRAL LOCATION, VARIATION AND
SKEWNESS.02. SKEWNESS = symmetry/asymmetry, i.e. distribution on either side of peak.03. Symmetrical = same shape on both sides of midpoint.04. If larger frequencies focused on lower end (right) of the variable said to be
POSITIVELY skewed.

54
05. If larger frequencies focused on the higher end of the variable said to be NEGATIVELY skewed.
06. Smooth curves used, especially in large populations.
NORMAL POSITIVELY SKEWED NEGATIVELY SKEWED
07. KURTOSIS = refers to the flatness or peakedness of the distribution.08. Symmetrical, bell shaped distribution = MESOKURTIC09. More peaked distribution = LEPTOKURTIC10. Flatter distribution = PLATYKURTIC
8.4 MEASURES OF CENTRAL TENDENCY1. Used to determine which score or value is CENTRAL to the distribution and can be
Used to summarise ENTIRE DISTRIBUTION.
Leptokurtic
Mesokurtic
Platykurtic

55
2. Score or value used to represent all scores in sample is called MEASURE OF CENTRAL TENDENCY.
3. Three measures of central tendency:a. MODE: SCORE IN A SAMPLE OF SCORES THAT OCCURS WITH THE
GREATEST FREQUENCY.b. MEDIAN: VALUE OR SCORE SUCH THAT HALF THE OBSERVATIONS FALL
ABOVE IT AND HALF FALL BELOW IT.c. MEAN: SUM OF A SAMPLE OF SCORES DIVIDED BY THE NUMBER OF
SCORES IN THE SAMPLE.4. MODE:
a. If 2+ SUCCESSIVE scores have highest frequency, then take averageb. If 2 values, not following each other, have highest frequency, then sample has two
modes. = bimodalc. Bimodal scores not good indicators of mode, central tendency.d. In grouped frequency distribution = mode = to the midpoint of the class interval with
the highest frequency.e. Mode is the only measure of central tendency that can meaningfully be used for
NOMINAL DATA. SG. Pg. 2205. MEDIAN:
a. Arrange scores in ascending/descending order. b. Median falls in the middle.c. If uneven number easy.d. If even number: median is average between the two scores between which the
median falls. SG. Pg. 221e. Both MEDIAN AND MODE can be used with ordinal data, median preferred because
takes into account frequencies AND RANK order.6. MEAN:
a. Is the arithmetic midpoint of the scores and represents all the scores in the sample.b. To calculate:
i. Add all the scoresii. Divide by total number of scores in sample.iii. X refers to raw scoresiv. N refers to number of scores in distributionv. Mean formula = see pg 221 SG
c. Mean can be calculated by using frequency distributiond. Done by multiplying each value of X by the number of times it occurs; these
products are added together and divided by the total number of measurements. SG. Pg. 222
e. All the values of the variable are used in the calculation of the mean, therefore more appropriate measure of central tendency for interval and ratio data.
f. Can be used in mathematical calculations, mode and median cannot.g. More accurate and stable estimate of population h. BUT if 2+ scores differ greatly from rest, will affect the mean, then median preferredi. H=skewed distributionj. The mean, median and mode of a symmetrical frequency will coincide.

56
7. All three measure of central tendency can be used in the case of interval and ration data- BUT THE MEAN IS USUALLY CHOSEN
8.5 MEASURES OF VARIABILITY1. VARAIBLITY = THE EXTENT TO WHICH SCORES IN A SAMPLE DIFFER, THAT IS,
HOW SPREAD OUT THEY ARE.2. Range = difference between the highest and the lowest3. Disadvantage of the range of the distribution as a measure of variability is that it uses only
2 scores in the whole sample4. Another approach = determine the degree to which each score differs (deviates) from the
mean of the sample.5. This can be used as an index of the variability of the scores in the sample.6. Measures of variability = VARIANCE and STANDARD DEVIATION, based on above, i.e.
average difference between each score and the mean is used to express the variability of a sample of scores.
7. Mean is the index of central tendency that bet represents the scores in the sample8. If we see how much each score differs from the mean, then we have an indication of the
extent to which they differ from each other.9. Can therefore determine the variability by SUBTRACTING the mean of the sample from
each raw score in the sample.10. The difference is called the DEVIATION SCORE. Represented by x.11. This score indicates the extent to which each raw score deviates from the mean.12. To determine the variability could add u p the deviation scores but some of the will be
minus and some will be plus – this means that the sum of deviations will be ZERO.13. A way to get rid of negative values is to SQUARE THE DEVIATIONS FROM THE MEAN
BEFORE WE ADD THEM UP.14. The variance of a sample is calculated by:
a. Dividing up the sum of the squared deviation scores by the number of scores to obtain an average of the squared deviation scores.
15. FORMULA : SG. Pg. 22316. Note : the sum of the squares is divided by : n-1 NOT n17. VARIANCE IS A STATISTIC IN SQUARED UNITS.18. Interpret the meaning of the variability of a set of scores in terms of the original units of
measurement.19. Therefore calculate the square root of the variance and this is know s as the standard
deviation of a sample of scores: 20. FORMULA : SG. Pg. 22421. STANDARD DEVIATION: INDEX OF VARIABILITY THAT IS EXPRESSEDIN THE SAME
UNITS AS THE ORIGINAL MEASUREMENT.22. Both variance and standard deviation indicate the average extent to which scores in a
distribution differ from one another.23. Because standard deviation expressed in same units as original measure, researchers
prefer it.
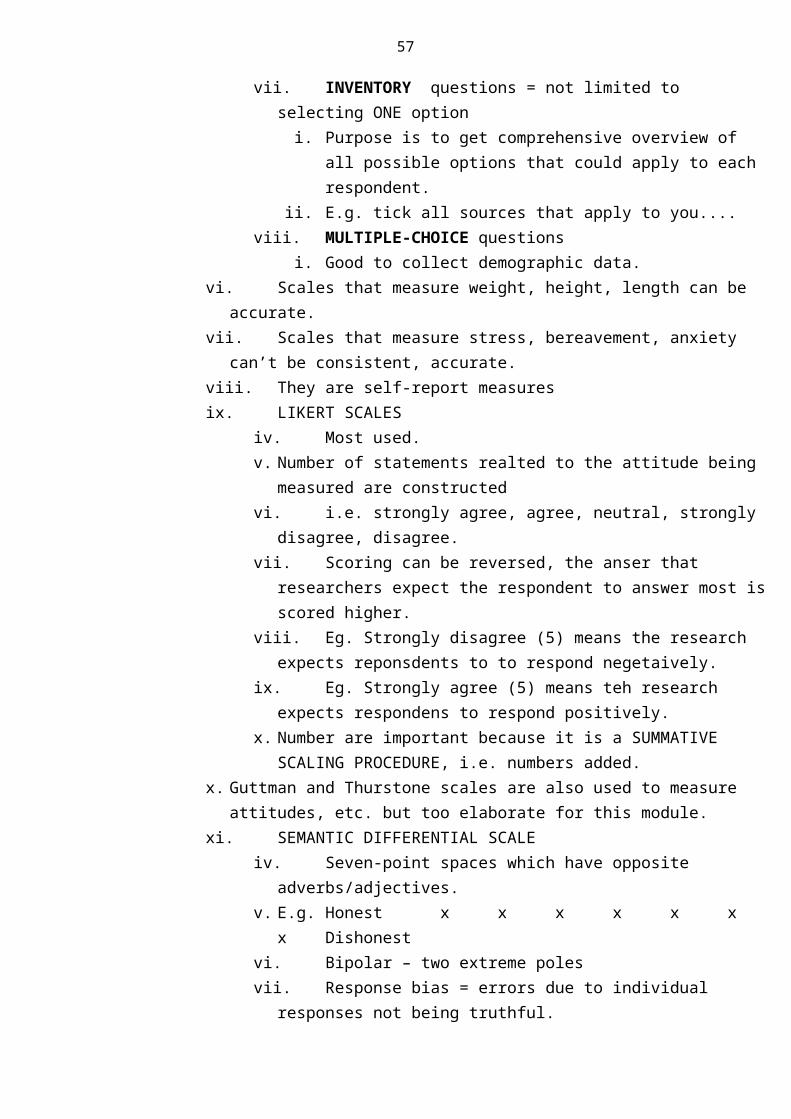
57
8.6 RELATIONSHIPS1. ALL ABOVE PERTAINS TO SINGLE VARIABLE.2. Now discuss relationship between two variables.3. If relationship between two variables, it means that the persons’ position on one variable is
related to his position on the other variable.4. Direct/positive relationship means: relatively high scores on one variable are associated
with relatively high scores on the other variable; low scores on one variable associated with low scores on other variable.
5. Inverse/negative relationship means: high scores on one variable associated with low scores on the other variable and vice versa.
6. Statistical relationship between two variables is the CORRELATION.7. Statistic used to describe this called CORRELATION COEFFICIENT.8. Can range from -1,00 to +1,009. Value close to 0 = weak relationship.
10. 0 means no relationship11. Numerical size of a correlation coefficient indicates the strength of the relationship.12. Sign + or – indicates the direction of the relationship.13. Positive correlation means that an increase in once variable is associated with an increase
in the other.14. A correlation between two variables does not necessarily mean that one variable causes
the other.
8.7 CONCLUSION1. Two types of statistical methods:
a. DESCRIPTIVE used to:i. Organiseii. Summariseiii. Visualise the data
b. INFERENTIAL2. Tables, graphs and calculation of a single representative number makes data easier to
understand and helps identify underlying patterns.3. Use evidence in sample to make generalisations/inferences about the population.

58
STUDY UNIT 9
ANALYSING AND INTERPRETING QUALITATIVE DATA
9.1 INTRODUCTION1. ANALYSIS = THE PROCESS OF USING SPECIFIC PROCEDURES TO WORK THROUGH
DATA COLLECTED.2. INTERPRETATION = THE PROCESS OF MAKING SENSE OF THE DATA ANALYSED.3. QUALITATIVE DATA = INFORMATION EXPRESSED NONNUMERICALLY IN WORDS,
PICTURES OR DIAGRAMS.
9.2 DESCRIBING QUALITATIVE DATA1. NOMOTHETIC = VERIFYING UNIVERSAL PATTERNS.2. IDIOGRAPHIC = SPECIFYING UNIQUE CHARACTERISTICS3. ENUMERATED = EXPRESSED IN NUMBERS.4. FORMALISED = FOLLOWING SET CONVENTIONS AND PROCEDURES.5. Choice between quantitative and qualitative data influenced by particular assumptions
about the nature of reality (ontology) and nature of knowledge (epistemology).6. Choice of explanation most crucial decision in research.7. Can be nomothetic or idiographic8. Quantitative data often used to confirm causal regularities.9. Qualitative researcher does not have to decide between nomothetic and idiographic
explanation10. Definitive characteristic of qualitative data is USE OF WORDS11. For qualitative researechers: knowing about social reality is roote din understanding which
comes from shared meaning generated by experiencing social reality.12. Field research, unstructured interviews and open question used13. DEFOCUSING: BEING OPEN-ENDED AND RECEPTIVE14. RAPPORT – FORGING A FRIENDLY RELATIONSHIP15. UNSTRUCTURED METHODS: = METHODS LACKING PREDETERMINED
PRESDCRIPTIONS AND SPECIFIC GUIDELINES ON WHAT TO COLLECT INFORMATION ABOUT.
16. Qualitative resesrch more flexible, less structured17. Researcher plasy active rold = close engagement18. Flexibility of design, unstructured behavioural methods19. Primary aim = get 1st hand experience20. Data captures character of naturally occurring human behaviour.21. The unique aspect is emphasised = idiographic explanation22. Use of inductively build theory by:
i. Developing concepts to describe happenings in contextii. They are linked to each other = theory based
23. Neuman – 6 characteristics that yeidl qualitative data:i. SOCIAL CONTEXTii. PROCESS AND SEQUENCE of everyday events = understand how events unfoldiii. CASE STUDY because 1 or few get holistic viewiv. GROUNDED THEORY = research process openv. INTERPRETATION = expose meaningfulness of situation, provide coherent
synthesisi. 1st order interpretations = personal

59
ii. 2nd order interpretations = outsiders’/researchers’ understandingvi. INTEGRITY of researcher rely on clients’ direct quotes.
b. GROUNDED THEORY = AN APPROACH THAT CONSTRUCTS THEORY INDUCTIVELY ON THE BASIS OF THE DATA PROVIDED.
c. THIRD- ODER INTERPRETATION = DETERMINING THE GENERAL THEORETICAL IGNIFICANCE OF DATA
d. FIRST – ORDER INTERPRETATION = PARTICIPANTS’ OR RESPONDENTS’ OWN NARRATIVES OR RESPONSES
e. SECOND – ORDER INTERPRETATIN = OUTSIDERS’ OR RESEARCHERS’ UNDERSTANDING.
f. RECONSTRUCTED LOGIC = A RESEARCH PROCESS FORMALLY PLANNED IN TERMS OF A NUMBER OF SEQUENTIAL STEPS.
g. LOGIC IN PRACTICE = A FLEXIBLE RESEARCH PROCESS WITH RECURRING AND OVERLAPPING STEPS.
9.3 RECORDING QUALITATIVE DATA1. NONQUANTITATIVE = NOT EXPRESSED IN NUMBERS.2. Primary storage format is text-based.3. Neuman = 5 types of field notes for analysis, interpretation and write-up of data:
i. Jotted notes – briefii. Direct observation – comprehensive notesiii. Research inference – conclusions of researcheriv. Analytical notes – mental recoreds of strategies researcher followedv. Personal notes – personal feelings, thoughts.
b. Unstructured interviews can generate similar set of notes. (can be tape recorded)
9.4 ANALYSING QUALITATIVE DATA1. CODING = ASSIGNING OR GROUPING SEGMENTS OF DATA TOGETHER.2. DATA SET = A COLLECTION OF ALL THE DATA OBTAINED IN A STUDY3. CROSS-SECTIONAL = USING CODING CATEGORIES UNIFORMALY ACROSS A DATA
SET.4. Order/structure5. Similar to library catalogue6. Data set7. 1st label all text-based and supplementary data
1. Qualitative coding process of conceptualising data.2. Develop categories and assign data to them3. Maintaining contextual meaning is CRUCIAL
1. Qualitative analysis emphasises meaning in the social context2. Everyday concepts are insightful 3. These concepts used as codes4. Found by finding main themes5. Indexing identifies essence of content

60
1. Grouping data:i. Condenses itii. More manageable
2. Can then link items3. Open coding = makes allowances for development and refinement of categories used.4. Inclusive coding = includes all relevant data when data retrieved.5. Categories analytically logical and can be used cross-sectionally6. Because tested against data from context studied = grounded categories7. Coding focuses research
1. Coding intimately linked to analysis2. Cyclical movement between data collection and analysis is continual AND
CONCURRENT3. Axial coding = way to combine data and connect categories
1. Selective coding = number of related categories linked to core category.2. Grounded because from particular setting
1. Cross-sectional coding = compares specific themes from items in a data set2. Non-cross-sectional coding = study particular case, unique.
1. AXIAL CODING = SUBSEQUENT REFINING OF CATEGORIES2. NON-CROSS-SECTIONAL CODING = CODING THAT IS SPECIFIC TO A DATA ITEM
9.5 INTERPRETING QUALITATIVE DATA1. SUCCESSIVE – APPROXIMATION = REFINING CONCEPTS AND INTERPRETATIONS
BY REVIEWING THE DATA SET.2. SATURATION = WHEN NOTHING NEW CAN BE LEARNED FROM COLLECTING MORE
DATA3. ABSTRACTION = FORMING A MENTAL IMAGE BY IDENTIFYING COMMON QUALITIES4. ANALYTIC COMPARISON = COMPARING DATA AND ACTIVELY SEEKING
EXCEPTIONS TO REFINE AND TEST AN EXPLANATION.
1. Interpretation = reflecting on possible meaning of data2. Exploring particular themes3. Ensuring adequate data collected to support researchers’ interpretation4. This called SUCCESSIVE APPROXIMATION.5. Process of interpreting intensifies once the researcher has collected his data.6. Always some work to do7. Only ends with data saturation i.e. subsequent data collection simply reconfirms teh
researchers’ current knowledge. SG. Pg. 247.
1. Central concern = description of the setting is a faithful representation of the context studies.2. Description close to raw data = still selective because it identifies KEY elements.3. Premise that materials ‘speak for themselves’ questionable.4. Research CANNOT SIMPLY BE ANECDOTAL.5. Data has to be reflected upon (interpreted)6. INTERPRETING data is an example of reflection
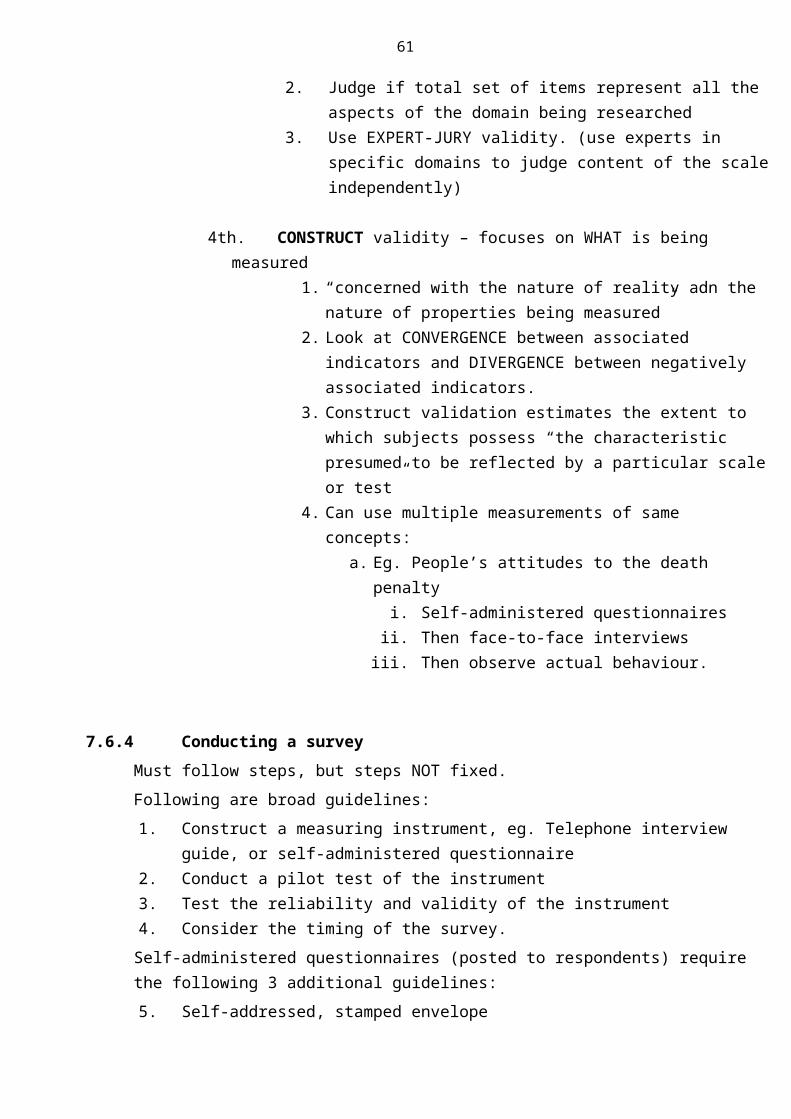
61
1. Description is necessary for interpretation2. Description = how and why questions3. Interpretation = answer why4. Abstraction = inferences drawn
1. Explanations must be credible2. Done by demonstrating alternative explanations considered3. Identify exceptions and contrary evidence.4. Process is constantly comparing across teh data set and searching for “negative or
disconfirming evidence” is know as ANALYTIC COMPARISON. SG. Pg. 247
1. Check data is of good quality. Ie. True.
9.6 USING COMPUTERS1. BOOLEAN SEARCHES = RELYING ON LOGICAL OPERATORS SUCH AS “AND”, “OR”,
“NOT”2. MATRIX = A GRID IN WHICH DATA IS PLACED.
1. Classification of computer programs:
a. WORD PROCESSING packages = text-based data, 1st. very elementary
b. TEXT RETRIEVER systems = search key concepts1st. BOOLEAN SEARCH2nd. Tries determine co-occurrences
c. RELATIONAL DATABASE MANAGEMENT systems = managing the text1st. Organised in a MATRIX2nd. Rows = cases3rd. Columns = fields, categories4th. Link one data set to another5th. But must have one common element6th. Data has to be standardised and formalised7th. Therefore not ideal for qualitative research
d. CODE AND RETRIEVE SOFTWARE = specially tailored for qualitative researchers1st. Flexible2nd. Allows revision and development in coding3rd. Advanced versions automise changes to the
coding scheme and keep record of how coding scheme evolved.
4th. Keywords are attached to chunks of data5th. Then retrieved by using the codes or a
combination of these codes
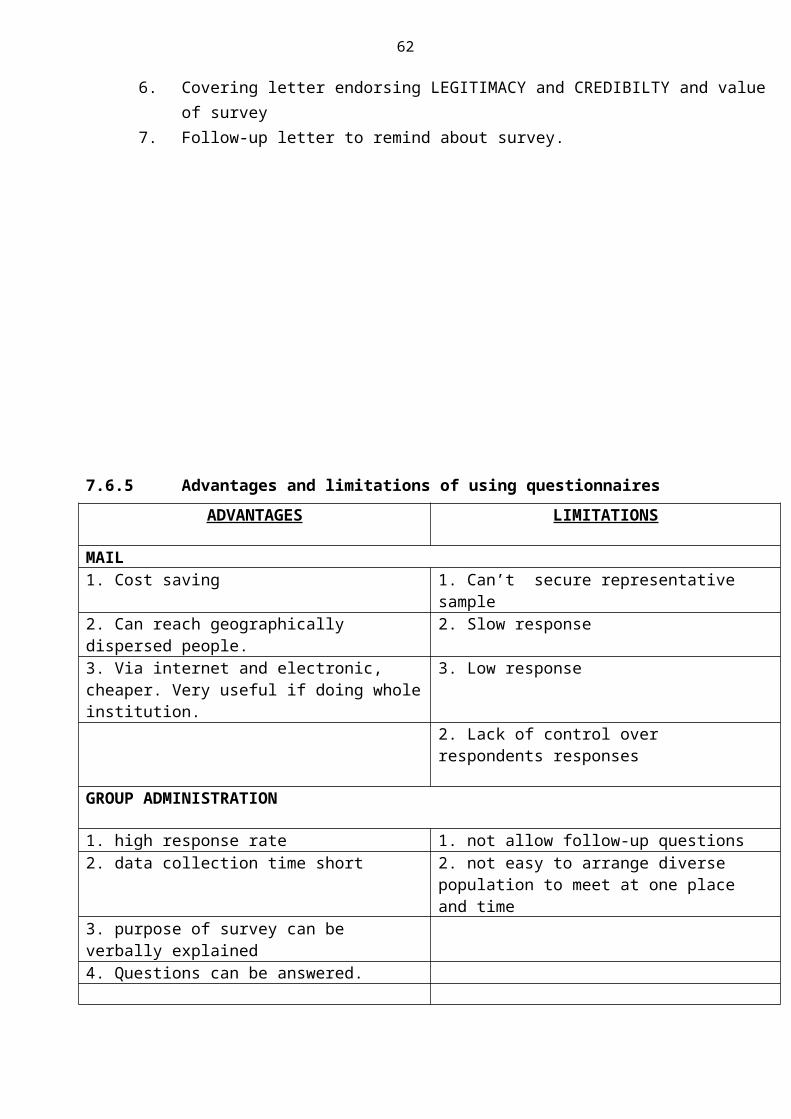
62
e. THEORY AND NETWORK BUILDERS = most ambitious 1st. Develop more complete representation of the
connections between categories of data2nd. Purpose = develop higher-order classification
systems at a conceptual level.3rd. Meta=concepts and meta-codes are built and
networks of nodes and links identified.
1. Specific benefits are:i. Higher accuracy in codingii. Improved data retrievaliii. More systematic organisation of dataiv. Easier access to codes and text-data for comparison purposesv. Better manipulation of datavi. Quicker reproduction of datavii. Ability to manage larger volumes of dataviii. Conduct more cojmplex analyses of this data
1. Criticisms:i. Qualitative data = craft, can’t automateii. Can lead to shallow understandingiii. Danger that research rely too much on computer programmes’ settings
9.7 CONCLUSION1. QUALITATIVE DATA = TENDS TO ENHANCE DATA2. QUANTITATIVE DATA = TENDS TO CONDENSE DATA TO REVEAL GENERAL
PATTERNS.
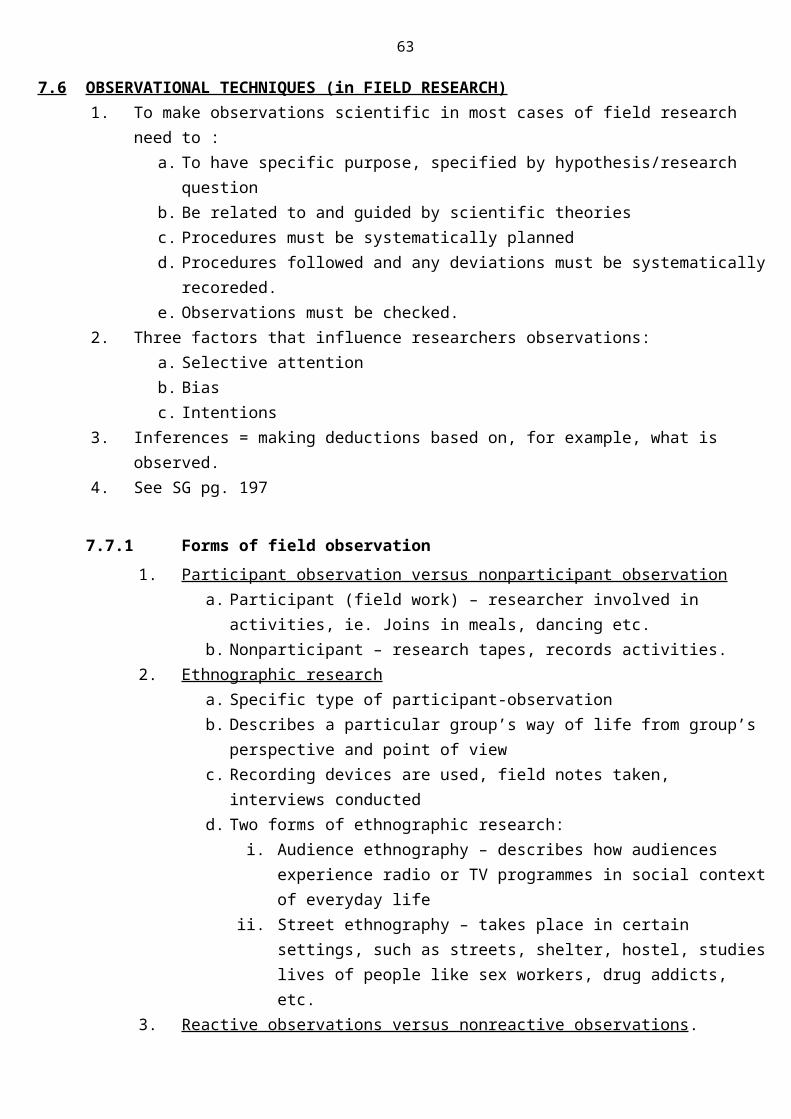
63
STUDY UNIT 10
WRITING AND EVALUATING RESEARCH REPORTS
10.1 INTRODUCTION1. Main research goal = make work known to others2. In this study unit discuss:
a. Functions and characteristics of a research reportb. Different types of reportsc. Organisation of a research reportd. Briefly look at technicalitiese. Guidelines on evaluating a research report.
10.2 FUNCTIONS AND CHARACTERISTICS OF A RESEARCH REPORT1. Babbie (1992) – 3 primary functions of a research report:
a. COMMUNICATES SCIENTIFIC DATA AND IDEAS TO AN AUDIENCEb. CONTRIBUTES TO THE GENERAL BODY OF SCIENTIFIC KNOWLEDGEc. STIMULATES AND DIRECTS FURTHER INQUIRY.
2. Must report accurately3. How much reported depends on nature of research4. If quantitative –
a. Need enough info to replicateb. Must be reliable, valid and objective
5. Archive6. Report = concrete way of putting forward arguments and reasons (empirical and
theoretical) to support findings.
10.3 TYPES OF RESEARCH REPORTS1. Wimmer and Dominick (1994) first step CLEARLY IDENTIFY AUDIENCE.2. TYPES OF RESEARCH REPORTS
01.Written assignmentsi. academic career
02.Presentationsi. seminar/conferenceii. findings important aspect of presentationiii. audio-visual aids, graphic formatsiv. not nec. To discuss methodsv. followed by question and answer sessionvi. distribute hard copies afterwards
03.Journal Articles i. Research mainstay of academic journalsii. Key – write succinctly iii. Reason – time and expenseiv. Raw data not includedv. Information should be accurate, easy to find, relevant and comprehensive

64
vi. If submit to academic journal check format.
04.Commissioned research i. Applied – practical problem needs to be solved.ii. Agency or organisation commission researchiii. Not limited to policy – used to evaluate current practicesa dn resolving
problems in workplace.iv. Need to offer suggestions after research completedv. Usually in-houe for management, there simpler termsvi. Exclude details about sampling, methodology and literature reviewvii. Begin with executive summary of key findings and recommendations of
research viii. Presentation is more flexible than other types of research reports
05.The dissertation and the thesisi. Post-graduate studiesii. DISSERTATION – demonstrates research skills and proves taht can
successfully undertake research independentlyiii. THESIS –
1. Expected to make significant contribution to knowledge of subject2. Strong emphasis on as much details as possible3. Give details of:
a. Precise nature of the research process (eg. Literature review)b. Research design (eg. Sampling, methods used for data
collectionc. Method of interprtationusedd. Format of the report
4. Thesis higher level than dissertationiv. Dissertation and thesis longest type of report because of need for detail
06.Mass mediai. General publicii. After more specialised reports published.iii. Give most basic facts, eg. Size/nature of sample, possible margins of erroriv. Make interesting to publicv. Use journalistic principlesvi. Avoid jargonvii. Data collection techniques, measurement techniques literature review
omitted.
10.4 ORGANISATION OF A REPORT1. Done at same time as research2. Four distinct stages:
01.DEFINITION OF THE PROBLEM02.OBTAINING INFORMATION03.ANALYSING AND INTERPRETING THIS INFORMATION04.MAKING KNOWN THE RESULTS.
3. First step is to identify your intended audience.4. This influences type of report written.5. This also influences the format, style and organisation of your report6. Effective introduction and well-written conclusion very important
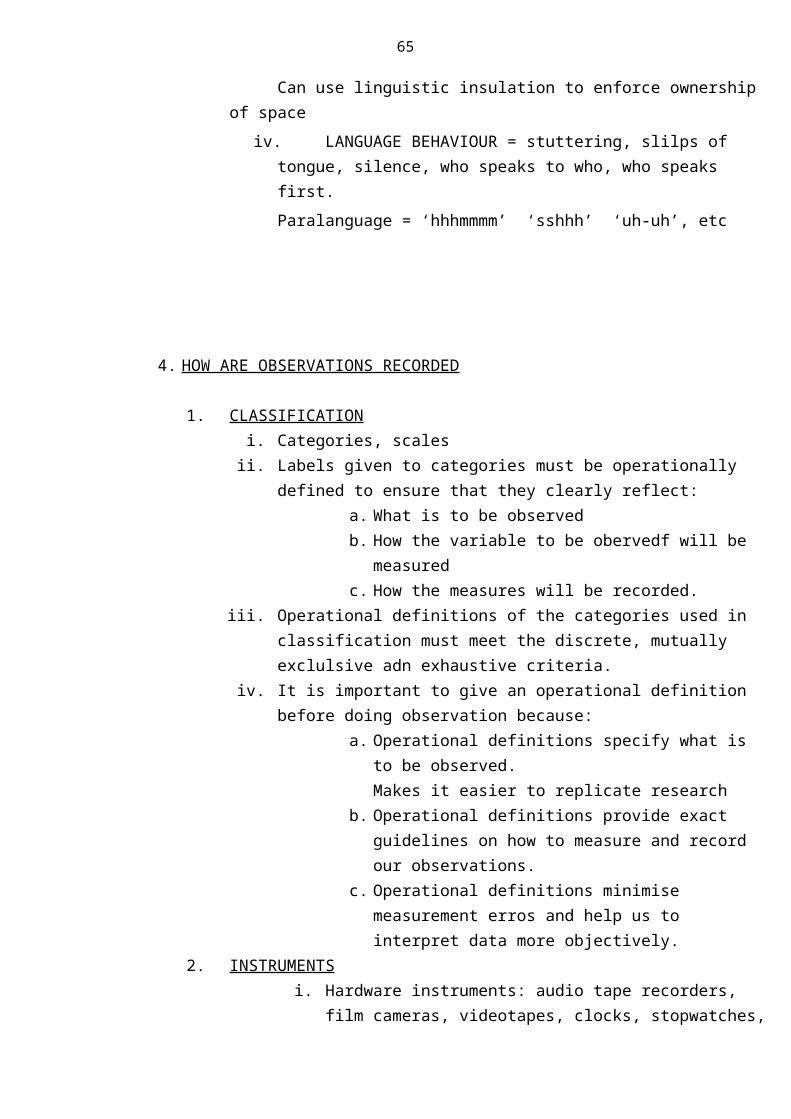
65
7. Body needs to fully describe planning, structuring and process of your research.8. FOUR BROAD AREAS THAT SHOULD BE INCLUDED:
01.DEFINING THE PROBLEM02.OBTAINING THE INFORMATION 03.ANALYSING AND INTERPRETING THE INFORMATION 04.MAKING KNOWN THE RESULTS.
10.4.1 DEFINING THE PROBLEM1. THE RESEARCH PROBLEM
a. Drives the whole processb. Description of problem very importantc. Core concepts need to be clearly defined and explained
2. THE LITERATURE REVIEWa. Summarises work already doneb. Establishes boundariesc. Helps design research pland. Wimmer and Dominick (1994) two important aspects:
i. ACCURACY = CAREFUL, PRECISEii. RELEVANCE = RELATES DIRECTLY TO THE STUDY AT HAND.
10.4.2 OBTAINING THE INFORMATION1. DATA GATHERING
a. Sampleb. Sample sizec. Sample characteristics = description in terms of demographics, lifestyle,
other identifying characteristicsd. Mention representativeness of samplee. Evens that could influence the drawing of that sample
2. METHOD a. How research undertakenb. Intended audience determines amount of detailc. Logical order, describe your method in same order as actually did researchd. Refer to data collection and measuring instruments. E.g. Questionnaire
3. RELIABILITY AND VALIDITY a. Depends on report:
i. Journal article – 1-2 sentencesii. Dissertation/thesis – more detail (appendix)iii. Newspaper report – not even mentioned.
10.4.3 ANALYSING AND INTERPRETING THE INFORMATION1. RESULTS

66
a. Research findingsb. Three elements to consider
i. ILLUSTRATING YOUR FINDINGS1. Charts, tables, figures, graphics use sparingly if for journal.2. If for commissioned research then appropriate
ii. DESCRIPTION OF YOUR ANALYSIS1. Quantitative research = state statistical method.
iii. DESCRIPTION OF FINDINGS1. Must relate directly to your initial problem2. Also to your research questions/hypothesis3. Need to ask self if findings confirm your hypothesis and answer
research questions.2. INTERPRETATION AND DISCUSSION
a. INTERPRETATION = “an analytical process in which you examine your research in order to develop a conceptual understanding of it” SG.pg 264
b. DISCUSSION = “moves beyond interpretation and provides a deeper understanding of the data gathered in relation to the supporting theory, research problem, hypothesis or research questions and explains what has emerged from your research.” SG pg. 264
c. Discussion can link interpretation to conclusion = cohesive wholed. Main objective of this part of report is to consolidate your research.e. Need to :
a. reflect back on what you didb. re-examine data you gathered in research process
f. have to explain concisely wht the results of research mean without repeating self
g. need to be selective and select most appropriate examples to illustrate interpretations
h. Wimmer and Dominick (1994) say 4 following elements should feature in discussion:i. SUMMARISEii. IMPLICATIONSiii. LIMITATIONSiv. SUGGESTIONS FOR FUTURE RESEARCH
10.4.4 MAKING KNOW THE RESULTS1. THE INTRODUCTION
a. Part of fourth and final stage of research processb. Function – lead reader into reportc. State outline, goals and particular point of view about researchd. Wimmer and Dominick (1994) three aspects found in report:
i. State the problemii. Explain the theoretical framework that you used to explain your
findingsiii. Justify the research

67
iv. Indicate the aim of the research SG. Pg. 265
2. THE CONCLUSIONa. Research report should end not just stopb. Make it clear you said something importantc. Brief summary of your findings
3. THE ABSTRACTa. If intended for academic journal, dissertation, thesis must provide short
summary (150-500 words) highlighting key points in research work.b. Abstracts are published in databases, eg. Dissertations abstracts, useful
for making your work accessible to other researchers.
10.5 TECHNICALITIES1. Most important = GOOD ENGLISH/LANGUAGE2. Formal style of writing3. 3rd person4. Stick to a tense5. Format depends on purpose of report6. Ultimate length also depends on certain factors, eg. Line spacing, etc.7. CONVENTIONS = A GENERAL AGREEMENT REGARDING CERTAIN RULES
USE OF TENSES IN A RESEARCH REPORT
PRESENT TENSE Describing accepted knowledge “Public Service Broadcasting is in a crisis.”
PRESENT TENSE Referring to information in your paper
“The results are summarised i Table 1”
PRESENT TENSE Discussing findings and conclusions
“These findings imply ....”
PRESENT PERFECT TENSE Describing events that have occurred over an unspecified period of time in the past up to the present
“Several researchers have evaluated this model.”
PAST TENSE Describing events that occurred at a specific time in the past
“Collins (1994) analysed the content...”
PAST TENSE Describing your methods and your results
“The content was coded into twelve categories.”Category A had a score of 27%”
8. Plug (1993) identifies five stylistic characteristics for good scientific writing:01.Write SYSTEMATICALLY02.Write CLEARLY

68
03.Write PRECISELY04.Write DIRECTLY and SIMPLY05.Write CONCISELY
9. Be PARSIMONIOUS 10.PARSIMONY = USING NO MORE THAN IS STRICTLY NEEDED.11.Other aspects not for this course SG. Pg 270-271
10.6 EVALUATING A REPORT
10.6.1 Definition of the problem& Is the title clear and appropriate?& Does the introduction establish the purpose of the research?& Does the introduction justify the need for the research?& Does the introduction outline what is to follow in the report?Is the introduction limited in length?& Is the research problem clearly stated?& Are research questions and/or hypotheses given?& Are the hypotheses clear, testable and specific?& Does the literature review critique relevant previous studies?& Is relevant knowledge presented in the literature review?& Has the researcher adequately discussed relevant literature?& Does the research identify gaps in knowledge?& Are the theoretical aspects of the research work clearly described?& Does the theory fit the study?& Have key constructs been identified in the literature review?& Does the research build on that discussed in the literature review?& Is there evidence that the research was properly planned?& Are key concepts clearly explained?
10.6.2 Obtaining the informationAre the methods described in enough detail to allow replication?& Is a rationale given for the methods selected?& Is the research design appropriate for resolving the research problem?& Are variables operationally defined?& Is the sampling procedure described?& Is the sample size adequate?& Is the sample representative of the defined population?& Is the reliability of the study clearly explained?& Was any form of validity established?& Is this validity adequate?
10.6.3 Analysing and interpreting the information& Is the data depicted accurately?& Is the data analysis appropriate and correctly executed?& Have alternative interpretations of findings been considered?& Is the discussion of the findings relevant to the problem being investigated?& Are the findings explained in terms of any particular theory?& Is this theory adequate for explaining the findings?& Are the conclusions valid and important?& Does the conclusion correlate with the introduction?
10.6.4 Technicalities

69
& Is the report organised logically?& Does the report comply with the style conventions for this type of report?& Is the length of the report acceptable?& Is the abstract an accurate reflection of the research?& Are tables and figures clear and understandable?& Is the statistical test appropriate for the type of data collected?& Is the use of punctuation correct?& Are all quotations suitable and correctly acknowledged?Are sources correctly referenced?Is there a bibliography?& Are the words and jargon used appropriate?& Does the report contain grammatical error?Are there spelling mistakes
1. Can’t PASS JUDGMENT ON AN EVALUATION,2. LANGUAGE OF REPORT IMPORTANT, I.E HOW IT IS WRITTEN
10.7 CONCLUSION 1. Looked at characteristics of research report2. Looked at 6 different types of research report3. Looked at different formats for each4. Explained that these formats depend on audience, purpose and complexity of research
concerned5. Conclude with why it is important to have research report evaluated, and how to evaluate
a research report.6. Publishing concludes research process but public nature of report lets it be continually
discussed and argued.