study results drought scenario study this slide deck contains results from the 2011 teppc study...
TRANSCRIPT

Study Results
Drought Scenario Study
This slide deck contains results from the 2011 TEPPC Study Program. This study shows the impact in the interconection of increased thermal plant forced outages and decreased hydro caused by drought conditions.

2
• Central Question: What impact do changes in thermal plant operation and hydro generation availability have on transmission utilization, production cost, and the ability of the Western Interconnection to continue serving its load obligation?
• Change to starting input assumptions:o Loads – Peak demand increased to reflect higher
temperatures in drought year (inputs provided by NREL)o Transmission System – Noneo Generation – Low hydro (2001) data used; increased
thermal plant forced outages modeled (inputs provided by Argonne National Laboratory)
• Results follow…
2022 PC7 WGA Drought Study

3
• 1977 western drought• Selected due to severity and coincidence within multiple basins• Defined by USGS HUC-2 Basin flows
Drought Condition Selected for Study
Presented by Chris Harto (ANL) on Nov 15 DWG call

4
Modeling of Hydro Generation
Presented by Chris Harto on Nov 15 DWG call
Miss
ouri
TX Gulf
Rio Gra
nde
Upper
CO
Lower
Co
Great
Bas
in
Pacific
NW
Califo
rnia
0.000
0.050
0.100
0.150
0.200
0.250
Worst Case Loss of Generation 1977 Scenario
Thermo
Hydro
Fra
ctio
n o
f to
tal
gen
erat
ion
lo
st (
MW
h
bas
is)
Miss
ouri
TX Gulf
Rio Gra
nde
Upper
CO
Lower
Co
Great
Bas
in
Pacific
NW
Califo
rnia
0.000
0.050
0.100
0.150
0.200
0.250
Worst Case Loss of Generation 2001 Scenario
Thermo
Hydro
Fra
ctio
n o
f to
tal
gen
erat
ion
lo
st (
MW
h
bas
is)
Hydroelectric Generation :Same as TEPPC low flow hydro case (2001)
Differences:• Slight overestimation of impact
to Pacific NW and CA• Slight underestimation for Great
Basin and Lower CO

5
• “At-risk” thermal plants identified based on their dependence upon surface water for cooling
• Impacted plants identified in sub-basins where flow under drought was less than 50% of normal flowo List of impacted plants in WECC will not be reported
since no plant-specific analysis of drought mitigation plans was conducted
• Impact to “at-risk” plants modeled as increased forced outage rates
Impact of Drought on Thermal Plants
6
• Based on estimate of lost generation• Calculated using EIA data for impacted
plants• Lost generation proportional to the loss of
flow relative to the minimum of the average basin flow or 2010 water demand
• Lost generation was allocated monthly based on deviation from normal flow in that month relative to other months
Determining Increased Forced Outage Rates (Down Days)

7
Overview of Lost Thermoelectric Generation
Basin Lower Colorado CaliforniaLost Generation (MWh) 6,470,000 4,670,000
at risk capacity under 50% historical flow (MW) 1,908 1,791
at risk with WECC equivalent found (MW) 1,837 1460*
Fraction of at risk capacity found in WECC database 0.96 0.82average down days 147 133day/month 12.2 11.1*Includes 407 MW of CA geothermal at risk

8
Monthly Variability in Lost Generation
Lower Colorado California
Flow RatioLost Generation
MWh Down Days Flow RatioLost Generation
MWh Down Days
JAN 0.3649 1,097,515 24.9 0.2632 652,592 18.6
FEB 0.2935 1,220,901 27.7 0.2538 660,918 18.9
MAR 0.5556 767,967 17.4 0.2783 639,218 18.2
APR 0.6923 531,736 12.1 0.292 627,083 17.9
MAY 0.6667 575,975 13.1 0.3013 618,846 17.7
JUN 0.8182 314,168 7.1 0.4333 501,932 14.3
JUL 1.125 0 0.0 0.6183 338,076 9.6
AUG 0.931 119,239 2.7 0.6788 284,490 8.1
SEP 0.8571 246,945 5.6 0.6592 301,850 8.6
OCT 0.878 210,828 4.8 0.6438 315,490 9.0
NOV 0.4737 909,498 20.6 1.2627 0 0.0
DEC 0.6 691,239 15.7 1.0427 0 0.0

9
• Forced outage rates modified to reflect increased “down days” for all impacted plants within a basin
All impacted plants assumed to be down the same number of days in a given month
• Overlap allowed with scheduled maintenance
Modifying Forced Outage Rates

10
• Developed by NREL• Basis for demand changes: ‘99 California
Energy Commission Study titled High Temperatures & Electricity Demand: An Assessment of Supply Adequacy in California, Trends & Outlooko Study provided an estimate for the change in
peak demand for 17 areas in the WSCC for two high temperature scenarios (1-in-5 and 1-in-40 probability)
Impact of Drought on Demand

11
1. Match 17 WSCC areas to 2022 TEPPC load bubbles
2. Identify hottest month for each load area in 1977 (Drought year)
3. Increase peak demand for this month only by the 1-in-40 % change value reported for the WSCC area in the CEC studyo Monthly energy was increased by ½ of the peak
demand change to preserve the demand shape
Peak Load Adjustment Method
12
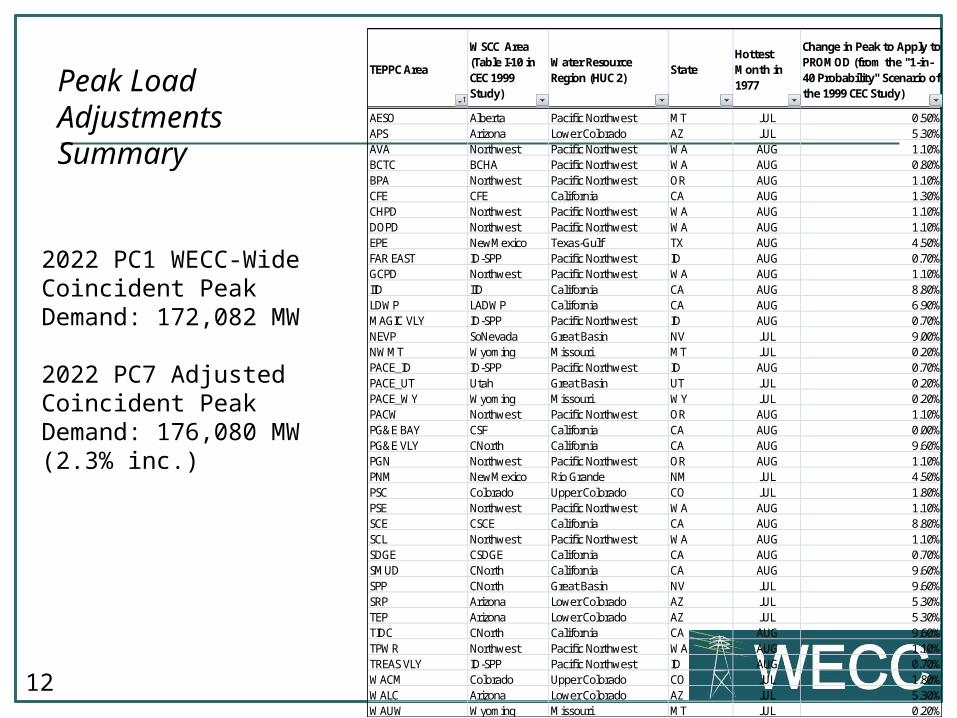
Peak Load Adjustments Summary
TEPPC Area
WSCC Area (Table I-10 in CEC 1999 Study)
Water Resource Region (HUC 2)
StateHottest Month in 1977
Change in Peak to Apply to PROMOD (from the "1-in-40 Probability" Scenario of the 1999 CEC Study)
AESO Alberta Pacific Northwest MT JUL 0.50%APS Arizona Lower Colorado AZ JUL 5.30%AVA Northwest Pacific Northwest WA AUG 1.10%BCTC BCHA Pacific Northwest WA AUG 0.80%BPA Northwest Pacific Northwest OR AUG 1.10%CFE CFE California CA AUG 1.30%CHPD Northwest Pacific Northwest WA AUG 1.10%DOPD Northwest Pacific Northwest WA AUG 1.10%EPE NewMexico Texas-Gulf TX AUG 4.50%FAR EAST ID-SPP Pacific Northwest ID AUG 0.70%GCPD Northwest Pacific Northwest WA AUG 1.10%IID IID California CA AUG 8.80%LDWP LADWP California CA AUG 6.90%MAGIC VLY ID-SPP Pacific Northwest ID AUG 0.70%NEVP SoNevada Great Basin NV JUL 9.00%NWMT Wyoming Missouri MT JUL 0.20%PACE_ID ID-SPP Pacific Northwest ID AUG 0.70%PACE_UT Utah Great Basin UT JUL 0.20%PACE_WY Wyoming Missouri WY JUL 0.20%PACW Northwest Pacific Northwest OR AUG 1.10%PG&E BAY CSF California CA AUG 0.00%PG&E VLY CNorth California CA AUG 9.60%PGN Northwest Pacific Northwest OR AUG 1.10%PNM NewMexico Rio Grande NM JUL 4.50%PSC Colorado Upper Colorado CO JUL 1.80%PSE Northwest Pacific Northwest WA AUG 1.10%SCE CSCE California CA AUG 8.80%SCL Northwest Pacific Northwest WA AUG 1.10%SDGE CSDGE California CA AUG 0.70%SMUD CNorth California CA AUG 9.60%SPP CNorth Great Basin NV JUL 9.60%SRP Arizona Lower Colorado AZ JUL 5.30%TEP Arizona Lower Colorado AZ JUL 5.30%TIDC CNorth California CA AUG 9.60%TPWR Northwest Pacific Northwest WA AUG 1.10%TREAS VLY ID-SPP Pacific Northwest ID AUG 0.70%WACM Colorado Upper Colorado CO JUL 1.80%WALC Arizona Lower Colorado AZ JUL 5.30%WAUW Wyoming Missouri MT JUL 0.20%
2022 PC1 WECC-Wide Coincident Peak Demand: 172,082 MW
2022 PC7 Adjusted Coincident Peak Demand: 176,080 MW (2.3% inc.)

13
Conventional Hydro
Pumped Storage
Steam - Coal
Steam - Other
Nuclear
Combined Cycle
Combustion Turbine
Cogeneration
IC
Negative Bus Load
Biomass RPS
Geothermal
Small Hydro RPS
Solar
Wind
(40,000,000) (20,000,000) 0 20,000,000 40,000,000
Annual Energy Difference: 2022 PC1 Common Case vs. 2022 PC7 WGA Drought
GWh
2022 WGA Drought – Changes in Total Annual Generation vs. Common Case
GWh
Low Hydro Results
Other Results (see TEPPC Glossary for definitions)
PC1 PC7 DifferenceDump Energy (MWh) 397,104 298,827 (98,277) -24.748%Emergency Energy (MWh) 2,676 3,063 386 14.436%
CO2 Emissions (MMetricTons) 359 373 14 3.936%
CO2 Adder ($/metric ton) 0.000 0.000
Variable Production Cost (thermal units excl DSM)
CO2 Adder (Total M$) 0 0 0 0.000%
Other Variable Costs (M$) 14,851 16,262 1,411 9.502%
Total Var. Prod. Cost (M$) 14,851 16,262 1,411 9.502%
Only an increase in areas with emergency in the Common Case (CFE, AESO)

14
2022 WGA Drought – Changes in Total Annual Generation vs. Low Hydro
Conventional Hydro
Pumped Storage
Steam - Coal
Steam - Other
Nuclear
Combined Cycle
Combustion Turbine
Cogeneration
IC
Negative Bus Load
Biomass RPS
Geothermal
Small Hydro RPS
Solar
Wind
(4,000,000) (2,000,000) 0 2,000,000 4,000,000 6,000,000
Annual Energy Difference: 2022 PC1-2 Low Hydro Sensitivity vs. 2022 PC7 WGA Drought
GWhGWh
Other Results (see TEPPC Glossary for definitions)
PC1-2 PC7 DifferenceDump Energy (MWh) 315,155 298,827 (16,327) -5.181%Emergency Energy (MWh) 2,825 3,063 237 8.403%
CO2 Emissions (MMetricTons) 374 373 (1) -0.170%
CO2 Adder ($/metric ton) 0.000 0.000
Variable Production Cost (thermal units excl DSM)
CO2 Adder (Total M$) 0 0 0 0.000%
Other Variable Costs (M$) 16,064 16,262 198 1.233%
Total Var. Prod. Cost (M$) 16,064 16,262 198 1.233%

15
2022 WGA Drought – Changes in Generation by State vs. Common Case
Alberta
Arizon
a
British
Colu
mbia
Califo
rnia
Colora
do
Idah
o
Mex
ico
Mon
tana
Nevad
a
New M
exico
Orego
n
South
Dak
ota
Texas
Utah
Was
hingt
on
Wyo
ming
-20,000,000
-15,000,000
-10,000,000
-5,000,000
0
5,000,000
10,000,000
15,000,000
20,000,000
Annual Energy Difference: 2022 PC1 Common Case vs. 2022 PC7 WGA Drought
Hydro+PS Steam - Boiler Combined Cycle Combustion Turbine
Cogeneration Renewable Other
GWh
Low Hydro Results

16
2022 WGA Drought – Changes in Generation by State vs. Low Hydro
Alberta
Arizon
a
British
Colu
mbia
Califo
rnia
Colora
do
Idah
o
Mex
ico
Mon
tana
Nevad
a
New M
exico
Orego
n
South
Dak
ota
Texas
Utah
Was
hingt
on
Wyo
ming
-4,000,000
-3,000,000
-2,000,000
-1,000,000
0
1,000,000
2,000,000
Annual Energy Difference: 2022 PC1-2 Low Hydro Sensitivity vs. 2022 PC7 WGA Drought
Hydro+PS Steam - Boiler Combined Cycle Combustion Turbine
Cogeneration Renewable Other
GWh
Result of increased forced outages applied to plants in the Lower Colorado water basin
Result of increased forced outages applied to plants in the California water basin

17
2022 WGA Drought – Changes in Region to Region Transfers
AZNMNV To Ca_S
Basin To AZNMNV
Basin To Ca_N
Basin To Ca_S
Ca_N To Ca_S
Canada To NWUS
NWUS To Basin
NWUS To Ca_N
NWUS To Ca_S
RMPA To AZNMNV
RMPA To Basin
-1000
-500
0
500
1000
1500
2000
2500
3000
3500
Region to Region Transfers - aMW
2022 2022 PC1-2 2022 PC7

18
2022 WGA Drought – Changes in Transmission Utilization
P45 SDG&E-CFE
P29 Intermountain-Gonder
P26 Northern-Southern California
P03 Northwest-British Columbia
P47 – Southern New Mexico
Most Heavily Utilized PathsIncreases in U90 Relative to Common >5% Case Indicated in Red
P08 Montana to Northwest
P60 Inyo-Control
P27 IPP DC Line
P11 West of Crossover
P10 West of Colstrip
P01 Alberta-British Columbia
Most Heavily Utilized Paths U75 U90 U99
P45 SDG&E-CFE 43.54% 35.30% 30.87%P08 Montana to Northwest 67.18% 34.59% 16.27%P03 Northwest-British Columbia 52.68% 32.47% 20.78%P29 Intermountain-Gonder 230 kV 46.63% 23.50% 12.59%P47 Southern New Mexico (NM1) 44.46% 22.07% 8.95%P26 Northern-Southern California 29.32% 17.91% 12.21%P01 Alberta-British Columbia 16.60% 13.47% 11.77%P11 West of Crossover 68.11% 5.38% 0.00%P10 West of Colstrip 56.47% 0.00% 0.00%

Questions or thoughts on this study?