study report sr219 construction industry productivity
TRANSCRIPT

STUDY REPORT SR 219 (2010)
Construction Industry Productivity
I.C. Page
The work reported here was funded by BRANZ from the Building Research Levy.
© BRANZ 2010
ISSN: 1179-6197

i
Preface This report discusses the various industry productivity metrics available and their uses. Factors affecting productivity are identified and recommendations for productivity improvement at various levels of the industry are made. A builders’ survey of factors affecting productivity is reported. Acknowledgments This work was funded by the Building Research Levy. Note This report is intended for principals and managers of design and construction firms.

ii
Construction Industry Productivity BRANZ Study Report SR 219 I.C. Page Abstract There are various definitions of productivity for the building industry and some confusion as to what is meant by the term. This study examines the various definitions and suggests two indexes to be used for monitoring the industry. Monitoring productivity is impeded by lack of timely data and currently in New Zealand a two-year wait is necessary before the more exact productivity metrics can be calculated. A quicker partial productivity measure is suggested for monitoring short-term trends. A limited breakdown of productivity by industry sector is provided.
Factors influencing a realistic productivity measurement are discussed, including how quality and an aging building stock are considered. Builders were surveyed on their opinion of influences on new housing costs, and some site and design specific characteristics (e.g. plan complexity and site slope) were found to be relevant. Another survey looked at building industry productivity and found it was affected by firm organisation, level of skills and the design details. The literature indicates the presence of quality control systems and benchmarking has net financial benefits, and quality-cost trade-offs are best considered at the firm or project level.

iii
Contents
1. INTRODUCTION ............................................................................................................................... 1
2. SUMMARY ......................................................................................................................................... 1
3. LITERATURE REVIEW .................................................................................................................... 2
4. DEFINING PRODUCTIVITY ........................................................................................................... 4
4.1 Work placed per person ............................................................................................................................. 5 4.2 Work placed by work type .......................................................................................................................... 7 4.3 Value-added per person .............................................................................................................................. 7 4.4 Multi-factor productivity indexes ....................................................................................................... 10 4.5 Production functions ................................................................................................................................... 11 4.6 Preferred productivity measure ........................................................................................................... 11
4.6.1 Pros and cons of the various measures of productivity ........................................... 12
5. AREAS FOR PRODUCTIVITY IMPROVEMENT ....................................................................... 13
5.1 Individual project level ............................................................................................................................. 13 5.2 Firm level ........................................................................................................................................................... 14 5.3 Industry-wide level ...................................................................................................................................... 15
6. BUILDERS' SURVEY OF FACTORS AFFECTING COSTS AND PRODUCTIVITY ............. 16
7. DISCUSSION .................................................................................................................................. 17
8. FURTHER WORK ........................................................................................................................... 18
9. REFERENCES .................................................................................................................................. 19
10. APPENDIX ....................................................................................................................................... 21
10.1 Employment within various sectors of building and construction ................................ 21 10.2 Multi-factor productivity calculations ............................................................................................ 27 10.3 Modelling productivity with a production function ................................................................ 29 10.4 1979 Building and construction census ........................................................................................ 32 10.5 Survey of factors affecting new housing costs ......................................................................... 32 10.6 Survey of factors affecting building industry productivity ................................................ 34
Figure 1. Value of work placed per worker.............................................................................. 5 Figure 2. Capital formation types by selected countries .......................................................... 6 Figure 3. Labour productivity .................................................................................................. 8 Figure 4. Multi-factor productivity construction industry ........................................................ 10 Figure 5. MFP and workloads ............................................................................................... 16 Figure 6. Production function regression model .................................................................... 31 Figure 7. Value-added by firm size 1979 construction census .............................................. 32 Figure 8. Factors influencing new housing costs – average score ........................................ 33

iv
Figure 9. Factors influencing new housing costs – % saying very important ......................... 34 Figure 10. Survey of productivity factors – new house builders ............................................ 35 Figure 11. Survey of productivity factors – non-residential builders ...................................... 35 Table 1. Work placed per construction person ........................................................................ 6 Table 2. Value-added per worker by sub-industry ................................................................... 9 Table 3. Innovation in construction ....................................................................................... 15 Table 4. Capital formation and employment ......................................................................... 22 Table 5. Employment regressed against value of work ......................................................... 23 Table 6. Employment from the Business Demographic Survey (BDS) .................................. 25 Table 7. Sub-industry employment modelling ....................................................................... 26 Table 8. MFP calculations .................................................................................................... 27 Table 9. Labour and capital income shares .......................................................................... 28 Table 10. Construction industry value-added, employment and capital stock ....................... 30 Table 11. Production function regression analysis ................................................................ 31 Table 12. Cost factors for new housing ................................................................................ 36 Table 13. Productivity in the building industry ....................................................................... 37

1
1. INTRODUCTION Productivity growth is the basis for an increase in incomes and welfare in society and the building industry needs to be as efficient as possible in order to contribute to the overall economy. There have been many studies here and overseas which find that productivity performance in the building and construction industry compares poorly to other industries. This report examines existing research on productivity, including measurement and reasons for poor productivity, and identifies some actions that the industry can undertake to improve its performance.
2. SUMMARY The main findings are:
A multi-factor productivity (MFP) index should be used for the construction industry. An index developed about work for the Department of Building and Housing (DBH) (Davis, 2007) is a suitable measure, but is subject to data delays.
A labour productivity index, which is more timely but less accurate, is suggested for monitoring trends every quarter. Two versions of this are suggested: value-added, and capital formation, divided by the number of persons employed. They represent within-industry trends and industry plus supplier (manufacturers, designers) trends, respectively.
In terms of value-added by the industry, workers in the civil engineering sector are the most ‘productive’ at about $69,000 per worker, followed by all buildings (residential and non-residential) at $58,000. The sub-contractors have $52,000 per worker.
The alternative measure of capital formation per worker gives $156,000 per worker for residential buildings, $82,000 per worker for non-residential buildings work, and $142,000 per worker for civil engineering. This measure includes the efficiency gains of suppliers outside the industry (e.g. manufacturers, designers).
Labour productivity in the whole industry has been declining by about 0.1% per year since 1988. MFP, which allows for labour and capital inputs, has declined by about 1% per year since 1988, although since the mid-1990s it has barely changed. MFP represents the effect of factors such as technology, management efficiency, regulation, workloads, changing work types etc. It is a measure of those factors that are hard to measure but have an influence on industry outputs.
The above productivity indexes do not directly consider the quality of work and hence may be a misleading measure of industry performance. It is suggested that quality effects are best considered at a project level and that designers and owners be encouraged to consider ongoing cost, as well as initial costs entailed by their decisions. In addition, quality management systems in design and construction firms are known to reap net benefits in overseas firms. The same effect is likely for New Zealand firms due to reduced call-backs and re-work.

2
3. LITERATURE REVIEW A Treasury report (Black et al, 2003) calculated productivity for nine industry groups within New Zealand, including construction. The index was constructed from production-based GDP constant price series, the household labour force survey hours worked series, and the productive capital stock series, all from Statistics NZ. The report found that total-factor productivity in the construction industry had declined by about 1.5% pa between 1988 and 2002. Total-factor productivity (sometimes called multi-factor productivity or MFP) is the amount of output per unit input, the latter being a combination of inputs weighted by their relative cost shares.
A number of other Treasury reports (Fox, 2005; Mason, 2007 etc) have subsequently examined productivity for the overall economy and for particular sectors, including comparisons with other countries. They find change in total-factor productivity for construction in New Zealand is about 50% worse than in the UK.
Davis (2007, 2008) undertook studies for the DBH on productivity in the construction industry. The report briefly examines partial productivity measures, i.e. labour and capital productivity, but most of the focus was on industry structure and how government policy can improve productivity. He suggested an industry framework for productivity based on three levels. At the lowest level there is on-site productivity affected by labour supervision/organisation, scheduling, material procurement, off-site assembly and efficient design. The middle level is the firm where productivity is affected by how groups of projects are simultaneously managed, adoption of innovation, and general management practices. The highest level is the whole industry where skills, training, investment, research, competition, products, ease of entry, and regulation affect productivity.
Among the report’s recommendations is the need to collect information at the firm level on skills, investment, business practices and performance data. There is also a recommendation for more economic analysis of industry performance. The report believes government policy can best affect the third level, and recommended government engagement with industry to identify factors that hinder productivity improvements and strategies to address these.
Partly in response to these reports the DBH set up two industry taskforces, one a Sector Productivity Taskforce and the other an Urban Taskforce. The first addresses issues identified in the DBH’s work. The second taskforce arises in part from earlier work (e.g. Grimes et al, 2007) on the land cost issues affecting housing affordability and the mixed record in encouraging intensification in the major cities.
The first taskforce brief was to look at skills and procurement issues as they affect productivity. Their recommendations included:
Central and local government develop, publish and maintain a 10-year rolling infrastructure programme. This work to be done by a National Infrastructure Unit within a government department. The aim is to mitigate boom-bust cycles and share information and dialogue with the industry.
Government-funded projects are to have training obligations for non-residential work. These could be administered through a pre-qualification process whereby the skills development and management expertise of firms is assessed periodically.
A government-private sector forum (e.g. a Built Infrastructure Leadership Group) meets at intervals to monitor infrastructure programming and training systems.

3
Government consider the use of standard components on its new buildings (e.g. schools). This is expected to reduce costs and encourage wider industry adoption of standardisation.
Government and private sector to extend the DBH ‘starter’ homes designs to other housing segments. The aim is to encourage more standardisation in housing.
Construction industry training beyond secondary education Year 10 is unified so that consistent and clear career paths are open to new entrants.
The continuing professional development and licensed building practioners regimes need to have more emphasis on management skills.
There needs to be an analysis of the skills required in the long term.
More government investment in infrastructure is required now to retain skills in the current downturn.
Although the taskforce brief believes government policy is best applied on industry-wide issues the recommendations affect productivity at all levels. More standardisation of design affects design at the lowest level, improved management training affects firms’ performance at the middle level, and at the high level the programming and skills forecasting will cause an industry-wide productivity improvement.
The other taskforce on the urban environment has recommendations that are not directly related to construction industry productivity, but they do impinge on the housing sector via measures to encourage intensification and facilitate regulatory processes.
The Urban Taskforce recommendations included:
Government identifies a lead department to provide strategic leadership to champion quality urban development and inter-agency coordination.
A sector-led advisory group (designers, developers and financiers) provides advice to Ministers at regular intervals.
Government establishes an urban development agency that facilitates the creation of partnerships for each project development. The government role is to facilitate land assembly, and ensure consents and infrastructure/amenity issues are resolved before calling for development proposals on a competitive basis.
Central government works with local government and developers on partnering models for two or three high-density urban developments as soon as possible, to demonstrate the feasibility and impacts of the new model.
Councils establish teams that ‘account manage’ intensive developments to facilitate the consent process and provision of infrastructure.
The Building Code be reviewed to ensure it provides for noise abatement and other amenity needs in medium-high density housing.
Some members of the taskforce also had recommendations related to council charges, long-term funding and the Resource Management Act 1991.
Overall the recommendations relate to urban intensification and will have cost impacts (e.g. extra structural and noise abatement costs) hopefully offset by savings with transport and other infrastructure.
There are many overseas studies on construction productivity, and a general overview includes Department of Trade and Industry (2004) that compared UK productivity to the US and some European countries. Productivity has been static in recent years, or at

4
best it has had small growth for short periods and any growth is usually below other industry productivity growth rates. Factors influencing productivity between countries include the mix of work types, firm sizes, the size of the ‘black’ economy (unregistered workers), and what stage of the business cycle is measured. It finds that country comparisons are difficult and can be unreliable due to these factors.
In the US the National Research Council (NRC) has long been interested in the construction industry and developed a national strategy to improve productivity (NRC, 1980). They developed five main themes: 1) Managing the building process and the roles of the owner, designer and builder; 2) Financial planning with emphasis on managing debt in the boom-bust cycle; 3) Government regulation role, specifically less state requirements and more national standards; 4) Skills and workforce motivation; and 5) Innovation including sharing ideas, free-rider effects and technology transfer via industry institutions. A later publication from NRC (2009) has developed some of the earlier ideas on productivity. Their five ‘breakthrough’ improvements are: Electronic Building Information Modelling, On-site Management Processes, more Pre-fabrication/ Modularisation, Innovation Demonstrations, and better Performance Measures at project and industry level.
A Scandinavian summary (Alinaitwe et al, 2004) notes three themes commonly occur in productivity studies, namely innovation and knowledge transfer, benchmarking and industrialisation. Issues to be addressed to improve productivity are: design (complexity, changes, quality), manpower (skills of workers and supervisors, turnover, stoppages and absenteeism), management (supply chain, pre-fabrication, site congestion/layout/access, construction method, innovation), and environment (workloads, regulatory requirements, weather).
Many studies concentrate on particular aspects of productivity, such as measurement and data limitations (Crawford and Vogl, 2006; Bang and Bertelsen, 1999), improving labour skills (Williams, 2005), lessons from other industries (Veiseth et al, 2003), the role of innovation (Nam et al, 1995), labour productivity on social housing projects (Clark and Herrmann, 2004), and business cycle effects (Zhi et al, 2003).
In Australia Econtech and KPMG produced reports in 2003, 2007, 2008 and 2009 for various clients on productivity in the construction industry. The main focus of these reports was first defining and measuring productivity, and secondly to measure changes in productivity due to industry reform. The reports contain case studies of particular buildings and economy-wide impacts, but they do not examine in any detail the factors affecting productivity, apart from some regulatory impacts.
4. DEFINING PRODUCTIVITY Productivity is normally defined as the volume of outputs from a process per unit of inputs. In the construction industry the outputs are buildings and civil structures and the inputs are labour, materials and capital employed in the industry.
Measures of productivity include:
Work placed per person
Value-added per person
Value-added per combined unit of labour and capital inputs, expressed as an index
Econometric measures using production functions.
5
These are usually applied to annual data for industry inputs and outputs. There is generally no consideration about the quality of the outputs and the ongoing cost implications of design decisions, workmanship and call-backs. Such considerations, when included in the planning, are normally done at a project level. Quality issues also arise for inputs, particularly labour skills. Some work has been done overseas on differentiating skill levels for the labour input in productivity studies but we were unable to find any of these results for New Zealand.
Analysis of the four measures above is now considered.
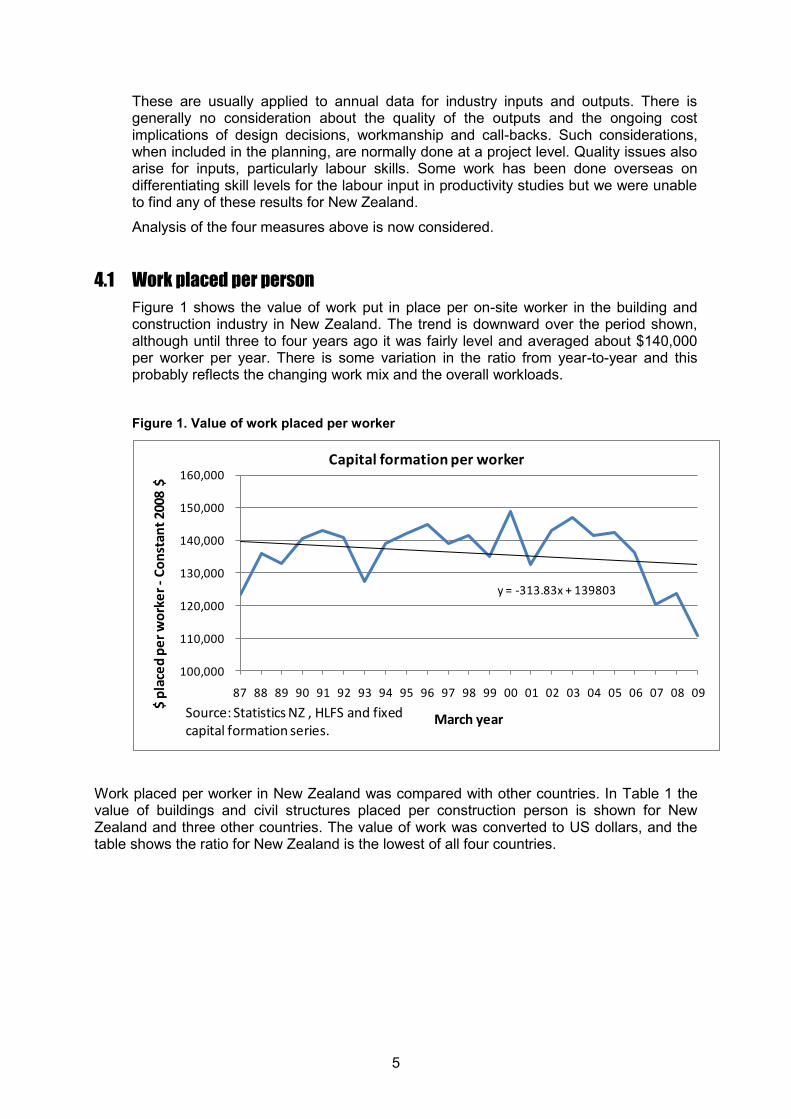
4.1 Work placed per person Figure 1 shows the value of work put in place per on-site worker in the building and construction industry in New Zealand. The trend is downward over the period shown, although until three to four years ago it was fairly level and averaged about $140,000 per worker per year. There is some variation in the ratio from year-to-year and this probably reflects the changing work mix and the overall workloads.
Figure 1. Value of work placed per worker
y = -313.83x + 139803
100,000
110,000
120,000
130,000
140,000
150,000
160,000
87 88 89 90 91 92 93 94 95 96 97 98 99 00 01 02 03 04 05 06 07 08 09
$ pl
aced
per
wor
ker -
Cons
tant
200
8 $
March year
Capital formation per worker
Source: Statistics NZ , HLFS and fixed capital formation series.
Work placed per worker in New Zealand was compared with other countries. In Table 1 the value of buildings and civil structures placed per construction person is shown for New Zealand and three other countries. The value of work was converted to US dollars, and the table shows the ratio for New Zealand is the lowest of all four countries.

6
Table 1. Work placed per construction person
Fixed capital formation
New buildings and civil structures for 2006UK Australia USA NZ
Value (1) £ million $A million $US billion $ NZ million130,415 143,797 1,089 21,633
PPP (2) 0.65 1.39 1.00 1.54$US (3) 200,638 103,451 1,089 14,047
Employment (000) (4) 1,836 892 6,239 187 $US FCF/ person (5) 109,295 115,950 174,485 75,050
Value added (6) £/person $A/person $US person $NZ/person38.2 77.1 103.5 45.3
US$/ person 58.8 55.4 103.5 29.4(1) Value of fixed capital formation for buildings and civil structures(2) Purchasing power parity factor (similar to exchange rates).(3) Capital formation values converted into $US.(4) Construction industry employment(5) FCF $US/ construction employment.(6) Value added by the construction industry
On the surface this implies lower productivity per worker in New Zealand than elsewhere i.e. each worker puts in place a lower value of construction work than other countries. However this measure is influenced by a number of factors such as the mix of work type, the amount of pre-fabrication, and what is included in the value of work.
Figure 2. Capital formation types by selected countries
0102030405060708090
100
NZ Australia USA UK France Germany
Perc
ent o
f all
cons
truc
tion
wor
k
Fixed capital formation for 2001
Civil engineering
Non-res buildings
Residential
Source: DTI UK, see references.

7
Other countries generally have a similar mix of work types (see Figure 2). However, the US and UK capital formation data is believed to be inflated by items that are not building and infrastructure related (such as oil refineries, power generation equipment and flood protection schemes), which should be in the plant/equipment or land improvement capital asset types and not in structures. There are also economies of scale considerations, and probably more standardisation of designs for housing in other countries, so that would tend to favour their labour productivity ratios.
The relative importance of each of these is not known, but it seems likely that all play a significant part in producing different ratios overseas.
Another consideration in using fixed capital formation (FCF) data is that it covers new structures, additions to existing structures, and work to an existing building that significantly extends the life of a structure. It does not cover routine maintenance and repairs work, or decoration and replacement of fittings (e.g. new bathrooms and kitchens). It is known that a significant amount of the workforce is involved in repairs, maintenance and renovation, and if the proportion of new to maintenance/renovation work changes over time (as the building stock ages for example), this has the effect of reducing the capital formation per worker productivity measure over time.
Hence using the value of FCF per worker is not always a useful indicator of productivity for new construction.
4.2 Work placed by work type Ideally we would wish to separate work value and labour numbers for each of residential building, non-residential building and civil structures. While we have individual capital formation data for the three asset types, the labour numbers (and value-added) in each segment are not generally available internationally or locally.
In New Zealand the annual Business Demographic Survey (BDS) carried out by Statistics NZ provides employment by sub-industry group. These include numbers for new housing (RB), non-residential buildings (NR) and other construction (OC), and a variety of sub-trade groups (e.g. services installation, finishing etc). In the Appendix the BDS employment ratio (dollar work placed per worker) was calculated for each sub-industry group, and then all industries added together. The results for recent years are that the new housing sector puts in place about $156,000 of work per job, non-residential $82,000 per job, and civil engineering about $142,000 per job, in 2008 dollar terms. In other words, in terms of labour productivity the new housing industry is the most productive.
This is a little surprising as we had expected civil engineering to be have the highest dollar:employment ratio since it is believed to be plant intensive. It seems likely that the quite high pre-fabrication component in new housing (e.g. frames and trusses, windows, doors, kitchen and bathroom fittings and joinery) has affected the ratio. It may also be the type of civil engineering undertaken locally is small-scale and/or labour intensive e.g. footpaths, walkways, roads, bridges, retaining walls, water, stormwater and sewage reticulation, rail track work, tanks and silos.
4.3 Value-added per person This is a measure commonly used in productivity studies for the overall economy and for individual industries. Value-added is the wages, salaries and operating surplus (i.e. profits) less depreciation of plant. It excludes the inputs from other industries (e.g.

8
materials, business services etc). Thus we have subtracted other industry efficiency gains (e.g. pre-fabrication which is in the manufacturing industry sector or designers who are in the business services sector), and we are looking only at the construction industry (i.e. persons on-site and persons in construction firms directly supporting on-site construction.)
These results are shown in the lower part of Table 1 where New Zealand value-added is about $45,000 per construction worker. The overall economy value-added per worker in New Zealand was about $54,000 in 2006 so construction is below average on this measure. The results in the table indicate a similar picture to that for capital formation per worker i.e. New Zealand ranks lower than the other countries by a significant margin.
Figure 3 shows the trend in value-added per worker employed in the construction industry. The value-added is in constant dollars and two measures of labour are used. The Household Labour Force Survey employment numbers are the average numbers employed during the year and include full and part-time workers. The dotted line is for employment numbers adjusted to the equivalent worker numbers assuming a standard 40-hour week (i.e. average hours worked are over 40 hours). For both measures the linear trend is very similar and since 1988 labour productivity has declined slightly by about 0.1% per year, although the change in the last three years is much greater than that.
Figure 3. Labour productivity
y = -52.073x + 58658
0
10000
20000
30000
40000
50000
60000
70000
88 89 90 91 92 93 94 95 96 97 98 99 00 01 02 03 04 05 06 07 08 09
$ pe
r wor
ker
07/0
8$
March year
Value added per worker
Worker numbers only
Adjust for weekly hrs
Linear (Worker numbers only)
Source: Statistics NZ
Table 2 shows value-added for a three-sector breakdown: all buildings construction, other construction (i.e. civil engineering), and construction services. A more detailed breakdown was preferred but Statistics NZ was unable to supply to that detail. The construction services group are mainly the sub-contracting industries i.e. concreters, plumbers, electricians, plasterers, painters etc. A detailed list is in the Appendix in

9
Table 6. The highest number for value-added per worker is in the civil engineering sector at approximately $69,000 per worker (in 2008 dollars). Construction services, which provides most of its output to the building sector, is lowest at $52,000 per worker and building construction (residential and non-residential combined) is a little higher at $57,000 per worker.
It is interesting to compare these numbers with the FCF per worker in Section 4.2. For housing and non-residential buildings combined the workers in these two sectors together put in place about $122,000 per year of FCF in recent years. For civil engineering the number is $142,000 per year per worker. So other industries outside construction add about $70,000 per worker or 50-60% of the final value of the work as put in place.
Table 2. Value-added per worker by sub-industry
Value -added by sub-industry
March year 2005 2006 2007Value-added $ million
Building construction 1872 2363 2626Civil engineering 1402 1771 1964
Construction services 3847 4513 5264Number of employees + working proprietors
Building construction 42,178 44,882 46,091 Civil engineering 24,140 26,730 29,300
Construction services 91,866 97,727 101,891 158,184 169,339 177,282
Value added $ per worker - $ of dayBuilding construction 44,383 52,649 56,974
Civil engineering 58,078 66,255 67,031 Construction services 41,876 46,180 51,663
Value added $ per worker - 2008 $ averageBuilding construction 52,247 58,163 59,830 56,746
Civil engineering 66,752 71,824 69,331 69,302 Construction services 49,296 51,016 54,253 51,521
Source: Annual Enterprise Survey for value-added. Employment is from the Business Demographic Survey.Building construction is ANZSIC groups E301,E302Civil engineering is E310Construction services are E321 to E324, E329.
What is value-added measuring? It is the total of wages, salaries and profits, so if these increase then productivity may be increasing. Wages can increase due to more hours worked or higher hourly rates. The former may not be a productivity improvement because the denominator in the productivity measure (i.e. labour hours) also increases. But higher hourly rates are a productivity increase by this measure, as is any increase in profits with no change in inputs (e.g. higher margins due to increased demand). This may seem a strange way to measure productivity but it is saying that when value-added per worker increases the industry output has become more highly valued in the

10
market (increased profits), and its workers are paid more, and hence this is a productivity increase.
4.4 Multi-factor productivity indexes The problem with the partial productivity indexes (like labour productivity) is that the changes in the trend could be due to changes in supply of other factors of production such as capital. A better measure is total-factor productivity where all inputs are combined in the denominator. In practice it is not possible to measure all inputs easily (e.g. technology, regulation, land) and usually only labour and capital are combined. These measures are called MFP, rather than total-factor productivity, as there is acknowledgment that not all factors of production have been included.
The calculation is usually done in an index form, where an index of output (e.g. value- added) is divided by a composite index of inputs (e.g. labour and capital). Davis (2007) describes one method of doing this (see the Appendix) and the results derived by BRANZ using the report’s method are shown in Figure 4. The labour and capital stock indexes are combined into one index in the denominator using their relative shares of income (i.e. wages/salaries versus profit) as weights. The trend since 1988 is a decline of about 0.5% per year. However, since the mid-1990s MFP appears to have stabilised. The labour productivity index is also shown for comparison – it is value-added divided by employed numbers, averaged over a year, re-based as an index of 100 at 1988. Most of the difference between the two series occurred in the early 1990s and it is speculated that capital stock built up for the mid-1980s building boom was under-utilised in the early 1990s.
Figure 4. Multi-factor productivity construction industry
y = -0.005x + 0.9297
0.700
0.750
0.800
0.850
0.900
0.950
1.000
1.050
1.100
88 89 90 91 92 93 94 95 96 97 98 99 00 01 02 03 04 05 06 07 08 09
Prod
ucti
vity
inde
x ba
se
Mar
88=1
.000
March year
MFP index - Construction
Labour productivity indexMFPLinear (MFP)
Source: BRANZ
What is the MFP measuring? To some extent it is a measure of our ignorance of what factors contribute to construction industry output. After allowing for labour and capital inputs it is a measure of all the other factors within the industry that contribute to the production process. It is a measure of technological progress (i.e. more efficient plant, new building techniques), on-site and firm management efficiencies, compliance impacts, economies of scale, cyclical workloads, changing mix of work types, changing skills levels, and the mix of skills etc. The relative importance of each of these factors is

11
unknown but we know from a later chart (Figure 5) that cyclical workloads has some effect, although the correlation is not high (Rsq=0.11).
The supply of materials does not directly appear in this index because it is a measure of value-added within the industry, not the effect of outside changes in other industries (i.e. manufacturing). However improvements in building materials indirectly appear in the MFP. For example pre-fabricated components, more panel products and other material improvements have reduced the need for less skilled labour on-site. This raises the average hour wage on-site and improves the value-added to site hours ratio.
4.5 Production functions The final measure of productivity to be examined is the use of production functions. These functions are usually of the form below:
Q = A Lβ1Kβ2
Where Q = the industry output e.g. value-added.
A = technology/managerial efficiency coefficient.
L = labour used e.g. labour hours.
K = capital stock in the industry e.g. value of productive stock (plant, machinery and equipment).
All of Q, A, L and K change with time and β1, β2 are constants.
The equation can be solved using time series data (see the Appendix). The result is the coefficient for technological-managerial efficiency declined at about 2.1% per year between 1987 and 2005. There are a number of assumptions in this method including one that the share of labour and capital does not change with time, which is somewhat unrealistic, and the result of a 2.1% decline in productivity is likely to be an over-estimate.
4.6 Preferred productivity measure The recommended productivity measure is the MFP index shown in Figure 4. This is an annual index but there is currently about two years’ delay in producing it due to infrequent capital stock updates.
The simple labour productivity index, shown on the same chart, follows the MFP index quite closely. So it is suggested that the labour index be used as a proxy for productivity to monitor approximate trends. It is available on a quarterly basis with a four to six month delay from the end of the quarter, but it suffers from seasonal fluctuations. To remove the fluctuations a rolling four-quarter sum is used, as is shown in Figure 3. (The calculation is the rolling four-quarter sum of value-added or work placed value divided by the average 40-hour equivalent employment for the year to the quarter.)
The simple index should be calculated for both value-added and capital formation. The value-added metric is used for measuring performance only within the industry, and work placed metric (FCF) is for the performance of the industry and its suppliers.
As data for the MFP index calculation becomes available, more accurate measures can then be produced.

12
4.6.1 Pros and cons of the various measures of productivity Productivity is a measure of output per unit input and a choice of a measure is made on several factors including:
What outputs and what inputs are measured?
Over what time period do we measure?
What use is to be made of the productivity measure?
Can quality improvements be captured?
The main outputs of the industry are buildings and engineering structures and the first measure of productivity examined was the value of these structures per labour input, the latter being worker numbers or labour hours. This is an adequate measure if we are mainly concerned about producing structures as cheaply as possible, given the available labour resources. But it does not tell us whether any efficiency gains have occurred within the industry (either labour or capital plant improvements) or outside it (e.g. pre-fabrication which is in manufacturing, or improved design which is in the business services sector).
Hence the widespread use of the value-added metric, which measures performance only inside the industry. Adding capital to the denominator in the MFP index allows us to monitor whether the industry is making improvements in the use of both its labour and capital inputs, thereby contributing to economic growth. The main failing of the MFP index is that it does not allow for quality changes.
Quality is difficult to measure in a composite output metric, and if included would require the segregation of structures in quality classes and the identification of inputs into each segment. This has not been done elsewhere due to data difficulties, such as identifying quality groups of structures and separating out new build inputs from maintenance/remedial work inputs.
Quality changes are indirectly included if we use the capital formation per worker metric. Assume that an increasing proportion of the construction workforce is engaged on remedial work because of declining quality. Capital formation placed per worker would decline over time because the denominator in the index increases as more workers are required for maintenance (it is impossible to separate out maintenance/repair workers from new structure workers in the official data).
However the same argument applies for an aging building stock, where maintenance work increases with time due to aging assets rather than quality issues. So the capital formation per worker index measures a combination of effects, including changes in efficiency, quality and an aging building stock.
The MFP index is different because it includes the costs of maintenance/remedial work as well as new work. However it still does not capture quality effects, because with value-added as the metric we have maintenance/remedial work appearing in both the numerator and denominator of the productivity index and the MFP index may not change, even though quality may change with time.
Neither the value-of-work-placed metric nor the value-added metric is totally satisfactory but the value-added multi-factor index method is preferred. It measures how the industry is valued by society at large (through profits and wages) per unit composite input by the industry. Also it is simple to calculate and monitor trends, and comparisons with other industries can be readily made.
The multi-factor index method is widely used in New Zealand and overseas. There is already an economy-wide productivity index for New Zealand, which is made up of value-added, capital and labour as described above. Statistics NZ has plans to extend

13
this to individual industries over the next few years, and it is recommended that their indexes be used, when available, to monitor productivity in construction compared to other industries.
In the meantime the index developed in the paper for the DBH (Davis, 2007) should be used for an annual index, albeit with some delay, and as an approximation the value-added per worker index should be used on a quarterly basis.
5. AREAS FOR PRODUCTIVITY IMPROVEMENT The above discussion has looked at measurement of productivity and the remainder of this study examines potential productivity improvements. As discussed in the literature review there are many studies on the factors influencing productivity. The findings are applicable locally and particular themes relevant to New Zealand are:
Skills training, particularly for on-site management, and management of multi-projects at the firm level. Improvement here will reduce re-work and waiting times.
More modularisation of housing and less one-off designs. It may also be possible to do more modular pre-fabrication for non-residential buildings such as education and small health centres. Industrial buildings are fairly similar in type and are likely to be candidates for a degree of standardisation.
More benchmarking at the firm level to encourage improvements. Use quality management systems in firms.
Investigate what lessons can be learnt from innovative and efficient firms in the industry.
Increase the average firm size to achieve efficiencies.
Undertake industry-government liaison for programming of government works to mitigate boom-bust cycles.
Streamline regulation and compliance costs of central and local government.
These themes are applied to the three-level industry structure suggested by Davis.
5.1 Individual project level At the lowest level of the project two important factors to improve productivity are:
Skills training – on-site skills, management and design skills. Benchmarking.
Up-skilling of on-site management is vital for productivity gains. There are a number of studies overseas (Picard, 2004) of on-site time utilisation showing that direct hands-on time varies between 30% and 80% of available time, depending on the project. No equivalent New Zealand studies were found but anecdotal evidence suggests time utilisation can be improved on many projects in New Zealand. Wasted time is due to poor supervision and construction planning, and also poor design can contribute to inefficient construction. The importance of design factors on new housing costs was included in a survey of builders undertaken by BRANZ (see the Appendix, Figure 8). Among the factors plan complexity and site slope had a quite important influence on costs. Project
14
productivity performance needs to be measured. For example labour hours for various tasks and downtime hours need to be recorded and where possible compared to ‘good performance’ benchmarks. Otherwise areas for improvement are not identified. A major cause of customer dissatisfaction is call-backs, and poor or less than expected ongoing performance of buildings. Designers need to consider the operational requirements of their designs and make the owners more aware of the various trade-offs between initial cost and ongoing performance.
5.2 Firm level At the firm level the following are likely to improve productivity:
Improved management skills Firm size efficiencies Modularisation Benchmarking and quality systems Lessons learnt from good performers Encourage life-cycle analysis by designers, as appropriate for individual
projects. Firm level efficiencies are possible in the management and resource allocation of simultaneous projects. There is need for training in multi-project management. As the industry builds more residential multi-units to achieve better urban intensification the typical firm’s type of work will change from detached low-rise to more medium-density multi-storey residential construction. The scale of average residential construction is likely to increase and average firm sizes will need to get bigger to handle the larger projects. When compared to many other countries our new housing is very much ‘custom’ designed and built. Previous work (Page, 2007) has shown the ‘group builders’ in New Zealand are able to offer houses 15% cheaper than one-off designs from small builders, which are the predominate source at present. While pre-fabrication of frames and trusses is common, modularisation and standardisation are rare and appear to offer efficiency savings, particularly for multi-unit construction. Benchmarking (e.g. customer satisfaction, safety incidences, defect call-backs, predictability of project time, repeat clients etc), is applicable at the firm level, as it is for component metrics on individual projects. Some large contractors are now benchmarking against industry averages using key performance indicators, which improves their performance and helps win new work.1 Quality systems in construction firms appear to have good paybacks in terms of reduced re-work.
The literature indicates innovation by firms is important for productivity gains. Currently innovation in New Zealand construction firms is low and appears to be declining (see Table 3.) Construction firms have lower innovation than firms in the economy as a whole. Construction firms do little research and development in New Zealand, although some of the larger companies in the non-residential sector have trialled various pre-fabrication systems to speed up construction at the individual project level. Most innovation in the industry comes from the materials manufacturing sector, rather than the construction companies.
1 http://www.constructing.co.nz

15
Table 3. Innovation in construction
Businesses undertaking innovation
Type of innovationGoods or Operations Managerial Marketing Totalservices processes innovatn innovation rateConstruction Percentage
2005 12 22 33 26 412007 16 16 26 21 38
All industries Percentage2005 30 29 31 29 522007 26 23 27 26 47
Source: Business Operations Surveys, Statistics NZSurvey is undertaken at 2 year intervals and percentages are for a two years of data.
5.3 Industry-wide level At the industry level the following factors influence productivity in the medium and long-term:
Government-funded skills training
Mitigation of boom-bust cycles
Regular review of regulation and compliance costs
Consideration of modularisation for education, health and correction buildings.
The government scheme for practitioner licensing and ongoing CPD will help to improve skills. Various tertiary training paths for new entrants are generally available, with a significant level of government funding and subsidies.
Some firms are reluctant to invest in training because labour can readily move, hence the taskforce recommendation that bidders for government work have a training programme and be actively up-skilling their workers.
Simplified and non-prescriptive regulation can lower transaction costs and facilitate innovation. The Simple House manual being developed by the DBH may help lower compliance costs and adequate funding of standards is important.
The literature (Zhi, 2003) indicates workload cycles usually have an effect on productivity and government-funded projects can help reduce the workload fluctuations. Figure 5 indicates this for New Zealand where changes in the MFP index move in cycle with the changes in workload from the previous year.

16
Figure 5. MFP and workloads
-20.0
-15.0
-10.0
-5.0
0.0
5.0
10.0
15.0
20.0
0.700
0.750
0.800
0.850
0.900
0.950
1.000
1.050
88 89 90 91 92 93 94 95 96 97 98 99 00 01 02 03 04 05 06 07 08 09
Prod
ucti
vity
inde
x ba
se M
ar88
=1.0
00
March year
MFP index - Construction
MFP index
% annual chg workloadsSource: BRANZ
6. BUILDERS' SURVEY OF FACTORS AFFECTING COSTS AND PRODUCTIVITY
Two surveys of builders were undertaken as part of this project. The first survey asked about the importance of a given list of cost factors for new housing. The second survey was more general on factors influencing productivity (defined as outputs per unit input). The results are:
First survey on new house costs:
The main factors influencing new house costs are materials and labour costs, the ground slope of the site, and floor plan complexity.
Some other design variables (including window sizes, wall multi-claddings and an upper storey) were assessed as having a low effect on house cost.
Second survey on general productivity influences in the building industry:
The main factors identified as affecting productivity were the level of trade skills, project organisation and design detailing.
Plant, standardisation and pre-fabrication/modularisation were rated as having a fairly minor influence on productivity.
The responses were similar for both housing and non-residential contractors.
Full details of the results are in the Appendix.

17
7. DISCUSSION There are various definitions of productivity and particular metrics are used for various situations. At the project or firm level a company will be interested in comparisons and can use benchmark indicators. For the whole industry there is a need to use an aggregate measure. Either a work placed per person or a value-added metric can be used for this, depending on whether it is wished to monitor the wider economy productivity (manufacturing and construction) or just the trends within the construction industry. The MFP index developed for the DBH is suggested for monitoring medium to long-term trends.
How should quality trends be included in productivity measures? There is no simple answer because quality changes are difficult to measure in an aggregate index. Instead, it is suggested at the project level owners are encouraged to consider such factors as ongoing operations and maintenance costs when they consider alternatives. They may also wish to consider environmental impacts for certain types of building and green rating measures, as these may have revenue impacts for commercial buildings.
At the firm level designers and contractors can benefit from quality assurance schemes. Quality management is critical for construction projects, as almost all projects require some re-work. A number of studies have been done on poor quality costs, and two studies (Love et al, 1999, 2000) found the cost of re-work due to poor work or poor design ranged from 2% to 12% of total contract value.
Another study (Rosenfeld, 2009) looked at the trade-off between the cost of quality control and the cost of re-work for eight projects. They found that an investment of about 2% of the total project cost provides the best return in reducing re-work costs. The investment includes quality staff and procedures, auditing, routine process controls, routine tests during construction, instruction and training. The benefits were found to be cost reductions in re-work, penalties, handling investigations and complaints, legal fees and compensation. The study did not record other cost savings such as unreported re-work, loss of existing and new customers, and reputation damage. The author estimated these are at least equal to the measured loss, and for many projects an expenditure of up to 4% of the project value on quality management will reap net benefits.
What areas can the New Zealand industry improve on? The short and most urgent list is:
On-site and multi-project management skills within firms
Benchmarking at the firm level and adoption of quality management systems
Assessing the potential for modularisation and standardisation
Scaling up of the average firm size in the house building industry.
Modularisation is not always suitable because many non-residential buildings are different (apart from education, health and industrial buildings). Housing would appear to have scope for modularisation and standardisation, particularly for the lower and medium cost range. The group building companies are mainly in the medium cost segment use and use sets of standard plans, and modularisation of parts of the building (kitchens and bathrooms) appears to be possible. Many new houses are for well-established households and owners are becoming more focused on amenity and the value of the service provided by the dwelling. While the first home market is sensitive to cost, other owners may have other priorities.
In developed economies consumption is increasingly spent on service goods and experiences, rather than the basic needs of food, clothing and shelter. Some Danish

18
authors (Bang et al, 1999) have suggested this applies to the housing market where they found the main priority in new housing is space, a good level of comfort, privacy, finish etc. Many of these amenities were also found in a New Zealand study (Page, 2007b). The Danish authors argued that a willingness to pay an increasing share of household income on housing may be an indication that in developed countries housing is becoming a luxury good associated with modern lifestyles. In this scenario the productivity ratio is the benefit divided by the price. The benefits include floor area, space volume, comfort, lighting, privacy, finish, maintenance and resource-efficiency.
This is a quite different measure to the usual productivity ratio of cost/inputs. It is likely these amenity characteristics are sought after in New Zealand homes, and are one of the reasons so much of our construction and design are one-offs. If this is the case then it becomes harder to achieve cost savings, and productivity metrics based solely on the cost may not be an adequate metric.
Despite this trend to amenity there are advantages in efficiency improvements across the various housing segments. The areas for productivity improvements described above, at the various levels of the industry, are worthwhile in themselves.
Earlier work (Page, 2007) has suggested group house builders are able to construct more cheaply than small-scale builders with savings of around 15%. The Appendix has data from an old census of the industry indicating that larger firms are more productive.
The two surveys of builders on new house cost factors and building industry productivity found some interesting results. The new house survey indicated that apart from labour and material costs, the ground slope and floor plan complex had a significant effect on costs. In contrast window sizes, more than one wall cladding and an upper storey did not have a major effect on new housing costs.
The other survey on industry productivity was surprising because standardisation and pre-fabrication/modularisation rated low as productivity influences. In contrast skill levels, project organisation and the design details were important for productivity gains, and this reflects the findings of the productivity literature.
8. FURTHER WORK Further work in the following areas will enable a better understanding of how to improve productivity in the New Zealand construction industry:
Examine Statistics NZ financial and workforce data of individual construction firms to assess variations in performance between and within sub-industries. This would need to be on anonymised data so firms are not identifiable. Publish this data in sub-industry aggregate form as a benchmark for firms to improve their performance. Also show the results for different firm sizes to see how important economies of scale are in the various sub-industries.
Carry out surveys of medium and large construction firms to assess adoption of quality management systems and attempt to ascertain the costs and savings associated with these systems. Publicise the results of these surveys in aggregate form, to encourage better take-up of quality management in construction.
Survey the industry to ascertain the proportion of work on new construction, routine maintenance, premature failures and decoration/remodelling for housing. The aim is to ascertain how much of the workforce operates in each segment. Develop appropriate performance measures for each segment.

19
9. REFERENCES
Alinaitwe H, Mwakali J and Hansson B. 2001. Labour Productivity in the Building Industry. CIB World Building Congress, Wellington, New Zealand (April 2001).
Allen S. 1995. ‘Why Construction Industry Productivity Is Declining’. NBER Working Paper 1555. National Bureau of Economic Research, Cambridge, MA, USA.
Bang H and Bertelsen N. 1999. ‘Building Productivity Fundamentals’. CIB W55 & W65 Joint Triennial Symposium Customer Satisfaction: A Focus for Research and Practice. Cape Town, South Africa (September 1999).
Black M, Guy M and McLellan N. 2004. ‘Productivity in New Zealand 1988 to 2002’. Working Paper 03/06. The Treasury, Wellington, New Zealand.
Clarke L and Herrmann G. 2004. ‘Cost vs Production:Labour Deployment and Productivity in Social Housing Construction in England, Scotland, Denmark and Germany’. Construction Management and Economics 22(10).
Crawford P and Vogl B. 2006. ‘Measuring Productivity in the Construction Industry’. Building Research and Information 34(3).
Davis N. 2007. Construction Sector Productivity: Scoping Report. Martin Jenkins for Department of Building and Housing, Wellington, New Zealand.
Davis N. 2008. Productivity in the Building and Construction Sector: Summary Report. Martin Jenkins for Department of Building and Housing, Wellington, New Zealand.
Department of Trade and Industry. 2004. Measuring the Competiveness of the UK Construction Industry. University College of London, UK and Davis Langdon Consultancy.
Econtech Pty Ltd. 2003, 2007, 2008, 2009. Economic Analysis of Building and Construction Industry Productivity. Econtech, Canberra, Australia.
Love P and Li H. 2000. ‘Quantifying the Causes and Costs of Re-work in Construction’. Construction Management and Economics 18: 479-490.
Love P, Mandal P and Li H. 1999. ‘Determining the Causal Structure of Re-work Influences in Construction’. Construction Management and Economics 17: 505-517.
Nam C and Tatum C. 1997. ‘Leaders and Champions for Construction Innovation’. Construction Management and Economics 15. 259-270.
National Research Council. 1980. A National Strategy for Improving Productivity in Building and Construction. NRC, USA.
National Research Council. 2009. Advancing the Competitiveness and Efficiency of the US Construction Industry. NRC, USA.
Page I. 2007. ‘House Price Modelling’. BRANZ Study Report 187. BRANZ Ltd, Judgeford, New Zealand.
Page I. 2007b. ‘Changing Housing Need’. BRANZ Study Report 183. BRANZ Ltd, Judgeford, New Zealand.,
Picard H. 2004. Driving Down Construction Project Labour Cost’. CM eJournal. Construction Management Association of America.

20
Rosenfeld Y. 2009. ‘Cost of Quality Versus Cost of Non-Quality in Construction: The Crucial Balance’. Construction Management and Economics 27: 107-117.
Veiseth M, Christian C and Andersen B. 2003. Productivity and Logistics in the Construction Industry – What Can the Construction Industry Learn from the Stationary Industry? NORDNET, International Project Management Conference, Oslo, Norway (September 2003).
Williams I. 2005. Productivity in the UK Engineering Construction – A View from the Industry. Engineering Construction Industry Training Board, UK.
Mao Zhi, Goh Bee Hua, Shou Qing Wang, and G Ofari. 2003. ‘Total Factor Productivity Growth Accounting in the Construction Industry of Singapore’. Construction Management and Economics 21(7).

21
10. APPENDIX This Appendix has the following sections:
Employment breakdowns
Production function modelling
Census of building and construction 1978-79
Builders’ survey of new housing cost factors
Builders’ survey of general productivity factors
10.1 Employment within various sectors of building and construction The value of work placed by the construction industry is shown in Table 4 for capital formation. It includes new work, additions, and work on existing assets that significantly prolongs the life of the assets. Routine maintenance and repairs are not included. The table also shows value-added, and construction industry employment (including full and part-timers), and includes on-site employment and office activities that directly support construction firms. Support sectors such as designers, surveyors and management consultants are not included unless they are on the payroll of the construction firm.

22
Table 4. Capital formation and employment
Fixed capital formation and construction employment
Construction IndustryResidential Non-res Other Total Total Value VA/
Year Employment buildings buildings Construction FCF/ added personend March (000) (1) <----------------$ million 07/08$-----------------------> person 07/08$M 07/08$
87 103.7 5701 4165 2941 12807 123,504 7001 67,510 88 99.6 6174 4954 2397 13525 135,760 6860 68,854 89 97.3 5960 4518 2438 12916 132,706 6626 68,086 90 95.0 6892 4238 2217 13348 140,465 6900 72,617 91 88.4 6847 3533 2229 12608 142,708 5854 66,258 92 75.5 5843 2319 2454 10616 140,606 4943 65,476 93 79.6 6109 2273 1762 10144 127,441 4826 60,628 94 83.5 7163 2727 1706 11597 138,883 5331 63,849 95 94.7 8158 3519 1762 13439 141,876 5990 63,236 96 102.9 8255 4147 2475 14877 144,541 6313 61,339 97 113.3 8676 4261 2811 15747 138,986 7062 62,331 98 114.9 8982 4001 3259 16243 141,424 7300 63,564 99 109.0 7827 3876 2995 14697 134,839 6684 61,324 00 113.2 9314 3682 3820 16816 148,587 7835 69,226 01 116.4 8072 3963 3389 15424 132,535 7305 62,775 02 112.7 8235 4371 3484 16090 142,801 7712 68,446 03 125.0 10258 4433 3673 18365 146,889 8815 70,504 04 145.0 11849 4436 4181 20466 141,170 9725 67,082 05 153.8 12216 5088 4545 21848 142,076 10380 67,504 06 165.7 11635 6014 4907 22557 136,110 10835 65,378 07 186.8 11407 5503 5566 22477 120,340 10637 56,953 08 187.2 11839 5394 5921 23154 123,686 11109 59,341 09 182.6 na na na na 10113 55,384
Average 1987 to 2008 137,179 65,104 (1) Household labour force survey year averageCapital formation has been adjusted to 2007/08 values using the CGPI.Source Statistics NZ
The value of work placed per construction worker varies between $148,000 and $120,000 over the period. The variation is likely to be due to changes in the mix of work, as well as efficiency changes. To assess the effect of the work types a regression analysis was done. The construction industry employment was regressed against the value of work by year in residential buildings, non-residential buildings and other construction (i.e. civil engineering). The period analysed was 1987 to 2005, and FCF (shown in Table 4) is used to measure volume of work, adjusted to constant dollars using the capital goods price indexes. The regression showed good correlation (Rsq=0.97) indicating the volume of work is a good indicator of employment in the industry as measured by the Household Labour Force Survey (see Table 5).

23
Table 5. Employment regressed against value of work
B&C Employ = c1 + c2*RB + c3*NR + c4*OCSUMMARY OUTPUT
Regression StatisticsMultiple R 0.984R Square 0.968Adjusted R Square 0.963Standard Error 6.066Observations 22
ANOVAdf SS MS F Significance F
Regression 3 19989.0363 6663.01209 181.0732199 1.24717E-13Residual 18 662.352046 36.7973359Total 21 20651.3883
Coefficients Standard Error t Stat P-value Lower 95% Upper 95% Lower 95.0%Intercept 4.34397 7.258934 0.598 0.557008711 -10.90648466 19.594423 -10.9064847X Variable 1 0.00383 0.001170 3.270 0.004250808 0.00136861 0.0062863 0.00136861X Variable 2 0.00769 0.002117 3.635 0.001894868 0.003246811 0.0121413 0.00324681X Variable 3 0.01466 0.002422 6.054 1.00988E-05 0.009572985 0.0197492 0.00957298
Employment 2008 (000 persons) % Work placed$/person Residential bldgs i.e. 3.8 jobs per $1M RB 45.3 26 261,270 Non-residential bldgs i.e. 7.7 jobs per $1M NR 41.5 24 129,971 Other construction i.e. 14.7 jobs per $1M OC 86.8 50 68,208
Other 4.3178.0 100
The coefficients on the explanatory variables can be interpreted as the value of work required to support one job. For example the coefficient on residential building work is 0.00383. For the regression, employment was in thousands of persons and value in million dollars so the coefficient indicates 3.8 construction industry jobs are created for every $1 million of expenditure on housing. It is similar for non-residential building where the ratio is 7.7 jobs per $1 million, and civil engineering with a ratio of 14.7 jobs per $1 million. The inverse of these is the value of work placed per construction worker and shows residential is $261,000 per worker, non-residential buildings $130,000 per person, and civil engineering only $68,000 per person. However the dollar value of capital formation per worker is somewhat different to those found using the BDS data later in this section.
The table also has the implied employment for 2008 in each of housing (26% of all construction industry employment), non-residential buildings (24%) and civil engineering (50%).
Whether the three ratios represent reality is open to conjecture. The regression finds the three coefficients that give the best fit. Their t values are quite high but the coefficients have a quite large range. For example at the 95% confidence level the range for the residential coefficient is between 0.0014 and 0.0063, with an expected value of 0.00383.
The results of the regression are not what is expected, in that we had thought that civil engineering would have a high dollar work placed per person due to the high plant content and low labour content of other construction compared to buildings work.

24
A more direct measure of employment by work type is available from the business demographic survey (BDS) carried out annually by Statistics NZ. They survey employment by industrial classification, and the numbers are shown in Table 6.
The numbers include employees plus enterprises. The latter are included because a lot of enterprises are one-person firms, and working proprietors are not counted as employees. The numbers will be a slight over-estimate, however the totals are close to those from the household labour force survey, which is considered to be a more accurate count of industry employment.
A series of regressions were then carried out for each sub-industry as was done for the total industry in Table 5. The regressions were done using annual data for the period 2000 to 2009. The results are in Table 7, where the coefficients represent the amount of employment in the sub-industry per $1 million of work done on each of housing (RB), non-residential buildings (NR) and civil engineering (OC). The Rsq values are high for most sub-industries, indicating a quite good fit. For example for the concreting services sub-industry, for every $1 million spent on each of RB, NR and OC the employment is 0.08, 0.36 and 0.42 persons per year in that sub-industry, and the Rsq is 0.99.
Adding up for all sub-industries the employment is 6.4 person per $1m of RB, 12.1 persons per $1m of NR, and 7.1 persons per $1m of OC. The inverse gives the amount of work placed per worker: residential $156,000 per worker, non-residential buildings $82,000 per worker and other construction $142,000 per worker.
These ratios are somewhat different from those in Table 5, partly because the models cover different periods. Which set of percentages is best to use? Both methods indicate the residential sector is the most ‘productive’ in terms of value of work placed per worker. But the two methods rank the other two sectors differently. Directly measured employment, via the BDS, would seem to be most reliable. The bottom of Table 7 indicates that the employment ratios are approximately 6.4 persons per $1 million of new housing, 12.1 jobs per $1 million non-residential, and 7.1 jobs per $1 million of civil engineering.

25
Table 6. Employment from the Business Demographic Survey (BDS)
Sub-industry employment From Business Demographic Survey
Enterprises + employees2000 2001 2002 2003 2004 2005 2006 2007 2008
E301100 House Construction 19,817 19,068 19,507 21,776 25,534 28,427 31,265 33,159 35,091 E301900 Other Residential Building Construction 202 221 265 454 925 1,356 1,645 1,930 2,233 E302000 Non-Residential Building Construction 8,781 9,060 9,636 9,984 10,953 12,395 11,972 11,002 12,555 E310100 Road and Bridge Construction 11,135 10,963 10,202 11,548 12,546 13,791 14,772 15,191 15,915 E310900 Other Heavy & Civil Engineering Constn 7,935 7,927 9,978 9,573 9,840 11,748 13,389 15,554 15,161 E321100 Land Development and Subdivision 3,554 3,094 2,789 2,636 2,068 1,592 1,812 1,952 2,123 E321200 Site Preparation Services 6,473 6,557 6,956 7,352 8,253 9,457 10,033 10,476 10,936 E322100 Concreting Services 2,132 2,247 2,324 2,609 2,958 3,405 3,674 3,880 4,044 E322200 Bricklaying Services 2,351 2,226 2,238 2,497 2,855 3,153 3,120 3,228 3,346 E322300 Roofing Services 2,140 2,033 2,119 2,410 2,816 3,025 3,273 3,426 3,528 E322400 Structural Steel Erection Services 370 415 496 577 646 636 667 699 691 E323100 Plumbing Services 7,705 7,647 7,787 8,326 9,057 9,850 10,389 10,755 11,047 E323200 Electrical Services 13,046 13,582 13,389 14,142 15,101 15,413 16,379 17,036 17,618 E323300 Air Conditioning and Heating Services 2,398 2,282 2,374 2,615 2,889 4,341 4,627 4,836 5,188 E323400 Fire & Security Alarm Installation Serv 2,870 2,907 3,273 3,240 3,334 3,022 3,115 3,347 3,330 E323900 Other Building Installation Services 572 543 570 601 710 922 1,017 1,131 1,232 E324100 Plastering and Ceiling Services 3,345 2,949 2,982 3,400 3,928 4,373 4,682 4,704 4,913 E324200 Carpentry Services 4,136 3,957 3,962 4,143 4,287 4,437 4,486 4,228 4,136 E324300 Tiling and Carpeting Services 2,733 2,698 2,837 3,011 3,354 3,680 3,878 4,014 4,155 E324400 Painting and Decorating Services 8,520 8,392 8,489 9,078 9,852 10,689 11,259 11,320 11,394 E324500 Glazing Services 1,194 1,220 1,280 1,375 1,551 1,563 1,755 2,266 1,778 E329100 Landscape Construction Services 2,303 2,534 3,171 3,794 4,519 5,777 6,446 6,876 7,313 E329200 Hire Constn Machinery with Operator 541 631 645 762 894 1,026 1,143 1,277 1,261 E329900 Other Construction Services n.e.c. 3,289 3,380 3,651 3,877 4,467 5,505 5,972 6,440 6,556
Total less land development 113,988 113,439 118,131 127,144 141,269 157,991 168,958 176,775 183,421

26
Table 7. Sub-industry employment modelling
Employment per $ million fixed capital formation
Constant Persons per $ million 2008$ RegressionC0 RB NR OC R sq
E301100 House Construction -7962 3.22 0.70E301900 Other Residential Building Construction-3141 0.40 0.66E302000 Non-Residential Building Construction3259 1.56 0.73E310100 Road and Bridge Construction 8510 ) 3.44 0.87E310900 Other Heavy & Civil Engineering Constn )E321100 Land Development and SubdivisionE321200 Site Preparation Services -1834 0.17 0.85 1.04 0.99E322100 Concreting Services -1362 0.08 0.36 0.42 0.99E322200 Bricklaying Services -20 0.13 0.10 0.22 0.99E322300 Roofing Services -1119 0.18 0.42 0.92E322400 Structural Steel Erection Services -68 0.10 0.04 0.77E323100 Plumbing Services 350 0.33 1.12 0.91E323200 Electrical Services 4833 0.35 1.38 0.84E323300 Air Conditioning and Heating Services-3965 0.20 1.12 0.87E323400 Fire & Security Alarm Installation Serv 2558 0.02 0.08 0.23E323900 Other Building Installation Services -796 0.04 0.24 0.81E324100 Plastering and Ceiling Services 1300 0.34 1.04 0.95E324200 Carpentry Services 3159 0.08 0.03 0.71E324300 Tiling and Carpeting Services -353 0.14 0.46 0.92E324400 Painting and Decorating Services 1300 0.34 1.04 0.95E324500 Glazing Services -329 0.04 0.30 0.69E329100 Landscape Construction Services -6783 0.21 1.09 0.94 0.98E329200 Hire Constn Machinery with Operator -738 0.03 0.15 0.15 0.97E329900 Other Construction Services n.e.c. -2897 0.07 0.69 0.82 0.99
-6096 6.39 12.13 7.07Source: Business Demographic Survey, annual data 2000 to 2008.Employment for each sub-industry was regressed against the 3 components of
fixed capital formations (RB, NR, OC). R sq for each regression is shown.Employment = c0 + c1*RB + c2*NR + c3*OC c0 to c3 are constants.
Most coefficients had t statistic > 2.5, i.e. significantly different from zero.

27
10.2 Multi-factor productivity calculations The MFP index for construction was calculated using the method in Davis (2007), and the results are in Table 8. Labour numbers were used instead of labour hours worked. The calculation requires the income share between labour and capital, and national account data for the construction industry was used (as shown in Table 9). Estimates were made for capital stock after 2005, since more recent data is not yet available from Statistics NZ.
Table 8. MFP calculations
Multi-factor productivity index for construction
Construction Capital Indexes -----------------------------------------> MFPValue added stock K Employ L Composite L, K index
Mar Yr 1992/93$M 1995/96$M HLFS (000) VA K L It VA/It88 4031 3122 99.6 1.000 1.000 1.000 1.000 1.00089 3894 3161 97.3 0.966 1.012 0.977 0.993 0.97390 4055 3131 95.0 1.006 1.003 0.954 0.977 1.03091 3440 3221 88.4 0.853 1.032 0.887 0.952 0.89692 2905 3216 75.5 0.721 1.030 0.758 0.865 0.83393 2836 3171 79.6 0.704 1.016 0.799 0.886 0.79494 3133 3315 83.5 0.777 1.062 0.838 0.928 0.83795 3520 3461 94.7 0.873 1.109 0.951 1.011 0.86496 3710 3742 102.9 0.920 1.199 1.033 1.095 0.84097 4150 3978 113.3 1.030 1.274 1.137 1.184 0.86998 4290 4188 114.9 1.064 1.341 1.153 1.223 0.87099 3928 4342 109.0 0.974 1.391 1.094 1.214 0.80300 4604 4538 113.2 1.142 1.454 1.136 1.265 0.90301 4293 4717 116.4 1.065 1.511 1.168 1.307 0.81502 4532 4875 112.7 1.124 1.561 1.131 1.307 0.86003 5180 5083 125.0 1.285 1.628 1.255 1.407 0.91404 5715 5535 145.0 1.418 1.773 1.455 1.581 0.89705 6100 6207 153.8 1.513 1.988 1.544 1.725 0.87706 6367 6407 165.7 1.580 2.052 1.663 1.818 0.86907 6251 6407 186.8 1.551 2.052 1.875 1.925 0.80608 6528 6357 187.2 1.619 2.036 1.879 1.919 0.84409 5943 6257 182.6 1.474 2.004 1.833 1.881 0.784
Capital stock after 2005 is estimated by BRANZ
Composite L, K index I t= I(t-1)*((Kt/K(t-1))^wKt
*(Lt/L(t-1))^wLt)

28
Table 9. Labour and capital income shares
Construction IndustryCompensation Gross op % share
of employees surplusMar yr Labour Capital
87 1,522 1,222 55.5% 44.5%88 1,579 1,330 54.3% 45.7%89 1,601 1,373 53.8% 46.2%90 1,632 1,580 50.8% 49.2%91 1,507 1,326 53.2% 46.8%92 1,469 966 60.3% 39.7%93 1,380 1,044 56.9% 43.1%94 1,447 1,302 52.6% 47.4%95 1,643 1,617 50.4% 49.6%96 1,762 1,887 48.3% 51.7%97 1,945 2,107 48.0% 52.0%98 2,146 2,171 49.7% 50.3%99 2,058 2,095 49.6% 50.4%00 2,309 2,492 48.1% 51.9%01 2,500 2,253 52.6% 47.4%02 2,588 2,567 50.2% 49.8%03 2,882 2,850 50.3% 49.7%04 3,260 3,232 50.2% 49.8%05 3,810 3,897 49.4% 50.6%06 48.5% 51.5%07 BRANZ estimate 48.0% 52.0%08 48.0% 52.0%09 48.5% 51.5%
$ million current
29
10.3 Modelling productivity with a production function
The production function described in Section 4.5 is further analysed below:
Q = A Lβ1Kβ2
Where Q = the industry output e.g. value-added.
A = technology/managerial efficiency coefficient.
L = labour used e.g. labour hours.
K = capital stock in the industry e.g. value of productive stock (plant, machinery and equipment).
All of Q, A, L and K change with time and β1, β2 are constants.
Let A = aeδt where managerial efficiency is assumed to change exponentially with time, and δ is the annual change in efficiency.
Where e = exponential (2.714)
δ = constant
t = time.
Taking natural logs of both sides:
LnQ =Lna + δt + β1 LnK + β2 LnL.
This equation is solved by linear regression. The coefficient in the regression on the time term is δ, which is a measure of the annual change in technological-managerial efficiency.
The time series for value-added, labour and capital are shown in Table 10 and the regression parameters are in Table 11. The regression coefficients are used to model the total output over time (as shown in Figure 6). The modelling parameters for capital stock are only available up to 2005, so the regression was done between 1988 and 2005. The forward predictions of the model are shown in Figure 6, using assumed values for capital stock for 2005 to 2008. The model values for value-added plotted against actual are quite close, except for the forecasts after 2005. We do not yet know the actual values for capital stock for the latter years but the estimates are likely to be fairly correct. Hence we conclude the model does not provide very good predictive accuracy for value-added.

30
Table 10. Construction industry value-added, employment and capital stock
Building and construction industry resources
March Value added Capital stock Employment VA/employ Capital stk/ year 92/93 $ mill 95/96 $ mill (000 persons) $/ person labour ratio1987 4114 3,102 103.7 39,672 29,913 1988 4031 3,122 99.6 40,462 31,338 1989 3894 3,161 97.3 40,010 32,479 1990 4055 3,131 95.0 42,673 32,949 1991 3440 3,221 88.4 38,936 36,457 1992 2905 3,216 75.5 38,477 42,596 1993 2836 3,171 79.6 35,628 39,837 1994 3133 3,315 83.5 37,521 39,701 1995 3520 3,461 94.7 37,160 36,537 1996 3710 3,742 102.9 36,046 36,357 1997 4150 3,978 113.3 36,628 35,110 1998 4290 4,188 114.9 37,353 36,465 1999 3928 4,342 109.0 36,037 39,835 2000 4604 4,538 113.2 40,680 40,097 2001 4293 4,717 116.4 36,889 40,533
2002 4532 4,875 112.7 40,222 43,266
2003 5180 5,083 125.0 41,432 40,656
2004 5715 5,535 145.0 39,421 38,179 2005 6100 6,207 153.8 39,668 40,364 2006 6367 6,407 165.7 38,419 38,660 2007 6251 6,407 186.8 33,468 34,303 2008 6528 6,357 187.2 34,872 33,958 2009 5943 6,257 182.6 32,547 34,266
= capital stock data estimated after 2005

31
Table 11. Production function regression analysis
logQ = Loga + δT + β1LogL +β2LogKSUMMARY OUTPUT 1987 to 2005
Regression StatisticsMultiple R 0.977317R Square 0.955149Adjusted R Square0.946178Standard Error 0.047145Observations 19
ANOVAdf SS MS F
Regression 3 0.709986 0.236662 106.4793Residual 15 0.033339 0.002223Total 18 0.743325
CoefficientsStandard Error t Stat P-valuelna Intercept -1.10959 2.366663 -0.46884 0.645923
β1 X Variable 1 0.890776 0.195594 4.55422 0.00038
β2 X Variable 2 0.665389 0.392035 1.697271 0.11029
δ X Variable 3 -0.02319 0.011028 -2.10275 0.052782
Figure 6. Production function regression model
0
1000
2000
3000
4000
5000
6000
7000
8000
1987
1988
1989
1990
1991
1992
1993
1994
1995
1996
1997
1998
1999
2000
2001
2002
2003
2004
2005
2006
2007
2008
2009
Val
ue a
dded
$95
/96
mill
ion
March year
Output - Model v ActualActual
Model
Model forecast
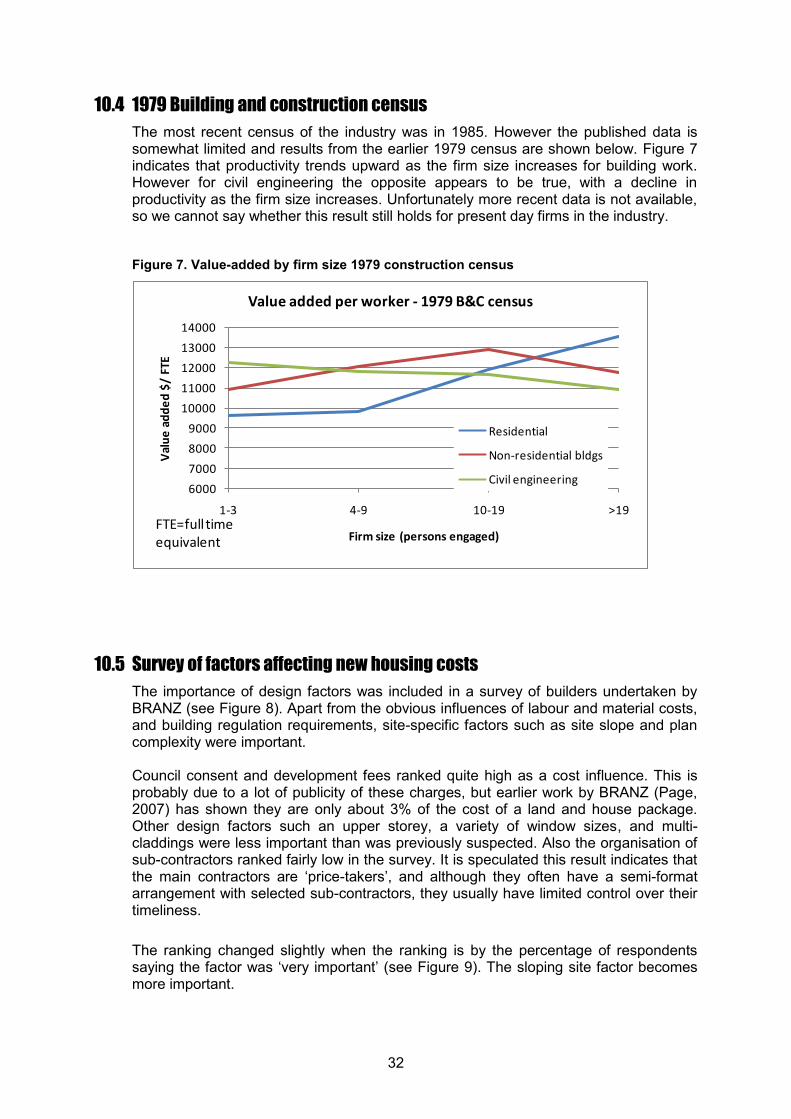
32
10.4 1979 Building and construction census The most recent census of the industry was in 1985. However the published data is somewhat limited and results from the earlier 1979 census are shown below. Figure 7 indicates that productivity trends upward as the firm size increases for building work. However for civil engineering the opposite appears to be true, with a decline in productivity as the firm size increases. Unfortunately more recent data is not available, so we cannot say whether this result still holds for present day firms in the industry.
Figure 7. Value-added by firm size 1979 construction census
6000
7000
8000
9000
10000
11000
12000
13000
14000
1-3 4-9 10-19 >19
Val
ue a
dded
$/
FTE
Firm size (persons engaged)
Value added per worker - 1979 B&C census
Residential
Non-residential bldgs
Civil engineering
FTE=full time equivalent
10.5 Survey of factors affecting new housing costs The importance of design factors was included in a survey of builders undertaken by BRANZ (see Figure 8). Apart from the obvious influences of labour and material costs, and building regulation requirements, site-specific factors such as site slope and plan complexity were important. Council consent and development fees ranked quite high as a cost influence. This is probably due to a lot of publicity of these charges, but earlier work by BRANZ (Page, 2007) has shown they are only about 3% of the cost of a land and house package. Other design factors such an upper storey, a variety of window sizes, and multi-claddings were less important than was previously suspected. Also the organisation of sub-contractors ranked fairly low in the survey. It is speculated this result indicates that the main contractors are ‘price-takers’, and although they often have a semi-format arrangement with selected sub-contractors, they usually have limited control over their timeliness.
The ranking changed slightly when the ranking is by the percentage of respondents saying the factor was ‘very important’ (see Figure 9). The sloping site factor becomes more important.

33
Figure 8. Factors influencing new housing costs – average score
1 2 3 4
Material costs
Labour costs
Council development fees
Sloping site (moderate)
Building Regulations
Floor plan complexity
Council bldg fees
Design costs
Organisation of sub-contractors
Council timeliness
Council documentatn/spec requirements
An upper Storey
H&S Regulations
Multi wall claddings
Window sizes (more than 4)
Importance of factor
Factors affecting new house costs
1= not important, 4=very important
N=224

34
Figure 9. Factors influencing new housing costs – % saying very important
0 10 20 30 40
Material costs
Council development fees
Sloping site (moderate)
Labour costs
Council bldg fees
Building Regulations
Floor plan complexity
Council timeliness
An upper Storey
Council documentatn/spec …
Organisation of sub-contractors
Design costs
H&S Regulations
Multi wall claddings
Window sizes (more than 4)
Percent saying very important
Factors affecting new house costs
10.6 Survey of factors affecting building industry productivity New house and non-residential builders were surveyed on the factors affecting building industry productivity. The results are in Figure 10 and Figure 11 and are similar for both builder types with skills, project organisation and design detailing being the most important. Workload levels, procurement, innovation and multi-project organisation also rated quite important. Workload reflects the trend in Figure 5 where productivity changes move in cycle with workload changes. The methods used by firms to procure work are rated important, reflecting the need to keep skills fully employed. It is surprising that standardisation and pre-fabrication are rated quite low as the literature indicates these are potential measures to achieve productivity gains. It may be that
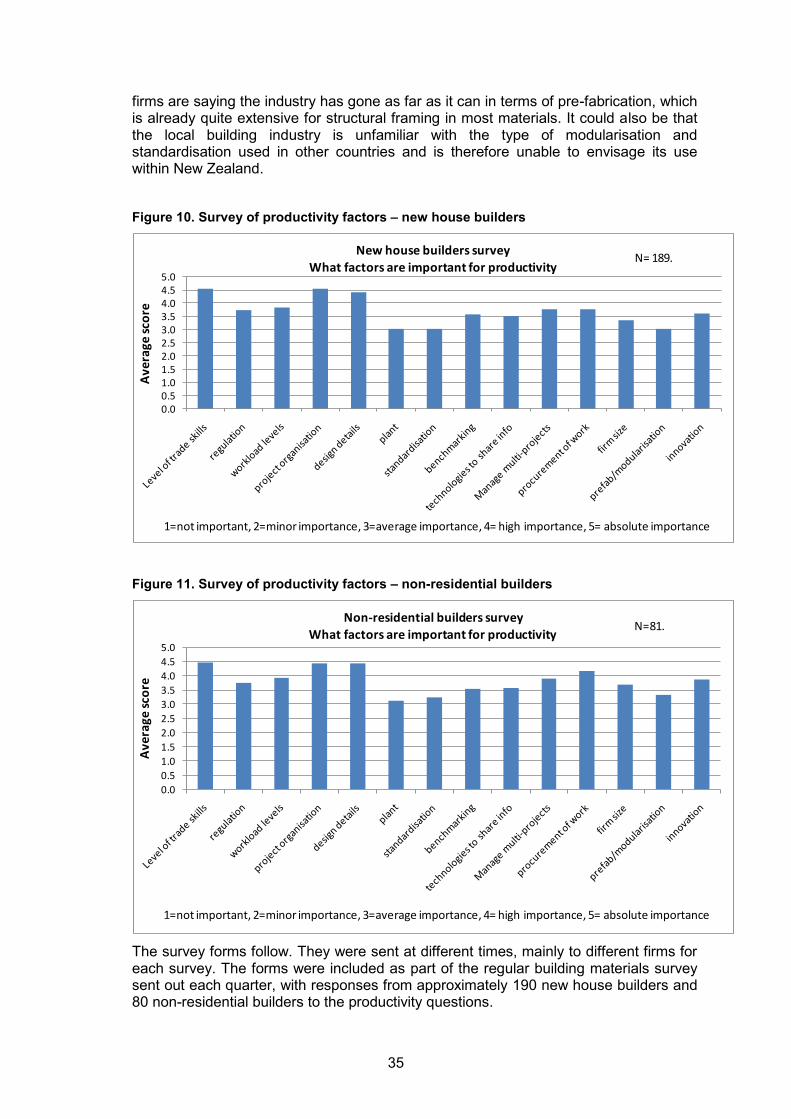
35
firms are saying the industry has gone as far as it can in terms of pre-fabrication, which is already quite extensive for structural framing in most materials. It could also be that the local building industry is unfamiliar with the type of modularisation and standardisation used in other countries and is therefore unable to envisage its use within New Zealand.
Figure 10. Survey of productivity factors – new house builders
0.00.51.01.52.02.53.03.54.04.55.0
Ave
rage
scor
e
New house builders surveyWhat factors are important for productivity
N= 189.
1=not important, 2=minor importance, 3=average importance, 4= high importance, 5= absolute importance
Figure 11. Survey of productivity factors – non-residential builders
0.00.51.01.52.02.53.03.54.04.55.0
Ave
rage
scor
e
Non-residential builders surveyWhat factors are important for productivity
N=81.
1=not important, 2=minor importance, 3=average importance, 4= high importance, 5= absolute importance
The survey forms follow. They were sent at different times, mainly to different firms for each survey. The forms were included as part of the regular building materials survey sent out each quarter, with responses from approximately 190 new house builders and 80 non-residential builders to the productivity questions.
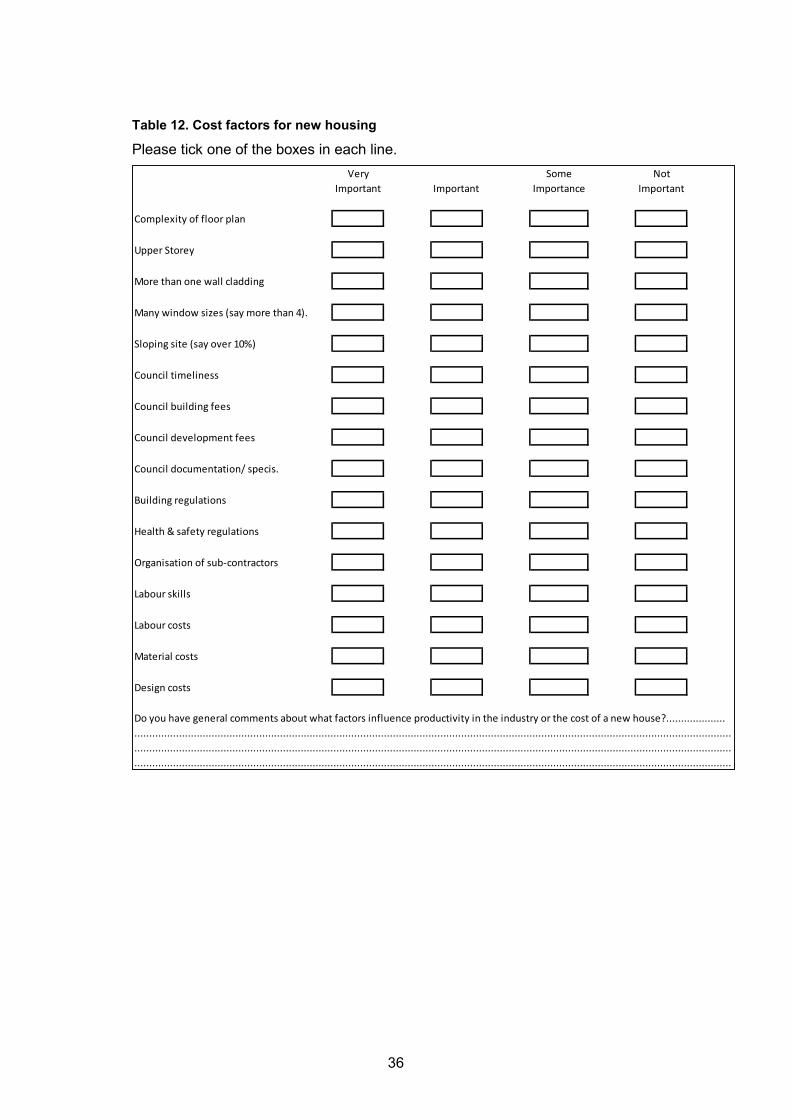
36
Table 12. Cost factors for new housing
Please tick one of the boxes in each line. Very Some Not
Important Important Importance Important
Complexity of floor plan
Upper Storey
More than one wall cladding
Many window sizes (say more than 4).
Sloping site (say over 10%)
Council timeliness
Council building fees
Council development fees
Council documentation/ specis.
Building regulations
Health & safety regulations
Organisation of sub-contractors
Labour skills
Labour costs
Material costs
Design costs
Do you have general comments about what factors influence productivity in the industry or the cost of a new house?...............................................................................................................................................................................................................................................................................................................................................................................................................................................................................................................................................................................................................................................

37
Table 13. Productivity in the building industry
It would be appreciated if respondents could also fill out this form with the new building form. How important are the following to your firm’s productivity?
PRODUCTIVITY FACTORS (fill out only once per firm.)Consider projects done over the last 3 years by your firm. In your option how important are the following factors on productivity (i.e. output per unit of inputs).
Please score the importance on a scale of 1 to 51= not important, 2= minor importance, 3= average importance, 4= high importance, 5= absolute importance.
Level of trade skills.
Level of regulation.
Level of workloads.
Organisation & planning of projects (labour, equipment, materials, information).
Design details and documentation.
Procurement of plant (i.e. leasing/ sharing/ owning arrangements).
Standardisation of design (i.e. Similar buildings with minor changes, or limited rangeof plans.)
Benchmarking performance of projects.
Technologies to exchange information with managers, designers & site personnel.
Management of multi-projects.
Procurement of work (method used to procure new work).
Size of firm (i.e. How important is the number of workers on your firm's productivity)
Prefabrication and modularisation.
Uptake of innovation by your firm.
What other factors are important for productivity? .............................................................................................................................................................................................................................................................................................................
Thank you. Please fold and return with the building survey. Thank You. Please fold this form and freepost it with the new build survey in the return envelope.