study report corsar - vfa
TRANSCRIPT

TMC114 Clinical Study Report TMC114HIV4035
1
Version 1.03 Date: 16 January 2014
CLINICAL STUDY REPORT (CSR)
Name of Sponsor/Company
Janssen Research & Development*
JANSSEN-CILAG GmbH
Name of Finished Product Prezista® and/or Intelence®
Name of Active Ingredient(s)
Darunavir and/or Etravirine
* Janssen Research & Development is a global organization that operates through different legal entities in various countries. Therefore, the legal entity acting as the sponsor for Janssen Research & Development studies may vary, such as, but not limited to Janssen Biotech, Inc.; Janssen Products, LP; Janssen Biologics, BV; Janssen-Cilag International NV; Janssen, Inc; Janssen Infectious Diseases BVBA; Janssen R&D Ireland; or Janssen Research & Development, LLC. The term “sponsor” is used to represent these various legal entities as identified on the Sponsor List.
Status: Approved
Date: 16 January 2014
Prepared by: MUC Research GmbH, Munich, Germany
Document No.: EDMS-HIV-00000001:03
Compliance The study was carried out in accordance with the "Recommendations for the planning and implementation of observational studies" published by BfArM on November 12th 1998 and the VFA´s recommendation for the improvement of quality and transparency of non-interventional studies ("VFA-Empfehlungen zur Verbesserung der Qualität und Transparenz von nicht-interventionellen Studien"; 2007).
Confidentiality Statement The information in this document contains trade secrets and commercial information that are privileged or confidential and may not be disclosed unless such disclosure is required by applicable law or regulations. In any event, persons to whom the information is disclosed must be informed that the information is privileged or confidential and may not be further disclosed by them. These restrictions on disclosure will apply equally to all future information supplied to you that is indicated as privileged or confidential.
Protocol No.: TMC114HIV4035 (A non-interventional study, NIS)
Title of Study:
Cost and resource utilization study in antiretroviral treated patients (Corsar) study - a health economic evaluation of costs associated with the HIV infection within the German health care system
Study Name: Corsar
Annotation:
This CSR refers to the evaluation of HIV-related variables (efficacy and safety evaluation) of Corsar. The cost and
resource analyses are described elsewhere.
EudraCT Number: N.A.
NCT No.: The study is listed in the register of non-interventional studies of research-based pharmaceutical companies (vfa, Verband forschender Arzneimittelhersteller). (http://www.vfa.de/de/arzneimittel-forschung/datenbanken-zu-arzneimitteln/nisdb/nis-details/_249)

TMC114 Clinical Study Report TMC114HIV4035
2
Version 1.03 Date: 16 January 2014
Clinical Registry No.: N.A.
Coordinating Investigator(s): Prof. Dr. med. Matthias Stoll, Medizinische Hochschule Hannover, Zentrum Innere Medizin, Klin. Immunologie und Rheumatologie, Carl-Neuberg-Str. 1, 30625 Hannover, Germany
Study Center(s):
The study was contacted in 10 German sites. The participating study centers were:
- Private Practice Gute, Locher, Lutz (Dr. Klauke) - ICH Grindel (Prof. H.-J. Stellbrink) - UK Hamburg-Eppendorf (Dr. O. Degen) - Klinikum Dortmund (Dr. M. Hower) - Praxis Georgstrasse (Dr. B. Kuhlmann) - LMU München (Prof. J. Bogner) - Praxis Hartl, Gorriahn (Dr. D. Gorriahn) - MHH (Prof. M. Stoll) - Ärzteforum Seestrasse (Dr. W. Schmidt) - Praxis City Ost (Dr. C. Cordes)
Publications (References):
Presentation of preliminary data:
- M. Stoll, et al. CORSAR (Cost and Resource utilization Study in Antiretroviral treated patients): a prospective multicenter cohort study focusing on the financial burden of HIV infection in people living with HIV (PLHIV) receiving antir. 19th International AIDS Conference, Washington D.C.: Abstract no. THPE660.
- M. Stoll et al. CORSAR-Studie: Eine prospektive, multizentrische Kohortenstudie zu den Krankheitskosten der HIV-Infektion unter antiretroviraler Therapie (ART) im deutschen Gesundheitssystem: 96 Wochen Analyse: DÖAK, Innsbruck 2013: Abstract 153.
Study Period: 07 JAN 2009 – 27 JUN 2012
The first patient was enrolled on 07 JAN 2009. The last observation recorded in the data base was 27 JUN 2012.
Phase of Development: N.A.
OBJECTIVES:
- The primary objective of this study was o to evaluate direct and indirect costs associated with the HIV infection itself as well as the
antiretroviral treatment and its effects in HIV-infected patients in Germany

TMC114 Clinical Study Report TMC114HIV4035
3
Version 1.03 Date: 16 January 2014
- Secondary objectives were
o to prescribe habits in terms of antiretroviral therapy and drug combinations used in first, - second or further-line therapy (definition see Protocol)
o to evaluate efficacy/effectiveness (% of patients with HIV-1-RNA <50 copies/mL at week 24, 48
and 96
and % of "responders", "non-responders (>50)", "non-responders(>200)"; see CRITERIA FOR
EVALUATION)
o to evaluate the drug safety, particularly with regard to adverse events and serious adverse events in particular in patients receiving Darunavir and/or Etravirine.
o to describe aspects of quality of life aspects (using the EQ-5D , incl. VAS)
Annotation:
This CSR includes the evaluation of efficacy and drug safety in patients of the Corsar study. Cost and resource
analyses and the evaluation of quality of life aspects – all performed by the Institut für
Versicherungsbetriebslehre Forschungsstelle für Gesundheitsökonomie, Hannover) – are described elsewhere.
METHODS:
Design
Corsar was a non-interventional prospective cohort study. Physicians and subjects did not follow a defined
schedule of diagnostic or therapeutic measures. Documentation of clinical data, direct and indirect costs was
based on routine care of HIV infected patients not being influenced by the sponsor.
Quality assurance
Data monitoring was provided by the sponsor. Monitoring included online data checks concerning the intrinsic validity of the saved therapy data and possible gaps in the documentation. On-site monitoring visits were performed as frequently as necessary and included checks of signed informed patient consent forms, AEs/SAEs recorded in the case record forms and data verification (year of birth, gender, data related to the disease, primary objectives and laboratory results) regarding completeness and plausibility. Source data verification was performed in accordance with the data protection laws. Number of Subjects (planned and analyzed):
The planned sample size was 1114 subjects. The sample size calculation was based on the primary hypothesis that treatment with HAART (highly active antiretroviral therapy) is cost-saving, i.e. due to lower hospitalization rates on HAART (40.7% vs. 52.0%; Medical School of Hannover 1997, see Protocol 11.1).
Analysis data sets
Different analysis sets - the full analysis set, the efficacy and safety sets - were used for the description of the study population, the evaluation of efficacy and the evaluation of drug safety, respectively.
o FULL ANALYSIS SET (FAS) Full Analysis Set (FAS): All patients included in the study
- Baseline demographics and HIV-related variables were described for the Full Analysis Set
TMC114 Clinical Study Report TMC114HIV4035
4
Version 1.03 Date: 16 January 2014
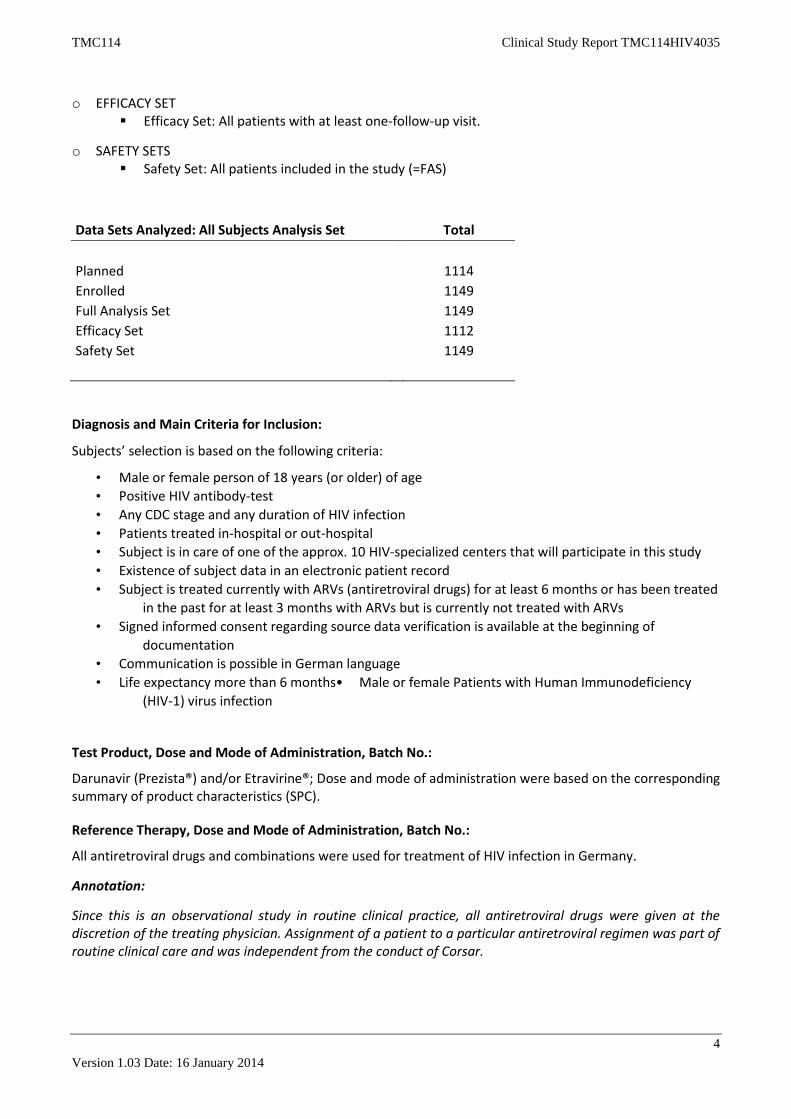
o EFFICACY SET Efficacy Set: All patients with at least one-follow-up visit.
o SAFETY SETS Safety Set: All patients included in the study (=FAS)
Data Sets Analyzed: All Subjects Analysis Set Total
Planned 1114
Enrolled 1149
Full Analysis Set 1149
Efficacy Set 1112
Safety Set 1149
Diagnosis and Main Criteria for Inclusion:
Subjects’ selection is based on the following criteria:
• Male or female person of 18 years (or older) of age
• Positive HIV antibody-test
• Any CDC stage and any duration of HIV infection
• Patients treated in-hospital or out-hospital
• Subject is in care of one of the approx. 10 HIV-specialized centers that will participate in this study
• Existence of subject data in an electronic patient record
• Subject is treated currently with ARVs (antiretroviral drugs) for at least 6 months or has been treated
in the past for at least 3 months with ARVs but is currently not treated with ARVs
• Signed informed consent regarding source data verification is available at the beginning of
documentation
• Communication is possible in German language
• Life expectancy more than 6 months• Male or female Patients with Human Immunodeficiency
(HIV-1) virus infection
Test Product, Dose and Mode of Administration, Batch No.:
Darunavir (Prezista®) and/or Etravirine®; Dose and mode of administration were based on the corresponding summary of product characteristics (SPC).
Reference Therapy, Dose and Mode of Administration, Batch No.:
All antiretroviral drugs and combinations were used for treatment of HIV infection in Germany.
Annotation:
Since this is an observational study in routine clinical practice, all antiretroviral drugs were given at the discretion of the treating physician. Assignment of a patient to a particular antiretroviral regimen was part of routine clinical care and was independent from the conduct of Corsar.

TMC114 Clinical Study Report TMC114HIV4035
5
Version 1.03 Date: 16 January 2014
Duration of Treatment:
Due to the observational design of Corsar, treatment duration was not specified in the protocol. All subjects fulfilling the inclusion criteria should be followed for 96 weeks with respect to antiretroviral therapy and other variables defined in the protocol.
Duration of treatment was based standard criteria such as virological and/or immunological success, drug safety, individual tolerability and other patient relevant factors.
CRITERIA FOR EVALUATION:
Efficacy measures
a) Proportion of the cohort with HIV-1 RNA <50 copies/mL at week 24, 48 and 96 (missing data
excluded) stratified by 1st-, 2nd/3rd and >3rd-line therapy.
b) Proportion of "responders", "non-responders (>50)", "non-responders(>200)”*
c) Absolute CD4 cell counts and change from baseline stratified by 1st-, 2nd/3rd and >3rd-line therapy
d) Percentage of patients with absolute CD4 cell counts <350, 350-500; >500/µL at week 24, 48 and 96
stratified by 1st-, 2nd/3rd and >3rd-line therapy.
e) Time on drug stratified by 1st-, 2nd/3rd and >3rd-line therapy and for the most frequent treatment
classes; baseline is not the time of inclusion but the time of initiation of the regimen.
* "responder" = HIV-1 RNA <50 copies/mL with and without HAART change
"non-responder(>50)" = HIV-1 RNA >50 copies/mL in two consecutive test results with change of
HAART
"non-responder(>200)" = multiple peak-HIV-1 RNA >200 copies/mL without change of HAART
Safety measures
Laboratory safety parameters were described for the Safety Set (missing data were excluded).
Listing of all AEs and SAEs occurring during the course of the study
Listing of all AEs and SAEs (including MedDRA Codes) occurring during antiretroviral treatment based
on Darunavir and/or Etravirine and causal relationship (unless not reported).
STATISTICAL METHODS:
Sample size
The sample size calculation was based on the primary hypothesis that treatment with HAART is cost-saving, i.e. due to lower hospitalization rates on HAART. (40.7% vs. 52.0%; Medical School of Hannover 1997 (see Protocol 11.1).
Statistical analyses
Primary analyses
The statistical analyses for pharma economic evaluation (direct and indirect costs associated with HIV infection) are based on the methods described elsewhere by the Institut für Versicherungsbetriebslehre Forschungsstelle für Gesundheitsökonomie, Hannover.

TMC114 Clinical Study Report TMC114HIV4035
6
Version 1.03 Date: 16 January 2014
Secondary analyses The methods for secondary analyses (efficacy and safety) are described in the statistical analysis plan,
version 1.1., of MUC Research. All analyses were performed after cleanup of the database (implausible
values were set as missing; all changes and the reasons for changing were documented, see Appendix A.
Documentation cleanup Corsar database).
Data were analyzed using descriptive and explorative methods.
- All statistical analyses were carried out by means of the STATA® package (version 10.1) and Excel 2010.
- As this is an observational study, only descriptive statistical methods were used. There was no data
imputation. Qualitative data (e.g. categorical variables) were presented by means of frequency
distributions. Analyses were based on valid (or observed) data per parameter (resulting in different
sample sizes for efficacy and safety laboratory parameters).
- Quantitative variables were summarized using statistical parameters such as valid (or observed) N,
mean, standard deviation, minimum, maximum, and selected quantiles (lower quartile (25%), upper
quartile (75%), and median (50%)).
- Kruskal-Wallis and Mann-Whitney U test (pairwise) were used to test for significance when comparing
continuous variables.
- Wilcoxon signed-rank test was used to test for significance when comparing repeated measurements on
a single sample.
- Chi-square-test and Fisher exact test (pairwise) were used to test for significance when comparing
frequencies.
- The p-level for significance is p<0.05.
Analysis populations
o FULL ANALYSIS SET (FAS)
Full Analysis Set (FAS): All patients included in the study - Baseline demographics and HIV-related variables were described for the full
analysis set
o EFFICACY SET
Efficacy Set: All patients with at least one-follow-up visit.
o SAFETY SETS
Safety Set: All patients included in the study (=FAS) - Laboratory safety parameters were described for all patients of the FAS (missing
data were excluded).
- All reported AEs and SAEs were listed for the safety set.
DRV/ETR Subset: All patients receiving Darunavir (Prezista®) and/or Etravirine (Intelence®) as part of their antiretroviral combination regimen.
- All reported AEs and SAEs were listed for the DRV/ETR subset; including MedDRA Coding and causal relationship (unless not reported).

TMC114 Clinical Study Report TMC114HIV4035
7
Version 1.03 Date: 16 January 2014
RESULTS:
List off Abbreviations:
AE Adverse Event
ALT (SGPT) Alanine Transaminase (Glutamic-Pyruvic
Transaminase
AST (SGOT) Aspartat-Aminotransferase (Glutamat-
Oxalacetat-Transaminase)
BMI Body mass index
CDC Classification System for HIV Infection
FAS Full Analysis Set
HAART Highly Active Antiretroviral Therapy
HIV Human immunodeficiency virus
IQR Interquartile range
NNRTI Non-nucleoside reverse-transcriptase inhibitors
NRTI Nucleoside analog reverse-transcriptase
inhibitors
PI Protease Inhibitor
SAE Serious Adverse Event
SAP Statistical Analysis Plan
SD Standard Deviation

TMC114 Clinical Study Report TMC114HIV4035
8
Version 1.03 Date: 16 January 2014
List of all tables:
Table 1: Baseline characteristics for FAS; overall and stratified by therapy line ......................................................... 10 Table 2: HAART - Treatment classes at baseline, overall and stratified by therapy line ............................................. 10 Table 3: Percentage and time to "lost to follow up”, overall and stratified by therapy line ....................................... 11 Table 4: Baseline characteristics for Efficacy Set; overall and stratified by therapy line ............................................. 11 Table 5: HAART - Treatment classes at baseline, overall and stratified by therapy line (Efficacy Set) ........................ 12 Table 6: Patients with or without HAART change after baseline [BL] at baseline, week 24, 48 and 96; overall and
stratified by therapy line ............................................................................................................................... 14 Table 7: Any documented reasons for HAART change after Baseline until week 96, overall and stratified by
therapy line .................................................................................................................................................... 15 Table 8: Time on drug at baseline, overall and stratified by therapy line ................................................................... 15 Table 9: Time on drug at baseline, overall and stratified by treatment classes .......................................................... 15 Table 10: Percentage of patients with HIV-1 RNA<50 copies/mL at baseline, week 24, 48 and 96, overall and
stratified by therapy line ............................................................................................................................... 16 Table 11: Percentage of “responder”, "non-responder(>50)" and "non-responder(>200)" overall and stratified
by therapy line ............................................................................................................................................... 16 Table 12: Percentage of “responder”, "non-responder(>50)" and "non-responder(>200)", stratified by
treatment classes ........................................................................................................................................... 17 Table 13: Absolute CD4 cell count [cells/µL] at baseline, week 24, 48 and 96, overall and stratified by therapy
line ................................................................................................................................................................. 18 Table 14: Change in CD4 cell count [cells/µL] at baseline, week 24, 48 and 96, overall and stratified by therapy
line ................................................................................................................................................................. 19 Table 15: Percentage of patients with CD4 cell count <350/µL, 350-500/µL and >500/µL at baseline, week 24,
48 and 96, overall and stratified by therapy line ........................................................................................... 20 Table 16: BMI [kg/m²] at baseline, week 24, 48 and 96, overall and stratified by therapy line .................................. 22 Table 17: Blood pressure systolic [mmHg] at baseline, week 24, 48 and 96, overall and stratified by therapy line .. 23 Table 18: Blood pressure diastolic [mmHg] at baseline, week 24, 48 and 96, overall and stratified by therapy
line ................................................................................................................................................................. 24 Table 19: Pulse [beats/minute] at baseline, week 24, 48 and 96, overall and stratified by therapy line .................... 25 Table 20: Triglyceride [mg/dL] at baseline, week 24, 48 and 96, overall and stratified by therapy line ..................... 29 Table 21: Change in Triglyceride [mg/dL] at baseline, week 24, 48 and 96, overall and stratified by therapy line .... 30 Table 22: Total cholesterol [mg/dL] at baseline, week 24, 48 and 96, overall and stratified by therapy line ............. 31 Table 23: Change in total cholesterol [mg/dL] at baseline, week 24, 48 and 96, overall and stratified by therapy
line ................................................................................................................................................................. 32 Table 24: LDL cholesterol [mg/dL] at baseline, week 24, 48 and 96, overall and stratified by therapy line ............... 33 Table 25: Change in LDL cholesterol [mg/dL] at baseline, week 24, 48 and 96, overall and stratified by therapy
line ................................................................................................................................................................. 34 Table 26: HDL cholesterol [mg/dL] at baseline, week 24, 48 and 96, overall and stratified by therapy line .............. 35 Table 27: Change in HDL cholesterol [mg/dL] at baseline, week 24, 48 and 96, overall and stratified by therapy
line ................................................................................................................................................................. 36 Table 28: AST (SGOT) [U/L] at baseline, week 24, 48 and 96, overall and stratified by therapy line .......................... 37 Table 29: Change in AST (SGOT) [U/L] at baseline, week 24, 48 and 96, overall and stratified by therapy line ......... 38 Table 30: ALT (SGPT) [U/L] at baseline, week 24, 48 and 96, overall and stratified by therapy line ........................... 39 Table 31: Change in ALT (SGPT) [U/L] at baseline, week 24, 48 and 96, overall and stratified by therapy line .......... 40 Table 32: Glucose [mg/dL] at baseline, week 24, 48 and 96, overall and stratified by therapy line ........................... 41 Table 33: Change in glucose [mg/dL] at baseline, week 24, 48 and 96, overall and stratified by therapy line ........... 42 Table 34: Creatinine [mg/dL] at baseline, week 24, 48 and 96, overall and stratified by therapy line ....................... 43 Table 35: Change in creatinine [mg/dL] at baseline, week 24, 48 and 96, overall and stratified by therapy line ....... 44

TMC114 Clinical Study Report TMC114HIV4035
9
Version 1.03 Date: 16 January 2014
STUDY POPULATION
CORSAR started recruitment during 2009 and ended after the last patient had reached week 96 in July 2012.
1149 patients from 8 outpatient and 4 inpatient centers in Germany were included in the study. 40% of patients were on 1st-line HAART at the time of enrolment (baseline), 16% of patients were on 2nd- or 3rd-line HAART and 26% of patients on 4th- or further-line HAART. In 18% of patients this information was not available (“Therapy not classified”)
The study visit “week 24” was documented in 812 patients, the visit “weeks 48” in 964 patients and the visit “week 96” in 904 patients.
Baseline demographics and HIV-related variables of the Full Analysis Set and of the Efficacy Set are shown in Tables 1-2.
BASELINE DEMOGRAPHICS AND HIV-RELATED VARIABLES
Socio-demographic data and HIV-related variables including age, gender, CDC status, duration of HIV diagnosis, CD4 cell counts and HIV-1 RNA<50 copies/mL at study start are shown in Tables 1 and 2.
All patients (N= 1149; FAS)
The median age of the patients at time of enrolment was 46 years (IQR: 40-53 years). Patients on 1st-line HAART were younger (44 years) than patients on 2nd- or 3rd-line HAART (48 years) or patients on 4th- or further-line HAART (48 years) (P<0.001; Kruskal-Wallis). The majority of the patients were men (88.7%). The CDC classification of HIV disease (most recently revised in 1993) was assessed at study start. Overall, about one fourth of patients met the criteria for CDC stage C (28%). Distribution of CDC C stages differed across the therapy lines. CDC stage C was reached in 22% of patients on 1st-line HAART, in 26% on 2nd- or 3rd-line HAART (48 years) and in 40% of patients on 4th- or further-line HAART (P<0.001, Chi²). The median duration of HIV diagnosis was 10 years (1st-line HAART: 5 years; 2nd- or 3rd-line HAART: 12 years; 4th- or further-line HAART: 15 years). The absolute median CD4+ cell count was 529 cells/µL; the interquartile range (IQR) was 369 – 709 cell/µL years (1st-line HAART: 494/µL; 2nd- or 3rd-line HAART: 580/µL; 4th- or further-line HAART: 538/µL) (P=0.02, Kruskal-Wallis). In 89% of patients HIV-1 RNA was <50 copies/mL at baseline (1st-line HAART: 90%; 2nd- or 3rd-line HAART: 92%; 4th- or further-line HAART: 92%). Most patients received a NRTI+PI (41%) based regimen or a NRTI+NNRTI (41%) based regimen (see Table 2). The overall observation time was 96 weeks and did not differ within the different therapy lines. During the observation time, 91 patients (8%) were “lost to follow up” (after a median time of 50 weeks (IQR: 13-79 weeks), see Table 3). Efficacy set (N= 1112; all patients with at least one-follow-up visit) The socio-demographic data and HIV-related variables of the Efficacy Set and the FAS were comparable (see Tables 4 and 5).

TMC114 Clinical Study Report TMC114HIV4035
10
Version 1.03 Date: 16 January 2014
FAS (=SAFETY SET)
Table 1: Baseline characteristics for FAS; overall and stratified by therapy line
Baseline characteristics
1st-line therapy
2nd/3rd-line therapy
>3rd-line therapy
Therapy not classified
Total
N 458 180 304 207 1149
Gender (N, %) Male 411 (89.7%) 158 (87.8%) 260 (85.5%) 190 (91.8%) 1019 (88.7%)
Female 45 (9.8%) 21 (11.7%) 41 (13.5%) 16 (7.7%) 123 (10.7%)
Trans-sexual
2 (0.4%) 1 (0.6%) 3 (1.0%) 1 (0.5%) 7 (0.6%)
Age [years], (Median, IQR)
44 (38 – 50) 48 (41 – 56) 48 (44 – 58) 46 (40 – 51) 46 (40 – 53)
CDC C (N, %) 102/456 (22.4%)
46/180 (25.6%)
121/303 (39.9%)
42/185 (22.7%)
311 (27.7%)
Duration of HIV diagnosis [years], (Median, IQR)
5.3
(2.6 – 10.0) 11.5
(7.0 – 16.7) 14.5
(10.8 – 19.0) 9.3
(4.0 – 14.1) 9.6
(4.5 – 15.5)
CD4 cell count [cells/µL], (Median, IQR)
494
(356 – 685) 580
(418 – 756) 538
(367 – 770) 532
(369 – 709) 529
(369 – 709)
HIV-1 RNA <50 copies/mL, (n/N, %)
412/456
(90.4) 165/180
(91.7) 278/304
(91.5) 164/201
(81.6) 1019/1141
(89.3)
Observation time [weeks], (Median, IQR)
96.8 (92 –
101.4) 96.0 (91.3 –
101.4) 95.9 (91.7 –
101.4) 92.4 (49.2 –
98.1) 95.9 (91.3 –
101.3)
Table 2: HAART - Treatment classes at baseline, overall and stratified by therapy line
Treatment classes at BL [N, %]
1st-line therapy (N=458)
2nd/3rd-line therapy (N=180)
>3rd-line therapy (N=304)
Therapy not classified (N=207)
Total (N=1149)
NRTI+PI 215 (46.9) 65 (36.1) 137 (45.1) 51 (24.6) 468 (40.7)
NRTI+PI+x 0 (0.0) 1 (0.6) 10 (3.3) 2 (1.0) 13 (1.1)
NRTI+NNRTI 205 (44.8) 92 (51.1) 102 (33.6) 74 (35.7) 473 (41.2)
NRTI+NNRTI+x 0 (0.0) 0 (0.0) 2 (0.7) 1 (0.5) 3 (0.3)
NRTIs 18 (3.9) 19 (10.6) 8 (2.6) 24 (11.6) 69 (6.0)
Other 11 (2.4) 3 (1.7) 44 (14.5) 17 (8.2) 75 (6.5)
Comment: Patients on treatment interruption were excluded.

TMC114 Clinical Study Report TMC114HIV4035
11
Version 1.03 Date: 16 January 2014
Table 3: Percentage and time to "lost to follow up”, overall and stratified by therapy line
Lost to follow up n/N (%) Observation time [weeks], (Median, IQR)
1st-line therapy 32/458 (7.0) 42.9 (13.1 - 54.6)
2nd/3rd-line therapy 15/180 (8.3) 59.1 (44.7 - 78.1)
>3rd-line therapy 29/304 (9.5) 50.0 (28.3 - 70.0)
Therapy not classified 15/207 (7.2) 33.3 (13.0 - 79.0)
Total 91/1149 (7.9) 49.7 (21.7 - 71.4)
EFFICACY SET (AT LEAST ONE FOLLOW UP)
Table 4: Baseline characteristics for Efficacy Set; overall and stratified by therapy line Baseline characteristics
1st-line therapy
2nd/3rd-line therapy
>3rd-line therapy
Therapy not classified
Total
N 452 180 301 179 1112
Gender (N, %) Male 408 (90.3) 158 (87.8) 258 (85.7) 162 (90.5) 986 (88.7)
Female 42 (9.3) 21 (11.7) 40 (13.3) 16 (8.9) 119 (10.7)
Trans-sexual
2 (0.4) 1 (0.6) 3 (1.0) 1 (0.6) 7 (0.6)
Age [years], (Median, IQR)
44 (38 – 50) 48 (41 – 56) 48 (44 – 58) 46 (40 – 52) 46 (40 – 53)
CDC C (N, %) 102/450
(22.7) 46/180 (25.6)
120/301 (39.9)
35/159 (22)
303/1090 (27.8)
Duration of HIV diagnosis [years], (Median, IQR)
5.3
(2.6 – 10.0) 11.5
(7.0 - 16.7) 14.5
(10.8 - 19.1) 9.3
(4.0 - 14.2) 9.8
(4.5 - 15.5)
CD4 cell count [cells/µL], (Median, IQR)
495
(357 - 685) 580
(418 - 756) 538
(367 - 763) 544
(376 - 717) 532
(373 - 720)
HIV-1 RNA <50 copies/mL, (n/N, %)
408/451
(90.5) 165/180
(91.7) 277/301
(92.0) 144/176
(81.8) 994 /1108
(89.7)
Observation time [weeks], (Median, IQR)
96.9 (92.1 -
101.4) 96.0 (91.3 -
101.4) 95.9 (91.9 -
101.4) 94.0 (83.4 -
100.1) 96.0 (91.7 -
101.4)

TMC114 Clinical Study Report TMC114HIV4035
12
Version 1.03 Date: 16 January 2014
Table 5: HAART - Treatment classes at baseline, overall and stratified by therapy line (Efficacy Set)
Treatment classes at BL [N, %]
1st-line therapy (N=452)
2nd/3rd-line therapy (N=180)
>3rd-line therapy (N=301)
Therapy not classified (N=179)
Total (N=1112)
NRTI+PI 215 (47.6) 65 (36.1) 137 (45.5) 51 (28.5) 468 (42.1)
NRTI+PI+x 0 (0.0) 1 (0.6) 10 (3.3) 2 (1.1) 13 (1.2)
NRTI+NNRTI 205 (45.4) 92 (51.1) 102 (33.9) 74 (41.3) 473 (42.5)
NRTI+NNRTI+x 0 (0.0) 0 (0.0) 2 (0.7) 1 (0.6) 3 (0.3)
NRTIs 18 (4.0) 19 (10.6) 8 (2.7) 24 (13.4) 69 (6.2)
Other 11 (2.4) 3 (1.7) 44 (14.6) 17 (9.5) 75 (6.7)
EFFICACY RESULTS
The following analyses are based on data of the Efficacy Set. HAART changes and treatment interruption (Tables 6 and 7) Overall, in 211 patients (23%) HAART was different from baseline at week 96 (at week 24: in 86 patients (11%); at week 48: in 163 patients (17%)). Patients on 1st line HAART were more frequently on their baseline HAART (80%) than patients on 2nd- or 3rd-line HAART (75%) and on 4th- or further-line HAART (75%) at week 96. Most common reasons for HAART changes were side effects, patient’s wish and virological failure. At baseline, 3.5% of patients did not receive any HAART, at week 24 1.7%, at week 48 2.1% and at week 96 0.9%. There were no treatment interruptions in patients on 2nd- or 3rd-line HAART or on 4th- or further-line HAART. Time on drug (Tables 8 and 9) Overall time on drug until enrolment was 3.3 years (IQR: 2.4-5.0 years). Patients on 2nd- or 3rd-line HAART stayed longer on their baseline regimen as patients on 1st-line HAART or patients on 4th- or further-line HAART (P<0.01; Kruskal-Wallis). HIV-1 RNA Table 10 shows the percentage of patients with HIV-1 RNA<50 copies/mL at baseline, week 24, 48 and 96; overall and stratified by therapy line. All patients: At baseline, 90% of patients had an HIV-1 RNA level <50 copies/mL, at week 24, 91% of patients had HIV-1 RNA levels <50 copies/mL, at week 48, 94% of patients had HIV-1 RNA levels <50 copies/mL and at week 96, 94% of patients had HIV-1 RNA levels <50 copies/mL. Patients on 1st-line HAART: At baseline, 91% of patients had an HIV-1 RNA level <50 copies/mL, at week 24, 92% of patients had HIV-1 RNA levels <50 copies/mL, at week 48, 95% of patients had HIV-1 RNA levels <50 copies/mL and at week 96, 92% of patients had HIV-1 RNA levels <50 copies/mL. Patients on 2nd- or 3rd-line HAART: At baseline, 92% of patients had an HIV-1 RNA level <50 copies/mL, at week 24, 94% of patients had HIV-1 RNA levels <50 copies/mL, at week 48, 96% of patients had HIV-1 RNA levels <50 copies/mL and at week 96, 95% of patients had HIV-1 RNA levels <50 copies/mL.

TMC114 Clinical Study Report TMC114HIV4035
13
Version 1.03 Date: 16 January 2014
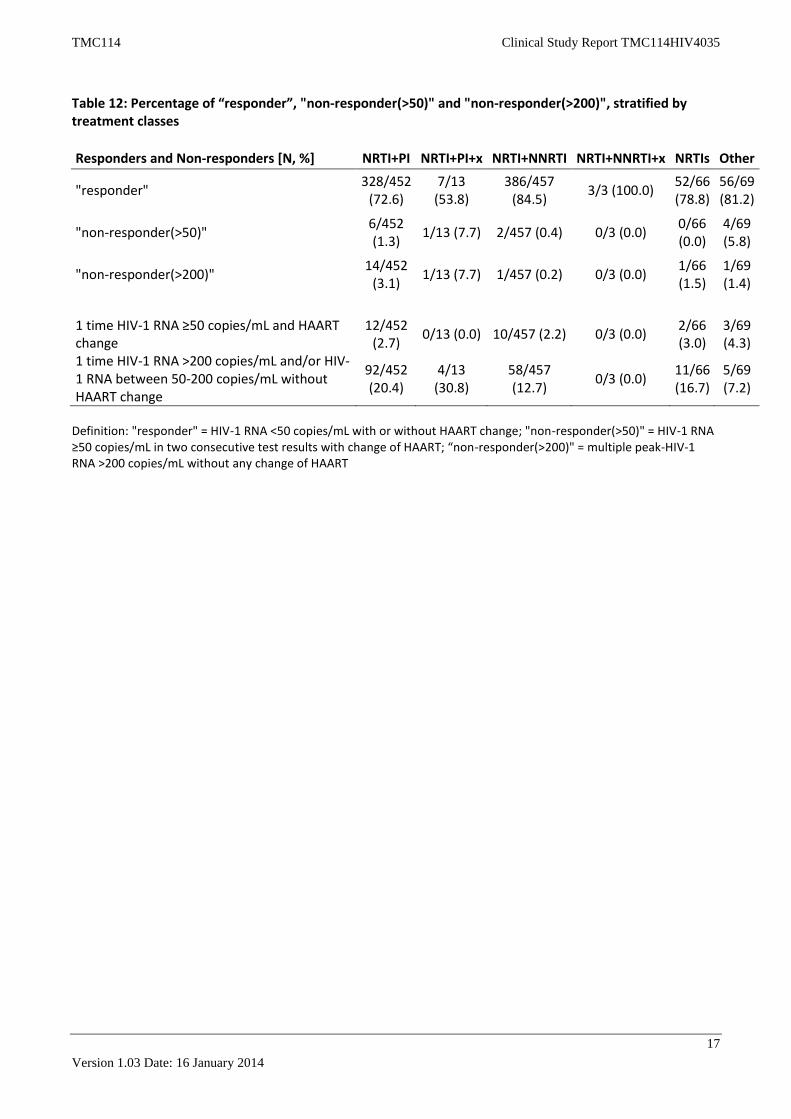
Patients on 4th- or further-line HAART: At baseline, 92% of patients had an HIV-1 RNA level <50 copies/mL. , at week 24, 92% of patients had HIV-1 RNA levels <50 copies/mL, at week 48, 95% of patients had HIV-1 RNA levels <50 copies/mL and at week 96, 95% of patients had HIV-1 RNA levels <50 copies/mL. Proportion of "responders", "non-responders (>50)", "non-responders (>200)”* Tables 11 and 12 show the percentage of patient “responders", "non-responders (>50)", "non-responders (>200)” at baseline, week 24, 48 and 96; overall and stratified by therapy line and treatment classes. Most patients were “responders” (76.3%), only 1.4% were “non-responders (>50)", and 1.6% "non-responders (>200)". In 15% of patients HIV-1 RNA was one time >200 copies/mL and/or between 50-200 copies/mL without any HAART change. There were no significant differences within therapy lines or treatment classes. Definition: "responder" = HIV-1 RNA <50 copies/mL with or without HAART change;
"non-responder(>50)" = HIV-1 RNA ≥50 copies/mL in two consecutive test results with change of HAART; “non-responder(>200)" = multiple peak-HIV-1 RNA >200 copies/mL without any change of HAART
CD4 cell count Absolute CD4 cell counts and change in absolute CD4 cell counts are shown in tables 13 and 14. Overall, the median baseline absolute CD4 cell count was 532/µL (IQR: 373/µL-720/µL). Median follow-up levels were 544/µL (IQR: 393/µL-755/µL), 579/µL (IQR: 410/µL-769/µL) and 599/µL (IQR: 430/µL-785/µL) at weeks 24, 48 and 96, respectively. The median changes from baseline were +24/µL, +30/µL and +56/µL at weeks 24, 48 and 96 (P<0.001, respectively, Wilcoxon). In patients on 1st-line HAART, the median baseline absolute CD4 cell count was 495/µL (IQR: 357/µL-685/µL). Median follow-up levels were 535/µL (IQR: 397/µL-737/µL), 560/µL (IQR: 408/µL-747/µL) and 580/µL (IQR: 426/µL-784/µL) at weeks 24, 48 and 96, respectively. The median changes from baseline were +33/µL, +53/µL and +73/µL at weeks 24, 48 and 96 (P<0.001, respectively, Wilcoxon). In patients on 2nd- or 3rd-line HAART, the median baseline absolute CD4 cell count was 580/µL (IQR: 418/µL-756/µL). Median follow-up levels were 580/µL (IQR: 431/µL-771/µL), 596/µL (IQR: 458/µL-780/µL) and 609/µL (IQR: 445/µL-783/µL) at weeks 24, 48 and 96, respectively. The median changes from baseline were +16/µL, +28/µL and +42/µL at weeks 24, 48 and 96 (P<0.001, at week 96, Wilcoxon). In patients on 4th- or further-line HAART, the median baseline absolute CD4 cell count was 538/µL (IQR: 367/µL-763/µL). Median follow-up levels were 567/µL (IQR: 365/µL-805/µL), 566/µL (IQR: 386/µL-797/µL) and 616/µL (IQR: 407/µL-802/µL) at weeks 24, 48 and 96, respectively. The median changes from baseline were +13/µL, +12/µL and +44/µL at weeks 24, 48 and 96 (P<0.001, at week 96, Wilcoxon). All patients: At baseline, in 22% CD4 cell count was <350/µL, in 24% CD4 cell count was between 350-500/µL and in 54% CD4 cell count was >500/µL. At week 96, in 15% CD4 cell count was <350/µL, in 21% CD4 cell count was between 350-500/µL and in 64% CD4 cell count was >500/µL. Patients on 1st-line HAART: At baseline, in 23% CD4 cell count was <350/µL, in 27% CD4 cell count was between 350-500/µL and in 49% CD4 cell count was >500/µL. At week 96, in 14% CD4 cell count was <350/µL, in 23% CD4 cell count was between 350-500/µL and in 64% CD4 cell count was >500/µL.

TMC114 Clinical Study Report TMC114HIV4035
14
Version 1.03 Date: 16 January 2014
Patients on 2nd- or 3rd-line HAART: At baseline, in 15% CD4 cell count was <350/µL, in 22% CD4 cell count was between 350-500/µL and in 63% CD4 cell count was >500/µL. At week 96, in 14% CD4 cell count was <350/µL, in 20% CD4 cell count was between 350-500/µL and in 66% CD4 cell count was >500/µL. Patients on 4th- or further-line HAART: At baseline, in 24% CD4 cell count was <350/µL, in 20% CD4 cell count was between 350-500/µL and in 56% CD4 cell count was >500/µL. At week 96, in 18% CD4 cell count was <350/µL, in 20% CD4 cell count was between 350-500/µL and in 62% CD4 cell count was >500/µL.
Table 6: Patients with or without HAART change after baseline [BL] at baseline, week 24, 48 and 96; overall and stratified by therapy line Without HAART
change after BL N (%)
HAART change after BL N (%)
Therapy interruption
N (%) Total
1st-line therapy
Baseline 444 (98.2) 0 (0.0) 8 (1.8) 452 (100.0)
Week 24 312 (91.0) 26 (7.6) 5 (1.5) 343 (100.0)
Week 48 340 (85.9) 51 (12.9) 5 (1.3) 396 (100.0)
Week 96 301 (79.8) 70 (18.6) 6 (1.6) 377 (100.0)
2nd/3rd-line therapy
Baseline 180 (100.0) 0 (0.0) 0 (0.0) 180 (100.0)
Week 24 115 (89.8) 13 (10.2) 0 (0.0) 128 (100.0)
Week 48 134 (81.7) 30 (18.3) 0 (0.0) 164 (100.0)
Week 96 115 (75.2) 38 (24.8) 0 (0.0) 153 (100.0)
>3rd-line therapy
Baseline 301 (100.0) 0 (0.0) 0 (0.0) 301 (100.0)
Week 24 195 (88.2) 26 (11.8) 0 (0.0) 221 (100.0)
Week 48 214 (82.3) 46 (17.7) 0 (0.0) 260 (100.0)
Week 96 187 (74.8) 63 (25.2) 0 (0.0) 250 (100.0)
Therapy not classified
Baseline 148 (82.7) 0 (0.0) 31 (17.3) 179 (100.0)
Week 24 90 (75.0) 21 (17.5) 9 (7.5) 120 (100.0)
Week 48 93 (64.6) 36 (25.0) 15 (10.4) 144 (100.0)
Week 96 82 (66.1) 40 (32.3) 2 (1.6) 124 (100.0)
Total
Baseline 1073 (96.5) 0 (0.0) 39 (3.5) 1112 (100.0)
Week 24 712 (87.7) 86 (10.6) 14 (1.7) 812 (100.0)
Week 48 781 (81.0) 163 (16.9) 20 (2.1) 964 (100.0)
Week 96 685 (75.8) 211 (23.3) 8 (0.9) 904 (100.0)

TMC114 Clinical Study Report TMC114HIV4035
15
Version 1.03 Date: 16 January 2014
Table 7: Any documented reasons for HAART change after Baseline until week 96, overall and stratified by therapy line Reason for HAART change after BL [N, %]
1st-line therapy
2nd/3rd-line therapy
>3rd-line therapy
Therapy not classified
Total
Side effects 12 (13.2) 9 (19.1) 8 (9.8) 10 (19.2) 39 (14.3)
Patient´s wish 2 (2.2) 2 (4.3) 8 (9.8) 1 (1.9) 13 (4.8)
Virological failure 1 (1.1) 1 (2.1) 5 (6.1) 4 (7.7) 11 (4.0)
Immunological failure 0 (0.0) 0 (0.0) 1 (1.2) 2 (3.8) 3 (1.1)
Noncompliance 1 (1.1) 1 (2.1) 0 (0.0) 0 (0.0) 2 (0.7)
Simplification 6 (6.6) 1 (2.1) 2 (2.4) 0 (0.0) 9 (3.3)
Therapy intensification 1 (1.1) 1 (2.1) 1 (1.2) 1 (1.9) 4 (1.5)
Therapy interruption 1 (1.1) 0 (0.0) 1 (1.2) 1 (1.9) 3 (1.1)
Resistance 0 (0.0) 0 (0.0) 2 (2.4) 0 (0.0) 2 (0.7)
Comorbidites 1 (1.1) 1 (2.1) 3 (3.7) 0 (0.0) 5 (1.8)
Clinical study start 1 (1.1) 0 (0.0) 0 (0.0) 1 (1.9) 2 (0.7)
Unknown 65 (71.4) 31 (66.0) 51 (62.2) 32 (61.5) 179 (65.8)
Total 88 (100.0) 42 (100.0) 72 (100.0) 48 (100.0) 250 (100.0)
Comment: Table includes all HAART changes; there are patients with more than one HAART changes Table 8: Time on drug at baseline, overall and stratified by therapy line
Time on drug – Therapy lines [years] N Median (IQR)
1st-line therapy 444 3.2 (2.4 - 4.5)
2nd/3rd-line therapy 180 3.8 (2.6 - 5.7)
>3rd-line therapy 301 3.3 (2.3 - 4.9)
Therapy not classified 148 3.8 (2.4 - 5.8)
Total 1073 3.3 (2.4 - 5.0)
Comment: P=0.0014; Kruskal-Wallis Table 9: Time on drug at baseline, overall and stratified by treatment classes
Time on drug – Treatment Classes [years] N Median (IQR)
NRTI+PI 459 3.2 (2.3 – 4.8)
NRTI+PI+x 13 2.6 (1.9 – 3.3)
NRTI+NNRTI 460 3.4 (2.5 – 5.2)
NRTI+NNRTI+x 3 3.1 (1.0 – 3.7)
NRTIs 67 4.8 (2.9 – 8.0)
Other 70 3.0 (2.0 – 5.0)

TMC114 Clinical Study Report TMC114HIV4035
16
Version 1.03 Date: 16 January 2014
Table 10: Percentage of patients with HIV-1 RNA<50 copies/mL at baseline, week 24, 48 and 96, overall and stratified by therapy line
HIV-1 RNA <50 copies/mL Baseline n/N (%)
Week 24 n/N (%)
Week 48 n/N (%)
Week 96 n/N (%)
1st-line therapy 408/451 (90.5) 315/343 (91.8) 376/396 (94.9) 348/377 (92.3)
2nd/3rd-line therapy 165/180 (91.7) 120/128 (93.8) 158/164 (96.3) 146/153 (95.4)
>3rd-line therapy 277/301 (92.0) 203/221 (91.9) 246/260 (94.6) 237/250 (94.8)
Therapy not classified 144/176 (81.8) 100/116 (86.2) 123/137 (89.8) 114/124 (91.9)
Total 994/1108 (89.7) 738/808 (91.3) 903/957 (94.4) 845/904 (93.5)
Table 11: Percentage of “responder”, "non-responder(>50)" and "non-responder(>200)" overall and stratified by therapy line Responders and Non-responders [N, %]
1st-line therapy
2nd/3rd-line therapy
>3rd-line therapy
Therapy not classified
Total
"responder" 347/449
(77.3) 144/178
(80.9) 234/296
(79.1) 124/177
(70.1) 849/1112
(76.3)
"non-responder(>50)" 4/449 (0.9) 2/178 (1.1) 6/296 (2.0) 4/177 (2.3) 16/1112 (1.4)
"non-responder(>200)" 6/449 (1.3) 6/178 (3.4) 4/296 (1.4) 2/177 (1.1) 18/1112 (1.6)
1 time HIV-1 RNA ≥50 copies/mL and HAART change
12/449 (2.7) 2/178 (1.1) 9/296 (3.0) 4/177 (2.3) 27/1112 (2.4)
1 time HIV-1 RNA >200 copies/mL and/or HIV-1 RNA between 50-200 copies/mL without HAART change
79/449 (17.6) 24/178 (13.5) 43/296 (14.5) 25/177 (14.1) 171/1112
(15.4)
without any HAART 1/449 (0.2) 0/178 (0.0) 0/296 (0.0) 18/177 (10.2) 19/1112 (1.7)
Definition: "responder" = HIV-1 RNA <50 copies/mL with or without HAART change; "non-responder(>50)" = HIV-1 RNA ≥50 copies/mL in two consecutive test results with change of HAART; “non-responder(>200)" = multiple peak-HIV-1 RNA >200 copies/mL without any change of HAART
TMC114 Clinical Study Report TMC114HIV4035
17
Version 1.03 Date: 16 January 2014
Table 12: Percentage of “responder”, "non-responder(>50)" and "non-responder(>200)", stratified by treatment classes
Responders and Non-responders [N, %] NRTI+PI NRTI+PI+x NRTI+NNRTI NRTI+NNRTI+x NRTIs Other
"responder" 328/452
(72.6) 7/13
(53.8) 386/457
(84.5) 3/3 (100.0)
52/66 (78.8)
56/69 (81.2)
"non-responder(>50)" 6/452 (1.3)
1/13 (7.7) 2/457 (0.4) 0/3 (0.0) 0/66 (0.0)
4/69 (5.8)
"non-responder(>200)" 14/452
(3.1) 1/13 (7.7) 1/457 (0.2) 0/3 (0.0)
1/66 (1.5)
1/69 (1.4)
1 time HIV-1 RNA ≥50 copies/mL and HAART change
12/452 (2.7)
0/13 (0.0) 10/457 (2.2) 0/3 (0.0) 2/66 (3.0)
3/69 (4.3)
1 time HIV-1 RNA >200 copies/mL and/or HIV-1 RNA between 50-200 copies/mL without HAART change
92/452 (20.4)
4/13 (30.8)
58/457 (12.7)
0/3 (0.0) 11/66 (16.7)
5/69 (7.2)
Definition: "responder" = HIV-1 RNA <50 copies/mL with or without HAART change; "non-responder(>50)" = HIV-1 RNA ≥50 copies/mL in two consecutive test results with change of HAART; “non-responder(>200)" = multiple peak-HIV-1 RNA >200 copies/mL without any change of HAART

TMC114 Clinical Study Report TMC114HIV4035
18
Version 1.03 Date: 16 January 2014
Table 13: Absolute CD4 cell count [cells/µL] at baseline, week 24, 48 and 96, overall and stratified by therapy line CD4 cell count [cells/µL]
N Mean SD Min Max 25th
Percentile 75th
Percentile Median
1st-line therapy
Baseline 452 537.2 254.1 16 1770 357 685 495
Week 24 343 577.0 258.8 66 1730 397 737 535
Week 48 396 602.9 264.1 100 1677 408 747 560
Week 96 375 626.5 280.3 13 1793 426 784 580
2nd/3rd-line therapy
Baseline 180 610.5 281.1 24 1464 418 756 580
Week 24 128 621.6 277.7 78 1742 431 771 580
Week 48 164 638.2 285.0 0 1599 458 780 596
Week 96 152 648.7 290.4 150 1712 445 783 609
>3rd-line therapy
Baseline 301 578.9 295.8 2 1994 367 763 538
Week 24 221 600.8 300.3 83 1449 365 805 567
Week 48 260 597.5 280.0 52 1459 386 797 566
Week 96 250 626.4 295.8 57 1600 407 802 616
Therapy not classified
Baseline 176 575.3 298.2 44 1670 376 717 544
Week 24 116 563.9 268.5 131 1875 387 711 513
Week 48 137 609.2 275.6 121 1770 411 751 581
Week 96 124 629.7 278.2 109 1844 445 760 612
Total
Baseline 1109 566.4 278.4 2 1994 373 720 532
Week 24 808 588.7 275.2 66 1875 393 755 544
Week 48 957 608.4 273.7 0 1770 410 769 579
Week 96 901 630.7 285.7 13 1844 430 785 599

TMC114 Clinical Study Report TMC114HIV4035
19
Version 1.03 Date: 16 January 2014
Table 14: Change in CD4 cell count [cells/µL] at baseline, week 24, 48 and 96, overall and stratified by therapy line Change in CD4 cell count [cells/µL]
N Mean SD Min Max 25th
Percentile 75th
Percentile Median
1st-line therapy
Baseline 452 0.0 0.0 0 0 0 0 0
Week 24 343 29.2 142.8 -595 522 -41 104 33
Week 48 396 57.0 170.6 -700 1091 -30 131 53
Week 96 375 85.6 192.6 -696 818 -15 171 73
2nd/3rd-line therapy
Baseline 180 0.0 0.0 0 0 0 0 0
Week 24 128 15.5 147.8 -353 556 -84 80 16
Week 48 164 34.4 172.6 -894 752 -51 110 28
Week 96 152 40.6 169.2 -420 597 -56 122 42
>3rd-line therapy
Baseline 301 0.0 0.0 0 0 0 0 0
Week 24 221 18.2 158.8 -582 734 -55 76 13
Week 48 260 2.4 159.4 -781 594 -64 85 12
Week 96 250 40.3 178.2 -797 689 -46 119 44
Therapy not classified
Baseline 176 0.0 0.0 0 0 0 0 0
Week 24 116 11.4 173.1 -800 668 -49 93 17
Week 48 137 24.4 174.0 -612 476 -46 95 15
Week 96 124 38.4 206.5 -987 581 -48 150 46
Total
Baseline 1109 0.0 0.0 0 0 0 0 0
Week 24 808 21.5 152.6 -800 734 -50 94 24
Week 48 957 33.6 169.7 -894 1091 -47 113 30
Week 96 901 59.0 188.0 -987 818 -36 152 56

TMC114 Clinical Study Report TMC114HIV4035
20
Version 1.03 Date: 16 January 2014
Table 15: Percentage of patients with CD4 cell count <350/µL, 350-500/µL and >500/µL at baseline, week 24, 48 and 96, overall and stratified by therapy line CD4 cell count categories Baseline
n/N (%) Week 24 n/N (%)
Week 48 n/N (%)
Week 96 n/N (%)
1st-line therapy
CD4 cell count<350/µL 105/452 (23.2) 62/343 (18.1) 70/396 (17.7) 51/375 (13.6)
CD4 cell count 350-500/µL 124/452 (27.4) 89/343 (25.9) 91/396 (23.0) 86/375 (22.9)
CD4 cell count>500/µL 223/452 (49.3) 192/343 (56.0) 235/396 (59.3) 238/375 (63.5)
2nd/3rd-line therapy
CD4 cell count<350/µL 27/180 (15.0) 18/128 (14.1) 21/164 (12.8) 21/152 (13.8)
CD4 cell count 350-500/µL 39/180 (21.7) 30/128 (23.4) 32/164 (19.5) 30/152 (19.7)
CD4 cell count>500/µL 114/180 (63.3) 80/128 (62.5) 111/164 (67.7) 101/152 (66.4)
>3rd-line therapy
CD4 cell count<350/µL 73/301 (24.3) 50/221 (22.6) 46/260 (17.7) 44/250 (17.6)
CD4 cell count 350-500/µL 60/301 (19.9) 43/221 (19.5) 65/260 (25.0) 51/250 (20.4)
CD4 cell count>500/µL 168/301 (55.8) 128/221 (57.9) 149/260 (57.3) 155/250 (62.0)
Therapy not classified
CD4 cell count<350/µL 39/176 (22.2) 22/116 (19.0) 23/137 (16.8) 20/124 (16.1)
CD4 cell count 350-500/µL 40/176 (22.7) 32/116 (27.6) 30/137 (21.9) 19/124 (15.3)
CD4 cell count>500/µL 97/176 (55.1) 62/116 (53.4) 84/137 (61.3) 85/124 (68.5)
Total
CD4 cell count<350/µL 244/1109 (22.0) 152/808 (18.8) 160/957 (16.7) 136/901 (15.1)
CD4 cell count 350-500/µL 263/1109 (23.7) 194/808 (24.0) 218/957 (22.8) 186/901 (20.6)
CD4 cell count>500/µL 602/1109 (54.3) 462/808 (57.2) 579/957 (60.5) 579/901 (64.3)
TMC114 Clinical Study Report TMC114HIV4035
21
Version 1.03 Date: 16 January 2014
PHARMACOKINETIC [AND PHARMACODYNAMIC] RESULTS:
N.A.
PHARMACOGENOMIC RESULTS:
N.A.
PATIENT-REPORTED OUTCOMES RESULTS:
N.A.
MEDICAL RESOURCE UTILIZATION AND HEALTH ECONOMICS RESULTS:
The results concerning the pharma economic evaluation are presented elsewhere.
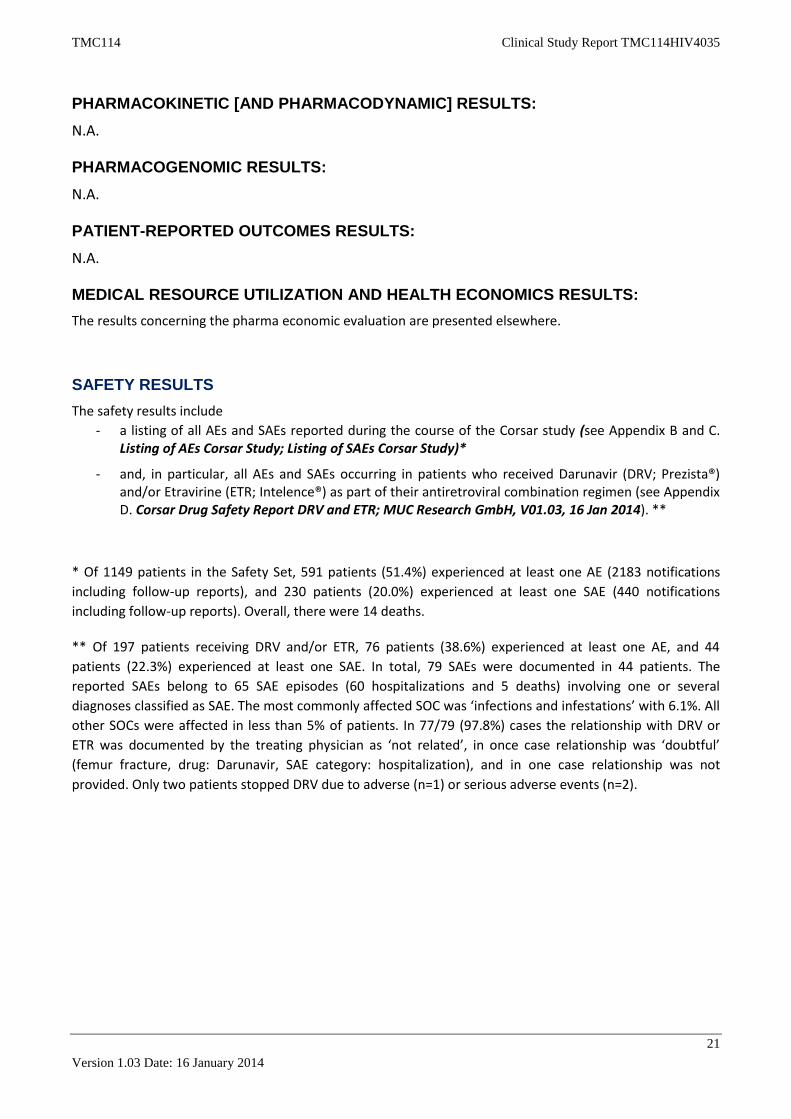
SAFETY RESULTS
The safety results include
- a listing of all AEs and SAEs reported during the course of the Corsar study (see Appendix B and C. Listing of AEs Corsar Study; Listing of SAEs Corsar Study)*
- and, in particular, all AEs and SAEs occurring in patients who received Darunavir (DRV; Prezista®) and/or Etravirine (ETR; Intelence®) as part of their antiretroviral combination regimen (see Appendix D. Corsar Drug Safety Report DRV and ETR; MUC Research GmbH, V01.03, 16 Jan 2014). **
* Of 1149 patients in the Safety Set, 591 patients (51.4%) experienced at least one AE (2183 notifications
including follow-up reports), and 230 patients (20.0%) experienced at least one SAE (440 notifications
including follow-up reports). Overall, there were 14 deaths.
** Of 197 patients receiving DRV and/or ETR, 76 patients (38.6%) experienced at least one AE, and 44
patients (22.3%) experienced at least one SAE. In total, 79 SAEs were documented in 44 patients. The
reported SAEs belong to 65 SAE episodes (60 hospitalizations and 5 deaths) involving one or several
diagnoses classified as SAE. The most commonly affected SOC was ‘infections and infestations’ with 6.1%. All
other SOCs were affected in less than 5% of patients. In 77/79 (97.8%) cases the relationship with DRV or
ETR was documented by the treating physician as ‘not related’, in once case relationship was ‘doubtful’
(femur fracture, drug: Darunavir, SAE category: hospitalization), and in one case relationship was not
provided. Only two patients stopped DRV due to adverse (n=1) or serious adverse events (n=2).

TMC114 Clinical Study Report TMC114HIV4035
22
Version 1.03 Date: 16 January 2014
VITAL SIGNS
BMI, blood pressure and pulse are shown in table 16-19. The median BMI was 24 kg/m2 in each group, the median diast. /syst. blood pressure was 80/128 mmHg and the median pulse was 76 beats/minute. Table 16: BMI [kg/m²] at baseline, week 24, 48 and 96, overall and stratified by therapy line
BMI [kg/m²] N Mean SD Min Max 25th
Percentile 75th
Percentile Median
1st-line therapy
Baseline 449 23.9 3.3 16 44 22 26 24
Week 24 260 24.6 3.6 16 45 22 26 24
Week 48 304 24.3 3.4 16 44 22 26 24
Week 96 281 24.5 3.7 16 45 22 27 24
2nd/3rd-line therapy
Baseline 179 24.7 3.7 15 36 22 27 24
Week 24 104 25.0 3.7 15 34 23 28 24
Week 48 133 25.3 3.9 15 38 22 28 24
Week 96 115 25.1 4.0 15 39 22 27 24
>3rd-line therapy
Baseline 302 24.1 4.0 15 48 21 26 24
Week 24 154 24.3 3.8 17 39 22 26 24
Week 48 197 24.2 3.7 16 37 22 26 24
Week 96 178 24.4 4.0 17 41 22 26 24
Therapy not classified
Baseline 182 24.1 3.7 17 39 21 26 24
Week 24 80 24.1 3.8 18 34 21 27 24
Week 48 92 24.2 3.4 18 34 22 27 24
Week 96 90 24.3 3.1 18 32 22 26 24
Total
Baseline 1112 24.1 3.6 15 48 22 26 24
Week 24 598 24.5 3.7 15 45 22 26 24
Week 48 726 24.4 3.6 15 44 22 27 24
Week 96 664 24.6 3.8 15 45 22 27 24

TMC114 Clinical Study Report TMC114HIV4035
23
Version 1.03 Date: 16 January 2014
Table 17: Blood pressure systolic [mmHg] at baseline, week 24, 48 and 96, overall and stratified by therapy line
Blood pressure, systolic [mmHg]
N Mean SD Min Max 25th
Percentile 75th
Percentile Median
1st-line therapy
Baseline 372 126.1 15.9 90 200 118 135 125
Week 24 255 130.3 16.8 90 190 120 140 130
Week 48 302 130.8 15.9 86 180 120 140 130
Week 96 265 130.1 14.4 92 168 120 140 130
2nd/3rd-line therapy
Baseline 144 130.0 18.1 90 180 120 141 130
Week 24 102 129.4 14.3 100 170 120 140 130
Week 48 128 131.5 16.8 89 180 120 140 130
Week 96 116 134.1 18.2 100 200 120 140 131
>3rd-line therapy
Baseline 237 129.2 15.3 84 180 120 140 130
Week 24 157 128.3 15.6 90 180 120 140 129
Week 48 190 130.0 16.1 92 170 120 140 130
Week 96 169 130.7 16.4 90 180 120 140 130
Therapy not classified
Baseline 141 126.8 15.1 90 185 120 135 125
Week 24 77 126.3 14.4 99 161 120 137 123
Week 48 89 130.8 16.6 100 180 120 140 130
Week 96 81 130.6 18.7 90 185 120 140 130
Total
Baseline 894 127.7 16.0 84 200 120 140 128
Week 24 591 129.1 15.8 90 190 120 140 130
Week 48 709 130.7 16.2 86 180 120 140 130
Week 96 631 131.0 16.3 90 200 120 140 130

TMC114 Clinical Study Report TMC114HIV4035
24
Version 1.03 Date: 16 January 2014
Table 18: Blood pressure diastolic [mmHg] at baseline, week 24, 48 and 96, overall and stratified by therapy line
Blood pressure, diastolic [mmHg]
N Mean SD Min Max 25th
Percentile 75th
Percentile Median
1st-line therapy
Baseline 372 80.9 10.7 60 130 72 90 80
Week 24 257 82.8 11.7 53 120 74 90 81
Week 48 302 82.0 11.5 48 150 73 90 80
Week 96 264 82.1 9.9 43 105 75 90 80
2nd/3rd-line therapy
Baseline 144 82.7 11.2 50 112 75 90 80
Week 24 102 82.5 9.4 69 120 77 90 80
Week 48 128 83.4 11.1 49 111 79 90 80
Week 96 116 83.1 10.4 59 110 77 90 80
>3rd-line therapy
Baseline 237 81.8 10.0 56 110 75 90 80
Week 24 157 80.9 9.8 53 117 75 88 80
Week 48 190 82.4 10.2 60 118 75 90 80
Week 96 169 81.8 11.4 60 110 72 90 80
Therapy not classified
Baseline 138 80.5 10.0 50 110 75 85 80
Week 24 76 81.1 11.2 60 105 70 90 80
Week 48 89 81.2 10.3 50 110 75 89 80
Week 96 81 81.4 11.0 56 108 70 90 80
Total
Baseline 891 81.4 10.5 50 130 75 90 80
Week 24 592 82.0 10.8 53 120 75 90 80
Week 48 709 82.3 10.9 48 150 75 90 80
Week 96 630 82.1 10.6 43 110 75 90 80

TMC114 Clinical Study Report TMC114HIV4035
25
Version 1.03 Date: 16 January 2014
Table 19: Pulse [beats/minute] at baseline, week 24, 48 and 96, overall and stratified by therapy line
Pulse [beats/minute] N Mean SD Min Max 25th
Percentile 75th
Percentile Median
1st-line therapy
Baseline 358 76.3 11.1 40 117 68 82 76
Week 24 249 78.5 11.4 50 117 72 84 79
Week 48 294 77.9 12.3 50 125 69 85 77
Week 96 262 79.0 12.5 54 130 71 86 78
2nd/3rd-line therapy
Baseline 138 76.5 9.9 52 120 70 82 76
Week 24 99 76.1 10.0 51 113 70 80 75
Week 48 121 79.1 11.9 44 112 72 85 79
Week 96 113 77.9 11.8 54 116 70 84 76
>3rd-line therapy
Baseline 229 76.0 10.4 55 111 68 82 75
Week 24 149 75.6 10.8 52 108 68 83 75
Week 48 183 76.4 11.4 53 115 68 83 76
Week 96 163 76.0 12.4 50 112 67 84 74
Therapy not classified
Baseline 135 76.5 10.2 54 114 70 80 78
Week 24 75 75.6 11.4 48 122 68 82 78
Week 48 89 76.4 13.4 50 120 68 84 76
Week 96 81 74.6 11.0 53 108 67 81 74
Total
Baseline 860 76.3 10.6 40 120 68 82 76
Week 24 572 77.0 11.1 48 122 70 84 76
Week 48 687 77.5 12.2 44 125 69 84 76
Week 96 619 77.5 12.3 50 130 68 84 76
TMC114 Clinical Study Report TMC114HIV4035
26
Version 1.03 Date: 16 January 2014
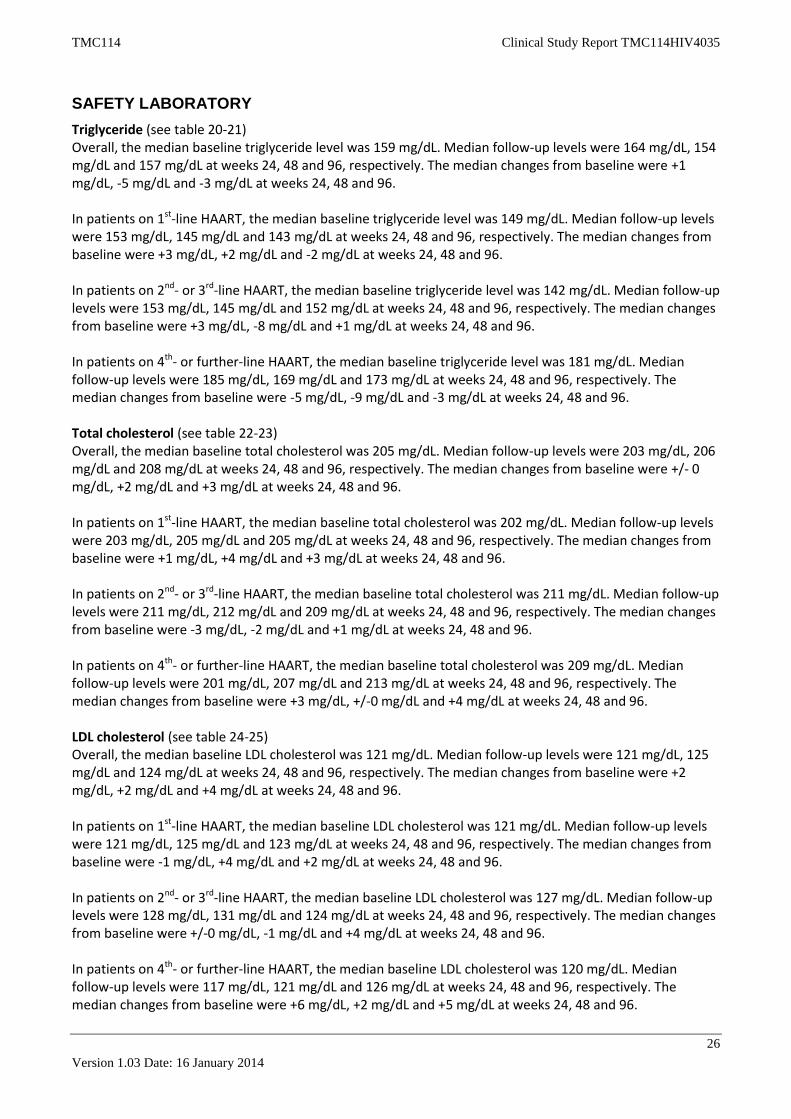
SAFETY LABORATORY
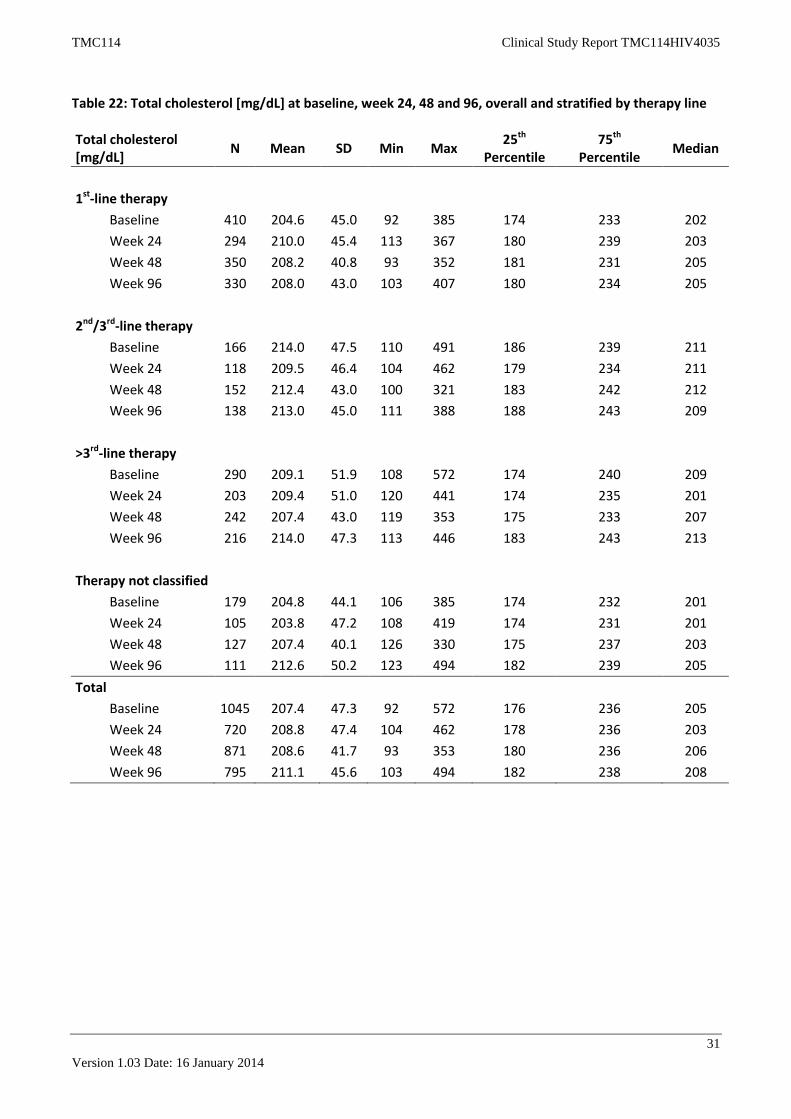
Triglyceride (see table 20-21) Overall, the median baseline triglyceride level was 159 mg/dL. Median follow-up levels were 164 mg/dL, 154 mg/dL and 157 mg/dL at weeks 24, 48 and 96, respectively. The median changes from baseline were +1 mg/dL, -5 mg/dL and -3 mg/dL at weeks 24, 48 and 96. In patients on 1st-line HAART, the median baseline triglyceride level was 149 mg/dL. Median follow-up levels were 153 mg/dL, 145 mg/dL and 143 mg/dL at weeks 24, 48 and 96, respectively. The median changes from baseline were +3 mg/dL, +2 mg/dL and -2 mg/dL at weeks 24, 48 and 96. In patients on 2nd- or 3rd-line HAART, the median baseline triglyceride level was 142 mg/dL. Median follow-up levels were 153 mg/dL, 145 mg/dL and 152 mg/dL at weeks 24, 48 and 96, respectively. The median changes from baseline were +3 mg/dL, -8 mg/dL and +1 mg/dL at weeks 24, 48 and 96. In patients on 4th- or further-line HAART, the median baseline triglyceride level was 181 mg/dL. Median follow-up levels were 185 mg/dL, 169 mg/dL and 173 mg/dL at weeks 24, 48 and 96, respectively. The median changes from baseline were -5 mg/dL, -9 mg/dL and -3 mg/dL at weeks 24, 48 and 96. Total cholesterol (see table 22-23) Overall, the median baseline total cholesterol was 205 mg/dL. Median follow-up levels were 203 mg/dL, 206 mg/dL and 208 mg/dL at weeks 24, 48 and 96, respectively. The median changes from baseline were +/- 0 mg/dL, +2 mg/dL and +3 mg/dL at weeks 24, 48 and 96. In patients on 1st-line HAART, the median baseline total cholesterol was 202 mg/dL. Median follow-up levels were 203 mg/dL, 205 mg/dL and 205 mg/dL at weeks 24, 48 and 96, respectively. The median changes from baseline were +1 mg/dL, +4 mg/dL and +3 mg/dL at weeks 24, 48 and 96. In patients on 2nd- or 3rd-line HAART, the median baseline total cholesterol was 211 mg/dL. Median follow-up levels were 211 mg/dL, 212 mg/dL and 209 mg/dL at weeks 24, 48 and 96, respectively. The median changes from baseline were -3 mg/dL, -2 mg/dL and +1 mg/dL at weeks 24, 48 and 96. In patients on 4th- or further-line HAART, the median baseline total cholesterol was 209 mg/dL. Median follow-up levels were 201 mg/dL, 207 mg/dL and 213 mg/dL at weeks 24, 48 and 96, respectively. The median changes from baseline were +3 mg/dL, +/-0 mg/dL and +4 mg/dL at weeks 24, 48 and 96. LDL cholesterol (see table 24-25) Overall, the median baseline LDL cholesterol was 121 mg/dL. Median follow-up levels were 121 mg/dL, 125 mg/dL and 124 mg/dL at weeks 24, 48 and 96, respectively. The median changes from baseline were +2 mg/dL, +2 mg/dL and +4 mg/dL at weeks 24, 48 and 96. In patients on 1st-line HAART, the median baseline LDL cholesterol was 121 mg/dL. Median follow-up levels were 121 mg/dL, 125 mg/dL and 123 mg/dL at weeks 24, 48 and 96, respectively. The median changes from baseline were -1 mg/dL, +4 mg/dL and +2 mg/dL at weeks 24, 48 and 96. In patients on 2nd- or 3rd-line HAART, the median baseline LDL cholesterol was 127 mg/dL. Median follow-up levels were 128 mg/dL, 131 mg/dL and 124 mg/dL at weeks 24, 48 and 96, respectively. The median changes from baseline were +/-0 mg/dL, -1 mg/dL and +4 mg/dL at weeks 24, 48 and 96. In patients on 4th- or further-line HAART, the median baseline LDL cholesterol was 120 mg/dL. Median follow-up levels were 117 mg/dL, 121 mg/dL and 126 mg/dL at weeks 24, 48 and 96, respectively. The median changes from baseline were +6 mg/dL, +2 mg/dL and +5 mg/dL at weeks 24, 48 and 96.

TMC114 Clinical Study Report TMC114HIV4035
27
Version 1.03 Date: 16 January 2014
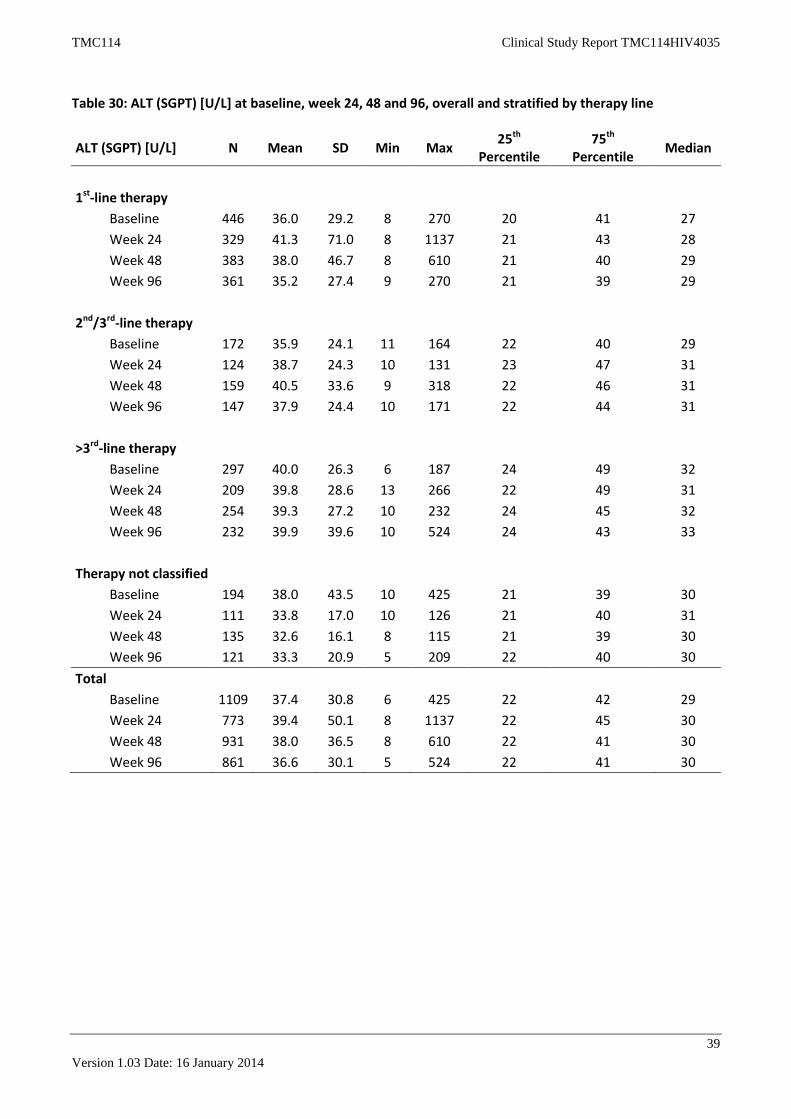
HDL cholesterol (see table 26-27) Overall, the median baseline HDL cholesterol was 46 mg/dL. Median follow-up levels were 45 mg/dL, 47 mg/dL and 47 mg/dL at weeks 24, 48 and 96, respectively. The median changes from baseline were +/-0 mg/dL, +1 mg/dL and +1 mg/dL at weeks 24, 48 and 96. In patients on 1st-line HAART, the median baseline HDL cholesterol was 45 mg/dL. Median follow-up levels were 46 mg/dL, 47 mg/dL and 48 mg/dL at weeks 24, 48 and 96, respectively. The median changes from baseline were +1 mg/dL, +2 mg/dL and +2 mg/dL at weeks 24, 48 and 96. In patients on 2nd- or 3rd-line HAART, the median baseline HDL cholesterol was 48 mg/dL. Median follow-up levels were 46 mg/dL, 49 mg/dL and 48 mg/dL at weeks 24, 48 and 96, respectively. The median changes from baseline were -1 mg/dL, +/-0 mg/dL and +/-0 mg/dL at weeks 24, 48 and 96. In patients on 4th- or further-line HAART, the median baseline HDL cholesterol was 45 mg/dL. Median follow-up levels were 44 mg/dL, 44 mg/dL and 46 mg/dL at weeks 24, 48 and 96, respectively. The median changes from baseline were +/-0 mg/dL, +/-0 mg/dL and -1 mg/dL at weeks 24, 48 and 96. AST (SGOT) (see table 28-29) Overall, the median baseline AST was 29 U/L. Median follow-up levels were 30 U/L, 29 U/L and 28 U/L at weeks 24, 48 and 96, respectively. The median changes from baseline were +1 U/L, +/-0 U/L and -2 U/L at weeks 24, 48 and 96. In patients on 1st-line HAART, the median baseline AST was 28 U/L. Median follow-up levels were 28 U/L, 28 U/L and 27 U/L at weeks 24, 48 and 96, respectively. The median changes from baseline were +1 U/L, +/-0 U/L and -2 U/L at weeks 24, 48 and 96. In patients on 2nd- or 3rd-line HAART, the median baseline AST was 29 U/L. Median follow-up levels were 31 U/L, 30 U/L and 28 U/L at weeks 24, 48 and 96, respectively. The median changes from baseline were +1 U/L, +1 U/L and -2 U/L at weeks 24, 48 and 96. In patients on 4th- or further-line HAART, the median baseline AST was 31 U/L. Median follow-up levels were 31 U/L, 30 U/L and 28 U/L at weeks 24, 48 and 96, respectively. The median changes from baseline were +/-0 U/L, +/-0 U/L and -2 U/L at weeks 24, 48 and 96. ALT (SGPT) (see table 30-31) Overall, the median baseline ALT was 29 U/L. Median follow-up levels were 30 U/L, 30 U/L and 30 U/L at weeks 24, 48 and 96, respectively. The median changes from baseline were +/-0 U/L, +/-0 U/L and +/-0 U/L at weeks 24, 48 and 96. In patients on 1st-line HAART, the median baseline ALT was 27 U/L. Median follow-up levels were 28 U/L, 29 U/L and 29 U/L at weeks 24, 48 and 96, respectively. The median changes from baseline were +1 U/L, +/-0 U/L and +/-0 U/L at weeks 24, 48 and 96. In patients on 2nd- or 3rd-line HAART, the median baseline ALT was 29 U/L. Median follow-up levels were 31 U/L, 31 U/L and 31 U/L at weeks 24, 48 and 96, respectively. The median changes from baseline were +1 U/L, +2 U/L and +/-0 U/L at weeks 24, 48 and 96. In patients on 4th- or further-line HAART, the median baseline ALT was 32 U/L. Median follow-up levels were 31 U/L, 32 U/L and 33 U/L at weeks 24, 48 and 96, respectively. The median changes from baseline were +/-0 U/L, -1 U/L and -2 U/L at weeks 24, 48 and 96.

TMC114 Clinical Study Report TMC114HIV4035
28
Version 1.03 Date: 16 January 2014
Glucose (see table 32-33) Overall, the median baseline glucose was 90 mg/dL. Median follow-up levels were 91 mg/dL, 90 mg/dL and 88 mg/dL at weeks 24, 48 and 96, respectively. The median changes from baseline were +1 mg/dL, +/-0 mg/dL and -2 mg/dL at weeks 24, 48 and 96. In patients on 1st-line HAART, the median baseline glucose was 90 mg/dL. Median follow-up levels were 90 mg/dL, 88 mg/dL and 88 mg/dL at weeks 24, 48 and 96, respectively. The median changes from baseline were +1 mg/dL, -1 mg/dL and -1 mg/dL at weeks 24, 48 and 96. In patients on 2nd- or 3rd-line HAART, the median baseline glucose was 90 mg/dL. Median follow-up levels were 90 mg/dL, 90 mg/dL and 90 mg/dL at weeks 24, 48 and 96, respectively. The median changes from baseline were -1 mg/dL, +/-0 mg/dL and -2 mg/dL at weeks 24, 48 and 96. In patients on 4th- or further-line HAART, the median baseline glucose was 90 mg/dL. Median follow-up levels were 91 mg/dL, 92 mg/dL and 89 mg/dL at weeks 24, 48 and 96, respectively. The median changes from baseline were +1 mg/dL, +2 mg/dL and +/-0 mg/dL at weeks 24, 48 and 96. Creatinine (see table 34-35) Overall, the median baseline creatinine was 0.9 mg/dL. Median follow-up levels were 0.9 mg/dL, 0.9 mg/dL and 0.9 mg/dL at weeks 24, 48 and 96, respectively. The median changes from baseline were +/-0 mg/dL, +/-0 mg/dL and +0.01 mg/dL at weeks 24, 48 and 96. In patients on 1st-line HAART, the median baseline creatinine was 0.9 mg/dL. Median follow-up levels were 0.9 mg/dL, 0.9 mg/dL and 0.9 mg/dL at weeks 24, 48 and 96, respectively. The median changes from baseline were +/-0 mg/dL, +/-0 mg/dL and +0.02 mg/dL at weeks 24, 48 and 96. In patients on 2nd- or 3rd-line HAART, the median baseline creatinine was 0.9 mg/dL. Median follow-up levels were 0.9 mg/dL, 0.9 mg/dL and 0.9 mg/dL at weeks 24, 48 and 96, respectively. The median changes from baseline were +/-0 mg/dL, -0.01 mg/dL and +/-0 mg/dL at weeks 24, 48 and 96. In patients on 4th- or further-line HAART, the median baseline creatinine was 0.9 mg/dL. Median follow-up levels were 1.0 mg/dL, 1.0 mg/dL and 1.0 mg/dL at weeks 24, 48 and 96, respectively. The median changes from baseline were +/-0 mg/dL, +/-0 mg/dL and +/-0 mg/dL at weeks 24, 48 and 96.

TMC114 Clinical Study Report TMC114HIV4035
29
Version 1.03 Date: 16 January 2014
LIPIDS
Table 20: Triglyceride [mg/dL] at baseline, week 24, 48 and 96, overall and stratified by therapy line
Triglyceride [mg/dL] N Mean SD Min Max 25th
Percentile 75th
Percentile Median
1st-line therapy
Baseline 413 187.3 140.0 39 1404 103 225 149
Week 24 293 190.1 132.4 36 908 103 235 153
Week 48 352 183.3 122.8 31 696 101 223 145
Week 96 329 178.5 118.6 36 855 101 222 143
2nd/3rd-line therapy
Baseline 166 196.5 134.9 32 871 106 273 142
Week 24 118 199.7 150.8 33 1163 110 260 153
Week 48 152 181.1 117.2 44 969 108 224 145
Week 96 136 201.1 145.7 40 802 109 252 152
>3rd-line therapy
Baseline 292 242.1 269.2 37 3609 117 285 181
Week 24 204 232.7 218.5 51 2417 117 292 185
Week 48 241 226.6 173.2 48 1182 115 279 169
Week 96 215 242.2 243.9 45 2486 117 279 173
Therapy not classified
Baseline 177 192.5 114.6 47 839 107 246 168
Week 24 105 183.3 119.1 42 712 101 229 159
Week 48 127 182.4 123.9 48 1000 99 230 151
Week 96 111 211.3 167.2 49 1229 114 262 169
Total
Baseline 1048 204.9 183.0 32 3609 107 248 159
Week 24 720 202.7 163.5 33 2417 108 249 164
Week 48 872 194.8 139.0 31 1182 105 237 154
Week 96 791 204.3 173.6 36 2486 109 247 157

TMC114 Clinical Study Report TMC114HIV4035
30
Version 1.03 Date: 16 January 2014
Table 21: Change in Triglyceride [mg/dL] at baseline, week 24, 48 and 96, overall and stratified by therapy line
Change in Triglyceride [mg/dL]
N Mean SD Min Max 25th
Percentile 75th
Percentile Median
1st-line therapy
Baseline 413 0.0 0.0 0 0 0 0 0
Week 24 286 3.3 122.3 -1178 480 -36 39 3
Week 48 340 -2.9 123.5 -1151 550 -42 42 2
Week 96 314 -8.4 131.3 -1252 527 -51 38 -2
2nd/3rd-line therapy
Baseline 166 0.0 0.0 0 0 0 0 0
Week 24 113 4.1 113.4 -304 625 -39 45 3
Week 48 145 -13.6 112.6 -528 604 -58 38 -8
Week 96 129 4.1 125.5 -433 546 -38 43 1
>3rd-line therapy
Baseline 292 0.0 0.0 0 0 0 0 0
Week 24 199 -28.1 241.3 -2353 1338 -64 38 -5
Week 48 234 -22.0 257.8 -3149 687 -50 34 -9
Week 96 209 -1.0 189.0 -1123 954 -44 53 -3
Therapy not classified
Baseline 177 0.0 0.0 0 0 0 0 0
Week 24 103 -0.9 113.1 -495 457 -50 32 0
Week 48 121 -14.9 109.6 -419 690 -56 20 -20
Week 96 105 16.5 151.6 -274 1033 -50 56 -13
Total
Baseline 1048 0.0 0.0 0 0 0 0 0
Week 24 701 -6.1 163.3 -2353 1338 -45 39 1
Week 48 840 -11.8 169.1 -3149 690 -49 39 -5
Week 96 757 -0.8 151.2 -1252 1033 -47 44 -3
TMC114 Clinical Study Report TMC114HIV4035
31
Version 1.03 Date: 16 January 2014
Table 22: Total cholesterol [mg/dL] at baseline, week 24, 48 and 96, overall and stratified by therapy line
Total cholesterol [mg/dL]
N Mean SD Min Max 25th
Percentile 75th
Percentile Median
1st-line therapy
Baseline 410 204.6 45.0 92 385 174 233 202
Week 24 294 210.0 45.4 113 367 180 239 203
Week 48 350 208.2 40.8 93 352 181 231 205
Week 96 330 208.0 43.0 103 407 180 234 205
2nd/3rd-line therapy
Baseline 166 214.0 47.5 110 491 186 239 211
Week 24 118 209.5 46.4 104 462 179 234 211
Week 48 152 212.4 43.0 100 321 183 242 212
Week 96 138 213.0 45.0 111 388 188 243 209
>3rd-line therapy
Baseline 290 209.1 51.9 108 572 174 240 209
Week 24 203 209.4 51.0 120 441 174 235 201
Week 48 242 207.4 43.0 119 353 175 233 207
Week 96 216 214.0 47.3 113 446 183 243 213
Therapy not classified
Baseline 179 204.8 44.1 106 385 174 232 201
Week 24 105 203.8 47.2 108 419 174 231 201
Week 48 127 207.4 40.1 126 330 175 237 203
Week 96 111 212.6 50.2 123 494 182 239 205
Total
Baseline 1045 207.4 47.3 92 572 176 236 205
Week 24 720 208.8 47.4 104 462 178 236 203
Week 48 871 208.6 41.7 93 353 180 236 206
Week 96 795 211.1 45.6 103 494 182 238 208

TMC114 Clinical Study Report TMC114HIV4035
32
Version 1.03 Date: 16 January 2014
Table 23: Change in total cholesterol [mg/dL] at baseline, week 24, 48 and 96, overall and stratified by therapy line
Change in Total cholesterol [mg/dL]
N Mean SD Min Max 25th
Percentile 75th
Percentile Median
1st-line therapy
Baseline 410 0.0 0.0 0 0 0 0 0
Week 24 284 2.5 30.4 -155 125 -16 21 1
Week 48 337 3.1 30.4 -159 109 -12 21 4
Week 96 313 3.4 33.5 -143 191 -13 23 3
2nd/3rd-line therapy
Baseline 166 0.0 0.0 0 0 0 0 0
Week 24 112 0.6 26.8 -54 78 -20 21 -3
Week 48 145 -1.4 31.6 -170 87 -19 16 -2
Week 96 131 -0.7 38.2 -222 119 -21 20 1
>3rd-line therapy
Baseline 290 0.0 0.0 0 0 0 0 0
Week 24 198 1.5 41.4 -195 231 -17 17 3
Week 48 234 -2.8 39.4 -284 111 -18 17 0
Week 96 209 3.9 36.4 -124 109 -17 25 4
Therapy not classified
Baseline 179 0.0 0.0 0 0 0 0 0
Week 24 103 0.3 31.1 -82 175 -15 11 -3
Week 48 122 0.4 30.2 -101 85 -14 19 0
Week 96 106 6.2 41.3 -94 275 -12 24 2
Total
Baseline 1045 0.0 0.0 0 0 0 0 0
Week 24 697 1.6 33.4 -195 231 -17 19 0
Week 48 838 0.3 33.4 -284 111 -16 19 2
Week 96 759 3.2 36.3 -222 275 -16 23 3

TMC114 Clinical Study Report TMC114HIV4035
33
Version 1.03 Date: 16 January 2014
Table 24: LDL cholesterol [mg/dL] at baseline, week 24, 48 and 96, overall and stratified by therapy line
LDL cholesterol [mg/dL]
N Mean SD Min Max 25th
Percentile 75th
Percentile Median
1st-line therapy
Baseline 358 122.6 38.6 21 300 96 146 121
Week 24 257 125.3 39.7 31 259 100 148 121
Week 48 302 125.8 35.1 28 253 100 146 125
Week 96 282 126.9 38.6 35 315 101 150 123
2nd/3rd-line therapy
Baseline 144 127.8 37.3 32 254 105 147 127
Week 24 99 125.7 35.9 43 221 99 155 128
Week 48 125 130.8 36.5 43 223 110 155 131
Week 96 114 131.0 43.1 34 303 103 156 124
>3rd-line therapy
Baseline 249 118.7 36.1 36 263 94 141 120
Week 24 166 123.6 41.9 27 250 95 154 117
Week 48 189 123.4 37.3 50 211 97 147 121
Week 96 179 130.0 40.8 36 241 103 154 126
Therapy not classified
Baseline 133 119.5 33.2 50 204 91 146 119
Week 24 68 121.8 38.7 51 223 96 147 117
Week 48 92 122.8 33.1 57 237 97 147 124
Week 96 76 125.8 35.1 51 217 100 147 123
Total
Baseline 884 121.9 37.0 21 300 97 145 121
Week 24 590 124.5 39.5 27 259 97 150 121
Week 48 708 125.7 35.7 28 253 100 148 125
Week 96 651 128.4 39.6 34 315 102 152 124

TMC114 Clinical Study Report TMC114HIV4035
34
Version 1.03 Date: 16 January 2014
Table 25: Change in LDL cholesterol [mg/dL] at baseline, week 24, 48 and 96, overall and stratified by therapy line
Change in LDL cholesterol [mg/dL]
N Mean SD Min Max 25th
Percentile 75th
Percentile Median
1st-line therapy
Baseline 358 0.0 0.0 0 0 0 0 0
Week 24 244 0.9 24.6 -118 96 -13 15 -1
Week 48 284 2.0 27.6 -129 81 -14 17 4
Week 96 262 3.5 28.5 -91 188 -13 21 2
2nd/3rd-line therapy
Baseline 144 0.0 0.0 0 0 0 0 0
Week 24 91 2.3 26.2 -91 113 -12 17 0
Week 48 117 1.1 27.8 -72 137 -14 15 -1
Week 96 105 2.8 31.5 -127 90 -12 21 4
>3rd-line therapy
Baseline 249 0.0 0.0 0 0 0 0 0
Week 24 159 6.5 28.1 -89 111 -10 18 6
Week 48 179 2.6 26.2 -100 88 -11 18 2
Week 96 170 7.4 31.6 -134 96 -9 23 5
Therapy not classified
Baseline 133 0.0 0.0 0 0 0 0 0
Week 24 63 2.1 25.9 -65 103 -13 19 0
Week 48 83 1.9 27.4 -90 67 -9 15 2
Week 96 67 6.5 26.4 -48 95 -10 23 4
Total
Baseline 884 0.0 0.0 0 0 0 0 0
Week 24 557 2.9 26.1 -118 113 -12 16 2
Week 48 663 2.0 27.2 -129 137 -13 16 2
Week 96 604 4.8 29.7 -134 188 -11 21 4

TMC114 Clinical Study Report TMC114HIV4035
35
Version 1.03 Date: 16 January 2014
Table 26: HDL cholesterol [mg/dL] at baseline, week 24, 48 and 96, overall and stratified by therapy line
HDL cholesterol [mg/dL]
N Mean SD Min Max 25th
Percentile 75th
Percentile Median
1st-line therapy
Baseline 361 48.3 15.3 10 119 38 56 45
Week 24 258 50.0 15.7 20 125 39 57 46
Week 48 302 50.2 16.0 12 121 40 58 47
Week 96 286 49.9 15.1 15 117 39 58 48
2nd/3rd-line therapy
Baseline 146 51.2 18.7 22 146 38 61 48
Week 24 101 49.1 16.8 20 102 38 56 46
Week 48 128 51.7 18.9 22 143 39 59 49
Week 96 115 50.7 18.7 12 150 40 57 48
>3rd-line therapy
Baseline 254 46.8 14.5 21 132 36 54 45
Week 24 166 46.7 15.6 17 140 36 54 44
Week 48 194 46.2 14.8 19 138 36 54 44
Week 96 183 46.7 13.6 21 117 36 56 46
Therapy not classified
Baseline 136 49.1 15.0 22 101 40 59 46
Week 24 68 49.3 16.5 18 109 40 56 47
Week 48 92 51.3 15.0 27 91 40 62 49
Week 96 77 49.6 16.0 13 86 37 60 48
Total
Baseline 897 48.5 15.7 10 146 38 57 46
Week 24 593 48.8 16.0 17 140 38 56 45
Week 48 716 49.5 16.2 12 143 38 58 47
Week 96 661 49.1 15.6 12 150 38 58 47

TMC114 Clinical Study Report TMC114HIV4035
36
Version 1.03 Date: 16 January 2014
Table 27: Change in HDL cholesterol [mg/dL] at baseline, week 24, 48 and 96, overall and stratified by therapy line
Change in HDL cholesterol [mg/dL]
N Mean SD Min Max 25th
Percentile 75th
Percentile Median
1st-line therapy
Baseline 361 0.0 0.0 0 0 0 0 0
Week 24 246 1.3 9.1 -38 58 -3 5 1
Week 48 285 2.3 10.1 -56 49 -3 7 2
Week 96 266 2.6 11.9 -74 58 -3 8 2
2nd/3rd-line therapy
Baseline 146 0.0 0.0 0 0 0 0 0
Week 24 93 -0.9 9.6 -53 30 -5 3 -1
Week 48 120 1.2 11.1 -59 51 -3 6 0
Week 96 106 0.0 12.1 -51 32 -6 6 0
>3rd-line therapy
Baseline 254 0.0 0.0 0 0 0 0 0
Week 24 161 0.0 7.6 -19 33 -4 3 0
Week 48 185 -0.6 8.0 -26 21 -5 4 0
Week 96 175 -0.1 10.1 -26 51 -5 3 -1
Therapy not classified
Baseline 136 0.0 0.0 0 0 0 0 0
Week 24 65 -0.7 13.7 -51 61 -6 6 1
Week 48 84 1.7 10.2 -36 43 -5 8 1
Week 96 70 1.0 11.5 -54 26 -5 8 2
Total
Baseline 897 0.0 0.0 0 0 0 0 0
Week 24 565 0.4 9.5 -53 61 -4 5 0
Week 48 674 1.2 9.8 -59 51 -4 6 1
Week 96 617 1.2 11.4 -74 58 -4 6 1

TMC114 Clinical Study Report TMC114HIV4035
37
Version 1.03 Date: 16 January 2014
LIVER
Table 28: AST (SGOT) [U/L] at baseline, week 24, 48 and 96, overall and stratified by therapy line
AST (SGOT) [U/L] N Mean SD Min Max 25th
Percentile 75th
Percentile Median
1st-line therapy
Baseline 443 32.5 18.0 12 172 24 35 28
Week 24 325 34.9 42.2 13 688 24 35 28
Week 48 378 32.3 19.5 11 179 24 33 28
Week 96 353 29.8 15.9 2 182 23 31 27
2nd/3rd-line therapy
Baseline 172 32.5 13.2 13 110 25 36 29
Week 24 122 33.2 11.8 14 82 26 38 31
Week 48 156 34.5 16.6 15 143 26 38 30
Week 96 145 33.2 17.2 10 113 24 36 28
>3rd-line therapy
Baseline 302 34.6 16.5 11 176 25 38 31
Week 24 210 35.0 19.4 11 238 26 39 31
Week 48 254 34.1 15.5 9 130 25 38 30
Week 96 230 32.8 25.1 13 325 23 35 28
Therapy not classified
Baseline 194 33.1 17.6 15 155 24 35 29
Week 24 111 32.3 13.2 14 93 25 35 31
Week 48 134 31.3 10.8 14 76 24 34 29
Week 96 120 30.7 18.0 8 201 24 34 28
Total
Baseline 1111 33.2 16.9 11 176 24 36 29
Week 24 768 34.3 30.1 11 688 25 36 30
Week 48 922 33.0 16.9 9 179 24 35 29
Week 96 848 31.3 19.3 2 325 23 34 28

TMC114 Clinical Study Report TMC114HIV4035
38
Version 1.03 Date: 16 January 2014
Table 29: Change in AST (SGOT) [U/L] at baseline, week 24, 48 and 96, overall and stratified by therapy line
Change in AST (SGOT) [U/L]
N Mean SD Min Max 25th
Percentile 75th
Percentile Median
1st-line therapy
Baseline 443 0.0 0.0 0 0 0 0 0
Week 24 323 2.7 33.5 -94 525 -4 4 1
Week 48 373 0.9 17.2 -94 146 -4 3 0
Week 96 351 -1.8 16.4 -98 127 -6 2 -2
2nd/3rd-line therapy
Baseline 172 0.0 0.0 0 0 0 0 0
Week 24 119 1.1 8.5 -47 32 -3 4 1
Week 48 151 1.2 12.0 -57 79 -4 4 1
Week 96 141 0.2 14.0 -39 73 -6 4 -2
>3rd-line therapy
Baseline 302 0.0 0.0 0 0 0 0 0
Week 24 210 0.4 20.9 -139 206 -4 5 0
Week 48 252 -0.8 15.4 -142 75 -4 4 0
Week 96 229 -1.7 25.3 -150 270 -8 2 -2
Therapy not classified
Baseline 194 0.0 0.0 0 0 0 0 0
Week 24 110 -1.4 18.6 -123 40 -4 4 0
Week 48 132 -1.7 17.7 -132 30 -3 3 0
Week 96 118 -2.8 22.8 -133 140 -6 4 -1
Total
Baseline 1111 0.0 0.0 0 0 0 0 0
Week 24 762 1.2 25.6 -139 525 -4 4 1
Week 48 908 0.1 16.0 -142 146 -4 4 0
Week 96 839 -1.6 19.8 -150 270 -7 3 -2
TMC114 Clinical Study Report TMC114HIV4035
39
Version 1.03 Date: 16 January 2014
Table 30: ALT (SGPT) [U/L] at baseline, week 24, 48 and 96, overall and stratified by therapy line
ALT (SGPT) [U/L] N Mean SD Min Max 25th
Percentile 75th
Percentile Median
1st-line therapy
Baseline 446 36.0 29.2 8 270 20 41 27
Week 24 329 41.3 71.0 8 1137 21 43 28
Week 48 383 38.0 46.7 8 610 21 40 29
Week 96 361 35.2 27.4 9 270 21 39 29
2nd/3rd-line therapy
Baseline 172 35.9 24.1 11 164 22 40 29
Week 24 124 38.7 24.3 10 131 23 47 31
Week 48 159 40.5 33.6 9 318 22 46 31
Week 96 147 37.9 24.4 10 171 22 44 31
>3rd-line therapy
Baseline 297 40.0 26.3 6 187 24 49 32
Week 24 209 39.8 28.6 13 266 22 49 31
Week 48 254 39.3 27.2 10 232 24 45 32
Week 96 232 39.9 39.6 10 524 24 43 33
Therapy not classified
Baseline 194 38.0 43.5 10 425 21 39 30
Week 24 111 33.8 17.0 10 126 21 40 31
Week 48 135 32.6 16.1 8 115 21 39 30
Week 96 121 33.3 20.9 5 209 22 40 30
Total
Baseline 1109 37.4 30.8 6 425 22 42 29
Week 24 773 39.4 50.1 8 1137 22 45 30
Week 48 931 38.0 36.5 8 610 22 41 30
Week 96 861 36.6 30.1 5 524 22 41 30

TMC114 Clinical Study Report TMC114HIV4035
40
Version 1.03 Date: 16 January 2014
Table 31: Change in ALT (SGPT) [U/L] at baseline, week 24, 48 and 96, overall and stratified by therapy line
Change in ALT (SGPT) [U/L]
N Mean SD Min Max 25th
Percentile 75th
Percentile Median
1st-line therapy
Baseline 446 0.0 0.0 0 0 0 0 0
Week 24 326 4.5 57.1 -173 867 -5 7 1
Week 48 377 3.5 46.2 -199 591 -5 6 0
Week 96 358 0.1 27.0 -200 195 -6 7 0
2nd/3rd-line therapy
Baseline 172 0.0 0.0 0 0 0 0 0
Week 24 120 4.2 16.8 -52 82 -3 9 1
Week 48 151 3.7 27.2 -125 248 -3 8 2
Week 96 140 1.1 24.8 -122 128 -6 8 0
>3rd-line therapy
Baseline 297 0.0 0.0 0 0 0 0 0
Week 24 205 -1.5 23.0 -139 138 -7 5 0
Week 48 247 -2.2 21.6 -152 116 -7 6 -1
Week 96 226 -1.0 35.5 -152 396 -10 6 -2
Therapy not classified
Baseline 194 0.0 0.0 0 0 0 0 0
Week 24 110 -5.9 48.2 -351 61 -6 6 1
Week 48 132 -6.3 46.8 -390 53 -6 5 0
Week 96 118 -6.4 52.2 -380 167 -7 7 -1
Total
Baseline 1109 0.0 0.0 0 0 0 0 0
Week 24 761 1.3 43.9 -351 867 -5 6 0
Week 48 907 0.5 38.3 -390 591 -5 6 0
Week 96 842 -0.9 33.7 -380 396 -7 7 0

TMC114 Clinical Study Report TMC114HIV4035
41
Version 1.03 Date: 16 January 2014
GLUCOSE
Table 32: Glucose [mg/dL] at baseline, week 24, 48 and 96, overall and stratified by therapy line
Glucose [mg/dL] N Mean SD Min Max 25th
Percentile 75th
Percentile Median
1st-line therapy
Baseline 430 91.6 20.0 50 292 82 96 90
Week 24 309 90.9 15.3 46 168 83 97 90
Week 48 365 91.4 21.6 56 301 81 97 88
Week 96 342 89.1 16.1 49 189 80 96 88
2nd/3rd-line therapy
Baseline 172 94.0 20.1 55 178 83 100 90
Week 24 119 92.5 22.5 53 238 83 99 90
Week 48 156 95.9 21.8 47 184 83 103 90
Week 96 141 93.9 24.7 52 271 81 101 90
>3rd-line therapy
Baseline 295 96.2 31.0 45 336 81 100 90
Week 24 205 98.9 33.6 59 295 82 105 91
Week 48 249 97.6 25.9 44 219 83 104 92
Week 96 216 95.2 29.9 42 309 80 102 89
Therapy not classified
Baseline 179 94.1 20.2 52 170 83 101 91
Week 24 110 97.0 29.0 53 246 83 101 90
Week 48 131 92.7 20.3 59 189 80 99 90
Week 96 116 92.2 38.7 43 426 79 97 86
Total
Baseline 1076 93.7 23.6 45 336 82 99 90
Week 24 743 94.3 25.0 46 295 83 100 91
Week 48 901 94.1 22.8 44 301 82 100 90
Week 96 815 92.0 25.8 42 426 80 98 88

TMC114 Clinical Study Report TMC114HIV4035
42
Version 1.03 Date: 16 January 2014
Table 33: Change in glucose [mg/dL] at baseline, week 24, 48 and 96, overall and stratified by therapy line
Change in Glucose [mg/dL]
N Mean SD Min Max 25th
Percentile 75th
Percentile Median
1st-line therapy
Baseline 430 0.0 0.0 0 0 0 0 0
Week 24 302 -0.2 18.5 -176 57 -8 8 1
Week 48 353 -0.5 18.9 -88 173 -9 7 -1
Week 96 332 -1.9 17.5 -127 48 -11 8 -1
2nd/3rd-line therapy
Baseline 172 0.0 0.0 0 0 0 0 0
Week 24 116 -0.3 22.9 -100 81 -9 9 -1
Week 48 150 1.4 20.6 -88 72 -9 12 0
Week 96 136 -0.7 26.0 -85 179 -11 7 -2
>3rd-line therapy
Baseline 295 0.0 0.0 0 0 0 0 0
Week 24 202 0.9 19.9 -101 80 -6 10 1
Week 48 242 1.4 25.2 -244 95 -8 13 2
Week 96 212 -0.9 20.2 -115 126 -9 8 0
Therapy not classified
Baseline 179 0.0 0.0 0 0 0 0 0
Week 24 105 2.5 23.2 -70 116 -8 13 1
Week 48 123 -2.0 19.0 -63 67 -11 9 0
Week 96 109 -1.5 36.8 -68 317 -14 7 -4
Total
Baseline 1076 0.0 0.0 0 0 0 0 0
Week 24 725 0.5 20.4 -176 116 -8 10 1
Week 48 868 0.2 21.2 -244 173 -9 9 0
Week 96 789 -1.3 23.2 -127 317 -11 7 -2

TMC114 Clinical Study Report TMC114HIV4035
43
Version 1.03 Date: 16 January 2014
CREATININE
Table 34: Creatinine [mg/dL] at baseline, week 24, 48 and 96, overall and stratified by therapy line
Creatinine [mg/dL] N Mean SD Min Max 25th
Percentile 75th
Percentile Median
1st-line therapy
Baseline 441 0.9 0.2 0.5 2.1 0.8 1.0 0.9
Week 24 329 0.9 0.2 0.5 2.0 0.8 1.0 0.9
Week 48 382 0.9 0.2 0.4 2.2 0.8 1.0 0.9
Week 96 360 1.0 0.2 0.5 2.3 0.8 1.1 0.9
2nd/3rd-line therapy
Baseline 175 0.9 0.2 0.5 1.6 0.8 1.0 0.9
Week 24 124 0.9 0.2 0.5 1.5 0.8 1.0 0.9
Week 48 157 0.9 0.2 0.5 1.7 0.8 1.0 0.9
Week 96 145 0.9 0.2 0.4 1.6 0.8 1.0 0.9
>3rd-line therapy
Baseline 301 1.0 0.2 0.5 2.2 0.8 1.1 0.9
Week 24 211 1.0 0.2 0.5 1.9 0.8 1.1 1.0
Week 48 252 1.0 0.3 0.5 2.8 0.8 1.1 1.0
Week 96 229 1.0 0.3 0.5 2.9 0.8 1.1 1.0
Therapy not classified
Baseline 189 1.0 0.4 0.5 4.1 0.8 1.0 0.9
Week 24 112 1.0 0.8 0.6 7.7 0.8 1.1 0.9
Week 48 135 1.0 0.7 0.6 8.3 0.8 1.1 1.0
Week 96 121 1.0 0.3 0.6 3.5 0.8 1.1 0.9
Total
Baseline 1106 0.9 0.2 0.5 4.1 0.8 1.0 0.9
Week 24 776 0.9 0.3 0.5 7.7 0.8 1.1 0.9
Week 48 926 1.0 0.3 0.4 8.3 0.8 1.1 0.9
Week 96 855 1.0 0.2 0.4 3.5 0.8 1.1 0.9

TMC114 Clinical Study Report TMC114HIV4035
44
Version 1.03 Date: 16 January 2014
Table 35: Change in creatinine [mg/dL] at baseline, week 24, 48 and 96, overall and stratified by therapy line
Change in Creatinine [mg/dL]
N Mean SD Min Max 25th
Percentile 75th
Percentile Median
1st-line therapy
Baseline 441 0.00 0.00 0.00 0.00 0.00 0.00 0.00
Week 24 325 -0.01 0.10 -0.40 0.30 -0.08 0.04 0.00
Week 48 373 0.01 0.13 -0.43 1.19 -0.06 0.09 0.00
Week 96 353 0.03 0.15 -0.50 1.29 -0.06 0.10 0.02
2nd/3rd-line therapy
Baseline 175 0.00 0.00 0.00 0.00 0.00 0.00 0.00
Week 24 121 -0.02 0.12 -0.27 0.50 -0.10 0.06 -0.01
Week 48 153 0.01 0.11 -0.36 0.33 -0.06 0.10 0.00
Week 96 141 0.02 0.14 -0.33 0.67 -0.08 0.10 0.00
>3rd-line therapy
Baseline 301 0.00 0.00 0.00 0.00 0.00 0.00 0.00
Week 24 210 0.01 0.11 -0.44 0.44 -0.04 0.07 0.00
Week 48 249 0.02 0.13 -0.30 0.61 -0.07 0.10 0.00
Week 96 227 0.04 0.14 -0.30 0.71 -0.07 0.10 0.00
Therapy not classified
Baseline 189 0.00 0.00 0.00 0.00 0.00 0.00 0.00
Week 24 107 0.03 0.54 -0.74 5.30 -0.10 0.06 0.00
Week 48 130 0.05 0.53 -0.40 5.90 -0.08 0.10 0.01
Week 96 117 0.01 0.19 -1.24 0.48 -0.05 0.10 0.03
Total
Baseline 1106 0.00 0.00 0.00 0.00 0.00 0.00 0.00
Week 24 763 0.00 0.22 -0.74 5.30 -0.08 0.06 0.00
Week 48 905 0.02 0.23 -0.43 5.90 -0.06 0.10 0.00
Week 96 838 0.03 0.15 -1.24 1.29 -0.07 0.10 0.01

TMC114 Clinical Study Report TMC114HIV4035
45
Version 1.03 Date: 16 January 2014
Study Limitations:
The observational, non-interventional design of the study was mandatory to meet the primary study objective, i.e. evaluation of direct and indirect costs associated with routine clinical care of HIV patients in Germany. In contrast to randomized clinical trials, assignment of a patient to a particular antiretroviral regimen was at the discretion of the treating physician. Therefore evaluation of efficacy and safety could only be descriptive for the different treatment strata.
CONCLUSION(S):
CORSAR started recruitment during 2009 and ended after the last patient had reached week 96 in July 2012. This large observational cohort included 1149 patients from 8 outpatient and 4 inpatient centers in Germany.
40% of patients were on 1st-line HAART at the time of enrolment, 16% of patients were on 2nd- or 3rd-line HAART and 26% of patients on 4th- or further-line HAART. Most patients received a NRTI+PI (41%) based regimen or a NRTI+NNRTI (41%) based regimen. Patients on 1st-line HAART were younger (44 years) than patients on 2nd- or 3rd-line HAART (48 years) or patients on 4th- or further-line HAART (48 years). The majority of the patients were men (88.7%).
Overall, 23% of patients changed HAART regimen at least once during follow–up. Most common reasons for HAART changes were side effects, patient’s wish and virological failure. Treatment interruptions were only in patients on 1st-line HAART.
More than 90% of patients had a HIV-a RNA <50 copies/mL at the various time points during follow-up reflecting a good virological control in patients treated in HIV-specialized centers in Germany.
Most patients were “responders” (76.3%), only 1.4% were “non-responders (>50)", and 1.6% "non-responders (>200)", but in 15% of patients HIV-1 RNA was at one time >200 copies/mL and/or between 50-200 copies/mL without any HAART change. In addition to a good virological response, immunological control was very successful. CD4 cell counts were >500/µL in 54% of patients at enrollment and in 64% of patients at week 96. Overall, the laboratory safety parameters were stable and did not shown any deterioration. 51% of patients experienced at least one AE, and 20% of patients at least one SAE.
The safety of DRV or ETR in patients of the Corsar study was within expected ranges. No new unexpected adverse events were observed which could affect the safety profile of DRV or ETR.