study on women's experiences at harvard law school
DESCRIPTION
Nome do arquivo:Study on women's experiences at Harvard Law School.pdfTRANSCRIPT

Study on Women’s Experiences at HarvardLaw School
Working Group on Student Experiences
February 2004
Cambridge, MA
Study on Women’s Experiences at Harvard Law School 2
PLEASE DO NOT CITE WITHOUT PERMISSION.
Working Group on Student Experiences
Meeta Anand Jennifer Nash
Nicole Birch Adam Neufeld
Alicia Blumenfeld Christina Olsson
Amy Cyphert Jennifer Pendleton
Lilian Faulhaber Brian Rubineau
Ashley Filip Charlotte Sanders
Andi Friedman Naomi Schoenbaum
Suzanne Katzenstein Puja Seam
Sharon Kelly Zoe Segal-Reichlin
Audrey Lee Katie Wiik
Linda Lee Lori Zahalka
Jessica Myers
Contact Information: Adam Neufeld, Director(617) [email protected]

Study on Women’s Experiences at Harvard Law School 3
TABLE OF CONTENTS
I. EXECUTIVE SUMMARY 4
II. INTRODUCTION 8
III. METHODOLOGY 10
A. CLASSROOM PARTICIPATION 10
B. STUDENT SURVEYS 12
C. EXTRACURRICULAR ACTIVITIES 15
D. MENTAL HEALTH CARE 15
E. GRADUATION HONORS 16
F. COURSE GRADES 16
G. CAREER AND EMPLOYMENT 17
H. FOCUS GROUPS 17
IV. RESULTS 18
A. CLASSROOM PARTICIPATION 18
B. EXTRACURRICULAR ACTIVITIES 19
C. STUDENT LIFE 21
D. ACADEMIC PERFORMANCE AND CHOICES 25
E. EMPLOYMENT AND CAREER CHOICES 30
V. CONCLUSION 34
VI. APPENDIX 35

Study on Women’s Experiences at Harvard Law School 4
I. EXECUTIVE SUMMARY
Over the past fifteen years, law schools and organizations around the country haveconducted studies that found significant differences in the way women and men experience lawschool. Given that 2003 marked the fiftieth anniversary of women graduating from Harvard LawSchool (HLS), a similar study at HLS is especially timely. Over the past year and a half, a groupof students investigated the experiences of female and male students at Harvard in order tocontribute to the law school community’s ongoing efforts to explore and address gender issues.
The study group collected and analyzed data from a variety of sources. We conductedthree online student surveys, monitored student participation in 190 class meetings, analyzedthree recent years of first-year course grades, collected information on extracurricularinvolvement, held a series of student focus groups, and compiled data on mental health visits,post-graduate employment, and clerkships.
Results
The experiences of female and male students at Harvard Law School differ markedly innumerous ways, in accord with the conclusions reached in studies conducted at other elite lawschools.
Classroom Participation
We monitored student participation in 32 courses, totaling 190 class meetings, during theSpring 2003 semester. For each class meeting, we had two students – one woman and one man –monitor simultaneously, and we then averaged the results.
Women consistently volunteered to speak less often and made up a significantly smallerpercentage of frequent talkers, those students who speak three or more times in one class.Although the monitored classes were on average 45% female, women made 39% of the 7,831total comments in our sample. This disparity primarily reflects a gender difference in student-volunteered comments. A male student was 50% more likely to speak voluntarily at least onceduring a class meeting than was a female student. Men were also much more likely to speakmultiple times in a given class meeting. Compared with female students, men were 64% morelikely to speak three or more times in a class, and 144% more likely to volunteer three or morecomments.
We also found a highly skewed distribution of student participation in first-year (1L)courses, with a small number of students – mostly male – accounting for much of theparticipation. Eighteen percent of 1L students accounted for 50% of all comments made in theapproximately 12 class meetings monitored for each 1L section. The distribution of student-volunteered comments is even more uneven, although the extent of skewing varied a good dealbetween 1L courses. Overall, 10% of students accounted for almost 45% of all volunteeredcomments spoken in the 1L classes we monitored, and women constituted only 20% of this top

Study on Women’s Experiences at Harvard Law School 5
group of volunteers. Although a small number of students made up a large share of totalparticipation, 85% of 1L students spoke at least once during the approximately 12 classesmonitored per section, and 48% spoke voluntarily at least once.
Extracurricular Activities
We also found gender differences in involvement in certain extracurricular activities.Women held higher-up positions in academic journals at greater rates than men over the past sixyears. Women comprised 49% of executive boards and 56% of the top leadership positions ofHLS-recognized academic journals. Excluding the Women’s Law Journal decreased the overallpercentage of women on the masthead to 44%, but only reduced the percentage of women in thetop leadership positions to 52%. Most journals have had at least 50% female mastheads at somepoint in the past six years, with a notable exception of Law Review, with a membership that was36% female on average.
Women also participated in the Legal Aid Bureau and Board of Student Advisors (BSA),two activities requiring a substantial time commitment and having a competitive applicationprocess, at higher rates than men. Over the past six years, women made up 57% of Legal AidBureau members and 59% of BSA members, compared with approximately 45% of the studentbody.
Student Life and Satisfaction
In terms of overall satisfaction, we found no gender difference in respondents’ answers tohow likely they would be to choose to attend HLS again. However, 2L and 3L men were morelikely than women to respond that they would choose not to attend law school at all.
Women and men differed substantially in how they described their own abilities. Giventhe opportunity to rank their abilities in various areas, women gave themselves significantlylower scores in skills like legal analysis, quantitative reasoning, and ability to think quickly onone’s feet, even after controlling for demographics and undergraduate major. Male respondentswere much more likely than females to assess themselves as being in the top quintile of theirclass in legal analysis (33% v. 15%) and quantitative reasoning (40% v. 11%). Further researchis needed to determine whether this difference represents overconfidence on the part of men, andto what degree the gender difference in confidence may cause self-selection in terms of courses,classroom participation, extracurricular involvement, faculty interaction and career efforts.
Additionally, according to data from Harvard Mental Health Services, women visiteduniversity mental health services significantly more often than men in recent years, mirroringnational trends. In 2001 and 2002, approximately 16% of law students received mental healthservices from Harvard, with women making up almost two-thirds of that group. However, thesefindings should be interpreted cautiously because we have no information on the prevalence ofpreexisting conditions, visits to non-Harvard providers, the extent of Harvard health insurancecoverage, or the purpose for or type of visit.
Study on Women’s Experiences at Harvard Law School 6
Academic Performance
We investigated gender patterns in grades by examining commencement honors and 1Lcourse grade data. The Registrar’s Office provided us with data on 1L course grades for threerecent years, allowing us to examine whether women and men received different 1L coursegrades, and whether grading patterns changed based on a professor’s gender, the course topic, orthe exam type.
On average, men received somewhat higher grades than women in 1L courses during thethree years of course grades we received. Thirty-one percent of the grades for men were A- orbetter, compared with 25% of women’s grades. This gender difference was mirrored in our 1Lsurvey sample, with women expecting lower grades on average than men.
The gender difference in 1L course grades varied depending on the subject matter of thecourse. In our sample, the greatest gender disparity occurred in Torts, while Criminal Lawshowed no statistically significant difference. The gender pattern also varied to some degreebased on the gender of the professor teaching the course. Compared with 1L courses taught byfemale professors, those with male professors showed slightly greater gender disparities. Examtype, in contrast, generally did not affect the gender disparity, at least among the limited range ofexam types commonly used in 1L courses.
The gender disparities in 1L course grades also exist in graduation honors. From 1997 to2003, women were more likely than men to graduate without Latin honors (55.1% v. 46.6%).Moreover, 14.4% of male graduates received magna cum laude honors, compared with 8.4% offemale graduates.
Although we were unable to analyze enrollment data, gender differences also appear toexist in course selection. Among 2L and 3L survey respondents, 46% of men and 29% of womenreported expecting to take multiple courses in the area of corporate or commercial law. Seventy-one percent of women and 43% of men reported expecting to take a clinical course beforegraduating.
Employment and Clerkships
Women and men also differed significantly in terms of employment, clerkships, andcareer priorities.
Women pursued public interest work during summers and after graduation insignificantly higher rates than men. From 1998 to 2003, nearly 11% of female graduates took apublic interest job as their initial employment (excluding clerkships), compared with 5.5% ofmale graduates, according to data from the Office of Public Interest Advising and Office ofCareer Services. Additionally, 55% of Low-Income Protection Plan (LIPP) enrollees during thepast six years have been women.
Over the past six years, women held judicial clerkships in rates similar to their percentagein the student body. However, there were differences in where men and women clerk. Only 36%

Study on Women’s Experiences at Harvard Law School 7
of HLS clerks at the U.S. Supreme Court and Circuit Courts of Appeals were women during thepast six years. In contrast, women were overrepresented in state court and U.S. District Courtclerkships.
We also found significant gender differences among survey respondents in the three mostimportant factors they considered in choosing a career. Compared with men, women were morelikely to choose “helping others” (41% v. 26%) and “advancing ideological goals” (24% v.15%), and less likely to choose “high salary” (32% v. 44%). Differences in career prioritiesappear to result in a gender difference in long-term career expectations, but not in immediate jobplans. Women in our 2L/3L survey, for example, were significantly less likely than men toexpect to be at a law firm or in-house counsel in 10 years, but we found no such genderdifference in students’ post-graduate job expectations. Additionally, the career goals of students– especially male students – appears to change during the course of law school. For example, 2Land 3L men in our survey sample were significantly less likely to choose “helping others” thanwere 1L men.
Conclusion
This study does not purport to provide a comprehensive overview of the incredible rangeof student experiences. Rather, by identifying substantial differences along one importantdimension – gender – we hope not only to bring additional light to that dimension but also toprovide a lens on student experiences generally.
We believe our findings can be viewed through a number of perspectives and can shedlight on a number of issues. As a result, this study should prove helpful to all members of theHLS community in exploring and addressing gender differences. HLS is not alone in facingthese issues. Studies of other law schools and of legal employers have also found genderdifferences, although direct comparisons are difficult due to methodological differences.However, regardless of the degree to which similar gender patterns are present at other lawschools, Harvard can lead in exploring and responding to these issues.
Despite the obvious focus of the study, however, our findings are not only relevant towomen or to gender. Although our results demonstrate that gender is an important dimension ofstudent experiences at Harvard Law School, it is only one of numerous factors that influencestudents’ experiences. As a result, the HLS community should consider focusing not only ongender differences but also on the potential broader issues of which gender disparities may be amanifestation.
We hope that the information from this study helps to provide a more concrete foundationfor a dialogue about, and further investigation of, the experiences of all students at Harvard LawSchool. Some of the gender differences should raise questions about whether the institution isequally hospitable for the learning and career development of all students; other differences, suchas areas where women are “overrepresented,” could indicate experiences and career pathwaysthat all students might benefit from. Discussion of women’s experiences should assist theHarvard Law School community in its continuing efforts to reassess its practices to ensure thatall students can maximally contribute to and gain from the academic experience.

Study on Women’s Experiences at Harvard Law School 8
II. INTRODUCTION
For the past year and a half, a group of students investigated the experiences of male andfemale students at Harvard Law School (HLS). Gender issues in legal education have recentlycome under increasing examination, with several law schools and the Law School AdmissionCouncil (LSAC) studying the role of gender in legal education and finding significant genderdifferences.1 Gender differences in the legal profession have been similarly examined.2
This study is especially timely given that 2003 was the fiftieth anniversary of the firstgraduating class of women at Harvard Law School. Women now make up 45% of the J.D.student body,3 a far cry from the initial graduating class of fourteen women in 1953. Thisnumber, however, is still below the percentage of women at law school overall4 and atcompetitor schools.5
Our effort to assess men’s and women’s experiences at the Law School was intended toassist the process of self-assessment and improvement at the school, of which recent first-yearcurricular changes are examples. Numerous factors guided our choice of focus areas. First, wewanted to choose aspects of student life at HLS, such as classroom participation, that areimportant for many students. We also chose areas, such as grades and extracurricular activities,that often have important influences on future employment options. Additionally, we chose areasthat we could investigate quantitatively. We decided, for instance, not to focus on certain facets
1 See Linda F. Wightman, Women in Legal Education: A Comparison of the Law School Performance and LawSchool Experiences of Women and Men, LAW SCHOOL ADMISSION COUNCIL RESEARCH REPORT SERIES (1996); YaleLaw Women, Yale Law School Faculty and Students Speak About Gender, a thttp://www.yale.edu/ylw/finalreportv4.pdf (2002) (Yale); Janet Taber et al., Gender, Legal Education, and the LegalProfession: An Empirical Study of Stanford Law Students and Graduates, 40 STAN. L. REV. 1209 (1988) (Stanford);Suzanne Homer & Lois Schwartz, Admitted But Not Accepted: Outsiders Take an Inside Look at Law School, 5BERKELEY WOMEN'S L.J. 1 (1989-90) (Boalt Hall); Lani Guinier et al., Becoming Gentlemen: Women's Experiencesat One Ivy League Law School, 143 U. PA. L. REV. 1, 26 (1994) (University of Pennsylvania); Marsha Garrison,Brian Tomko & Ivan Yip, Succeeding in Law School: A Comparison of Women's Experiences at Brooklyn LawSchool and the University of Pennsylvania, 3 MICH. J. OF GENDER & L. 515 (1996) (Brooklyn Law School); Joan M.Krauskopf, Touching the Elephant: Perceptions of Gender Issues in Nine Law Schools, 44 J. LEGAL EDUC. 311, 328(1994) (Ohio’s nine law schools).2 See, e.g. , NATIONAL ASSOCIATION OF LAW PLACEMENT (NALP), WOMEN AND ATTORNEYS OF COLOR CONTINUE
TO MAKE SMALL GAINS AT LARGE LAW FIRMS (2003), available at http://www.nalp.org/press/minrwom03.htm(finding that in 2003 women made up 43% of associates in large law firms but only 17% of partners).3 See HARVARD LAW SCHOOL, JD STUDENT BODY, available athttp://www.law.harvard.edu/Admissions/JD_Admissions/body.html.4 Women made up approximately 49% of the students in approved law schools nationwide in 2002. See AMERICAN
B AR A SSOCIATION, F IRST Y EAR E NROLLMENT IN ABA APPROVED L AW S CHOOLS 1947-2002(PERCENTAGE OF WOMEN), available at http://www.abanet.org/legaled/statistics/femstats.html.5 See, e.g.,, YALE LAW SCHOOL, JD ADMISSIONS: GENERAL INFORMATION, available athttp://www.yale.edu/outside/html/Admissions/admis-jdgeneral.htm (Yale: 48%); STANFORD LAW SC H O O L,FREQUENTLY ASKED QUESTIONS, available at http://www.law.stanford.edu/overview/facts/ (Stanford: 48%)(Additionally, women make up 53% of Stanford’s current 1L class. See http://www.law.stanford.edu/events/wal/.);NATIONAL ASSOCIATION FOR LAW PLACEMENT, NATIONAL DIRECTORY OF LAW SCHOOLS (2002-2003) (ColumbiaLaw School: 51%; New York University: 50%).

Study on Women’s Experiences at Harvard Law School 9
of student experiences, such as social life, because of the difficulty in framing survey questionsand collecting reliable data. The goal of the study was not to produce conclusions andrecommendations, but rather to provide additional information for a meaningful and moreinformed dialogue by all members of the HLS community on legal education and studentexperiences at the school. We believed that quantitative data would best serve to strengthen thefoundation for such a discussion.
We worked with many members of the HLS community, and we received incrediblefaculty, administrative and student support in helping us with study design, methodology anddata provision. Although many people helped us, particular thanks are due to Mark Byers,Catherine Claypoole, David Cope, Martha Field, Heather Gerken, Denise Grey, Lani Guinier,Joni Hersch, Information Technology Services (ITS), Christine Jolls, Elena Kagan, Todd Rakoff,the Registrar’s Off ice, Suzanne Richardson and El izabeth Stong.

Study on Women’s Experiences at Harvard Law School 10
III. METHODOLOGY
A. CLASSROOM PARTICIPATION
In Spring 2003, we monitored student participation in 32 courses. We monitored all first-year (1L) core courses and a range of large and consistently offered upper-level courses taughtby tenured faculty. Each course was monitored for between four and seven class meetings,totaling 190 class meetings.
All monitors were students enrolled in the courses they monitored in order to respect theclassroom space and minimize the risk of distortion. We assigned two monitors, one woman andone man, to monitor classes simultaneously, and we averaged their data. Male and femalemonitors showed no statistically significant difference in their recording of participation data. Inaddition to providing instructions for recording participation monitoring, we conducted grouptraining sessions or met individually with all monitors before they began. (See appendix I) Wediscussed not only how to collect information but also how to avoid drawing attention to themonitoring. Monitors filled out a paper form or an Excel spreadsheet for each class meeting.6
(See appendix II) We monitored participation in a range of classes so that we could assesswhether participation is influenced by the student’s gender as well as other factors such as classsize, professor’s gender, gender composition of students in the class, and professor’s teachingstyle. We chose not to monitor smaller classes and seminars because of concern about skewingthe results.
We provided advance notice of monitoring to professors at the beginning of the Spring2003 semester. We emailed all professors telling them that a sample of courses would bemonitored at some point during the semester. The email was sent one week into the semester,approximately a month and a half before monitoring began. We did not indicate when we wouldbe monitoring or which courses would be monitored. Given that our study aims to beconstructive, we believed that informing professors justified the small potential distortion thatcould result from professor’s awareness of the monitoring. We did not monitor two classes as aresult of professors’ requests in response to the notice.
In addition to recording the gender of the student who made the comment, monitorsrecorded whether the comment was volunteered by the student or was a response to the professorcalling on the student. Monitors gave unique identifiers to each student who spoke, allowing usto calculate how many students spoke, how many times each student spoke, and whether theprofessor asked the student additional follow-up questions. These unique student identifiers alsopermitted us to keep track of multiple comments by students. First-years are divided up intoseven sections of students that take all required 1L courses together. Second-semester 1Ls taketwo required courses, and we used the same student identifier across both courses and all classmeetings. However, because students are generally less familiar with one another in second- andthird-year (2L/3L) courses, we could only maintain student identifiers within a given class
6 We adapted the form from the one used in the study at Yale Law School. See Yale Law Women, supra note 1.

Study on Women’s Experiences at Harvard Law School 11
meeting. Monitors also recorded the number and gender of students actually present in eachclass. Finally, we independently recorded the gender of the professor for each class andcalculated from registration lists the number and gender composition of students enrolled in each1L section.
We considered collecting additional information about participation but chose not tobecause of concerns about reliability, demand on monitors, and resource limitations. After muchdiscussion and many practice runs, we decided not to assess the quality (e.g., substantivecomments, questions, information-seeking questions, etc.) of the participation by a student. Webelieved that such measures were too subjective and nuanced to be reliable.7 We also did notmeasure the duration of student participation because of similar concerns about subjectivity.8
Finally, we did not record information on the number of students who raised their hands.Although this would have allowed us to assess whether professors called on volunteering men orwomen differently, we thought such recordkeeping imposed too great a burden on studentmonitors and would often be impractical.
During analysis of the monitoring data, we only corrected for clear clerical mistakes.Whenever there was ambiguity in how to correct such a mistake, we chose the option thatfavored the most even distribution of participation in a class. For instance, in the few instancesthat a 1L student identifier was recorded incorrectly and did not match the initials or name of anystudent, we treated it as a unique student, meaning that our reported percentages of the class whospoke at least once in a course likely overstate the actual values. Further, in the few situationswhere the gender recorded was ambiguous, we set it for female in classes where men weretalking disproportionately, meaning that our reported gender disparities likely understate theactual difference in participation rates.
We calculated gender differences in participation at the levels of individual classmeeting, course, section (for 1Ls only) and overall. We separated comments that werevolunteered by the student from those offered in response to being called on by the professor.We also examined other measures of participation in addition to individual comments, includingnon-consecutive participation by students (“exchanges”). This category of participation ignoresif and how a professor immediately followed up with the student, so a prolonged back-and-forthbetween a professor and a student counts the same as a stand-alone comment by a student. Wealso looked at the composition of students who spoke at least once during a class meeting.Finally, we examined gender patterns among students who had three or more exchanges in agiven class meeting (“dominant participants”). Appendix III summarizes the overall monitoringsample.
7 For instance, depending on the context, “Was Justice White in the majority of the previous case?” could becharacterized either as a common information-seeking question or as a question reflecting an appreciation of theimportance of the political and internal dynamics of the Supreme Court.In contrast, some other studies have attempted to take a more contextual approach to participation monitoring. SeeElizabeth Mertz et al., What Difference Does Difference Make?: The Challenge for Legal Education (unpublishedmanuscript, on file with the New York University Law Review), cited in Sarah Berger et al., “Hey! There’s LadiesHere!!” 73 N.Y.U. L. REV. 1022, 1047-53 (1988).8 Even classifying participation by general categories of time would have likely been too unreliable. The best way tomeasure duration contemporaneously may be to develop a computer program that would allow a monitor to hit a keywhen a student begins and then ends speaking. Developing such a program was beyond our resources.
Study on Women’s Experiences at Harvard Law School 12
B. STUDENT SURVEYS
We conducted two rounds of student surveys in order to explore students’ career goals,extracurricular activities, confidence and satisfaction, among other areas. We used the surveysprimarily to explore issues that we could not examine by direct observation. The only surveyquestions that addressed directly-observable areas (e.g., journals) did so in order to investigatepossible relationships among certain variables or to control for certain variables. We are verythankful to David Cope and Joni Hersch for all of their help in improving the surveys.
We conducted two surveys in April 2003, one for 1Ls (see appendix IV) and one for 2Lsand 3Ls. (See appendix V) We also conducted a survey for 1Ls in December 2002. (Seeappendix VI) All surveys were advertised as “Student Experiences Survey,” and neither thesurvey nor the publicity mentioned its gender focus. All surveys were available online, thanks tothe help of HLS Information Technology Services. To access the survey, students entered theirHLS user name and password, enabling us to ensure that each student only took the survey once.This identifying student information was used only to award prizes for taking the survey and toprotect against students taking the survey multiple times. We used ITS’ technology to make surethat student responses were anonymous. The Committee on the Use of Human Subjects approvedour survey protocol.
Survey Questions
The survey explored a number of issues related to academics, career plans,extracurricular involvement and self-esteem.
In designing the surveys, we tried to avoid questions that could distort individualresponses or the respondent pool. We did not ask any questions specifically on gender issues,such as students’ perception of whether male and female students participate differently in class,because we did not want to alert students to a purpose of the survey that could have led to biasedresponses. Additionally, we omitted certain questions, such as those on LSAT score and familyincome because of the negative response from students at other law schools who took trial runsof the surveys. We also made optional the question asking students to identify their race becausewe did not want students to be concerned that answering the questions about race, gender, and1L section might identify them. Additionally, to attract more respondents and more faithfulresponses, we kept the surveys as short as possible (5 minutes), accepting the risk of slightlygreater ambiguity caused by asking fewer questions than we would have liked.
The survey questions can be roughly divided into issue areas:
Career: We asked a series of questions about career expectations. All surveys askedstudents to select the sector in which they thought they would most likely be working in 10years. Second- and third-year respondents were also asked what type of job they had/will havetheir 2L summer and after graduating (excluding clerkships). We also inquired whether theyapplied/will apply for clerkships and, if so, at what level. We asked an analogous question aboutwhere 3Ls will clerk after graduation. Additionally, in order to get some idea of a student’s

Study on Women’s Experiences at Harvard Law School 13
underlying values, we asked students to choose the three most important factors in their careerchoices from a list of ten. Finally, we asked students to list the professors from whom theyreceived or expect to receive references for job or clerkship applications.
Academics: We asked students about the course groupings from which they have taken orexpect to take multiple courses and inquired about clinicals, negotiation classes and cross-registration. Additionally, we asked students about course preparation and faculty interaction.Finally, in order to investigate the effect of students’ initial law school grades and how studentspredict their grades, we inquired about students’ 1L first semester grades and their gradepredictions for their current courses.9
Self-Assessment: We asked students to assess their abilities, relative to the rest of theirclass, in a variety of skills relevant to legal education and practice. We relied largely on the listof twelve skills identified in the American Bar Association’s MacCrate Report as important forlawyers.10 We asked about technical skills (legal reasoning, legal research, brief writing, oralargument, thinking well on one’s feet and quantitative problem solving) and interpersonal skills(persuading others, recognizing and resolving ethical dilemmas and building consensus amongpeople with different viewpoints).
Extracurricular Activities: We asked students about current activities, in addition towhether they planned to apply for certain competitive activities as well as how likely theythought would be to be selected.
Demographics: We also asked questions concerning the student’s parental educationlevel, race/ethnicity, marriage or relationship status, college graduation year, undergraduatemajor and gender.
Our treatment of race/ethnicity deserves particular attention, as it differs somewhat frommany other surveys. First, we chose to inquire about race and Hispanic/Latino/a statussimultaneously, rather than in separate questions. We chose this approach because we expectedthat the small sample size would force us to collapse certain race/ethnicity groups and because of
9 We chose not to ask directly about 1L students’ grades because we were concerned they might find the questiontoo prying or respond untruthfully. Instead, we asked a pair of questions on grades for each course: (i) what studentsfelt they deserved based on their understanding of the course’s subject matter; and (ii) how satisfied they were withtheir grade relative to what they felt they deserved. This served two purposes. First, the questions served to narrowdown to some degree the possible range for a student’s grade. In this sense, how a student interpreted the firstquestion is unimportant. Rather, they indicate their grade to some degree merely by selecting a specific grade andanswering whether that selected grade is greater than, less than or equal to what they received. Second, the pair ofquestions allowed some insight into the degree to which students internalized their grade.For the 2L/3L survey, we asked students for their highest and lowest 1L first semester grades. After talking with across-section of students, we believed that 2L/3L students would be less hesitant than 1Ls about answering thesegrade questions directly. Asking about high and low grades separately allowed us to investigate how students reactwhen they receive grades that are quite different. References in this report to “average” 1L first semester grades for2L/3Ls mean the average of the high and low grades. We decided to ask only two grade questions because wethought this was a sufficient approximation and that the added costs outweighed the marginal benefit of additionalquestions.10 See AMERICAN BAR ASSOCIATION, LEGAL EDUCATION AND PROFESSIONAL DEVELOPMENT: A N EDUCATIONAL
CONTINUUM (1992) (“MacCrate Report”).

Study on Women’s Experiences at Harvard Law School 14
the questionable descriptive value of treating Hispanic/Latino/a status and race as separate.11
Second, the answer to this question was optional because we did not want to risk upsetting somerespondents or discouraging completion of the survey for those concerned about self-identification or the appropriateness of the question. For purposes of analysis, we treatedrespondents who did not check off any boxes to the question on race/ethnicity as a separatecategory. We also collapsed the survey answers on race/ethnicity into two different variables.The first variable had seven values: White; African-American or African; Latino/a; Asian-American or Asian; Other Race/Ethnicity; Multiracial (respondents who selected more than onerace/ethnicity box); and Left Question Blank. The second variable had three values: White; NotWhite; and Left Question Blank. Because of the small number of respondents in certain groups,we used the second variable for most regressions.
Survey Publicity
In order to attract as large and as representative of a respondent pool as possible, weheavily publicized the survey and awarded prizes of $50 each to nine participants selected atrandom. We thank the Dean of Students Office for funding the awards and some of the publicitycosts. We advertised through mailbox fliers, posters, and emails from HL Central, a large law-school-wide social organization. For the 1L surveys, we provided a professor from each sectionwith an email message publicizing the survey to send to his or her students. For the 2L/3Lsurvey, we attempted to get all professors teaching Constitutional Law during the 2002-2003academic year to post or email their students our message publicizing the survey. Most, but notall, of the professors we asked advertised the survey to their students in some form. We alsoasked approximately 50 student organizations, representing a wide range of activities andpolitical viewpoints, to send our written message about the survey to their membership.
Data Analysis
We used Stata 8.0 to perform multivariate and logit regression analyses. We performedsuch analyses in order to identify the differential effects of gender and other variables on anumber of measures based on the survey responses.
We restricted the sample for all surveys to students pursuing a J.D. degree, includingjoint-degree candidates. Although L.L.M. and S.J.D. students could take the survey, we excludedthem from our analysis because of the small number of responses. However, we feel that furtherstudy of their experiences is important as they have a unique perspective on HLS and studentexperiences here.
An additional note is necessary concerning our analysis of survey responses where eachrespondent provided information on multiple courses. For instance, each 1L respondentanswered questions on their expected grade and satisfaction for all of their current 1L courses. Inthe analysis, we constructed a database with a student’s answers for each course as a separate
11 This approach differs from that of the U.S. Census Bureau, which asks about the two separately. See U.S. CENSUS
B U R E A U , CENSUS 2000 BR I E F : OVERVIEW OF R ACE AND H ISPANIC O RIGIN (2001), available athttp://www.census.gov/prod/2001pubs/c2kbr01-1.pdf.
Study on Women’s Experiences at Harvard Law School 15
entry. In order to address the repeated observations by individuals, we used the cluster functionin Stata for all regressions on this database.
We received over 1,000 survey responses. Among 1Ls, 289 (52% of the class) and 278(50%) students took the fall and spring surveys, respectively. Two hundred and twenty-six 2Ls(40%) and 183 3Ls (33%) took the spring survey. Appendix VII describes the survey sampledemographics. One area worth noting in particular is the gender composition of our responsepool. As discussed above, we went to great lengths to ensure that men and women did not knowthe surveys’ gender focus. Although women are slightly overrepresented in the survey sample,the gender composition of the samples is comparable to that of the general student population,which is untrue of most other attempts to investigate gender issues in legal education. Whatdifference we did have may have been a product of imperfect containment of the study’s purposeor a greater willingness by female students to respond to surveys generally.
Overall, we designed our survey questions and publicity efforts to attract asrepresentative a pool of respondents as possible. However, we recognize that extrapolating ourfindings from the survey samples to the general student body is not without problems andrequires certain assumptions. As a result, all references to survey findings in this report referonly to the survey sample. We leave readers to decide for themselves to what extent toextrapolate the results. At a minimum, our surveys provide insight into a substantial portion ofthe student body at HLS due to the large number of responses.
C. EXTRACURRICULAR ACTIVITIES
We examined the gender composition of a few extracurricular activities. We looked at themastheads and leadership positions (e.g., President, Editor-in-Chief) of HLS-recognized studentjournals for the past six years. After considering the alternatives, we chose to use each journal’sown definition of masthead positions, which generally corresponded to the “Executive Board,”and calculated the gender composition for the first issue of each academic year. For moststudents listed, we used their first names to determine gender. When the name was inconclusive,we looked at yearbook pictures. We used internet searches to identify the gender of the fewremaining students.
We also calculated the gender composition of the Legal Aid Bureau and Board of StudentAdvisors (BSA) because of the substantial time commitment for both activities.
D. MENTAL HEALTH CARE
We received data on the total number of law student visits to Harvard Mental HealthServices for the 2001 and 2002 calendar years from Dr. Richard Kadison, director of MentalHealth Services of Harvard University Health Services. This number includes mental healthvisits to both Law School Health Services (in Pound Hall) and the main Holyoke Center. Visitsinclude those for therapy, medication and individual, group or couple counseling.

Study on Women’s Experiences at Harvard Law School 16
Although this information provides some insight into student life, the findings should beinterpreted cautiously because we have no information on the prevalence of preexistingconditions, Harvard health insurance coverage or the purpose for or type of visit.
E. GRADUATION HONORS
We examined the Latin honors lists for the past six years and calculated the gendercomposition of each honors category (summa cum laude, magna cum laude, cum laude, non-honors). Prior to 1999, HLS awarded honors based on absolute grade point average (GPA)levels. Since 1999, magna cum laude and cum laude are awarded to the top 10% and subsequent30% of the graduating class with the highest GPAs, respectively. Summa cum laude is still tiedto an absolute GPA level, 7.20.12 We calculated the gender composition of Latin honors listsusing the method described above for journal board members.
F. COURSE GRADES
The Registrar’s Office provided us with data on grades for the five required 1L coursesfor three of the five years between 1996 and 2000.13 The Registrar’s Office released threerandom years from that range in order to preserve anonymity. We received three sets of gradedata for each year, providing us separately with information on subject matter, professor’sgender, and type of exam.14 We received no other information about any grade entry. Weomitted all entries without a final letter grade, such as withdrawals and incompletes. AppendixVIII describes the sample of 8,248 course grades.
We adopted the Registrar’s scale for assigning values to each grade letter, allowing us totreat grades on an ordinal scale15 and used Stata 8.0 to perform regression analyses.
The first year of law school provides a useful controlled situation for grade researchbecause all students take the same required set of courses (Civil Procedure, Contracts, CriminalLaw, Property and Torts). In contrast, elective courses taken by second-year and third-yearstudents offer much more variety than do 1L courses in terms of student composition, coursecontent and grading method. A similar analysis of grades for common 2L/3L electives couldshed further light on the effect of exam type as well as provide an important comparison to our1L grade findings.
Additionally, although the course grade data highlight grade distributions generally, theydo not show how students perform throughout their three years at HLS. Having anonymous dataon grades for individual students over their law school career would allow investigation of howstudents’ GPAs differ by class year and whether the gender pattern changes by class year, which
12 See HARVARD LAW SCHOOL, HARVARD LAW SCHOOL CATALOG 2003-2004 209 (2003).13 At the time we received this data, this range represented the most recent five years, excluding class years that werestill attending HLS.14 We divided exam type into four categories: in-class (approximately three hours) restricted-materials; in-classopen-materials; one-day (eight hours) restricted-materials; one-day open-materials.15 In calculating GPA for the purposes of graduation honors, the Registrar’s Office assigns the following values toeach grade: A+ = 8; A = 7; A- = 6; B+ = 5; B = 4; B- = 3; C = 2; D = 1; F = 0. See HARVARD LAW SCHOOL, supranote 12.

Study on Women’s Experiences at Harvard Law School 17
could help narrow the range of hypotheses warranting further investigation. Such data could alsoshed light on grades and grading patterns generally. Is there a small group of students thatconsistently receive top grades, while most students vary tremendously? Do certain studentsconsistently perform much better in courses with certain types of exams? Student-level gradedata could also provide insight into the effect of receiving high or law grades initially, as well aswhether male and female students perform differently throughout the three years of law schoolbased on their initial experience with law school grades.
G. CAREER AND EMPLOYMENT
We examined information on summer and post-graduate employment provided by KenLafler at the Low-Income Protection Plan (LIPP) office, Alexa Shabecoff at the Office of PublicInterest Advising (OPIA), and Mark Weber at the Office of Career Services (OCS). We receiveddata on OPIA summer funding during students’ 1L and 2L summers from 1998 to 2002. We alsoreceived data from OCS on initial post-graduate employment for the past six graduating classesand from LIPP on graduates who were registered for LIPP over the past six years.
H. FOCUS GROUPS
In order to help us design survey questions and to supplement and provide context toquantitative results, we conducted eight single-sex focus groups, where male and femaleparticipants could discuss their experiences at Harvard Law School. Students’ age, race andextracurricular involvement were considered in order to ensure a diverse group. For each focusgroup, we had one facilitator and either had one note-taker or tape-recorded the discussion.Questions strived to be general and neutral, and focused on people’s personal experiences ratherthan soliciting their perceptions about “common” experiences at HLS. The Committee on theUse of Human Subjects approved our protocol, and all focus group participants signed a consentform. (See appendix IX)

Study on Women’s Experiences at Harvard Law School 18
IV. RESULTS
A. CLASSROOM PARTICIPATION
“I hate talking in class, yet there are some seminars that I love…. In someof the big classes, it wouldn’t matter anyway; it’s not like my presence orabsence even matters.”
-Female 2L
“I have felt there is no space for people who just absorb and listen in lawschool and then reflect on it later. As a person who absorbs informationbest through this method instead of just talking when I feel like it, I have feltthat there is little room for that learning technique in law school.”
-Female 1L
We found significant gender differences in classroom participation by students in theclasses we monitored. Appendix X summarizes the sample and participation measures by course,and Appendix XI summarizes this for first-year courses in particular, where we had more refineddata.
Overall, 39% of the 7,831 comments monitored were made by women, although theymade up 45% of the students in attendance in the sample. (See appendix XII) The results seemlargely – but not entirely – due to differences in voluntary participation. Women made only 34%of student-initiated comments and exchanges. In terms of odds ratios, a male student was 32%more likely than a female to talk during a class meeting, and 50% more likely to talk voluntarily.Finally, men were 63% more likely to speak three or more times in a class meeting and 142%more likely to volunteer three or more times in a class meeting.
Our classroom monitoring found that professors generally followed up with male andfemale students at similar rates, and, by some measures, were more likely to follow up oncomments made by women. Professors followed up with a student after he or she spoke 23% ofthe time, but followed up less frequently (12%) when the student volunteered the initialcomment. Overall, professors were 17% less likely to follow up with comments made by malestudents than female students. However, this difference was largely due to professors’ lowerfollow-up rates with volunteered comments, of which women provide fewer than men.
Our results suggest that, on average, professors treat men and women students roughlythe same in terms of calling on them and following up with them. However, because men seemmore willing to talk voluntarily in class, the end result is a significant gender difference inoverall participation. Other studies, including one at Yale16 and a comparative study of eightschools, found that women participated in less often than men in many courses.17 Additionally,
16 See, e.g., Yale Law Women, supra note 1 (Men’s rate of volunteering exceeded women in 16 of the 23 monitoredcourses.).17 See Mertz, supra note 7. See also Guinier, supra note 1; Taber, supra note 1.

Study on Women’s Experiences at Harvard Law School 19
surveys at other law schools have found a perception among students that professors engagedifferently with male and female students’ comments.18
The gender difference overall masks a decent degree of variation among the 32 courseswe monitored. For instance, women were overrepresented in terms of overall comments andvolunteered comments in seven and six courses, respectively. In three courses, female studentswere more likely than males to speak at least once as well as to volunteer at least once. Finally,in 10 of 32 courses, women were more likely than men to participate in response to a professorcalling on them.
The variation in gender patterns between courses suggests that further research should bedone to determine possible course-specific factors that may influence the pattern of participation.Unfortunately, our sample size was insufficient for comparisons of participation patternsbetween different teaching methods (e.g., Socratic v. non-Socratic courses). However, we didfind some interesting trends that are worth exploring further. First, we found a trend towardsincreasing gender disparity the greater the overall level of participation in the course. Also,although only five of the thirty-two courses monitored were taught by women, we found sometrends in terms of professors’ gender. By all of our measures, men participated even moredisproportionately in courses with female professors than with male professors, which maypartly be explained by the higher overall participation in courses taught by female professors onaverage.
The monitoring data also suggest some overall trends in classroom participation. Duringthe approximately 12 class meetings total that we monitored for each section, 85% of 1L studentsspoke at least once, with 48% of students speaking voluntarily at least once during this timeperiod. However, there was significant variation between 1L courses, ranging from only 28% toas many as 65% of students participating voluntarily at least once during the monitoring period.(See appendix XI)
A further trend we found was that a small number of students accounted for much of theclassroom participation, and these top talkers were overwhelmingly male. Eighteen percent of 1Lstudents made 50% of all comments in the 1L classes we monitored. (See appendix XIII) Thedistribution of student-volunteered comments is even more skewed, with ten percent of studentsaccounting for 43% of all volunteered comments spoken in the 1L monitoring sample. However,the extent of skewing varied greatly between 1L courses. (See appendix XIV) Women made uponly 20% of this top group of volunteers. (See appendix XV)
B. EXTRACURRICULAR ACTIVITIES
“I'm beginning to realize that the key is to be able to find what you want todo and, as for the rest, just sit back and enjoy the show. Otherwise, it's tooeasy to get sucked into the herd mentality and do things just because othersare doing them.”
-Male 1L
18 See Yale Law Women, supra note 1; Guinier, supra note 1.

Study on Women’s Experiences at Harvard Law School 20
“I found that most of my experiences at the law school have caused me tofeel insecure and have resulted in a low self-esteem. For these reasons, allactivities I engage in tend to be away from the law school.”
-Female 3L
We calculated the gender composition of students involved in academic journals andcertain other extracurricular activities. We also surveyed students about their involvement anddecisions to apply for competitive extracurricular activities.
Academic Journals
Women were involved in higher-up positions of journals at greater rates than men overthe past six years. (See appendix XVI) Women comprised 49% of masthead positions (usuallycorresponding with the executive board) and 56% of the top leadership (e.g., President or Editor-in-Chief) of HLS-recognized journals. Most journals have had 50% female mastheads at somepoint in the past six years, with a notable exception of Law Review, with a membership that was36% female.
We also examined the gender composition of journals excluding the Women’s LawJournal. Excluding the Women’s Law Journal decreased the overall percentage of women on themasthead to 44%, but only reduced the percentage of women in the top leadership positions to52%.19
Women have been underrepresented on the Law Review for the past six years relative tothe student population. Although some other top law schools also have women underrepresentedon law review,20 other schools show near parity 21 if not overrepresentation by women. 22 In thestudent surveys, we investigated gender differences in applying for Law Review as well as theeffect of first semester 1L grades on the decision. We found that gender was not a significantfactor in deciding whether to apply for Law Review in our survey sample. Second- and third-year students in our sample who had higher grades first semester 1L year were more likely tohave applied for Law Review, but men’s decision to apply showed a significantly strongercorrelation with first-semester grades than women’s decision. (See appendix XVII) We alsoinvestigated the decisions of students who had sizable variations in their first semester 1L grades,which we defined as a difference of at least two grades (e.g., A- to B). We found that women inour sample with sizable grade variations were more likely than men with such variations to applyfor Law Review, and that average first-semester 1L grade still had a significantly stronger effectfor women than men.
Legal Aid Bureau and Board of Student Advisors
19 We do not have enough information to know whether the existence of a women’s law journal attracts additionalwomen to journal work or primarily has a substitution effect.20 For instance, University of Chicago, Northwestern University, and Columbia. See Hugo Torres & TammyPettinato, Internal Law Review Report Leaked, THE RECORD, Nov. 6, 2003.21 For instance, Duke University and Stanford University. See id.22 University of Pennsylvania and Boalt Hall. See id.
Study on Women’s Experiences at Harvard Law School 21
“Even the most worthwhile extracurriculars require extensive applicationprocesses. I feel like I am constantly competing for something while I amhere, be it grades, activities, or summer jobs.”
-Male 1L
We also investigated the gender composition of the Legal Aid Bureau and Board ofStudent Advisors (BSA), two activities with a substantial time commitment and a competitiveapplication process.
Women were overrepresented on the Legal Aid Bureau relative to their proportion of thestudent body. From 1998 to 2003, 57% of Legal Aid members were women. (See appendixXVIII) Women were also consistently overrepresented on BSA and made up 59% of all BSAmembers from 1998 to 2003. (See appendix XIX) Women and men in our survey sample weresimilarly likely to expect to apply for Legal Aid Bureau or Board of Student Advisors (BSA)after controlling for demographics, self-assessment of skills, career plans and grades. However,2L and 3L men who ranked themselves highly in terms of analytical skills were less likely toapply for BSA, while no similar effect occurred among women.
Further research would be helpful in understanding how these overrepresentations,combined with our findings of gender differences in course selection in our survey sample,23
shape the overall legal education of women and men.
C. STUDENT LIFE
“Life here is fantastic!”-Male 1L
“The school manages to take 500 of the brightest and most motivatedstudents in any field in the country and systematically pacify and alienatelarge proportions of them, so that by the time they are in their third year,many if not most students rarely attend class, do the reading, or care a figabout law.”
-Male 3L
“Harvard is sending a message that if you want to do something well, youcan only do one thing. So if you want to be a good law student, don’t comehere as a parent, and if you feel like you can’t do it, we’re not going to helpyou.”
-Female 3L
Confidence and Self-Assessment
“I was confident in my abilities and was recognized as being talented by mypeers and supervisors before law school. My first two years of law school
23 See infra pp. 29-30.
Study on Women’s Experiences at Harvard Law School 22
absolutely destroyed that. It is only recently that I have begun feeling myown worth again.”
-Female 3L
“I walked in the door confident, and I’m going to leave the same.”-Male 3L
We asked survey participants to evaluate their ability relative to the rest of their class in arange of skills thought to be important to legal practice, largely based on the skills identified inthe ABA’s MacCrate Report.24
We found significant gender differences in students’ self-assessment of their abilities.(See appendix XX) Women in our sample assessed themselves significantly lower than men didin many skills, even after controlling for demographics, undergraduate major, and career goals.Thirty-three percent of male respondents reported themselves in the top quintile of their class interms of legal reasoning ability, compared with 15% of women. Women self-assessed their legalreasoning skills lower than men in our 2L/3L and 1L samples, even after controlling for 1L firstsemester grades. Among all students, legal analysis skills were correlated with 1L first semestergrades. (See appendix XXI)
Another area of note is students’ self-assessment of their quantitative problem-solvingskills, such as those used in finance and economics. Women in our sample self-assessed theirquantitative skills far lower than men, even after controlling for variables such as undergraduatemajor. Forty percent of men ranked themselves in the top quintile in quantitative skills,compared with only 11% of women. Second- and third-year women were more likely to self-assess their quantitative skills lower than men, whether the pool was limited to those whomajored in financial or quantitative studies (e.g., economics, math, statistics) or those who didnot.
Women in our sample also self-assessed themselves significantly lower than men in theirability to think quickly on their feet, argue orally, write briefs and persuade others.
Our results comport with other studies finding that female law students generally ratethemselves lower than men in terms of academic ability.25 Although we were not able to surveystudents prior to starting HLS, the LSAC study found that among incoming law students, menrated themselves higher than women in ability.26 The LSAC longitudinal survey also found thatlaw school substantially reduced students’ academic self-confidence, and operated on womenand men equally.27 Studies at other law schools have found that women seem to suffer more thanmen from feelings of alienation and lack of confidence. At a survey in nine Ohio law schools,41% of female students compared with only 17% of males reported that they thought ofthemselves as intelligent and articulate before law school but no longer felt that way once in
24 See AMERICAN BAR ASSOCIATION, supra note 10.25 See, e.g., Wightman, supra note 1, at 54.26 See id. at 56-57.27 See id. at 58-59.

Study on Women’s Experiences at Harvard Law School 23
school.28 At University of Pennsylvania, even women who succeeded academically reported ahigher degree of alienation than their male peers.29
Help-Seeking and Support Groups
“I wake up every morning dreading the day, and no matter how well I do inclass, how much work I get done, or how well I feel I understand thematerial, it is never enough. I often feel lost and adrift, with very littleguidance.”
-Male 1L
“I am frustrated by the fact that there is not much open discussion aboutlife-work balance issues. I sense that nearly all of my peers, like myself,plan to have a family some day and yet I only hear my female peers talkingabout how they expect this to impact their careers.”
-Female 1L
“I know many people who cried their way through 1L year.”-Female 3L
Female law students were substantially more likely than male law students to have visitedMental Health Services during calendar years 2001 and 2002. (See appendix XXII) Womenmade up 64% of all law student patients who visited Mental Health Services during that period.Women and men averaged similar numbers of visits per patient (5.42; 5.66).
These findings should be interpreted cautiously. In addition to not having information onthe prevalence of preexisting conditions, Harvard health insurance coverage, or the purpose foror type of visit, general population studies suggest that women may have a lower threshold onaverage for seeking mental health care. Furthermore, if a gender difference among law studentspersists after accounting for other factors, we should hesitate before deciding that it is women,rather than men, who are worse off. Especially if most of the visits are for therapy, it is possiblethat women are better off for taking greater advantage of a beneficial service.
However, the stark gender difference does support further investigation into possiblecauses and explanations. 30
Overall, approximately 17% of law students visited Mental Health Services at least onceannually, not including mental health care outside University Health Services or services such asthose offered by the Office of Student Life Counseling. Studies have frequently found a higherrate of depression and substance abuse among law students and lawyers than the general
28 See Krauskopf, supra note 1, at 328.29 See Guinier, supra note 1.30 Some insight could be gained by looking at information on mental health visits for a comparison group, such asHarvard undergraduates or business school students.

Study on Women’s Experiences at Harvard Law School 24
population.31 One key question is whether some aspect of legal education is contributing to thehigher incidence of psychiatric distress, or if the rates primarily reflect higher rates of preexistingconditions or greater predisposition.32 Further, some of these studies have found that female lawstudents showed greater rates of psychiatric distress than male students.33 Student surveys atother law schools have found that female respondents reported crying more often, having moresleeping difficulties and experiencing more anxiety than men.34 In our focus groups, we similarlyfound that many women, as well as men, expressed feelings of alienation and decreased self-esteem in law school and a desire to discuss these issues more openly.35
Academic Satisfaction
“I have been more stimulated and challenged in these last few years than Iever thought possible.”
-Male 3L
“I've been surprised by the number of people that I see disengaged from lifeat HLS -- both academic and extracurricular. There are lots of people whostop vocalizing what they are passionate about after their first year.”
-Female 3L
“I fought the law and the law almost won.”-Male 3L
To help gauge students’ academic satisfaction, the surveys inquired into how contentstudents were with their current courses. We also asked them to rank how likely they would be tochoose to attend law school again as well as to choose HLS again over their second-choice lawschool.
Amongst all class years, there was no gender difference in students’ responses to whetherthey would choose HLS again over their second choice. However, 2L and 3L men were morelikely to respond that they would not go to law school at all again. In terms of their satisfactionwith law school, women seem to be more affected by grades than men. Average 1L first semestergrades showed a strong correlation with likelihood of choosing to attend law school again for 2Land 3L women, while these grades had no significant effect on 2L and 3L men’s response to thequestion. In the 1L Spring survey, student’s gender had no significant influence on self-reportedlikelihood of choosing to attend law school again. (See appendix XXVI).
31 See, e.g. , Susan Daicoff, Articles Lawyer, Know Thyself: A Review of Empirical Research on Attorney AttributesBearing on Professionalism, 46 Am. U. L. Rev. 1337, 1347 (1997).32 See, e.g. , id. at 1378 (referring to a 1986 study that concluded legal education may be partly responsible for aspiking of symptoms of psychiatric distress during the first year of law school).33 See, e.g., id. at 1375-81.34 Taber, supra note 1; Homer & Schwartz, supra note 1; Guinier, supra note 1 (student survey found, for instance,that 68% of men responded they never cried during law school, compared with only 15% of women.).35 Anecdotally, we found that most focus group participants greatly appreciated the opportunity to discuss theirexperiences and issues with other students.
Study on Women’s Experiences at Harvard Law School 25
Overall, women seem to assign greater weight to their grades as measures of their interestor ability in a legal area. Additionally, satisfaction with current courses had a significantlystronger correlation with expected grades for 1L women than men. Much more research isneeded to determine possible causal relationships between satisfaction with law school andexpected academic success.
The question of why satisfaction with courses or pedagogy may show a gender differenceis outside the scope of this report. However, some hypotheses that have been expressed are:women may be more put off than men by the style or format of the academic environment, suchas class size or participation method, rather than any substantive differences;36 women and menmay differ to some degree in their moral reasoning;37 or law school may be less satisfactory tostudents aiming for a career in public interest law, of which women are the majority.38
We also do not know how faculty interaction might influence overall academicsatisfaction. After consideration, we concluded that student-faculty interaction was too hard todefine and varied to lend itself to a few survey questions. However, student surveys at other toplaw schools suggest that male students may be more comfortable seeking a professor’s timeoutside of class39 and more likely to ask professors questions outside of class, both of whichcould affect overall academic satisfaction.40
D. ACADEMIC PERFORMANCE AND CHOICES
Academic decisions and success have the potential to influence a student’s careeroptions, and many students may also view grades as measures of their legal ability and generalintelligence. In order to gain some insight into these issues, we analyzed data on graduationhonors and 1L course grades and asked questions about students’ course selection in our surveys.
Honors and Grades
“I hate grades. I don't want to care but I do.”-Male 1L
“In my circles, though very competitive, there is very little talk aboutgrades.”
-Male 3L
We found significant gender differences in Latin honors and 1L course grades. Womenwere less likely to graduate magna cum laude than men and more likely to graduate without
36 See, e.g., Taunya L. Banks, Gender Bias in the Classroom, 14 SO. ILL. L. J. 527, 528 (1990).37 See, e.g., Sandra Janoff, The Influence of Legal Education on Moral Reasoning, 76 MINN. L. REV. 194 (1991).38 See e.g. , Robert Granfield, Contextualizing the Different Voice: Women, Occupational Goals, and LegalEducation, 16 LAW & POL’Y 1, 18 (1994). The author suggests that women’s reactions to legal training are greatlyinfluenced by occupational goals. Women entering law school with “social justice” aspirations reported moresilencing in the classroom and were less likely to believe that law school made them more competent, comparedwith women who chose law school because of goals such as job security and high potential income. See id. at 14-18.39 Yale Law Women, supra note 1; Guinier, supra note 1.40 Taber, supra note 1.

Study on Women’s Experiences at Harvard Law School 26
Latin honors. From 1997 to 2003, 14.4% percent of graduating men received magna cum laude,compared with 8.4% of women. (See appendix XXV) During the same time period, 55.1% ofwomen graduated without Latin honors, compared with 46.6% of men. (See appendix XXVI)Further, the gender pattern in honors seems to be moving in the wrong direction – with greaterdisparities the past two years.
We also found a significant gender disparity in 1L course grades overall. (See appendixXXVII) In our sample of three years of course grades, women received somewhat lower gradesthan men, with greater differences in higher letter grades (A- and above). Thirty-one percent ofcourse grades for men were A- or better, compared with 25% of grades for women. Women’sgrades were more likely than men’s to be B or B+.
The gender difference in 1L course grades was somewhat affected by the gender of theprofessor teaching the course. (See appendix XXVIII) We did find some evidence for aninteraction between the student’s and professor’s gender in course grades. In regression analyses,we found that a female student in a course taught by a female professor was more likely thanstudents in a course with a male professor to receive a grade of A or A+. (See appendix XXIX)More research is needed to determine the robustness of this difference as well as to explorevarious hypotheses for such an effect.41
The gender difference also generally persisted across 1L courses with different examtypes, whether an in-class (usually 3 hours) or one-day (8 hours) take-home exam or whetheropen-book or restricted-materials. (See appendices XXX and XXXI) The chief exception wasthat women were significantly more likely to do well in courses with in-class restricted-materialsexams. Further research on grade data on 2L/3L courses is desirable in order to examine whetherother grading options may influence the gender pattern. The range of exam types seen in 1Lcourses is rather limited, as we do not see options such as essays, papers on a topic of a student’schoice, problem sets or weekly exercises.
Course topic affected the gender pattern in 1L grades in our sample. Torts exhibited themost pronounced gender disparity. The disparity was significant but not as great in Contracts,Property and Civil Procedure. Finally, Criminal Law did not show a statistically significantgender difference in grades. (See appendices XXXII and XXXIII) Additional grade datasupplemented with focus groups would be useful in further exploring the effect of course topicon gender patterns.
41 One common hypothesis relates to the influence of faculty role models. Women represent a smaller share of full-time law faculty at Harvard (17%) than at competitor schools. See http://www.law.harvard.edu/faculty/directory/ (14of 81 full-time professors are women.); YALE LAW SCHOOL, supra note 1 (24% at Yale); STANFORD LAW SCHOOL,FACULTY available at http://www.law.stanford.edu/faculty/ (24% at Stanford: 10 female, including one associateprofessor, and 31 male, including three associate, full-time professors); COLUMBIA LAW SCHOOL, FULL TIME
FACULTY, available at http://www1.law.columbia.edu/faculty/full_time_fac (34% at Columbia: 17 female, includingthree associate professors, and 50 male, including one associate, full-time professors); NEW YORK UNIVERSITY LAW
SCHOOL OF LA W, FULLTIME FACULTY, available at http://www.law.nyu.edu/faculty/profiles/fulltime/index.html(29% at NYU: 26 female, including one new appointment, and 65 male, including two new appointments, full-timeprofessors).

Study on Women’s Experiences at Harvard Law School 27
In addition, we found that women in our 1L Spring survey sample expected lower gradeson average than men, but did not differ in terms of course satisfaction. (See appendix XXXIV)The gender difference in expected grade was smaller but remained significant even aftercontrolling for students’ assessment of their abilities. As would be anticipated, expected coursegrade also showed a high degree of correlation with course satisfaction. Additionally, satisfactionwith current courses showed a significantly greater correlation with grade expectations forwomen than men. More research needs to be done into this gender pattern as well beforeassigning any sort of causation between grade expectations and course satisfaction.
The Spring survey also asked 1L students what grade they felt they deserved based ontheir understanding of the material and exam preparation for each of their first-semester courses,as well as how satisfied they were with the grade they received, compared with what theythought they deserved. Women in our sample on average chose lower grades for what theybelieved they deserved than men did. This gender difference in both grades and expectations isparticularly striking given our finding, discussed below, that women reported spending moretime preparing for class than did men.
Other studies have also found small grade differences among men and women. TheLSAC study found women earned first-year grades slightly lower than men overall.42 However,of particular relevance to HLS, the study found that nationwide among students with the highestundergraduate GPA (3.76-4.0), women earned slightly higher law school grades than men.43
Additionally, a study at the University of Pennsylvania Law School in the early 1990s found thatmen on average received higher grades than women during all three years, despite comparableLSAT scores and undergraduate GPA.44 Throughout all years of school, male students at Pennwere significantly more likely than women to be in the top 10% of the class and in the top half ofthe class. In contrast, no significant gender difference in grades has been found in some otherschools.45
The grade differences in our sample highlight the need for additional research. Althoughthe practical significance of the differences should not be exaggerated, the persistence of agender difference in 1L grades deserves attention. The finding that a student’s gender has astatistically significant effect on a variable as difficult to influence as course grades (because offactors such as blind-grading) suggests how pervasive an influence gender might be in manyfacets of legal education.46
More years of data would be helpful in assuring that the gender patterns that we found arerepresentative. Additionally, 1L course grades shed light on grade distributions generally, but donot allow us to see how students perform throughout their time at HLS. Anonymous sets ofgrades for individual students would show how students’ GPAs differ and whether the genderpattern changes by class year. Such information would also indicate whether male and female
42 See Wightman, supra note 1, at 17-24.43 See id. at 18-19.44 See, e.g., Guinier, supra note 1.45 See, e.g., Garrison et al., supra note 1.46 See generally Deborah A. Prentice & Dale T. Miller, When Small Effects are Impressive , 112 PSYCHOLOGICAL
BULLETIN 160 (1992).
Study on Women’s Experiences at Harvard Law School 28
students react differently to receiving high or low grades in their first semester of law school.Finally, in addition to shedding light on gender patterns, additional information would provideadditional insight into what grades are testing. Such reexamination of grading methods may alsohelp deal with the issue of many students’ complaints about arbitrary grades, which we heard infocus groups and optional survey answers.47 How this belief may influence studying andcommitment to classes is an important question for further research.48
Class Preparation and Attendance
“Law school was much easier than college. I had much more free timehere, since for most classes, I didn’t have to show up or do any work untilthe week before finals.”
-Male 3L
We found a gender difference on average in the amount of time 2L and 3L students – butnot 1Ls – in our survey sample reported spending preparing for courses. (See appendix XXXV)Marital status also appears to play an important role in preparation time. Second- and third-yearmen who had a spouse or significant other who lived locally reported spending significantlymore time on average preparing for class. This was not the case for women who had a spouse orsignificant other who lived locally. Further, this effect was limited to second- and third-yearstudents and to spouses and significant others who lived locally, rather than long-distance.
Additionally, students in our sample spent significantly less time on class preparationafter 1L year, and 2L/3L students who received higher grades their first semester 1L yearreported slightly greater preparation time.
We did not ask about time spent in relaxation or recreation. However, the LSAC studyfound that men reported spending significantly more hours per week than women on relaxationand recreation during the first year of law school.49
We also found no gender difference in class attendance rate in our 1L class monitoringsample. Approximately 84% of enrolled 1L women and men attended class meetings on average.Additionally, attendance rates for women and men in a course were significantly positivelycorrelated – that is, courses that had a higher percentage of enrolled women attending usuallyhad a higher percentage of enrolled men in attendance as well.
Course Selection
“I actually have had some very positive experiences in law school but mostof those have come from my clinical work (away from the law school), the
47 A 1L man wrote, “The seemingly random distribution of grades (people I know who did nothing—really, almostnothing—often did quite well while others who spent hundreds—really, hundreds—of hours didn’t) is disturbingand a bit disheartening.” A 2L woman commented, “As soon as you start not to have any faith in the equity ofgrades, it’s hard to really take it too seriously.”48 One possible response was captured by a 2L man’s comment that the emphasis on grades can “discouragestudents from taking intellectually stimulating courses.”49 See Wightman, supra note 1, at 43.

Study on Women’s Experiences at Harvard Law School 29
friends I have made here at Harvard, not from the classroom. Only in thosesettings am I reminded of who I really am and how much I have to offer.”
-Female 3L
Although we were unable to analyze course enrollment data from the Registrar’s Office,we gained some insight into course selection through our classroom participation monitoring andstudent surveys.
Attendance numbers for women and men that we collected during classroom monitoringprovide some information on course selection, albeit quite imperfect. There was a trend in oursample towards women being overrepresented in attendance in 2L/3L courses taught by women,but this was not uniform.
In our survey sample, we found gender differences in the likelihood of students planningto take clinical courses and advanced corporate law courses. Among 2L and 3L respondents,71% of women and 43% of men reported expecting to take a clinical course before graduating.Forty-six percent of men and 29% of women reported expecting to take multiple courses in thearea of corporate or commercial law. There was no overall gender difference for likelihood oftaking a negotiation class, but students of color were significantly more likely to take such acourse.
When we performed regressions and controlled for self-assessment of skills, careerexpectations, and career priorities, among other variables, gender did not have a significant effecton any of the course choices mentioned. (See appendix XXXVI) However, the interaction ofgender with career expectations and career values significantly affected the likelihood of takingmultiple courses in corporate or commercial law. Women who expected to work in a firm in 10years were much more likely to take multiple corporate/commercial courses while women whoidentified helping others as a top priority in their career were much less likely to take suchcourses. More exploration is needed into why these career values and expectations affect menand women differently in terms of course selection.
We also found some evidence that the more successful a student is in traditional measuresof academic achievement (e.g., higher 1L course grades or self-assessed legal reasoning ability),the less likely the student is to take arguably less traditional course offerings, such as clinical andnegotiation courses. The correlation between grades and course selection can be viewed as eitherpositive or negative depending on one’s view of the ultimate goals of legal education. To somedegree, grades provide feedback as to students’ talent and help students evaluate career options.On the other hand, such a correlation may mean that students who enter law school lessconfident in certain areas are inhibited from challenging themselves to develop important skills.
Further research on course selection would provide insight into whether certain students,both women and men, are in effect creating alternative curricula for legal education through theircourse selection choices. Knowing the student composition of elective courses, includingclinicals, would allow us to investigate whether women and men select electives differently, andwhether factors such as professor’s gender, professor’s teaching style or class size are influential.
Study on Women’s Experiences at Harvard Law School 30
E. EMPLOYMENT AND CAREER PRIORITIES
“I think most people would choose Harvard again because of theopportunities it opens up, but that doesn't mean they are enjoying lawschool at all.”
-Male 3L
“Why can't everyone just relax a little? Of course, getting emails every dayabout career panels, resume workshops, and interviewing techniquesessions doesn't help ease anyone's single-minded focus on landing big-money jobs.“
-Female 1L
Employment
Women were more likely than men to do public interest work during their summers andafter graduation. Public interest is broadly defined to include government, non-profit and legalservices work. According to information received from the Office of Public Interest Advising,women were more likely than men to work in public interest jobs during their 1L summer(approximately 33% v. 25%). This difference persisted for the 2L summer, when between 7-15%of women and 3-8% of men worked in the public interest field.
Women were similarly more likely than men to take public interest employment aftergraduation. Although only a small percentage of the student body is initially employed in apublic interest job, this group includes approximately twice as many women as men. For theclasses graduating from 1998 to 2003, 5% of men and 10% of women took public interestemployment after graduation or a clerkship. (See appendix XXXVII) We similarly found thatmore women than men are enrolled in the Low-Income Protection Plan, with women making up55% of LIPP enrollees for the past six years. (See appendix XXXVIII) These gender differencescomport with studies nationwide, which generally find women choosing public interest workinitially in higher rates than men.50
Despite more public interest post-graduate employment among women, women and menwent into law firms in percentages similar to their composition in the graduating class over thepast six years. Overall, 64% of all students graduating between 1998 and 2002 initially workedin a law firm. This similar rate is largely a product of more men than women going directly intobusiness. As a result, limiting the sample to those students planning on pursuing law may mask agender difference in private practice employment.
We were unable to investigate whether gender differences exist in the compensation orsubject matter of the work for students whose initial jobs were at private firms. In terms of
50 See, e.g. , NATIONAL ASSOCIATION FOR LAW PLACEMENT, COURTING CLERKSHIPS: T HE NALP J UDICIAL
CLERKSHIP STUDY (2000), available at http://www.nalp.org/nalpresearch/clrksumm.htm (finding that 4.0% and1.5% of women and men, respectively, in the class of 1998 worked in public interest as their first job after lawschool).

Study on Women’s Experiences at Harvard Law School 31
salary, the information provided by OCS suggests no overall gender difference for initial post-graduate employment.
A related question that we could not explore is whether men and women are treateddifferently by law firms and other employers. A study at UCLA Law School found a genderdifference in the number of call-back interviews that students received.51 After controlling forGPA and law review membership, the UCLA study found that interviewers were more likely tooffer call-backs to second-year women than men. Further study is needed to investigate whetherthese results are representative as well as whether the gender differential reflects women’sapplying for less prestigious employers than men, disparate treatment by employers or otherfactors.
Clerkships
Overall, women clerked in rates similar to their percentage in the student body, but therewere differences in where men and women clerked. According to OCS data, approximately 24%of all graduates from 1998 to 2003 initially worked as judicial clerks. Forty-three percent of thestudents who clerked were women. However, only 36% of HLS clerks at the U.S. SupremeCourt and Circuit Courts of Appeals were women during this time period. In contrast, womenclerk at higher rates in federal district and state courts. (See appendix XXXIX).
Research by NALP suggests a similar trend nationwide. During 1994-1998, women madeup a slight majority (50.2%) of the clerkship population but were underrepresented in federalclerkships (45.7%).52
We do not have enough information to know why there is a gender difference inclerkship placement levels. Women may be actively choosing state courts and U.S. DistrictCourts because they offer different types of experiences, which is similar to their seeminglyhigher rates of taking clinicals. Alternatively, women may be self-selecting out of applying forfederal appellate courts because of fewer strong faculty contacts, lower self-esteem, lessacademic success or scarcity of role models to whom they can relate.53 Women may also be lessflexible in terms of clerking because of personal preference or commitments (e.g., geographicalconstraints), or women and men may be applying at comparable rates to all courts, but receivingdifferential treatment in the selection process.54
Career Values and Priorities
“I thought that I would come here and become much more focused andcareer-oriented, but I think I’ve actually done the opposite. I’ve realized
51 David Eaves, I.P.L. Png & J. Mark Ramseyer, Gender, Ethnicity and Grades: Empirical Evidence ofDiscrimination in Law-Firm Interviews, 7 LAW & INEQ. 189 (1989).52 NALP, supra note 50.53 See, e.g. , Krauskopf, supra note 1 (On student survey, 45% of women overall and 64% of minority womenstudents reporting feeling deprived of role models by the scarcity of women professors.)54 See, e.g. , NALP, supra note 50 (finding in their surveys – responded to by 11% of the sample pool targeted – agender differential in rate of receiving a clerkship offer for those who applied. Sixty-six percent of women whoapplied for clerkships received an offer, compared with 74% of men).

Study on Women’s Experiences at Harvard Law School 32
how important a balance is to me, and that I will not be happy just having aone track life and putting my career first.”
-Female 1L
“I was shocked…at how little students care about making a difference inpeople’s lives with their law degree.”
-Male 1L
Women and men in our sample differed significantly in the factors they selected as mostimportant to them in their careers, even after controlling for demographic variables. Womenwere much more likely than men to choose “helping others” as a career priority. Forty-onepercent of women chose this as one of the three most important factors for their career, comparedwith 22% of men. Additionally, women were more likely than men to choose “advancingideological goals” and less likely to choose “high salary.”
Our results also suggest changes to students’ career priorities during law school,particularly for men. For instance, 2L and 3L men were less likely to choose “helping others”than were 1L men. Further research in this area, especially longitudinal studies, would behelpful.
Differences in career values seem to result in a gender difference in long-term careerexpectations, but not in immediate job plans. Women in our 2L and 3L survey were significantlyless likely than men to expect to be at a firm or in-house in 10 years,55 when controlling fordemographics. However, controlling for choice of career priorities eliminated the genderdifference in 10-year career expectations. No such gender difference existed in initial jobexpectations.
Surveys of incoming students at other law schools have found that women were morelikely than men on average to identify altruistic factors for attending law school56 and to plan topursue public interest work after graduation.57 However, during the course of law school, thegender difference in career ambitions seemed to diminish, although not entirely.58 For instance,surveys at University of Pennsylvania found that over 25% of women and 7% of men enteringlaw school wanted to pursue public interest law; by graduation, the percentage of femalerespondents interested in a career in public interest dropped to about 9%, while men’s ratesstayed the same.59 Surveys of law school graduates have also found that women are more likelyto identify work/life balance as one of the top reasons they chose their current employer.60
Assuming the gender difference in career priorities is real, a key question becomes howwell students are matched with employers. This question is of critical importance for bothindividuals and employers because of the personal and economic costs of job dissatisfaction and 55 Wightman, supra note 1, at 61-62.56 Diacoff, supra note 31, at 1392. See also Krauskopf, supra note 1; Taber, supra note 1.57 See, e.g., Guinier, supra note 1.58 Taber, supra note 1.59 Guinier, supra note 1.60 See, e.g., CATALYST, WOMEN IN LAW: MAKING THE CASE (2003) (45% of women and 34% of men surveyed citedwork/life balance as a top reason for their choosing their employer.).

Study on Women’s Experiences at Harvard Law School 33
switching. Women may be being matched with employers worse than men, as some research oflegal professionals has found higher dissatisfaction and expectations of leaving employers earlierfor women than men.61 Although students certainly are responsible for their career choices, lawschools can play an important role in assisting students’ decisionmaking processes – such as byhelping make options available to students, assisting with information gathering and being abargaining agent on behalf of students where collective action costs are great. Law schoolsshould also consider if and how the school itself may be influencing students’ career values.
61 See, e.g. , id. (finding from a survey of 1,400 law graduates that women respondents intended to remain at theircurrent employer for three fewer years than men).

Study on Women’s Experiences at Harvard Law School 34
V. CONCLUSION
Overall, we found significant gender differences in a wide range of areas at Harvard LawSchool. Although we collected and analyzed a great deal of data, the comprehensiveness of thestudy was limited by resources, access to information, and opportunity. In light of our findingsand our experience in conducting the study, we believe further research would be helpful. Someareas of particular relevance include student-faculty interaction, student social life andlongitudinal changes in students’ career expectations and confidence. Additionally, although wedid not focus on race, some of our results suggest that women of color may have significantlydifferent experiences at HLS than white women and men of color, which deserves furtherinvestigation.62
This study does not claim to provide a comprehensive overview of the incredible range ofexperiences of students at Harvard Law School. The differences we found represent averages.To assume our findings characterize the experiences of all students would be just asinappropriate as to assume our findings shed no light on student experiences. Rather, byidentifying substantial differences along one important dimension – gender – we hope not only tobring additional light to that dimension but also to provide a lens on student experiencesgenerally. As a result, the HLS community should consider focusing not only on genderdifferences but also on the potential broader issues of which gender differences may be amanifestation. Some differences we found may suggest different ways of viewing particularfacets of the student experience. In this sense, discussion of women’s experiences may assist inHarvard Law School’s continuing efforts to reassess a range of related practices to assure that allstudents can maximally contribute to and gain from the academic experience. Some of thegender differences should raise questions about whether the institution is equally hospitable forthe learning and career development of all students; other differences, such as areas wherewomen are “overrepresented,” could indicate experiences and career pathways that all studentsmight benefit from more seriously considering. As a 1L woman suggested in the survey’soptional space, “As individual students and as a community, we have to talk about why we dothe things we do, and understand for ourselves what we are committed to, and why those projectsare the best for us…. It is as much a personal challenge as it is a challenge for the administrationand institution of the law school.” Reassessment need not require costly, elaborate studies.Informal investigation, commitment to discussion, and small-scale experimentation can provide agood start and will help make sure that the rigor and analysis that characterizes classroomdiscussion applies to a discussion of the school itself. We hope that the information from thisstudy helps provide a more concrete foundation for the Harvard Law School community’scontinuing dialogue on the school, legal education and student experiences.
62 For instance, among survey respondents, women of color were less likely to say they would choose HLS again,even though there was no difference in their answer to whether they would attend law school again. Other studieshave similarly found that race substantially influences the way many women experience law school. See, e.g.,Krauskopf, supra note 1, at 325 (31% of women of color respondents reported being dissatisfied or very dissatisfiedwith their law school experience, compared with 18% of women and 12% of men overall.).

Appendix I
Instructions for Classroom Participation Monitoring Form
The daily observations sheets you fill out will provide us with useful statistics about faculty-studentinteractions in classroom settings. It is therefore extremely important that the sheets are filled out asaccurately as possible. Please familiarize yourself with the directions below, and direct any questionsto Suzanne Katzenstein (***) or Sharon Kelly (***).
(1) Attendance: It is extremely important to collect information about student attendance for eachclass observed. If counting students and monitoring at the same time is too burdensome, please asksomeone reliable to collect and report this information to you at the end of each class.
(2) Filling out the table :
i. Comment Number: Each time a student begins to speak, begin to record information on a new row.The only time in which a new row is not begun is when the student and professor interrupt oneanother, or the student only says a word or two. These types of exchanges are considered “rapid fire”and are considered as one comment.
ii. Iteration Column: Please indicate the “comment number” in the Iterations column. For example,imagine that the second comment made in class is spoken by student X, and that this is X’s firstcomment during that class. The second row iteration’s column should be marked “I”, for initialcomment. If student X makes the fourth comment later in class, the iterations column of the fourthrow should be marked “S2”, for same as commenter 2. If the 10th comment is made by that samestudent, please write in the 10th row’s iterations column “S2” as well. Please pay as much attention aspossible to ‘repeat students’ – making whatever notes necessary in the identifier column (their initialsor some random letter, etc.) to help yourself keep track of students who participate multiple times.
iii. Identifier Column: The identifier column will be critical for helping us to compile informationabout ‘‘repeat players’ within a class, over the observation period. For this reason, it is important thatyou use consistent identifiers throughout the observation period. (Initials, for example, are a goodidentifier, shirt color is not – assuming student X changes his/her clothes on a regular basis). Pleasenote that the purpose of this study is not to accumulate information about specific individuals. Anyidentifying notes you make about individual students will be examined for quantitative purposes only,and the sheets will remain confidential.63
iv. Sex: If the same student, a female for example, is responsible for comments 1-8, you only need tofill out the sex column for Comment Number 1. The Iteration column for rows 2-8 will do the rest ofthe work for you, as they will be marked with “S1” and so it will be clear that the student is female.
v. Method of Participation: Again, if a student is being grilled by a professor socratically fornumerous comments in a row, no need to write “S” repeatedly. You can do so later, or draw an arrowlater.
vii. On Panel: If your class is on a panel system, please note, to the extent possible, who is on panelfor that day, so that you can mark “Y” when appropriate in the “On Panel?” column. Please staple to
this sheet a list of panel members for the day’s class. To the extent possible, please add initials ofpanel participants.
63 This paragraph was included on 1L instruction sheets only.

Appendix II
Classroom Participation Monitoring Form
Course _________________Professor _________________Date _________________Monitor _________________
Number of students present:Male _________Female _________
CommentNumber
Iteration(e.g., I, S5)
Sex(M/F)
Method of Participation(V=volunteer; S = nonvolunteer On Panel Notes and Identifiers
12
3
4
5
6
7
8
9
10
11
12
13
14
15
16
17
18
19
20
21
22
23
24
25
26
27
28
29
30

Study on Women’s Experiences at Harvard Law School 37
Appendix III
Participation Monitoring, Overall Sample Summary
1L 2L/3L Total
No. of courses monitored 14 18 32
No. of class meetings 81 109 190
No. of women in attendance 2,390 3,470 5,860
No. of men in attendance 2,944 4,217 7,161
No. of comments 3,965 3,866 7,831
No. of volunteered comments 1,877 1,645 3,522
No. of exchanges 2,112 2,148 4,260
No. of volunteered exchanges 1,533 1,397 2,931
No. of students participating at least oncein a class meeting
1,400 1,466 2,866
No. of students voluntarily participatingat least once in a class meeting
1,050 1,015 2,065
No. of students making three or moreexchanges in a class meeting
147 142 289
No. of students making three or morevolunteered exchanges in a class meeting
79 59 138
Description of the sample monitored and the overall number of different types ofparticipation recorded. The participation information for 1L classes here was analyzed inthe same way as for 2L/3L classes (by class meeting) rather than using the more detailedinformation we had concerning 1L courses, where student identifiers were consistentacross all class meetings and courses.
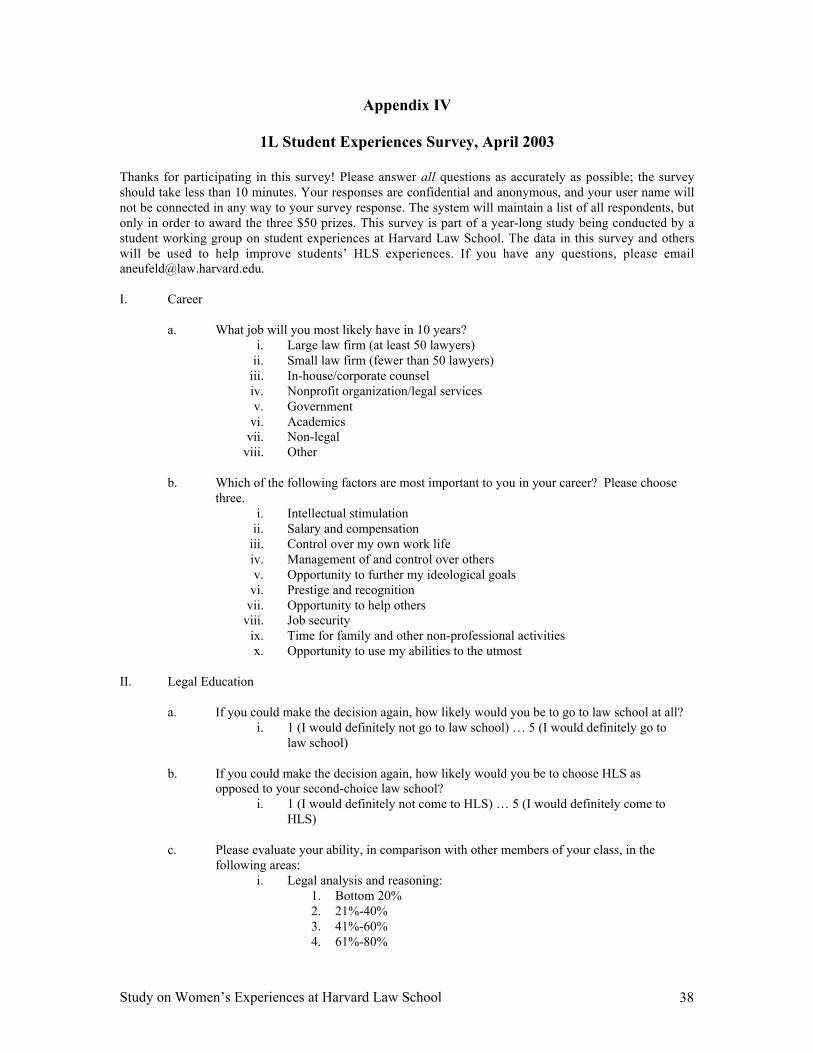
Study on Women’s Experiences at Harvard Law School 38
Appendix IV
1L Student Experiences Survey, April 2003
Thanks for participating in this survey! Please answer all questions as accurately as possible; the surveyshould take less than 10 minutes. Your responses are confidential and anonymous, and your user name willnot be connected in any way to your survey response. The system will maintain a list of all respondents, butonly in order to award the three $50 prizes. This survey is part of a year-long study being conducted by astudent working group on student experiences at Harvard Law School. The data in this survey and otherswill be used to help improve students’ HLS experiences. If you have any questions, please [email protected].
I. Career
a. What job will you most likely have in 10 years? i. Large law firm (at least 50 lawyers) ii. Small law firm (fewer than 50 lawyers) iii. In-house/corporate counsel iv. Nonprofit organization/legal services v. Government vi. Academics vii. Non-legal viii. Other
b. Which of the following factors are most important to you in your career? Please choosethree.
i. Intellectual stimulation ii. Salary and compensation iii. Control over my own work life iv. Management of and control over others v. Opportunity to further my ideological goals vi. Prestige and recognition vii. Opportunity to help others viii. Job security ix. Time for family and other non-professional activities x. Opportunity to use my abilities to the utmost
II. Legal Education
a. If you could make the decision again, how likely would you be to go to law school at all? i. 1 (I would definitely not go to law school) … 5 (I would definitely go to
law school)
b. If you could make the decision again, how likely would you be to choose HLS asopposed to your second-choice law school?
i. 1 (I would definitely not come to HLS) … 5 (I would definitely come toHLS)
c. Please evaluate your ability, in comparison with other members of your class, in thefollowing areas:
i. Legal analysis and reasoning:1. Bottom 20%2. 21%-40%3. 41%-60%4. 61%-80%

Study on Women’s Experiences at Harvard Law School 39
5. Top 20% ii. Legal research: iii. Brief writing: iv. Persuading others: v. Recognizing and resolving ethical dilemmas: vi. Thinking well on your feet: vii. Building consensus and resolving disagreements among people with
different viewpoints: viii. Quantitative problem solving, as in finance and economics:
III. Extracurricular Activities
a. How probable is it that you will apply for: i. Law Review?
1. 1 (Definitely not) … 4 (Undecided) … 7 (Definitely) ii. Legal Aid Bureau? iii. BSA?
b. If you were to apply, how probable do you think it is that you would be selected for: i. Law Review?
1. 1 (Definitely not) … 7 (Definitely)2. Unsure
ii. Legal Aid Bureau? iii. BSA?
IV. Classroom
a. What grade do you think you deserved, based on your understanding of the material andyour preparation for the exam, in each of your classes last semester? (For this questionand next, please ignore the class you did not take last semester.)
i. Civil Procedure?1. A+ … F
ii. Contracts? iii. Criminal Law? iv. Torts?
b. Compared to what you think you deserved, how satisfied are you with the grade youreceived in each of your classes last semester?
i. Civil Procedure?1. 1 (Very disappointed) … 5 (Very pleasantly surprised)
ii. Contracts? iii. Criminal Law? iv. Torts?
c. On average, how much time per week do you spend preparing for each of your 1Lcourses this semester?
i. 0-2 hours per week ii. 3-5 hours per week iii. 6-8 hours per week iv. 9-11 hours per week v. 12 or more hours per week
d. How does this compare to last semester? i. 1 (Much less) … 3 (Same) … 5 (Much more)
e. On average, how often do you expect to attend class for your 1L courses this semester?

Study on Women’s Experiences at Harvard Law School 40
i. Attend every class ii. Miss 1-2 classes total this semester iii. Miss 3-5 classes total this semester iv. Miss 6-10 classes total this semester v. Miss 11 or more classes total this semester
f. How does this compare to last semester? i. 1 (Much less) … 3 (Same) … 5 (Much more)
g. Taking everything into account, how satisfied are you with your overall experience ineach of your classes this semester? (For this question and next, please ignore the classyou are not taking this semester.)
i. In your elective?1. 1 (Very dissatisfied) … 3 (Neutral) … 5 (Very satisfied)
ii. In Property? iii. In Torts? iv. In Criminal Law? v. In Contracts?
h. In what percentile of your class do you think your spring grade will most likely fall? i. In Property?
1. Bottom 20%2. 21%-40%3. 41%-60%4. 61%-80%5. Top 20%
ii. In Torts? iii. In Criminal Law? iv. In Contracts?
V. Demographics
a. What first-year section are you in? i. 1, 2, 3, 4, 5, 6, 7
b. What year did you finish college? ___
c. What was your undergraduate major? (Check more than one if you double- or triple-majored.)
i. Social sciences (e.g., political science, international relations, sociology,anthropology, psychology)
ii. Humanities (e.g., languages, history, English, women’s studies, ethnicstudies, philosophy)
iii. Arts (e.g., visual arts, music) iv. Economics and finance (e.g., business, economics) v. Quantitative studies (e.g., math, statistics) vi. Biological and physical sciences (e.g., chemistry, physics, biology,
engineering) vii. Other
d. What is your gender? i. Male ii. Female
e. Do you identify yourself as: (optional; check all that apply)

Study on Women’s Experiences at Harvard Law School 41
i. African ii. African-American iii. American Indian or Alaska Native iv. Asian v. Asian-American vi. Latino/a vii. Native Hawaiian or Pacific Islander viii. White ix. Other
f. Are you: i. Single ii. In a committed relationship, local iii. In a committed relationship, long distance iv. Married or domestic partnership, local v. Married or domestic partnership, long-distance
g. Please select the highest educational level attained by any of your parents. i. Graduate or professional degree. ii. College degree. iii. High school degree. iv. Some high school. v. Less than high school
VI. This survey has tried to assess students’ experiences at HLS. Please use the space below toprovide any comments or details of your experiences that you feel have not been captured in thesurvey.
i. ________
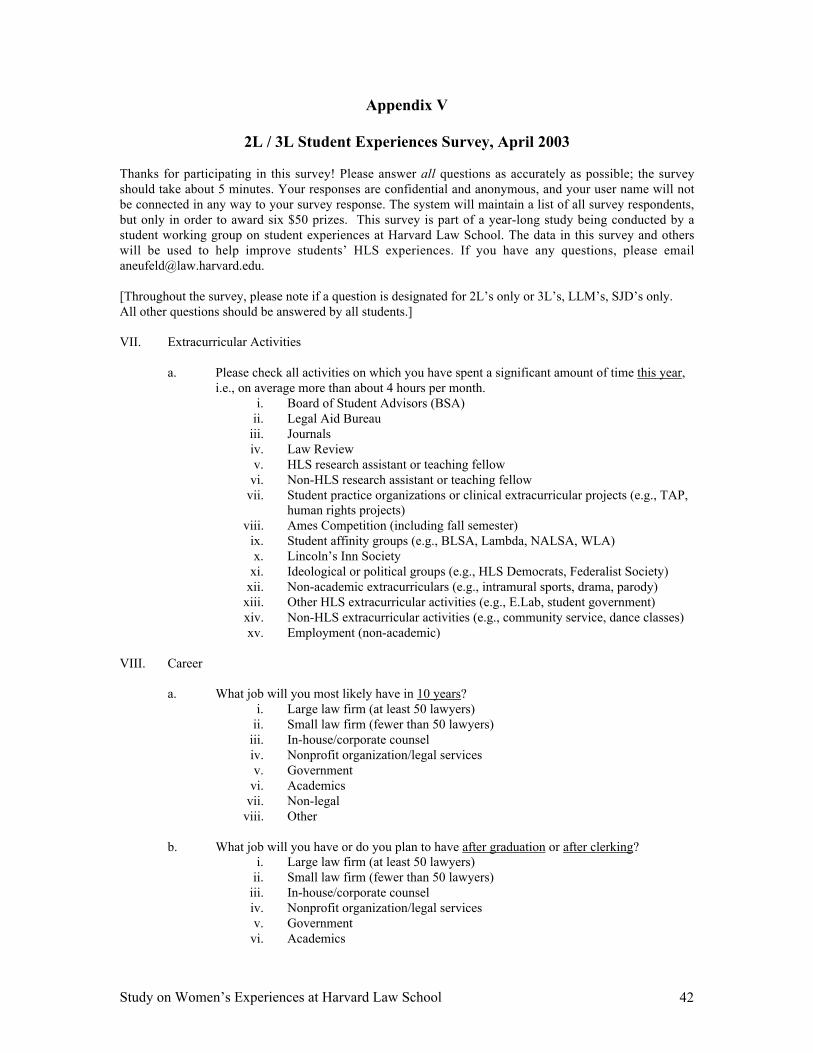
Study on Women’s Experiences at Harvard Law School 42
Appendix V
2L / 3L Student Experiences Survey, April 2003
Thanks for participating in this survey! Please answer all questions as accurately as possible; the surveyshould take about 5 minutes. Your responses are confidential and anonymous, and your user name will notbe connected in any way to your survey response. The system will maintain a list of all survey respondents,but only in order to award six $50 prizes. This survey is part of a year-long study being conducted by astudent working group on student experiences at Harvard Law School. The data in this survey and otherswill be used to help improve students’ HLS experiences. If you have any questions, please [email protected].
[Throughout the survey, please note if a question is designated for 2L’s only or 3L’s, LLM’s, SJD’s only.All other questions should be answered by all students.]
VII. Extracurricular Activities
a. Please check all activities on which you have spent a significant amount of time this year,i.e., on average more than about 4 hours per month.
i. Board of Student Advisors (BSA) ii. Legal Aid Bureau iii. Journals iv. Law Review v. HLS research assistant or teaching fellow vi. Non-HLS research assistant or teaching fellow vii. Student practice organizations or clinical extracurricular projects (e.g., TAP,
human rights projects) viii. Ames Competition (including fall semester) ix. Student affinity groups (e.g., BLSA, Lambda, NALSA, WLA) x. Lincoln’s Inn Society xi. Ideological or political groups (e.g., HLS Democrats, Federalist Society) xii. Non-academic extracurriculars (e.g., intramural sports, drama, parody) xiii. Other HLS extracurricular activities (e.g., E.Lab, student government) xiv. Non-HLS extracurricular activities (e.g., community service, dance classes) xv. Employment (non-academic)
VIII. Career
a. What job will you most likely have in 10 years? i. Large law firm (at least 50 lawyers) ii. Small law firm (fewer than 50 lawyers) iii. In-house/corporate counsel iv. Nonprofit organization/legal services v. Government vi. Academics vii. Non-legal viii. Other
b. What job will you have or do you plan to have after graduation or after clerking? i. Large law firm (at least 50 lawyers) ii. Small law firm (fewer than 50 lawyers) iii. In-house/corporate counsel iv. Nonprofit organization/legal services v. Government vi. Academics

Study on Women’s Experiences at Harvard Law School 43
vii. Non-legal viii. Other ix. Unknown
c. Have you applied or do you plan to apply for a clerkship? At what level(s)? Please checkall that apply.
i. I do not plan to apply for a clerkship. ii. U.S. Supreme Court clerkship iii. Federal Court of Appeals clerkship iv. Federal District Court clerkship v. State supreme court (or highest court) clerkship vi. State intermediate appellate court clerkship vii. State trial court clerkship viii. Other
d. [3L’s, LLM’s, and SJD’s only.] Will you be clerking after graduation? At what level(s)?(Check all that apply.)
i. I will not clerk after graduation. ii. U.S. Supreme Court clerkship iii. Federal Court of Appeals clerkship iv. Federal District Court clerkship v. State supreme court (or highest court) clerkship vi. State intermediate appellate court clerkship vii. State trial court clerkship viii. Other ix. Not sure
e. [2L’s only] What job will you have this summer? (Please check all that apply.) i. Large law firm (at least 50 lawyers) ii. Small law firm (fewer than 50 lawyers) iii. In-house/corporate counsel iv. Nonprofit organization/legal services v. Government vi. Academics vii. Non-legal viii. Other ix. No job x. Unknown
f. Of the summer jobs or post-graduation/ post-clerkship jobs you applied for, is the job youtook your:
i. Top choice ii. Among your top choices iii. Among your middle choices iv. Among your bottom choices v. N/A
g. Please list the faculty members, if any, that you have asked or plan to ask for a referenceor letter of recommendation.
i. ____________________
h. Which of the following factors are most important to you in your career? Please choosethree.
i. Intellectual stimulation ii. Salary and compensation iii. Control over my own work life

Study on Women’s Experiences at Harvard Law School 44
iv. Management of and control over others v. Opportunity to further my ideological goals vi. Prestige and recognition vii. Opportunity to help others viii. Job security ix. Time for family and other non-professional activities x. Opportunity to use my abilities to the utmost
IX. Legal Education
a. If you could make the decision again, how likely would you be to go to law school at all? i. 1 (I would definitely not go to law school) … 5 (I would definitely go to
law school)
b. If you could make the decision again, how likely would you be to choose HLS asopposed to your second-choice law school?
i. 1 (I would definitely not come to HLS) … 5 (I would definitely come toHLS)
c. Please evaluate your ability, in comparison with other members of your class, in thefollowing areas:
i. Legal analysis and reasoning:1. Bottom 20%2. 21%-40%3. 41%-60%4. 61%-80%5. Top 20%
ii. Legal research: iii. Brief writing: iv. Persuading others: v. Recognizing and resolving ethical dilemmas: vi. Thinking well on your feet: vii. Building consensus and resolving disagreements among people with
different viewpoints: viii. Quantitative problem solving, as in finance and economics: ix. Oral argument:
d. Did you apply to or compete for: i. Board of Student Advisors (BSA) ii. Legal Aid Bureau iii. Law Review iv. HLS-administered writing prize (e.g., Olin Prize) v. Other HLS academic competitions vi. Other non-HLS academic competitions
X. Classroom
a. Please check all course groupings in which you have taken multiple courses or plan totake multiple courses.
i. Corporate and Commercial Law ii. International, Comparative, Human Rights and Foreign Law iii. Constitutional Law and Jurisprudence iv. Criminal Law and Procedure v. Legal Profession/Legal Ethics/Professional Responsibility vi. Legal History and Jurisprudence vii. Intellectual Property and Cyberlaw/ Technology

Study on Women’s Experiences at Harvard Law School 45
viii. Government Lawyering (e.g., Local Government Law, Administrative andRegulatory Law)
ix. Other domestic subspecialty (e.g., health, family, education, employment,civil rights, or environmental law)
b. Have you taken a: i. Clinical class? ii. Negotiation, Mediation, or ADR class?
c. Have you cross-registered or do you plan to cross-register for classes outside HLS? If so,how many?
i. I have not cross-registered and do not plan to cross-register for any courses. ii. I have cross-registered or plan to cross-register for 1-2 courses. iii. I have cross-registered or plan to cross-register for 3-4 courses. iv. I have cross-registered or plan to cross-register for 5 or more courses.
d. On average, how much time per week do you spend preparing for each of your coursesthis semester?
i. 0-2 hours per week ii. 3-5 iii. 6-8 iv. 9-11 v. 12 and above
e. How does this compare to your first semester, 1L year? i. 1 (Much less) … 4 (Same) … 7 (Much more)
f. On average, in what percentile of your classes do you think your grades this semester willmost likely fall? (Only include HLS classroom courses.)
i. Top 20%… Bottom 20%
g. What was the highest grade you received for your 1L first semester courses? i. A+…F
h. What was the lowest grade you received for your 1L first semester courses? i. A+…F
XI. Demographics
a. What is your academic status? (Please check all that apply.) i. 2L ii. 3L iii. LLM iv. SJD v. Visiting scholar/researcher vi. Joint degree candidate
b. What year did you finish college? ___
c. What was your undergraduate major? (Check more than one if you double- or triple-majored.)
i. Social sciences (e.g., political science, international relations, sociology,anthropology, psychology)
ii. Humanities (e.g., languages, history, English, women’s studies, ethnicstudies, philosophy)

Study on Women’s Experiences at Harvard Law School 46
iii. Arts (e.g., visual arts, music) iv. Economics and finance (e.g., business, economics) v. Quantitative studies (e.g., math, statistics) vi. Biological and physical sciences (e.g., chemistry, physics, biology,
engineering) vii. Other
d. What is your gender? i. Male ii. Female
e. Do you identify yourself as: (optional; check all that apply) i. African ii. African-American iii. American Indian or Alaska Native iv. Asian v. Asian-American vi. Latino/a vii. Native Hawaiian or Pacific Islander viii. White ix. Other
f. Are you: i. Single ii. In a committed relationship, local iii. In a committed relationship, long distance iv. Married or domestic partnership, local v. Married or domestic partnership, long-distance
g. What first-year section were you in? i. 1…7
h. Please select the highest educational level attained by any of your parents. i. Graduate or professional degree. ii. College degree. iii. High school degree. iv. Some high school. v. Less than high school
XII. This survey has tried to assess students’ experiences at HLS. Please use the space below toprovide any comments or details of your experiences that you feel have not been captured in thesurvey.
i. ________

Study on Women’s Experiences at Harvard Law School 47
Appendix VI
1L Student Experiences Survey, December 2002
Thank you very much for participating in this survey! Please answer as accurately as possible; the surveyshould take less than 10 minutes. Your responses are confidential and anonymous, and your user name willnot be connected in any way to your survey response. The system will maintain a list of all respondents, butonly in order to award the three $50 prizes. This survey is part of a year-long study being conducted by astudent working group on student experiences at Harvard Law School. The data in this survey will be usedto help improve students’ HLS experiences.
XIII. Career
a. What job will you most likely have in 10 years? i. Large law firm (more than 50 lawyers) ii. Small law firm (fewer than 50 lawyers) iii. In-house/corporate counsel iv. Nonprofit organization/legal services v. Government vi. Academics vii. Non-legal viii. Other
b. Of the following factors, which is the most important consideration in your career plans? i. Advancing a cause you believe in ii. High salary iii. Work/life balance
XIV. Classroom
a. In what percentile of your class do you think your grade will most likely fall? (For thisquestion and the rest of the survey, please ignore the class you are not taking thissemester.)
i. Civil Procedure?1. Bottom 20%2. 21%-40%3. 41%-60%4. 61%-80%5. Top 20%
ii. Contracts? iii. Criminal Law? iv. Torts?
b. Taking everything into account, how satisfied are you with your overall experience ineach of your classes?
i. Civil Procedure?1. 1 (Very dissatisfied) … 3 (Neutral) … 5 (Very satisfied)
ii. Contracts? iii. Criminal Law? iv. Torts?
XV. Faculty Interaction
a. Approximately how many times this semester have you interacted with each of yourprofessors outside of class? (Please exclude interactions regarding purely administrative

Study on Women’s Experiences at Harvard Law School 48
issues. Include things such as emails, talking before and after class, office hours, andstudent-initiated lunches. Note that there are sixteen weeks of classes per semester.)
i. Civil Procedure?1. 0…16, 17-32, 33-64 interactions this semester
ii. Contracts? iii. Criminal Law? iv. Torts?
XVI. Extracurricular Activities
a. Please estimate the number of hours you spend per month on each of the followingactivities. (Please include time spent at social activities sponsored by the group ororganization you are a member of.)
i. on journals?1. 0…20, 21-40, 41-60, 61-80, 81-100 hours per month
ii. on student practice organizations (e.g., TAP, Defenders, PLAP) or clinicalprojects?
iii. on student affinity groups (e.g., BLSA, Lambda, NALSA)? iv. on other law-school extracurricular activities?
b. How probable is it that you will seek a higher-up position or a position in any of yourlaw-school-related activities in the future?
i. 1 (Definitely not) … 4 (Undecided) … 7 (Definitely)
c. How probable is it that you will apply for Law Review? i. 1 (Definitely not) … 4 (Undecided) … 7 (Definitely)
XVII. Social Life
a. Approximately how many close friends do you have? (A close friend is someone whoyou made social plans with or contacted socially within the last two weeks. Please do notinclude a significant other.)
i. … within your 1L section?1. 0…20, 21-30, 31-40, 41-50, 51-60 close friends
ii. … who are 1Ls but not in your section? iii. … who are 2Ls, 3Ls, or LLMs at HLS? iv. … who are not at HLS (whether local or not)?
b. How many times this semester have you participated in a study group? (Note that thereare 16 weeks of classes per semester.)
i. 0…16, 17-32, 33-64 study groups this semester
c. Please estimate how many times per month you go to HLS-related social events (e.g., BarReviews, ice cream socials):
i. 0…16, 17-32, 33-64 times per month
d. To what extent do you agree with the following statement: “I feel that I have to changemyself to fit in at HLS.”
1. 1 (Definitely disagree) … 4 (Neutral) … 7 (Definitely agree)
XVIII. Demographics
a. What first-year section are you in? i. 1, 2, 3, 4, 5, 6, 7.
b. What year did you finish college? ___

Study on Women’s Experiences at Harvard Law School 49
c. What is your gender? i. Male ii. Female
d. Do you identify yourself as a: (check all that apply) i. African-American or African ii. American Indian or Alaska Native iii. Asian-American or Asian iv. Latino/a v. Native Hawaiian or Pacific Islander vi. White vii. Other
e. What are your personal relationships and commitments? i. Single. ii. Committed relationship, local. iii. Committed relationship, long distance. iv. Married or domestic partnership, local. v. Married or domestic partnership, long-distance.
f. Please select the highest educational level attained by any of your parents. i. Graduate or professional degree. ii. College degree. iii. High school degree. iv. Some high school. v. Less than high school
XIX. This survey has tried to assess students’ experiences at HLS. Please use the space below toprovide any comments or details of your experiences that you feel have not been captured in thesurvey.
i. ________

Study on Women’s Experiences at Harvard Law School 50
Appendix VII
Student Surveys, Summary of Sample Demographics
April 2003 December 2002
2L/3L 1L 1L
No. of respondents 411 278 289
Female 53% 52% 45%
Students of color 25% 29% 32%
Left race blank 4% 6% 4%
In committedrelationship/marriage – local
34% 28% 26%
In committedrelationship/marriage – long-distance
21% 23% 29%
Parent with graduate degree 73% 73% 71%
Parent with a college degree, butnot a graduate degree
19% 19% 19%
Social sciences undergraduatemajor
49% 46% N/A
Humanities undergraduate major 40% 36% N/A
Finance/economics undergraduatemajor
19% 21% N/A
Biological sciences undergraduatemajor
10% 12% N/A
Summary of demographics of respondents for the student surveys conducted in April2003 and December 2002.
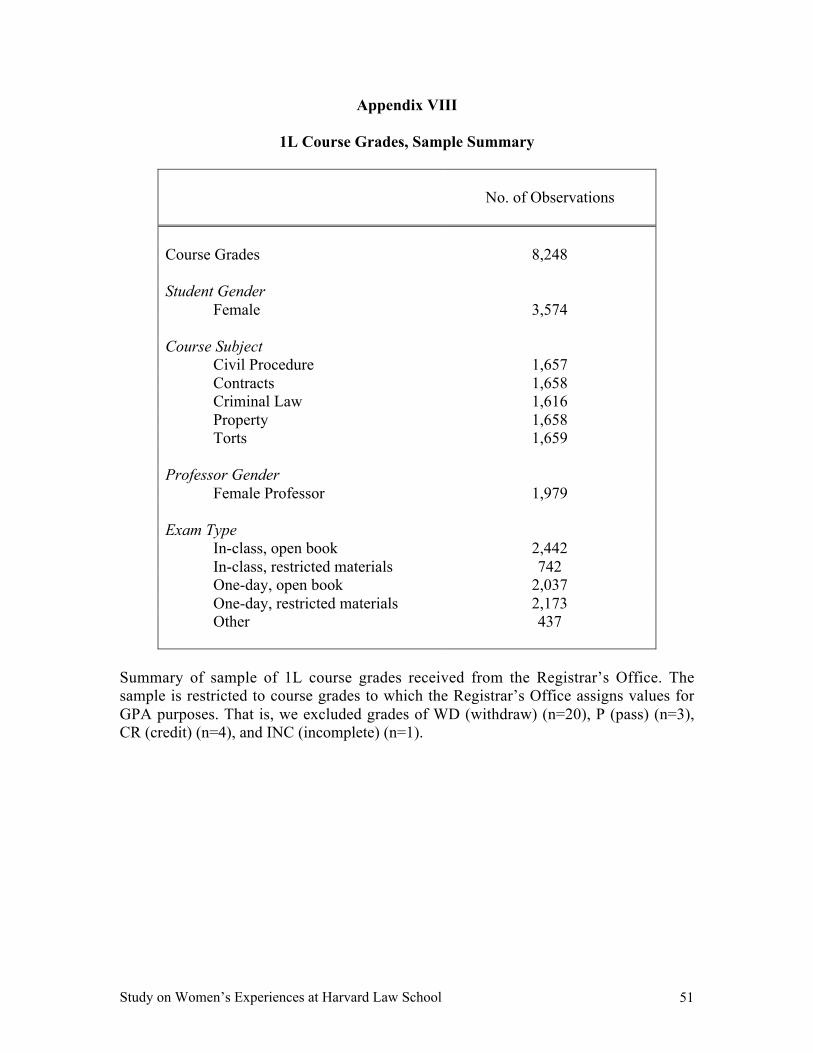
Study on Women’s Experiences at Harvard Law School 51
Appendix VIII
1L Course Grades, Sample Summary
No. of Observations
Course Grades 8,248
Student GenderFemale 3,574
Course SubjectCivil Procedure 1,657Contracts 1,658Criminal Law 1,616Property 1,658Torts 1,659
Professor GenderFemale Professor 1,979
Exam TypeIn-class, open book 2,442In-class, restricted materials 742One-day, open book 2,037One-day, restricted materials 2,173Other 437
Summary of sample of 1L course grades received from the Registrar’s Office. Thesample is restricted to course grades to which the Registrar’s Office assigns values forGPA purposes. That is, we excluded grades of WD (withdraw) (n=20), P (pass) (n=3),CR (credit) (n=4), and INC (incomplete) (n=1).

Study on Women’s Experiences at Harvard Law School 52
Appendix IX
Focus Group Informed Consent
Please read this consent agreement carefully before agreeing to participate in this study.
Purpose of the study:To gain insight into students’ experiences at HLS.
What you will do in this study:You will participate in a discussion of various issues and areas of student experiences at HLS.
Time required:The focus group will take approximately 90 minutes to complete.
Risks:There are no anticipated risks associated with participating in this study.
Benefits:The information gathered in the focus groups will be used to begin a discussion of studentexperiences at HLS and if, and how, HLS can improve students’ experiences here. If you wish,you can send an email message to Adam Neufeld ([email protected]) to request a copyof any reports or writings based on the research.
Confidentiality:Your participation in this experiment will remain confidential, and your identity will never bereported. Your comments will only be associated with general identifiers (e.g., class year, gender).Participants may discuss the issues raised in this group with others, as long as they maintain theconfidentiality of the individual participants. Any tape-recording of the discussion will beconfidential and destroyed at the end of the study.
Participation and withdrawal:Your participation in this experiment is completely voluntary, and you may withdraw from thefocus group at any time without penalty. You may withdraw by informing the facilitator that youno longer wish to participate (no questions will be asked).
Contact:If you have questions about this focus group, please contact Adam Neufeld, ***.
Who to contact about your rights in this experiment:Jane Calhoun, Harvard Committee on the Use of Human Subjects in Research, Science Center400E, Cambridge, MA 02138. Phone: 617-495-5459. E-mail: [email protected]
Agreement:The purpose and nature of this research have been sufficiently explained and I agree toparticipate in this study. I understand that I am free to withdraw at any time without incurringany penalty.
Signature: _____________________________________ Date: __________________
Name (print): ________________________________________________

Study on Women’s Experiences at Harvard Law School 53
Appendix X
Participation Monitoring of All Courses, Sample Summary
Median Minimum Maximum
No. of students attending 66.1 23.9 117.4
% of attending students who are women 45% 28% 65%
No. of comments 36.8 12.7 99.7
% of comments by women 37% 22% 55%
No. of volunteered comments 18.7 4.8 36.2
% of volunteered comments by women 32% 11% 54%
No. of exchanges 21.2 8.3 41.3
% of exchanges by women 36% 22% 66%
No. of volunteered exchanges 15 4.7 27.9
% of volunteered exchanges by women 33% 14% 54%
No. of students participating 14.6 6.7 29.9
% of students participating who are women 37% 21% 56%
No. of students participating voluntarily 10.5 3.8 20.1
% of students participating voluntarily who arewomen
35% 13% 55%
No. of dominating participants 1.2 0 6.3
% of dominating participants who are women 23% --- 100%
No. of volunteering dominating participants 0.5 0 2.5
% of volunteering dominating participants whoare women
5% --- 100%
Summary of the median, minimum and maximum values for various measures forcourses in the sample (n=32). Some numbers are not round because all course valuesreflect the average of all class meetings for each course.

Study on Women’s Experiences at Harvard Law School 54
Appendix XI
Participation Monitoring of First-Year Courses, Course Summary
OverallMean
Median Minimum Maximum
No. of enrolled students 79.3 79 77 82
% of enrolled students who are women 45% 44% 42% 48%
No. of attending students 66.9 67.7 61.5 74.9
% of attending students who are women 45% 45% 40% 49%
No. of comments 51.8 47.6 34.3 102.7
% of comments by women 37% 35% 22% 54%
No. of volunteered comments 24.5 23.8 13.3 37.7
% of volunteered comments by women 32% 33% 19% 47%
No. of exchanges 27.6 25.4 17.4 41.8
% of exchanges by women 35% 35% 23% 46%
No. of volunteered exchanges 20 19.5 9.8 29.3
% of volunteered exchanges by women 32% 33% 21% 46%
No. of students participating 8.9 9 6.1 12.2
% of students participating who are women 43% 42% 35% 49%
No. of students participating voluntarily 6.6 6.8 3.7 9.4
% of students participating voluntarily who arewomen
38% 38% 29% 45%
No. of dominating participants 0.6 0.5 0 1.5
% of dominating participants who are women 27% 29% --- 100%
No. of volunteering dominating participants 0.4 0.3 0 1.3
% of volunteering dominating participants whoare women
16% 0% --- 100%
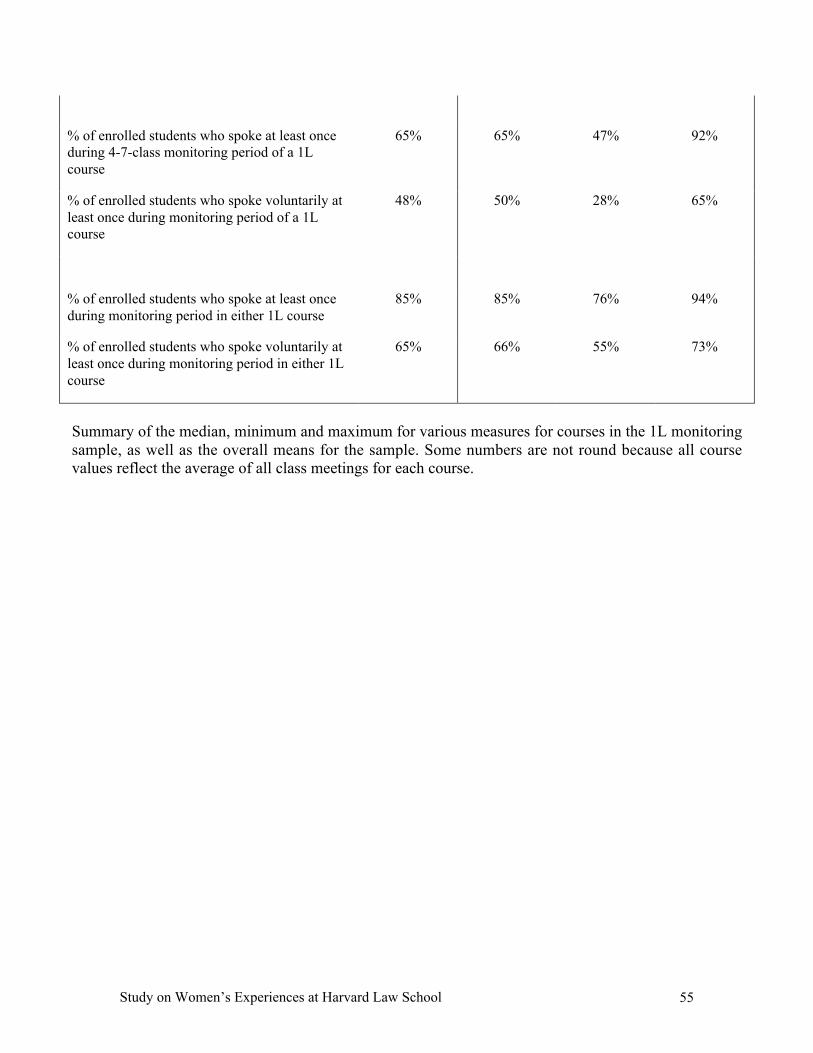
Study on Women’s Experiences at Harvard Law School 55
% of enrolled students who spoke at least onceduring 4-7-class monitoring period of a 1Lcourse
65% 65% 47% 92%
% of enrolled students who spoke voluntarily atleast once during monitoring period of a 1Lcourse
48% 50% 28% 65%
% of enrolled students who spoke at least onceduring monitoring period in either 1L course
85% 85% 76% 94%
% of enrolled students who spoke voluntarily atleast once during monitoring period in either 1Lcourse
65% 66% 55% 73%
Summary of the median, minimum and maximum for various measures for courses in the 1L monitoringsample, as well as the overall means for the sample. Some numbers are not round because all coursevalues reflect the average of all class meetings for each course.

Study on Women’s Experiences at Harvard Law School 56
Appendix XII
Classroom Participation of Female Students
45%
38%
34% 34%35%
33%
38%39%
25%
0%
10%
20%
30%
40%
50%
Class Comments Exchanges Students Dominant Participants
Total Voluntary
The first column is the percentage of women in attendance in the classes we monitored. The next column represents thepercentage of all comments that were made by women. The following column represents the percentage of allvolunteered comments that were made by women. The subsequent columns represent the analogous percentages forexchanges (that is, ignoring whether there was immediate follow-up to the comment), students who participated at leastonce during the class meeting (that is, ignoring how many times a student spoke) and students who spoke at least threetimes during the class meeting (“dominant participants”).

Study on Women’s Experiences at Harvard Law School 57
Appendix XIII
Cumulative Distribution of Participation in First-Year Courses
0%
10%
20%
30%
40%
50%
60%
70%
80%
90%
100%
0% 10% 20% 30% 40% 50% 60% 70% 80% 90% 100%
Cumulative % of Students
Cum
ulat
ive
% o
f Com
men
ts
All
Volunteered
This graph shows the cumulative distribution for participation in our 1L coursemonitoring sample. The x-axis is the percentage of all students, ranked according toparticipation. The y-axis is the cumulative percentage of all comments (top line) and allstudent-volunteered comments (bottom) made by these students. For instance, the graphpoint (90%, 67%) on the top line means that the top 10% of overall participators wereresponsible for 33% of all comments.
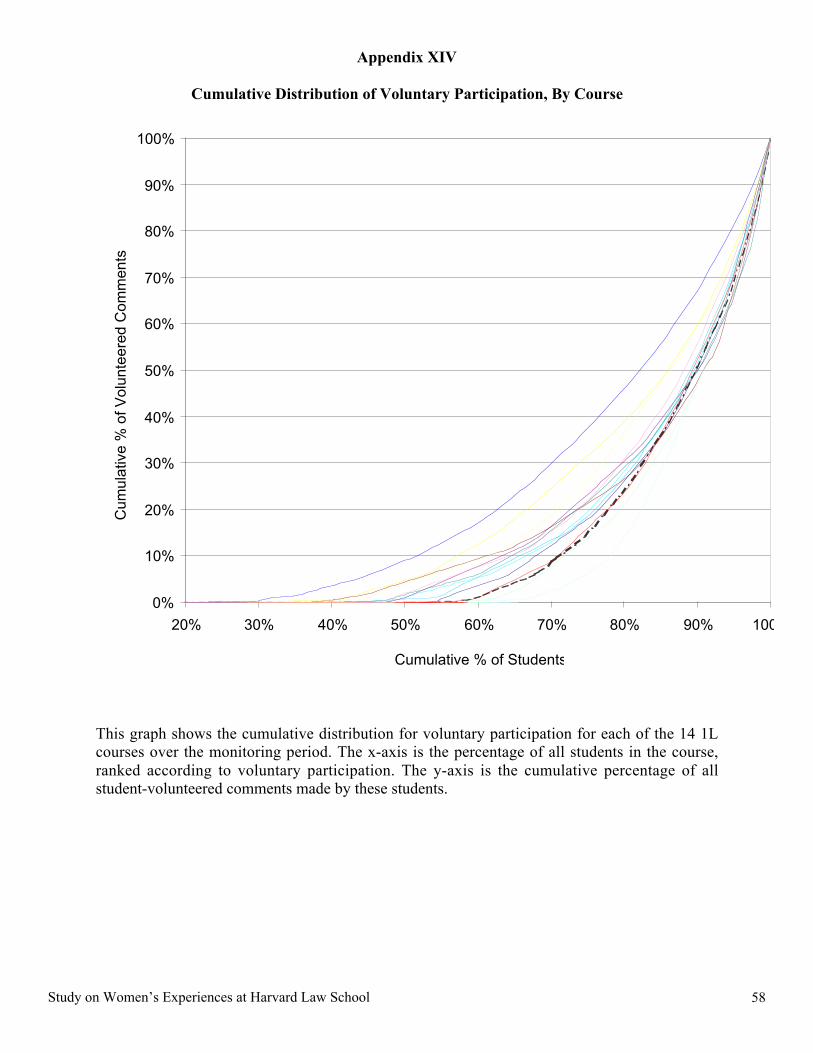
Study on Women’s Experiences at Harvard Law School 58
Appendix XIV
Cumulative Distribution of Voluntary Participation, By Course
0%
10%
20%
30%
40%
50%
60%
70%
80%
90%
100%
20% 30% 40% 50% 60% 70% 80% 90% 100%
Cumulative % of Students
Cum
ulat
ive
% o
f Vol
unte
ered
Com
men
ts
This graph shows the cumulative distribution for voluntary participation for each of the 14 1Lcourses over the monitoring period. The x-axis is the percentage of all students in the course,ranked according to voluntary participation. The y-axis is the cumulative percentage of allstudent-volunteered comments made by these students.

Study on Women’s Experiences at Harvard Law School 59
Appendix XV
Cumulative Distribution of Voluntary Participation in 1L Courses, By Decile
This table shows the distribution for voluntary participation in 1L courses overall. Students aregrouped into deciles. The second column is the percentage of all volunteered comments made bystudents in the particular decile. For instance, the top decile of participators accounted for 43%of all volunteered comments. The gender composition of students in each decile is listed in thethird column. For instance, the top decile contributed 43% of all volunteered comments, and only20% of the students in this decile were women.
DecileCumulative % of
Volunteered Comments % Female
1-3 0% ---
4 2% 50%
5 3% 58%
6 6% 45%
7 10% 36%
8 14% 37%
9 22% 47%
10 43% 20%
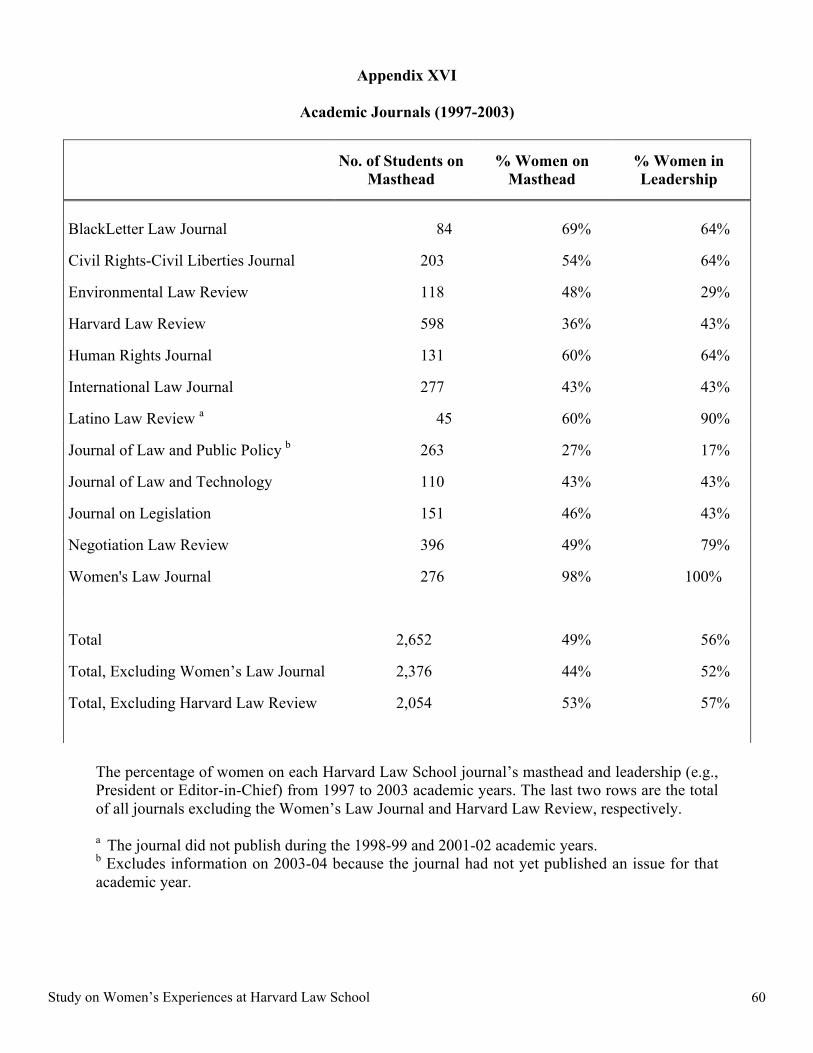
Study on Women’s Experiences at Harvard Law School 60
Appendix XVI
Academic Journals (1997-2003)
The percentage of women on each Harvard Law School journal’s masthead and leadership (e.g.,President or Editor-in-Chief) from 1997 to 2003 academic years. The last two rows are the totalof all journals excluding the Women’s Law Journal and Harvard Law Review, respectively.
a The journal did not publish during the 1998-99 and 2001-02 academic years.b Excludes information on 2003-04 because the journal had not yet published an issue for thatacademic year.
No. of Students onMasthead
% Women onMasthead
% Women inLeadership
BlackLetter Law Journal 84 69% 64%
Civil Rights-Civil Liberties Journal 203 54% 64%
Environmental Law Review 118 48% 29%
Harvard Law Review 598 36% 43%
Human Rights Journal 131 60% 64%
International Law Journal 277 43% 43%
Latino Law Review a 45 60% 90%
Journal of Law and Public Policy b 263 27% 17%
Journal of Law and Technology 110 43% 43%
Journal on Legislation 151 46% 43%
Negotiation Law Review 396 49% 79%
Women's Law Journal 276 98% 100%
Total 2,652 49% 56%
Total, Excluding Women’s Law Journal 2,376 44% 52%
Total, Excluding Harvard Law Review 2,054 53% 57%

Study on Women’s Experiences at Harvard Law School 61
Appendix XVII
Application to Law Review, Regression Analyses
* = p<.05; ** = p<.01; *** = p<.001Coefficients and standard errors for regression analyses on 2L/3L survey sample. The sample is limitedto students who are not on Law Review. Dependent variable is whether student applied for Law Review.The third column is limited to 2L/3Ls whose highest and lowest first-semester 1L grade were two ormore grades different (e.g., B and A-).
Applied for Law ReviewApplied for Law Review –
Students with large 1L grade diff.
Female 0.668(0.352)
1.339*(0.579)
Nonwhite -0.061(0.084)
-0.225(0.126)
Left Race blank 0.180(0.149)
-0.258(0.278)
Female*Nonwhite 0.067(0.111)
0.194(0.178)
Female*Race blank 0.126(0.262)
0.366(0.372)
Joint degree -0.208(0.154)
0.018(0.214)
Years since college 0.005(0.013)
0.013(0.021)
Married/committed relationship – local 0.039(0.077)
0.065(0.112)
Married/committed relationship – long-distance -0.155(0.091)
-0.227(0.161)
Female*Married/committed relationship – local -0.088(0.106)
-0.316(0.164)
Female*Married/committed relationship –long-distance
0.057(0.122)
0.095(0.224)
Highest educ. level for parent of high schooldegree or less
0.012(0.082)
-0.002(0.175)
Highest educ. level for parent of college degree 0.047(0.060)
0.156(0.091)
Average grades first semester 1L year 0.111*(0.047)
0.167*(0.074)
Female*Average grades first semester 1L year -0.141*(0.065)
-0.263*(0.108)
Undergraduate major in social sciences -0.017(0.053)
0.020(0.082)
Undergraduate major in humanities -0.004(0.054)
0.087(0.085)
Undergraduate major in finances/economics orstatistics/quantitative studies
0.014(0.061)
0.081(0.092)
Applied or expect to apply for clerkships 0.319***(0.048)
0.400***(0.083)
Constant -0.418 -0.816
Adjusted R-squared 0.155 0.277
Number of observations 338 132
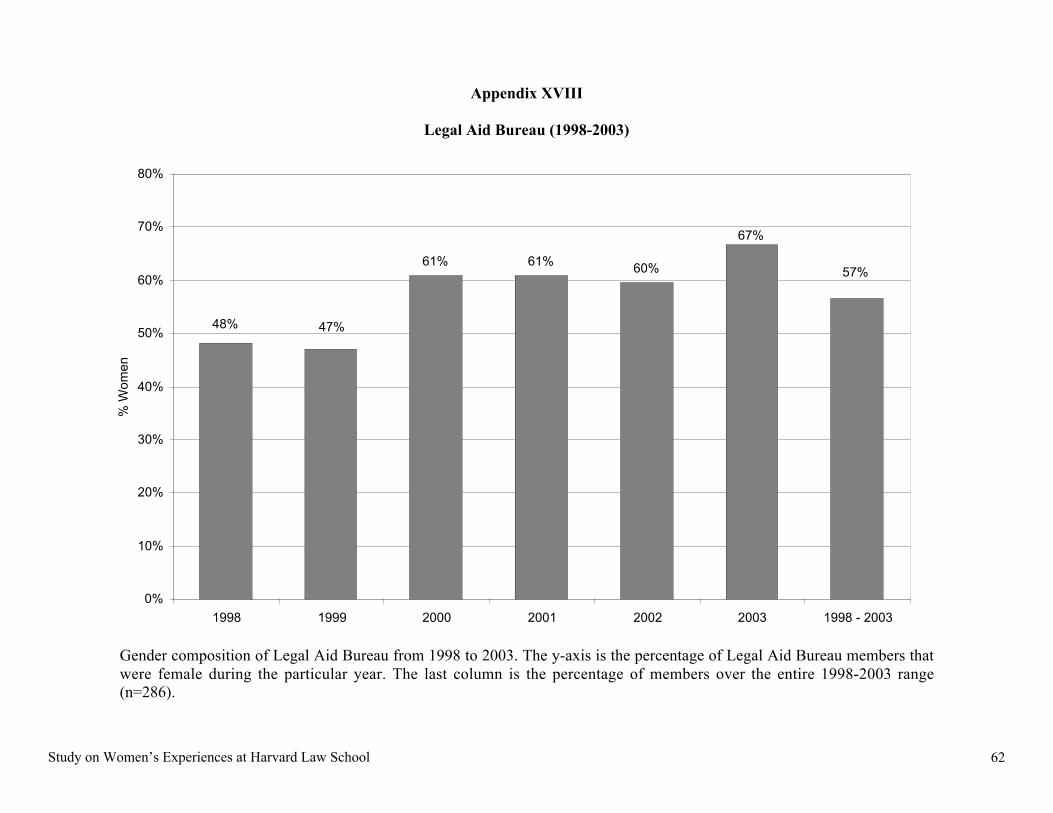
Study on Women’s Experiences at Harvard Law School 62
Appendix XVIII
Legal Aid Bureau (1998-2003)
61% 61% 60%
48% 47%
67%
57%
0%
10%
20%
30%
40%
50%
60%
70%
80%
1998 1999 2000 2001 2002 2003 1998 - 2003
% W
omen
Gender composition of Legal Aid Bureau from 1998 to 2003. The y-axis is the percentage of Legal Aid Bureau members thatwere female during the particular year. The last column is the percentage of members over the entire 1998-2003 range(n=286).

Study on Women’s Experiences at Harvard Law School 63
Appendix XIX
Board of Student Advisors (1998-2003)
53%
61%
55%
60%59%
65%
57%
0%
10%
20%
30%
40%
50%
60%
70%
80%
1998 1999 2000 2001 2002 2003 1998 - 2003
% W
omen
Gender composition of Board of Student Advisors (BSA) from 1998 to 2003. The y-axis is the percentage of BSA membersthat were female during the particular year. The last column is the percentage of members over the entire 1998-2003 range(n=335).

Study on Women’s Experiences at Harvard Law School 64
Appendix XX
Self-Assessment of Skills
15%
11%
17%
11%
26%
21%
40%
20%
25%27%
20%
18%
13%
12%
28%
23%24%
33%
0%
5%
10%
15%
20%
25%
30%
35%
40%
45%
50%
Legal Reasoning QuantitativeReasoning
Quick on Feet Brief Writing Oral Argument Research Ethical Issues BuildingConsensus
PersuadingOthers
Female Male
Percentage of male and female respondents who ranked themselves in the top quintile of their class in particular skills thought to berelevant to legal practice. Results represent all class years combined, except for oral argument, which was asked only of 2L/3Lrespondents.

Study on Women’s Experiences at Harvard Law School 65
Appendix XXI
Self-Assessment of Skills, Regression Analyses
Legal Analysis Quantitative Reasoning
Female -0.501**(0.151)
-0.570**(0.204)
Nonwhite -0.030(0.164)
-0.097(0.221)
Race left blank 0.065(0.296)
0.191(0.400)
Female*Nonwhite 0.403(0.211)
0.212(0.286)
Female*Race blank 0.289(0.471)
-0.782(0.636)
3L 0.073(0.088)
0.147(0.119)
Joint degree student 0.236(0.267)
1.276***(0.360)
Years since college -0.008(0.025)
0.025(0.033)
Married/committed relationship – local -0.034(0.143)
-0.008(0.193)
Married/committed relationship – long-distance -0.290(0.179)
-0.441(0.242)
Female*Married/committed relationship – local 0.063(0.200)
-0.103(0.270)
Female*Married/committed relationship – long-distance 0.288(0.234)
-0.060(0.317)
Highest educ. level for parent of high school degree or less -0.141(0.152)
-0.088(0.205)
Highest educ. level for parent of college degree -0.063(0.115)
0.177(0.155)
Major in humanities -0.192(0.105)
-0.931***(0.141)
Major in financial or quantitative studies 0.077(0.117)
1.045***(0.158)
Major in social studies -0.099(0.102)
-0.566***(0.138)
Avg. 1L grade 0.441***(0.058)
0.139(0.079)
Constant 1.779*** 3.103***
Adjusted R-squared 0.186 0.359
Number of observations 404 404
* = p<.05; ** = p<.01; *** = p<.001Coefficients and standard errors for regression analyses on 2L/3L Spring Survey. Both dependentvariables are ordinal scale and represent the quintile of the class in which the respondent ranked himselfor herself for the particular skill.
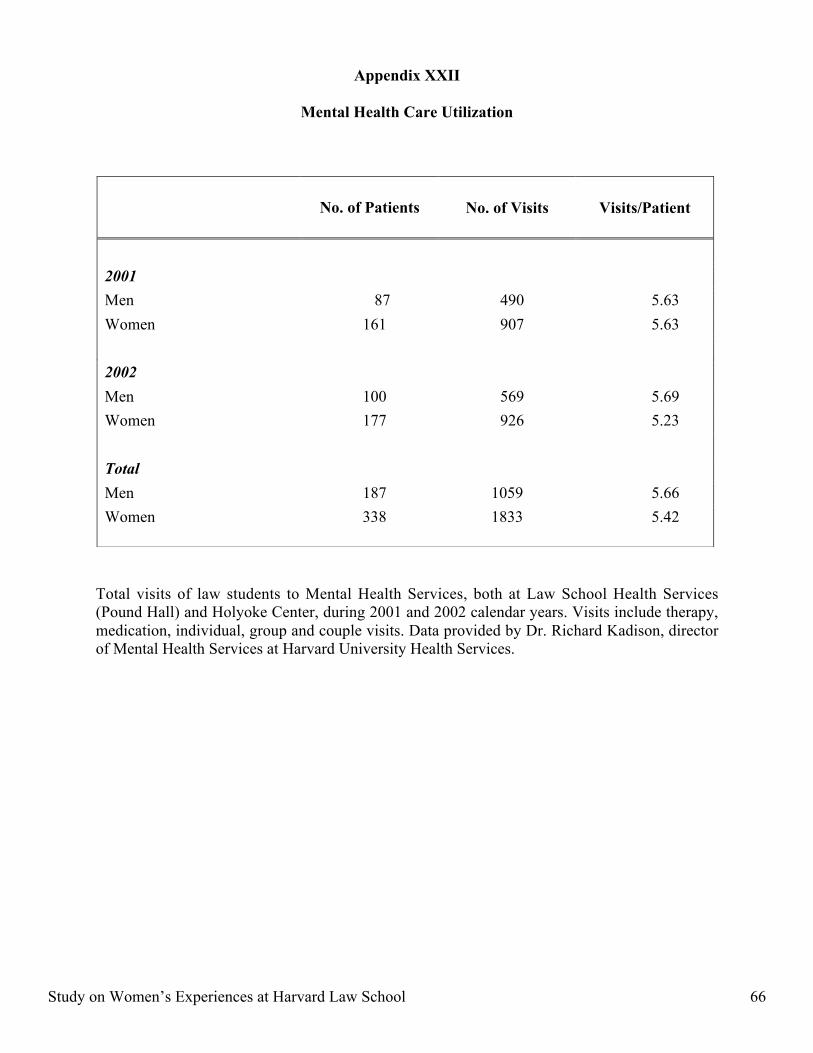
Study on Women’s Experiences at Harvard Law School 66
Appendix XXII
Mental Health Care Utilization
Total visits of law students to Mental Health Services, both at Law School Health Services(Pound Hall) and Holyoke Center, during 2001 and 2002 calendar years. Visits include therapy,medication, individual, group and couple visits. Data provided by Dr. Richard Kadison, directorof Mental Health Services at Harvard University Health Services.
No. of Patients No. of Visits Visits/Patient
2001
Men 87 490 5.63
Women 161 907 5.63
2002
Men 100 569 5.69
Women 177 926 5.23
Total
Men 187 1059 5.66
Women 338 1833 5.42

Study on Women’s Experiences at Harvard Law School 67
Appendix XXIII
Likelihood of Choosing HLS and Law School Again, Regression Analyses
Likelihood of Choosing HLS AgainLikelihood of Choosing Law School
Again
Female 0.068(0.348)
-0.098(0.304)
Nonwhite 0.163(0.141)
-0.066(0.123)
Left race blank -0.173(0.275)
0.015(0.241)
Female*Nonwhite -0.414*(0.184)
0.103(0.161)
Female*Race blank -0.078(0.387)
0.281(0.339)
2L 0.073(0.092)
-0.046(0.081)
3L 0.001(0.099)
-0.091(0.086)
Joint degree 0.036(0.306)
-0.036(0.268)
Years since college 0.012(0.019)
-0.014(0.017)
Married/committed relationship – local -0.125(0.131)
0.143(0.114)
Married/committed relationship – long-distance -0.133(0.150)
0.221(0.131)
Female*Married/committed relationship – local 0.120(0.181)
-0.127(0.158)
Female*Married/committed relationship –long-distance
-0.288(0.203)
-0.009(0.178)
Highest educ. level for parent of high schooldegree or less
-0.059(0.141)
0.104(0.123)
Highest educ. level for parent of college degree -0.085(0.101)
0.155(0.088)
Legal reasoning skills -0.102(0.072)
0.098(0.063)
Female*Legal reasoning skills -0.035(0.086)
0.079(0.075)
Avg. expected grades for current courses(quintiles)
0.136*(0.063)
0.119*(0.055)
Likelihood of choosing to attend law schoolagain
0.446***(0.041)
Likelihood of choosing to attend HLS again 0.341***(0.031)
Constant 2.317***(0.319)
1.834***(0.281)
Adjusted R-squared 0.171 0.187
Number of observations 679 679
* = p<.05; ** = p<.01; *** = p<.001Coefficients and standard errors for regression analyses based on 1L and 2L/3L Spring Surveys. Bothdependent variables are ordinal scale (1-5). Average expected grade variable differs slightly for 1Ls, where itonly reflects their current 1L courses, rather than all courses.

Study on Women’s Experiences at Harvard Law School 68
Appendix XXIV
Likelihood of Choosing HLS and Law School Again, 1L Survey, Regression Analyses
* p<.05; ** = p<.01; *** = p<.001
Coefficients and standard errors for regression analyses based on 1L Spring survey sample. Bothdependent variables are ordinal scale (1-5).
Likelihood of ChoosingHLS Again
Likelihood of Choosing LawSchool Again
Female 0.240(0.196)
-0.102(0.170)
Nonwhite 0.095(0.195)
-0.266(0.168)
Female*Nonwhite -0.492(0.259)
0.493*(0.224)
Years since college 0.012(0.025)
-0.011(0.022)
Married/committed relationship – local -0.178(0.211)
-0.166(0.183)
Married/committed relationship – long-distance
0.024(0.213)
0.004(0.184)
Female*Married/committed relationship– local
-0.346(0.285)
0.302(0.247)
Female*Married/committed relationship– long-distance
-0.760*(0.300)
0.223(0.263)
Highest educ. level for parent of highschool degree or less
-0.005(0.228)
-0.152(0.197)
Highest educ. level for parent of collegedegree
-0.203(0.154)
0.213(0.133)
Avg. expected grades for current 1Lcourses (quintiles)
0.058(0.081)
0.120(0.069)
Avg. satisfaction with current courses 0.215*(0.095)
0.236**(0.082)
Likelihood of choosing to attend lawschool again
0.357***(0.068)
Likelihood of choosing to attend HLSagain
0.268***(0.051)
Constant 1.853*** 1.876***
Adjusted R-squared 0.166 0.140
Number of observations 273 273
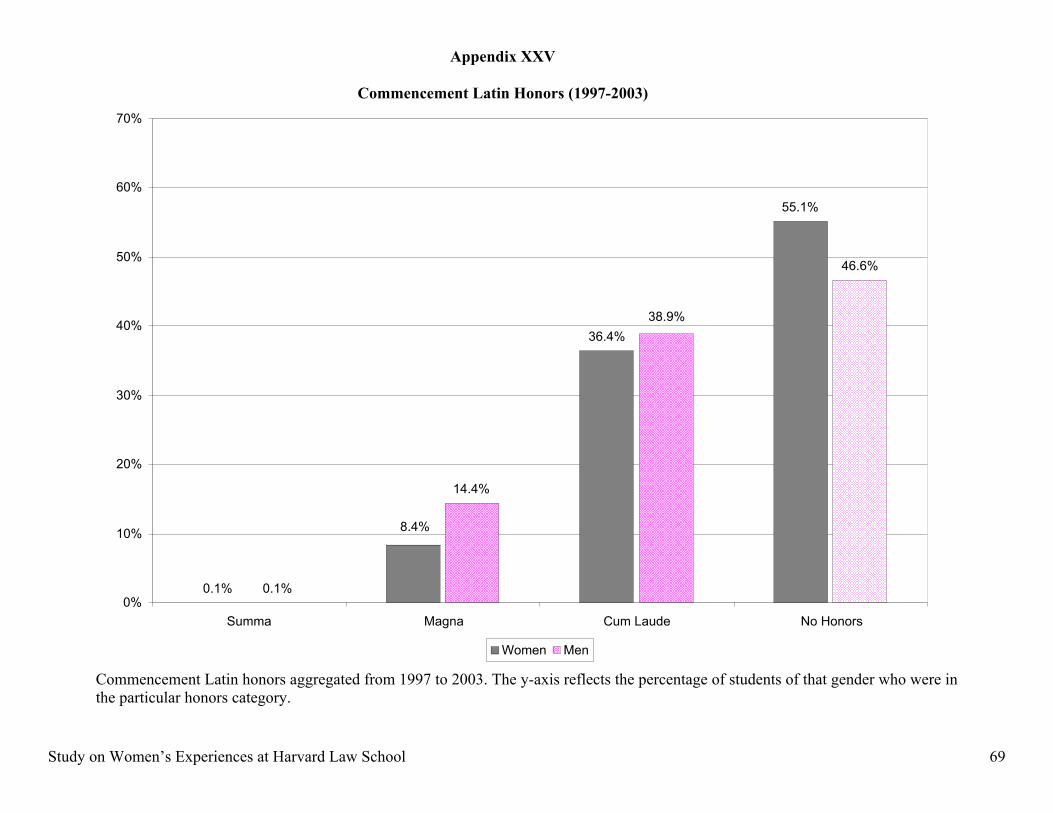
Study on Women’s Experiences at Harvard Law School 69
Appendix XXV
Commencement Latin Honors (1997-2003)
0.1%
36.4%
55.1%
0.1%
14.4%
46.6%
8.4%
38.9%
0%
10%
20%
30%
40%
50%
60%
70%
Summa Magna Cum Laude No Honors
Women Men
Commencement Latin honors aggregated from 1997 to 2003. The y-axis reflects the percentage of students of that gender who were inthe particular honors category.

Study on Women’s Experiences at Harvard Law School 70
Appendix XXVI
Commencement Latin Honors (1997-2003)
1997 1998 1999 2000 2001 2002 2003 Total
Graduating Students Total No. 545 531 553 550 540 545 569 3833% Men 58.7% 57.8% 59.1% 56.9% 59.6% 53.6% 53.8% 57.1%% Women 41.3% 42.2% 40.9% 43.1% 40.4% 46.4% 46.2% 42.9%
Summa Cum LaudeTotal No. 1 0 1 0 0 0 0 2% of Men in Class in This Category 0.0% 0.0% 0.3% 0.0% 0.0% 0.0% 0.0% <0.1%% of Women in Class in This Category 0.4% 0.0% 0.0% 0.0% 0.0% 0.0% 0.0% <0.1% Magna Cum LaudeTotal No. 91 89 56 55 54 54 56 455% of Men in Class in This Category 22.5% 19.2% 11.3% 13.4% 10.6% 11.3% 12.5% 14.4%% of Women in Class in This Category 8.4% 13.4% 8.4% 5.5% 9.2% 8.3% 6.6% 8.4% Cum LaudeTotal No. 326 296 165 165 162 164 171 1449% of Men in Class in This Category 58.4% 54.7% 29.1% 30.4% 30.7% 33.2% 35.6% 38.9%% of Women in Class in This Category 61.8% 57.1% 31.0% 29.5% 28.9% 26.5% 23.6% 36.4% No Latin HonorsTotal No. 127 146 331 330 324 327 342 1927% of Men in Class in This Category 19.1% 26.1% 59.3% 56.2% 58.7% 55.5% 51.6% 46.6%% of Women in Class in This Category 29.3% 29.5% 60.6% 65.0% 61.9% 65.2% 70.0% 55.1%
Total Chi-squared 13.669 1.910 1.188 5.827 0.372 2.903 10.973 24.802P-value (degrees of freedom = 3) 0.003 0.591 0.756 0.120 0.946 0.407 0.012 0.000
Commencement Latin honors from 1997 to 2003. The percentages of men and women in the studentbody who are in the particular category are listed for each honors category.

Study on Women’s Experiences at Harvard Law School 71
Appendix XXVII
First-Year Course Grades
33.9
7.0
19.3
10.8
1.00.5
7.9
16.6
31.7
0.11.0
8.3
31.9
28.9
1.10%
5%
10%
15%
20%
25%
30%
35%
40%
D C B- B B+ A- A A+
Women Men
First-year course grades by gender for three of the five years between 1996 and 2000. The y-axis is the percent of students of thatgender that received the particular grade.

Study on Women’s Experiences at Harvard Law School 72
Appendix XXVIII
First-Year Course Grades – Gender of Professor
Female Professors
36.7
7.1
33.7
17.0
0.2
8.7
14.7
30.7
0.7
8.3
0.4
8.8
32.3
0.0 0.60%
5%
10%
15%
20%
25%
30%
35%
40%
D C B- B B+ A- A A+
Male Professors
7.0
11.4
0.6
7.6
17.2
34.9
30.1
1.1
8.3
1.2
20.0
31.327.8
0.1 1.20%
5%
10%
15%
20%
25%
30%
35%
40%
D C B- B B+ A- A A+
Women Men
First-year course grades by gender for courses taught by female (top) and male (bottom)professors for three of the five years between 1996 and 2000. The y-axis is the percent ofstudents of that gender that received the particular grade in those courses.

Study on Women’s Experiences at Harvard Law School 73
Appendix XXIX
First-Year Course Grades – Gender of Professor, Regression Analyses
Grade A/A+
Female student -0.174***(0.029)
-0.481***(0.086)
Female professor -0.126**(0.039)
-0.354**(0.115)
Female student*Female professor 0.071(0.060)
0.439*(0.180)
Year2 0.010(0.031)
-0.025(0.089)
Year3 0.058(0.031)
-0.036(0.089)
Constant 4.984*** -1.913***
Adjusted/Pseudo R-squared 0.006 0.007
Number of observations 8248 8248
* = p<.05; ** = p<.01; *** = p<.001
Coefficients and standard errors for regression analyses on 1L course grades. The second columnlists the results from a regression with the dependent variable of grade, scaled from 0-8according to the values assigned by the Registrar’s Office for calculating GPA. The third columnlists the results from a regression with a dependent variable of whether the grade was an A orA+. As a result, the R-squared listed in the third column is a Pseudo R-squared, as opposed to theAdjusted R-squared listed in the second column.

Study on Women’s Experiences at Harvard Law School 74
Appendix XXX
First-Year Course Grades – Exam Type
In-Class Exams
0.21.2
0.21.3
6.6
0.5
7.7
16.0
35.1
30.5
8.8
1.5
9.9
19.6
32.9
28.0
0%
5%
10%
15%
20%
25%
30%
35%
40%
D C B- B B+ A- A A+
Take-Home Exams
33.1
7.4
18.7
11.4
0.3
7.6
16.8
33.4
0.00.8
8.0
0.6
30.930.1
0.90%
5%
10%
15%
20%
25%
30%
35%
40%
D C B- B B+ A- A A+
Women Men
First-year course grades by gender for courses with in-class exams and one-day take-homeexams for three of the five years between 1996 and 2000. The y-axis is the percent of students ofthat gender receiving the particular grade in courses with in-class and take-home exams.

Study on Women’s Experiences at Harvard Law School 75
Appendix XXXI
First-Year Course Grades – Exam Type, Regression Analyses
Grade A/A+
Female student -0.197***(0.047)
-0.573***(0.148)
In-class restricted-materials -0.026(0.065)
-0.095(0.180)
Take-home open-materials 0.055(0.046)
0.241*(0.119)
Take-home restricted-materials -0.098*(0.046)
-0.204(0.128)
Other exam type 0.012(0.081)
-0.024(0.224)
Female*In-class restricted-materials 0.072(0.097)
0.743**(0.273)
Female*Take-home open-materials -0.007(0.070)
-0.106(0.211)
Female*Take-home restricted-materials 0.103(0.069)
0.353(0.213)
Female*Other exam type 0.184(0.121)
0.770*(0.331)
Year2 -0.018(0.033)
-0.072(0.096)
Year3 0.062(0.033)
-0.026(0.093)
Constant 4.970*** -1.992***
Adjusted/Pseudo R-squared 0.005 0.010
Number of observations 7831 7831
* = p<.05; ** = p<.01; *** = p<.001
Coefficients and standard errors for regression analyses including independent variables of typeof exam. In the second column, the dependent variable is grade, scaled from 0-8. In the thirdcolumn, the dependent variable is binary, based on whether or not the grade was an A or A+. Theexam types are compared with the in-class open-materials type.

Study on Women’s Experiences at Harvard Law School 76
Appendix XXXII
First-Year Course Grades – Course Subject
Torts
6.7
21.7
11.09.3
1.7
0.3
7.0
17.3
34.5
29.9
25.0
0.0 1.9 1.6
32.2
0%
5%
10%
15%
20%
25%
30%
35%
40%
D C B- B B+ A- A A+
Civil Procedure, Property and Contracts
33.6
6.5
10.9
0.80.5
8.1
16.6
32.4
8.0
0.1 0.70.8
19.4
31.030.7
0%
5%
10%
15%
20%
25%
30%
35%
40%
D C B- B B+ A- A A+
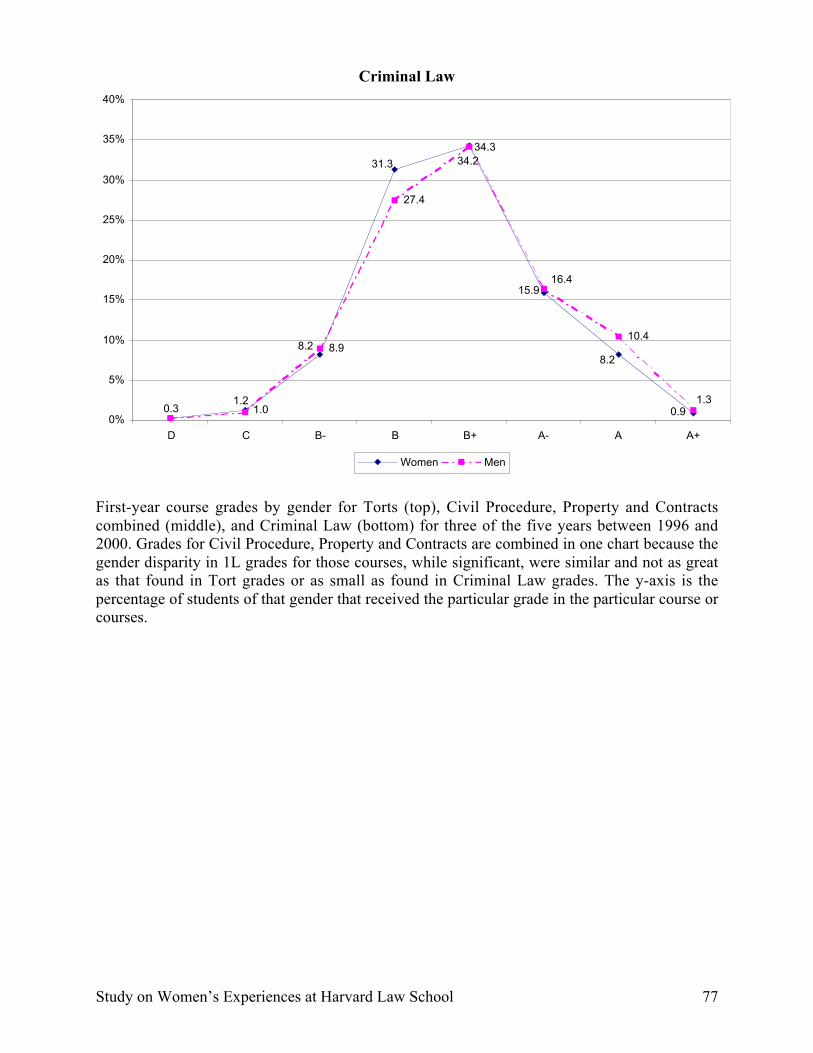
Study on Women’s Experiences at Harvard Law School 77
Criminal Law
8.9
27.4
10.4
1.2
8.2
0.9
8.2
15.9
34.3
31.3
0.3 1.01.3
16.4
34.2
0%
5%
10%
15%
20%
25%
30%
35%
40%
D C B- B B+ A- A A+
Women Men
First-year course grades by gender for Torts (top), Civil Procedure, Property and Contractscombined (middle), and Criminal Law (bottom) for three of the five years between 1996 and2000. Grades for Civil Procedure, Property and Contracts are combined in one chart because thegender disparity in 1L grades for those courses, while significant, were similar and not as greatas that found in Tort grades or as small as found in Criminal Law grades. The y-axis is thepercentage of students of that gender that received the particular grade in the particular course orcourses.

Study on Women’s Experiences at Harvard Law School 78
Appendix XXXIII
First-Year Course Grades – Course Subject, Regression Analyses
Civil Procedure Contracts Criminal Law
Grade A/A+ Grade A/A+ Grade A/A+
Female student -0.117*(0.056)
-0.441*(0.177)
-0.190**(0.055)
-0.219(0.161)
-0.084(0.059)
-0.284(0.168)
Year2 0.074(0.276)
0.137(0.214)
0.177**(0.067)
0.213(0.186)
0.064(0.073)
-0.189(0.198)
Year3 0.098(0.149)
0.319(0.208)
-0.015(0.067)
-0.174(0.201)
0.077(0.071)
-0.232(0.195)
Constant 4.862*** -2.257*** 5.002*** -2.202*** 4.867*** -1.891***
Adjusted/Pseudo R-squared 0.002 0.008 0.012 0.005 0.0002 0.004
Number of observations 1657 1657 1658 1658 1616 1616
Property Torts
Grade A/A+ Grade A/A+
Female student -0.125*(0.057)
-0.389*(0.168)
-0.268***(0.058)
-0.610***(0.175)
Year2 -0.065(0.069)
-0.099(0.202)
-0.192**(0.071)
-0.180(0.198)
Year3 0.149*(0.069)
0.144(0.193)
0.036(0.071)
-0.109(0.197)
Constant 4.918*** -2.257*** 5.098*** -1.848***
Adjusted/Pseudo R-squared 0.007 0.006 0.017 0.013
Number of observations 1658 1658 1659 1659
* = p<.05; ** = p<.01; *** = p<.001Coefficients and standard errors for regression analyses with the dependent variable of grade (0-8), for each course subject matter.

Study on Women’s Experiences at Harvard Law School 79
Appendix XXXIV
Satisfaction and Expected Grade for First-Year Students, Regression Analyses
Expected Grade in Course Satisfaction with Course
Female -0.635**(0.194)
0.095(0.225)
Nonwhite -0.042(0.146)
0.207(0.127)
Left race blank -0.523*(0.208)
-0.336(0.265)
Female*Nonwhite 0.151(0.193)
-0.275(0.173)
Female*Race blank 0.243(0.425)
-0.067(0.344)
Highest educ. level for parent ofhigh school degree or less
0.201(0.176)
-0.167(0.174)
Highest educ. level for parent ofcollege degree
-0.163(0.111)
-0.066(0.108)
Married/committed relationship –local
0.325(0.168)
0.323*(0.133)
Married/committed relationship –long-distance
0.218(0.146)
0.001(0.142)
Female*Married/committedrelationship – local
-0.282(0.227)
-0.309(0.187)
Female*Married/committedrelationship – long-distance
-0.158(0.218)
0.159(0.192)
Contractsa -0.107(0.121)
-0.215(0.173)
Criminal Lawa -0.090(0.080)
0.103(0.120)
Tortsa -0.070(0.071)
-0.319*(0.139)
Electivea 0.047(0.103)
Avg. preparation time -0.005(0.016)
0.026(0.020)
Female*Avg. preparation time 0.046(0.024)
-0.008(0.025)
Undergraduate major in socialsciences
0.007(0.102)
-0.039(0.089)
Undergraduate major infinances/economics
0.007(0.118)
-0.009(0.104)
Undergraduate major in humanities 0.038(0.105)
-0.027(0.094)
Expectation of working at law firmin 10 years
-0.093

Study on Women’s Experiences at Harvard Law School 80
in 10 years (0.085)Career priority of helping others 0.122
(0.084)Constant 3.783*** 3.287***
R-squared 0.108 0.041
Number of observations 555 832
* = p<.05; ** = p<.01; *** = p<.001
Coefficients and standard errors for regression analyses based on 1L Spring Survey. Expectedgrade in course is an ordinal scale variable equal to the quintile in which the student believed hisor her grade would fall relative to other students in the course. Satisfaction with course is anordinal scale variable from 1 (“Very dissatisfied”) to 5 (“Very satisfied”). We inquired aboutsatisfaction but not expected grade for elective courses.
a Relative to property.

Study on Women’s Experiences at Harvard Law School 81
Appendix XXXV
Course Preparation Time, Regression Analyses
Avg. Preparation TimeAll Students
Avg. Preparation Time2L/3L Only
Female 0.568(.393)
1.093*(.446)
2L -2.000***(.275)
3L -2.564***(.293)
-0.540*(.260)
Nonwhite -0.468(.423)
-0.613(.484)
Left race blank 0.088(.746)
-0.146(.847)
Female*Nonwhite 0.423(.552)
0.401(.624)
Female*Race blank -0.515(1.091)
-1.003(1.367)
Highest educ. level for parent of high schooldegree or less
-0.116(.423)
-0.165(.447)
Highest educ. level for parent of college degree -0.143(.301)
-0.188(.341)
Married/committed relationship – local 0.723(.390)
1.206**(.422)
Married/committed relationship – long-distance 0.841(.448)
0.295(.526)
Female*Married/committed relationship – local -0.789(.542)
-1.188*(.593)
Female*Married/committed relationship – long-distance
-0.670(.608)
-0.331(.692)
Undergraduate major in social sciences -0.170(.265)
-0.246(.296)
Undergraduate major in finances/economics 0.037(.321)
0.296(.353)
Undergraduate major in humanities -0.274(.278)
-0.456(.306)
Highest grade first semester 1L year 0.318*(.160)
Lowest grade first semester 1L year 0.063(.167)
Constant 6.368*** 1.977
Adjusted R-squared 0.112 0.032
Number of observations 684 402
* = p<.05; ** = p<.01; *** = p<.001Coefficients and standard errors for regression analyses on survey samples. Dependent variablesare average number of hours spent per week preparing for each course during the currentsemester. For 1Ls, this only includes the preparation time for their two 1L courses, and not theirelective.

Study on Women’s Experiences at Harvard Law School 82
Appendix XXXVI
Anticipated Course Selection, Regression Analyses
Multiple Corporate/Commercial
Clinical Negotiation
Female -2.409(1.893)
-2.183(1.766)
0.027(1.686)
Nonwhite 0.718(0.426)
-0.852(0.446)
0.837*(0.408)
Left race blank -0.735(0.787)
-1.296(0.798)
0.475(0.792)
Female*Nonwhite -1.249*(0.628)
1.043(0.593)
-0.658(0.538)
Female*Race blank 0.674(1.417)
1.989(1.403)
0.470(1.224)
3L 0.176(0.249)
-0.311(0.234)
-0.579*(0.230)
Joint degree -0.638(0.746)
0.334(0.759)
0.354(0.668)
Years since college 0.050(0.069)
-0.068(0.065)
-0.040(0.065)
Married/committed relationship – local -0.515(0.366)
0.411(0.363)
-0.155(0.374)
Married/committed relationship – long-distance
-0.034(0.453)
-0.478(0.474)
-0.317(0.479)
Female*Married/committed relationship –local
0.463(0.575)
-0.146(0.527)
0.161(0.511)
Female*Married/committed relationship –long-distance
0.052(0.663)
0.513(0.630)
-0.361(0.625)
Highest educ. level for parent of highschool degree or less
0.792(0.436)
0.260(0.421)
-0.332(0.399)
Highest educ. level for parent of collegedegree
0.352(0.318)
-0.286(0.303)
-0.229(0.299)
Undergraduate major infinances/economics
0.489(0.324)
-0.271(0.320)
-0.325(0.313)
Quantitative reasoning skills 0.440***(0.105)
-0.096(0.095)
0.204*(0.095)
Legal reasoning skills -0.076(0.147)
-0.239(0.139)
-0.639***(0.144)
Consensus building skills -0.031(0.117)
0.094(0.111)
0.478***(0.117)
Expectation of working at law firm in 10years
0.357(0.346)
-0.934**(0.353)
0.368(0.350)
Female*Expectation of law firm in 10years
1.380**(0.513)
0.554(0.494)
-0.050(0.487)
Career priority of helping others 0.309(0.402)
0.877*(0.413)
0.097(0.406)
Female*Career priority of helping others -1.894**(0.616)
0.163(0.558)
-0.313(0.522)

Study on Women’s Experiences at Harvard Law School 83
Average grade first semester 1L year -0.175(0.230)
-0.552*(0.232)
0.047(0.230)
Female*Average grade first semester 1Lyear
0.411(0.344)
0.444(0.317)
0.045(0.302)
Constant -0.957(1.404)
4.310***(1.430)
-0.610(1.394)
Pseudo R-squared 0.222 0.164 0.105
Number of observations 404 404 404
* = p<.05; ** = p<.01; *** = p<.001
Coefficients and standard errors for regression analyses on 2L/3L survey sample. The dependentvariables are whether the student had already taken or expected to take multiple courses in corporate orcommercial law; a clinical course; and a negotiation course.

Study on Women’s Experiences at Harvard Law School 84
Appendix XXXVII
Public Interest Employment (1998-2003)
Data from Office of Public Interest Advising on students graduating from 1998 to 2003 taking jobs in public interest after graduationand after clerkships. Public interest employers include the government, non-profit organizations, and legal services. The percentagesof men and women in the graduating class who were in the particular category are listed for each category. Post-clerkship jobplacement data for the class of 1999 is not available at this time from OPIA, and the total (last column) does not include 1999 values.
1998 1999 2000 2001 2002 2003 Total
Graduating StudentsTotal No. 531 553 550 540 545 569 2735% Men 57.8% 59.1% 56.9% 59.6% 53.6% 53.8% 56.3%% Women 42.2% 40.9% 43.1% 40.4% 46.4% 46.2% 43.7%
Accepted Public Interest Jobs Post-GraduationTotal No. 26 33 19 27 28 33 133% of Men in Class in This Category 2.9% 4.9% 1.9% 3.7% 5.5% 4.6% 3.7%% of Women in Class in This Category 7.6% 7.5% 5.5% 6.9% 4.7% 7.2% 6.4%
Accepted Public Interest Job Post-ClerkshipTotal No. 8 N/A 21 17 12 23 81% of Men in Class in This Category 0.7% N/A 2.2% 1.9% 1.7% 2.3% 1.8%% of Women in Class in This Category 2.7% N/A 5.9% 5.0% 2.8% 6.1% 4.5%
Accepted Public Interest Job (Total)Total No. 34 N/A 40 44 40 56 214% of Men in Class in This Category 3.6% N/A 4.2% 5.6% 7.2% 6.9% 5.5%% of Women in Class in This Category 10.3% N/A 11.4% 11.9% 7.5% 13.3% 10.9%P-value (dichotomous) 0.022 --- 0.019 0.051 0.920 0.073 0.000

Study on Women’s Experiences at Harvard Law School 85
Appendix XXXVIII
Low Income Protection Plan (1998-2003)
61%
54%
50%
55%
50%
63%
55%
0%
10%
20%
30%
40%
50%
60%
70%
1998 1999 2000 2001 2002 2003 1998 - 2003
% W
omen
Gender composition of students participating in Low Income Protection Plan (LIPP) from 1998 to 2003 (n=279). The y-axis is thepercentage of students from all graduating classes that participated in LIPP in a given year that were female. The numbers for the classof 2003 are based on the number enrolled in LIPP as of December 31, 2003. The last column is the percentage of members over theentire 1998-2003 range. Data provided by Ken Lafler of the Financial Aid office.

Study on Women’s Experiences at Harvard Law School 86
Appendix XXXIX
Judicial Clerkships (1998-2003)
36% 36%
49%51%
43%
0%
10%
20%
30%
40%
50%
60%
70%
U.S. Sup. Ct. (n=50) U.S. Ct. App. (n=410) U.S. Dist. Ct. (n=459) State/Foreign/Other(n=106)
Total (n=1,025)
% W
omen
Gender composition of students clerking from 1998 to 2003. The y-axis is the percentage of students from all graduating classesthat clerked in a given year at that level that were female. Data provided by Kirsten Solberg of the Office of Career Services.