study on the value of lost load of electricity supply … · study on the value of lost load of...
TRANSCRIPT

STUDY ON THE VALUE OF LOST LOAD OF ELECTRICITY SUPPLY IN EUROPE ‐ ACER
Cambridge Economic Policy AssociatesPresentation of findings – Brussels18/06/2018
Lewis Heather – Managing ConsultantDaniel Mitchell – ConsultantWill Glevey ‐ Economist
Page 1
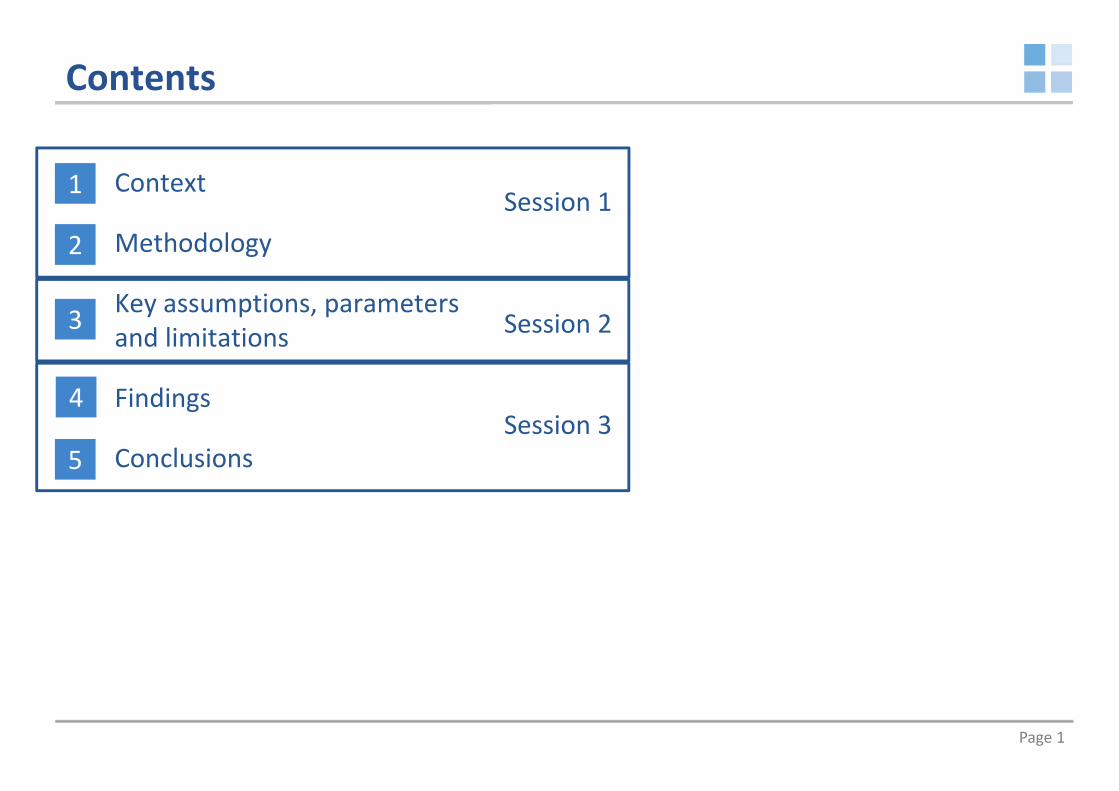
Contents
Context
Methodology
Key assumptions, parameters and limitations
Findings
Conclusions5
4
3
2
1 Session 1
Session 2
Session 3

Page 2
CONTEXT1

Page 3
Cambridge Economic Policy Associates (CEPA)
CEPA, from its offices in London and
Sydney, advises a wide range of clients,
including government departments,
sector regulators, international
organisations, non‐governmental
organisations, foundations, private sector
companies and consumer groups across
every continent.
CEPA is an economic and financial policy consulting business. We
advise clients on issues where economics, finance and public policy
overlap.
Contact us:

Page 4
• CEPA commissioned to undertake projectDecember 2017
• Task B preliminary report submitted to ACER and NRAs for commentFebruary 2018
• Task A report submitted following ACER and NRA commentApril 2018
• Task A and B draft report submitted for ACER and NRA commentMay 2018
• Task A and B final report due for submission22 June 2018
Process so far – Thanks to those who have supported our work
Context
Consum
er su
rveys

Page 5
• To provide you with an understanding of our methodology• To present our results• To discuss limitations of our research• To explore practical applications of our findings
Scope of discussion• The final report is due on Friday (22nd June)• Thank to those NRAs who have provided comments on our draft report (8th
June)• Minor presentational changes can be incorporated following this workshop• However, revisions to the methodology or the addition of new analysis is
not within scope
Aims for this workshop
Context

Page 6
Value of lost load (VoLL)“The value attributed by consumers to unsupplied energy”
The European Union Electricity Market Glossary
Value of lack of adequacy (VoLA)“The value attributed by consumers to unsupplied energy given advance notification”
ACER/CEPA definition*
VoLL and VoLA
Context
*NB: For this project, ACER specified consideration of advance notice of one day

Page 7
1. Review and assess the concept of VoLL in electricity supply:
• Conduct review of academic literature
• Analyse and identify relevant consumer types
• Group these into groups of meaningful homogeneity
2. Provide numerical estimates of VoLL for each consumer type/group per Member State:
• Take into account individual MS specificities
• Consider the context of different regulatory applications
• Evaluate the opportunity to differentiate VoLL by impact of timing, duration and provision of notice
Two key objectives
Objectives
In this presentation, we focus on the VoLL estimates that we have derived (i.e. objective 2)

Page 8
METHODOLOGY2

Page 9
MethodologyTwo analytical methodologies employed
1. Primary approach: Production‐function methodology
• Used to develop ‘headline’ VoLL estimates• Based on the assumption that electricity is a fundamental input for the enjoyment of leisure and for productive output
• Made use of publicly available EU data• Best placed to meet ACER’s objectives: Allowed consistent and objective approach covering all consumers in the EU
2. Supporting research: Domestic and non‐domestic consumer surveying
• Designed to support primary methodology• Used to refine key assumptions• Also used to evaluate additional requirements – e.g. impact of duration of outage and notice
• Was not intended to develop VoLL estimates
Page 10
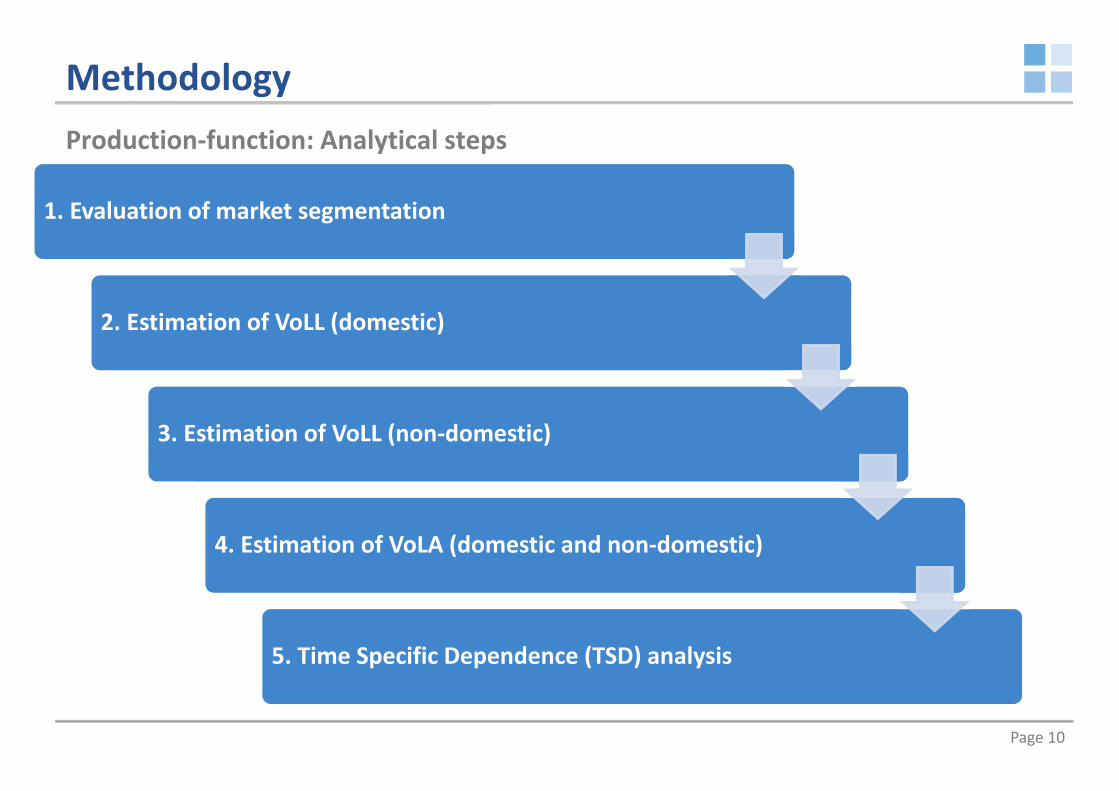
MethodologyProduction‐function: Analytical steps
1. Evaluation of market segmentation
2. Estimation of VoLL (domestic)
3. Estimation of VoLL (non‐domestic)
4. Estimation of VoLA (domestic and non‐domestic)
5. Time Specific Dependence (TSD) analysis

Page 11
MethodologyProduction‐function methodology: VoLL Calculation
Step 1: Calculate the leisure value for households in each MS
•1a: Estimate time spent on leisure activities by employed individuals.•1b: Calculate the value of leisure for employed individuals. •1c: Develop assumptions of the ‘substitutability factor’: the proportion of leisure value that is reliant on the supply of electricity.•1d: Apply assumption regarding the value of leisure time for non‐employed individuals (the ‘non‐employment' factor).
Step 2: Calculate average household VoLL for each MS
•
•where LVMS = household leisure value and ELCMS = annual household electricity consumption.
Page 12
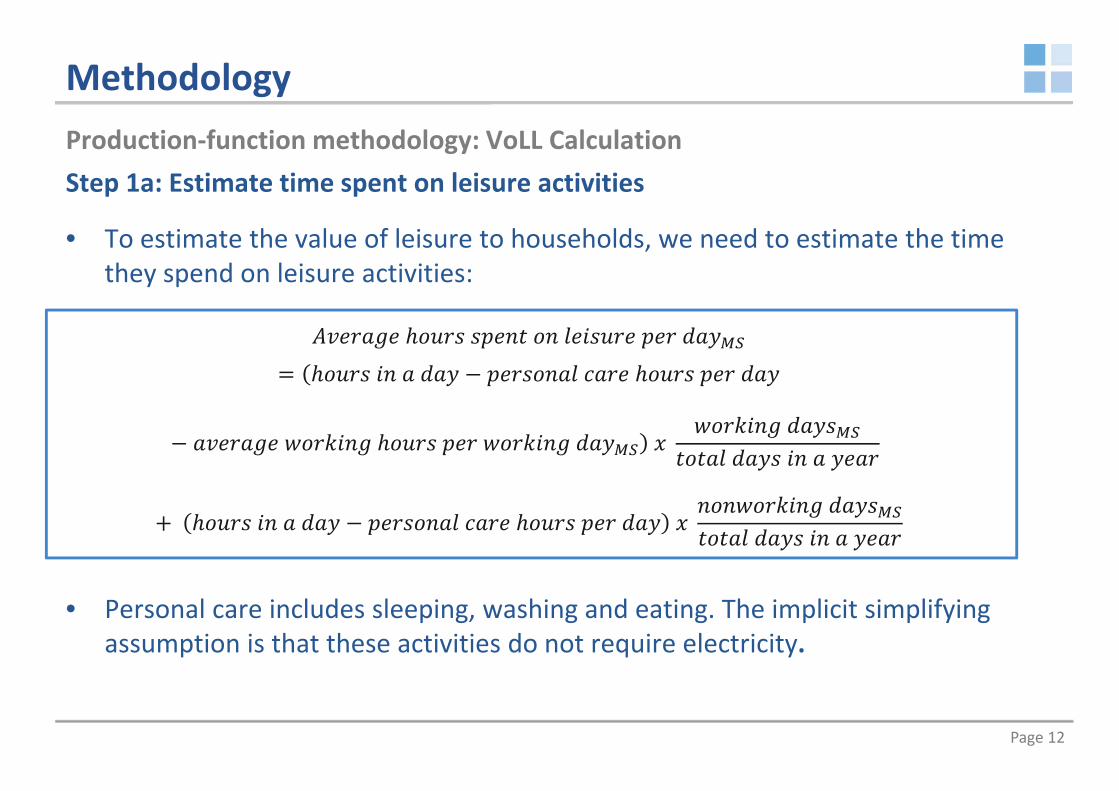
Step 1a: Estimate time spent on leisure activities
• To estimate the value of leisure to households, we need to estimate the time they spend on leisure activities:
• Personal care includes sleeping, washing and eating. The implicit simplifying assumption is that these activities do not require electricity.
MethodologyProduction‐function methodology: VoLL Calculation
Page 13
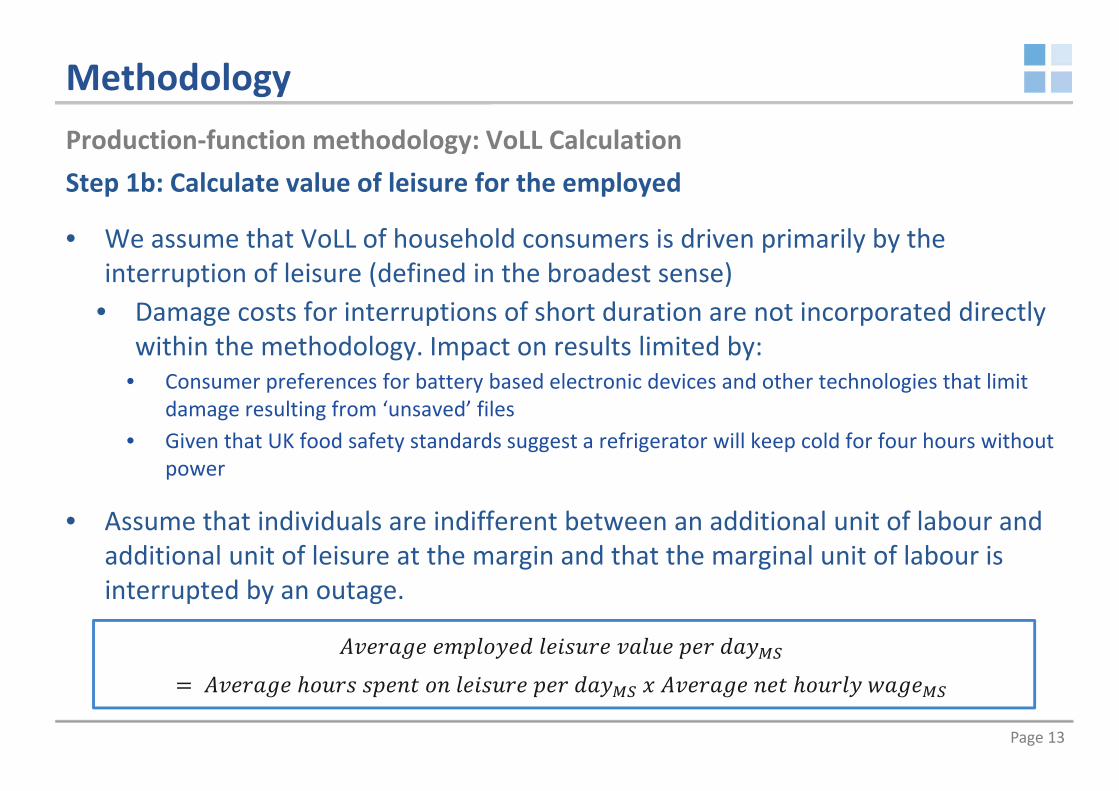
Step 1b: Calculate value of leisure for the employed
• We assume that VoLL of household consumers is driven primarily by the interruption of leisure (defined in the broadest sense)
• Damage costs for interruptions of short duration are not incorporated directly within the methodology. Impact on results limited by:
• Consumer preferences for battery based electronic devices and other technologies that limit damage resulting from ‘unsaved’ files
• Given that UK food safety standards suggest a refrigerator will keep cold for four hours without power
• Assume that individuals are indifferent between an additional unit of labour and additional unit of leisure at the margin and that the marginal unit of labour is interrupted by an outage.
MethodologyProduction‐function methodology: VoLL Calculation

Page 14
Steps 1c and 1d: The substitutability factor and non‐employed coefficient
• Without incorporating additional assumptions, our estimate of leisure value would have two limitations:1. It assumes that 100% of the value of leisure is dependent on electricity2. It assumes that those who are not employed value an hour of leisure at the
same level as those who are employed.
• We incorporate these considerations into our analysis using two coefficients:• Substitutability factor (s.f.): Reflects the proportion of leisure that is
dependent on electricity. A high s.f. (close to 100%) represents a high level of dependence on electricity.
• Non‐employed coefficient: Reflects the lower value placed on an hour of leisure by those who are not employed.
MethodologyProduction‐function methodology: VoLL Calculation
Previous literature has generally assumed s.f. and non‐employed coefficients of 50%

Page 15
Steps 1c and 1d: The substitutability factor and non‐employed coefficient
• Using the s.f. and non‐employed coefficient, we can identify the total value of leisure that is dependent on electricity for each Member State:
MethodologyProduction‐function methodology: VoLL Calculation
)
Page 16
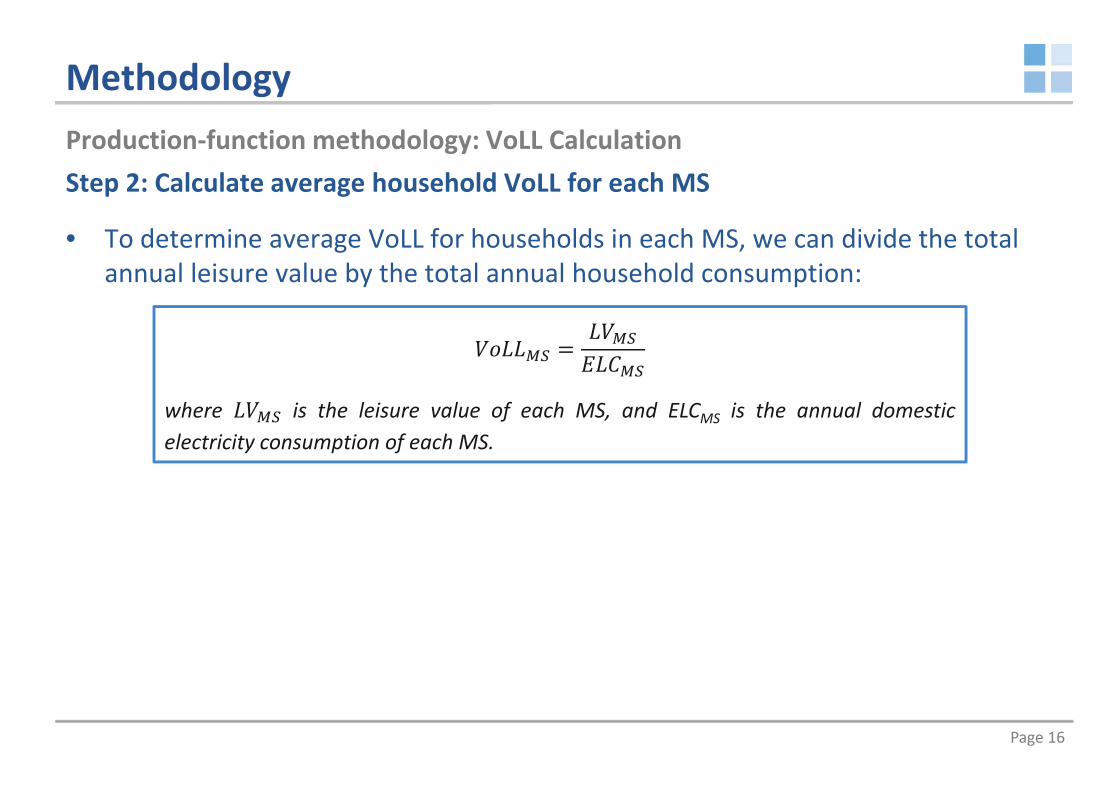
Step 2: Calculate average household VoLL for each MS
• To determine average VoLL for households in each MS, we can divide the total annual leisure value by the total annual household consumption:
MethodologyProduction‐function methodology: VoLL Calculation
where is the leisure value of each MS, and ELCMS is the annual domesticelectricity consumption of each MS.

Page 17
Calculating Value of Lack of Adequacy (VoLA)
• To incorporate the impact of providing one day of notice ahead of an outage, we can introduce a new factor into our equation.
• We define the ‘notice factor’.
• This captures the reduced impact on the value of leisure (e.g. due to re‐planning leisure activities) by providing one day of notice ahead of the interruption.
• As with the s.f., a high notice factor (close to one), indicates that dependence on electricity remains high even when notice is provided.
MethodologyThe impact of notice ahead of an outage

Page 18
Considering outages of different duration
• We have evaluated the relative impact of outages of differing durations by comparing willingness to accept of consumers in response to outages of three durations:
• 20 minutes• 2 hours• 48 hours
• We have also combined this with consideration of notice to evaluate the combined impact of notice and duration – e.g. considering whether the value of notice changes depending on the duration of the outage.
MethodologyThe impact of duration

Page 19
To consider the time‐specific nature of dependence on electricity, we use the demand factor:
This allowed us to define the TSD:
MethodologyTime‐specific dependence analysis
Time of day
• Day (8am to 8pm)
• Night (8pm to 8am)
Day of week
• Weekday• Saturday• Sunday
Time of year
• Spring• Summer• Autumn• Winter
,
,
,
,
Time dimensions considered for TSD analysis

Page 20
Methodology
• Conceptually similar for non‐domestic and domestic consumers
• Rather than the value of leisure, we consider the impact of an outage on productive output, measured using gross value added (GVA)
• We also make use of an s.f. for non‐domestic consumers.
• However , we expected that this would be different to that of domestic consumers
• Previous literature has often used an s.f. of 100%. i.e. the assumption is that non‐domestic consumers are completely dependent on electricity and that all output would stop in the event of an outage
Non‐domestic consumer analysis
, ,

Page 21
KEY ASSUMPTIONS, PARAMETERS AND LIMITATIONS
3
Page 22
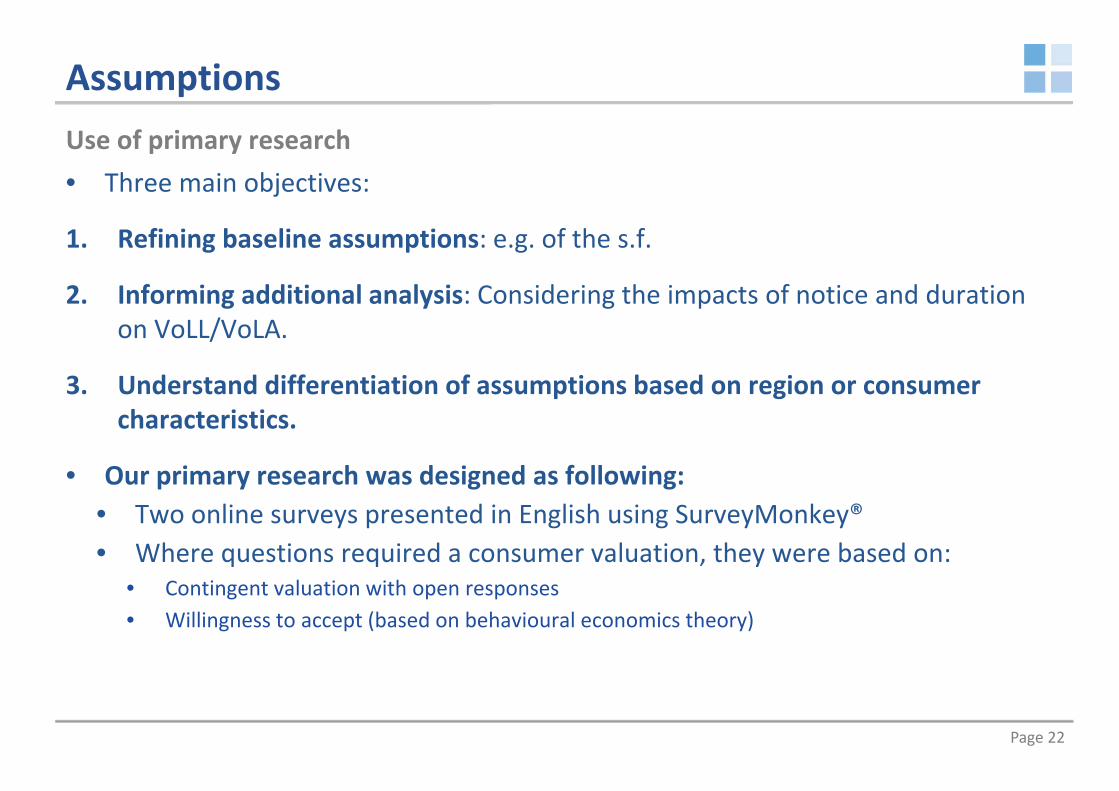
Assumptions
• Three main objectives:
1. Refining baseline assumptions: e.g. of the s.f.
2. Informing additional analysis: Considering the impacts of notice and duration on VoLL/VoLA.
3. Understand differentiation of assumptions based on region or consumer characteristics.
• Our primary research was designed as following:• Two online surveys presented in English using SurveyMonkey® • Where questions required a consumer valuation, they were based on:
• Contingent valuation with open responses• Willingness to accept (based on behavioural economics theory)
Use of primary research

Page 23
Assumptions
• Primary research has supported our analysis in a number of areas:Use of primary research
Assumption Role of primary research Impact on analysis
Substitutability factor (domestic)
Refined 50% assumption used in literature
Revised s.f. with potential for differentiation between consumers
Substitutability factor (non‐domestic)
Refined 100% assumption used in literature
Revised s.f. with potential for differentiation between consumers
Notice factor (all) Provided evidence base for evaluation of VoLA
Incorporated evidenced notice factor into analysis
Impact of duration (all)
Evaluated WTA in response to a range of outage durations
Considered impact of duration on WTA, and interaction with provision of notice
Time specific dependence analysis (all)
Corroborated TSD analysis Supported consideration of time specific analysis in EU and U.K.
Page 24
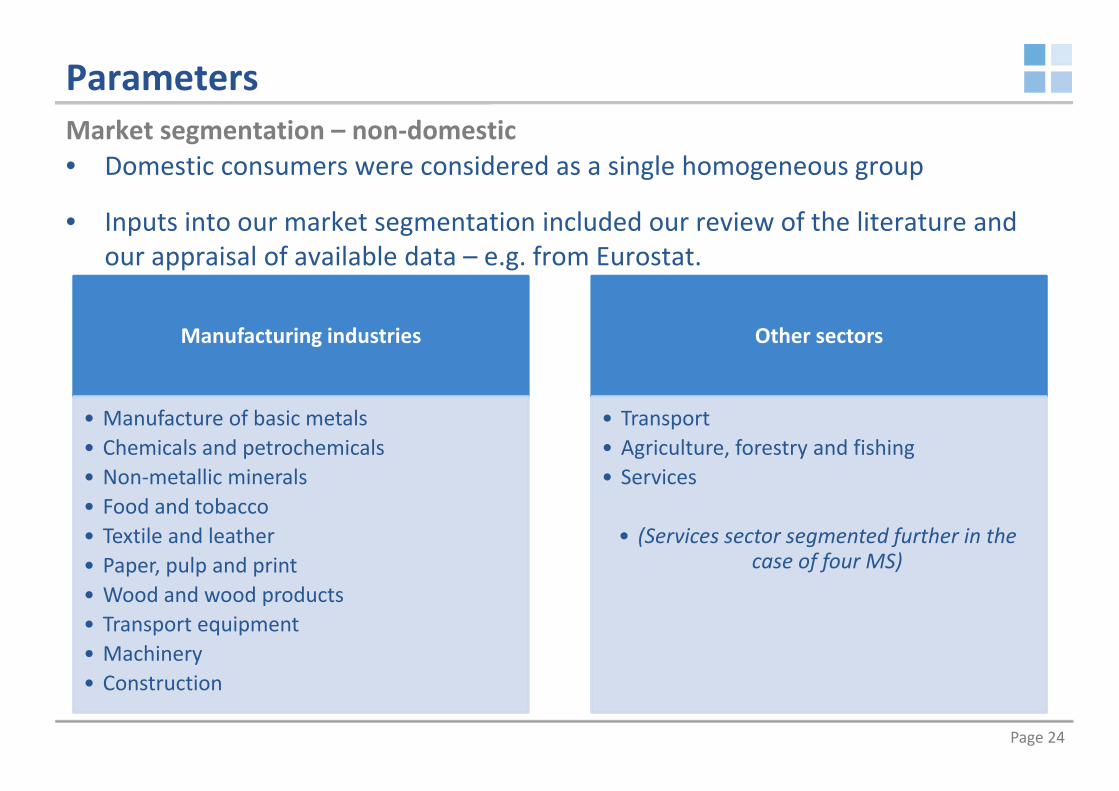
ParametersMarket segmentation – non‐domestic
Manufacturing industries
• Manufacture of basic metals• Chemicals and petrochemicals• Non‐metallic minerals• Food and tobacco• Textile and leather• Paper, pulp and print• Wood and wood products• Transport equipment• Machinery• Construction
Other sectors
• Transport• Agriculture, forestry and fishing• Services
• (Services sector segmented further in the case of four MS)
• Domestic consumers were considered as a single homogeneous group
• Inputs into our market segmentation included our review of the literature and our appraisal of available data – e.g. from Eurostat.

Page 25
ParametersMember State Categorisation ‐ Regions
Northern Europe
• Denmark• Estonia• Finland• Ireland• Latvia• Lithuania• Sweden• UK
Eastern Europe
• Bulgaria• Czech Republic• Hungary• Poland• Romania• Slovakia
Southern Europe
• Croatia• Cyprus• Greece• Italy• Malta• Portugal• Slovenia• Spain
Western Europe
• Austria• Belgium• France• Germany• Luxembourg• Netherlands

Page 26
ParametersMember State Categorisation – Relative income
Above median income
• Austria• Belgium• Denmark• Finland• France• Germany• Ireland• Italy• Luxembourg• Malta• Netherlands• Spain• Sweden• UK
Below median income
• Bulgaria• Croatia• Cyprus• Czech Republic• Estonia• Greece• Hungary• Latvia• Lithuania• Poland• Portugal• Romania• Slovakia• Slovenia

Page 27
Primary research draft findingsUse of primary research – Response assessmentDomestic survey:
• Number of responses: >600
• Respondents who answered all questions: >500
• Regional contribution: • At least one response from all MS apart from Malta• 17 MS submitted at least 10 responses• Six MS submitted at least 50 responses
Page 28
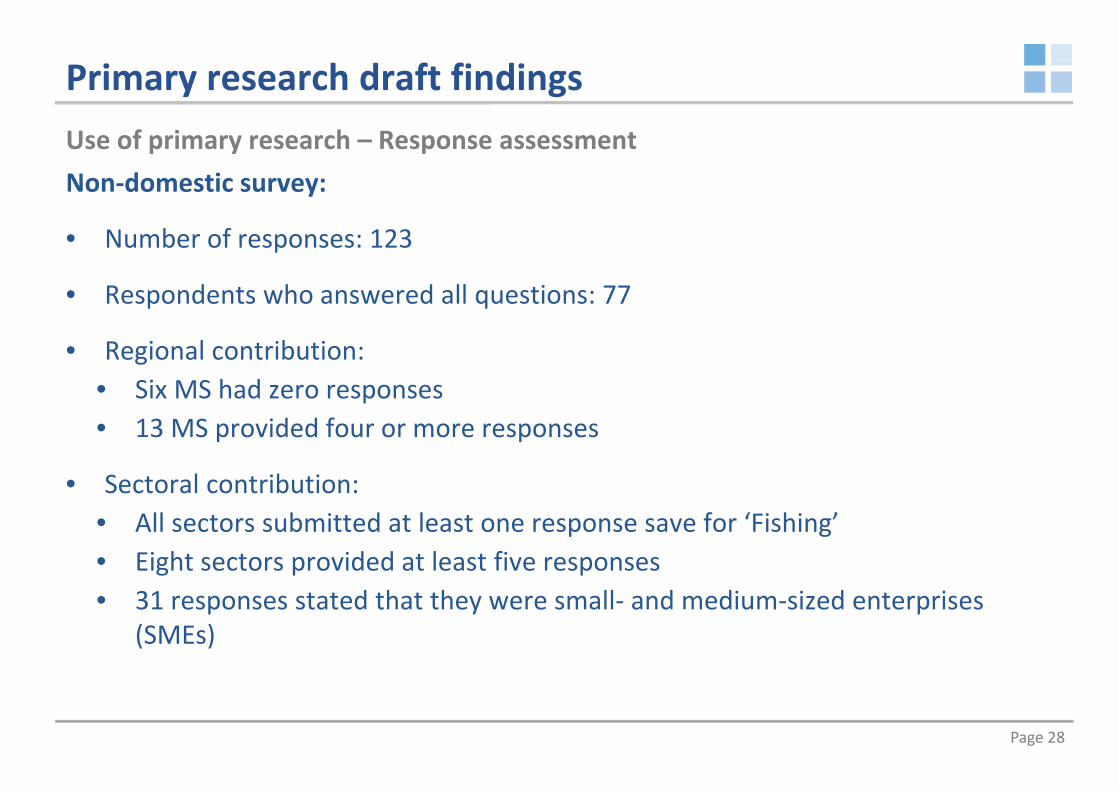
Primary research draft findingsUse of primary research – Response assessmentNon‐domestic survey:
• Number of responses: 123
• Respondents who answered all questions: 77
• Regional contribution: • Six MS had zero responses• 13 MS provided four or more responses
• Sectoral contribution:• All sectors submitted at least one response save for ‘Fishing’• Eight sectors provided at least five responses• 31 responses stated that they were small‐ and medium‐sized enterprises
(SMEs)

Page 29
Primary research draft findingsStated substitutability factors (s.f.) ‐ Domestic
• The s.f. represents the extent to which domestic consumers are dependent on electricity for their
leisure. A higher substitutability factor represents greater dependence.
• The literature has often assumed an s.f. of 50%
• We find a statistically different s.f. for North‐EU MS and MS outside of northern Europe.
We have used an s.f. of 63.1% for northern European MS and 58.3% for all other MS
Disaggregation Responses Average substitutability factor
Overall 609 59.4%
Region
Northern Europe 145 63.1%
Eastern Europe 176 58.9%
Southern Europe 91 58.0%
Western Europe 197 57.9%
IncomeRelatively High 368 59.6%
Relatively Low 241 59.1%
Page 30
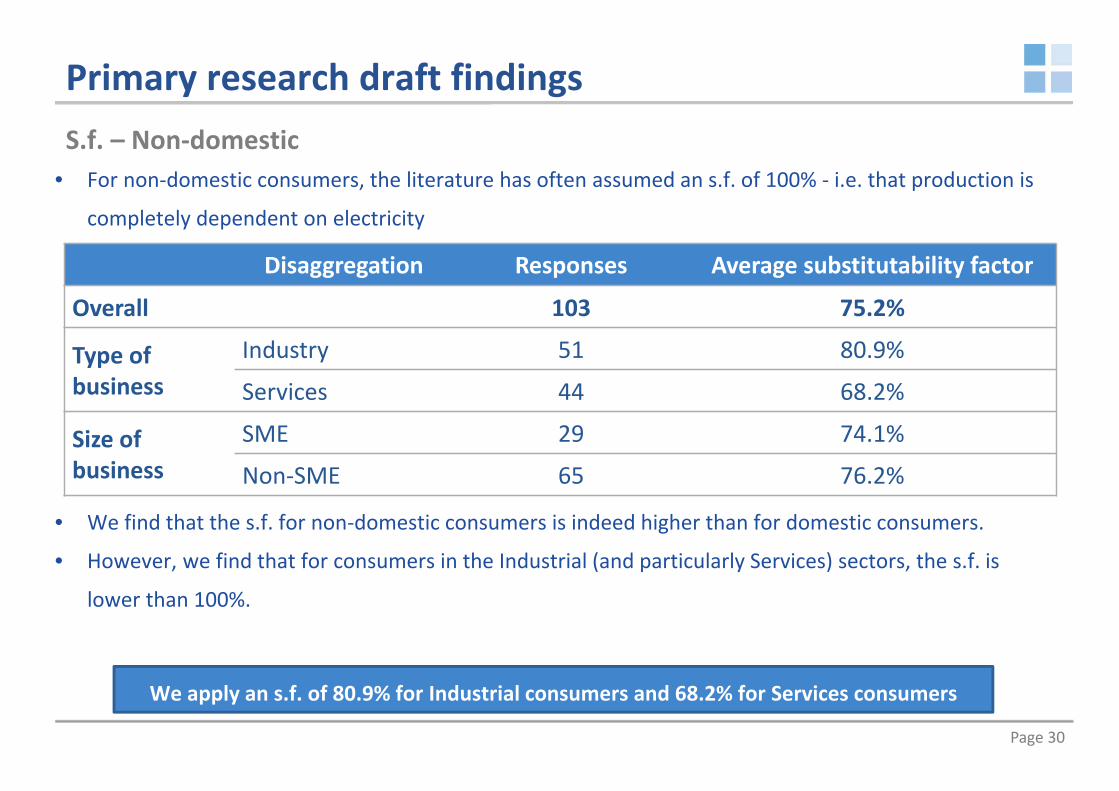
Primary research draft findingsS.f. – Non‐domestic
• For non‐domestic consumers, the literature has often assumed an s.f. of 100% ‐ i.e. that production is
completely dependent on electricity
• We find that the s.f. for non‐domestic consumers is indeed higher than for domestic consumers.
• However, we find that for consumers in the Industrial (and particularly Services) sectors, the s.f. is
lower than 100%.
We apply an s.f. of 80.9% for Industrial consumers and 68.2% for Services consumers
Disaggregation Responses Average substitutability factor
Overall 103 75.2%
Type of business
Industry 51 80.9%
Services 44 68.2%
Size of business
SME 29 74.1%
Non‐SME 65 76.2%

Page 31
Primary research draft findingsImpact of duration of outage on WTA ‐ Domestic
Domestic WTA per hour relative to a 2‐hour outage WTA
WTA increases but marginal WTA decreases with duration of outage
WTA
per hou
r relative to a 2‐hou
r outag
e
Outage duration

Page 32
Primary research draft findingsImpact of notice (VoLA) ‐ Domestic
Implied notice factor over time
Notice is less beneficial when consumers ultimately face an outage of longer duration
Implied no
tice factor
Outage duration

Page 33
Primary research draft findingsImpact of duration on WTA – Non‐domestic
Non‐domestic WTA per hour relative to a 2‐hour outage WTA
The decrease in marginal WTA is even more pronounced for non‐domestic consumers
WTA
per hou
r relative to a 2‐hou
r outag
e
Outage duration

Page 34
Primary research draft findingsImpact of notice (VoLA) – Non‐domestic
Implied Industrial notice factor over time, non‐domestic survey
Notice is less beneficial with increasing duration, but it is less beneficial for non‐domestic
than for domestic consumers
Implied no
tice factor
Outage duration

Page 35
RecapAdvantages of our approach
• Consistent and objective application across Europe • Developed scientific evidence‐base for assumptions and specific
requirements using supporting research • Easily replicated • Can be readily built on through refinement of specific assumptions
over time • Not dependent on occurrence of an outage (direct methods) • Not subject to subjectivity or cultural differences (stated
preference) • Applicable within time and budget constraints
Page 36
LimitationsProduction‐function methodology• Dependent on data availability and quality
• Dependent on key assumptions:
• Labour theory assumption that hourly wage is equivalent to the marginal unit of leisure
• Marginal lost hour of leisure equivalent to average lost hour of leisure
• VoLL is driven primarily by direct effect of loss of leisure or GVA. More challenging to
incorporate consideration of indirect effects such as damages
• Value of leisure of employed individuals is used as a basis for leisure value of non‐
employed
• Considers a number of aggregated consumption sectors which may contain heterogeneous
consumers
• Difficult to consider impact of additional factors including duration, notice and timing directly
• Can result in seemingly high VoLL estimates for consumers/sectors with small levels of
consumption
Page 37
LimitationsProduction‐function methodology – data limitationsThree data limitations were identified:
1. A mismatch between GVA and electricity consumption data: Granularity of
consumption data constrained our disaggregation of non‐domestic consumers.
However, the number of sectors included in our analysis is at the upper bound of
previous literature.
2. Missing data points: There were a number of missing data points that we needed
to fill using assumptions. These were mostly limited to Malta and Luxembourg.
3. Lack of EU hourly load data at a disaggregated consumer level: Our TSD analysis
therefore assumed that demand factors were primarily driven by domestic
consumers. We used a case study using data for Great Britain to test this
assumption.

Page 38
Limitations
Limitation Potential impact on results
Web‐based survey Sample bias
Survey in English only Sample bias
Approach to promoting responses (through NRAs and direct channels)
Sample biasStrategic responses
Use of WTA, contingent valuation Limited scope for estimation of VoLL
Lack of incentive for honest responses Limited scope for estimation of VoLLStrategic responses
Sample size Prevents detailed analysis with statistical significance
Primary research• Our survey was designed to elicit relative considerations, e.g. of the impact of duration and the
provision of notice on VoLL. It was not designed to identify an absolute measure of VoLL.
• The survey was designed to maximise benefits within budget and time constraints.
• Within this narrow scope, we believe that the impact of these limitations was small.
• However, we do note the following limitations:

Page 39
DRAFT FINDINGS4

Page 40
Draft findings
• Domestic VoLL estimates• Regional differentiation
• Non‐domestic VoLL estimates• Differentiation by consumer type• Consideration of Industrial and Services sector
• Time‐specific dependence analysis
What we will discuss
Page 41
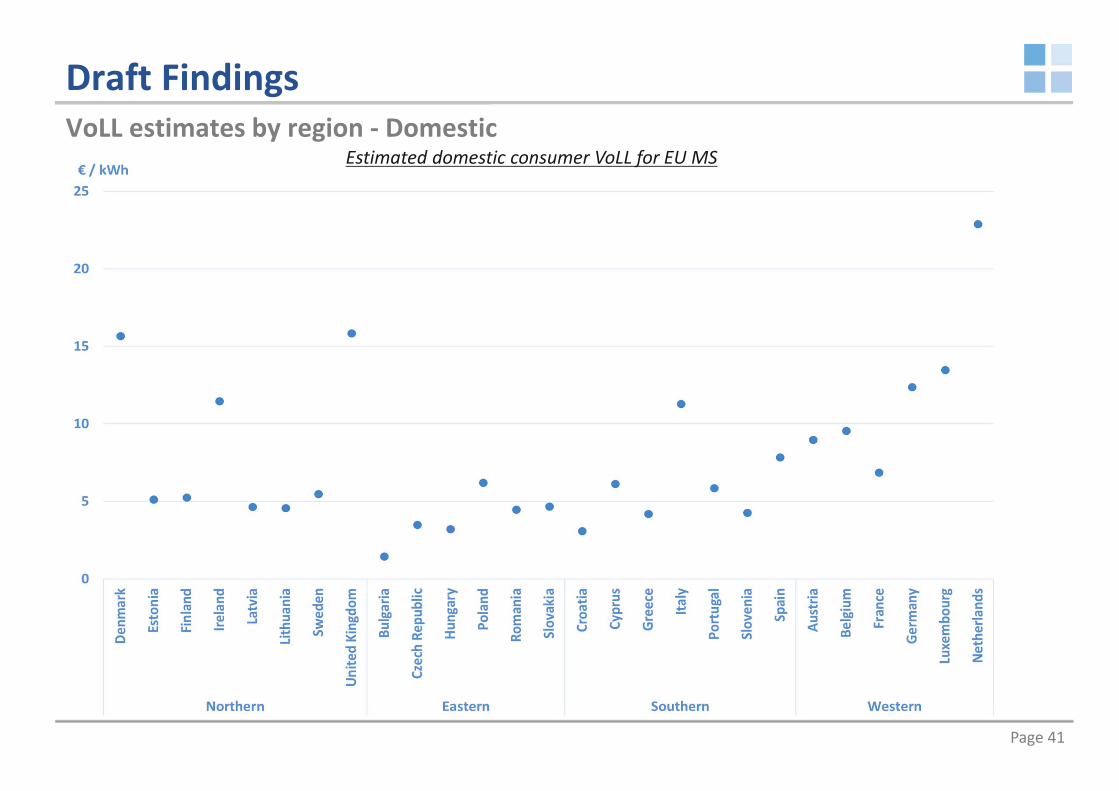
Draft FindingsVoLL estimates by region ‐ Domestic
Estimated domestic consumer VoLL for EU MS

Page 42
Draft FindingsVoLL estimates by region ‐ Domestic
Estimated domestic VoLL ranges for EU member states by region
VoLL estimates range from €1.50/kWh for Bulgaria to €22.94/kWh for the Netherlands
VoLL generally higher for more northern MS with higher income levels
Page 43
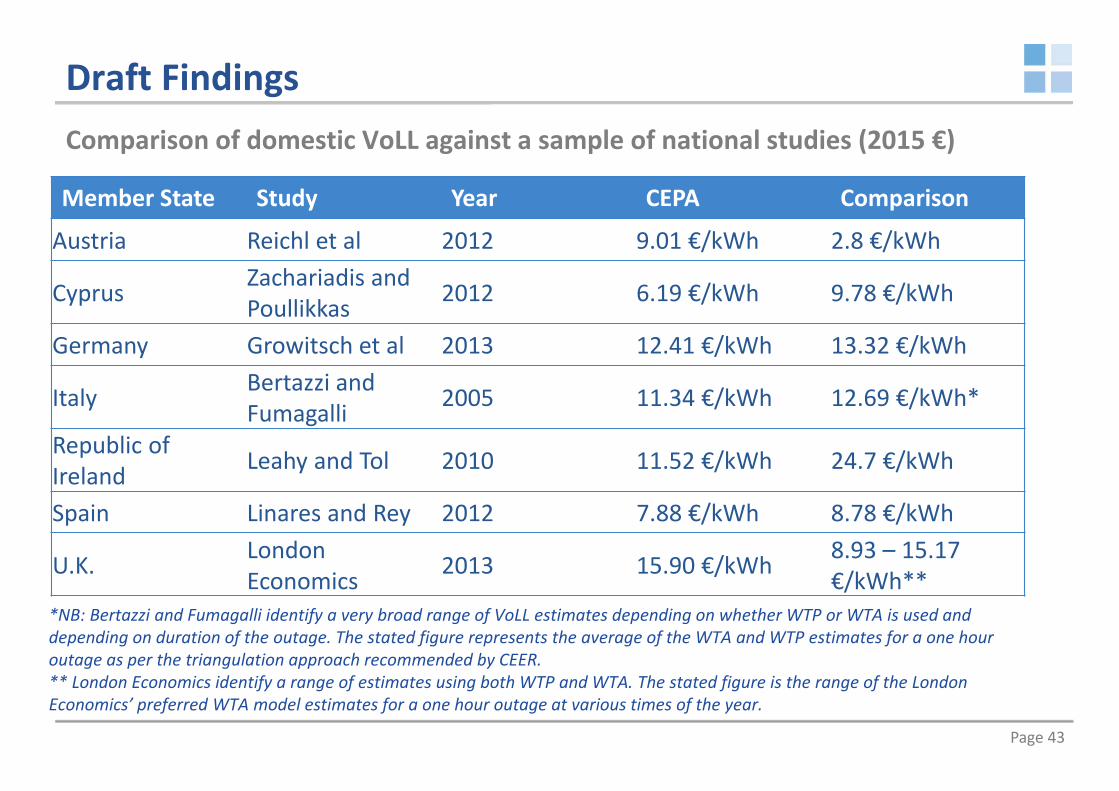
Draft Findings
Member State Study Year CEPA Comparison
Austria Reichl et al 2012 9.01 €/kWh 2.8 €/kWh
Cyprus Zachariadis and Poullikkas 2012 6.19 €/kWh 9.78 €/kWh
Germany Growitsch et al 2013 12.41 €/kWh 13.32 €/kWh
Italy Bertazzi and Fumagalli 2005 11.34 €/kWh 12.69 €/kWh*
Republic of Ireland Leahy and Tol 2010 11.52 €/kWh 24.7 €/kWh
Spain Linares and Rey 2012 7.88 €/kWh 8.78 €/kWh
U.K. London Economics 2013 15.90 €/kWh 8.93 – 15.17
€/kWh**
Comparison of domestic VoLL against a sample of national studies (2015 €)
*NB: Bertazzi and Fumagalli identify a very broad range of VoLL estimates depending on whether WTP or WTA is used and depending on duration of the outage. The stated figure represents the average of the WTA and WTP estimates for a one hour outage as per the triangulation approach recommended by CEER.** London Economics identify a range of estimates using both WTP and WTA. The stated figure is the range of the London Economics’ preferred WTA model estimates for a one hour outage at various times of the year.

Page 44
Draft FindingsVoLL estimates by sector – Non‐domestic
Estimated non‐domestic VoLL ranges across all EU MS by
sector (excluding Construction and Transport)
Some sectors demonstrate a relatively broad range of VoLL across the EU

Page 45
Draft FindingsVoLL estimates by sector – Non‐domestic (2)
Estimated non‐domestic VoLL ranges across all EU MS by
sector (Construction and Transport)
Possible outliers seem particularly pronounced for Transport and Construction industries

Page 46
Draft Findings
We provide three hypotheses to rationalise outliers:
1. VoLL is ‘normalised’ using consumption:• VoLL is measured ‘per unit of electricity consumed’. • Hence, where a high level of output is produced using a low level of
electricity, VoLL may reach very high levels.• However, intuition may expect VoLL to correlate with level of consumption.
2. Assumptions in relation to ‘criticality’ of input:• Our s.f. is designed to reflect the level of ‘criticality’ of input.• However, our research does not allow for very granular analysis of the s.f. of
particular industries.• Hence, a lower s.f. for certain industries may lead to lower VoLL estimates.
3. Data reporting:• Inconsistencies in data reporting and sector definitions may lead to anomalies
or may exacerbate those other hypotheses above.
VoLL estimates by sector – Non‐domestic (3)

Page 47
Draft Findings
Member State Comparison paper
Year CEPA Comparison**
Cyprus Zachariadis and Poullikkas 2012 0.45 – 5.45
€/kWh 2.06 €/kWh
Germany Growitsch et al 2013 0.41 – 6.09 €/kWh 1.81 €/kWh
Republic of Ireland Leahy and Tol 2010 0.34 – 10.77
€/kWh 4 €/kWh
Spain Linares and Rey 2012 0.28 – 4.76 €/kWh 1.49 €/kWh
UK London Economics 2013 0.51 – 5.53
€/kWh0.43 – 14.07 €/kWh***
Comparison of Industry sector VoLL against a sample of national studies* (2015 €)
*NB: We have excluded the Transport and Construction sectors from the ranges presented to align with that presented in national reports.**NB: Note that few studies consider Industrial consumers at the same level of disaggregation as measured in our study. Hence a broad range around the point of comparison is to be expected. Inconsistent definitions between studies warrant caution in comparison.*** Stated range is of disaggregated industrial sectors from both London Economics’ ‘capacity’ and ‘utilisation’ methodology approaches

Page 48
Draft Findings
Member State
Comparison paper
Year CEPA Comparison CEPA (100% s.f)
Cyprus Zachariadis and Poullikkas 2012 4.65 €/kWh 6.60 €/kWh 6.81 €/kWh
Germany Growitsch et al 2013 8.55 €/kWh 12.34 €/kWh 12.53 €/kWh
Republic of Ireland Leahy and Tol 2010 13.97 €/kWh 13 ‐ 14 €/kWh20.48 €/kWh
Spain Linares and Rey 2012 6.64 €/kWh 9.17 €/kWh 9.73 €/kWh
Comparison of Services sector VoLL against a sample of national studies (2015 €)
• Our headline VoLL estimates are generally about 2/3rds of that found in previous national studies.
• The difference can be explained by our application of an evidence‐based substitutability factor for Services consumers.

Page 49
Draft FindingsTSD analysis ‐ Domestic
Domestic consumer TSD ranges for EU MS

Page 50
CONCLUSIONS5

Page 51
Conclusions
Feature of our report Applications
Pan‐EU VoLL estimates All applications – particularly those which apply cross‐border
VoLL estimates by sector National network planning; interruptions incentives and compensation
Informing demand‐side‐response programmes
Informing the order of disconnectionImpact of duration System adequacy measures
Procurement of balancing and back‐up services
Defining interruptions incentives and compensationImpact of notice Network planning (at all levels)
Interruptions incentives and compensation
Informing demand‐side response programmesTime‐varying analysis Network planning
Cost benefit analyses
Design of capacity markets
Procurement of balancing and back‐up services
Interruptions incentives and compensation
Application of different areas of our analysis

Page 52
Conclusions
Area of further work Description
Granular analysis of s.f. and notice factors
More granular (e.g. at National level) would allow :
• Validation of the findings of our research;
• Granular refinement of assumptions – e.g. depending on type of consumer or nationality
• Allow consideration of different notice periods (other than one day)TSD analysis Obtaining profiled consumption data with disaggregation by consumer type
would allow more granular analysis of the TSD of different types of electricity consumers
Outlier analysis More detailed analysis of consumers who represent outliers (e.g. the Construction industry) would allow the reasons for these results to be better understood
Analysis of disaggregated ‘Services’ sectors
Where available, disaggregated consumption data for Services consumers has allowed differentiation of this potentially heterogeneous consumer group. Gathering additional data would allow such estimates to be obtained across the EU
Proposed areas for further research

Page 53
Cambridge Economic Policy Associates (CEPA)
CEPA, from its offices in London and
Sydney, advises a wide range of clients,
including government departments,
sector regulators, international
organisations, non‐governmental
organisations, foundations, private sector
companies and consumer groups across
every continent.
CEPA is an economic and financial policy consulting business. We
advise clients on issues where economics, finance and public policy
overlap.
Contact us:

Page 54
APPENDICES

Page 55
ADDITIONAL STUDIES AND SENSITIVITIESA

Page 56
Draft FindingsDisaggregated Services sector analysis (based on four MS only)
Estimated Services VoLL range by disaggregated sector

Page 57
Draft FindingsSensitivity analysis – Non‐employment factor
Domestic VoLL sensitivity analysis ranges, grouped by region
Page 58
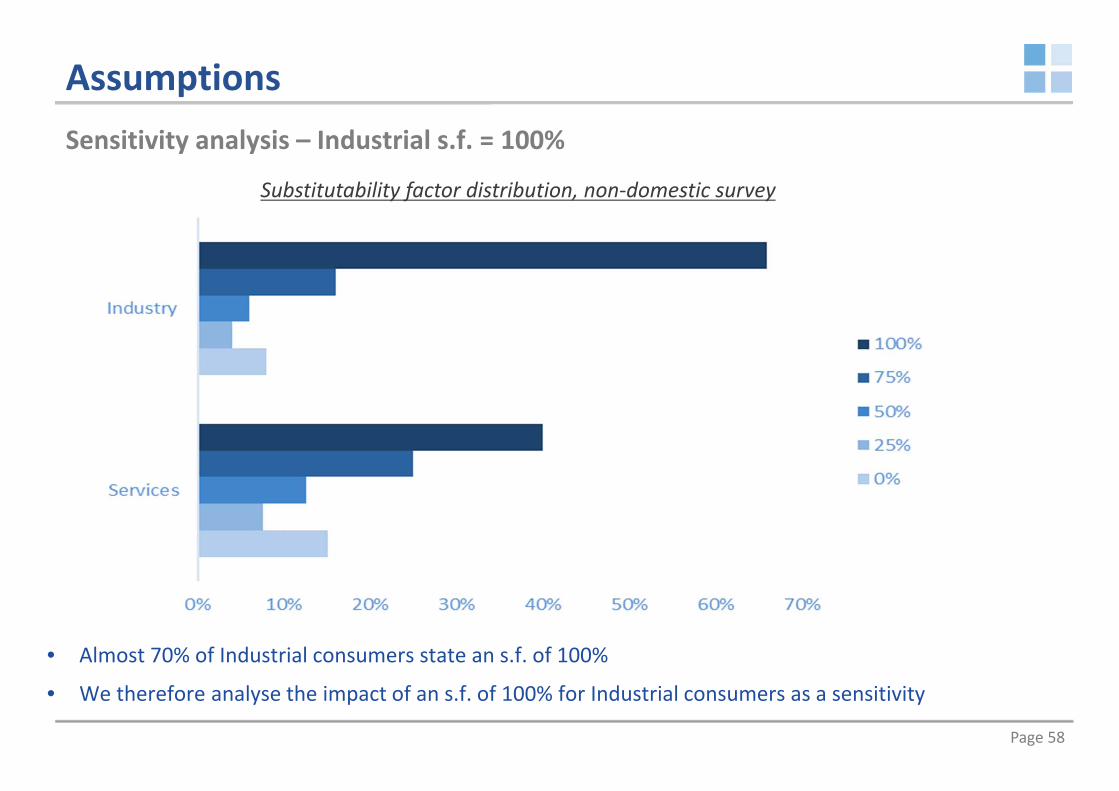
AssumptionsSensitivity analysis – Industrial s.f. = 100%
Substitutability factor distribution, non‐domestic survey
• Almost 70% of Industrial consumers state an s.f. of 100%
• We therefore analyse the impact of an s.f. of 100% for Industrial consumers as a sensitivity
Page 59
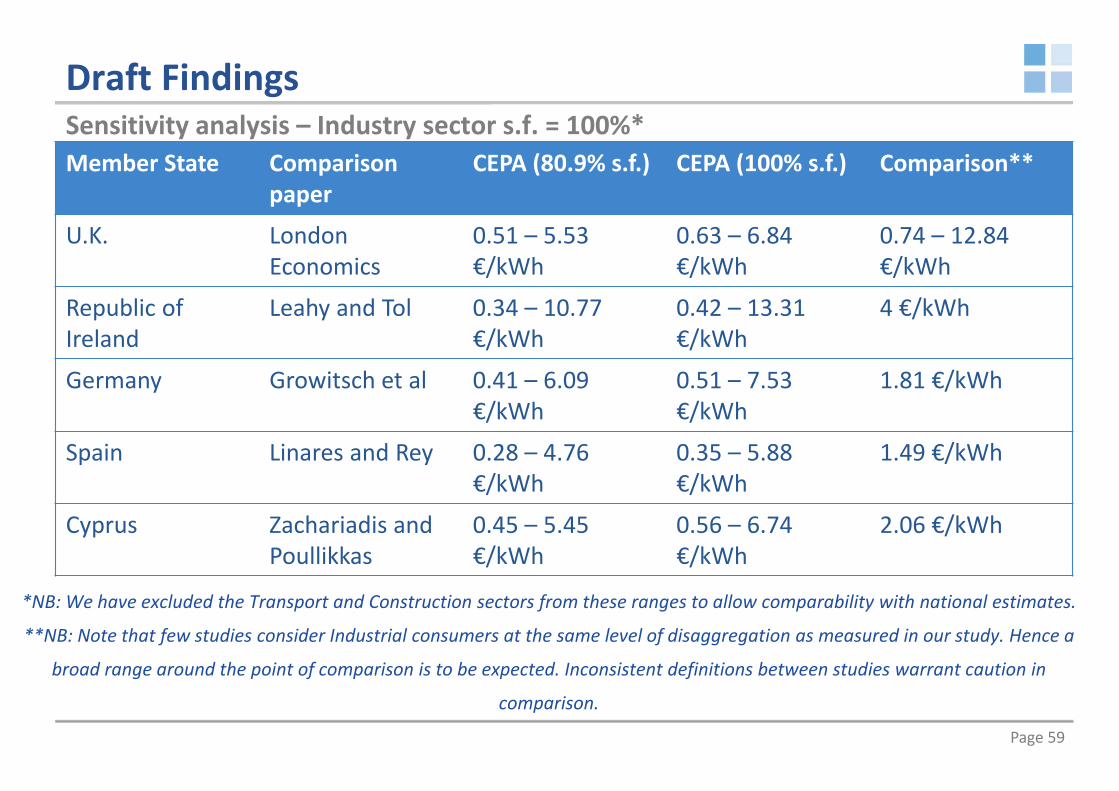
Draft Findings
Member State Comparison paper
CEPA (80.9% s.f.) CEPA (100% s.f.) Comparison**
U.K. London Economics
0.51 – 5.53 €/kWh
0.63 – 6.84 €/kWh
0.74 – 12.84 €/kWh
Republic of Ireland
Leahy and Tol 0.34 – 10.77 €/kWh
0.42 – 13.31 €/kWh
4 €/kWh
Germany Growitsch et al 0.41 – 6.09 €/kWh
0.51 – 7.53 €/kWh
1.81 €/kWh
Spain Linares and Rey 0.28 – 4.76 €/kWh
0.35 – 5.88 €/kWh
1.49 €/kWh
Cyprus Zachariadis and Poullikkas
0.45 – 5.45 €/kWh
0.56 – 6.74 €/kWh
2.06 €/kWh
Sensitivity analysis – Industry sector s.f. = 100%*
*NB: We have excluded the Transport and Construction sectors from these ranges to allow comparability with national estimates.
**NB: Note that few studies consider Industrial consumers at the same level of disaggregation as measured in our study. Hence a
broad range around the point of comparison is to be expected. Inconsistent definitions between studies warrant caution in
comparison.

Page 60
Draft FindingsTSD: UK case study – Domestic and non‐domestic demand factors
Domestic, Services and Industry UK demand factorsUK
(ENTSO‐E)
Domestic Services Industry
Time of
day Day 110% 120% 130% 120%
Night 90% 80% 70% 80%
Day of w
eek Weekday 106% 98% 127% 114%
Saturday 102% 99% 94% 96%
Sunday 92% 103% 79% 89%
Time of year
Spring 99% 97% 98% 98%
Summer 87% 87% 91% 94%
Autumn 100% 97% 94% 99%
Winter 114% 119% 118% 110%
Provides support for EU ‘seasonal’ analysis. Some support for ‘time of day’ analysis.
But does not support ‘day of week’ analysis
Page 61
DETAILED VOLL ESTIMATESB

Page 62
Draft VoLL estimates by Member StateAnnual average VoLL (€/kWh) – Domestic
Austria 9.01
Belgium 9.60
Bulgaria 1.50
Croatia 3.15
Cyprus 6.19
Czech Republic 3.53
Denmark 15.73
Estonia 5.18
Finland 5.30
France 6.92
Germany 12.41
Greece 4.24
Hungary 3.27
Ireland 11.52
Italy 11.34
Latvia 4.71
Lithuania 4.62
Luxembourg 13.52
Malta 6.38
Netherlands 22.94
Poland 6.26
Portugal 5.89
Romania 4.52
Slovakia 4.73
Slovenia 4.32
Spain 7.88
Sweden 5.52
United Kingdom 15.90

Page 63
Draft VoLL estimates by Member StateAnnual average VoLA (€/kWh) – Domestic
Austria 5.00
Belgium 5.33
Bulgaria 0.83
Croatia 1.75
Cyprus 3.44
Czech Republic 1.96
Denmark 8.73
Estonia 2.87
Finland 2.94
France 3.84
Germany 6.89
Greece 2.35
Hungary 1.82
Ireland 6.39
Italy 6.29
Latvia 2.61
Lithuania 2.56
Luxembourg 7.51
Malta 3.54
Netherlands 12.73
Poland 3.47
Portugal 3.27
Romania 2.51
Slovakia 2.62
Slovenia 2.40
Spain 4.37
Sweden 3.06
United Kingdom 8.83
Page 64
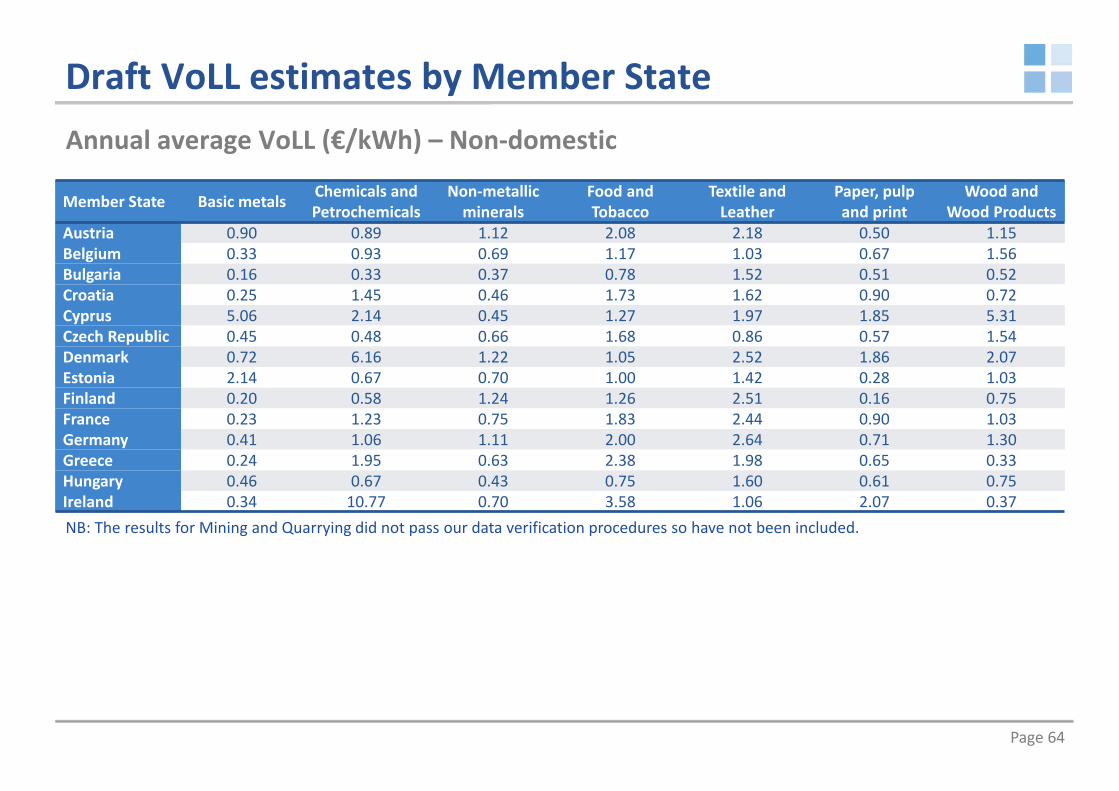
Draft VoLL estimates by Member StateAnnual average VoLL (€/kWh) – Non‐domestic
Member State Basic metals Chemicals and Petrochemicals
Non‐metallic minerals
Food and Tobacco
Textile and Leather
Paper, pulp and print
Wood and Wood Products
Austria 0.90 0.89 1.12 2.08 2.18 0.50 1.15Belgium 0.33 0.93 0.69 1.17 1.03 0.67 1.56Bulgaria 0.16 0.33 0.37 0.78 1.52 0.51 0.52Croatia 0.25 1.45 0.46 1.73 1.62 0.90 0.72Cyprus 5.06 2.14 0.45 1.27 1.97 1.85 5.31Czech Republic 0.45 0.48 0.66 1.68 0.86 0.57 1.54Denmark 0.72 6.16 1.22 1.05 2.52 1.86 2.07Estonia 2.14 0.67 0.70 1.00 1.42 0.28 1.03Finland 0.20 0.58 1.24 1.26 2.51 0.16 0.75France 0.23 1.23 0.75 1.83 2.44 0.90 1.03Germany 0.41 1.06 1.11 2.00 2.64 0.71 1.30Greece 0.24 1.95 0.63 2.38 1.98 0.65 0.33Hungary 0.46 0.67 0.43 0.75 1.60 0.61 0.75Ireland 0.34 10.77 0.70 3.58 1.06 2.07 0.37NB: The results for Mining and Quarrying did not pass our data verification procedures so have not been included.

Page 65
Draft VoLL estimates by Member StateAnnual average VoLL (€/kWh) – Non‐domestic (2)
Member State Basic metals Chemicals and Petrochemicals
Non‐metallic minerals
Food and Tobacco
Textile and Leather
Paper, pulp and print
Wood and Wood Products
Italy 0.31 1.13 0.84 1.76 3.63 0.86 1.23Latvia 0.37 1.86 0.59 1.58 3.21 3.10 0.63Lithuania 0.86 0.79 0.80 1.68 2.60 1.57 1.13Luxembourg 0.07 0.22 0.88 1.42 1.50 1.48 4.63Malta * 1.53 3.23 1.84 0.36 3.00 9.23Netherlands 0.31 0.73 1.18 1.77 2.46 0.95 3.25Poland 0.22 0.52 0.73 1.69 3.57 0.75 1.05Portugal 0.16 0.53 0.52 1.68 2.43 0.35 1.51Romania 0.17 0.38 0.41 3.23 3.28 0.87 0.81Slovakia 0.15 0.38 0.81 1.51 3.75 0.57 4.28Slovenia 0.16 1.59 0.56 1.43 1.96 0.38 1.30Spain 0.28 1.51 0.72 2.07 2.65 0.84 1.38Sweden 0.34 1.42 1.30 1.56 1.98 0.19 1.04United Kingdom 0.51 1.69 0.90 2.78 2.61 0.99 5.27
*Unable to estimate VoLL due to limited data.

Page 66
Draft VoLL estimates by Member StateAnnual average VoLL (€/kWh) – Non‐domestic (3)
Member State Transport Equipment Machinery Construction Transport
Agriculture, Forestry and Fishing Services
Austria 5.46 5.24 22.09 3.12 2.25 10.43Belgium 1.25 13.77 18.61 3.96 1.22 8.76Bulgaria 1.93 1.27 5.27 3.09 5.78 2.12Croatia 1.90 2.61 21.40 2.87 17.26 3.25Cyprus 1.74 5.45 113.00 * 1.55 4.65Czech Republic 2.54 2.81 14.47 2.27 2.65 4.07Denmark 4.39 6.68 24.62 9.66 0.83 11.59Estonia 1.48 2.41 10.96 16.10 1.84 2.86Finland 2.17 5.21 25.12 5.25 2.06 4.86France 3.23 3.17 12.91 3.07 2.72 7.15Germany 6.09 5.59 5.86 3.71 * 8.55Greece 2.05 10.85 1.03 11.30 1.99 4.51Hungary 2.47 2.35 10.83 2.06 3.24 4.91Ireland 1.21 3.98 68.48 39.00 2.86 13.97
*Unable to estimate VoLL due to limited data.

Page 67
Draft VoLL estimates by Member StateAnnual average VoLL (€/kWh) – Non‐domestic (4)
Member State Transport Equipment Machinery Construction Transport
Agriculture, Forestry and Fishing Services
Italy 4.32 3.35 42.30 6.41 3.99 7.83Latvia 1.50 4.26 15.15 6.67 3.64 3.76Lithuania 5.29 3.86 13.75 29.73 4.57 4.47Luxembourg 4.14 8.76 13.53 6.98 2.21 13.34Malta 2.65 1.83 10.16 * 5.96 4.48Netherlands 6.30 6.33 26.41 5.64 0.88 8.91Poland 2.53 3.04 29.88 3.85 4.29 3.53Portugal 3.10 2.34 16.41 8.15 2.94 4.57Romania 2.05 2.24 16.92 5.76 4.97 6.53Slovakia 2.55 2.82 67.97 5.00 6.93 4.16Slovenia 2.56 2.18 33.13 6.19 * 4.66Spain 4.15 4.76 21.47 4.73 3.19 6.64Sweden 5.00 4.43 15.31 3.05 2.92 7.01United Kingdom 5.53 3.66 83.49 7.51 2.56 13.05
*Unable to estimate VoLL due to limited data.
Page 68
PARAMETERS AND DATA SOURCESC

Page 69
Parameters
Variable Source Units Comments
Hours worked Eurostat Average usual weekly hours for employed person
Used to derive time spent on leisure activities per day.
Hours spent sleeping and on personal care
CEPA literature review; Eurostat
Hours per day Assumed 11 hours of each day is spent on sleeping and personal care.
Substitutability factor
CEPA primary research
%
Population employed/ not employed
Eurostat Average annual figures in thousands
The non‐employed include all those who are not working.
Calculated by subtracting the number of employed people from the overall population.
Annual domestic electricity consumption
Eurostat Gigawatt‐hour (GWh)
Data sources – Domestic consumers (1)
Page 70
Parameters
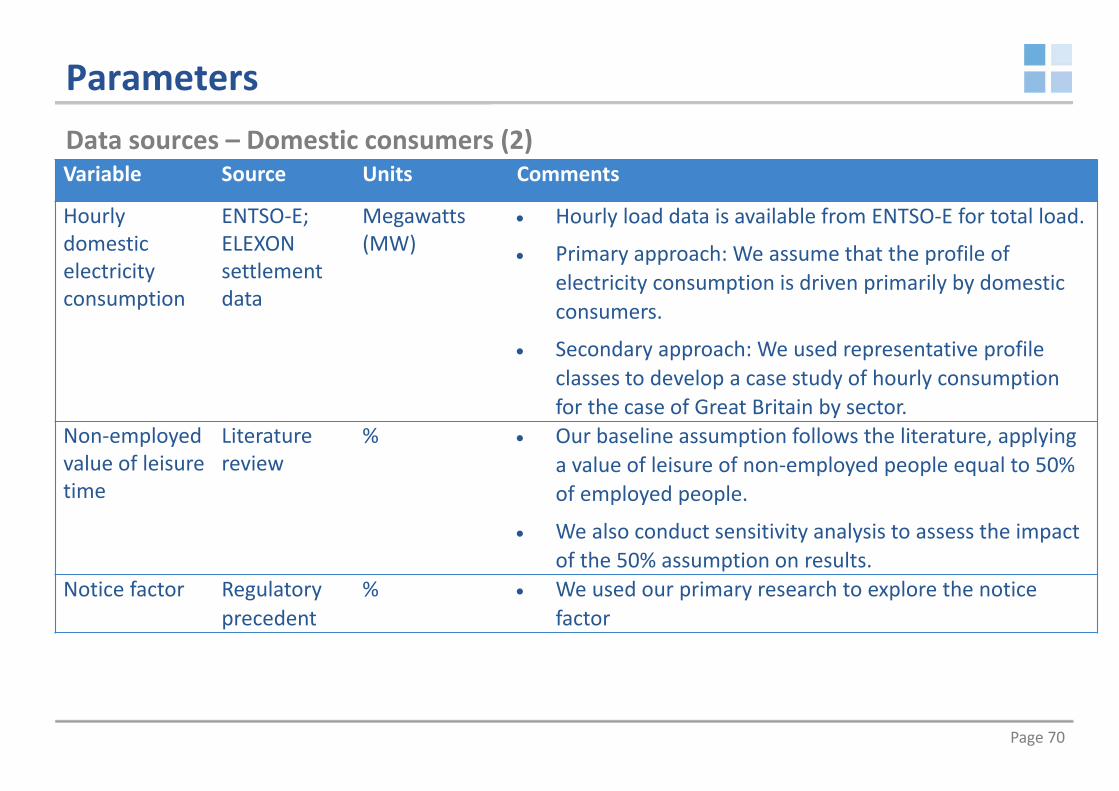
Variable Source Units Comments
Hourly domestic electricity consumption
ENTSO‐E; ELEXON settlement data
Megawatts (MW)
Hourly load data is available from ENTSO‐E for total load.
Primary approach: We assume that the profile of electricity consumption is driven primarily by domestic consumers.
Secondary approach: We used representative profile classes to develop a case study of hourly consumption for the case of Great Britain by sector.
Non‐employed value of leisure time
Literature review
% Our baseline assumption follows the literature, applying a value of leisure of non‐employed people equal to 50% of employed people.
We also conduct sensitivity analysis to assess the impact of the 50% assumption on results.
Notice factor Regulatory precedent
% We used our primary research to explore the notice factor
Data sources – Domestic consumers (2)

Page 71
Parameters
Variable Source Units Comments
GVA by use/industry sector
Eurostat[nama_10_a64]
Current prices,million euro
Eurostat provides GVA data by industry sector at the level of disaggregation required.
In limited cases where gaps existed, they were eliminated using National data or taking a similar MS as a proxy.
Annualelectricityconsumptionby use
Eurostat[nrg_105a]
Gigawatt‐hour(GWh)
Final energy consumption is broken down in line with our consumer segmentation.
Hourlyelectricityconsumptiondata by use/industry
ELEXONsettlement data
KWh We used representative profile classes to develop a case study of hourly consumption for the case of Great Britain, disaggregated by sector.
Substitutabilityfactor andNotice factor
Primaryresearch
% We used our primary research to explore the s.f. and notice factor.
Data sources – Non‐domestic consumers

Page 72
LITERATURE REVIEW SUMMARY OF LITERATURED
Page 73
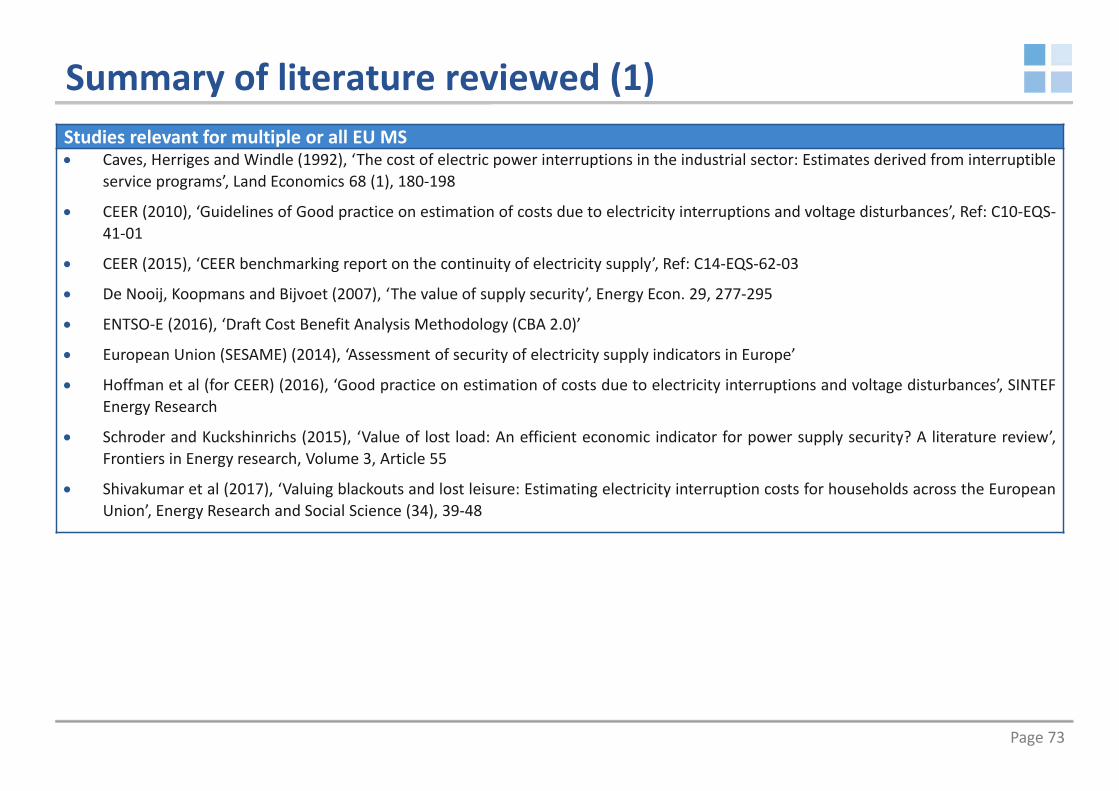
Summary of literature reviewed (1)Studies relevant for multiple or all EU MS Caves, Herriges and Windle (1992), ‘The cost of electric power interruptions in the industrial sector: Estimates derived from interruptible
service programs’, Land Economics 68 (1), 180‐198
CEER (2010), ‘Guidelines of Good practice on estimation of costs due to electricity interruptions and voltage disturbances’, Ref: C10‐EQS‐41‐01
CEER (2015), ‘CEER benchmarking report on the continuity of electricity supply’, Ref: C14‐EQS‐62‐03
De Nooij, Koopmans and Bijvoet (2007), ‘The value of supply security’, Energy Econ. 29, 277‐295
ENTSO‐E (2016), ‘Draft Cost Benefit Analysis Methodology (CBA 2.0)’
European Union (SESAME) (2014), ‘Assessment of security of electricity supply indicators in Europe’
Hoffman et al (for CEER) (2016), ‘Good practice on estimation of costs due to electricity interruptions and voltage disturbances’, SINTEFEnergy Research
Schroder and Kuckshinrichs (2015), ‘Value of lost load: An efficient economic indicator for power supply security? A literature review’,Frontiers in Energy research, Volume 3, Article 55
Shivakumar et al (2017), ‘Valuing blackouts and lost leisure: Estimating electricity interruption costs for households across the EuropeanUnion’, Energy Research and Social Science (34), 39‐48

Page 74
Summary of literature reviewed (2)Studies assessing VoLL or other reliability metrics in specific MS or other Countries Baarsma and Hop (2009), ‘Pricing power outages in the Netherlands’, Energy 34, 1378‐1386
Bertazzi, Fumagalli and Schiavo (2005), ‘The use of customer outage cost surveys in policy decision making: The Italian experience inregulating quality of electricity supply’, 18th International Conference and Exhibition on Electricity Distribution (CIRED), 1‐5
Bliem (2009), ‘Economic valuation of electrical service reliability in Austria – a choice experiment approach’, IHSK Working Paper
Bouri and El Assad (2016), ‘The Lebanese electricity woes: An estimation of the economical costs of power interruptions’, Energies (9),583
Carlsson and Martinsson (2008), ‘Does it matter when a power outage occurs? – A choice experiment study on the willingness to pay toavoid power outages’, Energy Economics (30), 1232‐1245
Carlsson, Martinsson and Akay (2009), The effect of power outages and cheap talk on willingness to pay to reduce outages’, IZA WorkingPaper
Growitsch et al (2013), ‘The costs of power interruptions in Germany – an assessment in the light of the Energiewende’, Institute ofEnergy Economics at the University of Cologne (EWI)
Leahy and Tol (2010), ‘An estimate of the value of lost load for Ireland’, Energy Policy 39, 1514‐1520
Linares and Rey (2013), ‘The costs of electricity interruptions in Spain: Are we sending the right signals?’, Energy Policy 61, 751‐760
London Economics (2013), ‘The value of lost load for electricity in Great Britain’
Reckon LLP (2012), ‘Desktop review and analysis of information on Value of Lost Load for RIIO‐ED1 and associated work’
Reichl, Schmidthaler and Schneider (2012), ‘The value of supply security: the costs of power outages to Austrian households, firms andthe public sector’, Johannes Kepler University Linz
Zachariadis and Poullikkas (2012), ‘The costs of power outages: A case study from Cyprus’, Energy Policy 51, 630‐641

Page 75
Summary of literature reviewed (3)Other studies assessing different methodological approaches Hoch and James (2011), ‘Valuing reliability in the national electricity market’ for the Australian Energy Market Operator
Lawton, Eto, Katz and Sullivan (2003), ‘Characteristics and trends in a national study of consumer outage costs’, CRRI 16th AnnualConference
Shivakumar et al (2014), ‘Estimating the socio‐economic costs of electricity supply interruptions’, Rapid Response Energy Brief (2)(Insight_E)
Torriti (2017), ‘Understanding the timing of energy demand through time use data: time of the day dependence of social practices’,Energy Research and Social Science (25), 37‐47
V.S. Ajodhia (2006), ‘Regulating Beyond Price: Integrated Price‐Quality Regulation for Electricity Distribution Networks’
Van der Welle and van der Zwaan (2007), ‘An overview of selected studies on the value of lost load’, Energy Research centre of theNetherlands (ECN)

Page 76
SURVEY QUESTIONSE

Page 77
Primary research questionsDomestic survey questions1. Please state your country of residence 2. Please confirm the currency that you will use in this survey3. Approximately what percentage of the enjoyment of your leisure time relies on electricity provided by the electricity grid? 4. Is the time when a loss of electricity supply would have the greatest impact on your enjoyment of leisure...
In summer / In winter / No difference5. In the season you have selected above, is the time when a loss of electricity supply would have the greatest impact on your enjoyment of
leisure... On a weekday (Monday – Friday) / At the weekend (Saturday or Sunday) / No difference
6. In the season and on the days you have selected above, is the time when a loss of electricity supply would have the greatest impact on your enjoyment of leisure...
In the morning (06:00 – 10:00) / During the day (10:00 – 17:00) / In the evening (17:00 – 23:00) / At night (23:00 – 06:00) / Nodifference
7. Imagine that you will have no access to electricity supply from the grid for one 20‐minute period and that no notice will be provided ahead of the interruption. How much would you need to be paid to accept this scenario?
8. [As Q7, but for] one 2‐hour period9. [As Q7, but for] one 2 day period10. Imagine that you will have no access to electricity supply from the grid for one 20‐minute period and that 24 hours of notice will be
provided ahead of the interruption. How much would you need to be paid to accept this scenario?11. [As Q10, but for] one 2‐hour period12. [As Q10, but for] one 2 day period13. Which of the following categories best describes your employment status?
Employed, working full‐time / Employed, working part‐time / Not employed, looking for work / In education / Not employed or in education, NOT looking for work / Retired / Disabled, not able to work / Prefer not to say
14. Please estimate your annual household income (after tax and any other deductions)€0 ‐ €10,000 / €10,000 ‐ €25,000 / €25,000 ‐ €50,000 / €50,000 ‐ €75,000 / €75,000 or more / Prefer not to say
Page 78
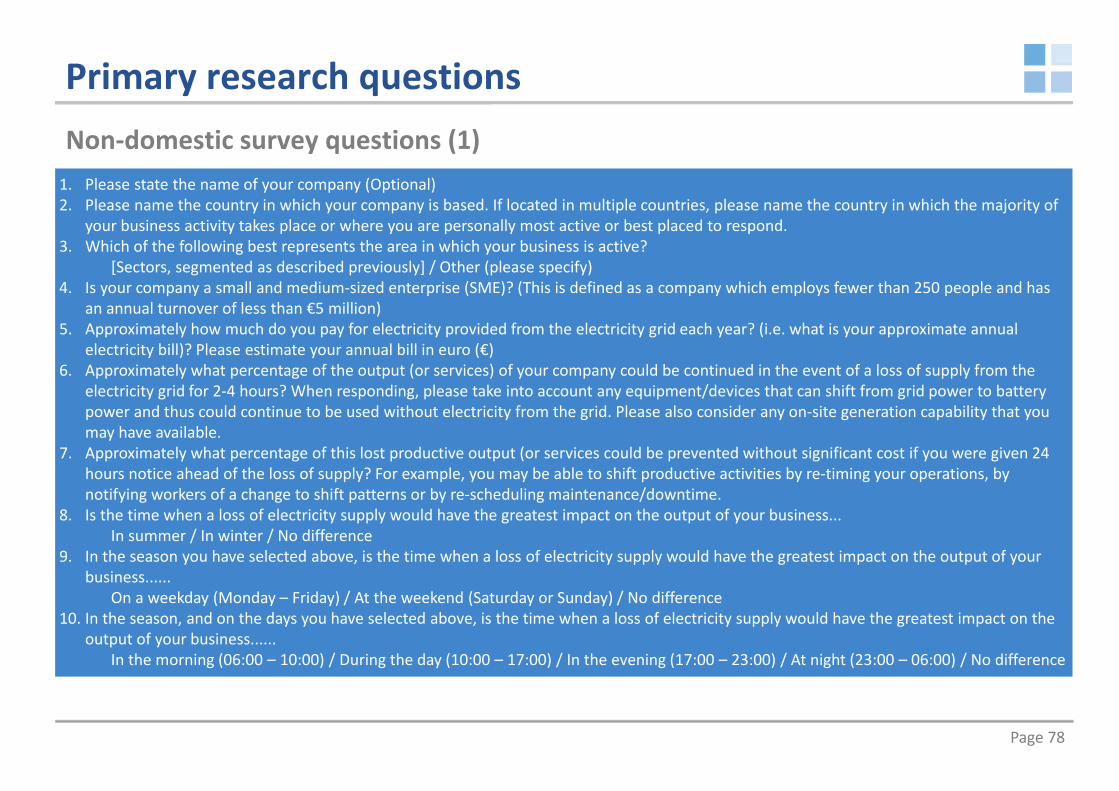
Primary research questionsNon‐domestic survey questions (1)1. Please state the name of your company (Optional) 2. Please name the country in which your company is based. If located in multiple countries, please name the country in which the majority of
your business activity takes place or where you are personally most active or best placed to respond.3. Which of the following best represents the area in which your business is active?
[Sectors, segmented as described previously] / Other (please specify)4. Is your company a small and medium‐sized enterprise (SME)? (This is defined as a company which employs fewer than 250 people and has
an annual turnover of less than €5 million)5. Approximately how much do you pay for electricity provided from the electricity grid each year? (i.e. what is your approximate annual
electricity bill)? Please estimate your annual bill in euro (€)6. Approximately what percentage of the output (or services) of your company could be continued in the event of a loss of supply from the
electricity grid for 2‐4 hours? When responding, please take into account any equipment/devices that can shift from grid power to battery power and thus could continue to be used without electricity from the grid. Please also consider any on‐site generation capability that you may have available.
7. Approximately what percentage of this lost productive output (or services could be prevented without significant cost if you were given 24 hours notice ahead of the loss of supply? For example, you may be able to shift productive activities by re‐timing your operations, by notifying workers of a change to shift patterns or by re‐scheduling maintenance/downtime.
8. Is the time when a loss of electricity supply would have the greatest impact on the output of your business...In summer / In winter / No difference
9. In the season you have selected above, is the time when a loss of electricity supply would have the greatest impact on the output of your business......
On a weekday (Monday – Friday) / At the weekend (Saturday or Sunday) / No difference10. In the season, and on the days you have selected above, is the time when a loss of electricity supply would have the greatest impact on the
output of your business......In the morning (06:00 – 10:00) / During the day (10:00 – 17:00) / In the evening (17:00 – 23:00) / At night (23:00 – 06:00) / No difference

Page 79
Primary research questionsNon‐domestic survey questions (2)8. Imagine that you will have no access to electricity supply from the grid for one 20‐minute period and that no notice will be provided ahead
of the interruption. What percentage of your monthly bill would you need to be refunded to accept this scenario?9. [As Q7, but for] one 2‐hour period10. [As Q7, but for] one 2 day period11. Imagine that you will have no access to electricity supply from the grid for one 20‐minute period and that 24 hours of notice will be
provided ahead of the interruption. What percentage of your monthly bill would you need to be refunded to accept this scenario?12. [As Q10, but for] one 2‐hour period13. [As Q10, but for] one 2 day period

Page 80
SECTOR MAPPINGF

Page 81
Non‐domestic sector mapping (1)Electricity consumption and GVA data available at EU level informed our mapping
Mapping no. Electricity consumption GVA
1 Iron and Steel Manufacture of basic metalsNon‐ferrous Metals
2 Chemicals and PetrochemicalsManufacture of chemicals and chemical productsManufacture of basic pharmaceutical products and pharmaceutical preparations
3 Non‐Metallic Minerals Manufacture of other non‐metallic mineral products4 Food and Tobacco Manufacture of food products; beverages and tobacco products
5 Textile and Leather Manufacture of textiles, wearing apparel, leather and related products
6 Paper, Pulp and Print Manufacture of paper and paper productsPrinting and reproduction of recorded media
7 Wood and Wood Products Manufacture of wood and of products of wood and cork, except furniture; manufacture of articles of straw and plaiting materials
8 Transport Equipment Manufacture of other transport equipmentManufacture of motor vehicles, trailers and semi‐trailers
9 Machinery Manufacture of fabricated metal products, except machinery and equipmentManufacture of computer, electronic and optical productsManufacture of electrical equipmentManufacture of machinery and equipment

Page 82
Non‐domestic sector mapping (2)Electricity consumption and GVA data available at EU level informed our mappingMapping no. Electricity consumption GVA
11 Transport Transportation and storage
12Fishing
Agriculture, Forestry and FishingAgriculture / Forestry
13 Services
Arts, entertainment and recreation; other service activities; activities of household and extra‐territorial organizations and bodiesFinancial and insurance activitiesInformation and communicationProfessional, scientific and technical activities; administrative and support service activitiesPublic administration, defence, education, human health and social work activitiesReal estate activitiesWholesale and retail trade, transport, accommodation and food service activities

Page 83
Cambridge Economic Policy Associates (CEPA)
CEPA, from its offices in London and
Sydney, advises a wide range of clients,
including government departments,
sector regulators, international
organisations, non‐governmental
organisations, foundations, private sector
companies and consumer groups across
every continent.
CEPA is an economic and financial policy consulting business. We
advise clients on issues where economics, finance and public policy
overlap.
Contact us: