study on the port of rotterdam – market definition and market
TRANSCRIPT

Report prepared for the NMa
NMa ref: P_600019/6.B309
Study on the Port of Rotterdam –
Market Definition and Market Power
Final report
Charles River Associates
480 Avenue Louise, Box 18
B-1050 Brussels
+32 2 627 1400
9 December 2004

Preface
During this project we were provided with considerable assistance from a number of sources. We would like to thank all that have participated in the survey and in our interviews. We highly appreciate the time and effort spent by HbR to assist with this project. Finally, we would like to thank the project team at the Netherlands Competition Authority for their helpful feedback.
The enclosed report was commissioned by the Netherlands Competition Authority on terms specifically limiting Charles River Associates’ liability. Our conclusions are the result of the exercise of our best professional judgment, based in part upon materials and information provided to us by the Netherlands Competition Authority and others. Use of this report by any third party for whatever purpose should not, and does not, absolve such third party from using due diligence in verifying the report’s contents.
Any use which a third party makes of this report, or any reliance on it, or decisions to be made based on it, are the responsibility of such third party. Charles River Associates accepts no duty of care, or liability of any kind whatsoever to any such third party as a result of decision made, or not made, or actions taken, or not taken based on this report.
For further details on this report, please contact:
Dr. Rainer Nitsche Charles River Associates
480 Avenue Louise, Box 18 B-1050 Brussels
Belgium Tel: +32 2 627 1400
Report prepared for the NMa

Contents
Charle s
Rive r
Asso c iate s
Report prepared for the NMa
Contents
Preface........................................................................................................................................ ii Contents .................................................................................................................................... iii Tables..........................................................................................................................................v Figures..................................................................................................................................... viii 1 Executive summary .............................................................................................................9
1.1 Background..................................................................................................................9 1.2 Overview......................................................................................................................9 1.3 Activities of HbR.......................................................................................................13 1.4 Market definition .......................................................................................................14 1.5 Market power.............................................................................................................15 1.6 Methodologies ...........................................................................................................16 1.7 Renting out of land ....................................................................................................19 1.8 Provision of infrastructure .........................................................................................23 1.9 Structure of the report ................................................................................................44
2 The approach to market definition and market power ......................................................45 2.1 Introduction................................................................................................................45 2.2 Preliminary steps: Identifying participants, services, cargo types and flows ............46 2.3 The conceptual framework for market definition ......................................................47 2.4 Market power.............................................................................................................51 2.5 Methodologies to apply the framework .....................................................................52 2.6 Further relevant steps to assess market power...........................................................55
3 Summary of the survey results ..........................................................................................57 3.1 Survey background and methodology .......................................................................57 3.2 User survey – evaluation and main results ................................................................59 3.3 Tenants survey – evaluation and main results ...........................................................68 3.4 Survey-based evidence on switching – the SSNIP test..............................................73
4 Activities of HbR...............................................................................................................81 4.1 Introduction................................................................................................................81 4.2 HbR services covered in this report ...........................................................................81 4.3 Implications for the study ..........................................................................................85
5 Renting out of land ............................................................................................................87 5.1 Overview....................................................................................................................87 5.2 Tenant types...............................................................................................................89 5.3 Relationship between renting of land and provision of infrastructure.......................94 5.4 Lease contracts...........................................................................................................95 5.5 Lease-related prices ...................................................................................................96 5.6 Tenant turnover and capacity constraints ..................................................................99 5.7 Investments ..............................................................................................................104 5.8 Lease-related prices in Rotterdam compared to other ports ....................................106 5.9 Market power with regard to the renting out of land...............................................109
6 Provision of infrastructure: Overview.............................................................................111 7 Containers........................................................................................................................113
7.1 Overview..................................................................................................................113 7.2 Port users..................................................................................................................117 7.3 Throughput and capacity of container ports in North Europe .................................120
iii
Report prepared for the NMa

Contents
Charle s
Rive r
Asso c iate s
Report prepared for the NMa
7.4 Call pattern...............................................................................................................121 7.5 Structure of harbour dues and other relevant prices ................................................129 7.6 Benchmarking..........................................................................................................132 7.7 Cargo flow analysis: Overview................................................................................136 7.8 Cargo flow analysis: Port related and sea-side costs ...............................................138 7.9 Cargo flow analysis: Hinterland transportation costs ..............................................141 7.10 Qualitative differences of ports................................................................................145 7.11 Evidence of switching..............................................................................................149 7.12 Transhipment ...........................................................................................................153 7.13 Capacity expansion plans.........................................................................................155 7.14 Trends ......................................................................................................................160
8 Roll-on/roll-off and other general cargo .........................................................................162 8.1 Roll-on/roll-off.........................................................................................................162 8.2 Other general cargo..................................................................................................170
9 Dry bulk...........................................................................................................................177 9.1 Overview..................................................................................................................177 9.2 Port users..................................................................................................................182 9.3 Throughput and capacity constraints of dry bulk ports in the ARA range ..............185 9.4 Hinterland regions....................................................................................................194 9.5 Structure of harbour dues and other relevant prices ................................................197 9.6 Benchmarking..........................................................................................................200 9.7 Cargo flow analysis: Overview................................................................................204 9.8 Cargo flow analysis: Port-related and sea-side costs...............................................205 9.9 Cargo flow analysis: Hinterland transportation costs ..............................................206 9.10 Qualitative differences of ports................................................................................208 9.11 Evidence of switching..............................................................................................210 9.12 Capacity expansion plans.........................................................................................218 9.13 Trends ......................................................................................................................219
10 Liquid bulk ..................................................................................................................220 10.1 Overview..................................................................................................................220 10.2 Port users..................................................................................................................223 10.3 Structure of harbour dues and other relevant prices ................................................226 10.4 Throughput and capacity of liquid bulk ports in North Europe...............................229 10.5 Liquid bulk origin and destination...........................................................................230 10.6 Benchmarking..........................................................................................................235 10.7 Evidence of switching..............................................................................................235 10.8 Trends and expansion plans.....................................................................................239
11 Further considerations .................................................................................................240 Annex I: List of contacts and interviews ................................................................................241 Annex II: Bibliography ...........................................................................................................242 Annex III: Main alternative ports – other studies ...................................................................250 Annex IV: Preliminary study of the NMa...............................................................................251 Annex V: Selected dimensions of port capacity .....................................................................252 Annex VI: Acronyms and technical terms..............................................................................254 Annex VII: Tenant and user questionnaire .............................................................................269
iv
Report prepared for the NMa

Contents
Charle s
Rive r
Asso c iate s
Report prepared for the NMa
Tables
Table 1: Categorisation of tenant types ...................................................................................21 Table 2: Lease and lease-related prices in the port of Rotterdam compared to the port with the
next highest price .............................................................................................................22 Table 3: Throughput and revenue by cargo category (revenue in million €) ..........................24 Table 4: Harbour dues at other ports in the HLH range relative to the port of Rotterdam......27 Table 5: Share of volume shifted away from Rotterdam that is moved to other ports ............32 Table 6: Container terminal capacity and utilisation in 2003 ..................................................33 Table 7: Market definitions general cargo ...............................................................................36 Table 8: Market definitions liquid bulk ...................................................................................40 Table 9: Market definitions dry bulk .......................................................................................41 Table 10: Share of volume shifted away from Rotterdam that is moved to other ports ..........63 Table 11: Expected effect of capacity expansions in various ports on pricing and quality in
the port of Rotterdam.......................................................................................................64 Table 12: Performance and competitiveness – effect of corporatisation and privatisation (user
survey)..............................................................................................................................66 Table 13: Expected effects of Maasvlakte II ...........................................................................71 Table 14: Performance and competitiveness – effect of corporatisation and privatisation
(tenant survey) .................................................................................................................72 Table 15: Test for profitability of an increase in harbour dues in the port of Rotterdam
(SSNIP test) .....................................................................................................................76 Table 16: Split of total port related costs for containers in 2003.............................................79 Table 17: Cost of cargo shipment through Rotterdam in 2003 (cargo handling cost for 2001)
..........................................................................................................................................80 Table 18: Total port related costs per ton and share of harbour dues ......................................80 Table 19: Revenues of the port of Rotterdam in 2002 and 2003 .............................................82 Table 20: Categorisation of tenant types .................................................................................91 Table 21: Number of tenants of the port of Rotterdam indicating they would re-locate
following a permanent increase in lease prices for existing contracts by 10% in the port of Rotterdam ....................................................................................................................93
Table 22: Lease contracts of HbR in the context of Infra+ by tenant type..............................95 Table 23: Turnover of land in the port of Rotterdam in 2002 and 2003................................101 Table 24: Lease contracts expiring until the end of 2007 for which prices will become freely
negotiable – total and as share of total surface for business and industry .....................102 Table 25: Lease contracts expiring until the end of 2007 for which prices will become freely
negotiable – number of contracts and largest site/berth by cargo type..........................103 Table 26: Throughput and revenue by cargo category (revenue in million €) ......................111 Table 27: Terminal operators in the port of Rotterdam – cargo throughput of top 10 customers
at each terminal (TEU)...................................................................................................119 Table 28: Top four container clients at the port of Rotterdam in 2003 in terms of harbour
dues ................................................................................................................................119 Table 29: Container throughput in million tons.....................................................................120 Table 30: Market shares based on container throughput in million tons...............................120
v
Report prepared for the NMa
Contents
Charle s
Rive r
Asso c iate s
Report prepared for the NMa
Table 31: Container terminal capacity and utilisation in 2003 ..............................................121 Table 32: Europe Far-East trade: ports of call in North Europe and capacity of trade lines .123 Table 33: Europe transatlantic trade: ports of call in North Europe and capacity of trade lines
........................................................................................................................................125 Table 34: Sequence of calls on the Far-East/Europe trade (27 trade routes).........................127 Table 35: Sequence of call for Transatlantic/Europe trade (23 trade routes) ........................127 Table 36: Market share of alliances in total TEU throughput in 2003 in the port of Rotterdam
........................................................................................................................................128 Table 37: Tariff for (deep-sea) container vessels in liner service (Tariff LC).......................130 Table 38: Tariff for shortsea/feeder container vessels in liner service (Tariff LF) ...............131 Table 39: Harbour dues per container for a typical vessel 2003............................................133 Table 40: Harbour dues per container for a typical feeder ship 2003....................................134 Table 41: Lease price (terreinconcessies) 2003 .....................................................................135 Table 42: Quay dues for a typical container terminal (kadegelden) 2003.............................135 Table 43: Lease related prices per container 2003 (quay dues and lease price) ....................135 Table 44: Lease related fees and harbour dues per typical container on the Far East trade 2003
(Regina Maersk).............................................................................................................136 Table 45: Lease related fees and harbour dues per typical container on the transatlantic trade
2003................................................................................................................................136 Table 46: Port related costs per container for a typical call of Regina Maersk, Far East trade
2003................................................................................................................................139 Table 47: Port related costs per container for a typical call of Ever Round, transatlantic trade
2003................................................................................................................................140 Table 48: Cost of hinterland transport for containers shipped through Rotterdam in 2003 ..141 Table 49: Hinterland transport cost per container per km in € (2003)...................................143 Table 50: Assessment of qualitative features of ports (2003)................................................145 Table 51: Nautical "quality" of container ports for a Far East-Hinterland shipment* ..........146 Table 52: Terminal "quality" of container ports for a Far East-Hinterland shipment* .........146 Table 53: Hinterland "quality" of container ports for a Far East-Hinterland shipment*.......147 Table 54: Tidal windows for selected ports (largest window available 2001) ......................148 Table 55: Captive volume and switched volume estimates based on the CRA survey .........150 Table 56: Substitute ports for container respondents.............................................................151 Table 57: Container terminal capacity developments in the HLH-range 2003 to 2007 (million
TEUs).............................................................................................................................155 Table 58: Roll-on/roll-off market shares for Benelux ports servicing North Sea routes in 2003
........................................................................................................................................163 Table 59: Top four roro clients at the port of Rotterdam in 2003 in terms of harbour dues 164 Table 60: Roll-on/roll-off market shares for Benelux ports servicing North Sea routes in 2003
........................................................................................................................................166 Table 61: Tariff for roro vessels (Tariffs LR1/TR1 and LR2/TR2) ......................................167 Table 62: Percentage difference in harbour dues compared to Rotterdam............................168 Table 63: Market shares in the ARA range ...........................................................................171 Table 64: Top four general cargo clients at the port of Rotterdam in 2003 in terms of harbour
dues ................................................................................................................................171 Table 65: Throughput and market shares of ports in the HLH-range for general cargo other
than roro and containers (2003) .....................................................................................172 Table 66: Tariff for tramp vessels (Tariffs TS1 and TS2) .....................................................173
vi
Report prepared for the NMa
Contents
Charle s
Rive r
Asso c iate s
Report prepared for the NMa
Table 67: Tariff for liner vessels (Tariffs LS1 and LS2) .......................................................173 Table 68: Percentage difference in harbour dues compared to Rotterdam: multipurpose vessel
........................................................................................................................................174 Table 69: Relevant market for iron ore & scrap – upper bound ............................................179 Table 70: Relevant market for coal – upper bound................................................................180 Table 71: Relevant market for agribulk – upper bound.........................................................180 Table 72: Relevant market for other dry bulk – upper bound................................................180 Table 73: HbR key accounts for dry bulk in 2003.................................................................183 Table 74: Main trade routes of dry bulk shipments coming to Rotterdam ............................185 Table 75: Dry bulk throughput in the HLH range in 2003, in million tons...........................186 Table 76: Dry bulk market shares in the HLH range in 2003................................................186 Table 77: Maximum draught for dry bulk carriers in the ARA ports ....................................187 Table 78: Share of dry bulk throughput by vessel draught ....................................................189 Table 79: Dry bulk terminal operators in Rotterdam.............................................................192 Table 80: Iron ore & scrap and coal throughput in the main ARA ports and Dunkerque .....193 Table 81: Inland transport of dry bulk cargo arriving in Rotterdam......................................194 Table 82: Destination of iron ore & scrap and coal cargo arriving in Rotterdam..................195 Table 83: Tariff for tramp vessels (Tariffs TS1 and TS2) .....................................................198 Table 84: Tariff for liner vessels (Tariffs LS1 and LS2) .......................................................198 Table 85: Split of dry bulk throughput by tariff applied to the vessel call ............................199 Table 86: Frequency reduction for agribulk vessels ≥ 10,000 GT charged according to tramp
vessel tariff (TS1 or TS2) ..............................................................................................199 Table 87: Price differences in harbour dues per ton of incoming cargo in 2003 compared to
Rotterdam.......................................................................................................................201 Table 88: Difference in harbour dues for tramp (dry bulk) vessels in 2004..........................203 Table 89: Price differences in harbour dues per ton of incoming cargo in 2001 compared to
Rotterdam.......................................................................................................................204 Table 90: Dry bulk – split of transport chain costs in Rotterdam for representative ships and
origin destination pairs (excluding cargo handling costs) .............................................205 Table 91: Estimate of total port related costs per ton and share of harbour dues ..................206 Table 92: Freight rates in inland shipping in €/ton ................................................................207 Table 93: Result of qualitative benchmarking of dry bulk ports in the ARA range..............209 Table 94: Substitute ports for iron ore & scrap respondents .................................................212 Table 95: Substitute ports for coal respondents .....................................................................213 Table 96: Substitute ports for agribulk respondents ..............................................................214 Table 97: Substitute ports for other dry bulk respondents .....................................................215 Table 98: Relevant market for iron ore & scrap – upper bound ............................................216 Table 99: Relevant market for coal – upper bound................................................................217 Table 100: Relevant market for agribulk – upper bound.......................................................217 Table 101: Relevant market for other dry bulk – upper bound..............................................217 Table 102: Liquid bulk throughput and calls in Rotterdam in 2003......................................220 Table 103: Throughput and market shares for mineral oil products and other liquid bulk in the
market Rotterdam-Antwerp in 2003 ..............................................................................223 Table 104: Throughput of and HbR revenues from the refineries (2003) .............................225 Table 105: Throughput of and HbR revenues from large oil terminals (2003) .....................226 Table 106: Rotterdam tariff for crude oil tankers (Tariff TT) ...............................................227 Table 107: Wilhelmshaven tariff for crude oil tankers coming from outside Europe ...........227
vii
Report prepared for the NMa

Contents
Charle s
Rive r
Asso c iate s
Report prepared for the NMa
Table 108: Tariff for tramp vessels (Tariffs TS1 and TS2) ...................................................228 Table 109: Tariff for liner vessels (Tariffs LS1 and LS2) .....................................................228 Table 110: Throughput and market shares for liquid bulk in the HLH range in 2003 ..........229 Table 111: Crude oil import in the HLH range, local capacity and pipelines (million tons) 231 Table 112: Harbour dues for crude oil tankers of different size ............................................235 Table 113: Substitute ports for crude oil respondents ...........................................................236 Table 114: Substitute ports for mineral oil products respondents .........................................237 Table 115: Substitute ports for other liquid bulk respondents ...............................................238
Figures
Figure 1: Quantity change due to an increase in price with constant and linear demand elasticity ...........................................................................................................................78
Figure 2: Total surface area of business and industrial premises in the port, split by status ...99 Figure 3: Lease prices of wet parcels with quay in various ports in 1998 (DFL/m2/year) ....107 Figure 4: Lease prices of dry parcels with quay in various ports in 1998 (DFL/m2/year) ....107 Figure 5: Harbour dues and lease-related revenues generated for HbR by the largest container
and distribution customers (2003) .................................................................................117 Figure 6: Example for a call pattern of a container line ........................................................122 Figure 7: Containers – harbour dues per container in main alternative ports in 2003...........133 Figure 8: Port-related costs per container for a representative Asia trade vessel (Regina
Maersk, 6.400TEU) .......................................................................................................140 Figure 9: The Hamburg-Le Havre range ...............................................................................142 Figure 10: Density of US containers......................................................................................143 Figure 11: Leading ports by destination ................................................................................144 Figure 12: Market share of the port of Rotterdam by destination..........................................144 Figure 13: Percentage of transhipment TEUs in Rotterdam..................................................153 Figure 14: Maximum shipsize (TEU) built that year.............................................................160 Figure 15: Harbour dues and other call costs for a typical roll-on/roll-off vessel .................167 Figure 16: Harbour dues and other call costs for a typical multipurpose vessel ...................174 Figure 17: Location of the most important steel production facilities in Germany...............196 Figure 18: The German inland waterway system ..................................................................196 Figure 19: Dry bulk – harbour dues per ton of shipped cargo for representative ships in
selected alternative ports in 2003...................................................................................201 Figure 20: Simulation of harbour dues for tramp (dry bulk) vessels in 2004 per GT ...........202 Figure 21: Cargo flow inland waterways...............................................................................234
viii
Report prepared for the NMa

1 Executive summary
1.1 Background
The Port of Rotterdam is Europe’s largest container port: compared to the next largest European port, Antwerp, more than twice the weight of cargo is passed through Rotterdam. The port is important for European export and import activities and it contributes significantly to economic activity in the Netherlands.
In January 2004, the Rotterdam Municipal Port Management became a public limited liability company, Havenbedrijf Rotterdam N.V. (in the following referred to as HbR). The newly founded company remains totally in public ownership. The Dutch Ministries of Economic Affairs and Transport, Public Works and Water Management have asked the Nederlandse Mededingingsautoriteit (NMa) to investigate whether HbR has market power with regard to its economic activities. The NMa conducted a preliminary study determining the economic activities of HbR and formulating an analytical framework to guide the definition of the relevant markets. The NMa study found two main economic activities undertaken by HbR: the renting out of parcels of land and the supply of port infrastructure. The NMa then commissioned CRA to undertake this study, in order to provide further information and analysis that would put the NMa in a position to determine the relevant markets with regard to these economic activities and to assess the position of HbR in these markets.
1.2 Overview
The definition of the “relevant market” is an intermediate step in order to assess market power. It is a tool for aiding the competitive analysis by identifying those substitute services that provide a significant competitive constraint for the services offered by HbR. Market power is usually defined as the ability to price sustainably above some measure of cost. However, in investigations that involve market definition and market power, competition authorities often rely on techniques that do not apply a direct measure of costs of the firms investigated. We use these techniques in this report, adapted to the specific context of the port authority’s services analysed here. The various complementary techniques employed include benchmarking, cargo flow analysis (analysis of seaside access, origin and destinations, modes of hinterland transportation, etc.), analysis of switching in response to hypothetical price increases, analysis of past switching in response to price changes, analysis of capacity constraints and consideration of other qualitative evidence. Our analysis shows that there is an important relationship between the renting out of land and the provision of infrastructure. Those tenants that are bound to the port (i.e. those who could not provide their services to the same customers from a non-port location elsewhere) either offer services for which there is a demand derived from the general level of cargo flows in the port, such as ship maintenance,
Report prepared for the NMa
Charle s
Rive r
Asso c iate s
or services directly associated with a particular cargo type, for example dry bulk terminal handling. To illustrate the link between the market power with respect to the provision of infrastructure and the renting out of land, consider a port that has a monopoly position for a specific cargo type. Generally, port users need to buy at least two complementary services when using the port: access to the infrastructure (which is paid for through the harbour dues) and stevedoring services (paid directly to the terminal operator, who in turn pays the port for the use of infrastructure – i.e. lease prices). A port authority that controls land and access rights can, in principle, extract monopoly rents by setting a high lease price, high harbour dues or a combination of both. Thus a finding of market power for the different cargo types would suggest that there is a potential to exploit market power on the leasing market too. For port-bound tenants access to the port users, which face a port with market power, can only be gained through the port. Thus, we can derive market power for tenants from the market power for the different cargo types.
We also considered a number of studies to compare lease related prices at various ports. It turns out that all studies consistently find that Rotterdam charges more than what is asked for comparable sites at other ports in the Hamburg-Le Havre range. Thus, higher harbour dues in Rotterdam cannot be generally explained by a pricing structure that would involve very low lease related prices.
Although we conceptually find that there may be market power with regard to lease prices for port-bound, it is also important to note that it is unlikely that there will be any major new tenants locating at the port in the near future due to space constraints (the main reason for the planned expansion of Maasvlakte II). For 98% of the surface occupied by existing tenants the port is contractually bound with regard to its price setting.
HbR provides infrastructure to port users that carry different cargo types. We identify the provision of infrastructure to each of ten different cargo types as relevant product markets. We offer a number of arguments for this choice: (1) Although HbR currently applies the same tariffs to some different cargo types, it can differentiate prices by cargo type. Indeed, HbR is currently considering a revised pricing structure. (2) Port authorities have limited possibilities to differentiate by the exact origin and destination of cargo that is handled on vessels calling at their port. Most importantly (3) for most cargo types a large number of the competitive constraints are very similar, although there are some relevant differences that we take into account (e.g. the number of substitute ports depends on the vessel size). Finally, (4) with minor variations, port authorities themselves use the ten cargo types as the main level of disaggregation and most available statistics are based on this level.
We therefore analyse geographic markets and market power on the level of cargo types. For a summary of the key results by cargo type we refer to Section 1.8 of this Executive Summary. Here we provide a general overview of the findings according to the different techniques employed.
10
Report prepared for the NMa

Charle s
Rive r
Asso c iate s
1.2.1 CARGO FLOW ANALYSIS
Rotterdam has a favourable position in the Hamburg-Le Havre (HLH) range. It provides fast and unconstrained access from the sea1, as well as excellent hinterland connections, not least due to its immediate access to the most important European inland waterway, the river Rhine.
This locational advantage, coupled with well-chosen investment decisions in the past, has helped the port to become the leading European port in almost all cargo categories. Through further network effects, large ports typically benefit from their size to attract business and grow even further. With size, the frequency of hinterland connections improves and the emergence of industrial clusters is facilitated.
Although all ports in the Hamburg-Le Havre range have some overlap in their hinterland, and while for the Amsterdam-Rotterdam-Antwerp (ARA) range overlap is considerable, the overlap of the ARA ports with Le Havre is negligible and with the German ports limited.2
1.2.2 ANALYSIS OF HYPOTHETICAL SWITCHING
The finding from our hinterland analysis that Rotterdam’s most important rivals are in the ARA range is also confirmed by our survey, which suggests that of that volume that would be switched in response to a 10% lasting price increase in total port related costs (total port call costs plus cargo handling costs), 73% would be switched to other ARA range ports. The German ports would attract only 10% of the switched volume, Le Havre and Dunkerque none. In many markets, the port of Antwerp is the next best alternative to Rotterdam, despite its restrictions due to the longer access time on the river Scheldt and the tidal constraints for larger vessels. The port of Amsterdam is constrained both in terms of sea-side access and with regard to hinterland transport by road. Moreover, it does not offer the network of connections offered by Antwerp and Rotterdam. Smaller ports in the region like Vlissingen and Zeebrugge are evolving and have captured some shares in specific markets but lack the industrial clusters. The port of Rotterdam has a superior position in the HLH range.
Another important consideration for the assessment of market power is that the harbour dues are only a very small part of the all costs that are incurred by HbR’s ultimate customer when choosing the port of Rotterdam. With respect to containers, for example, our analysis shows that an increase in harbour dues by 10% increases the total relevant costs of routing the cargo through the port of Rotterdam by at most 0.4%. This increases the incentive to raise prices
1 Being located at the open sea, Rotterdam does not have any tidal constraints and no draught restrictions for
large vessels up to 23 m. 2 In this study, we define the ARA range as the range of ports located between and including Amsterdam and
Antwerp, i.e. Amsterdam, Vlissingen, Rotterdam and Antwerp. The named ports also control some minor ports that are usually not listed separately. The port of Amsterdam administers also Beverwijk, Velsen/IJmuiden and Zaanstad. The port of Terneuzen belongs – in administrative terms – to the port of Vlissingen. Harbour dues set by HbR in Rotterdam also apply in Moerdijk, Dordrecht and all remaining ports in the Moerdijk/Rijmond area.
11
Report prepared for the NMa

Charle s
Rive r
Asso c iate s
above competitive level: Only if at the ultimate customers are extremely price sensitive, the increase will lead to switching. In fact, based on demand elasticities implied by the survey result, we find that HbR could profitably raise current harbour dues for containers and dry bulk.
1.2.3 ANALYSIS OF PAST SWITCHING
Neither HbR nor the port users surveyed could provide convincing evidence of switching in response to increases of harbour dues by a port authority. In fact, we could identify only one example where a port user reported switching in response to an increase in harbour dues.
This underpins the finding that harbour dues are not key factors determining switching decisions. Indeed, a very illustrative example of how other factors outweigh differences in harbour dues in containers is the fact that we have not yet observed any switching of liner services to Amsterdam, although there is empty capacity and pricing of both harbour dues and stevedoring dues is considered to be half the level of Rotterdam since a number of years.
1.2.4 CAPACITY CONSTRAINTS , ENTRY AND COUNTERVAILING POWER
For containerised cargo we find that the current capacity constraints at Antwerp limit the effectiveness of this port as a competitive constraint. This is very relevant as Antwerp is the most important alternative to Rotterdam. The situation will only gradually improve from the second half of 2005 onwards as further container terminal capacity will be added at the port of Antwerp. For all other cargo types we have not received evidence on any major near term expansions that are likely to change the competitive situation.
Based on the analysis above we also conclude that port users cannot outweigh the pricing power by countervailing power. For many cargo types this is also visible through the application of list prices. Only some port users, in particular liner shipping companies, negotiate discounts.
1.2.5 BENCHMARKING
All findings described above suggest that the port of Rotterdam is in a position to price higher than its rival ports for the services it offers, in particular through harbour dues and land lease related prices. This is confirmed by benchmarking studies that compare harbour dues for typical ships. For large ships in particular, Rotterdam charges significantly more than rival ports. More generally, Rotterdam is considered to be an expensive port in terms of harbour dues.
12
Report prepared for the NMa
Charle s
Rive r
Asso c iate s
1.2.6 CONCLUSION
Combining these various findings, we conclude that HbR has the ability to profitably charge higher harbour dues and land lease related prices than its rival ports. We also suggest relevant geographic markets for ten cargo types, ranging from the port of Rotterdam itself to ports in the ARA range plus Zeebrugge and Gent.
In our analysis we have not been tasked to investigate the financing of HbR or rival ports, which can have an important effect on pricing. If, for example rival ports price artificially low, for example as a result of state subsidies, then HbR’s ability to price higher than rivals as evidenced by higher prices need not indicate excessive pricing above cost at present. The sustained and large price difference we find then do however indicate that apparently customers do not switch away from the port of Rotterdam to the lower priced port services elsewhere. Thus, even though we provide convincing evidence that HbR can and does profitably charge higher prices than rival ports, this is not conclusive evidence that HbR is currently abusing market power by setting excessive harbour dues. It merely reveals HbR’s ability to sustain large price differences (whether they reflect costs difference or not) over longer time periods.
Moreover, the conclusions concern the pricing power of the port of Rotterdam in the short-run. Dynamic considerations, of which we offer some, tend to suggest that pricing power of a port at a favourable location can eventually be beneficial to consumers.
1.3 Activities of HbR
As the port authority of the port of Rotterdam, HbR is involved in four main activities:
• The supply of nautical-maritime services.
• The supply of land to tenants of the port.
• The supply of port infrastructure to tenants and port users.
• (Minority) shareholdings in other companies.
Out of these four activities, only the second and third, i.e. the supply of land and the supply of port infrastructure, are analysed in this study. This is in accordance with the brief we received from the NMa.
With regard to the renting out of land, HbR is responsible for the long-term spatial planning of the port, as well as the actual allocation of sites to and negotiation of lease prices with (prospective) tenants. For parcels that include quay walls, HbR does not only charge lease prices, but also quay dues. In many cases, the rented out land includes additional infrastructure set up by HbR, such as stronger quay walls, jetties, roads, or rail tracks. Such investments will be considered in the lease price charged by HbR.
13
Report prepared for the NMa
Charle s
Rive r
Asso c iate s
In addition to spatial management, HbR is responsible for the planning, construction and maintenance of the wet and dry infrastructure in the port, which includes for example waterways, port basins, quay walls and roads. HbR charges harbour dues to port customers for the use of this infrastructure.
The yearly expenditure related to investment and maintenance of the port territory and infrastructure is around €150m, which is generally financed out of HbR’s total revenues. The port authority is also engaged in the planning of major expansions of the port (Botlek in the late 1940s and early 1950s; Europoort starting in 1958; Maasvlakte I between 1968 and1974; Maasvlakte II, for which planning is ongoing). These projects are typically financed through loans from the municipality of Rotterdam and co-financed by the Dutch government with specific repayment arrangements.
1.4 Market definition
The definition of the relevant market is an intermediate step in order to assess market power. It is a tool for aiding the competitive analysis by identifying those substitute services that provide a significant constraint for the services offered by HbR.
The analysis of, first, the types of services that are provided by HbR and, second, the alternatives to these services that are available to port users is the first important step of the market definition exercise. It involves identifying the services provided by HbR (distribution of parcels of land and the supply and operation of the port infrastructure), identifying the key participants (in particular port users and tenants), cargo types (like crude oil, coal, etc.), and the origin and destination of cargo handled.
The definition of the relevant market can have several dimensions. It is common to distinguish relevant product markets and relevant geographical markets. The main practical purpose of market definition is to permit inferences about market power to be drawn from market shares. Thus, the relevant market needs to be defined so that it contains all those substitute products and ports that provide a significant competitive constraint to the services of HbR. With regards to the services provided by HbR the following issues are of particular relevance:
• Relevant product markets - The main issues regarding the relevant product markets in the area of ports refer to the level of disaggregation regarding the types of cargo and the origin and destination of cargo. Other possible considerations include the size of the vessels, the types of customers or the modes of transport that are used for part of the transport chain. Products are grouped together if they face similar competitive restraints and if the port authority cannot differentiate between them. In practice, a further consideration is the level of detail at which information is available in order to consider differences in competitive constraints. Often, the categorisations used by industry reflect a level of disaggregation that is sufficient to take strategic pricing decisions.
14
Report prepared for the NMa
Charle s
Rive r
Asso c iate s
• Relevant geographic markets - The relevant geographic market with regard to the provision of port infrastructure and with regard to the leasing of land to port bound customers is determined by analysing which ports provide significant competitive restraints to the pricing of HbR. Tenants that are not bound to the port could also locate in regions outside the port. For them the relevant geographic market is much wider.
The approach followed by most competition authorities to determine the relevant markets is the “hypothetical monopolist test,” also called the “SSNIP test” (Small but Significant and Nontransitory Increase in Price). This test goes through the logic of a hypothetical monopolist to determine whether or not pricing on a particular candidate market is constrained by substitute products. The relevant market is the smallest collection of products (regions/ports) such that the hypothetical profit-maximising monopolist would, if he were serving the market on its own, impose a small but significant nontransitory increase in price, assuming the terms of sale of the other products are held constant.
In Section 2.3 we discuss a number of potential pitfalls with regard to market definition. One important potential pitfall is the so-called “cellophane fallacy”. If observed prices already reflect market power the SSNIP test could identify a relevant market that is too wide. Indications that existing prices already reflect market power are therefore important.
1.5 Market power
In academic textbooks, market power is sometimes referred to as pricing above marginal cost, i.e. the cost of producing the last unit of output (in practice average variable cost are often used as a substitute to marginal cost). In practice, this theoretical measure is often not very helpful. If producing the goods involves low marginal cost but high fix costs that result, for example, from investments in infrastructure, some market power in the academic sense would be necessary in order to provide sufficient investment incentives. Regulatory bodies therefore usually take into account the incentives for investment, e.g. when regulating prices. One way to achieve this is to use cost concepts that consider the cost of the investments into the infrastructure. In the context of this study, our focus is not on determining a set of optimal prices that a regulator would set. In investigations that involve market definition and market power, competition authorities often rely on techniques that do not apply a direct measure of costs of the firm investigated. We use similar techniques and explain them further below. If pricing of the rival ports is competitive, these techniques can be used to show that the analysed firm exploits market power. If rivals price below competitive levels (e.g. due to subsidies), the techniques provide evidence on the potential to exploit market power if rival firms were to price competitively. In other words, in a market where all rivals price artificially low, even a firm with market power may be constrained to price at costs. Since we did not look at the financing of HbR and rival port authorities, our results provide direct evidence that the port is currently pricing excessively only to the extent that differences in
15
Report prepared for the NMa

Charle s
Rive r
Asso c iate s
financing are of a lower order than those found in pricing across the ports included in our study.
However, we do provide unconditional direct and convincing evidence addressing the question whether HbR can charge higher prices than the most important alternative ports. Such pricing power provides a strong indication that HbR can indeed exploit its dominant position, at least if rival ports do not price below costs, i.e. it suggests that HbR has market power if rivals do not price artificially low.
If firms exploit market power by setting high prices, this will, at least in the short-run, harm customers of the port. The welfare implications for other groups in society depend on a variety of factors. For example, if ports operate at full capacity, high prices may have no effect on the number of calls, implying that there is, at least in the short-run, only a distributive effect to the benefit of the port authority. Since consumers are not direct customers of the port they are affected as higher transport costs lead to higher prices for consumer goods.
Market power can be constrained if barriers to entry are low. In particular, planned capacity expansions at other ports will influence the choice available to port users. We therefore survey several major expansion plans. Furthermore, port customers may have countervailing power that constrains the pricing power of HbR. If such power existed one would expect to see at least some switching stories. Moreover, any power to sustain large price differences relative to rival ports would suggest that countervailing power is limited, for information purposes we nevertheless report available information on the port users. For vertically integrated ports, efficiency considerations of vertical integration may also play a role in the assessment of market power. Given that the port of Rotterdam is by and large a landlord port, not involved in major complementary activities, we have not investigated efficiency considerations. Finally, port authorities may coordinate their behaviour. The analysis of such potential coordinated behaviour has not been a focus of this project.
1.6 Methodologies
In order to pursue the analysis we have employed various complementary techniques including benchmarking, cargo flow analysis (analysis of seaside access, origin and destinations, modes of hinterland transportation etc), analysis of switching in response to hypothetical price increases, analysis of past switching in response to price changes, analysis of capacity constraints and consideration of other qualitative evidence. In this Section we briefly describe the main methodologies used. For a detailed description we refer to Section 2.
16
Report prepared for the NMa
Charle s
Rive r
Asso c iate s
1.6.1 BENCHMARKING
In order to address the cellophane fallacy problems and to get a first indication of pricing power, we compare the harbour dues and lease-related prices per unit (we use a standard measure for containers, called TEU, and the weight of the cargo for other cargo types).
The basic service of providing port infrastructure such as quay walls, jetties and roads does not differ significantly between ports, which means that higher pricing of the port of Rotterdam would be an indication of pricing power relative to the relevant alternative ports.
In Section 2.5 we present a simple model of spatial competition to show that, absent artificially low prices of some firms, transport cost advantages allow firms to price profitably above cost. If ports are located differently, this may simply reflect some degree of product differentiation that may help port authorities recovering fix costs. If there is a significant asymmetry between ports, the port with the advantage can profitably price above total costs if the competing (disadvantaged firm) prices at costs.
The benchmarking approach is relatively simple for those cargo types for which comparative pricing data exists. Moreover, it is meaningful regarding the assessment of pricing power reflected in existing prices. However, it does not answer the question whether there is scope to increase prices further (which we address in the following sections).
1.6.2 CARGO FLOW ANALYSIS
A complementary approach to the price benchmarking method is to analyse cargo flows. The conceptual approach is as follows. If at given prices3 the routing of a relevant unit of cargo via Rotterdam (considering hinterland transport costs, sea transport cost, cargo handling costs, and call costs, including harbour dues) costs €1,000 and the routing via the next best alternative port costs €1,100, an increase in harbour dues of €50 per unit, i.e. an increase of total costs by 5%, is unlikely to lead to switching. If a €50 increase is higher than five to ten percent of the existing level of harbour dues, this would indicate that the next best alternative port is not to be considered being in the same relevant market for the cargo flow considered.
1.6.3 SWITCHING IN RESPONSE TO A (HYPOTHETICAL) PRICE INCREASE
As a major part of the analysis, we surveyed port users and tenants. We questioned port users how they would respond if total port related costs were to increase by 10 percent.4 The answers yield two types of information. First, the answers provide an indication on responsiveness of demand for HbR’s services to a price increase. Second, the answers give very helpful evidence on which ports are considered as potential substitutes – which is helpful direct evidence for our market definition exercise.
3 Note that this is subject to the Cellophane fallacy caveat described before. 4 Note that this is subject to the Cellophane fallacy caveat described before.
17
Report prepared for the NMa
Charle s
Rive r
Asso c iate s
With regard to the responsiveness of demand for HbR’s services to a price increase (economists refer to the ‘price elasticity of demand’) a few important notes are due:
• Since access to the port infrastructure is always part of a bundle of complementary services (e.g. sea transport, other call cost such as pilotage and towage, stevedoring, hinterland transport), an increase in harbour dues only has a minimal effect on total generalised costs of a customer of the port, which include all costs in the transport chain. Thus, a ten percent price increase on harbour dues is much less likely to lead to switching than a ten percent price increase in total generalised cost, making it more likely that a mark-up is profitable. Therefore, it is possible (or even likely) that the market definition for the provision of port infrastructure services leads to narrower markets than the market definition for stevedores, which typically control a more significant part of generalised cost.
• It is also worth pointing out that the combination of several providers of complementary goods leads to a double marginalisation or double mark-up effect in oligopoly markets. Several providers of complementary services add mark-ups to their services, which leads to higher overall prices than if firms were vertically integrated.
These considerations suggest that switching in response to a small increase in harbour dues is less likely than switching in response to a small increase in total route costs. Using survey responses to determine price elasticities is subject to some caveats, including the possibility of strategic responses. These are discussed in full in Sections 2.5 and 3.1.
1.6.4 SWITCHING IN RESPONSE TO PAST PRICE CHANGES (REVEALED PREFERENCES)
We have asked surveyed port users and the port authority to provide evidence on switching in response to past changes in harbour dues. Evidence on past switching is important as it is not subject to the same caveats as statements about hypothetical switching behaviour.
We also looked at a number of other factors that provide evidence on potential switching. Our survey and previous studies show that port users take into account a number of factors when choosing a port. For example, one factor that prevents port users from switching is the existence of good connections. This is sometimes called a network effect. The more connections and the higher the frequencies offered, the more attractive a port. This makes it more difficult for smaller ports to compete against ports that are large and established.
1.6.5 CAPACITY CONSTRAINTS
The responses of the survey respondents to the questions about the potential substitute ports provide important direct information on the relevant market. If the ports that port users would switch to are subject to capacity constraints, these ports are no relevant competitive constraint until capacity is expanded.
18
Report prepared for the NMa

Charle s
Rive r
Asso c iate s
1.6.6 OTHER QUALITATITVE EVIDENCE
We also looked at other qualitative evidence. For example, we studied how prices are set, how often they are revised, and what the key pricing principles are and what information is used for pricing. This evidence is helpful to understand and interpret past behaviour of the port authority.
1.6.7 SOURCES OF INFORMATION
In order to undertake the study we engaged in intensive communication with HbR. We furthermore conducted a number of interviews with port users, a competing port (Antwerp), the European Commission and academics at the University of Leuven (see Annex I for a list of interviews). We consulted various resources, including reports and data generated by our own research and those provided by HbR and the NMa (see Annex II for a list of articles, reports and studies used).
A further important element of this study was the design and evaluation of a survey that was sent out to users and tenants of the port authority of Rotterdam. In total 1,315 questionnaires were sent out to addresses in the Netherlands, Belgium, Germany and other countries. In our survey evaluation, we considered 88 companies who filled out the tenants questionnaire and 58 companies who filled out the user questionnaire. Some user respondents answered the questions for several cargo types, which means that we could distinguish up to 67 different responses for some cargo-specific questions. Thus, we evaluated 146 questionnaires in total.
1.7 Renting out of land
The port of Rotterdam is a large industrial complex, which includes some five thousand hectares of land suitable for business and industrial tenants. HbR administers about 2,000 lease and ground rent contracts, which generated revenues of about €173 million in 2003.
1.7.1 TENANT TYPES, LEASE CONTRACTS AND AVAILABLE SPACE
In order to analyse market power with regard to the renting out of land, one needs to distinguish different tenant types. New tenants are typically more flexible with regard to port choice and HbR can negotiate prices with new tenants without contractual restrictions. They may add value to the port, not only by paying rent, but also by attracting cargo or improving the network of services offered to other tenants. In fact, the skilful development of the industrial and logistical clusters can be seen as one of the important tasks of HbR. The large existing tenants that are crucial for the services offered at the port are to a large extent locked in at the port as relocation would involve specific investments, both in facilities and in business relationships that have already been made in Rotterdam. Clearly, if prices were to be
19
Report prepared for the NMa

Charle s
Rive r
Asso c iate s
negotiated freely with these large customers, the port would have market power. Potential tenants, however, anticipate these lock-in effects. In order to resolve this issue and to attract tenants and encourage specific investments, the port authority offers long-term contracts. Standard contracts fix the inflation-adjusted rent for a period of 25 years. Most contracts have a renegotiation clause that limits the pricing power of the port authority when it comes to re-negotiation of the contracts. That is, reviewed prices for existing tenants are constrained by what has been agreed on with comparable new tenants.
As a result of this, apart from the few contracts that expire without re-negotiation clause, the potential of HbR exercising market power today depends on land that is or becomes available for new tenants. The analysis of HbR’s tenant database shows that, absent the envisaged expansion of Maasvlakte II, space available and suitable for letting is very limited. Until 2007 only about 2% of the suitable surface will become available, adding to about 6% that are currently available but not suitable for, for example, a new container terminal in addition to the planned expansions5 or a large industrial cluster. We, therefore, do not expect to see any major new tenants locating at the port of Rotterdam in the near future and for 98% of the surface occupied by the existing tenants the port is contractually bound with regard to its price setting.
1.7.2 RELATIONSHIP BETWEEN RENTING OUT OF LAND AND PROVISION OF INFRASTRUCTURE
In negotiations with new tenants, the bargaining power of HbR also depends on the business of the tenant. Those tenants that are not port-bound, i.e. that do not require access to land at the port in order to provide their services to the port users and/or cargo flows, could locate at various other locations and still serve the users of the port of Rotterdam, which suggests that, unless they are offered market rates, they would locate elsewhere. Moreover, our survey results did not indicate any particular concerns of tenants in this area. Our analysis did therefore not give rise to any competition concerns in this area. Table 1 provides an overview of the different tenant categories and whether they are port-bound or not. Note that our results are indicative. A full analysis would require a case-by-case assessment.
5 HbR recently concluded a tenant contract with Euromax, a joint venture of the largest existing terminal
operator at the port European Container Terminal (ECT) and P&O Nedloyd. The site for the new terminal is a site that was reserved for some time.
20
Report prepared for the NMa

Charle s
Rive r
Asso c iate s
Table 1: Categorisation of tenant types
Tenant group Categorisation (bound to the port or not)
Cargo handling companies Port-bound
Transport companies To some extent port-bound
Forwarding and shipping companies Generally not port-bound
Supplies-associated industries (incl. nautical service providers)
Mainly port-bound
Finance and consultancy companies Generally not port-bound
Source: CRA based on a categorisation contained in HbR “Rotterdam Port Information 2004”, p. 289. Note that our categorisation is indicative.
Those tenants that are bound to the port either offer services for which there is a demand derived from the level of cargo flows in general, such as ship maintenance, or services directly associated with a particular cargo type, for example dry bulk terminal handling or processing of cargo flows for which it would be uneconomical to be carried out at a distance from the port. There is, therefore, a link between the market power with respect to the provision of infrastructure and the renting out of land.
To illustrate this link, consider a port that has a monopoly position for a specific cargo type. Generally, port users need to buy at least two complementary services when using the port: access to the infrastructure (which is paid for through the harbour dues) and stevedoring services (paid directly to the terminal operator, who in turn pays the port for the use of infrastructure – i.e. rent).6 A port authority that controls land and access rights can, in principle, extract monopoly rent by setting a high rent, high harbour dues or a combination of both. Moreover, for a given rent the port authority will always prefer a tenant that generates harbour dues to one that does not. That HbR is well aware of the link between tenant pricing and harbour dues shows for example in its setting of lease prices, which depend on the expected harbour dues generated by the tenant. The relevant markets for tenants that provide cargo type specific services (like terminal operators) therefore depend on the relevant markets identified for the provision of infrastructure. Those tenants that are port-bound but do not provide services for only one cargo type (e.g. maintenance services for terminals) depend on aggregated findings with regard to the provision of infrastructure that reflect the mix of cargo types.7
6 Even if a vessel berths at a public quay and not at a terminal, it will need the services of some provider in
the port in order to unload the vessel and/or transport the cargo onwards. 7 Interested readers may want to note that there is a debate regarding airport regulation whether rents that can
be extracted from tentants should be taken into account in the regulatory process or not (“dual till” or “single till”).
21
Report prepared for the NMa

Charle s
Rive r
Asso c iate s
1.7.3 LEASE RELATED PRICES
We considered a number of studies to compare lease related prices at various ports. It turns out that all studies consistently find that Rotterdam charges more than what is asked for comparable sites at other ports in the Hamburg-Le Havre range (see Table 2). It is also interesting to note that Antwerp is found to be the port with the next highest lease related prices in two out of the three studies considered.
Table 2: Lease and lease-related prices in the port of Rotterdam compared to the port with the next highest price
Price difference compared to Rotterdam in %
Source/study and basis for price Port with the next highest
price in the study
Minimum price difference
Maximum price difference
PWC – lease price for wet parcel per m2 in 1998 Antwerp -5% -41%
PWC – lease price for dry parcel per m2 in 1998 Antwerp -29% -33%
DTZ – lease price per m2 in 2003 Antwerp -6% -43%
IBM – lease-related price per container (lease plus quay dues) in 2003
Le Havre -26% -26%
Source: CRA calculations based on PriceWaterhouseCoopers, “Case Reebok – Financial considerations including profitability of Distri-park Maasvlakte and the cash compensation”, DTZ “Benchmark Study Le Havre – Antwerp – Rotterdam” and IBM “Concurrentiepositie van de haven van Rotterdam in de containeroverslag”. The PWC study compared lease prices in Rotterdam, Antwerp, Hamburg, Bremen, Dunkerque and Le Havre. DTZ compared Rotterdam, Antwerp and Le Havre, and IBM compared Rotterdam, Antwerp, Hamburg, Bremerhaven and Le Havre. Note that for the analysis of the PWC study, we made the following assumptions: 1) the choice of the port with the next highest price is based on the average price in other ports and 2) we compared the minimum and maximum prices in Rotterdam with the minimum and maximum prices in Antwerp respectively. For more details see Section 5.
Given the link between lease related prices and harbour dues, these findings are important for the analysis of the provision of infrastructure. Higher harbour dues in Rotterdam cannot be generally explained by a pricing structure that would involve very low lease related prices and high harbour dues.8 Moreover, a finding of market power for the cargo types would suggest that there is potential to exploit market power on the leasing market. This, however, is currently of limited relevance given the existing capacity constraints and given that Maasvlakte II is years away.
8 HbR pointed out that in the 1950s and 1960s low lease prices had been a strategy to attract some of the
large refineries.
22
Report prepared for the NMa

Charle s
Rive r
Asso c iate s
1.8 Provision of infrastructure
1.8.1 ACTIVITIES OF HBR
Besides the supply of land to tenants of the port, the port authority of Rotterdam supplies nautical-maritime services and has shareholdings in other companies. In accordance with the directions of the NMa, we exclusively analysed the supply of land and the provision of infrastructure. One important question in the study was whether the quality of HbR’s activities influences the quality of the supplied basic infrastructure. Clearly, long-term spatial planning is one of the key activities of the port that influences the infrastructure available at the port. Each major expansion of the port involved critical decisions regarding the development of the sites. This applied to the Botlek expansion in the late 1940s and early 1950s, the Europoort project in 1958, and the Maasvlakte I expansion from 1968 to 1974. It will apply again to Maasvlakte II, the envisaged major expansion of the port of Rotterdam.
However, in the short run the ability of HbR to influence the key “quality” parameters that matter for port choice is limited. Some respondents to our survey mentioned that other ports (in particular Antwerp) were better in handling public tasks (like customs). Other quality comments focussed mainly on the services provided by stevedores. There is no evidence that HbR would currently provide services of better quality than other ports that would justify higher prices. However, as the following analysis shows, there is significant evidence to show that the port of Rotterdam (and thereby HbR) benefits from a better “quality” of factors that cannot be influenced by HbR in the short run, e.g. locational and nautical advantages and the superior network of transport links and other network effects.
1.8.2 CARGO TYPES AND PORT USERS
It is common practice of ports to distinguish three cargo categories and a number of cargo types per category:
• Dry bulk: iron ore and scrap, coal, agribulk, other dry bulk;
• Liquid bulk (sometimes referred to as “wet bulk”): crude oil, mineral oil products, other liquid bulk (mainly chemicals, oils and fats); and
• General cargo: containers, roll-on/roll-off, other general cargo.
Table 3 shows the importance of dry bulk, wet bulk, container and general cargo excluding containers by the weight of cargo throughput and the type of revenue generated.
23
Report prepared for the NMa

Charle s
Rive r
Asso c iate s
Table 3: Throughput and revenue by cargo category (revenue in million €)
Container General cargo 9
Liquid bulk Dry bulk Other Total
Throughput (in m tons) 71 8 153 86 11 328
Lease related revenue 50 19 52 19 35 175
Harbour dues (sea going vessels) 46 16 101 38 0 201
Harbour dues (non sea going vessels) 1 0 3 6 0 10
Other 5 3 4 2 2 18
Total revenue 103 38 160 65 37 403
Source: Rentabiliteitsberichtgeving – jaargang 2003. We received the document from HbR on 14 October 2004. The totals may not add up to the totals indicated in the document because of rounding as our totals are based on the percentage share of revenue indicated in the Rentabiliteitsberichtgeving. Other sources of revenue include revenue from customs, development costs (“exploitatie VBS”) and other revenue.
Liquid bulk is the most important source of revenue, followed by containers and dry bulk. Liquid bulk also accounts for the highest throughput.
The users of the port of Rotterdam are shipping companies, freight forwarders and, ultimately, their clients. Harbour dues are generally paid by the shipping companies directly to HbR. In wet and dry bulk, some of the major terminal operators and refineries located at the port are also important users of the cargo.
1.8.3 RELEVANT PRODUCT MARKETS
As discussed above, the port of Rotterdam handles a range of cargoes, port users and provides access to different types of vessels. One task in the market definition exercise is to determine which cargo types should be considered together, e.g. whether the provision of infrastructure to iron ore & scrap port users is in the same “product market” as the provision of infrastructure to coal port users. Applying the methodology described above (Section 1.4), we have analysed the relevant geographical markets on the level of cargo types. Although the current pricing structure does not differentiate all cargo types and although the choice of port users may differ depending on, for example, the exact origin and destination or the vessel size, there are a number of arguments for pursuing the analysis based on cargo types, i.e. choosing them as relevant product markets:
• Although HbR currently applies the same tariffs to some different cargo types, it can differentiate prices by cargo type. Indeed, HbR is currently considering a revised pricing structure that would lead to increased differentiation.
9 Other than container.
24
Report prepared for the NMa

Charle s
Rive r
Asso c iate s
• Port authorities only have limited possibilities to identify the exact origin and destination of cargo that is handled on vessels calling at their port. This limits the possibilities for differentiating by origin and destination.
For most cargo types, a large number of competitive constraints are very similar. Different ports specialise in different cargo types. Port users are typically similar by cargo type and the main hinterland destinations and transport modes are similar.
• For some cargo types (in particular, crude oil, iron & ore and scrap, coal, mineral oil products, and container) port choice is more restricted for some of the largest vessels used. We note these differences in the analysis as they are relevant for the assessment of market power. However, we concluded that pursuing an entirely separate analysis for small and large vessels for all cargo types would not be appropriate. Port users often use a combination of large and small vessels with various possibilities to substitute. A cut-off point between large and small would always be to some extent arbitrary as it is usually the drought of a vessel that matters most and the draught depends on the amount of cargo on the incoming or outgoing ship. There is only very limited information on other relevant competitive factors by vessel size and, indeed, many factors, like hinterland considerations, are unlikely to vary.
• For some cargo types we have taken into account other potential considerations. For example, with regard to container we concluded not to pursue a separate analysis of transhipment (see Section 7.12).
• Finally, with minor variations, port authorities themselves typically use the ten cargo types as the main level of disaggregation for throughput statistics. Even at this level the allocation of specific cargos to a cargo type is not always straight forward. For example, roll-on/roll-off is sometimes classified as “other general cargo” and containers are also shipped on trailers. But by and large, this classification is standard in the industry.
1.8.4 RELEVANT GEOGRAPHIC MARKETS AND MARKET POWER
Before discussing the main results by cargo type, we summarise the main findings by type of analysis. This allows a more concise presentation of results and highlights common results and differences across cargo types.
1.8.5 BENCHMARKING OF HARBOUR DUES
Port authorities in the HLH range have developed different tariff structures based on the capacity/size of the vessels, the throughput at the port and other criteria. One key difference between the Rotterdam tariff and the tariffs of rival ports like Antwerp, Amsterdam or Hamburg is that the named ports either cap their fees at a certain ship size or offer cheaper rates for larger vessels.
25
Report prepared for the NMa

Charle s
Rive r
Asso c iate s
In general, harbour dues can vary by a broad range of characteristics. Possible factors for price discrimination include the type of cargo, ship characteristics (e.g. gross tonnage, length, draft, level of loading), the cargo loaded and/or discharged per call, the origin and destination of the cargo, or whether the vessel operates in liner service or as a tramp vessel. In addition, frequency and other rebates can be offered. In Rotterdam, harbour dues mainly vary by cargo category and by ship characteristics.10 There is no differentiation by origin or destination of the cargo carried, but a special tariff applies to shortsea/feeder and hinterland vessels. There are special tariffs or rebates for crude oil tankers, agribulk vessels (frequency reduction), vessels operating in liner service (containers and other general cargo), and roll-on/roll-off vessels. For all other cargo types, HbR does not price discriminate, but charges a general tramp vessel tariff.
Tariffs in Rotterdam depend on the vessel’s gross tonnage and on the amount of cargo loaded and/or discharged in Rotterdam. If cargo equivalent to more than a specific share of the vessel’s GT is loaded and/or discharged in Rotterdam, fixed fee per GT is levied. If less cargo is moved in Rotterdam, the tariff is usually set as a lower fee per GT plus a fixed fee per metric ton of cargo loaded and/or discharged.11
Due to the differences in tariff structures between ports, price comparisons need to be based on tariffs for typical vessels. HbR employs a call cost model that can be used to benchmark harbour dues and other call costs. We have received relevant comparisons between Rotterdam and other ports for all cargo types but liquid bulk (with the exception of a comparison of port call costs for crude oil tankers between Rotterdam and Le Havre). Note that the benchmarking is based on list prices. HbR provides discounts to some port users, in particular to container liners. We therefore requested more detailed information on these discounts. In response, HbR confirmed for the container segment that the data provided represents a good indication of relative prices:
“In our opinion [the benchmarking] gives a good relative pricing picture of the different ports. Just as other ports do we also give incentives to the shipping lines. In 2004 a total of about 16 million euro's is given as incentives to all most all shipping lines. Some are lump sum, others partly dependent on the amount of cargo. The incentives are in most cases between the 20-30%” (information provided by HbR 21 October 2004).
We have, in accordance with this information, assumed that the effects of any discounts to the results of the benchmarking would be negligible.
Table 4 summarises the main results from the benchmarking studies.
10 There are also special harbour dues for inland vessels, e.g. fishermen and pleasure yachts. However, those
are not the focus of this study. 11 See Section 4.2.2 and the different cargo type chapters for a detailed description of the structure of harbour
dues.
26
Report prepared for the NMa
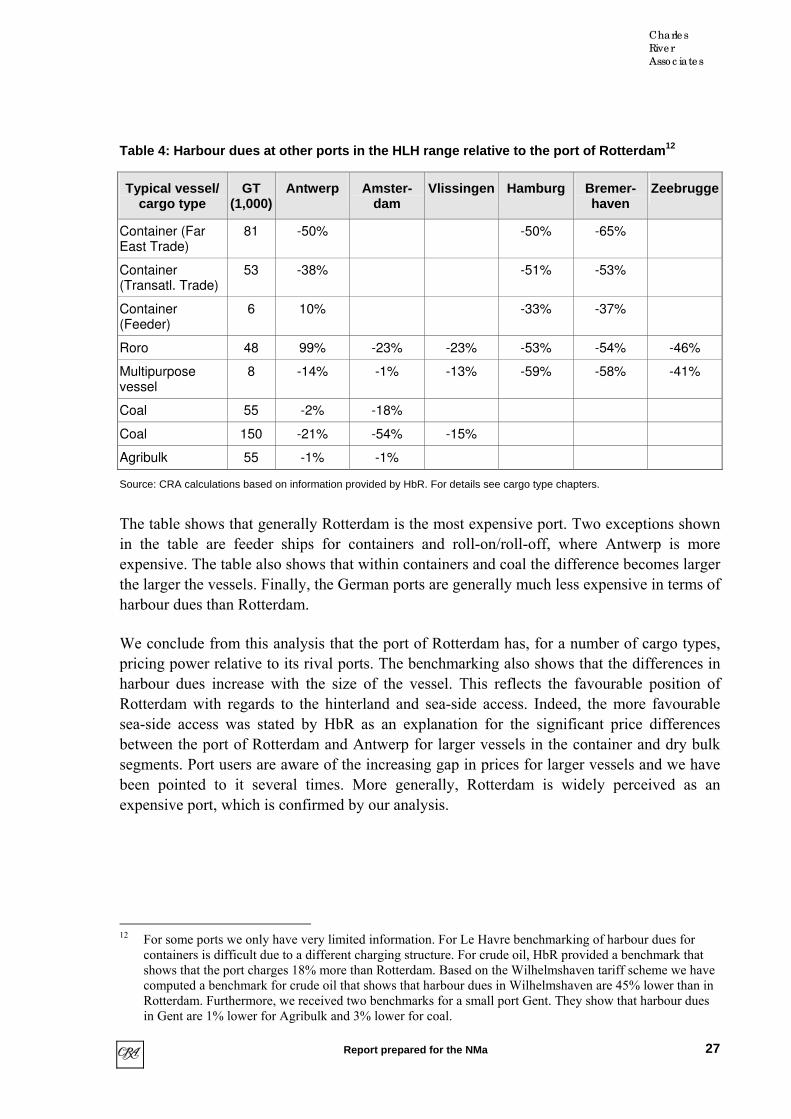
Charle s
Rive r
Asso c iate s
Table 4: Harbour dues at other ports in the HLH range relative to the port of Rotterdam 12
Typical vessel/ cargo type
GT (1,000)
Antwerp Amster-dam
Vlissingen Hamburg Bremer-haven
Zeebrugge
Container (Far East Trade)
81 -50% -50% -65%
Container (Transatl. Trade)
53 -38% -51% -53%
Container (Feeder)
6 10% -33% -37%
Roro 48 99% -23% -23% -53% -54% -46%
Multipurpose vessel
8 -14% -1% -13% -59% -58% -41%
Coal 55 -2% -18%
Coal 150 -21% -54% -15%
Agribulk 55 -1% -1%
Source: CRA calculations based on information provided by HbR. For details see cargo type chapters.
The table shows that generally Rotterdam is the most expensive port. Two exceptions shown in the table are feeder ships for containers and roll-on/roll-off, where Antwerp is more expensive. The table also shows that within containers and coal the difference becomes larger the larger the vessels. Finally, the German ports are generally much less expensive in terms of harbour dues than Rotterdam.
We conclude from this analysis that the port of Rotterdam has, for a number of cargo types, pricing power relative to its rival ports. The benchmarking also shows that the differences in harbour dues increase with the size of the vessel. This reflects the favourable position of Rotterdam with regards to the hinterland and sea-side access. Indeed, the more favourable sea-side access was stated by HbR as an explanation for the significant price differences between the port of Rotterdam and Antwerp for larger vessels in the container and dry bulk segments. Port users are aware of the increasing gap in prices for larger vessels and we have been pointed to it several times. More generally, Rotterdam is widely perceived as an expensive port, which is confirmed by our analysis.
12 For some ports we only have very limited information. For Le Havre benchmarking of harbour dues for
containers is difficult due to a different charging structure. For crude oil, HbR provided a benchmark that shows that the port charges 18% more than Rotterdam. Based on the Wilhelmshaven tariff scheme we have computed a benchmark for crude oil that shows that harbour dues in Wilhelmshaven are 45% lower than in Rotterdam. Furthermore, we received two benchmarks for a small port Gent. They show that harbour dues in Gent are 1% lower for Agribulk and 3% lower for coal.
27
Report prepared for the NMa

Charle s
Rive r
Asso c iate s
1.8.6 CARGO FLOW ANALYSIS
This Section summarises important aspects of the cargo flow analysis, in particular seaside access, the hinterland and hinterland transport modes.
Seaside access
One of the key advantages of the port of Rotterdam is that it is close to the sea and offers unconstrained around-the-clock access for large vessels in terms of draught. Rotterdam’s main rival for many cargo types, Antwerp, is much more restricted as tidal constraints limit the access for large vessels for the larger part of the day. Moreover, vessels need first to steam up the river Scheldt for 4 to 5 hours, and back again 4 to 5 hours to the sea, when going to and coming from Antwerp. Some of the largest ships in dry and wet bulk can only call at Rotterdam, Le Havre and Wilhelmshaven, restricting competition from the other ports in the ARA range (Amsterdam, Vlissingen, Antwerp).
Hinterland and transport modes
Rotterdam and the other ports in the ARA range have very good access to the most important inland waterway in Europe, the river Rhine over which further inland transport is efficient and therefore much used for a large category of cargo types. In particular, a large share of the hinterland traffic of these ports is shipped by barge (about 30% in Antwerp and 60% in Rotterdam).
Their superior access to the river Rhine corridor sets the ARA range ports apart from the German and the French ports, which serve different and, for the approach of important parts of the hinterland, inferior inland waterways. This factor is particularly relevant for dry and wet bulk cargo, for which barge transport is attractive. However, containers are also increasingly shipped by barge.
Road connections are also more favourable in Rotterdam than, for example, in Amsterdam, where congestion is a constant problem. Antwerp is closer to some of the most populated areas in Benelux and Germany by truck, which compensates some of the cost of the additional sea transport up the river Scheldt. However, despite its generally good road connections, Antwerp is currently constrained by the construction works on the Antwerp ring.
While the German ports do not have direct access to the Rhine corridor, they still share some of their hinterland with the ARA ports due to good rail and road connections. It is generally known that Rotterdam ships significantly less cargo to and from the hinterland by rail than for example Hamburg. This reflects the importance of rail connections for the German port, also due to less favourable inland waterway connections compared to the ARA ports. However, a more detailed analysis of the destinations of shipments of containers (which is well suited for
28
Report prepared for the NMa

Charle s
Rive r
Asso c iate s
rail transport) shows that by far the most important overlap in the hinterland of the port of Rotterdam is with the ARA range ports.
Finally, not least due to its deep-water access, which allows large crude oil and mineral oil tankers to call here, Rotterdam is linked to some of the major pipelines for crude oil, mineral oil and chemical products.
The finding of the hinterland analysis that Rotterdam’s most important rivals are in the ARA range is also confirmed by our survey, which suggests that of that volume that would be switched in response to a 10% lasting price increase in total port related costs (total port call costs plus cargo handling costs), 73% would be switched to other ARA range ports. The German ports would attract only 10% of the switched volume, Le Havre and Dunkerque none.
Ranking of cargo types regarding captivity
Cargo that is unlikely to be re-routed to another port in response to a lasting increase in prices can be loosely referred to as ‘captive cargo’. As our previous discussion shows, cargo may be captive for a variety of reasons. Cargo may be captive for a port if the port offers the shortest or most economical routing of cargo depending on the origin and destination of the cargo and other logistical considerations. Moreover, cargo can typically be captive if cargo users or shippers invested in facilities (terminals, refineries) at the port. Finally, cargo may be captive because ships cannot economically access other ports for physical reasons – this applies in particular to very large vessels with deep drought. Our analysis suggests a ranking of captivity of the different cargo types, which is also generally confirmed by our survey.
Crude oil is the most captive cargo type, due to sea-side access requirements (large vessels from the Middle East), dependence on existing facilities at the port (four refineries are located at the port of Rotterdam), and access to inland waterways and pipelines. Other bulk products follow in the captivity ranking. Mineral oil products share some of the characteristics of crude oil (linked to refineries, waterway and pipeline transport). However, the vessels used for this cargo type are on average smaller than crude oil tankers. Iron & ore and scrap also involve some very large and deep-going vessels that, within the ARA range, can only access the port of Rotterdam. For this cargo type, there is also vertical integration of some important customers, which reduces the incentive to switch. The cargo type “other general cargo” contains many different freight, ranging from steel to paper or bananas. This diversity means that captivity varies. Our survey puts it in the middle range, together with coal and other liquid bulk. At the lower end of our captivity ranking we have found to be agribulk, containers and roll-on/roll-off cargo. Among other things, this reflects that the last two are often not destined for the industry located at or near to the port.
29
Report prepared for the NMa

Charle s
Rive r
Asso c iate s
1.8.7 SWITCHING IN RESPONSE TO A (HYPOTHETICAL) PRICE INCREASE
It is important to note that, although an important source of income for HbR, harbour dues are only a very small part of the generalised cost of a particular route for HbR’s ultimate customers. Since access to the port infrastructure is always part of a bundle of complementary services (e.g. sea transport, other call cost such as pilotage and towage, stevedoring, hinterland transport), an increase in harbour dues only has a minimal effect on total generalised costs.
This can be illustrated by using container cargo as an example. A study that has been made available to us by HbR shows that harbour dues at Rotterdam are about €14 per container, which is only a small part of the generalised cost of routing a shipment through a port. The same study provided by HbR shows, for example, that other port related costs are €130 per container in Rotterdam and that hinterland transport cost from Rotterdam to Genk are €191, to Frankfurt/Main €359 and to Prague €735. Using Genk as a lower bound on hinterland cost, the data suggest that harbour dues are at most four percent of the relevant route cost of €335.13 Indeed, when including the full cost of the sea-transport this share would be much lower. Thus, an increase of harbour dues by 10% increases the costs of routing the cargo through the port by at most 0.4 percent. Cost simulations provided by HbR for dry bulk cargo show a similar result: Harbour dues account for about 1-2% of total generalised costs of a shipment from overseas to the German hinterland.14 Hence, an increase in harbour dues by 10% increases the costs of routing dry bulk cargo through the port by at most 0.2%.15
This relationship between harbour dues and generalised costs of a particular route is relevant for the assessment of the profitability of a price increase by HbR. Generally, if costs do not vary with quantity, a small price increase is profitable if the elasticity of demand for the service provided is below one. However, if customers have to buy a bundle of goods and services, like in the port example, the calculation is different. Using the container example mentioned above, suppose costs of HbR that are related to the provision of infrastructure do not vary with the container throughput. Based on the €14 harbour dues and the total route cost (excluding additional sea transport compared to Le Havre) of €335, one can compute the critical demand elasticity with respect to total route cost. These calculations show that an increase in harbour dues by 10% would be profitable if the firm elasticity of demand with respect to total route cost was below 24. That is, only if less than 24% of the volume is lost in response to a 1% increase of the total route cost of €335, the increase in harbour dues would be profitable. If part of the volume is bound to the port, for instance because the cargo is used at or close to the port, or because of specific investments of the carrier, the critical elasticity on the remaining volume is higher. Moreover, the exemplary calculation is based on the
13 The analysis underestimates the potential to increase prices as the current prices are likely to reflect some
pricing power as argued above. 14 The simulations provided by HbR excluded cargo handling costs, which means that the 1-2% share is an
upper bound. 15 Again, the analysis underestimates the potential to increase prices as the current prices are likely to reflect
some pricing power as argued above.
30
Report prepared for the NMa

Charle s
Rive r
Asso c iate s
observed level of harbour dues. If these reflect pricing power, the required elasticity would be even higher, which is less likely at lower prices. More generally, the point of the calculations is that the fact that HbR controls only a small part of the total route costs, it is more likely to have an incentive to implement a small percentage increase in prices than otherwise.
Using furthermore the switching information generated by our survey we conducted an indicative test whether a profit maximising port authority would have an incentive to raise current prices by 10%.16 On the basis of the demand elasticities implied by the survey, we find that this is the case for all cargo types analysed (containers and dry bulk). This result suggests that the users of the services provided by HbR constitute a relevant antitrust market.17 Obviously, there are a number of caveats associated with the use of survey results for the estimation of demand elasticities. In particular, usually only a fraction of total users responds to the questionnaire and there may be a selection bias in the sense that those that have concerns or at least strong positive or negative feelings with regard to the port authority are more likely to respond. Moreover, respondents may make unintended errors or may report strategically. We have therefore not built our conclusions primarily on the findings on the surveys. Rather we have used our profitability test findings as one of many pieces of evidence that, however, seem by and large all to point in the same direction.
1.8.8 EVIDENCE OF SWITCHING AND CAPACITY CONSTRAINTS
The survey technique we applied is much more useful for identifying evidence of past switching and for identifying ports that are considered as relevant substitutes for the port of Rotterdam. Based on the survey responses, we could identify only one example where a port user reported switching in response to an increase in harbour dues.
We also asked those port users that stated that they would switch volume in response to a 10% increase in port related cost to which port they would switch. Table 5 shows the result. It confirms the general perception in the market that Antwerp is by far the most important alternative port compared to Rotterdam and, as already referred to above, on average 73% of the volume would be switched to other ARA range ports.
16 Beware that current prices may already contain market power. 17 In Section 4.2 the port authority’s traditional approach to pricing is discussed. HbR told us that it does not
follow a short-run profit maximising strategy. It is currently reviewing the pricing structure. This may lead, for example, to more price differentiation across cargo types.
31
Report prepared for the NMa

Charle s
Rive r
Asso c iate s
Table 5: Share of volume shifted away from Rotterdam that is moved to other ports
Simple average share of volume moved away from
Rotterdam that would be re-routed to this port
Antwerp 48%
Amsterdam 20%
Hamburg 7%
Vlissingen 5%
Zeebrugge 5%
Other* 4%
Bremen/Bremerhaven 3%
Wilhelmshaven 3%
Felixstowe 2%
Gent 2%
Dunkerque 0%
Le Havre 0%
Totals may not add up to 100 due to rounding. Source: CRA questionnaire. The question was: “Suppose next that the total costs of shipping cargo through Rotterdam (i.e. total port call costs and cargo handling costs) were to increase permanently by 10% while the costs of calling at all other ports stayed at their current levels. Would you shift volume to other ports or would you expect that those who have power over the routing of cargo flows would shift volume from Rotterdam to other ports? If yes, please provide an estimate of the proportion of volume currently shipped through Rotterdam (of the cargo type for which you fill out this form) that you would shift or expect to be shifted to other ports. Please indicate what proportion of the total volume (of the cargo type for which you fill out this form) shifted away from Rotterdam Rotterdam to other ports you would expect to route or to be routed to each of the following ports.” * Other ports mentioned by respondents included Moerdijk, Dordrecht, “other small ports”, Terneuzen, North Killingholme, Thamseport, and Southampton.
In the short-run switching options are, for some cargo types, limited due to capacity constraints. Table 6 shows the estimated throughput capacity for most ports in the HLH-range for containers. It shows that the port of Antwerp is currently facing tight capacity constraints in the container segment.
32
Report prepared for the NMa

Charle s
Rive r
Asso c iate s
Table 6: Container terminal capacity and utilisation in 2003
Capacity (in m TEUs)
Utilisation (%)
Rotterdam 7.5 95
Hamburg 7.2 86
Antwerp 5.4 100
Bremerhaven 3.5 92
Le Havre 2.0 103
Zeebrugge 1.6 62
Amsterdam 1 0
Total capacity (in m TEU)
28.2
Source: Information provided by the HbR on 25 October 2004. The information source for Amsterdam is the Ceres website, see www.ceresglobal.com/pages/pressre.html, accessed on 21 Oct. 2004.
In the container business, capacities are insufficient to accommodate all traffic in Antwerp, which leads to spillover effects to the benefit of Rotterdam. This will change as various initiatives to increase capacity are underway. In particular, the opening of the Deurgank dock is expected to increase capacity in Antwerp from the end of 2005 until 2007 and eventually double Antwerp’s current capacity. This will make Antwerp a much more relevant competitive constraint for Rotterdam.
A very illustrative example of the importance of sea-side access and hinterland connections for the port choice and the limited role of harbour dues is that the port of Amsterdam charges half of the harbour dues and half of the stevedoring dues of Rotterdam for its new container terminal. Still the port has failed to attract any of the shipping lines, despite the capacity constraints seen at Antwerp and Rotterdam in 2004.18
1.8.9 QUALITATIVE EVIDENCE ON PRICING
Every year, HbR publishes a list of port tariffs that includes the harbour dues payable to the port authority. For most cargo types, harbour dues are charged according to the list prices. There are special tariffs or rebates for some cargo/vessel types. These include:
• Tariff for crude oil tankers;
• Frequency reductions for agribulk vessels (based on calls per year);
• Tariff for container vessels operating in liner service;
18 In fact, in a recent situation of very high congestion at Rotterdam, a deep-sea vessel with a few thousand
containers was diverted to Amsterdam. However, many of the containers were routed back to Rotterdam by truck for logistical treatment at the port or Rotterdam.
33
Report prepared for the NMa
Charle s
Rive r
Asso c iate s
• Tariff for vessels carrying other general cargo and operating in liner service (non-shortsea/feeder);
• Tariff for shortsea/feeder vessels (which, by definition, can only carry general cargo and must operate in liner service); and
• Tariff for roll-on/roll-off vessels (whether or not in liner service).
For all other cargo types, HbR does not price discriminate, but charges a general tramp vessel tariff. This means that, for example, coal and mineral oil vessels pay the same harbour dues per GT. This lack of price discrimination by cargo type is not a technical necessity, but represents the traditional pricing approach of the port authority of Rotterdam.19
For some cargo types, additional discounts are given. For example, in the container business, rebates of up to 30% on list prices are negotiated with the liners.
The level and structure of harbour dues are reviewed annually. Until corporatisation, the port authority would consult port customers and then make a proposal to the municipality, taking into account the views of the port customers and especially the financial situation and objectives of the port. A number of features of this process are noteworthy:
• The consultation of port customers was described as “ritual dancing” by HbR as the arguments of the customer representatives are predictable and these rounds are not seen as decisive for the actual outcome of the pricing decision. Our survey broadly confirmed this perception although some port users felt the consultation rounds did have an effect on the pricing decision.
• During the consultation rounds with customers, HbR is usually not approached regarding the level of harbour dues, but customers are more interested in better infrastructure, port facilities and/or land. Capacity limits and congestion are more important issues for customers than harbour dues.
• Occasionally the municipality would not agree with the port’s recommendations regarding the new level and/or structure of harbour dues. In such cases, the municipality would usually demand higher harbour dues in order to improve its own financial situation.
• It was pointed out by HbR that they do not follow a short-run profit maximising strategy, but seek to maintain a stable long-run pricing policy and establish the port as a “reliable partner” for its customers.
• According to HbR other ports generally wait and see how prices in Rotterdam change before they make their pricing decisions. This was confirmed by some but not by all survey respondents that commented on the sequencing of pricing decisions.
• HbR has repeatedly told us that it intends to maintain its traditional cost-based price decision-making process after corporatisation. The only difference will be that the
19 Price discrimination can be welfare and consumer welfare enhancing. The use of this term should not
induce a negative connotation.
34
Report prepared for the NMa

Charle s
Rive r
Asso c iate s
municipality will no longer have to approve prices, which HbR welcomes for it eliminates a level of bureaucracy the port experienced as a professional hinder.
• Harbour dues are not directly related to variable (or marginal) cost of providing services to the port user.20 They are set to generate cash for past and ongoing investments and to generate a return for the owner of the port. Thus, currently the level of investment activity and the conditions of financing these activities influence the pricing at the port of Rotterdam.
Given the current pricing structure, there are limits to the possibilities to price discriminate between different cargo types and destinations. HbR is free to change the pricing structure and to differentiate prices by cargo type. We have been told by HbR that they have discussed possibilities to change the pricing structure, but that no formal plans exist. We have, therefore, not restricted our analysis to the given pricing structure but considered cargo types within the same tariff separately.
1.8.10 CARGO TYPE SPECIFIC CONSIDERATIONS
For some cargo types specific issues were investigated in more depth. For example, for containers we analysed call pattern in order to gather evidence on the intensity of competition between ports (see Section 7.4). For containers, we also considered categorising transhipment as a separate product market. However, we concluded against such a separation (see Section 7.12). A detailed discussion of these cargo type specific considerations can be found in the cargo type chapters.
1.8.11 SUGGESTED MARKET DEFINITIONS BY CARGO TYPE
For none of the markets we investigated could we fully exclude the possibility that the services provided by HbR constitute a separate relevant market. This conclusion results if significant weight is put on the following observations:
• With one exception, we obtained no evidence on past switching in response to an increase in harbour dues. HbR stated that there are no examples of explicit pricing related switching.21 This assessment was confirmed by the port users surveyed: With the exception of one port user (Agribulk) port users could not report evidence on switching in response to an increase in harbour dues.
• Not decisive, but consistent with the fact that almost no switching was observed, is that survey results suggest opportunities to raise prices. Using the switching volumes derived from the survey responses, price increases would be profitable for all cargo
20 See also Masurel, E., Nijkamp, P. and B.W. Wiegmans: “Tariefstructuur van het zeehavengeld en de
daarmee samenhangende dienstverlening voor de oliesector in de Rotterdamse haven”, provided by the NMa.
21 Information provided by HbR 16 September 2004.
35
Report prepared for the NMa

Charle s
Rive r
Asso c iate s
types even at existing levels of prices. This suggests that a profit maximising firm could increase prices further.
• These findings are also a reflection of the fact that harbour dues are only a very small part of the overall route costs that port users have to incur when using the port. As explained above, the smaller the share in total route cost the lower the responsiveness of demand for a given percentage increase of prices.
We have, however, also used various complementary methodologies that do not rely on switching evidence. By putting more weight on this evidence and less weight on the switching evidence we identify definitions that we consider as an upper bound or the widest possible market definitions considering the available evidence. The reason for this is that these are very conservative estimates, based on conservative assumptions and putting less weight on the fact that there is virtually no empirical evidence on switching in response to a change in harbour dues.
For most cargo types, we have been able to draw on a large variety of data to underpin our conclusions. However, for four cargo types, agribulk and “other dry bulk”, roro, and “other general” cargo, the nature of the freight is much more diverse than for most of the other cargo types, and we have less empirical evidence to build firm conclusions on. We have therefore been particularly conservative when drawing our conclusions on these markets – which are, however, not the prime markets in terms of throughput and together account for only about 12% of total throughput in Rotterdam.
Table 7: Market definitions general cargo
Cargo type Market definition based on switching
data
Most conservative market definition
Market share (upper bound)
Container Rotterdam Rotterdam 100%
RoRo Rotterdam Zeebrugge
Rotterdam
Antwerp
Vlissingen
Amsterdam
37%
35%
20%
7%
2%
Other general cargo Rotterdam Antwerp
Rotterdam
Amsterdam
Vlissingen
43%
25%
17%
16%
Source: CRA analysis
36
Report prepared for the NMa

Charle s
Rive r
Asso c iate s
Container
The container business of the port of Rotterdam is generally considered as the most competitive cargo type that goes through the port.22
“The biggest competitive battle between the ports takes place in the container sector. Rotterdam’s most important competitors in this market segment are Hamburg and Antwerp.”23
Containers are standardised, i.e., each container terminal operator can handle containers without further specialisation, and generally containers do not contain input for industry located at the port. It is generally considered as non-captured cargo that could, in principle, be dealt with at any port with a container terminal.24 This is also confirmed by our survey, which shows that many operators consider a large part of their volume as non-captive volume.
In the current situation, we nevertheless conclude that with respect to containers HbR has pricing power relative to its rival ports and identify a very narrow relevant market. A number of factors led to this conclusion, in particular:
• There is clear evidence that Antwerp is the most relevant alternative port compared to Rotterdam. This is confirmed by an analysis of the call pattern, which suggests that the Antwerp-or-Rotterdam decision is much more relevant than the German-or-Benelux port decision (almost all lines call at a German and at a Benelux port). It is further underpinned by an analysis of the hinterland, which shows that the overlap between the ARA range ports is much greater than the overlap between German ports and Rotterdam or Le Havre and Rotterdam. Finally, this proposition is supported by the switching evidence. The survey responses of port users in the container segment suggest that almost half of any switched volume would be switched to Antwerp, 17% to Amsterdam and only 14% to Hamburg and 8% to Bremerhaven.
• However, although the above analysis suggests potential for intense rivalry between Antwerp and Rotterdam, there are a number of factors that indicate that Rotterdam is currently not effectively constrained by Antwerp. Based on evidence provided by HbR, harbour dues for typical deep-sea vessels on the Far East and the Transatlantic trade are 38 to 50% percent lower in Antwerp than they are in Rotterdam (and even lower in Hamburg and Bremerhaven). The differential compared to Antwerp is likely to reflect, among other factors, the better sea-side access of Rotterdam. This explanation was also suggested by HbR and is consistent with the fact that the price difference increases with ship size (the larger the ships, the more binding is the tidal constraint on the river Scheldt, to the disadvantage of Antwerp).
• Moreover, Antwerp is currently operating at full capacity. There is clear evidence that Rotterdam currently benefits from container flows that cannot go through Antwerp due to these constraints. This situation is expected to gradually change from the second half of the year 2005 onwards, but will be binding at least until then.
22 Interview with [confidential] on 8 July 2004. Interview with HbR. 23 HbR Annual Report 2004, p. 13. 24 With more and more cargo types being containerised, we may see more port bound containers in the future.
37
Report prepared for the NMa

Charle s
Rive r
Asso c iate s
Note that these findings do not suggest that the statement in HbR’s annual report, that the “biggest competitive battle” between the ports takes place in the container sector is necessarily generally wrong. Port related costs comprise many elements. Harbour dues are only a small part of the total port related cost and hinterland cost, whereas other elements, like container handling costs, are much more substantial part of total transport cost. It follows that competition between stevedores, on price and on quality, may indeed be intense but competition between port authorities in setting their harbour dues is not. Note, however, that in the short-run the capacity constraints at Antwerp also affect competition between stevedores.
Roll-on/roll-off
The roll-on/roll-off business is one of the least captive. This has been pointed out in our survey and it is confirmed by the fact that, at least for accompanied trucks on ferries, the terminal handling services are minimal. Over 90% of HbR’s revenue in this sector is generated by ferry services between Rotterdam and the east coast of Great Britain the so-called North Sea ferry market. We have included all ports that operate in this market as relevant alternatives. The key points that lead to this definition were the following:
• The non-existence of routes and the geographical location of ports suggest that it is currently not economical to serve the east coast of Great Britain from other ports than those included in the North Sea ferry market. Close to 90% of the respondents to our survey said that they would switch to one of the markets included in our definition. HbR considers Zeebrugge, which accounts for the largest roro throughput of ports that operate on the North Sea trade, as the most important competitor. There is also evidence that the hinterland on the continent is to a large extent local, or confined to the Benelux countries and locations in Germany along the Rhine.
• For the decision to move cargo from the North Sea to the French short sea market total generalised cost (including hinterland transportation in Great Britain) are to be considered. Given the low share of harbour dues in total generalised cost, an increase in harbour dues by five to ten percent is unlikely to lead to a significant shift from the North Sea ferry market to other ferry markets, like the market for the French short sea.
• Even across the ports serving the North Sea ferry market the port of Rotterdam can sustain higher price differences compared to Zeebrugge (46% less expensive), Amsterdam (-23%) and Vlissingen (-23%). The only exception to the rule that HbR’s harbour dues over all its types of cargo are the largest of all ports is roro harbour dues in Antwerp, which are double those of Rotterdam. According to HbR, however, this situation is likely to reflect the fact that the tariff benchmark in Antwerp captures the tariff for car cargo vessels rather than ferry services. Antwerp has traditionally focussed more on cars, whereas Rotterdam’s main roro business is ferry services. The markets are likely to be separate, and the differentiated but equally raised harbour dues are an indication of pricing power of both Antwerp (for cars) and Rotterdam (for ferry services), rather than a competitive discipline for HbR.
38
Report prepared for the NMa
Charle s
Rive r
Asso c iate s
Comparing the ports that operate in the North Sea ferry market shows that the port of Rotterdam has a market share of 35%. In the Havenplan 2020, published by HbR and other bodies, competition with the most important rival in that market, Zeebrugge, was seen as limited. This conclusion was based on Hinterland considerations. This conclusion is confirmed by the benchmarking analysis. Note, however, that the finding that roro traffic is the least captive cargo type would suggest that competition within the North Sea ferry market should be more intense. Contrary to cargo types like bulk cargo, specific investments and the availability of industry at the port seems less relevant. The choice of port seems mainly driven by transport cost considerations for the origin and destination pairs of the cargo.
Other general cargo
Generally cargo is very diverse, ranging from paper to steel or bananas. Some ports, including Antwerp, distinguish various types of general cargo in their tariff scheme. It would therefore not be entirely impossible to analyse each sub-market separately. In our assessment we alternatively rely on our general findings regarding the hinterland and the captivity of business that generates significant value added at the port. In particular, the following arguments were critical:
• For a number of general cargo types, ports have specialised (like fruit juices in Rotterdam and bananas in Antwerp) and built up industrial clusters at the port, suggesting that some cargo is captive. This is confirmed by our survey, which ranks “other general cargo” in the mid-range with respect to share of captive volume.
• The survey respondents pointed to Antwerp as the most important substitute port. Interestingly, a number of respondents also pointed to Vlissingen as a less important but relevant alternative.
• The benchmarking confirms the general picture obtained for other cargo types as well. Rotterdam is the most expensive port, although harbour dues are very similar to those in Amsterdam. This evidence, the fact that switching is confined mostly to the ARA-range ports, and the overlap in hinterlands all points to the conclusion that the ARA-range forms an upper bound on the relevant market.
Liquid bulk
In contrast to roro and container cargo, which rank lowest in terms of the share of captive volume identified by our survey respondents, liquid bulk was generally classified as the most captive, in particular crude oil and mineral oil products.
39
Report prepared for the NMa

Charle s
Rive r
Asso c iate s
Table 8: Market definitions liquid bulk
Cargo type Market definition based on switching
data
Most conservative market definition
Market share (upper bound)
Crude oil Rotterdam Rotterdam 100%
Mineral oil products Rotterdam Rotterdam
Antwerp
56%
44%
Other liquid bulk Rotterdam Rotterdam
Antwerp
78%
22%
Source: CRA analysis
Crude oil
Crude oil is only shipped into and not out of the port of Rotterdam and other ports in the Hamburg-Le Havre range. Shipments of crude oil are primarily determined by the location of the refineries. Four refineries are located at the port itself. They consume about half of the crude oil shipped into Rotterdam. The rest is pumped through pipelines to refineries located elsewhere. Some of these refineries also have access to a pipeline from Wilhelmshaven (they consume about 16% of Rotterdam’s volume). The rest is mainly pumped through a pipeline to refineries in Antwerp. We conclude that Rotterdam is the relevant market, for the following reasons:
• The capacity of the pipeline from Wilhelmshaven is almost fully utilised.
• Crude oil is shipped by some of the largest vessels with significant depths. These cannot call at Antwerp for physical restraints.
• The price difference between harbour dues in Rotterdam and Wilhelmshaven and Rotterdam and Antwerp suggests that Rotterdam has significant market power.
Mineral oil products and other liquid bulk
The position of the port of Rotterdam with regards to mineral oil products and chemical products (about half of “other liquid bulk” is chemical products, the other half is oils and liquid fats) follows to some extent from the strong position in crude oil and the existence of major refineries at the port: A large number of shipments are induced by the petrochemical industry located at the port. Rotterdam has the largest petrochemical cluster in the HLH-range. We define Antwerp and Rotterdam as the relevant markets, mainly because:
• Some 50% of the hinterland traffic for mineral oil products is shipped through pipelines, thus giving Rotterdam a strong position. The remainder is shipped via inland waterways. For other liquid bulk the share of barge transport is 75%.
40
Report prepared for the NMa

Charle s
Rive r
Asso c iate s
• The importance of barging gives the ARA range ports a strategic advantage, as they have superior access to the river Rhine corridor and the industry alongside.
• For many types of oils and fats, refineries and other processing at the port makes this business captive.
• Our survey results show that the only other port that was mentioned as a potential substitute to Rotterdam was Antwerp.
We have therefore concluded that the hinterlands served by the ports of Antwerp and Rotterdam constitute the widest possible relevant geographic market for mineral oil products and “other liquid bulk” type, that Rotterdam has consistently the largest market share in this market, as well as some power to set prices.
Dry bulk: Iron ore and scrap, coal, agribulk, and other dry bulk
Table 9: Market definitions dry bulk
Cargo type Market definition based on switching
data
Most conservative market definition
Market share
Iron ore and scrap Rotterdam Rotterdam
Amsterdam
Antwerp
Vlissingen
70%
18%
12%
0%
Coal Rotterdam Rotterdam
Amsterdam
Antwerp
50%
34%
16%
Agribulk Rotterdam Rotterdam
Amsterdam
Gent
Antwerp
44%
39%
11%
5%
Other dry bulk Rotterdam Rotterdam
Antwerp
Amsterdam
Gent
Zeebrugge
Vlissingen
29%
27%
21%
17%
4%
2%
Source: CRA analysis.
Dry bulk cargo is mainly used as an input for industrial production. The most important cargo types in this segment are iron ore & scrap and coal, which together account for almost 80% of
41
Report prepared for the NMa
Charle s
Rive r
Asso c iate s
total dry bulk throughput in Rotterdam. We base our suggested definition of the relevant markets on the following considerations.
• For iron ore & scrap and coal shipments, draught restrictions are the most important capacity constraint for competition between ports. Rotterdam is the only port that can accommodate large capesize vessels with more than 16.5 metres of draught. This means that at least between 62% (iron ore) and 11% (coal) of the current throughput volume in Rotterdam can be considered as captive business. Vertical integration of the main users also adds to the captivity of dry bulk cargo in Rotterdam. Both factors provide HbR with pricing power, which increases with the size of the respective vessel. The existence of price differentials is confirmed by our benchmarking analysis.
• Iron ore & scrap and coal are the most important dry bulk cargoes for the port of Rotterdam, both in terms of throughput and revenues generated for HbR. For both cargo types, German steel producers and power plants located in the hinterland in the Rhine/Moselle/Main area are the most important customers of the port of Rotterdam and all other ports in the ARA range. The overlap in hinterland with the German ports is marginal and not relevant for iron ore and coal. Moreover, our benchmarking analysis shows that harbour dues in Rotterdam are significantly higher than harbour dues in Hamburg. For agribulk and mineral dry bulk, the same hinterland and benchmarking considerations apply, which leads us to conclude that the German ports do not represent a competitive constraint on the pricing of HbR and are therefore not part of the relevant markets for any of the dry bulk cargo types.
• The importance of the other ARA ports, in particular Amsterdam and Antwerp, was confirmed by the responses to our survey.
• Due to relatively favourable maximum draught conditions (although still worse than in Rotterdam) and resulting fringe capacity, we included the port of Vlissingen in the relevant markets for iron ore and scrap and other dry bulk. This was confirmed by our survey results.
• Based on our hinterland analysis and our survey results, we also added Gent to the relevant markets for agribulk and other dry bulk. For other dry bulk, Zeebrugge was considered to be relevant too.
• The French port of Dunkerque shares some of the hinterland with the ARA ports, in particular in Belgium and Northern France. Still, although HbR indicated that volumes have been switched from Rotterdam to Dunkerque in the past, we have found no evidence for switches induced by harbour dues only. Also, the large majority of iron ore and coal shipped through Rotterdam is destined for German industry end users (83% and 63% respectively). Hence, the overlap in the hinterland is only very small. In addition, our survey responses indicate that Dunkerque is not considered as a suitable alternative to the port of Rotterdam for the various dry bulk goods. Even if it was mentioned as an alternative, respondents would not shift any volume there if prices in Rotterdam increased. Note that the latter argument also applied to Le Havre, which we excluded also due to hinterland considerations.
42
Report prepared for the NMa
Charle s
Rive r
Asso c iate s
1.8.12 COUNTERVAILING POWER , ENTRY AND EFFICIENCIES
Most port users pay harbour dues as published in the tariff brochure. HbR consults its customers prior to changing the list prices, but, as discussed above, these rounds are considered as “ritual dances” by the port itself. The fact that no serious negotiations take place at these rounds has been confirmed by our survey.25 Some port users, in particular container lines, but also some bulk users, negotiate discounts. With regard to container lines, the existence of price differentials between Rotterdam and Antwerp, as well as the current congestion at Antwerp, suggest that shipping lines have not been able to exercise countervailing power to the degree of eliminating HbR’s pricing power. The position of the lines is likely to be enhanced by the capacity expansion at Antwerp towards the end of 2005. Still, for the time being, although a number of port users are large companies, we conclude that they do not have countervailing power. Shortly before we finalised this project, HbR pointed to the apparent presence of discounts to some dry bulk cargo customers. Our survey also brought up some cases of roro customers receiving discounts. Our analysis rests on the assumption that the price benchmarks provided by HbR reflect relative pricing between ports sufficiently well. As tariff differences are substantial, however, our conclusion would be robust to fairly large asymmetric discounts, so that this working assumption is not crucially influencing our findings. For containers, HbR has explicitly confirmed that the provided benchmarking data (which excludes discounts) is a good approximation of relative prices with discounts. The lack of evidence of actual switching in response to an increase in harbour dues is consistent with the absence of effective countervailing power.
Throughput of almost all cargo types in the HLH range is growing, reflecting increasing trade flows due to globalisation and the need of the European industry for raw materials. This growth offers opportunities for some of the smaller ports to attract investment in facilities and offer a more attractive network of hinterland connections. Clearly, this may change the competitive landscape in the future.
Vertical integration can lead to foreclosure effects, but also to efficiencies. As the port of Rotterdam is essentially a landlord port not engaged in significant complementary activities, and since we did not hear any complaints as a result of the survey on this issue, we did not pursue any in-depth analysis of foreclosure or potential efficiencies of vertical integration. At a number of occasions, however, interviewees and survey respondents pointed out that they felt that ECT, the container terminal previously partially owned by HbR, receives preferential treatment compared to other terminal operators. Some of the shipping lines also stated that the lack of competing terminals at the port was of concern and that stevedoring services had been of insufficient quality and too expensive. Although these signals, if robust, would further substantiate our findings on the dominance of HbR, we have not further investigated these issues, as they are outside the scope of the present study.
25 However, one respondent pointed to a success of negotiations at these consultation rounds for feeder vessels
and ferry operators in the past.
43
Report prepared for the NMa
Charle s
Rive r
Asso c iate s
1.8.13 LIMITATIONS OF THE ANALYSIS
While our analysis provides convincing evidence that HbR has pricing power relative to rival ports and that the standard approach to market definition leads to relatively narrow markets among which HbR serves its own relevant market relatively uncontrained by competitors, a few remarks are important to put the findings into context. In particular, the finding of short-run pricing power does not automatically lead to a conclusion that this is welfare harming:
• While ports may have the power to exploit pricing power for a number of years, long-run considerations may induce lower pricing (in particular for expanding ports that want to attract more tenants).
• Dynamic considerations suggest that higher pricing of a port that has locational and geographic advantages can lead to higher investment at the – from a social perspective – right place.
• The competitive relationship between port authorities depends on the financing of the port authorities’ investments. However, as explained above, analysing subsidies/state aid is beyond the scope of this report.
1.9 Structure of the report
The remainder of the report is structured as follows. Chapter 2 details the approach to market definition and market power. Chapter 3 summarises the survey results. Chapter 4 provides a more detailed account of HbR’s activities, in particular the renting out of land and the provision of infrastructures. The ensuing chapters 5 to 10 present the detailed analysis of market definition and market power for these activities. Each of these chapters is introduced by an overview that summarises the key arguments and conclusions. The analysis with regard to the provision of infrastructure is conducted on the level of the ten identified cargo types. However, in order to avoid unnecessary repetitions we have grouped the analysis according to cargo categories: container, roll-on/roll-off and other general cargo, dry bulk and liquid bulk. In the last chapter we briefly discuss further considerations that put the analysis into the broader context of welfare considerations.
44
Report prepared for the NMa

2 The approach to market definition and market power
2.1 Introduction
The definition of the relevant market is an intermediate step in order to assess market power. It is a tool for aiding the competitive analysis by identifying those substitute services that provide a significant constraint for the services offered by HbR. The European Commission Notice on the definition of the relevant market confirms this view:
“The main purpose of market definition is to identify in a systematic way the competitive constraints that the undertakings involved face. The objective of defining a market in both its product and geographic dimension is to identify those actual competitors of the undertakings involved that are capable of competitive pressure” (para 2).
While a proper definition of the market is a helpful step in the analysis of market power, it is not sufficient and also not always necessary for the purpose of analysing market power.
The insight that there are various intermediate methods to get an understanding of issue of pricing power in the present project has implications for the kind of data that is to be gathered as part of the empirical analysis in order to put the NMa in a position to assess market power. In this section we therefore describe an analytic framework that includes, but also goes beyond the definition of the relevant markets.
Six elements can be distinguished that are relevant for the analysis of market definition and market power:
• Identification of participants, services, cargo types and flows;
• Market definition;
• Barriers to entry;
• “Countervailing power” of port customers;
• Efficiencies; and
• Collusion.
Report prepared for the NMa

Charle s
Rive r
Asso c iate s
2.2 Preliminary steps: Identifyin g participants, services, cargo types and flows
In its preliminary investigation of the economic activities of HbR, the NMa has concluded that the findings with regard to demand side substitution are likely to differ with regard to the type of ships that are used, the type of cargo, and the route. Moreover, the set of alternatives differs, depending on the positioning in the transport chain. For example, while ship-owners will consider using alternative ports in response to a price increase, shippers will, for some goods, also consider using alternative modes of transportation.
The analysis of, first, the types of services that are provided by HbR and, second, the alternatives to these services that are available to port users is the first important step of the market definition exercise. It involves identifying:
• Services provided by HbR – We describe the services provided by HbR in the next section. Market definition will concentrate on the two main activities of HbR, the distribution of parcels of land and the supply and operation of port infrastructure. Both markets are related. For example, competitive pressure on the market for the provision of infrastructure will constrain pricing for the leasing of land. This affects the sequencing of our analysis as we note below.
• Identifying key participants - The commercial activities conducted by the HbR involve the interaction of a number of principal parties, including coastal and international shipping operators, shippers, other providers of port services as well as land transport providers, regulators and tenants. For the market definition exercise the key participants are those that decide on the cargo flows (to assess relevant markets for the provision of infrastructure and the leasing and renting of land) and on the decision at which port to locate (to assess relevant markets for leasing and renting of land). We have identified the relevant participants by using the list of tenants provided by HbR, further information on port users that is available from HbR’s website, CRA industry expertise and relevant public documents.
• Types of cargo - Ports handle a range of cargoes. One critical task in the market definition exercise is to determine which cargo types should be considered together in the same “product market”. The appropriate definition critically depends on the ability of the port to differentiate between different cargo types and whether there are differences in the competitive constraints. To see that point, consider the following example. Suppose the port authority does not distinguish pricing between vessels that carry cargo type A and B, so that a price increase will always affect both cargo types (for ease of terminology we refer to cargo types in one pricing scheme as cargo categories, i.e. A and B are in one cargo category). Suppose further that there are two main competing ports (e.g. measured by available cargo handling capacity) for cargo type A, say Antwerp and Dunkerque, and two competing ports for cargo type B, say Antwerp and Amsterdam. Given the pricing structure, the pricing of the port authority will then be constrained by all three ports. Whether this constraint is sufficient to say that all three ports are in the same geographic market for the cargo category (A + B) depends on further analysis (such as the importance of cargo flow A, which may be
46
Report prepared for the NMa

Charle s
Rive r
Asso c iate s
minor). Thus, when identifying the relevant types of cargo, two questions need to be answered. First, are the cargo flows affected by similar competitive constraints (if yes, they can be grouped together) and second, can the port differentiate between the cargo types? In practice, a further consideration is the level of detail at which information is available in order to consider differences in competitive constraints. Often, the categorisations used by industry reflect a level of disaggregation that is sufficient to take strategic pricing decisions. Below, we propose to distinguish ten different cargo types.
• Origin and destination of cargo – It is general industry knowledge – confirmed time and again in our interviews and questionnaires - that hinterland costs and seaside access are critical factors for the choice of port. In theory, it is possible to choose many different levels of aggregation. What is the correct level of aggregation? Here it is worth noting an important difference between the origin and destination and the type of cargo. While it is easy for the port to distinguish harbour dues by cargo type, it is usually not that easy to distinguish harbour dues by detailed origin or destination of the cargo. This is, first, because it would add significant complexity to the pricing scheme and, second, because a ship may carry cargo for many destinations and from many origins (this is especially relevant for the container business). Moreover, the port and those paying the harbour dues may simply not have that the necessary information about origins and destinations of the cargo (which incidentally also prevents them from price differentiating along this dimension when they would have the power to do so). Thus, in general, the proper approach is to analyse the origin and destination patterns at the level of cargo types (which could in principle be distinguished by the port). The level of detail that is applied in this analysis can vary significantly (see our proposal regarding module B).
2.3 The conceptual framework for market definition
The main practical purpose of market definition is to permit inferences about market power to be drawn from market shares. Thus, the relevant market needs to be defined so that it contains all those substitute products and regions that provide a significant competitive constraint to the services of HbR. The approach followed by most competition authorities is the “hypothetical monopolist test,”also called the “SSNIP test” (Small but Significant and Nontransitory Increase in Price). This test goes through the logic of a hypothetical monopolist to determine whether or not pricing on a particular candidate market is constrained by substitute products. The relevant market is the smallest collection of products (regions) such that the hypothetical profit-maximising monopolist would, if he were serving the market on its own, impose a small but significant nontransitory increase in price, assuming the terms of sale of the other products are held constant. The NMa itself explained the SSNIP test in a recent merger decision:
Het gaat er bij deze test om vast te stellen wat de reactie van consumenten is op een niet-tijdelijke verandering in prijzen van 5 à 10% door een bepaalde producent. In het geval dat zij zullen overstappen naar een andere producent, worden op grond van de SSNIP-test beide
47
Report prepared for the NMa

Charle s
Rive r
Asso c iate s
producenten tot dezelfde relevante markt gerekend. (Besluit van 28 januari 2004, Nummer 3524 / 47, Juliana Kinderziekenhuis/ Rode Kruis Ziekenhuis - Leyenburg Ziekenhuis, p. 15).
The definition of the relevant market can have several dimensions. It is common to distinguish relevant product markets and relevant geographical markets. The main practical purpose of market definition is to permit inferences about market power to be drawn from market shares. Thus, the relevant market needs to be defined so that it contains all those substitute products and ports that provide a significant competitive constraint to the services of HbR. With regards to the services provided by HbR the following issues are of particular relevance:
• Relevant product markets - The main issues regarding the relevant product markets in the area of ports refer to the level of disaggregation regarding the types of cargo and the origin and destination of cargo. Other possible considerations include the size of the vessels, the types of customers or the modes of transport that are used for part of the transport chain. Products are grouped together if they face similar competitive restraints and if the port authority cannot differentiate between them. In practice, a further consideration is the level of detail at which information is available in order to consider differences in competitive constraints. Often, the categorisations used by industry reflect a level of disaggregation that is sufficient to take strategic pricing decisions.
• Relevant geographic markets - The relevant geographic market with regard to the provision of port infrastructure and with regard to the leasing of land to port bound customers is determined by analysing, which ports provide significant competitive restraints to the pricing of HbR. Tenants that are not bound to the port could also locate in regions outside the port. For them the relevant geographic market is much wider.
The approach followed by most competition authorities to determine the relevant markets is the “hypothetical monopolist test,” also called the “SSNIP test” (Small but Significant and Nontransitory Increase in Price). This test goes through the logic of a hypothetical monopolist to determine whether or not pricing on a particular candidate market is constrained by substitute products. The relevant market is the smallest collection of products (regions/ports) such that the hypothetical profit-maximising monopolist would, if he were serving the market on its own, impose a small but significant nontransitory increase in price, assuming the terms of sale of the other products are held constant.
There are a number of potential pitfalls that need to be avoided when applying the hypothetical monopolist test. We consider them under the headings:
• Wrong benchmark price;
• Reference to average instead of marginal consumers;
• Negligence of supply side substitution; and
48
Report prepared for the NMa

Charle s
Rive r
Asso c iate s
• Wrong sequence of analysis.
Pitfall 1: Wrong benchmark price (“Cellophane fallacy”)
The hypothetical monopolist test will only produce reasonable results if the current price is a price reflecting effective competition. In the European Commission Notice on the definition of the relevant market this is emphasised:
“Generally, and in particular for the analysis of merger cases, the price to take into account will be the prevailing market price. This might not be the case where the prevailing price has been determined in the absence of sufficient competition. In particular for investigation of abuses of dominant positions, the fact that the prevailing price might already have been substantially increased will be taken into account” (para 19).
For the purpose of this investigation, this implies that one has to consider the possibility that some of the tariffs set by the port of Rotterdam under its previous organisational form do not reflect prices compatible with effective competition. That is, they may already include a considerable mark-up. Ignoring this possibility is known as the “Cellophane fallacy”. Note that ignoring a mark-up may lead to a market definition that is too wide. It cannot lead to a market definition that is too narrow.
One way to study whether existing prices already reflect market power is to compare the prices for similar services at different ports. We explain our approach to address this issue in Section 2.5.1.
An alternative approach to address the issue of the Cellophane fallacy is to study past incidences of capacity shortages. If prices went up significantly, this may reflect a lack of market power in the absence of these capacity shortages. We find that in the past the pricing of the port authority in Rotterdam was based on yearly adjustments and followed a long-run strategy, not adapted to short-run fluctuations in demand. Thus, past pricing data will not generate the information required for this analysis.
In any event, when there is indication that the prevailing price level reflects a considerable mark-up already, the relevant market tests will overestimate the substitution effects from a (further) price rise, as prices are already high to begin with. As a result, the relevant market is defined to include more products than are truly in the market, so that market power is likely to be underestimated due to this fallacy. Relevant markets are likely to be smaller when based on already monopolized prices.
Pitfall 2: Reference to average instead of marginal consumer
The profitability of a price rise depends on the sales volume that would be lost following such a price increase. Thus, one tool used in competition inquiries is the analysis of switching behaviour of customers. A common error in competition inquiries is the focus on the
49
Report prepared for the NMa

Charle s
Rive r
Asso c iate s
behaviour of the average consumer. It is, however, not the behaviour of the average customer but that of the marginal customer that matters for market definition and therefore for the analysis of market power. The crucial question is whether the loss of sales that results from a price increase would be sufficient to offset the increased profits that stem from the higher margin on the remaining sales. It is not necessary for all customers to be willing to switch, only that enough would switch in response to a price increase for it not to be a profit maximising price increase.
In our survey, we asked whether users of the port of Rotterdam would switch in response to a lasting increase in port related prices by ten percent. In order to assess the economic importance of the switching statements we asked port users how much they would switch, and to which ports. This analysis was complemented by a cargo flow analysis described in more detail below. The cargo flow analysis looks directly at pricing power by analysing the differences in generalised cost of different cargo flows. If differences for a large number of these flows are large, a narrow relevant market follows.
Pitfall 3: Negligence of supply side substitution
Supply side substitution is given if companies that currently do not provide services that are substitutes for HbR could easily switch their production and offer these services. We agree with the initial assessment of the NMa that it is unlikely that on the level of inter-port competition other providers could easily switch from their current activity to providing the entire set of services that is provided by the port of Rotterdam. In fact, given the observed growth in almost all categories, switching is unlikely to occur. However, we do observe significant efforts by many ports to expand capacities and attract terminals for different cargo types. We analysed known expansion plans in the chapters discussing the cargo types. We also asked for known expansion plans in our survey.
Pitfall 4: Wrong sequence of the analysis
The results of the market definition analysis may depend on the sequence in which products or other ports are added. In order to identify the correct relevant market, it is necessary to add the services (ports, modes) to which the current customers of HbR would most likely switch first. If, for instance, the market for container shipping is analysed, and one would ask the question, would you switch to Gent in response to a hypothetical price rise, the answer could be no. This could lead to a wrong (too narrow) market definition as shippers may effectively consider Hamburg as the most relevant alternative container port.
This pitfall is addressed by asking port users where they would switch cargo volume in response to a price increase. Moreover, we ask a range of questions that address the issue of the quality of substitution of different ports. This allows us to determine the relevant sequence of the analysis by considering the best substitutes first.
50
Report prepared for the NMa
Charle s
Rive r
Asso c iate s
2.4 Market power
In academic textbooks market power is sometimes referred to as pricing above marginal cost, i.e. the cost of producing the last unit of output (in practice average variable cost are often used as a substitute to marginal cost). In practice, this theoretical measure is often not very useful. If producing the goods involves low marginal cost but high fix costs that result, for example, from investments in infrastructure, market power in the academic sense would be necessary in order to provide sufficient investment incentives. Regulatory bodies therefore usually take into account the incentives for investment, e.g. when regulating prices. One way to achieve this is to use cost concepts that consider the cost of the investments into the infrastructure.
In the context of this study our focus is not on determining a set of optimal prices that a regulator would set. Moreover, we have not been tasks to study the financing of the port authorities and their investments.
In investigations that involve market definition and market power, competition authorities often rely on techniques that do not rely on a direct measure of costs of the firm investigated. We use these techniques and explain them further below. If pricing of the rival ports is competitive these techniques can be used to show that the analysed firm exploits market power. If rivals price below competitive levels (e.g. due to subsidies), the techniques provide evidence on the potential to exploit market power if rival firms were to price competitively. In other words, in a market where all rivals price artificially low, even a firm with market power may be constrained to price at costs. Since we did not look at the financing of HbR and rival port authorities, our results provide no direct evidence that the port is currently pricing excessively.
However, we do provide direct and convincing evidence addressing the question whether HbR can charge higher prices than the most important alternative ports. Such pricing power provides a strong indication that HbR can exploit its dominant position, at least if rival ports do not price below costs, i.e. it suggests that HbR has market power if rivals do not price artificially low.
If firms exploit market power by setting high prices this will, at least in the short-run, harm customers of the port. The welfare implications for other groups in society depend on a variety of factors. For example, if ports operate at full capacity, high prices may have no effect on the number of calls, implying that there is, at least in the short-run, only a distributive effect to the benefit of the port authority. Since consumers are not direct customers of the port they are affected as higher transport costs lead to higher prices for consumer goods.
51
Report prepared for the NMa
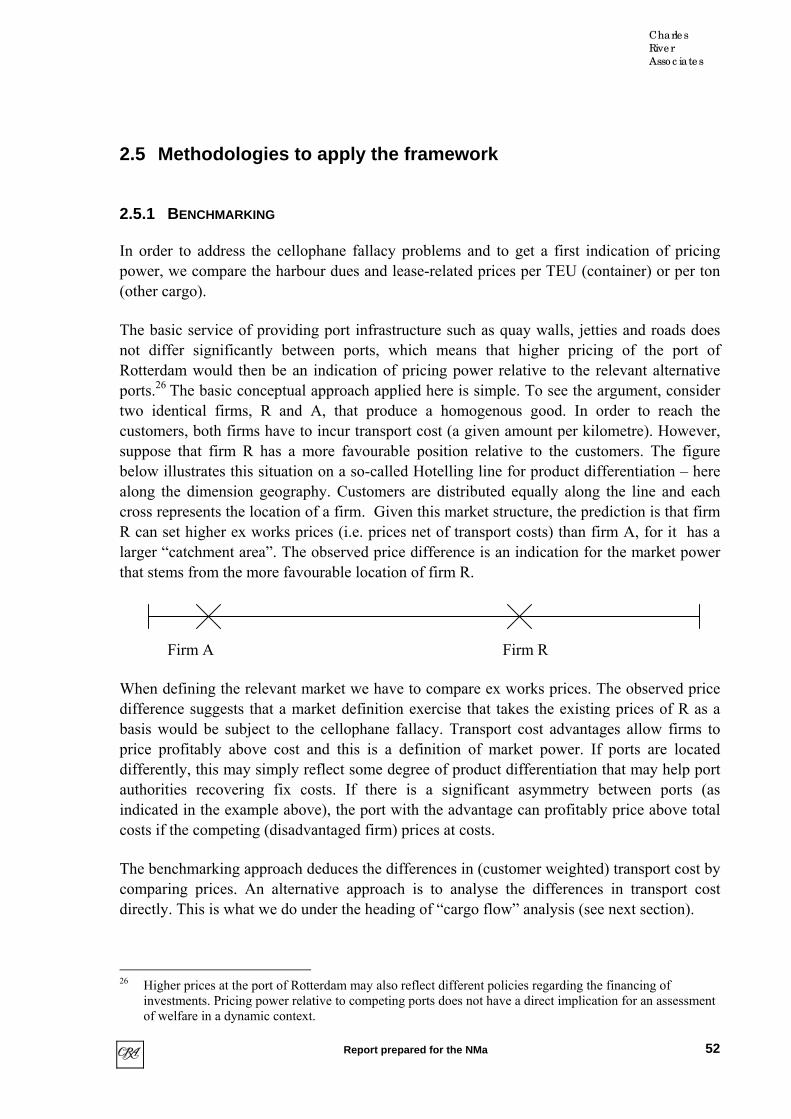
Charle s
Rive r
Asso c iate s
2.5 Methodologies to apply the framework
2.5.1 BENCHMARKING
In order to address the cellophane fallacy problems and to get a first indication of pricing power, we compare the harbour dues and lease-related prices per TEU (container) or per ton (other cargo).
The basic service of providing port infrastructure such as quay walls, jetties and roads does not differ significantly between ports, which means that higher pricing of the port of Rotterdam would then be an indication of pricing power relative to the relevant alternative ports.26 The basic conceptual approach applied here is simple. To see the argument, consider two identical firms, R and A, that produce a homogenous good. In order to reach the customers, both firms have to incur transport cost (a given amount per kilometre). However, suppose that firm R has a more favourable position relative to the customers. The figure below illustrates this situation on a so-called Hotelling line for product differentiation – here along the dimension geography. Customers are distributed equally along the line and each cross represents the location of a firm. Given this market structure, the prediction is that firm R can set higher ex works prices (i.e. prices net of transport costs) than firm A, for it has a larger “catchment area”. The observed price difference is an indication for the market power that stems from the more favourable location of firm R.
Firm A Firm R
When defining the relevant market we have to compare ex works prices. The observed price difference suggests that a market definition exercise that takes the existing prices of R as a basis would be subject to the cellophane fallacy. Transport cost advantages allow firms to price profitably above cost and this is a definition of market power. If ports are located differently, this may simply reflect some degree of product differentiation that may help port authorities recovering fix costs. If there is a significant asymmetry between ports (as indicated in the example above), the port with the advantage can profitably price above total costs if the competing (disadvantaged firm) prices at costs.
The benchmarking approach deduces the differences in (customer weighted) transport cost by comparing prices. An alternative approach is to analyse the differences in transport cost directly. This is what we do under the heading of “cargo flow” analysis (see next section).
26 Higher prices at the port of Rotterdam may also reflect different policies regarding the financing of
investments. Pricing power relative to competing ports does not have a direct implication for an assessment of welfare in a dynamic context.
52
Report prepared for the NMa

Charle s
Rive r
Asso c iate s
Note that the reverse conclusion is not possible. That is, should prices do differ, this may reflect that current prices are competitive, but it is also consistent with ports operating in different relevant markets and having comparable pricing power, leading to fairly equal high price levels, or even with outright collusion among the ports.
The benchmarking approach is relatively simple for those cargo types for which comparative pricing data exists. Moreover, it is meaningful regarding the assessment of pricing power reflected in existing prices. However, it does not answer the question whether there is scope to increase prices (which we address in the following sections).
2.5.2 CARGO FLOW ANALYSIS
A complementary approach to the price benchmarking method is to analyse cargo flows. The conceptual approach is relatively simple. If at given prices27 the routing of a relevant unit of cargo via Rotterdam (considering hinterland transport costs, sea transport cost, cargo handling costs, and call costs, including harbour dues) costs €1,000 and the routing via the next best alternative port costs €1,100, an increase in harbour dues of €50 per unit, i.e. an increase of total costs by 5%, is unlikely to lead to switching. If a €50 increase is higher than five to ten percent of the existing level of harbour dues, this would indicate that the next best alternative port is not to be considered being in the same relevant geographic market for the cargo flow considered. It follows that there are two important elements to this analysis. First, the importance of harbour dues and lease-related prices in the overall transport chain is of importance. Second, for each origin-destination pair the differences in generalised costs between alternative ports determine the likelihood of switching in response to an assumed price increase (captive business analysis).
Note that the fact that HbR can only control a small part of a bundle of complementary services also implies that its pricing power depends on the pricing of the terminal operator and other providers of complementary goods. By increasing competition between terminal providers, a port authority can induce lower prices and more room for its own pricing.
For technically inclined readers it is also worth pointing out that the combination of several providers of complementary goods leads to a double marginalisation effect in oligopoly markets. Several providers of complementary services add mark-ups to their services, which leads to higher overall prices than if firms were vertically integrated. The desire to reduce these multiple mark-ups and thereby become competitive is one rationale for the observed trend towards vertical integration in the transport industry.
27 Note that this is subject to the Cellophane fallacy caveat described before.
53
Report prepared for the NMa
Charle s
Rive r
Asso c iate s
2.5.3 SURVEY APPROACH
In order to complement the analysis above, we have designed survey questionnaires, which have been sent by the NMa to users and tenants of the port of Rotterdam (see Annex VII). Using survey techniques can be very helpful, in particular to complement other empirical evidence. However, one needs to be aware of the significant limitations of survey-based evidence for direct questions on competition. Strategic reporting of respondents may lead to biased answers. This can be exemplified by the SSNIP question, which asks whether respondents would switch volume away from Rotterdam in response to a lasting 10 percent increase in harbour dues charged by HbR (see enclosed questionnaires). Even ignoring the issues related to the cellophane fallacy discussed earlier, the bias of responses can go both ways:
• Strategic respondents may answer that they would not switch in order to indicate that price increases are possible and HbR has market power.
• Strategic respondents may also bias reporting to suggest that they would switch at the smallest price increase in order to indicate that they will not accept any price increase.
The fear of non-confidentiality may induce strategic responses. Further problems associated with survey techniques include a neglect of the pass-on dimension of price rises by suppliers in a vertical chain, straightforward forgetting of relevant issues, simple mistakes, and unintentional distortions. Respondents may also not fully understand their own preferences or – in particular since filling out questionnaires is not necessarily perceived as a principal activity – the person filling out the questionnaire may not have enough information to answer in detail. Moreover, prejudices may inform answers.
We conducted the survey despite these limitations, because we believe that it can still lead to valuable qualitative insights and input for the analyses pointed out above. In particular, we received more factual information on switching behaviour. In order to limit biased reporting, we have carefully chosen the order of questions and have asked for different types of evidence for similar issues.
2.5.4 REVEALED PREFERENCES
Neither HbR nor other port authorities have been able to provide us with examples of past pricing decisions that have induced port users to switch away from a particular port. The survey has, with one exception, confirmed this finding. According to our research there is no publicly available time-series data for harbour dues. Despite our acknowledgement of potentially important differences between actual behaviour and reported hypothetical reactions to changes in market conditions, we have therefore been forced to revert to the latter in the present study. Being well aware of the superiority of time-series data over questionnaires, however, we have taken considerable care in the drawing of our conclusions.
54
Report prepared for the NMa

Charle s
Rive r
Asso c iate s
2.6 Further relevant steps to assess market power
There is significant overlap in the analysis of the relevant markets and the analysis of market power. All conclusions regarding pricing power have immediate relevance for conclusions regarding market power. In addition, we now look at the conceptual issues related to barriers to entry, countervailing power of port customers, efficiencies and collusion.
2.6.1 BARRIERS TO ENTRY AND EXPANSION
There will be no new major maritime ports in Europe in the near future. However, existing ports expand their capacities and change their focus by investing in specific facilities. Thus, with regard to inter-port competition, entry relates more to capacity expansions and the change in focus than to the development of completely new sites (see appendix). We covered major known plans to expand in the relevant sections on different cargo types.
2.6.2 COUNTERVAILING POWER OF PORT CUSTOMERS
The port of Rotterdam has very different types of customers. Some customers may have relevant countervailing power because they contribute significant business to the port and have the ability to switch to other ports. We have investigated this issue.
2.6.3 EFFICIENCIES
Vertical integration of HbR, i.e. the joint provision of land, infrastructure and a variety of services at the port of Rotterdam, could lead to the risk of foreclosure. As a consequence of bundling of services and the resulting behavioural barriers to entry, customers could lose some of their countervailing power and entrants could be deterred. Thus, vertical integration could increase market power.
However, vertical integration could also lead to efficiency gains that may offset any increase in market power. In the market for maritime port services, the efficiency gains could result from economies of scale and scope and the incentive of the port operator to maximise revenue on all complementary services - which leads to an incentive not to overprice a single service. Another reason for integration can be demand from customers for one-stop shopping and integrated services.
Given the lack of vertical integration of the port of Rotterdam and in line with the findings of the preliminary study conducted by the NMa (see Annex IV), we currently do not envision further investigation into issues of vertical integration and efficiencies.
55
Report prepared for the NMa

Charle s
Rive r
Asso c iate s
2.6.4 COLLUSION
For the analysis of collusive oligopoly, three aspects are of particular significance:
1) Collusion represents a deviation from firms’ short-term profit-maximising strategy. Hence, given the behaviour of its rivals, each firm has an incentive to undercut its competitors.
2) From (1) it follows that collusion can only be maintained if the long-term profits from collusion for each firm are higher than the profits from deviating from the collusive price level, which would be followed by ‘punishment’ by the other firms.
3) The incentive to cheat on the other firms is larger if market conditions do not allow firms to observe if their competitors deviate from the collusive behaviour. In such non-transparent markets, collusion usually cannot be maintained.
While some port users suggested that that Rotterdam usually “moves first”, the analysis of collusion was not at the heart of this study.
2.6.5 SOURCES OF INFORMATION
In order to undertake the study we engaged in intensive communication with HbR (four meetings plus several telephone conversations). We furthermore conducted a number of interviews with port users (shipping lines, shipping agents for dry and liquid bulk), a competing port (Antwerp), the European Commission and academics at the University of Leuven (see Annex I for a list of interviews). We consulted various resources, including reports and data generated by our own research and those provided by HbR and the NMa (see Annex II for a list of articles, reports and studies used). A further important element of this study was the design and evaluation of a survey that was sent out to users and tenants of the port authority of Rotterdam (see next Chapter).
56
Report prepared for the NMa

3 Summary of the survey results
3.1 Survey background and methodology
One important element of our study was the design and evaluation of surveys that were sent out to the tenants and users of the port of Rotterdam. The addressees for the questionnaires were based on a customer database that we received from HbR. We added various freight forwarders that HbR does not have contractual relations with and which therefore are not part of the port authority’s database, but which nevertheless are users of the port and hence important for our study.
Questionnaires were sent out to 1,296 addresses in the Netherlands and 19 addresses abroad (mainly in Belgium and Germany). We left it up to the respondents to decide which of the surveys (or both) were relevant for them. Out of these 1,315 letters, 40 were returned to the sender (the NMa) by the Dutch mail because the address was no longer correct. In addition, 17 respondents sent blank questionnaires for both users and tenants back to the NMa, pointing out that the questions were not relevant for them or that the company addressed did no longer exist. Eight respondents did not fill out the tenants questionnaire, but sent it back in blank anyway. 16 respondents did the same with the user questionnaire. Note however that some respondents filled out one of the questionnaire – users or tenants respectively – but added the blank questionnaire which they did not see as relevant for themselves.
In our analysis of the survey responses, we considered 88 companies who filled out the tenants questionnaire and 58 companies who filled out the user questionnare. Some user respondents answered the questions for several cargo types, which means that we could distinguish up to 67 different responses for some cargo-specific questions. Thus, we evaluated 146 questionnaires in total.
For the user survey, many of the major customers of HbR answered our questions, often in detail and providing valuable qualitative insights. We received answers from the majority of the large oil companies and refineries located in the port, from two of the largest dry bulk terminal operators, one large container terminal operator, various container liners (including the leading ones in the world) and some major forwarding companies and agents. In addition to these major customers, we also received responses from smaller companies, which improves the representativeness of our analysis. Our respondents covered all cargo types.
Generally, the responses to our tenant survey were also of high quality. Most of the large terminal operators in the port of Rotterdam participated in the survey and provided valuable insights. However, we also received answers from smaller tenants, which should make our survey more representative. In terms of leased land, the total area leased in the port of
Report prepared for the NMa

Charle s
Rive r
Asso c iate s
Rotterdam by the respondents to the CRA tenant survey was 2,851 ha, which corresponds to about 60% of the total area leased out by the port of Rotterdam in 2003.28
The survey is an important input for our analysis. Nevertheless, a number of qualifying remarks are due.
• Responses could be biased to the extent that especially those port users and tenants had an incentive to participate in the survey that have concerns or strong feelings regarding the market position of the port of Rotterdam.
• There is the risk of strategic reporting of respondents. One example is the SSNIP question, asking whether respondents would switch volume away from Rotterdam if HbR increased harbour dues permanently by 10%. On the one hand, strategic respondents could answer that they would not switch with the intention of indicating that price increases are possible and HbR has market power. On the other hand, strategic respondents could answer that they would switch at the smallest price increase with the intention of indicating that they will not accept any price increase.
• In general, all surveys are vulnerable to problems such as forgetting, simple mistakes, and unintentional distortions. Respondents may not fully understand their own preferences, the person filling out the questionnaire may not have enough information to answer in detail or rely on prejudices when giving his answers. For respondents who are not the end users but operate at some point in the vertical chain (e.g. terminal operators), one issue that might also arise is that respondents might not understand the actual consequences of symmetric price rises for all rivals alike in the setting of a vertical chain with pass-on possibilities.
When designing and evaluating the questionnaires, we addressed these issues in the following way:
• We carried out consistency checks. Where answers were inconsistent to the extent that they would risk the meaninfulness of our survey results, we followed up with the respondents to clarify their responses or excluded the answers from our evaluation.
• Besides asking hypothetical questions, e.g. regarding switching between ports, we also asked for evidence on actual switching between ports in the past.
• Finally, we do not rely too much on the quantitative results of our survey, but more on the qualitative results. For example, we put less emphasis on the survey results to estimate the total captive throughput volume in Rotterdam or how much volume would be lost in response to a price increase by HbR. However, we use the responses for ranking purposes (e.g. the relative captiveness of the different cargo types) and to gain insights into the ports that users of Rotterdam would switch to.
In the following sections, we describe our evaluation approach for the surveys and present the main results. Given the different target groups, we distinguish between the user and the tenant survey.
28 4,722 ha according to HbR Annual Report 2003, p. 20.
58
Report prepared for the NMa

Charle s
Rive r
Asso c iate s
3.2 User survey – evaluation and main results
3.2.1 OVERVIEW
In total, we received 93 responses to our user survey. 33 responses were completely blank and therefore not considered in the evaluation. In addition, we excluded two of the remaining surveys from the evalution due to gross inconsistencies and suspected misunderstandings (see the discussion of caveats in the previous section). These left out answers do not introduce a bias in the analysis, as the elimination on the grounds of unreliability was not aselect. In all, this left us with a total of 58 companies who filled out the user survey and where included in the analysis.
One aim of our survey analysis was to be able to distinguish between the different cargo types since alternative ports, captiveness etc. are likely to vary across the cargoes being shipped through the port of Rotterdam. In reality, many port users handle more than one cargo type, e.g. both iron ore and coal or both mineral oil and chemicals. Although we explicitly asked them to do so, none of the respondents filled out one survey per cargo type. However, we followed up with all respondents who answered the questions for more than one cargo type, clarifying whether their responses were valid for all cargo types they dealt with and whether they could provide information about their shipments through Rotterdam in 2003 per cargo type. In general, respondents confirmed that their responses applied to all cargo types represented by them. Where companies provided us with the split of throughput between the different cargo types, we counted the different company/cargo pairs (we called them “company ID”) as a separate survey. This means that although we received responses from 58 companies, our survey evaluation is based on a total of 67 company ID’s. Note that there were some companies for which we did not receive the exact split of throughput volume. We consider those respondents for the results of each cargo type they indicated in the survey. Hence, the sum of counted answers when adding all answers for all cargo types is larger than 67 for most questions.
In the following, we report the main results of the user survey. Note that, as explained above, we distinguishe 67 company ID’s in our analysis, i.e. unique company/cargo type pairs. In the following, we will refer to these company ID’s as “respondents”. Note that this interpretation of “respondents” is not identical with the number of companies who actually answered the questionnaire (58). Out of the total number of 67 respondents, not all answered all questions. Hence, the number of respondents for a particular question varies (we report it in this section as “n”).
3.2.2 CHOICE OF PORT
About 37% of the respondents to the CRA questionnaire (n=65) are responsible for the decision which port to choose for a particular shipment. About 63% are not personally
59
Report prepared for the NMa

Charle s
Rive r
Asso c iate s
responsible for port choice. We decided to still include the latter group in our analysis in order to benefit from their industry expertise and experience.
64 respondents provided information about the total volume of shipments through Rotterdam in 2003 that their company was involved in. In total, the throughput volume shipped or handled by the respondents to our survey amounted to almost 367 million tons. Note that total volume in tons reported by the respondents to our survey is higher than the actual throughput volume in the port of Rotterdam in 2003 (328 million tons). This can be explained by doublecounting due to the fact that our respondents included agents, shippers, cargo handlers, and even end users. Hence, some of them deal with the same cargo, but at different points in the transport chain.
On average, respondents estimated that about 39% of their shipments through Rotterdam in 2003 are captive business, i.e. the volume could not be moved to other ports even if e.g. harbour dues in Rotterdam were increased permanently by 10% while harbour dues in all other ports stayed at their current level. As could be expected, the share of captive volume reported varied significantly between cargo types, ranging from 7% for roll-on/roll-off to 78% for mineral oil products. For all cargo types, respondents indicated that specific investments in facilities at or near the port were an important reason for the captiveness of the volume. Dry bulk port users attributed even more importance to this factor than other cargo types such as containers. The respondents to this question who are active in the mineral oil segment (4) even mentioned infrastructure investments as the only reason for captive business. For container users, generalised route costs are a very important reason for captive volume in Rotterdam. They attributed more weight to this factor than any other cargo type. On average, long-term contracts were also seen as important for all cargo types except mineral oil products. Other reasons for captive business mentioned by our respondents included congestion and lack of free capacity in other ports, the strategic location of Rotterdam, proximity to inland destinations and demands of cargo owners to ship volume through Rotterdam instead of other ports.
The CRA survey asked respondents through which ports they shipped cargo in 2003. In general, all ports in the HLH range were used by some of the 54 respondents who answered this question. However, for all cargo types, Rotterdam was used by more respondents than any other port. 94% of all respondents to this question used Rotterdam in 2003. The next largest ports were Antwerp with 56% and Amsterdam with 37%. However, also more distant ports such as Hamburg were used by a significant share of respondents (35%).
After asking for the actual use of the different ports in 2003, we also asked respondents which ports they see as alternatives for the port of Rotterdam for the different cargo types and how they assess their quality compared to Rotterdam. A detailed analysis of the responses to this question will be presented in the chapters on the different cargo types later in this report. However, the general conclusion is that the three ports closest to Rotterdam – Antwerp, Amsterdam and Vlissingen – were mentioned most often as substitutes for the port of Rotterdam. 81%, 67% and 51% of all respondents said that they saw these ports as
60
Report prepared for the NMa

Charle s
Rive r
Asso c iate s
alternatives for Rotterdam respectively. The quality of the ports as a substitute for Rotterdam was on average seen as relatively good, ranging from 0.4 (Amsterdam) to 0.9 (Antwerp) on a scale from –2 (very poor quality as a substitute) to +2 (very good quality as a substitute). Hamburg was seen by 44% as a possible substitute, with an average quality of 1.
Given that Antwerp is the largest port located close to Rotterdam, we asked respondents to evaluate the quality in Rotterdam compared to the quality in Antwerp. On average, our respondents believe that the quality (nautical, hinterland, terminal, dues, network effects) in Rotterdam is good compared to Antwerp (average of 0.1 to 0.8 for various quality factors on a scale from –2 (very poor) to +2 (very good)).29 The two areas were Rotterdam achieved the lowest score were costs. For both the quality of harbour dues and stevedoring dues, Rotterdam achieved on average a negative score compared to Antwerp (-0.1).
Turning from port to hinterland considerations, we asked respondents which port they would use for a cargo shipment from or to a specific hinterland destination. In particular, we offered the origins/destinations of Paris, Strasbourg, Gent, Bochum, Frankfurt/Main, Stuttgart, Munich and Prague. Across all cargo types, Rotterdam was the port chosen most often for shipments to or from the destinations and origins. Exceptions were Paris, where Le Havre was chosen as the main port, reflecting its position as a truly French port and shipments to and from Gent, where the port of Gent was chosen most often. For those origins and destinations where respondents chose Rotterdam most often, Antwerp was generally chosen by the next highest number of respondents. Exceptions were shipments to Hannover and Prague, where the second highest number of respondents chose one of the German ports (Hamburg and Bremen/Bremerhaven). However, interestingly Rotterdam was chosen by more respondents for shipments to Hannover than Bremen/Bremerhaven and Hamburg respectively.
3.2.3 SWITCHING
As discussed in Section 2.5.3, revealed preferences are arguably more reliable than stated preferences when it comes to switching between port. Hence, we asked respondents whether they had ever reduced (or heard of a reduction of) volume at a port due to an increase in harbur dues, an increase in port costs, a capacity expansion at other ports or other reasons. Only 15% of all respondents to this question reported a reduction in volume at a port due to an increase in harbour dues in the past. However, following up on these cases, we could only confirm one situation in which volume had really been reduced in a response to an increase in harbour dues. In all other cases, changes in total port costs, logistical considerations or other
29 Quality factors considered were “Proximity to origin and destination in terms of sailing time and nautical
access”, “Cost and time of hinterland connection to origin or ultimate destination”, “Frequency of hinterland connections”, “Quality/ facilities of terminal operator”, “Quality of facilities for further processing or storage at or near the port”, “Draft restrictions”, ”Harbour dues”, “Stevedoring dues”, “Benefits of bundling cargo at one port (network effects)”, “Benefits of splitting cargo between ports” and “Other”.
61
Report prepared for the NMa

Charle s
Rive r
Asso c iate s
reasons were ultimately responsible for the decision to reduce volume at a port. The one case of a volume reduction due to an increase in harbour dues involved an agribulk agency moving volume from Rotterdam to Amsterdam in 2001. While a reduction in volume due to a change in harbour dues was mentioned only by a minority of respondents, 49% reported a reduction in volume in response to an increase on total call costs at a port and 30% a volume reduction due to a capacity expansion at another port. Other reasons for switching that respondents mentioned included terminal handling charges, generally better conditions, a decision made by cargo owners/end users, a capacity shortfall or congestion at a port, more storage facilities at another port, the general service level and the relation of service and price.
Despite the very limited amount of actual switching due to a change in harbour dues that respondents reported, 75% of them said that they would expect volume to be shifted away from Rotterdam if HbR increased harbour dues permanently by 10% and harbour dues at all other ports stayed the same. For a hypothetical 10% increase in total port related costs – defined as port call costs plus cargo handling costs – in Rotterdam assuming no price change in other port, 83% of all respondents expected that volume would move from Rotterdam to other ports. The average volume that respondents would expect to shift away from Rotterdam in response to such an increase in total port related costs was 46% for all cargo types. Note however that this share varied significantly across the different cargo types, ranging from 8% for crude oil to 73% for roll-on/roll-off. Table 10 shows that – based on our survey responses – Antwerp would benefit most from an increase in total port related costs in Rotterdam by 10%. Out of the volume that respondents would expect to shift away from Rotterdam, almost half (about 48%) is expected to be moved to Antwerp on average. Amsterdam would be the second port, with a share of 20%. All other ports would receive only small shares of volume.
62
Report prepared for the NMa
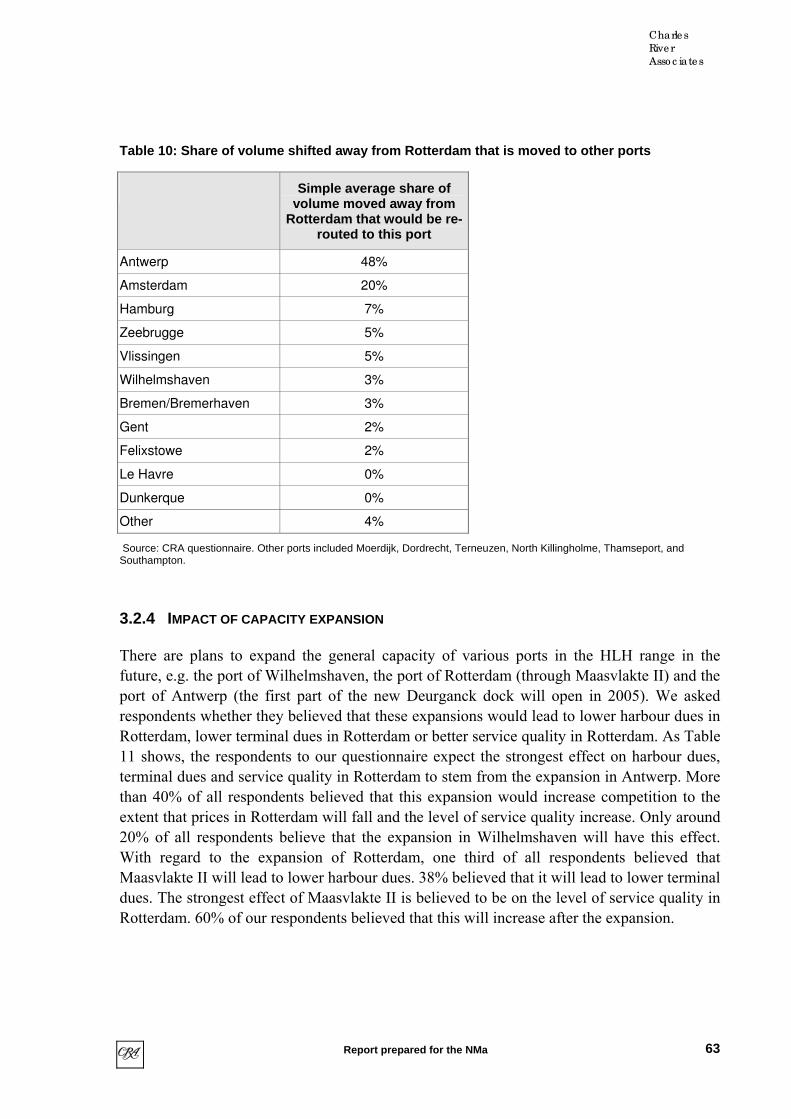
Charle s
Rive r
Asso c iate s
Table 10: Share of volume shifted away from Rotterdam that is moved to other ports
Simple average share of volume moved away from
Rotterdam that would be re-routed to this port
Antwerp 48%
Amsterdam 20%
Hamburg 7%
Zeebrugge 5%
Vlissingen 5%
Wilhelmshaven 3%
Bremen/Bremerhaven 3%
Gent 2%
Felixstowe 2%
Le Havre 0%
Dunkerque 0%
Other 4%
Source: CRA questionnaire. Other ports included Moerdijk, Dordrecht, Terneuzen, North Killingholme, Thamseport, and Southampton.
3.2.4 IMPACT OF CAPACITY EXPANSION
There are plans to expand the general capacity of various ports in the HLH range in the future, e.g. the port of Wilhelmshaven, the port of Rotterdam (through Maasvlakte II) and the port of Antwerp (the first part of the new Deurganck dock will open in 2005). We asked respondents whether they believed that these expansions would lead to lower harbour dues in Rotterdam, lower terminal dues in Rotterdam or better service quality in Rotterdam. As Table 11 shows, the respondents to our questionnaire expect the strongest effect on harbour dues, terminal dues and service quality in Rotterdam to stem from the expansion in Antwerp. More than 40% of all respondents believed that this expansion would increase competition to the extent that prices in Rotterdam will fall and the level of service quality increase. Only around 20% of all respondents believe that the expansion in Wilhelmshaven will have this effect. With regard to the expansion of Rotterdam, one third of all respondents believed that Maasvlakte II will lead to lower harbour dues. 38% believed that it will lead to lower terminal dues. The strongest effect of Maasvlakte II is believed to be on the level of service quality in Rotterdam. 60% of our respondents believed that this will increase after the expansion.
63
Report prepared for the NMa

Charle s
Rive r
Asso c iate s
Table 11: Expected effect of capacity expansions in various ports on pricing and quality in the port of Rotterdam
Share of respondents answering “yes”
Will the expansion of Wilhelmshaven lead to…
a. Lower harbour dues in Rotterdam? 18%
b. Lower terminal dues in Rotterdam? 18%
c. Better quality of services in Rotterdam? 23%
Will the expansion of Rotterdam lead to…
a. Lower harbour dues in Rotterdam? 33%
b. Lower terminal dues in Rotterdam? 38%
c. Better quality of services in Rotterdam? 60%
Will the expansion of Antwerp lead to…
a. Lower harbour dues in Rotterdam? 45%
b. Lower terminal dues in Rotterdam? 45%
c. Better quality of services in Rotterdam? 41%
Source: CRA questionnaire.
For containers, the recent expansion of terminal capacity at the port of Amsterdam provides an interesting case study for the effect of port expansion on competition and for the factors important for the choice of a port. The port of Amsterdam offers a new container terminal (Paragon terminal) where both harbour dues and stevedoring costs are about half of the level in Rotterdam. Still, the terminal has been unsuccessful in attracting significant container volume. We asked respondents what they believed are the reasons for this “failure” and to distribute 100 points between four factors: “Level of connections to the hinterland”, “Distance to hinterland locations”, “Seaside access” and “Other reason”. On average, respondents saw hinterland connections as the most important factor (33 points). Distance to hinterland locations received 14 points and seaside access 25. Other factors mentioned included a lack of connections with other main ports in the world, no infrastructure (hard and software) for containers, the fact that “the market” is in Rotterdam, and investments made in infrastructure in Rotterdam. One respondent said that his company was not willing to take the “risk of losing capacity in Rotterdam in case Amsterdam does not work and we want to return to Rotterdam”.
3.2.5 PRICING OF PORTS
According to our survey, 35% of the respondents negotiate harbour dues with HbR on average. Evaluating the answers per cargo type shows that there is a lot of variation. For liquid bulk, none of our respondents indicated that they negotiate harbour dues. For containers, the share was 69% and for roll-on/roll-off even 75%. For dry bulk, the share of
64
Report prepared for the NMa
Charle s
Rive r
Asso c iate s
respondents negotiating harbour dues with the port authority ranged from 20% for iron ore & scrap and coal to 67% for agribulk.
With regard to the annual consultation rounds that HbR holds with port users before setting the new harbour dues, about 47% of all respondents do not think that these rounds have an effect on the ultimate pricing decision of the port authority. 53% believe the contrary. Reasons provided by those respondents indicating that the consultation rounds did not influence the pricing of HbR included “arrogance of HbR (and formerly ignorance of the municipality”, and the feeling that pricing decisions are usually already taken before the consultation rounds take place. On the other hand, one respondent who believes that the consultation rounds influences the decision of HbR reported that in the past, these rounds were successful for feeder vessels and ferry operators.
In the following question, we asked users – if they had knowledge about harbour dues in Rotterdam and at other ports – to specify at which ports in the Hamburg-Le Havre range harbour dues are generally lower than at the port of Rotterdam. However, after receiving the responses, we realised that the question was formulated in a misleading way. In particular, we asked respondents to specify at which ports harbour dues are generally lower than at the port of Rotterdam. However, the table in which respondents where asked to tick their answers said “higher in Rotterdam” and “equal or lower in Rotterdam”, i.e. the “than” was missing, which reversed the meaning of the question. Reviewing the responses and the information we received about the level of harbour dues in reality showed significant discrepancies. Also, the fact that many respondents who “harbour dues are equal or lower in Rotterdam” indicated reasons for a price premium in Rotterdam compared to other ports in the following question indicates that they actually meant “harbour dues are equal or lower than in Rotterdam”. Given these problems, we decided to exclude this question from our survey evaluation and not consider it in our analysis.
As already mentioned, the following question asked respondents – if they believed that harbour dues in Rotterdam were higher than in other ports – what they believed were the reasons for this premium. Possible answers included “better services at Rotterdam”, ”better access to Rotterdam”, “better hinterland connections in Rotterdam” and “other reason(s)”. Respondents could indicate whether they believed the respective factor was important or not (i.e. yes or no). Out of all respondents who answered this question, 60% believed that better services in Rotterdam explained the price premium, 77% thought that better access to Rotterdam was important, and 73% answered that price premiums could be explained by better hinterland connections in Rotterdam. Other reasons mentioned included too high overhead costs at the port of Rotterdam, the fact that HbR does not compete on prices, and the fact that a substantial part of the proceeds of the port authority was given to the municipality in the past. It was also suggested that crude oil tankers were used as “cash cows”, that the port of Rotterdam was a monopoly and there was no transparent price calculation method and political conceit.
65
Report prepared for the NMa

Charle s
Rive r
Asso c iate s
37% of all respondents who answered the respective question believed that there is a traditional sequencing in the price setting of harbour dues in the sense that one port starts and the others follow. Out of the 14 respondents who indicated who they saw as the port that would usually go first, 12 mentioned the port of Rotterdam. One said that it was either Antwerp or Rotterdam but in the past mainly Rotterdam. One respondent (other liquid bulk) mentioned the UK ports without any further specification.
Almost 90% of all respondents said that they perceived price differences between harbour dues at different ports to be relatively stable. Still, 37 respondents, representing 70% of all respondents for the respective question, indicated that they knew of examples of ports trying to lure customers and their cargo volume away from other ports. Rotterdam was mentioned by four respondents in this context, Amsterdam by 14 (mainly in the context of the new Ceres Paragon terminal mentioned earlier). Antwerp was mentioned eleven times as trying to lure customers away from other ports and Hamburg seven times.
3.2.6 PERFORMANCE AND COMPETITIVENESS
In order to gain information about how port users think about the performance and competitiveness of the port authority of Rotterdam, we asked them to indicate which changes, compared to the situation today, they would expect as a result of the corporatisation of the Rotterdam port authority and which changes they would expect if – hypothetically – the port authority was to be fully privatised, i.e. came under full private ownership. Table 12 shows the responses to this question.
Table 12: Performance and competitiveness – effect of corporatisation and privatisation (user survey)
Corporatisation of the port authority Full privatisation of the port authority
Do you expect an effect on…
a. Pricing? b. Invest-ment?
c. Service quality?
a. Pricing? b. Invest-ment?
c. Service quality?
Share of “No, I do not expect an effect”
52% 43% 45% 13% 29% 29%
Share of “Yes, I expect an increase”
25% 54% 42% 42% 47% 55%
Share of “Yes, I expect a reduction”
23% 4% 13% 45% 24% 16%
Total answered 56 56 55 55 55 55
Source: CRA questionnaire.
66
Report prepared for the NMa
Charle s
Rive r
Asso c iate s
For both corporatisation and full privatisation, expectations of port users – based on the survey responses – are relatively mixed. In particular, almost the same share of respondents believed that prices would increase after the change as the share of respondents believing that prices would fall. This is true for both coporatisation and privatisation, although the share of respondents who does not expect any effect on pricing is larger for the former than for the latter. With regard to investment, the majority of respondents believed that both corporatisation and privatisation would lead to higher investments. However, 24% of the respondents also expected that – after full privatisation – investment would drop. This compares to only 4% of the respondents who believed the same to occur after corporatisation. Finally, a significant share of respondents, 42% and 54%, expected that the quality of services would increase after corporatisation and privatisation respectively. Interestingly, more respondents believe that this will occur after full privatisation than after corporatisaton In summary, there seem to be mixed expectations regarding the development of prices after corporatisation and privatisation. The majority of respondents expects investment to increase in both cases and service quality is expected to increase too.
To conclude the block of questions on competitiveness and performance, we asked respondents whether they had ever had any negative experience with the port authority or one of its daughter companies (e.g. terminal operators) that they would consider as “anti-competitive”, i.e. not normal competitive practice and possibly an attempt of HbR to abuse potential market power? We received only a limited amount of information from this question. Although technically speaking 38 respondents answered it, the overwhelming majority did so by saying “no”. However, most of the oil companies answering our survey referred to the pending court case on allegedly discriminatory pricing by HbR vis-à-vis the oil sector.
3.2.7 QUALITATIVE QUESTIONS
Many respondents provided details on the following qualitative questions asked in the survey:
• Please describe the nature of specific investments in port infrastructure and suprastructure by your company. Describe your contractual relationships with the port (length of time etc.). Would you be able to move the facilities to another port?
• If available, please provide information on the total cost of calling at the port of Rotterdam (disbursement accounts, split into: Harbour dues, cargo handling, other) and at other ports in the Hamburg-Le Havre range.
• If you have detailed information on the hinterland transport of the cargo shipped by you (origin and destination, transport modes), please provide this information for the ports you call at.
• Please explain the decision-making process of at which ports to call, the sequencing of calls (if applicable, e.g. for liner business) and the key factors considered. How often do you revise these decisions?
67
Report prepared for the NMa

Charle s
Rive r
Asso c iate s
• What do you see as the most important trends in your business that will affect the pricing and the service quality at the port of Rotterdam?
• Are there any concerns regarding the competitiveness between ports or of service providers within ports that you wish to bring to our attention?
The information we received from answers to these questions is used throughout the report and the different chapters.
3.3 Tenants survey – evaluation and main results
3.3.1 OVERVIEW
In total, we received 114 responses to our tenant survey. 25 responses were completely blank and therefore not considered in the evaluation. In addition, we excluded one of the remaining surveys from the evalution due to inconsistencies and lack of substantial information contained in the answers (see the discussion of caveats in the previous section). This left us with a total of 88 companies who filled out the tenant survey and where included in the analysis.
Like for the user survey, we tried to distinguish between tenants involved in the shipping and handling of different cargo types since alternative ports, captiveness etc. are likely to vary across the cargoes tenants deal with. In reality, port tenants often handle more than one cargo type, e.g. both iron ore and coal or both mineral oil and chemicals. Although we explicitly asked them to do so, none of the respondents filled out one survey per cargo type. However, this problem is less severe for the tenants than for the port users, where we followed up with all respondents who answered the questions for more than one cargo type, clarifying whether their responses were valid for all cargo types they dealt with. This means that for the tenant survey, the number of “company ID’s”, i.e. company/cargo type pairs is equal to the number of companies answering the survey, 88. Note however that where we distinguished between different cargo types, we considered all respondents for the results of each cargo type they indicated in the survey. Hence, the sum of counted answers when adding all answers for all cargo types is larger than 88 for most questions.
In the following, we report the main results of the tenant survey. Note that out of the 88 respondents, not all answered all questions. Hence, the number of respondents for a particular question varies (we report it in this section as “n”).
3.3.2 CHOICE OF LOCATION
The survey asked tenants which port or non-port locations would represent a possible substitute for their location at the port of Rotterdam. Interstingly, only very few respondents
68
Report prepared for the NMa

Charle s
Rive r
Asso c iate s
indicated that a non-port location would be suitable to them, which means that most of the respondents to our survey can be considered as port bound. Antwerp (55%) and Vlissingen (40%) received the highest share of respondents who said that those ports are possible substitutes for the location of their company. In terms of quality as a substitute compared to Rotterdam, Antwerp was rated on average with 1 (on a scale from –2 (very poor) to +2 (very good)) and Vlissingen with 0. Amsterdam represents an alternative for one third of all respondents who answered that question and received an average quality score of 0. However, other more distant ports were also seen as alternatives: the German ports received between 15% (Wilhelmshaven, average quality 0) and 24% (Hamburg, average quality 0). Dunkerque and Felixstowe seem to represent an alternative location only for a very small share of respondents, 4% and 6% respectively.
Based on our survey, Rotterdam does not have a significant quality advantage compared to the quality of respodents’ second best location alternative. For most quality factors tested in the survey (in particular for lease conditions, provision of suitable infrastructure, proximity to customers, synergies with other companies, quality of labour and other factors such as hinterland connections and quay dues), Rotterdam achieved on average a quality score of 0 compared to the quality at the next best location (on a scale from –2 (very poor) to +2 (very good)). The only factor where Rotterdam stood out was sea access (average score of 1), which confirms our general findings in this study.
57% of all respondents to the tenant survey feel that their company is locked in in the port of Rotterdam, i.e. it could not easily relocate even after termination of the lease contract. The by far most important reason for being locked in according to the survey results are specific investments made in facilities at or near the port. This factor received on average 49 points out of 100 points that respondents were asked to distributed between five different factors: “specific investments made in facilities at or near the port”, “long-term contracts with port-bound customers, e.g. ship owners” (received 10 points), “long-term contracts with other port tenants, e.g. terminal operators or storage companies” (6 points), “no other location offers the infrastructure necessary for our business” (16 points) and “other reason(s)” (19 points). Other reasons mentioned by respondents included, besides mentioning infrastructure investments and long-term contracts again, the strategic advantage of being located at a port, lease conditions and staff considerations.
While 57% of all respondents indicated to feel locked in in the port of Rotterdam, 32% of all respondents to that specific question said that they would re-locate if HbR increased its lease prices permanently by 10% and prices at all other locations stayed the same.
3.3.3 INFORMATION ABOUT THE LEASE RELATIONSHIP WITH THE PORT
The total area in the port of Rotterdam leased in 2003 by the respondents to the CRA survey who indicated the size of their sites amounted to 2,859 ha, representing about 60% of the total
69
Report prepared for the NMa
Charle s
Rive r
Asso c iate s
area leased out to. On average, respondents signed their first lease contract in 1966 and their lease will expire in 2027.
Total throughput volume handled by the respondents to our tenant survey was 489 million tons in 2003. This is higher than total throughput in Rotterdam in 2003 (328 million tons) due to doublecounting of the same volume handled by shippers, terminal operators and end users. On average, tenant respondents estimated that 57% of the cargo volume handled by them is captive volume for the port of Rotterdam, i.e. volume that could not be switched to other ports within a year even if e.g. harbour dues (zeehavengeld) in Rotterdam were increased permanently by 10%. The most important reason for captivity according to our survey results are specific investments made in facilities at or near the port. This reasoning is in line with the results from our user survey, where respondents also gave specific investments as the most important reason for captive volume. However, on average respondents to the user survey gave a lower share of captive volume than the tenants, only 39%.
Total cargo handling capacity of the respondents to our tenants survey was about 232 million tons in 2003. This question only related to transport, cargo handling and forwarding and shipping companies.
3.3.4 LEASE PRICES
As explained in the section on lease price setting by HbR (Section 5.5), HbR published recommended lease tariffs, but the final lease price depends on negotiations between the port and tenants. 15% of all respondents for this question indicated that they received a discount on the official lease prices published by HbR when they signed their contracts. Only four respondents provided information on the discounts they received, which ranged from 20 to 32%. One respondent received a one-time discount phased from 100 to 0%. Only 5% of all respondents to that question had received costless services from HbR when signing their lease contracts. These services are described in more detail in Section 1.7.
When being asked about the level of lease prices in the port of Rotterdam compared to lease prices at their next best alternative location, 17% of all respondents to that question indicated that they believed that lease prices were higher in the port of Rotterdam. 73% answered that they did not have any knowledge about lease prices at other locations. In general, this result confirms our finding that lease prices in the port of Rotterdam are at the upper end of the spectrum compared to other ports (see Section 5.8). Most respondents (83%) reported that they believed better sea access in Rotterdam was one reason for the price differential between the port of Rotterdam and other ports. Other important reasons were better infrastructure at Rotterdam (58%) and better hinterland connections (50%, multiple answers were possible). Better service level at the port of Rotterdam was seen by only 25% of all respondents to this question as an explanantion for the price differential, which supports our previous findings that the pricing power of HbR stems mainly from the port’s locational advantage and not from better quality offered by the port authority compared to other port authorities.
70
Report prepared for the NMa
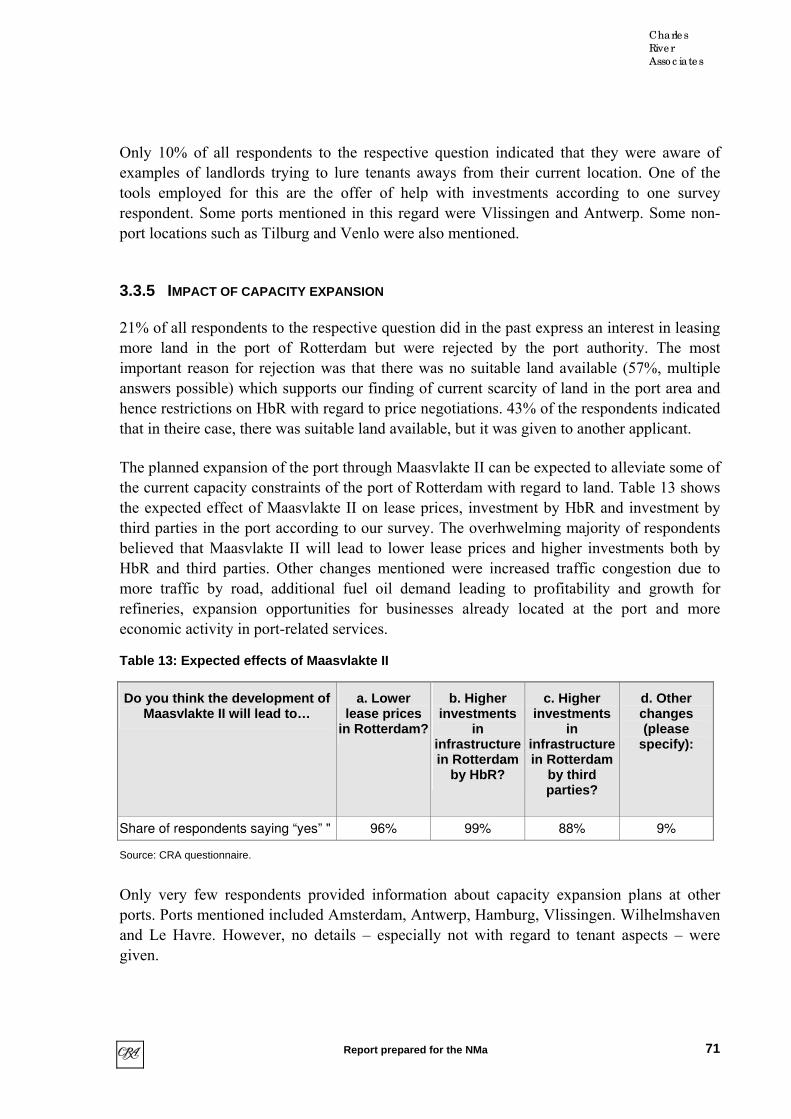
Charle s
Rive r
Asso c iate s
Only 10% of all respondents to the respective question indicated that they were aware of examples of landlords trying to lure tenants aways from their current location. One of the tools employed for this are the offer of help with investments according to one survey respondent. Some ports mentioned in this regard were Vlissingen and Antwerp. Some non-port locations such as Tilburg and Venlo were also mentioned.
3.3.5 IMPACT OF CAPACITY EXPANSION
21% of all respondents to the respective question did in the past express an interest in leasing more land in the port of Rotterdam but were rejected by the port authority. The most important reason for rejection was that there was no suitable land available (57%, multiple answers possible) which supports our finding of current scarcity of land in the port area and hence restrictions on HbR with regard to price negotiations. 43% of the respondents indicated that in theire case, there was suitable land available, but it was given to another applicant.
The planned expansion of the port through Maasvlakte II can be expected to alleviate some of the current capacity constraints of the port of Rotterdam with regard to land. Table 13 shows the expected effect of Maasvlakte II on lease prices, investment by HbR and investment by third parties in the port according to our survey. The overhwelming majority of respondents believed that Maasvlakte II will lead to lower lease prices and higher investments both by HbR and third parties. Other changes mentioned were increased traffic congestion due to more traffic by road, additional fuel oil demand leading to profitability and growth for refineries, expansion opportunities for businesses already located at the port and more economic activity in port-related services.
Table 13: Expected effects of Maasvlakte II
Do you think the development of Maasvlakte II will lead to…
a. Lower lease prices
in Rotterdam?
b. Higher investments
in infrastructure in Rotterdam
by HbR?
c. Higher investments
in infrastructure in Rotterdam
by third parties?
d. Other changes (please
specify):
Share of respondents saying “yes” " 96% 99% 88% 9%
Source: CRA questionnaire.
Only very few respondents provided information about capacity expansion plans at other ports. Ports mentioned included Amsterdam, Antwerp, Hamburg, Vlissingen. Wilhelmshaven and Le Havre. However, no details – especially not with regard to tenant aspects – were given.
71
Report prepared for the NMa

Charle s
Rive r
Asso c iate s
3.3.6 PERFORMANCE AND COMPETITIVENESS
Like the user survey, the tenant questionnaire asked respondents to indicate which changes, compared to the situation today, they would expect as a result of the corporatisation of the Rotterdam port authority and which changes they would expect if – hypothetically – the port authority was to be fully privatised, i.e. came under full private ownership. Table 14 shows the responses to this question.
Table 14: Performance and competitiveness – effect of corporatisation and privatisation (tenant survey)
Corporatisation of the port authority
Full privatization of the port authority
Do you expect an effect on…
a. Pricing of land?
b. Pricing
of harbour dues?
c. Invest-ment?
d. Service quality?
a. Pricing of land?
b. Pricing
of harbour dues?
c. Invest-ment?
d. Service quality?
Share of “No, I do not expect an effect”
49% 43% 40% 54% 14% 24% 33% 41%
Share of “Yes, I expect an increase”
32% 30% 52% 37% 64% 47% 43% 48%
Share of “Yes, I expect a reduction”
19% 28% 8% 9% 22% 29% 23% 11%
Totals may not add up to 100 due to rounding. Source: CRA questionnaire.
Compared to the user survey, the respondents to our tenants survey seem to be more pessimistic with regard to the effect of corporatisation and privatisation on the pricing of HbR (compare Section 3). In particular, 32% of the respondents expect lease prices to increase after corporatisation and 64% after privatisation. For the pricing of harbour dues, the shares are 30% and 47% respectively. These results indicate that tenants seem to expect HbR to have some pricing power, which it currently does not exercise fully given that they believe there is still room for price increases. However, the majority of respondents also believed that investments would increase after corporatisation and privatisation (52% and 43% respectively). With regard to the level of service quality, 54% believed that this would not change after corporatisation while 48% expect it to increase after a hypothetical full privatisation.
3.3.7 QUALITATIVE SURVEY
Like in the user survey, we included a list of qualitative questions in the tenants survey. Many respondents provided details on the following qualitative questions:
72
Report prepared for the NMa

Charle s
Rive r
Asso c iate s
• Please describe the nature of specific investments in port infrastructure and suprastructure that you have made. Describe the contractual relationships with the port (length of time etc.). Would you be able to move the facilities to another port?
• What do you see as the main strengths and weaknesses of the port of Rotterdam as a landlord?
• Are there any concerns regarding the competitiveness between ports or between service providers within ports that you wish to bring to our attention?
• Suppose you would start your company tomorrow. In which port would you locate your company? Which port-characteristics are essential for this choice? Do other ports constitute real alternatives for the port of first choice? If they do: which ports are these? If they do not: why are other ports not suitable?
The information we received from answers to these questions is used throughout the report and the different chapters. We did not analyse them separately.
3.4 Survey-based evidence on switching – the SSNIP test
As explained above, our user survey included questions concerning the effect of an increase in harbour dues or an increase in total port related costs (i.e. all port call costs plus cargo handling costs) on the cargo volume shipped through the port. The estimates of respondents regarding the volume that the port of Rotterdam would lose after such a price increase can be used demarkate the relevant market following the SSNIP test methodology. Note that due to the relatively small number of respondents per cargo type and due to the uncertainties related with survey data (strategic responses and other biases, see Section 3.1), the result of our SSNIP test is only indicative. Hence, we do not rely on it to define the relevant markets and to assess whether HbR has pricing power or not.
3.4.1 THE SSNIP TEST
The SSNIP test (“Small but Significant and Nontransitory Increase in Price”), also referred to as the “5% test” or the “hypothetical monopolist test,” is followed by most competition authorities in the definition of relevant markets in the antitrust context The test seeks to demarkate the relevant market of a particular product by following the logic and behaviour of a hypothetical monopolist. The relevant market is the smallest collection of products (regions) such that the hypothetical monopolist could increase its profits by imposing a small but significant nontransitory increase in price of all the goods in the thus defined market, assuming the terms of sale of all other products are held constant.
In practice, one considers the products or services of the firm under consideration asking whether a hypothetical profit-maximising monopolist with control over all of these products would be able to profitably raise the price permanently by 5 to 10 percent. If the answer is
73
Report prepared for the NMa

Charle s
Rive r
Asso c iate s
yes, then this is the relevant market. If the answer is no, other products (regions) also provide significant competitive constraints. Thus, in a next step further products (and/or regions) are added and it is again asked whether the hypothetical monopolist would be able to raise prices by 5 to 10 percent. If yes, this is the relevant market. As a guiding principle, the relevant market can be thought of as the smallest market that is “worth monopolising.”
3.4.2 APPLYING THE SSNIP TEST METHODOLOGY TO THE SURVEY DATA
In our survey, we asked respondents which share of the volume that they currently ship through Rotterdam they would expect to re-route to other ports in case of a permanent increase in total port related costs (i.e. all port call costs and cargo handling costs) in Rotterdam while cost in all other ports remained the same.30 Clearly, these data indicate how much cargo volume would be shifted from Rotterdam to other ports in the case of an increase in harbour dues. Note however that harbour dues only account for a (usually small share) of total port related costs. This needs to be taken into account in the analysis..
As already mentioned, when applying the SSNIP test in practice, one considers the products or services of the firm under consideration asking whether a price increase of 5 to 10% would be profitable for a hypothetical profit-maximising monopolist with control over all of these products. If the answer is yes, then this is the relevant market. Based on our survey data, we can estimate the change in cargo volume induced by a 10% increase in harbour dues by HbR.
It should be noted that when testing the profitability of a change in price and thereby quantity, one also needs to consider potential changes in costs for the hypothetical monopolist. An increase in costs if volume decreases could partly offset the increase in price for the remaining quantity that is sold. In the course of our study, we have not received any evidence that the cost structure of HbR is directly linked to the volume being shipped through the port. Hence, in our indicative SSNIP analysis, we assume that there are no variable costs and that therefore HbR’s costs are bound not to change with quantity (note that this is a conservative assumption as it makes price increases less profitable). Note that this assumption is conservative as it means that a reduction in volume will only reduce revenues for HbR, but that there will be no additional cost savings due to lower quantity, which would make a price increase even more profitable. Our conservative assumption of no variable costs means that an increase in harbour dues will be profitable for HbR if the percentage loss in volume induced by this increase is lower than the percentage increase in harbour dues, i.e. if the elasticity of demand is less than one.
30 Port users often have a clearer view on total port related costs than on minor parts of it. Moreover, HbR
could not provide switching evidence regarding harbour dues. Thus, asking for the response to changes to total port related costs is likely to yield more informed answers than questions referring to responses to changes in harbour dues.
74
Report prepared for the NMa
Charle s
Rive r
Asso c iate s
Table 15 shows the different steps of our SSNIP test. Note that we could only conduct the test for those cargo types where we had information about the share of harbour dues in total port related costs, i.e. for containers and all dry bulk cargo.
Based on the data from our survey, we arrive at the conclusion that it would be profitable for HbR to raise harbour dues by 10% for all cargo types analysed here. The percentage loss in volume would always be smaller than the percentage increase in price, which means that total profits would be higher than before the price increase – given that average costs are assumed to remain constant.
There are two important things to note regarding this result. First, the fact that our analysis suggests that there is room for HbR to increase prices for containers and all dry bulk cargo suggests that HbR is currently not profit maximising. Hence, HbR does not seem to exploit the pricing power that it has according to our analysis.
On the other hand, it is important to note that – due to the caveats discussed above (see Section 3.1) – our results are only indicative and do not necessarily reflect the true demand elasticity of port users. Whenever possible, we prefer data on revealed preferences over data on preferences stated in an interview or in the questionnaire. Given these restrictions, although the SSNIP test results suggest that the relevant market for containers and all dry bulk cargo types consists only of the port of Rotterdam, we do not base our definition of the relevant markets on the survey-based SSNIP test analysis only. In the course of our study, we have learned about only one example of revealed preferences with regard to switching induced by an increase in harbour dues. An agribulk agency moved volume from Rotterdam to Antwerp in 2001 after harbour dues had increased in Rotterdam. Our survey revealed no other switching related to a change in harbour dues.
In the following, we explain the steps of the profitability analysis in detail.
75
Report prepared for the NMa
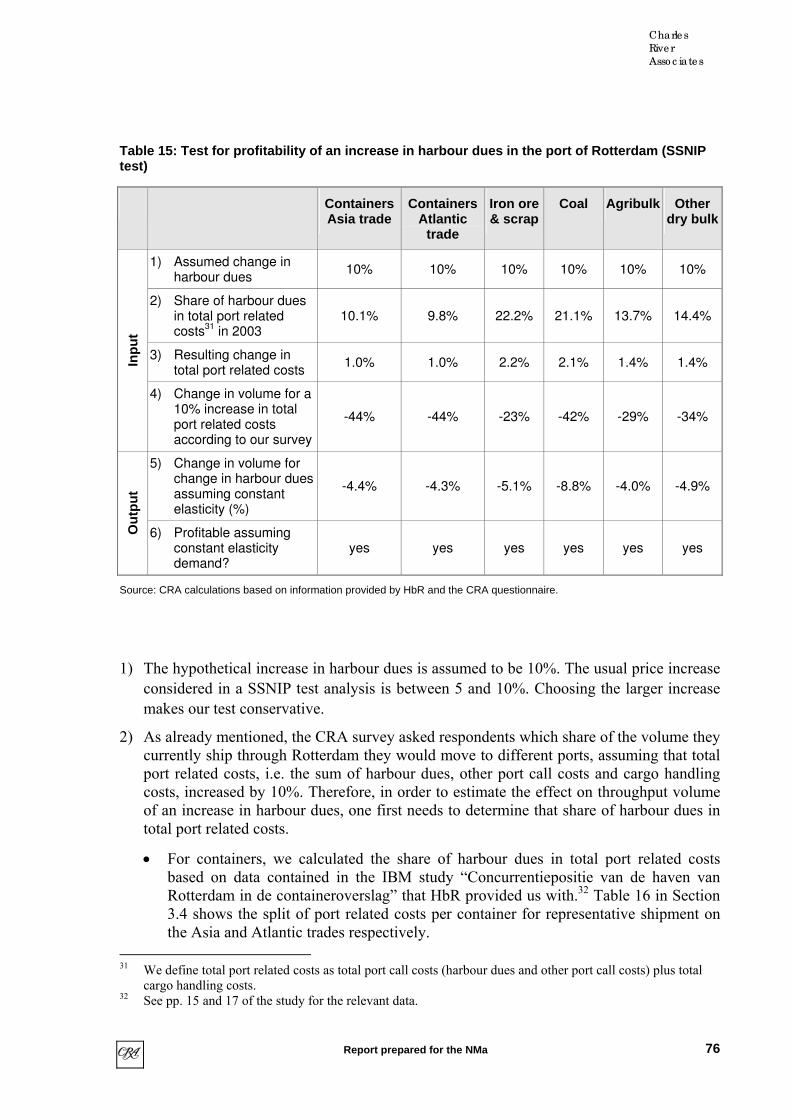
Charle s
Rive r
Asso c iate s
Table 15: Test for profitability of an increase in harbour dues in the port of Rotterdam (SSNIP test)
Containers Asia trade
Containers Atlantic
trade
Iron ore & scrap
Coal Agribulk Other dry bulk
1) Assumed change in harbour dues
10% 10% 10% 10% 10% 10%
2) Share of harbour dues in total port related costs
31 in 2003
10.1% 9.8% 22.2% 21.1% 13.7% 14.4%
3) Resulting change in total port related costs
1.0% 1.0% 2.2% 2.1% 1.4% 1.4% Inpu
t
4) Change in volume for a 10% increase in total port related costs according to our survey
-44% -44% -23% -42% -29% -34%
5) Change in volume for change in harbour dues assuming constant elasticity (%)
-4.4% -4.3% -5.1% -8.8% -4.0% -4.9%
Out
put
6) Profitable assuming constant elasticity demand?
yes yes yes yes yes yes
Source: CRA calculations based on information provided by HbR and the CRA questionnaire.
1) The hypothetical increase in harbour dues is assumed to be 10%. The usual price increase considered in a SSNIP test analysis is between 5 and 10%. Choosing the larger increase makes our test conservative.
2) As already mentioned, the CRA survey asked respondents which share of the volume they currently ship through Rotterdam they would move to different ports, assuming that total port related costs, i.e. the sum of harbour dues, other port call costs and cargo handling costs, increased by 10%. Therefore, in order to estimate the effect on throughput volume of an increase in harbour dues, one first needs to determine that share of harbour dues in total port related costs.
• For containers, we calculated the share of harbour dues in total port related costs based on data contained in the IBM study “Concurrentiepositie van de haven van Rotterdam in de containeroverslag” that HbR provided us with.32 Table 16 in Section 3.4 shows the split of port related costs per container for representative shipment on the Asia and Atlantic trades respectively.
31 We define total port related costs as total port call costs (harbour dues and other port call costs) plus total
cargo handling costs. 32 See pp. 15 and 17 of the study for the relevant data.
76
Report prepared for the NMa

Charle s
Rive r
Asso c iate s
• For dry bulk, we calculated the share of harbour dues in total port related costs based on information provided by HbR on 16 July 2004. This information did not include cargo handling costs, which are, therefore, taken from the study “Benchmark Droge Bulk”, provided by HbR on 16 July 2004. We assume that cargo is not stored, but transhipped (“overslag” but no “opslag” costs). We also assume that the cargo handling costs given for coal are also applicable to iron ore & scrap and that the cargo handling costs given for agribulk are the same as the cost charged for other dry bulk. Given the similarities between the two cargo type pairs, this assumption is reasonable. Note that HbR information related to 2003 while cargo handling costs are based on information for 2001.33 Table 17 and Table 18 in Section 3.4 show total port related costs for representative dry bulk carriers and costs per ton of cargo shipped as well as the share of harbour dues.
3) The percentage change in volume for an increase in total port related costs by 10%, i.e. the demand elasticity of cargo throughput with regard to total port related costs, has been taken from the CRA survey results. Note that for each cargo type we took the unweighted average volume that respondents indicated they would expect to shift to other ports if port related costs increased in Rotterdam. Since our survey questions did not distinguish between Atlantic and Asia trade for containers, we assume that the two trades have the same demand elasticity.
4) The percentage increase in total port related costs subsequently depends on the percentage in harbour dues and on the share of harbour dues in total port related costs. The higher the share of harbour dues in total port related costs, the higher the change in those cost if harbour dues increase. For the cargo types analysed here, an increase in harbour dues by 10% would lead to an increase in total port related costs between 1% and 2.2%. The effect of higher harbour dues is stronger for dry bulk than for containers, where harbour dues account for a lower share of total port related costs due to lower cargo handling costs.
5) The percentage change in volume induced by an increase in harbour dues of 10% is calculated by multiplying the increase in total port related costs for the respective cargo with the demand elasticity described under (4) divided by 10 (i.e. the change in volume for an increase in total port related costs by 1%). Note that this implies the assumption of a constant elasticity of demand, i.e. that the demand elasticity is the same at all points along the demand curve. This assumption is conservative. A linear demand curve with non-constant elasticity would lead to a lower decrease in volume induced by a small price increase, which would mean even less lost volume and hence higher profitability of a price increase (see Figure 1).
33 HbR attached strong disclaimers to the study “Benchmark Droge Bulk” when providing us with it and
recommended not to rely too heavily on the number contained in the study. We still decided to use the estimates of cargo handling costs of €1.7 and €3.4 per ton in our SSNIP test. HbR’s own estimate of dry bulk cargo handling costs were €1 to €3 per ton. The results of our test are the same for all cargo types when the average cargo handling cost estimate of HbR (€2 per ton) is assumed.
77
Report prepared for the NMa
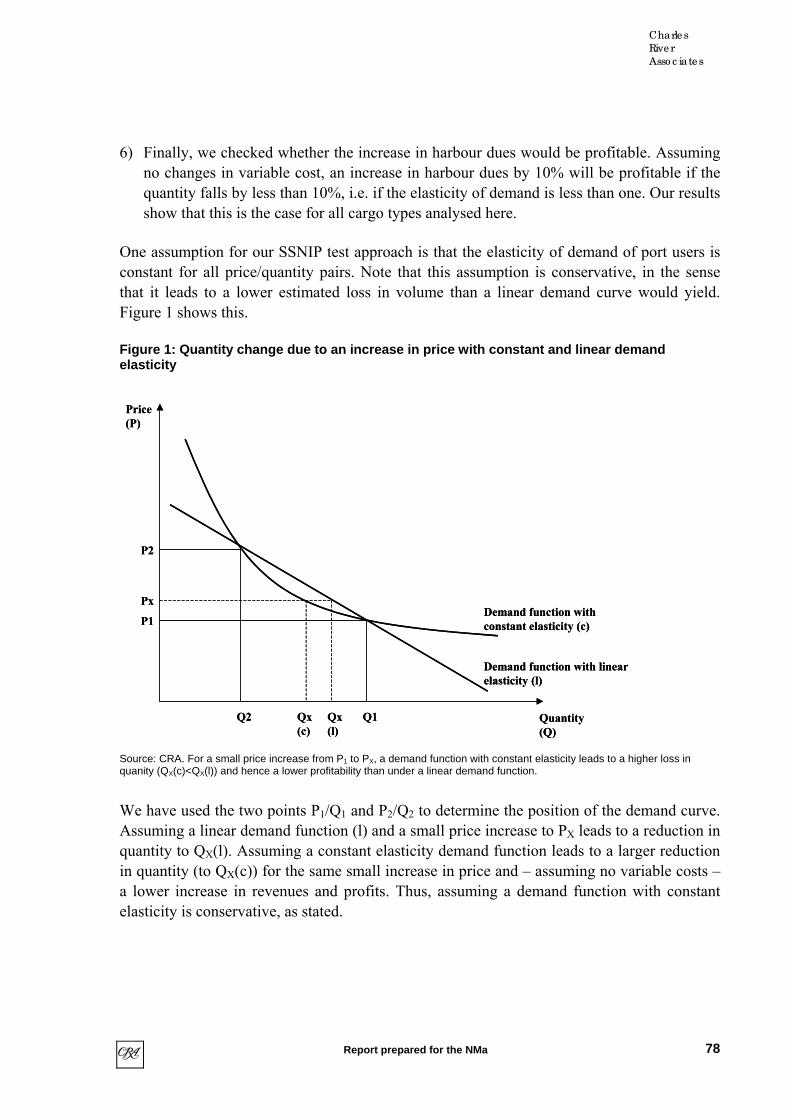
Charle s
Rive r
Asso c iate s
6) Finally, we checked whether the increase in harbour dues would be profitable. Assuming no changes in variable cost, an increase in harbour dues by 10% will be profitable if the quantity falls by less than 10%, i.e. if the elasticity of demand is less than one. Our results show that this is the case for all cargo types analysed here.
One assumption for our SSNIP test approach is that the elasticity of demand of port users is constant for all price/quantity pairs. Note that this assumption is conservative, in the sense that it leads to a lower estimated loss in volume than a linear demand curve would yield. Figure 1 shows this.
Figure 1: Quantity change due to an increase in price with constant and linear demand elasticity
Price
(P)
Quantity
(Q)
Q1
P1
Q2
P2
Px
Qx
(c)
Qx
(l)
Demand function with
constant elasticity (c)
Demand function with linear
elasticity (l)
Price
Quantity
(Q)
Q1
P1
Q2
Px
Qx
(c)
Qx
(l)
Demand function with
constant elasticity (c)
Demand function with linear
elasticity (l)
Source: CRA. For a small price increase from P1 to PX, a demand function with constant elasticity leads to a higher loss in quanity (QX(c)<QX(l)) and hence a lower profitability than under a linear demand function.
We have used the two points P1/Q1 and P2/Q2 to determine the position of the demand curve. Assuming a linear demand function (l) and a small price increase to PX leads to a reduction in quantity to QX(l). Assuming a constant elasticity demand function leads to a larger reduction in quantity (to QX(c)) for the same small increase in price and – assuming no variable costs – a lower increase in revenues and profits. Thus, assuming a demand function with constant elasticity is conservative, as stated.
(P)
P2
78
Report prepared for the NMa

Charle s
Rive r
Asso c iate s
3.4.3 SHARE OF HARBOUR DUES IN PORT RELA TED COSTS FOR CONTAINERS AND DRY BULK CARGO
able 16 presents the split of total port related costs ers in 2003.
of total port related costs for containers in 2003
T for contain
Table 16: Split
As e ia trad Atlantic trade
R Rotterdam otterdam
Harbour dues 29,720 19,613
Towage cost 8,310 7,800
Mooring/unmooring 3,901 3,093
Pilotage 10 10,898 ,974
Others 1 1,546 ,601
Total 5 42,950 4,506
Share of harbour dues 0.55 0.46
Total call costs per container (p. 16) 25 30
Cost of land move per container 110 110
Port related costs per container 135 140
Harbour dues per container 13.63 13.70
Share of harbour dues in port related costs 10.1% 9.8%
Source: CRA calculations based on “Concurrentiepositie van de haven van Rotterdam in de containeroverslag”, pp. 15 and 17, provided by HbR on 8 July 2004.
Table 17 presents the split of the total costs of a representative dry bulk shipment in the port of Rotterdam in 2003 (cargo handling costs for 2001).
79
Report prepared for the NMa

Charle s
Rive r
Asso c iate s
Table 17: Cost of cargo shipment through Rotterdam in 2003 (cargo handling cost for 2001)
Tons of cargo
shipped
Total sea transport cost in €
Total harbour
dues in €
Total other port call cost in €
Total hinterland costs in €
Cargo handling costs per ton in €
Total cargo
handling cost in €
Total port related
costs in €
Iron ore 145,000 4,101,180 77,850 26,593 1,812,500 1.7 246,500 350,943
Coal 55,000 1,054,800 29,1 ,830 6 1 ,570 15 87,500 .7 93 00 138,500
Agribulk 55,000 2,343,000 32,495 68 187,000 00 17,505 7,500 3.4 237,0
Other dry bulk
30,000 359,964 18,986 1,014 37 3.4 102,000 00 1 5,000 132,0
Source: Information provided by HbR on 16 July 2004. Cargo handling costs are taken from “Benchmark Droge Bulk”, provided razil
no storage, but only transhipment of the cargo to the hinterland transport mode. Cargo handling costs are at 2001 level.
able 19 presents the total port related costs per ton for representative dry bulk shipments in e port of Rotterdam and the share of harbour dues.
Table 18: Total port related costs per ton and share of harbour dues
by HbR on 16 July 2004. All shipments are assumed to be shipped to Mannheim/Germany. Origins are assumed to be Bfor iron ore, South Africa for coal and other dry bulk and the US gulf for agribulk. Note that cargo handling costs assume
Tth
Iron ore Coal Agribulk Other dry bulk
Total port related costs per ton 2.42 2.52 4.31 4.40
Harbour dues per ton 0.54 0.53 0.59 0.63
Share of harbour dues 22.2% 21.1% 13.7% 14.4%
Source: : Information provided by HbR on 16 July 2004. Cargo handling costs are taken from “Benchmark Droge Bulk”, provided by HbR on 16 July 2004.
80
Report prepared for the NMa

Charle s
Rive r
Asso c iate s
4 Activities of HbR
4.1 Introduction
As the port authority of the port of Rotterdam, HbR is involved in four main activities:
• The supply of nautical-maritime services.
• The supply of land to tenants of the port.
• The supply of port infrastructure to tenants and port users.
• (Minority) shareholdings in other companies.
Out of these four activities, only the second and third, i.e. the supply of land and the supply of port infrastructure, will be analysed in this study. This is in accordance with the brief we received from the NMa. CRA has not been tasked to further investigate issues related to vertical integration.
4.2 HbR services covered in this report
As explained in the previous section, this study covers two economic activities undertaken by HbR: the renting out of land and the provision of port infrastructure. This section provides more details on what the provision of these two services includes.
With regard to the renting out of land, HbR is responsible for the long-term spatial planning of the port, as well as the actual allocation of sites to and negotiation of lease prices with (prospective) tenants. For parcels that include quay walls, HbR does not only charge lease prices, but also quay dues. In many cases, the rented out land includes additional infrastructure set up by HbR, such as stronger quay walls, jetties, roads, or rail tracks. Such investments will be considered in the lease price charged by HbR. The process of price setting by HbR is discussed in more detail in the following sections of this report.
In addition to spatial management, HbR is responsible for the planning, construction and maintenance of the wet and dry infrastructure in the port, which includes for example waterways, port basins, quay walls and roads. HbR charges harbour dues to port customers for the use of this infrastructure. HbR also invests in the dredging of the channel in order to ensure the sea-side access for very large vessels like the ultra large oil tankers or the Berge Stahl, the largest dry bulk vessel that calls at a European port.
Additional suprastructure such as storage facilities, back-up areas, and cranes are not the direct responsibility of HbR, but are usually set up and maintained by port tenants and users.
81
Report prepared for the NMa

Charle s
Rive r
Asso c iate s
However, HbR is to a limited extent involved through its Infra+ strategy. Under this strategy, HbR provides some parts of suprastructure to terminal operators.
The yearly expenditure related to investment and maintenance of the port territory and infrastructure is around €150m, which is generally financed out of HbR’s total revenues. The port authority is also engaged in the planning of major expansions of the port (Botlek in the late 1940s and early 1950s; Europoort starting in 1958; Maasvlakte I between 1968 and1974; Maasvlakte II, for which planning is ongoing). These projects are typically financed through loans from the municipality of Rotterdam and co-financed by the Dutch government with specific repayment arrangements.
Table 19 below shows a split of total revenues of HbR in 2002 and 2003. Clearly, the port authority’s two main sources of revenue are lease related income (quay dues and leases) and harbour dues charged for the use of port infrastructure. The latter account for about 50% of the port’s revenues while the share of lease-related income in total revenues was close to 40% in the last two years. The following sections will explain the price setting of HbR in more detail.
Table 19: Revenues of the port of Rotterdam in 2002 and 2003
Revenues in 2002 in million
€
Revenues of total income in
2002
Revenues in 2003 in million
€
Revenues of total income in
2003
Harbour dues sea-going vessels 200 50% 201 50%
Harbour dues inland vessels 10 3% 10 2%
Rent, ground rent, quay fees 150 38% 152 38%
Other income 37 9% 38 9%
Total 397 100% 401 100%
Source: Port of Rotterdam, Annual Report 2003, p. 41. Note that the categorisation of revenues for 2003 presented in this table differs from other categorisations used later in the report. This is due to a new cost accounting approach that HbR introduced in 2003.
4.2.1 LEASE-RELATED PRICES
HbR uses a price list for lease-related prices. However, base lease prices are negotiated between the tenants and HbR and can differ from the list prices by up to 30%. The standard length of a lease is 25 years with the option for renewal. For the time of the lease, the price is determined by the base price adjusted by the Dutch consumer price index. All contracts contain a clause that limits the scope of price increases at the time of renegotiation: HbR needs to take the prices for similar parcels of land on the port territory into account.
List prices for leases are adjusted every 5 years. These adjustments affect new and renegotiated lease contracts only.
82
Report prepared for the NMa

Charle s
Rive r
Asso c iate s
When negotiating lease prices with prospective tenants, HbR takes into account their competitive position, the expected revenue generated by the tenant through harbour dues and any investments that might be required to prepare the parcel for the tenant by installing certain infrastructure. HbR has in the past used a cost-based pricing method, with which it is generally looking for an internal rate of return of 8.55%. This is not a regulated target, but internal HbR policy.
4.2.2 HARBOUR DUES FOR THE USE OF PORT INFRASTRUCTURE
Every year, HbR publishes a list of port tariffs that includes the harbour dues payable to the port authority. For most cargo types, harbour dues are charged according to the list prices. For example, vessels carrying wet and dry bulk cargo are charged per GT (gross tons) of the vessel. There are some (official and published) rebates available, but no additional discounts are given. The exception is the container business, where rebates of up to 30% on list prices are negotiated with the liners. According to HbR, harbour dues in Rotterdam are among the most transparent worldwide.
In general, harbour dues can vary by a broad range of characteristics. Possible factors for price discrimination include the type of cargo, ship characteristics (e.g. gross tonnage, length, draft, level of loading), the cargo loaded and/or discharged per call, the origin and destination of the cargo, or whether the vessel operates in liner service or as a tramp vessel. In addition, frequency and other rebates can be offered.
In Rotterdam, harbour dues vary by cargo category and by ship characteristics.34 There is no differentiation by origin or destination of the cargo carried, but a special tariff applies to shortsea/feeder and hinterland vessels. There are special tariffs or rebates for some cargo/vessel types. These include:
• Tariff for crude oil tankers;
• Frequency reductions for agribulk vessels (based on calls per year);
• Tariff for container vessels operating in liner service;
• Tariff for vessels carrying other general cargo and operating in liner service (non-shortsea/feeder);
• Tariff for shortsea/feeder vessels (which, by definition, can only carry general cargo and must operate in liner service); and
• Tariff for roll-on/roll-off vessels (whether or not in liner service).
For all other cargo types, HbR does not price discriminate, but charges a general tramp vessel tariff. This means that, for example, coal and mineral oil vessels pay the same harbour dues
83
Report prepared for the NMa

Charle s
Rive r
Asso c iate s
per GT. This lack of price discrimination by cargo type is not a technical necessity, but represents the traditional pricing approach of the port authority of Rotterdam.35
With regard to container vessels, HbR does not apply different harbour dues for cargo destined for transhipment and cargo destined for onward transportation to the hinterland. All incoming container vessels pay the same tariff. However, there is an indirect possibility to apply a targeted pricing policy for transshipment due to the fact that HbR charges different tariffs for incoming (overseas) container vessels, shortsea/feeder vessels and hinterland vessels. By setting the price for shortsea/feeder vessels, the port can, in fact, price discriminate between hinterland cargo and transhipment cargo (excluding relay).
The level and structure of harbour dues are reviewed annually. Until corporatisation, the port authority would consult port customers and then make a proposal to the municipality, taking into account the views of the port customers and especially the financial situation and objectives of the port36. A number of features of this process are noteworthy: 37
• The consultation of port customers was described as “ritual dancing” by HbR as the arguments of the customer representatives are predictable and these rounds are not seen as decisive for the actual outcome of the pricing decision. Our survey broadly confirmed this perception although some port users felt the consultation rounds did have an effect on the pricing decision.
• During the consultation rounds with customers, HbR is usually not approached regarding the level of harbour dues, but customers are more interested in better infrastructure, port facilities and/or land. Capacity limits and congestion are more important issues for customers than harbour dues.
• Occasionally the municipality would not agree with the port’s recommendations regarding the new level and/or structure of harbour dues. In such cases, the municipality would usually demand higher harbour dues in order to improve its own financial situation.
• It was pointed out by HbR that they do not follow a short-run profit maximising strategy, but seek to maintain a stable long-run pricing policy and establish the port as a “reliable partner” for its customers.
• According to HbR other ports generally wait and see how prices in Rotterdam change before they make their pricing decisions. This was confirmed by some but not by all survey respondents that commented on the sequencing of pricing decisions.
34 There are also special harbour dues for inland vessels, e.g. fishermen and pleasure yachts. However, those
are not the focus of this study. 35 Price discrimination can be welfare and consumer welfare enhancing. The use of this term should not
induce a negative connotation. 36 According to a study undertaken by researchers of the University of Amsterdam, the port considers
investment, maintenance and development costs of port infrastructure in setting prices (Masurel, E., Nijkamp, P. and B.W. Wiegmans: “Tariefstructuur van het zeehavengeld en de daarmee samenhangende dienstverlening voor de oliesector in de Rotterdamse haven”, provided by the NMa).
37 Interview with HbR on 22 July 2004.
84
Report prepared for the NMa
Charle s
Rive r
Asso c iate s
HbR has repeatedly told us that it intends to maintain its traditional price decision-making process after corporatisation. The only difference will be that the municipality will no longer have to approve prices, which HbR welcomes for it eliminates a level of bureaucracy the port experienced as a professional hinder. We understand that there will remain some indirect influence of the municipality on the pricing of the port: according to the corporatisation agreement, HbR must pay 4% of the invested capital to the municipality every year.38 If anything, this requirement does certainly not cap the prices set by HbR. There is, moreover, at this time no legal obligation foreseen for HbR to maintain any of the pricing policies applied in the past.39
4.3 Implications for the study
The analysis of the activities of HbR and its price setting procedure leads to some relevant implications for this study:
• The actual lease prices depend on the bargaining position of the tenant. For port-related services40 this bargaining position will depend on specific investments to be made by the port and the tenant respectively and on the ease by which cargo can be switched to other ports. Thus, inter-port competition on the cargo side will not only constrain harbour dues, but also lease-related prices. Similarly, a lack of competition on the cargo side will increase pricing power for leases. The definition of relevant markets for the lease of land will therefore be informed by the market definition for the provision of infrastructure for the relevant cargo type.
• When negotiating lease-related prices for a parcel, the expected level of harbour dues generated by the tenant is taken into account. We would expect (and do see) lower lease prices for parcels used for port-related services (e.g. terminals) than for other services (e.g. accountants). HbR sees harbour dues and lease-related prices as a bundle and, therefore, the chosen level of harbour dues and lease-related prices interact. Thus, the setting of lease related prices needs to be analysed in conjunction with the expected revenue generated by harbour dues.
• Harbour dues are not directly related to variable (or marginal) cost of providing services to the port user.41 They are set to generate cash for past and ongoing investments and to generate a return for the owner of the port. Thus, the level of investment activity and the conditions of financing these activities are of key importance for pricing at the port of Rotterdam (and for port pricing in general).
Given the current pricing structure, there are limits to the possibilities to price discriminate between different cargo types and destinations. While it is possible to price discriminate
38 Interview with HbR on 22 July 2004. 39 Information provided by the NMa. 40 Services that are derived from the cargo throughput of the port. 41 See also Masurel, E., Nijkamp, P. and B.W. Wiegmans: “Tariefstructuur van het zeehavengeld en de
daarmee samenhangende dienstverlening voor de oliesector in de Rotterdamse haven”, provided by the NMa.
85
Report prepared for the NMa

Charle s
Rive r
Asso c iate s
between hinterland traffic and transhipment, it is in the current price structure otherwise not possible to discriminate between different origin destination pairs as origin and destination are not part of the price schedule. One potential exception is the container business. If particular liners have traditional strongholds in regions or for certain cargo types, rebates can used to price discriminate. The possibility to price discriminate influences the definition of the relevant market as it affects the profitability of a price increase. HbR is free to change the pricing structure and to differentiate prices by cargo type. We have been told by HbR that they have discussed possibilities to change the pricing structure, but that no formal plans exist. We have, therefore, not restricted our analysis to the given pricing structure but considered cargo types within the same tariff separately.
86
Report prepared for the NMa

5 Renting out of land
5.1 Overview
The port of Rotterdam is a large industrial complex, which includes some five thousand hectares of land suitable for business and industrial tenants. The port has a total territory of about 11,000 ha, one third of which is covered by water. Of the remaining land area, only about two thirds are suitable to be rented out to businesses and industry.42 In 2003, the area of land suitable for business and industrial tenants was 5,036 ha.43
Currently, HbR has about 2,000 lease and ground rent contracts, generating revenues of about €179 million per year. The top five contracts – three in the oil segment, one in the container segment and one not cargo-related – account for about 9% of total lease revenues. There are 33 contracts with revenues of more than €1 million per year, which in total generate revenues of about €58 million, i.e. almost one third of all lease revenues.44
HbR rents out a variety of items. Clearly sites, berths and quays are the most important ones, but in some cases the port authority also leases infrastructure facilities to its tenants. These infrastructure facilities are covered by the port authority’s Infra+ strategy. The majority of the facilities is provided to tenants in the container segment. Infra+ contracts account for about 9% of HbR’s lease-related revenues as of October 2004.45
One important skill required by HbR with regard to renting out land is spatial planning, i.e. to develop and follow a long-term strategy for the port, which includes locating the right tenants at the right location on the port territory so that industry clusters can work efficiently. New tenants may add value to the port not only by paying rent, but also by attracting cargo or improving the network of services offered to other tenants.
In order to be able to define the relevant markets for the renting of land, one needs to distinguish the different tenant types. Tenants may be potential tenants or firms already established on the port territory. Secondly, they may be port-bound, i.e. access to land at the port is crucial in order to provide their services to the port’s customers. Also, tenants may have invested heavily in infrastructure and other facilities in the port, or may be easily able to re-locate once their contract expires.
42 On 1 January 2003, the port of Rotterdam had a total territory of 10,845 ha, of which 7,181 ha were land
and 3,664 ha were water (Ruimtebalans 2003, p. 2). 43 HbR Annual Report 2003, p. 20. 44 CRA calculations based on data received from HbR on 14 October 2004. 45 CRA calculations bases on data received from HbR on 14 October 2004. Detailed numbers are presented
later in this chapter.
Report prepared for the NMa

Charle s
Rive r
Asso c iate s
For port-bound tenants, potential market power for lease prices is derived from the port authority’s potential market power with respect to the relevant cargo flows. Given that most lease contracts of HbR are (very) long-term, it is important for the assessment of market power to determine to what extent the port authority is free to set and negotiate lease prices.
Benchmarking studies have shown that lease prices in the port of Rotterdam are higher than in other ports. Based on the CRA questionnaire, the most important reason for a price premium in Rotterdam is the better and unconstrained sea access that is offered compared to other ports. Our analysis of the HbR tenants database and other information on the status of the land on the port area indicates that scarcity of land, which reflects the high demand for land at the port of Rotterdam, could be another reason for the price differential found by all studies we considered.
In this chapter, it will become clear that over the next three years – due to space restrictions, extension options for existing contracts, and a price review process that requires benchmarking between existing tenants and prevents arbitrarily high price increases – HbR will only be free with regard to the pricing of a very small share of its total area, about 8%. This percentage of rental area that can be reallocated in the coming years is split into 6% of the total surface suitable for business and industrial tenants that is immediately available for allocation at the moment, and about 2% that will become available due to expiring contracts until the end of 2007. While 6% of currently available land may seem a considerable share, it is important to note that the majority of the sites available for immediate allocation to tenants consist mainly of very small patches of land. There is one site of 58 ha and a few smaller sites of 10 to 20 hectares. All other plots are smaller. This greatly reduces the sites’ attractiveness for some potential tenants and consequently decreases the pricing power of the port authority. The conclusion of large new lease contracts, e.g. for the construction of a new terminal or industrial plant, is at present not possible simply for lack of available space.
With regard to those land lease contracts that will expire over the next few years, in many cases existing tenants may wish to extend these lease contracts, especially if they have invested in on-site facilities. Such “captivity” would reduce the bargaining power of the tenants and allow HbR to exercise some pricing power in the renegotiation of the lease prices. However, this could affect at most 2.1% of the total surface area suitable for business and industry over the next three years, i.e. those sites for which contracts will expire without any extension option. This percentage is this low mainly due to the fact that many lease contracts specify conditions on extension prices that greatly curb HbR’s power to raise them. Overall, space limits, contract extensions, and required price benchmarking clearly constrain any potential market power that the port authority possesses for the renting of land.
For those sites where HbR can negotiate prices freely, the level of potential market power will – as already mentioned – depend to a significant extent on the port’s position in the respective cargo segment, which will influence its attractiveness as a business location not only for tenants that are directly bound to cargo flows, but also – through the effect on trade flows and economic activity in the port – its attractiveness for other tenants active in support
88
Report prepared for the NMa
Charle s
Rive r
Asso c iate s
industries that are only indirectly related to a specific cargo flow. An assessment of market definitions and market power of HbR for the provision of infrastructure for port users in the different cargo flow segments will be analysed in later chapters.
5.2 Tenant types
There is a wide range of tenant groups located in the port of Rotterdam. The following groups are based on a port directory published by HbR:
• “Cargo handling companies”, e.g. stevedores, terminal operators, warehousing and distribution companies, container depots, cargo superintendents, cargo classification companies and cargo surveyors.
• “Transport companies”, representing all transport modes (air, rail, barge, road).
• “Forwarding and shipping companies,” e.g. freight forwarders, shipping lines, shipbrokers, liner agents, inland shipping, and shortsea/feeder shipping companies.
• “Supplies-associated industries” (including nautical service providers), e.g. general industry, container-related companies (sale, rental, lease and repair), bunkering, towage and salvage companies companies dealing with equipment and materials, ship stores, and shipbuilding and repair companies.
• “Finance and consultancy companies”, e.g. banks, insurances, accountants, notaries, lawyers, consulting engineers and IT companies.46
In order to define relevant markets for the leasing of land, it is helpful to distinguish those tenants that are bound to the port and those that could lease or rent land at other sites. With regard to port-bound tenants, one should consider not only tenants that are bound to a port in general, i.e. tenants for whom location at some port as a provider of sea access is crucial to carry our their business, but also tenants that are bound to the port of Rotterdam because they have to be located at the port in order to get access to the users of the port of Rotterdam, e.g. to provide services to cargo flows, passenger flows or companies located on the Rotterdam port territory (providing services to cargo flows may include processing goods coming into the port). Out of the list of company types listed above, the majority can be classified as being port-bound.47
Cargo handling companies are generally port-bound since they require direct physical contact with the cargo they are dealing with and hence need sea access or at least access to sea-going vessels for their business. Clearly, a stevedoring company requires access to an area that is accessible for sea-going vessels. In principle, some cargo handling operations can locate at a
46 HbR “Rotterdam Port Information 2004”, p. 289. 47 Note that the analysis in the following paragraphs is of a general nature. In all tenant groups, there are likely
to be exceptions to the general classification. For example, while most cargo-handling companies are likely to be port-bound, some may not be. A comprehensive analysis of the degree to which tenants are bound to the port would require a case-by-case assessment.
89
Report prepared for the NMa
Charle s
Rive r
Asso c iate s
distance from the port, like e.g. hinterland terminals, warehousing companies and container depots. However, these are usually complementary to facilities at the port. Thus, while some hinterland terminals and warehouses do indeed exist, a scenario where most or even all cargo-handling companies locate outside the port is highly unlikely. In general, cargo-handling companies can, therefore, be classified as being port-bound and – given that specialisation is common – in addition usually bound to specific (groups of) cargo types.
Transport companies provide transport services from and to the port by a variety of transport modes. They are bound to the port in the sense that they need access to cargo loaded and/or unloaded in the port, but their administrative offices etc. could in theory be located outside the port. However, it seems reasonable to assume that, since their customers are located at the port, many transport companies have a strong incentive to be present in the port area in order to facilitate transactions and to have direct access to the cargo flows going through the port. Hence, we classify transport companies as generally bound to the port.
Forwarding and shipping companies are similar to transport companies in the sense that they do not need port infrastructure or sea access in order to conduct their business. However, they differ from transport companies to the extent that their relationship with cargo flows is mainly administrative and not physical, i.e. they may deal with cargo flows but usually do not touch the cargo itself. This explains why in fact various large forwarding companies and agents doing business in the port of Rotterdam are not tenants of the port authority.48 Hence, we do not classify forwarding and shipping companies as port-bound. Geographic proximity to the port, i.e. locations in the area directly around the port, may be an advantage for these companies in order to enable the necessary communication with port customers and the port authority. Yet, it does not appear that it is crucial for them to get access to the port users.49
The majority of supplies-associated industries require geographic proximity to the port and its customers. While some general industry may not be bound to the port in any shape or form, some may be port-bound if they depend on the cargo flows going through the port and require direct access in order to be able to provide their services to these flows. Nautical service providers like bunkering and towage companies are also clearly port-bound because, in order to do their business, they need access to sea-going vessels, which are in turn bound to the port by physical constraints. The same holds true for shipbuilding and repair companies, container-related companies etc. We therefore classify supplies-associated industries as generally bound to the port. Note that the decisive factor for being bound to the port is not necessarily the need for sea access or physical contact with cargo flows. Consider the case of a car rental company, which can be seen as a supplies-associated industry. While one could
48 Examples include [confidential] and [confidential], two of HbR’s key accounts in the dry bulk segment.
Note however that other agencies, e.g. Vopak for liquid bulk, are still located directly in the port of Rotterdam.
49 In fact, Eurokor for example provide ship agency services for the ports of ports of IJmuiden, Velsen, Amsterdam, Rotterdam, Vlaardingen, Schiedam, Dordrecht, Moerdijk and Vlissingen from their office in Ridderkerk close to Rotterdam. This clearly shows the fact that forwarding and shipping companies generally are not port-bound, but can provide their services also to more distant customers.
90
Report prepared for the NMa

Charle s
Rive r
Asso c iate s
argue that such a company could provide its services outside the port as well as inside the port territory, one could still classify it as port bound in the sense that – in order to have access to the passenger flows in the port – it needs to be established on the port territory. Otherwise, whenever a car was rented to someone on the port territory, a driver would have to bring this car from the off-site location to the port. Clearly, this would impose significant extra cost on the business. Hence, one could classify such a car rental company as being bound to the port as an economic entity and as a hub where passenger flows are bundled.
Finally, finance and consultancy companies are unlikely to be bound to the port territory. In principle, such companies could locate outside the port territory just as well as locating in the direct port area. While it may be more practical for e.g. accountants to be on-site, there is nothing that prevents them from locating in an office in the city centre and drive to the port area as necessary.
Table 20 summarises our classification of tenant types. Note that all our findings are indicative. A full analysis would require a case-by-case assessment of each individual tenant of the port authority.
Table 20: Categorisation of tenant types
Tenant group Categorisation (bound to the port or not)
Cargo handling companies Port-bound
Transport companies To some extent port-bound
Forwarding and shipping companies Generally not port-bound
Supplies-associated industries (incl. nautical service providers)
Mainly port-bound
Finance and consultancy companies Generally not port-bound
Source: CRA. Note that this categorisation is indicative.
HbR distinguishes between port-bound and non-port bound tenants in its list prices and defines them generally in accordance with our definition:
“A non port-bound company is a company with such a range of products and/or services that it could also be settled outside the port area. In general such a company does not need water access for its raw materials and products and has no relationship with a port-bound company for which it is essential to be established on a short distance.”50
On 1 January 2003, at least 87% of the port area suitable for business and industry was leased by port-bound tenants as defined by HbR. In particular, tenants active in the dry bulk, wet bulk and break bulk (incl. containers) segments held 87% of the total area leased out by the port. The remaining 13% were leased by “other tenants”, which included construction companies, trading companies, industry, and transport. It is very likely that at least some of
50 Email of Pieter van Essen (HbR), received on 12 October 2004.
91
Report prepared for the NMa
Charle s
Rive r
Asso c iate s
these other tenants are also bound to the port under HbR’s definition, which means that 87% is a lower bound for the share of land leased out to port-bound tenants.51
Many of the port’s tenants have made significant specific investments on their sites. Examples of such tenants are the oil refineries and storage companies, who have – according to our survey – invested up to € [confidential] in hardware and infrastructure.52 Clearly, at the time of re-negotiation for these tenants the relevant geographic market is the port of Rotterdam, as switching would be prohibitively expensive.53
The CRA questionnaire asked tenants if they felt that their company was locked in in the port of Rotterdam, i.e. if they thought that their company could not easily relocate even after termination of the lease contract. Out of a total of 86 respondents, 57% reported that they felt locked in. Specific investments made in facilities at or near the port were the most important reason given for the lock-in. Next, respondents were asked whether they believed that their company would re-locate if the port of Rotterdam were to increase its lease prices for existing contracts permanently by 10%, while lease prices for all other locations stayed at their current levels, assuming that the lease contract could be terminated easily and without penalty payments. Out of a total of 82 respondents, 68% said that they would not re-locate. Only 32% said that they believed their company would move. Table 21 below presents more details on the respondents who indicated that they would re-locate.54
51 HbR Ruimtebalans 2003, p. 8. 52 CRA questionnaire. 53 Note that we take the specific investment made in the past as an indicator for the investments they would
have to undertake (again) if they were to move to a different location today. It is the latter that matters for the switching decision.
54 CRA questionnaire.
92
Report prepared for the NMa

Charle s
Rive r
Asso c iate s
Table 21: Number of tenants of the port of Rotterdam indicating they would re-locate following a permanent increase in lease prices for existing contracts by 10% in the port of Rotterdam
Cargo type Type of company Number of respondents indicating they would re-
locate
Agribulk Cargo handling 1
Cargo handling 2 Containers
Supplies-associated industries 1
Cargo handling 1 Other dry bulk
Supplies-associated industries 1
Other 1 Other general cargo
Transport company 1
Cargo handling 2 Other liquid bulk
Other 1
Roll-on/roll-off Cargo handling 2
Source: CRA questionnaire. Number of respondents answering “yes” to the following question: ”Suppose that the port of Rotterdam were to increase its lease prices for existing contracts permanently by 10% while the lease prices for all other locations stayed at their current levels. Do you think that your company would re-locate if the lease contract could be terminated easily and without penalty payments?” Note that the total in the table above adds up to more than 26, the total number of companies saying “yes”, due to the fact that some companies are involved in more than one cargo type and/or classified themselves as more than one type of company.
Interestingly, the majority of the companies indicating that they would re-locate are cargo handlers. In particular, the group includes two terminal operators (one for juice and one for roll-on/roll-off) and one storage company (other liquid bulk/chemicals). However, none of the large dry bulk and container terminals said that their company would move away from Rotterdam if lease prices increased.
Despite the evidence reported above, overall our survey results seem to confirm the view that for a large number of port tenants and in particular the most important tenants in terms of lease revenues (oil terminals/storage facilities and container terminals) switching would not be an option and hence the relevant geographic market for lease contracts would be the port of Rotterdam.55
We have not analysed the market for non-port bound tenants, assuming that competition between the port of Rotterdam, other ports and especially non-port locations nearer or further away from the Rotterdam port area is intact. The responses to our survey did not indicate that there are particular competition problems with regard to tenants who are not port bound. Hence, we use the term “tenants” as a shorthand for tenants that are port-bound in the remainder of this report.
55 Note that the total area leased in the port of Rotterdam by the respondents to the CRA survey was 2,859 ha,
which corresponds to about 60% of the total area leased out by the port of Rotterdam in 2003 (4,722 ha according to HbR Annual Report 2003, p. 20).
93
Report prepared for the NMa

Charle s
Rive r
Asso c iate s
5.3 Relationship between renti ng of land and provision of infrastructure
For tenants specialising in specific (groups of) cargo types, the market definition for new tenants, existing tenants that wish to expand to new locations at the port, and tenants that have not made significant specific investments is derived to a significant extent from the market definition for the related cargo types. For example, a new terminal operator for crude oil may only consider the port of Rotterdam as a suitable location if Rotterdam is the only port that can accommodate large oil tankers. Likewise, a new terminal operator for dry bulk cargo may consider mainly those ports as alternative locations that are strong in dry bulk, such as Antwerp and Amsterdam. The more throughput of a specific cargo type a particular port attracts, the more attractive the port becomes for terminal operators dealing with this type of cargo. Hence, a strong market position in dry bulk could increase the pricing power of the port authority vis-à-vis prospective tenants active in the dry bulk industry. This situation is only reversed if, for example, a large terminal operator promises to develop new facilities that may divert the existing cargo flows to the benefit of Rotterdam. While these considerations may not apply to all tenants, they are likely to be relevant for many, in particular those that are port bound.
As will be discussed in more detail below, HbR is well aware of the link between the provision of infrastructure and the renting out of land. The port authority sees revenues generated by harbour dues and lease prices as a bundle. Tenants that are expected to generate higher income for the port through harbour dues (e.g. terminal operators) are likely to be offered lower lease prices than tenants who are unlikely to generate significant income through harbour dues.
In addition to the link between cargo flows and tenants, there is a more direct link between the renting out of land and the provision of infrastructure by HbR. As already mentioned, HbR does not only rent out sites, berths and quays, but in some cases also infrastructure facilities. These infrastructure facilities are covered by the port authority’s Infra+ strategy. The majority of infrastructure facilities are provided to tenants in the container segment, as shown in the table below.
94
Report prepared for the NMa

Charle s
Rive r
Asso c iate s
Table 22: Lease contracts of HbR in the context of Infra+ by tenant type
Segment Number of contracts
Sum of ha (sites)
Sum of metres (berths)
Sum of other items
Containers and Distribution 19 56.0 0 120,058
Food 1 0 0 1
Neobulk and other general cargo 2 0 0 5
Other (not linked to cargo) 1 0 0 1
Total 23 56.0 0 120,065
Source: CRA calculations based on data received from HbR on 14 October 2004. Other leased items include pieces of infrastructure, special rights etc.
In terms of turnover, Infra+ contracts account for €15.8 million of revenues in 2004, which corresponds to almost 9% of total lease-related revenues of HbR as of October 2004.56
5.4 Lease contracts
The port authority of Rotterdam uses standard lease and ground rent contracts (in the following both referred to as “lease contracts”) that are linked to “General Terms for Rights of Use” specifying the contract partners’ rights and obligations as well as the details of use-related payments.57 The most common contract term is 25 years, but in principle any lease term is possible. Contracts can include an option for the tenant to extend the lease, typically by a multiple of twenty-five years. Extended contracts are subject to a conditional review of the lease price.58
The total lease price consists of – if relevant – a price for the site, a price for the slope, a price for the water and for the facilities covered by the lease contract. All lease prices are adjusted annually based on the Dutch Consumer Price Index.59 In case of long-term contracts and those that include an extension option, the basic price is usually fixed for twenty-five years and revisited thereafter. However, changes to the lease prices are generally conditional, in particular on the development of the prices for similar parcels of land rented out in the port. The details of the price review are set out in the port authority’s “General Terms for Rights of Use”:
“Both HbR NV and the User may demand that the Use-related payment is reviewed as of the date of expiry of twenty-five Years after commencement of the Right of Use, and subsequently
56 The contracts in force in October 2004 generate revenues of about €179 million (CRA calculation based on
data received from HbR on 14 October 2004). 57 Port of Rotterdam, “General Terms for Rights of Use – Havenbedrijf Rotterdam N.V. 2004”. 58 Standard lease and ground rent agreements, articles 5.3 and 5.4 (provided by HbR on 14 October 2004). 59 Standard lease and ground rent agreements, articles 6.1-6.2 and “General Terms for Rights of Use –
Havenbedrijf Rotterdam N.V. 2004”, article 8.
95
Report prepared for the NMa

Charle s
Rive r
Asso c iate s
each time after expiry of a twenty-five Year period, provided the User or HbR NV was notified of such demand by no later than one hundred and twenty days prior to the date the review is demanded by registered letter. The provisions set forth in the previous sentence shall apply only if HbR NV or the User believes that the Use-related payment is not in agreement with similar use-related payments that have been agreed by HbR NV with third parties for the period of one Year prior to the Year in which the required review must be applied to the Use of Sites, Water, Slopes, Quaywalls, Jetties are Facilities, comparable to the Real Property, whilst taking into consideration:
a. The location, nature and condition of Real Property and comparable real property, whereby no account is taken of use or availability or nature of Buildings, if any;
b. The provisions subject to which the relevant similar rights of use were granted; and
c. The conditions subject to which the relevant similar rights of use were granted.
Where either HbR NV or the User should request a review, HbR NV shall submit a proposal for such review to the User by no later than fourteen days prior to the date of review. […] the new Use-related payment shall be fixed on the basis of the proposal to be submitted by HbR NV that will be based for this purpose on the provisions set forth in this Article 9.1.”
If HbR and the tenant cannot agree on a new lease price, a binding decision will be taken by a group of three experts, of which each party will appoint one and these two experts will appoint a third one. Like HbR, the appointed experts are bound to take into account the provisions set forth in article 9.1 as well as any changes in the property’s value due to external circumstances or currency movements.60
The requirement to take into account the price of similar sites rented out in the port limits the possibility of the port authority to demand a much higher price when tenants are locked in. Moreover, it creates a link between the pricing for new tenants and the re-negotiated prices for existing tenants. This limits the freedom for the port of Rotterdam to extract rents from its tenants. However, it may not reduce the space for doing so completely, in particular if prices for new tenants can be set high due to a strong position in the cargo market.
5.5 Lease-related prices
Lease contracts in the port of Rotterdam are not determined through an open tender. Instead, the port of Rotterdam has list prices (“recommended tariffs”) for lease and ground rent contracts, which are adjusted for inflation each year. A fundamental review of the list lease prices takes place every five years. The current list was determined in 1999 and is valid until the end of 2004. It distinguishes prices according to whether tenants are bound to the port or not according to HbR’s definition. Prices for dry land leased to tenants that are not port bound are higher than for port-bound companies (€9.51 versus €7.58 in 2004), since the former do not generate any additional income for the port through harbour dues and because the port
60 Port of Rotterdam, “General Terms for Rights of Use – Havenbedrijf Rotterdam N.V. 2004”, articles 9, 10
and 45.
96
Report prepared for the NMa

Charle s
Rive r
Asso c iate s
favours port-bound companies in its area.61 For port-bound tenants, prices vary depending on the type of land. HbR list prices distinguish four basic site types for port-bound companies:
• Dry sites without water access;
• Pitching parcels, i.e. sites with a slope that in most cases will be furnished with a jetty;
• Quay sites, i.e. sites behind a quay wall; and
• Incline and water.
While there is only one tariff per square metre applicable to pitching sites (€7.58 in 2004) and incline and water sites (€0.62), the price of pitching and quay sites depends on additional characteristics of the land.
• Pitching sites with a water depth of less than 4 metres: €6.77;
• Pitching sites with a water depth of more than 4 metres: €3.80 per square metre for the first 5 ha of, €3.16 for the second 5 hectares and €2.52 for each subsequent square metre;
• Quay sites: €5.54 for land up to 200 metres behind the quay wall, €3.15 for land more than 200 metres behind the quay wall, but a minimum average of €4.74 per square metre.62
Lease contracts usually include quay dues.63 Extra quay dues are only payable to the port authority for the use of public quays. Most quay walls, however, are rented by terminal owners.64
Although lease prices are listed according to the above categorisations, in practice, according to HbR, lease contracts are almost always concluded on an individual basis. In these negotiations, the final lease price agreed in the contract depends on the bargaining power of the potential tenant, which in turn is influenced by competition from other possible sites of location. HbR applies a maximum negotiation margin of -30% on the list prices. This means that there are sometimes significant differences between the prices tenants pay per square metre. We have been informed by HbR that the average reduction on list prices is about 10%.65
The CRA survey asked HbR’s tenants whether they received discounts on the official lease prices of the port of Rotterdam. Out of a total 55 respondents who answered that particular question, only eight, i.e. about 15%, indicated that they had received discounts from HbR. The discounts reported ranged from 13% up to 50%, with one respondent reporting a one-time discount phased from 100% to 0%. The survey also asked respondents whether they had
61 Email from Pieter van Essen, received 12 October 2004. 62 See “Aanpassing richtprijzen 2004”, 4 November 2003, document provided by HbR on 22 July 2004. 63 Interview with HbR on 5 July 2004. 64 HbR Port Tariffs 2004, p. 5. 65 Interview with HbR on 22 July 2004 and email from Pieter van Essen (HbR), 12 October 2004.
97
Report prepared for the NMa
Charle s
Rive r
Asso c iate s
received any costless services from HbR when signing the lease contract. Only 2 out of the 39 companies answering this question indicated that they did receive such services, but a total of seven companies provided details on services received from HbR. The extra services described by HbR include “promotion and commercial support”, “security and facility management”, co-operation on some site refurbishment, “pipeline installation (underground), fire brigade and other rescue services”, “co-investment in the improvement of the infrastructure on the terminal”, and “help in developing harbour infrastructure”.66 While some of the reported services seem to relate to public functions (e.g. fire brigade and rescue services), others clearly represent commercial services, e.g. promotion and commercial support.
In general, HbR does not use auctions for renting out land. It sometimes tries to find a new tenant for a particular site through an auction when a site is given back to the port authority for reallocation with existing installations and infrastructure that might be interesting for other tenants. Rather than unnecessarily destroying such an Infra+ site, HbR then seeks to find a suitable new tenant that wants to take over the existing sunk investments.67
Lease price differentials of existing tenants can arise due to different negotiated lease prices, but also due to different starting times of the contracts of different tenants and the level of recommended tariffs at that time. For example, during the 1970s and the 1980s, the recommended tariffs increased more than the rate of inflation during the same period. Because the lease prices of old tenants follow the rate of inflation, new tenants often pay more than old tenants for the same type of land.68 In particular, clients with lease contracts that date back to the 1950s and 1960s pay less than tenants with more recent contracts.69 To a large extent this is due to the historical development of the harbour in which the attraction of big tenants of certain cargo types was the prime objective of the port. It gave out favourable lease contracts to attract such desired customers.
Price differentials may also arise from extra investments made by the port of Rotterdam. Leases are cost-driven, i.e. HbR charges higher prices for sites where investment costs are higher. For example, because the quay wall is always an investment by the port of Rotterdam, quay sites are more expensive than pitching sites, where in most cases the tenant himself invested in a jetty. According to HbR, quay dues are not sufficient to cover the costs of constructing quay walls. The fact that lease prices are cost-driven is linked to HbR’s IRR objective of 8.55%.70 For containers, lease contracts usually follow the list prices plus a surcharge for specific site investments.71
66 CRA questionnaire. 67 Interview with HbR on 5 July 2004. 68 Email from Pieter van Essen (HbR), 12 October 2004. 69 Information provided by HbR on 22 July 2004. 70 Interview with HbR on 22 July 2004 and email from Pieter van Essen (HbR), 12 October 2004. 71 Interview with HbR on 22 July 2004.
98
Report prepared for the NMa

Charle s
Rive r
Asso c iate s
The fact that HbR’s potential to set lease prices and harbour dues, which together are its two main sources of revenue, are related is well understood by the port. HbR clearly sees harbour dues and lease prices as a bundle. In particular, it tends to charge higher lease prices for sites that do not generate harbour dues. In particular, dry sites are more expensive than wet sites: They generate no harbour dues that can be attributed directly to the tenant. Another variant of this is that some land lease contracts include a surcharge to be paid by the tenant if a specified level of cargo throughput is not met. Likewise, distribution and warehousing companies, who generate no harbour dues but pay higher leases to compensate for this, account for about the same revenue for HbR as sites linked to the dry and wet bulk segments (distribution companies occupy about 200h of the port area).72 Clearly, HbR sees that the variable fees it can charge on cargo limit the rent extraction via the lease contracts, and vice versa.
5.6 Tenant turnover and capacity constraints
As already mentioned, there are currently 5,036 ha of land at the port of Rotterdam that are suitable to be rented out to business and industry.73 The graph below shows the development of the total area surface suitable for business and industrial tenants over the last five years, split into whether the land was rented out, reserved or free for immediate allocation.
Figure 2: Total surface area of business and industrial premises in the port, split by status
215 221 235 245 314
4,940 4,940 4,940 4,974 5,036
0
1,000
2,000
3,000
4,000
5,000
6,000
1999 2000 2001 2002 2003
Hec
tare
s
Total allocated sites (ha) Sites immediately available for allocation (ha)
Options and reservations (ha) Total suitable surface area (ha)
Source: HbR Annual Report 2003, p. 20.
72 Interview with HbR on 22 July 2004. 73 On 1 January 2003, the port of Rotterdam had a total territory of 10,845 ha, of which 7,181 ha were land
and 3,664 ha were water (Ruimtebalans 2003, p. 2).
99
Report prepared for the NMa

Charle s
Rive r
Asso c iate s
The total surface area suitable for business and industrial tenants increased both in 2002 and 2003. In 2002, the increase was due to the purchase by HbR of 30 ha of land in the Waalhaven. In 2003, the total area earmarked to be rented out increased again, basically for two reasons. One was the purchase of a site on the north bank of the Nieuwe Waterweg. Another reason was accounting adjustments. In 2002, 155 ha of land had been left out of the total area indicated as suitable due to uncertainties regarding Maasvlakte II. These sites had been reserved for infrastructure of Maasvlakte II, in particular the access to Maasvlakte II for shipping. In 2003, a decision was made that the sites would not be needed and therefore HbR could include them in the total of suitable area for business and industry again.74 Although there may be small changes in the total surface area of land suitable for business and industrial tenants, in our further analysis we assume them to be negligible. That is, we assume the total area remained constant at the level of 2003, which seems reasonable, given that total rental space was relatively constant between 1999 and 2001.75 The expansion of Maasvlakte II will not come into effect before the end of 2007, that is, the end date of our analysis.76
Returning to the question of land available for immediate allocation to future tenants, the chart above shows that the share is low, around 6% in 2003. In addition, there are restrictions on the use of the free sites, given that most of them are relatively small. For example, the 314 ha of land available for immediate allocation at the end of 2003 included one site of 58 ha and a few smaller parcels of 10-20 ha, but all other sites were smaller. None of the sites could accommodate a new container terminal or a large industrial cluster.77 In January 2003, HbR reported sites immediately available for allocation of tenants with a total area of 245 ha. This area was split into 70 sites, 25 of which were smaller than 0.5 ha. 16 sites had a size of about 1 ha, 18 had 2 to 5 ha, nine plots were between 5 and 13 ha and only two sites were larger than 30 ha (33 and 59 ha respectively).78 Hence, any pricing power of HbR with regard to the currently available land is severely restricted by the limited size of the available plots and hence their attractiveness for potential tenants.
In the coming years, a new container terminal will be built on the northwest corner of the Maasvlakte in Rotterdam, the so-called Euromax terminal. HbR will be responsible for carrying out the basic construction and dredging, while the terminal itself, which will have a quay length of 1,800 metres, a draught of 19.65 metres and a surface of 100 ha (with possible extensions in a second phase), will be developed, built and operated by a 50/50 joint venture between P&O Nedlloyd and ECT. Construction work is expected to begin in the first half of
74 HbR Ruimtebalans 2003, p. 2 and HbR Annual Report 2003, p. 20. 75 Note that contrary to the information in the Annual Report 2003, the HbR publication “Ruimtebalans 2003”
indicates that the total surface area available for business and industrial tenants was not constant between 1999 and 2001, but fluctuated slightly. However, fluctuations occurred both upwards and downwards and usually below 1% (compare Ruimtebalans 2003, p. 6).
76 Construction work on Maasvlakte II is expected to commence in 2006 and the building of the first container terminal or chemical plant will not start before 2010 (http://www.maasvlakte2.com).
77 HbR Annual Report 2003, p. 20. 78 Ruimtebalans 2003, pp. 19-20.
100
Report prepared for the NMa
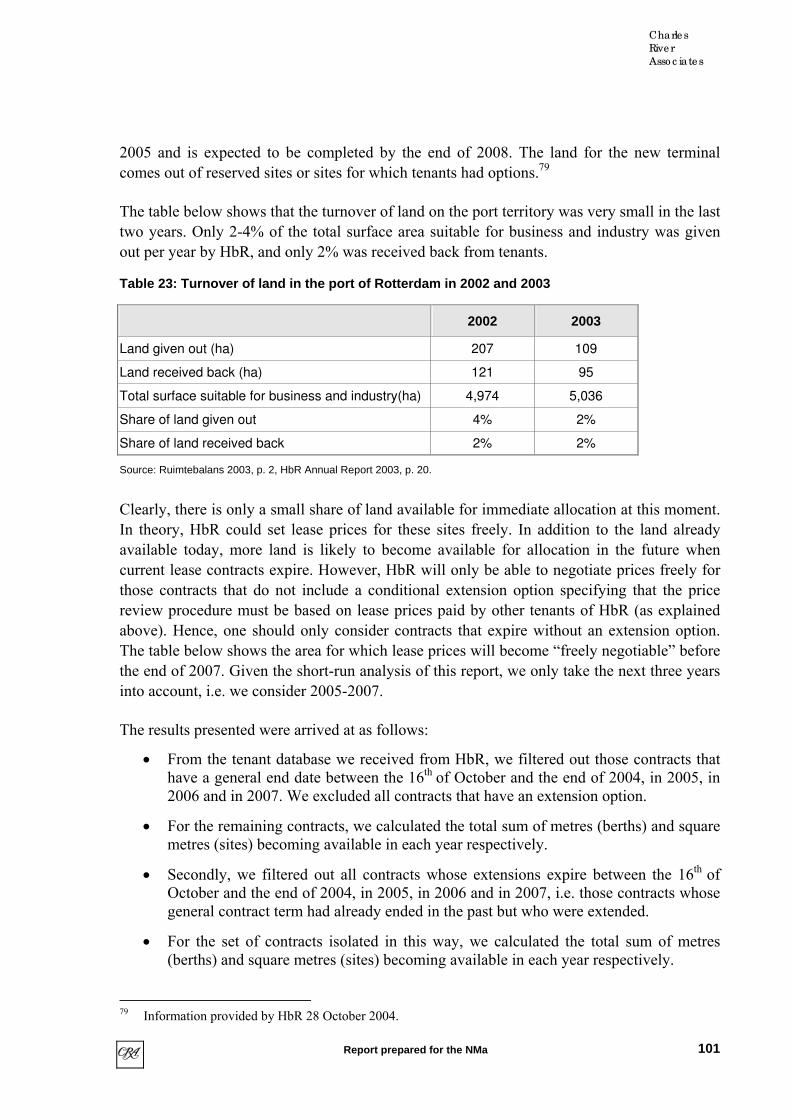
Charle s
Rive r
Asso c iate s
2005 and is expected to be completed by the end of 2008. The land for the new terminal comes out of reserved sites or sites for which tenants had options.79
The table below shows that the turnover of land on the port territory was very small in the last two years. Only 2-4% of the total surface area suitable for business and industry was given out per year by HbR, and only 2% was received back from tenants.
Table 23: Turnover of land in the port of Rotterdam in 2002 and 2003
2002 2003
Land given out (ha) 207 109
Land received back (ha) 121 95
Total surface suitable for business and industry(ha) 4,974 5,036
Share of land given out 4% 2%
Share of land received back 2% 2%
Source: Ruimtebalans 2003, p. 2, HbR Annual Report 2003, p. 20.
Clearly, there is only a small share of land available for immediate allocation at this moment. In theory, HbR could set lease prices for these sites freely. In addition to the land already available today, more land is likely to become available for allocation in the future when current lease contracts expire. However, HbR will only be able to negotiate prices freely for those contracts that do not include a conditional extension option specifying that the price review procedure must be based on lease prices paid by other tenants of HbR (as explained above). Hence, one should only consider contracts that expire without an extension option. The table below shows the area for which lease prices will become “freely negotiable” before the end of 2007. Given the short-run analysis of this report, we only take the next three years into account, i.e. we consider 2005-2007.
The results presented were arrived at as follows:
• From the tenant database we received from HbR, we filtered out those contracts that have a general end date between the 16th of October and the end of 2004, in 2005, in 2006 and in 2007. We excluded all contracts that have an extension option.
• For the remaining contracts, we calculated the total sum of metres (berths) and square metres (sites) becoming available in each year respectively.
• Secondly, we filtered out all contracts whose extensions expire between the 16th of October and the end of 2004, in 2005, in 2006 and in 2007, i.e. those contracts whose general contract term had already ended in the past but who were extended.
• For the set of contracts isolated in this way, we calculated the total sum of metres (berths) and square metres (sites) becoming available in each year respectively.
79 Information provided by HbR 28 October 2004.
101
Report prepared for the NMa
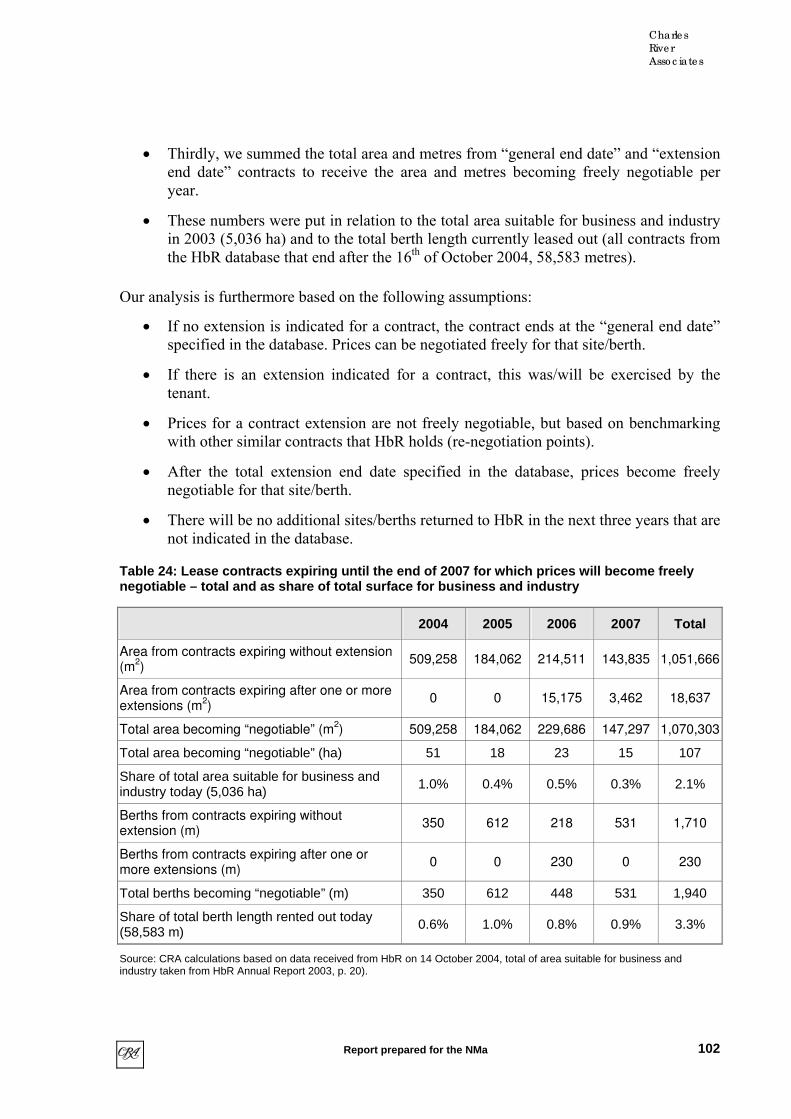
Charle s
Rive r
Asso c iate s
• Thirdly, we summed the total area and metres from “general end date” and “extension end date” contracts to receive the area and metres becoming freely negotiable per year.
• These numbers were put in relation to the total area suitable for business and industry in 2003 (5,036 ha) and to the total berth length currently leased out (all contracts from the HbR database that end after the 16th of October 2004, 58,583 metres).
Our analysis is furthermore based on the following assumptions:
• If no extension is indicated for a contract, the contract ends at the “general end date” specified in the database. Prices can be negotiated freely for that site/berth.
• If there is an extension indicated for a contract, this was/will be exercised by the tenant.
• Prices for a contract extension are not freely negotiable, but based on benchmarking with other similar contracts that HbR holds (re-negotiation points).
• After the total extension end date specified in the database, prices become freely negotiable for that site/berth.
• There will be no additional sites/berths returned to HbR in the next three years that are not indicated in the database.
Table 24: Lease contracts expiring until the end of 2007 for which prices will become freely negotiable – total and as share of total surface for business and industry
2004 2005 2006 2007 Total
Area from contracts expiring without extension (m
2)
509,258 184,062 214,511 143,835 1,051,666
Area from contracts expiring after one or more extensions (m
2)
0 0 15,175 3,462 18,637
Total area becoming “negotiable” (m2) 509,258 184,062 229,686 147,297 1,070,303
Total area becoming “negotiable” (ha) 51 18 23 15 107
Share of total area suitable for business and industry today (5,036 ha)
1.0% 0.4% 0.5% 0.3% 2.1%
Berths from contracts expiring without extension (m)
350 612 218 531 1,710
Berths from contracts expiring after one or more extensions (m)
0 0 230 0 230
Total berths becoming “negotiable” (m) 350 612 448 531 1,940
Share of total berth length rented out today (58,583 m)
0.6% 1.0% 0.8% 0.9% 3.3%
Source: CRA calculations based on data received from HbR on 14 October 2004, total of area suitable for business and industry taken from HbR Annual Report 2003, p. 20).
102
Report prepared for the NMa

Charle s
Rive r
Asso c iate s
Based on the above described methodology and assumptions, our findings show that prices will become freely negotiable only for a very small share of the total surface suitable for business and industry. That is, before the end of 2007, only about 2.1% of the area will become freely negotiable. In addition, similar to the land that is already available today, it is important to note that it is not only the total rental area that matters, but also its constitution. The following table shows the number of the expiring lease contracts per cargo type, as well as the largest site/berth for which a contract expires from 2005 until 2007.
Table 25: Lease contracts expiring until the end of 2007 for which prices will become freely negotiable – number of contracts and largest site/berth by cargo type
Segment Year Number of contracts
Largest site (ha)
Largest berth (m)
Other leased items
2005 3 8.0 345 0 Oil and Refinery
2006 2 0.3 0 1
2005 1 1.9 0 0 Other wet bulk
2007 2 0.3 90 0
(Petro) Chemical industry 2006 2 2.0 0 0
Agribulk 2005 6 0.2 42 0
Other dry bulk 2007 4 0.5 75 0
2005 2 2.2 0 0
2006 1 0.2 0 0 Containers and Distribution
2007 6 2.1 125 85
2006 7 1.0 180 7 Food
2007 4 5.7 150 1
2005 20 2.7 63 4
2006 21 7.0 130 2 Other (not linked to cargo)
2007 12 0.5 21 0
Source: CRA calculations based on data received from HbR on 14 October 2004. Other leased items include pieces of infrastructure (under HbR’s infra+ strategy), various rights etc.
From the table above, it is clear that sites and berths that come available are relatively small and hence will not provide major opportunities for larger scale projects, such as the building of a new container terminal, or large industrial facilities. The largest site overall that will be released for allocation is about 8 ha and is currently leased by Esso Nederland. However, this site is one of the smallest sites amongst all sites that Esso leases from HbR, which sum up to almost 228 ha in total,. Of these, 218 ha are covered by contracts that allow for extension until 2039 and 2046 respectively.80
80 CRA calculations based on data received from HbR on 14 October 2004.
103
Report prepared for the NMa

Charle s
Rive r
Asso c iate s
Overall, the short-run pricing power of HbR with respect to lease prices is therefore very much restricted by existing contracts, the majority of which on top of that includes extension options and hence only allows price changes based on prices of similar sites leased out by the port authority. Until the end of 2007, a maximum of only 2.1% of the current port area suitable for business and industry will become available for “free” price negotiations, i.e. price negotiations without the need for benchmarking with comparable sites on the port territory. HbR could exercise its bargaining power in price negotiations for these sites, especially if tenants who have invested in facilities on the site wish to extend their contract. However, as already mentioned, this would only apply to a very small share of the port’s total land suitable for renting out. In addition, the average size of the sites that will become available is relatively small, which reduces their attractiveness for many potential new tenants and hence the degree of pricing power HbR could exercise.
The scant availability of free sites in the port of Rotterdam was also confirmed by our questionnaire results. Out of a total of 65 respondents to a question specifically asking whether scarcity of rental space was perceived, 15 companies answered that their company had – in the recent past – expressed an interest in leasing more land in the port of Rotterdam, but was rejected by the port authority. In eight cases, this had been for reasons of unavailability of suitable land, while in six cases suitable land was given to another applicant. Various respondents also reported a lack of proper spaces in the port of Rotterdam in the qualitative sections of our survey.81
5.7 Investments
Each year, HbR establishes average “normal” investments in the construction and maintenance of infrastructure of about €150 million per year (€112 in 2003).82 Following proper business methods, before investing in new projects to expand the port territory and hence the area that can be leased out, HbR seeks to estimate the expected revenue stream, including the additional land lease payments, quay dues and harbour dues generated by the investment. These revenues are assessed against the investment costs and expected maintenance cost (NPV valuation). By internal rules, investment projects must have an IRR of 8.55% in order to be approved. For large investments, if so required, it has been common for the municipality of Rotterdam, or even the Dutch government, to step in with a loan.83
HbR has stated that it is difficult to rank the importance of the different cargo types for the port, because the port authority does not have a purely commercial perspective, but also takes socio-economic considerations into account (“The port is not a normal company.”). Still, if a
81 CRA questionnaire. 82 HbR Annual Report 2003, p. 20). 83 Interview with HbR on 22 July 2004.
104
Report prepared for the NMa

Charle s
Rive r
Asso c iate s
new trend has been identified (e.g. the start of the container business), then the port does not shy away from starting to think like a true investor.84
In general, however, the tool to promote or discourage certain sectors in the port area is not pricing, but land reservations instead.85
“Profit maximisation has never been the philosophy of the port management. The guiding factor is to ensure continuity and to serve the market well. All decisions have a long-term focus. “ 86
Furthermore, all major investment projects are decided upon in the context of also the world economy developments, such as the competitiveness of Europe vs. Asia.
5.7.1 PAST AND FUTURE PORT EXPANSION INVESTMENTS
In general, HbR is of the opinion that the huge investments related to port expansions cannot be financed in a traditional way, because they are too long-term focused. No bank would finance investments like these, according to the port. In the past public financing of infrastructure was an important basis for a number of major port expansions:
• The Botlek expansion in the late 1940s and early 1950s was financed by the port itself, out of revenues generated by the existing port facilities.
• The Europoort expansion in 1958 was a huge investment, the financing of which was shared between the Dutch government and the port. The port authority allocated port revenues and took out a loan from the municipality, which was paid back over about 20 years.
• The Maasvlakte I expansion established between 1968 and 1974 followed an approach similar to the Europoort expansion. It was financed by the port through a loan from the municipality of Rotterdam (with a longer term than for the Europoort project, but presently fully paid off) and co-financed by the Dutch government.
• Maasvlakte II is planned to be a €2.6 billion investment project and the financing approach will be similar to the ones used for the Maasvlakte I and Europoort projects. The dyke around the area will be subsidised and taken care of by the Dutch government, which participates in the company set up to develop Maasvlakte II. The port is expected to pay for the rest. 87
84 Interview with HbR on 5 July 2004. 85 Interview with HbR on 22 July 2004. 86 Interview with HbR on 22 July 2004. 87 Interview with HbR on 22 July 2004.
105
Report prepared for the NMa

Charle s
Rive r
Asso c iate s
5.7.2 INVESTMENTS IN OTHER PORTS
According to some industry experts, while in Antwerp the Belgian government has always been heavily involved in the financing of port investments, demanding that the port authority set attractively low rental (and other) prices in return, the port of Rotterdam had to finance its expansions mainly internally, which forced it to charge higher rents in order to repay its investments. This is widely considered to be an important reason for why, in the 1970s, Rotterdam was very interested in getting the large oil tankers: it needed the harbour dues to pay for its investments.88
Port financing systems are generally the same for all ports within one and the same country. According to industry experts, while the internal investment situation of German ports is similar to that of Rotterdam, Le Havre works under the French central system in which the larger part of finances is likely to come from the state. Moreover, there is a fundamental difference between continental ports and ports in the UK, which were privatised very early and have subsequently lobbied in Brussels for the start of a general debate about port privatisation. Industry experts have pointed out that any discussion about harbour dues should take the traditional differences in port financing into account.89
5.8 Lease-related prices in Rotterdam compared to other ports
We considered several studies in order to compare lease-related prices at Rotterdam with prices at other ports. All of the studies we analysed found that Rotterdam charges more than is asked for comparable sites at other ports in the HLH range.
In a study conducted by PriceWaterhouseCoopers on behalf of HbR in 2000, the port of Rotterdam was found to have significantly higher lease prices for both wet and dry sites than other ports. The results of the study are presented in the graphs below.
88 Interview with [confidential] on 12 July 2004. 89 Interview with [confidential] on 12 July 2004.
106
Report prepared for the NMa
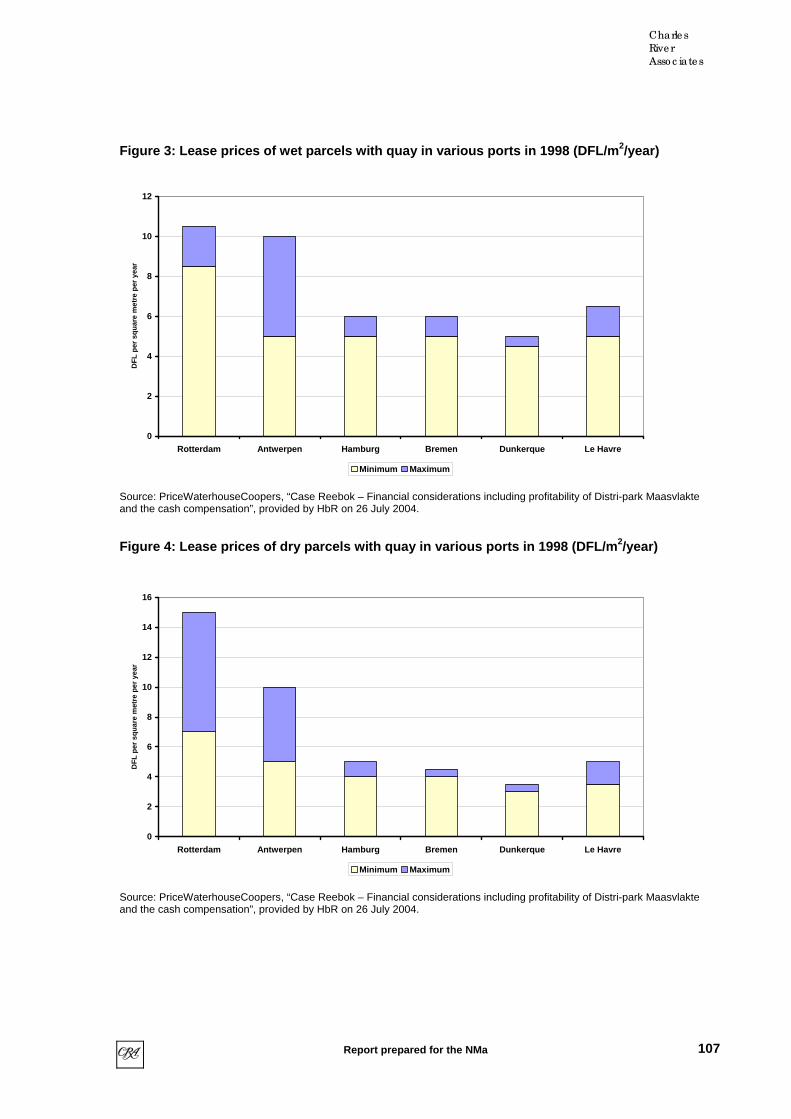
Charle s
Rive r
Asso c iate s
Figure 3: Lease prices of wet parcels with quay in various ports in 1998 (DFL/m 2/year)
0
2
4
6
8
10
12
Rotterdam Antwerpen Hamburg Bremen Dunkerque Le Havre
DF
L pe
r sq
uare
met
re p
er y
ear
Minimum Maximum Source: PriceWaterhouseCoopers, “Case Reebok – Financial considerations including profitability of Distri-park Maasvlakte and the cash compensation”, provided by HbR on 26 July 2004.
Figure 4: Lease prices of dry parcels with quay in various ports in 1998 (DFL/m 2/year)
0
2
16
4
6
8
10
12
14
DF
L pe
r sq
uare
met
re p
er y
ear
Rotterdam Antwerpen Hamburg Bremen Dunkerque Le Havre
Minimum Maximum Source: PriceWaterhouseCoopers, “Case Reebok – Financial considerations including profitability of Distri-park Maasvlakte and the cash compensation”, provided by HbR on 26 July 2004.
107
Report prepared for the NMa
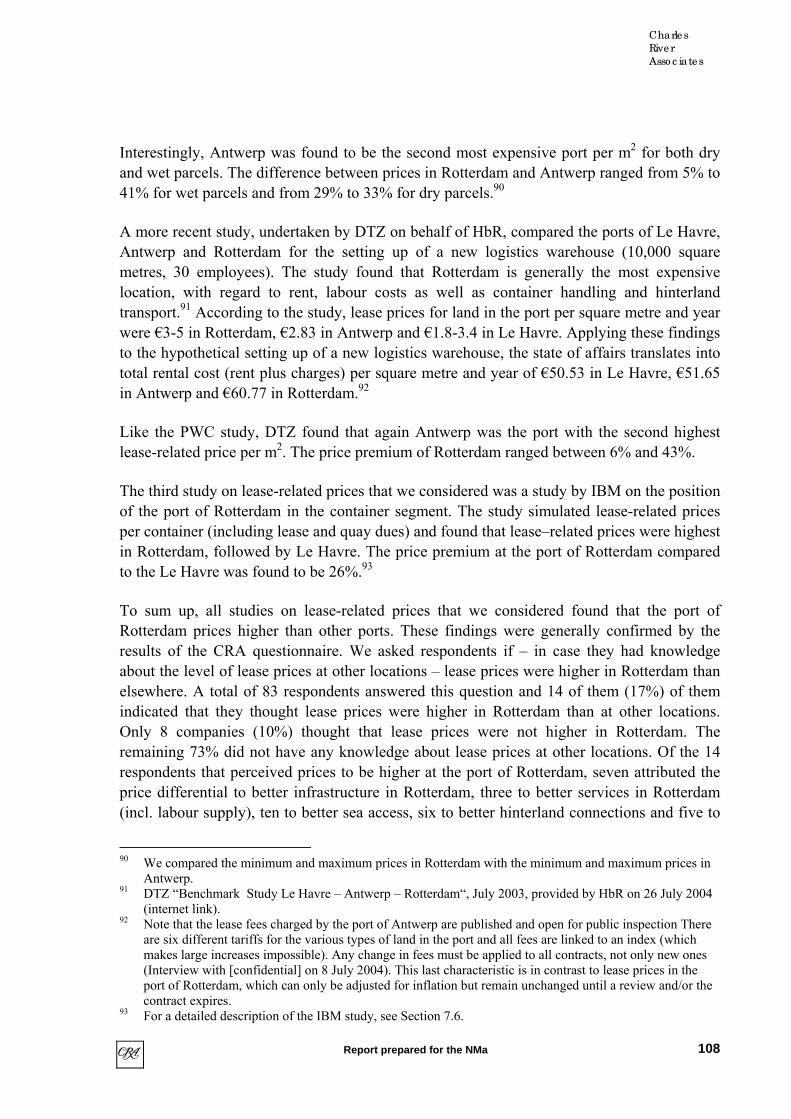
Charle s
Rive r
Asso c iate s
Interestingly, Antwerp was found to be the second most expensive port per m2 for both dry and wet parcels. The difference between prices in Rotterdam and Antwerp ranged from 5% to 41% for wet parcels and from 29% to 33% for dry parcels.90
osts as well as container handling and hinterland transport.91 According to the study, lease prices for land in the port per square metre and year
26%.
dam than elsewhere. A total of 83 respondents answered this question and 14 of them (17%) of them indicated that they thought lease prices were higher in Rotterdam than at other locations.
Rotterdam. The remaining 73% did not have any knowledge about lease prices at other locations. Of the 14
d five to
A more recent study, undertaken by DTZ on behalf of HbR, compared the ports of Le Havre, Antwerp and Rotterdam for the setting up of a new logistics warehouse (10,000 square metres, 30 employees). The study found that Rotterdam is generally the most expensive location, with regard to rent, labour c
were €3-5 in Rotterdam, €2.83 in Antwerp and €1.8-3.4 in Le Havre. Applying these findings to the hypothetical setting up of a new logistics warehouse, the state of affairs translates into total rental cost (rent plus charges) per square metre and year of €50.53 in Le Havre, €51.65 in Antwerp and €60.77 in Rotterdam.92
Like the PWC study, DTZ found that again Antwerp was the port with the second highest lease-related price per m2. The price premium of Rotterdam ranged between 6% and 43%.
The third study on lease-related prices that we considered was a study by IBM on the position of the port of Rotterdam in the container segment. The study simulated lease-related prices per container (including lease and quay dues) and found that lease–related prices were highest in Rotterdam, followed by Le Havre. The price premium at the port of Rotterdam compared to the Le Havre was found to be 93
To sum up, all studies on lease-related prices that we considered found that the port of Rotterdam prices higher than other ports. These findings were generally confirmed by the results of the CRA questionnaire. We asked respondents if – in case they had knowledge about the level of lease prices at other locations – lease prices were higher in Rotter
Only 8 companies (10%) thought that lease prices were not higher in
respondents that perceived prices to be higher at the port of Rotterdam, seven attributed the price differential to better infrastructure in Rotterdam, three to better services in Rotterdam (incl. labour supply), ten to better sea access, six to better hinterland connections an
90 We compared the minimum and maximum prices in Rotterdam with the minimum and maximum prices in
Antwerp. 91 DTZ “Benchmark Study Le Havre – Antwerp – Rotterdam“, July 2003, provided by HbR on 26 July 2004
(internet link). 92 Note that the lease fees charged by the port of Antwerp are published and open for public inspection There
are six different tariffs for the various types of land in the port and all fees are linked to an index (which makes large increases impossible). Any change in fees must be applied to all contracts, not only new ones (Interview with [confidential] on 8 July 2004). This last characteristic is in contrast to lease prices in the port of Rotterdam, which can only be adjusted for inflation but remain unchanged until a review and/or the contract expires.
93 For a detailed description of the IBM study, see Section 7.6.
108
Report prepared for the NMa

Charle s
Rive r
Asso c iate s
better synergies with other companies than in other locations. Note that the questionnaire allowed for multiple answers.94
According to HbR, the port authority is well aware of the difference between lease prices in Rotterdam and other ports, as well as non-port locations. However, HbR believes that potential tenants would not decide against being established or establishing themselves within the port of Rotterdam as location on the basis of a price difference of €1-2 per m2.95
operly and that there might be a potential risk of HbR having or abusing market power. Following our indicative
With regard to tenants that are bound to the port (in particular to the customers and cargo
our benchmarking results suggest that HbR uses both pricing instruments to extract any potential rents from port tenants and users. Based
in locating at the port of Rotterdam. In such a case, the rent that is likely to follow from HbR’s market power would be shared between the port authority and the new tenant,
5.9 Market power with regard to the renting out of land
Our analyses set out in the previous sections allow us to draw several conclusions regarding the pricing of HbR with regard to leases. As already mentioned, it is important to distinguish port-bound and non-port bound tenants as well as existing tenants and new tenants.
With regard to tenants that are not port-bound, we have seen no evidence that competition between port and non-port locations is not working pr
categorisation of tenants in Table 20, this finding is relevant for forwarding and shipping companies as well as finance and consultancy companies. In general, non-port bound tenants are companies that could provide exactly the same service to exactly the same customers from a non-port location elsewhere.
flows in the port), the assessment of potential market power is likely to vary between new tenants and existing tenants.
For new port-bound tenants that are tied to a specific cargo type or group of cargo types (e.g. containers or iron ore and coal), market power can in the short run be derived from today’s market power analysis with regard to the provision of infrastructure for the respective cargo type. As explained in Section 5.3, there is a close interaction between harbour dues and lease prices. HbR tends to see them as a bundle and
on our results of the cargo type analysis (see Sections 7 to 10), there is evidence that HbR has market power with regard to all cargo types, with market power being more limited for roll-on/roll-off. This means that conceptually, HbR is also likely to have market power with regard to lease prices for new tenants that are port-bound.
Note that in exceptional cases, there may only be one provider of a specific service interested
94 CRA questionnaire. 95 Interview with HbR on 22 July 2004.
109
Report prepared for the NMa

Charle s
Rive r
Asso c iate s
distributed according to the outcome of the bargaining on the respective lease price. Yet, the overall welfare effects would not be changed.
In cases of new port-bound tenants that are not directly linked to a specific cargo type, generally the same logic applies. However, instead of deriving the potential level of market power of HbR directly from the port’s position in the respective cargo type segment, one would need to take into account the mix of cargo types that the tenant serves. The link to cargo types can be either direct or indirect, e.g. via customers of the tenants that are in turn tied to (a mix of) specific cargo types. Given our general finding of market power for all cargo types, HbR can be expected to have market power also vis-à-vis port-bound tenants that are not directly linked to a single cargo type.96
Conceptually, based on our findings in the cargo type analyses, the derived demand for land parcels of port bound tenants should provide HbR with market power for lease prices. However, in reality there are limits to the port authority’s ability to exercise pricing power for lease prices. This stems from the fact that – as explained in detail in Section 5.6 – there is currently only very limited availability of new land. Also, only a small fraction of the total area suitable for renting out will become freely available for price negotiations with new tenants until the end of 2007. Hence, while pricing power with regard to new port-bound tenants is conceptually likely, it is unlikely to be an issue in practice.
Finally, we turn to existing port-bound tenants. From the price review process set out in HbR’s standard lease contracts (see Section 5.4 for a detailed discussion), it follows that reviewed lease prices for existing tenants depend on the pricing of recent new tenants when it comes to the re-negotiation point.97 Hence, to the extent that HbR may possess market power vis-à-vis new port-bound tenants, there is the possibility that this market power could have an effect on the review of lease prices of existing tenants. However – as explained above – while this is conceptually possible, it is highly unlikely that HbR would be able to exercise any pricing power with regard to new port-bound tenants. This implies that the port authority would also not be able to exercise any market power derived from the demand for specific cargo types vis-à-vis existing port-bound tenants.
96 By definition, the only chance for the port-bound tenant to get access to its potential customers and/or the
cargo flows at the port is to locate at the port. Hence, tenants should be willing to pay a rent premium to the port authority in order to be able to be active in that market. The port authority could extract part of that rent for given prices by auctioning the services.
97 Note that the recent new tenants used in this benchmarking process must be comparable to the tenant whose lease price is under review. Hence, one could for example not derive higher prices for a coal terminal operator from higher lease prices charged to a small coal trader that recently settled on the port territory.
110
Report prepared for the NMa
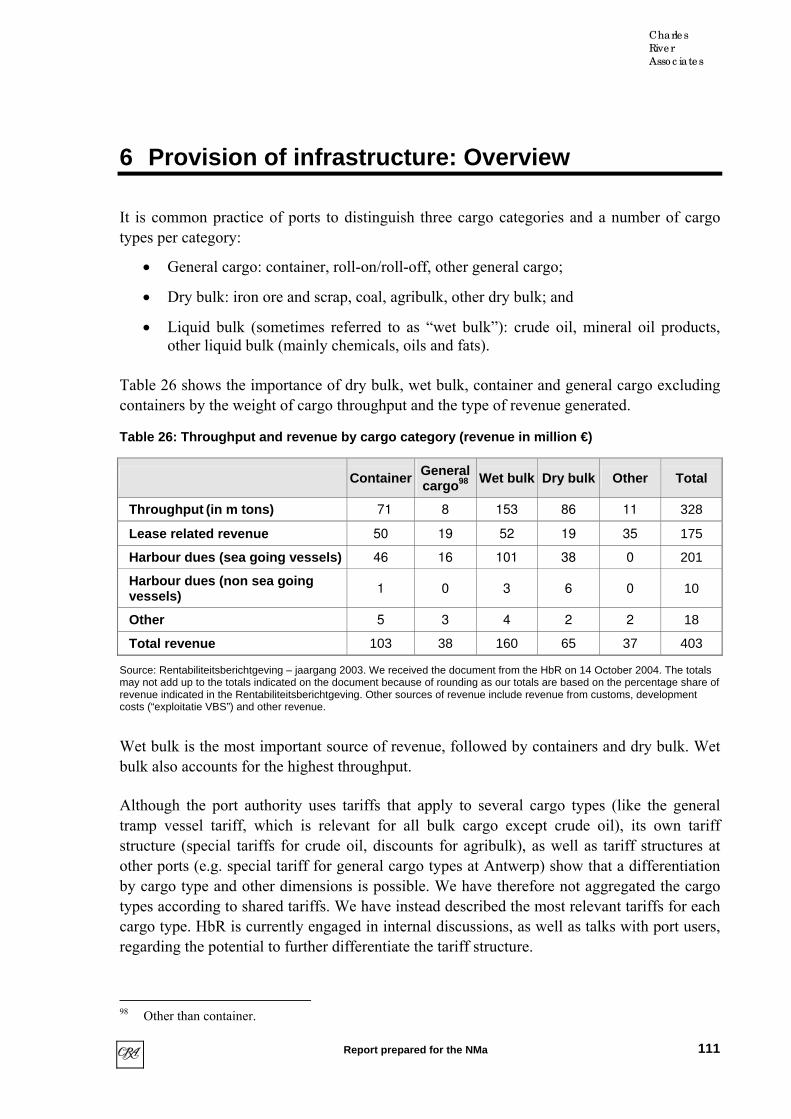
Charle s
Rive r
Asso c iate s
6 Provision of infrastructure: Overview
It is common practice of ports to distinguish three cargo categories and a number of cargo types per category:
• General cargo: container, roll-on/roll-off, other general cargo;
• Dry bulk: iron ore and scrap, coal, agribulk, other dry bulk; and
• Liquid bulk (sometimes referred to as “wet bulk”): crude oil, mineral oil products, other liquid bulk (mainly chemicals, oils and fats).
Table 26 shows the importance of dry bulk, wet bulk, container and general cargo excluding containers by the weight of cargo throughput and the type of revenue generated.
Table 26: Throughput and revenue by cargo category (revenue in million €)
Container General cargo 98 Wet bulk Dry bulk Other Total
Throughput (in m tons) 71 8 153 86 11 328
Lease related revenue 50 19 52 19 35 175
Harbour dues (sea going vessels) 46 16 101 38 0 201
Harbour dues (non sea going vessels) 1 0 3 6 0 10
Other 5 3 4 2 2 18
Total revenue 103 38 160 65 37 403
Source: Rentabiliteitsberichtgeving – jaargang 2003. We received the document from the HbR on 14 October 2004. The totals may not add up to the totals indicated on the document because of rounding as our totals are based on the percentage share of revenue indicated in the Rentabiliteitsberichtgeving. Other sources of revenue include revenue from customs, development costs (“exploitatie VBS”) and other revenue.
Wet bulk is the most important source of revenue, followed by containers and dry bulk. Wet bulk also accounts for the highest throughput.
Although the port authority uses tariffs that apply to several cargo types (like the general tramp vessel tariff, which is relevant for all bulk cargo except crude oil), its own tariff structure (special tariffs for crude oil, discounts for agribulk), as well as tariff structures at other ports (e.g. special tariff for general cargo types at Antwerp) show that a differentiation by cargo type and other dimensions is possible. We have therefore not aggregated the cargo types according to shared tariffs. We have instead described the most relevant tariffs for each cargo type. HbR is currently engaged in internal discussions, as well as talks with port users, regarding the potential to further differentiate the tariff structure.
98 Other than container.
111
Report prepared for the NMa

Charle s
Rive r
Asso c iate s
In the following we discuss general cargo, with a focus on containers, the roll-on/roll-off and “other general cargo”. We then move on to discuss dry bulk (iron ore and scrap, coal, agribulk, other dry bulk) and liquid bulk (crude oil, mineral oil products, and “other liquid bulk”).
112
Report prepared for the NMa

7 Containers
7.1 Overview
The container business of the port of Rotterdam is generally considered as the most competitive cargo type that goes through the port.99
“The biggest competitive battle between the ports takes place in the container sector. Rotterdam’s most important competitors in this market segment are Hamburg and Antwerp.”100
Containers are standardised, i.e. each container terminal operator can handle containers without further specialisation, and generally containers do not contain input for industry located at the port. It is generally considered as non-captured cargo that could, in principle, be dealt with at any port with a container terminal.101 This is also confirmed by our survey, which shows that many operators consider a large part of their volume as non-captive volume. In the current situation, we nevertheless conclude that HbR has pricing power relative to its rival ports.
There is clear evidence and general agreement that, of all ports in the HLH range, the port of Antwerp is the most relevant alternative port for the port of Rotterdam. Both share similar catchment areas and offer a good network in hinterland connections. An analysis of the call pattern of container lines shows that most lines call at either of the two ports, some at both. There are only very few lines that call at a German port and not also at either Rotterdam or Antwerp. This suggests that there is a qualitative difference between the competition between the two Benelux ports on the one hand and between Rotterdam and the German ports (in particular Hamburg) on the other. This is also confirmed by the analysis of the cargo flows, which shows that the overlap of the catchment areas of Antwerp and Rotterdam is far bigger than the overlap of the catchment areas of Hamburg and the two Benelux ports.
Yet, despite the relevance of Antwerp as an alternative port we find significant price differences. According to data provided by HbR the harbour dues for deap-sea container vessels at the port of Rotterdam are significantly higher than at the port of Antwerp - the larger the vessels, the higher the difference in the harbour dues. For typical vessels employed on the transatlantic and the Far-East trade, harbour dues in Antwerp are 38, respectively 50 percent lower than in Rotterdam.
The general impression that HbR has pricing power relative to its rival ports is confirmed by further analysis. Other ports in the HLH charge even lower fees for the typical vessels
99 Interview with [confidential] on 8 July 2004. Interview with HbR. 100 HbR Annual Report 2004, p. 13. 101 With more and more cargo types being containerised, we may see more port bound containers in the future.
Report prepared for the NMa

Charle s
Rive r
Asso c iate s
analysed. Simulations of lease related revenue per container shows that again Antwerp is significantly less expensive than Rotterdam (39 percent).
There is no evidence that the price difference can be explained, for example, by a better quality of the services provided by HbR.102 The main reason for the price difference provided by HbR is that Rotterdam offers better sea-side access than Antwerp, deap-sea vessels do not have to travel four to five extra hours on the river Schelde to get to the terminals in Antwerp and the same amount of time back to the sea. Moreover, larger vessels, for which the price differences is also the largest, face additional tidal constraints at Antwerp, which can lead to additional waiting hours, as these do not trouble the access to Rotterdam.
A study that has been provided by HbR shows that harbour dues at Rotterdam are about €14 per container, which is only a small part of the generalised cost of routing a shipment through a port. The same study provided by HbR shows, for example, that other port related costs are €130 per container in Rotterdam and that hinterland transport cost from Rotterdam to Genk are €191, to Frankfurt/Main €359 and to Prague €735. Using Genk as a lower bound on hinterland cost, the data suggest that harbour dues are at most four percent of the relevant route cost of €335.103 Indeed, when including the full cost of the sea-transport this share would be much lower. Thus, an increase of harbour dues by 10% increases the costs of routing the cargo through the port by at most 0.4 percent.
This relationship between harbour dues and generalised costs of a particular rout is relevant for the assessment of the profitability of a price increase by HbR. Generally, if costs do not vary with quantity, a small price increase is profitable if the elasticity of demand for the service provided is below one. However, if customers have to buy a bundle of goods and services, like in the port example, the calculation is different. Using the container example mentioned above, suppose costs of HbR that are related to the provision of infrastructure do not vary with the container throughput. Based on the €14 harbour dues and the total route cost (excluding additional sea transport compared to Le Havre) of €335, one can compute a critical demand elasticity with respect to total route cost. These calculations show that an increase in harbour dues by 10% would be profitable if the firm elasticity of demand with respect to total route cost was below 24. That is, only if less than 24% of the volume were lost in response to a 1% increase of the total route cost of €335, the increase in harbour dues would be profitable. If part of the volume is bound to the port, for instance because the cargo is used at or close to the port, or because of specific investments of the carrier, the critical elasticity on the remaining volume is higher. Moreover, the exemplary calculation is based on the observed level of harbour dues. If these reflect pricing power, the required elasticity would be even higher, which is less likely at lower prices. More generally the point of the
102 If comments about services that can be influenced by HbR were made, they related to public services (like
customs or scanning) provided by HbR . Other comments were made relative to services provided by ECT, the largest container terminal in the port. The comments invariably pointed to lower quality in Rotterdam than in Antwerp.
103 The analysis underestimates the potential to increase prices as the current prices are likely to reflect some pricing power as argued above.
114
Report prepared for the NMa

Charle s
Rive r
Asso c iate s
calculations is that the fact that HbR controls only a small part of the total route costs, it is more likely to have an incentive to implement a small percentage increase in prices than otherwise.
We have found no convincing evidence of switching between services in response to changes in harbour dues. According to HbR, “[t]here are no examples of explicit pricing related switching. It is always a combination of service, time, price, quality, etc. Coming closest to this kind of switching are the withdrawals of some container services from Maersk (AE2 2001 to Antwerp) and P&ONL (loop D 2001 to Antwerp)”. [confidential] However, subsequent research did not confirm that these switches were motivated by changes in the relative level of harbour dues, but rather by other considerations. In another document, HbR also pointed to the merger of Maersk and Sealand and subsequent restructuring of networks as a reason for the switching of cargo from Rotterdam to Antwerp.
We did, however, receive evidence on switching in response to changes in total call costs. Shippers and carriers are also concerned about competition between stevedores, which account for the bulk of port related costs. Thus, there can be competition between ports without harbour dues necessarily being a critical factor. More generally, the pricing power of the port authority also depends on the intra-port competition of stevedores. If they skim off a large part of the locational rent at Rotterdam (e.g. the competitive advantage of better deep-sea access) through the rents, there is less pricing power for the port authority in harbour dues. If the stevedores face strong intra-port competition, there is more pricing power for the port authority as the joint possibilities for rent extraction are limited.
Our results suggest a ranking of rival ports in terms of their relevance. Antwerp is by far the most important alternative port. This result is confirmed by the analysis of call pattern, hinterland, our survey results and general perception of industry experts. The survey evidence suggests that the next most important alternative ports are the two German ports, with Hamburg coming first, followed by Bremerhaven. The ARA range ports then follow, with Amsterdam being in a clear waiting position.
There is clear evidence of capacity constraints for container handling at Antwerp. Thus, in the short-run the potential competitive threat of Antwerp does not significantly constrain the pricing of the port authority of Rotterdam as switching to Antwerp is limited by the short-run absorption possibilities of the latter. More generally, market power of port authorities (and stevedores) increases with capacity utilisation.
The evidence currently available indicates that the port of Rotterdam has pricing power in the container business. Based on the price differences compared to Antwerp and other ports in the HLH range and the current capacity constraints at Antwerp, and having taken regards of the differences in quality between the services offered elsewhere, HbR’s provision of infrastructure for container vessels would currently constitute a relevant market as harbour dues set by HbR are more than 5 to 10 percent higher than those at the other ports, where port authorities provide essentially the same services with regard to the provision of infrastructure.
115
Report prepared for the NMa

Charle s
Rive r
Asso c iate s
A number of qualifying and explanatory comments are due in order to put this conclusion into context.
Our argumentation needs to be followed with care. It relates, for example, to pricing decisions taken on harbour dues only. Inter-port competition can still be perceived as vigorous. The point is that for the routing decisions of port users the pricing and the quality of other port-related services and hinterland transportation matter much more.
One focus of our analysis is on existing price differentials between ports.104
HbR provides discounts to some container lines. According to HbR almost all shipping lines benefit from these discounts, reflecting reductions in the order of 20 to 30 percent. In 2004 discounts will be equivalent to about €16 million. Some discounts are lump sum, others partly dependent on the amount of cargo. We have not received more detailed information on these discounts. However, HbR explicitly confirmed that in their view the benchmarking data that we used provides a good picture of relative pricing of the different ports.
Pricing power within the container segment varies depending on a number of factors. Pricing power of the port of Rotterdam increases with the size of the vessels. Since the largest vessels are deployed on the Far East trade, this is also the trade where the port has the most substantial pricing power (and, indeed, the highest prices and the highest market share). For some hinterland destinations (origins) cargo is bound to the port. For transhipment cargo is less bound. While this situation is more likely to affect the pricing of feeder traffic than that related to deep-sea vessels, it provides a further argument that pricing power increases with vessel size.
We have not been tasked to explore any issues related to the financing of the ports. Evidence of pricing power relative to rival ports is therefore not necessarily indication of excessive returns by the port authority relative to costs. HbR has recently moved to a new cost accounting system. Based on this system the current return is 4.3 percent for the containers and distribution market segment. These results depend critically on the depreciation and valuation techniques used for the asset base.
In our analysis we have taken the capacities as given and focussed on short-run pricing power. In the long-run ports are engaged in capacity competition as well. Pricing power at preferential locations can be beneficial for consumers if it attracts more investments at these locations than at less suitable locations.
There are a number of critical developments that are likely to change the competitive situation in the long run. Antwerp is planning to significantly increase container-handling capacity in the second half of next year. After a phasing in period, this will release the
116
Report prepared for the NMa

Charle s
Rive r
Asso c iate s
capacity constraint if presently faces. Also, if container growth rates continue as they were in the last few years, and Amsterdam keeps offering much lower harbour dues and terminal handling dues, it may eventually attract business. This may induce other port users to follow thus tipping the market. This, in turn, would ease capacity constraints at existing locations. Other smaller ports in the region have furthermore gained importance and are planning to expand. APM recently signed a letter of intent to operate a container terminal in Zeebrugge. Other ports, like Wilhelmshaven are expected to significantly increase capacity. ECT and P&ONL are potentially building and operating a new terminal at Rotterdam. At the same time vessel size increases and draught restrictions for ports like Antwerp and Hamburg become more binding.
7.2 Port users
The port of Rotterdam hosts a number of large container terminals that provide stevedoring services for deep-sea container ships.
Figure 5 shows the six container related tenants in the port that generate the most revenues for HbR. By far the largest operator of container handling services is ECT (European Container Terminals, formerly European Combined Terminals), owned by one of the largest terminal operating companies, Hutchison Whampoa Limited (HWL). The next largest is APM Terminals Rotterdam (formerly Maersk Delta), which belongs to the A.P. Møller – Mærsk Group which also operates liner shipping services. The two largest container terminals, the Delta terminal of ECT and the APM terminal, are each situated at the Maasvlakte, close to the sea. ECT also operates a second terminal, the Home Terminal, in the Waalhaven/Eemhaven, where other smaller terminals are situated too.
ECT’s Home Terminal can handle ships with a capacity of up to 5,500 TEU. The Maasvlakte terminals have no capacity restrictions. ECT, for example, states that its Delta Terminal is capable of handling the latest and future generations of container vessels with a capacity of 8,000 to 12,000 TEU. ECT has also stakes in some of the smaller container terminals. Waalveem, for example, is a fully owned subsidiary. It furthermore has a 50% share in Rotterdam Short Sea Terminals. All large container terminals at the port of Rotterdam are open to all shipping lines.
Figure 5: Harbour dues and lease-related revenues generated for HbR by the largest container and distribution customers (2003)
[confidential]
Source: Based on information received from HbR on 14 Oct 2004
104 The consultants that undertook the benchmarking study for HbR that yielded the simulation results reported
above concluded that there was no room for HbR to increase either lease related fees or harbour dues. This does, of course, have no implications regarding the pricing power reflected in existing prices.
117
Report prepared for the NMa
Charle s
Rive r
Asso c iate s
In the coming years, a new container terminal is to be built on the northwest corner of the Maasvlakte in Rotterdam. The so-called Euromax terminal is scheduled to have a quay length of 1,800 metres, a draught of 19.65 metres and a surface of 100 ha (which can all be extended in a second phase). The port of Rotterdam will carry out the construction and dredging, while Euromax, a 50/50 joint venture between P&O Nedlloyd (PONL) and ECT will develop, build and operate the terminal. The works is expected to begin in the first half of 2005 and should be completed by the end of 2008. The new terminal will be progressively operational after 2007. Over the next fifteen years, container traffic is expected to grow at about 8% per year and, according to HbR, the capacity added by Euromax is expected to be sufficient to accommodate traffic growth until 2011.105
Contracts between stevedores and liners are usually short-term (1-2 years). According to HbR the bargaining power of stevedoring companies is growing.106 In the HLH range, there are 1-2 terminal operators in each port. Liners would like to see more “hub ports” like Rotterdam, with one provider of infrastructure, but 5-6 terminal operators.107
Table 27 provides the throughput in TEUs of the ten largest shipping lines at each terminal in Rotterdam, as well as the percentage relative to total port container throughput. Apart from providing an additional indication of the size of the terminals, these data show the importance to HbR of several of the larger customers for the terminals. Altogether the ten largest customers account for [confidential] percent of the total container throughput of the port of Rotterdam.
105 [confidential] and
http://www.portofrotterdam.com/news/UK/Pressreleases/Pressreleases/HBR_28062004_01.asp?ComponentID=57244&SourcePageID=0.
106 Interview with HbR on 5 July 2004. 107 Interview with [confidential] on 6 July 2004.
118
Report prepared for the NMa

Charle s
Rive r
Asso c iate s
Table 27: Terminal operators in the port of Rotterdam – cargo throughput of top 10 customers at each terminal (TEU)
2003 2002
Cargo throughput of terminal (TEU)
Share of total port
container throughput
Cargo throughput of terminal (TEU)
Share of total port
container throughput
ECT DELTA [confidential] [confidential] [confidential] [confidential]
ECT HOME [confidential] [confidential] [confidential] [confidential]
APM [confidential] [confidential] [confidential] [confidential]
RST [confidential] [confidential] [confidential] [confidential]
HANNO [confidential] [confidential] [confidential] [confidential]
UNIPORT [confidential] [confidential] [confidential] [confidential]
Total throughput top 10 customers [confidential] [confidential] [confidential] [confidential]
Total port throughput 7,107,000 100% 6,506,000 100%
Source: CRA calculations based on Port Statistics 2003 and data provided by HbR on 26 July 2004.
Table 28 shows the most important container customers of the port of Rotterdam in terms of income generated through harbour dues.
Table 28: Top four container clients at the port of Rotterdam in 2003 in terms of harbour dues
Name of liner company Harbour dues paid in 2003 Share of total income out of seagoing vessels harbour
dues in 2003
[confidential] [confidential] [confidential]
[confidential] [confidential] [confidential]
[confidential] [confidential] [confidential]
[confidential] [confidential] [confidential]
Source: Information provided by HbR on 16 September 2004.
The shipping lines determine the network, decisions such as which ports a line calls at, the sequence in which it does so, the terminals, etc. For a large number of shipments, the customers of the shipping lines make the final choice for a specific port within that network.
For the analysis that follows it is important to note that, as described above, there are two large and a number of smaller container terminals at the port of Rotterdam that provide container handling services. The largest capacities are situated at Maasvlakte, which has no restrictions on the size of the container vessels that can be handled.
119
Report prepared for the NMa

Charle s
Rive r
Asso c iate s
7.3 Throughput and capacity of c ontainer ports in North Europe
Table 29 shows the container throughput in the Hamburg-Le Havre range between 1996 and 2003. Table 30 lists the corresponding market shares. Note that container throughput in Vlissingen and Terneuzen is not included in the table. The market shares of total container throughput for each of these ports for the years 2000-2003 remained below 1%.108
Table 29: Container th roughput in million tons
1996 1997 1998 1999 2000 2001 2002 2003
Hamburg 31 35.2 36.1 40 45.3 49.8 57.2 64.3
Bremen/Bremerhaven 15.7 17.4 18.3 21.7 27.5 29.3 30 31.8
Amsterdam 1.7 0.8 0.5 0.6 0.8 0.7 0.7 0.7
Rotterdam 52.9 58.6 61.6 66.3 65.1 62.2 65.8 70.6
Antwerp 29.5 33.4 35.4 39.4 44.5 46.4 53 61.4
Gent 0.1 0.2 0.2 0.2 0.1 0.2 0.2 0.2
Zeebrugge 6.2 7.6 9.1 10 11.6 10.6 11.9 12.3
Dunkerque 0.7 0.8 1 1.1 1.3 1.4 1.5 1.5
Le Havre 9.5 11.2 12.2 12.8 13.8 14.6 16.8 19
Total 147.3 165.2 174.4 192.1 210 215.2 237.1 261.8
Source: Information provided by HbR on 16 September 2004. Vlissingen and Terneuzen are not included as the market shares of total container throughput for each of the ports for the years 2000-2003 was below 1%.
Table 30: Market shares based on container throughput in million tons
1996 1997 1998 1999 2000 2001 2002 2003
Hamburg 21 21 21 21 22 23 24 25
Bremen/Bremerhaven 11 11 10 11 13 14 13 12
Amsterdam 1 0 0 0 0 0 0 0
Rotterdam 36 35 35 35 31 29 28 27
Antwerp 20 20 20 21 21 22 22 23
Gent 0 0 0 0 0 0 0 0
Zeebrugge 4 5 5 5 6 5 5 5
Dunkerque 0 0 1 1 1 1 1 1
Le Havre 6 7 7 7 7 7 7 7
Total 100 100 100 100 100 100 100 100
Totals may not add up to 100 due to rounding. Source: Information provided by HbR on 16 September 2004. Vlissingen and Terneuzen are not included as the market shares of total container throughput for each of the ports for the years 2000-2003 was below 1%.
108 Based on statistics obtained from the website of the Ports of Zeeland (http://www.zeeland-seaports.com).
120
Report prepared for the NMa
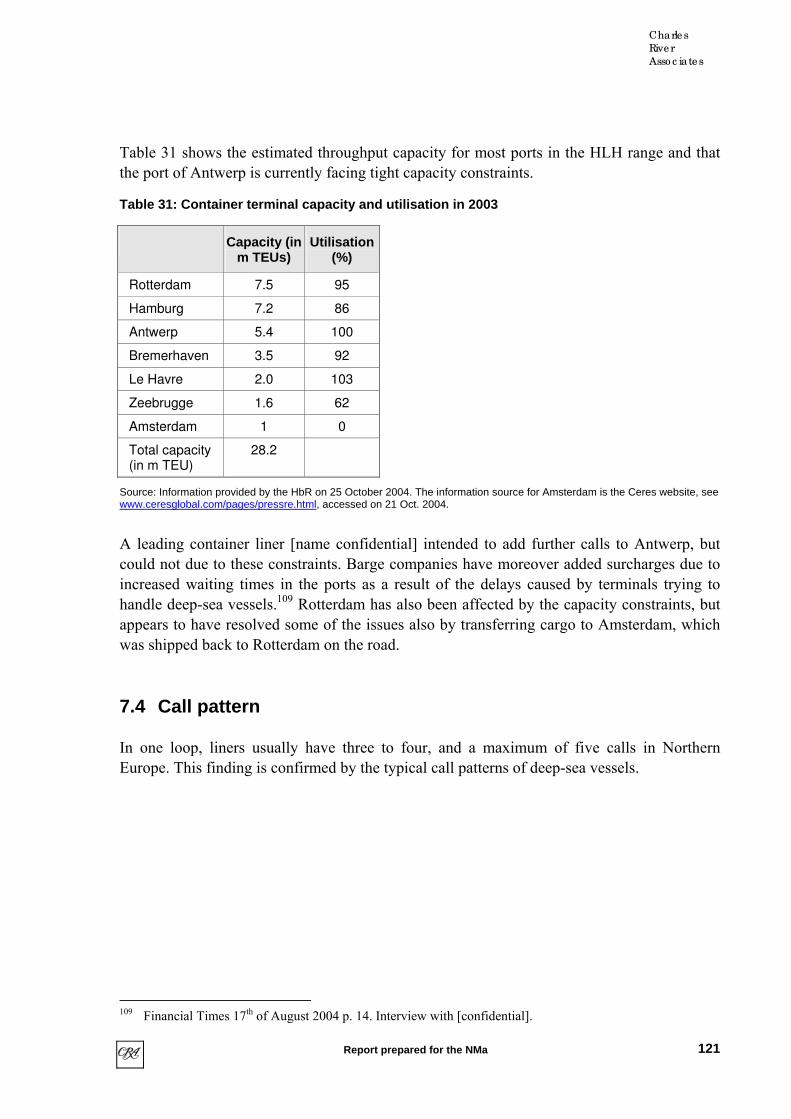
Charle s
Rive r
Asso c iate s
Table 31 shows the estimated throughput capacity for most ports in the HLH range and that the port of Antwerp is currently facing tight capacity constraints.
Table 31: Container terminal capacity and utilisation in 2003
Capacity (in m TEUs)
Utilisation (%)
Rotterdam 7.5 95
Hamburg 7.2 86
Antwerp 5.4 100
Bremerhaven 3.5 92
Le Havre 2.0 103
Zeebrugge 1.6 62
Amsterdam 1 0
Total capacity (in m TEU)
28.2
Source: Information provided by the HbR on 25 October 2004. The information source for Amsterdam is the Ceres website, see www.ceresglobal.com/pages/pressre.html, accessed on 21 Oct. 2004.
A leading container liner [name confidential] intended to add further calls to Antwerp, but could not due to these constraints. Barge companies have moreover added surcharges due to increased waiting times in the ports as a result of the delays caused by terminals trying to handle deep-sea vessels.109 Rotterdam has also been affected by the capacity constraints, but appears to have resolved some of the issues also by transferring cargo to Amsterdam, which was shipped back to Rotterdam on the road.
7.4 Call pattern
In one loop, liners usually have three to four, and a maximum of five calls in Northern Europe. This finding is confirmed by the typical call patterns of deep-sea vessels.
109 Financial Times 17th of August 2004 p. 14. Interview with [confidential].
121
Report prepared for the NMa
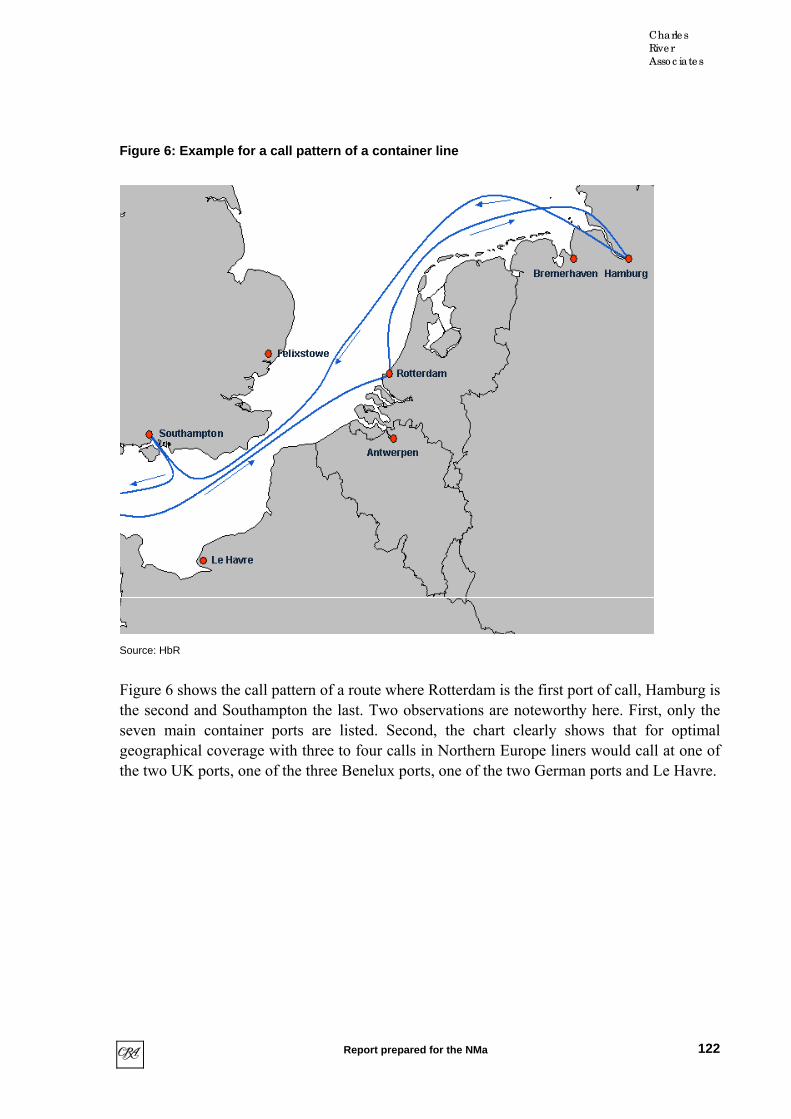
Charle s
Rive r
Asso c iate s
Figure 6: Example for a call pattern of a container line
Source: HbR
Figure 6 shows the call pattern of a route where Rotterdam is the first port of call, Hamburg is the second and Southampton the last. Two observations are noteworthy here. First, only the seven main container ports are listed. Second, the chart clearly shows that for optimal geographical coverage with three to four calls in Northern Europe liners would call at one of the two UK ports, one of the three Benelux ports, one of the two German ports and Le Havre.
122
Report prepared for the NMa

Charle s
Rive r
Asso c iate s
Table 32: Europe Far-East trade: ports of call in North Europe and capacity of trade lines
Carrier String RTM ANR HAM BRV SOU FXT LEH Other
EU ports
Average
capacity110
Annualised
capacity111
Loop A 6405 580820
Loop B 5776 523778
Loop C 5709 517748
Loop D (GIT) 7455 644985
Loop E (CAG
3642 88713Gra
nd A
lliance
Loop G (GIT) 3533 232758
AE1 (CAG) 7850 641479
AE2 (GIT) 6357 435968
Maerk
s
Seala
nd
AE5 (GOT) 7815 566112
Japan Exp. JEX (MOL)
6211 563248
Asia Exp. AEX (HMM)
5570 481852
New
World
Alli
ance (
AP
L,
HM
M,
MO
L)
China Exp. CEX (APL)
5343 436614
CES (Cosco) 5446 493874
AES 1 (K Line) 5596 457277
AES 2 (Yangming)
5554 477035
PDS (Hanjin) 4458 372214
NEX (Hanjin/Yangmi
n)
5591 472071Cosco/K
Lin
e/Y
an
gm
in/H
anjin
/Se
nato
r (C
KY
H)
CEX (Hanjin/Cosco)
5469 495949
United Arab (UASC)
AEC (THP) 3802 54950
WAE (Evergreen)
(THP) (ZEE)
5172 422628
Evergreen/Lloyd Triestino CEM (Lloyd
Triestino/Evergreen)
(THP) 5364 390223
MSC Silk Express 6716 436751
CMA CGM/Norasia
FAL (CAM CGM)
(ZEE) 6659 295541
110 Capacity is measured in TEU. 111 Total annualised capacity is the sum of Westbound and Eastbound annualised capacity.
123
Report prepared for the NMa

Charle s
Rive r
Asso c iate s
NCX (CMA CGM/Norasia/
APL) (ZEE)
4212 92070
Sunda Express (CMA
CGM/Norasia/APL)
(ZEE) (PIR)
2739 162420
China Shipping China Shipping 5620 423483
CMA CGM/Contship/P&O Nedloyd/Marfret
550 44835
Total annualised capacity in TEU 10,805,396
Source: Drewry Shipping Consulting Ltd, Drewry Container Quarterly, December 2003.Trade routes where information on ports called at or on total annualised capacity was missing were omitted from the above analysis.
A first observation from Table 32 and Table 33 is that for the majority of carriers and strings German ports are not a substitute for Benelux ports. Table 32 reveals that only one out of 27 strings on the Far East trade, representing 1.5% percent of the total annualised capacity on the routes analysed, does not cover both a German port and a Benelux port. However, an exception is the Sunda Express of the CMA CGM Norasia alliance, which calls at Zeebrugge (not shown in the table). For the case of transatlantic trade, Table 33 shows that five out of 23 strings do not call at both a German and a Benelux port, representing 5% of the total capacity analysed.
A second observation is that the majority of lines for a specific trade route chooses either Antwerp or Rotterdam: 21 lines representing 82% of the analysed capacity of the Far East trade call either in Rotterdam or in Antwerp and 18 lines representing 72% of the analysed capacity for transatlantic trade. However, the number of strings calling at either Antwerp or Rotterdam and Hamburg or Bremerhaven is slightly smaller: 19 out of 27 lines (representing 72% of the total analysed capacity) call at both a German port and a Benelux port. In the case of transatlantic trade, 12 out of 23 trade lines call at one of the German ports and one of the Benelux ports, covering 55% of total capacity analysed.
124
Report prepared for the NMa

Charle s
Rive r
Asso c iate s
Table 33: Europe transatlantic trade: ports of call in North Europe and capacity of trade lines
Carrier String RTM ANR HAM BRV SOU FXT LEH Other
EU ports
Average
Capacity
Annualised capacity
Grand Alliance PAX
(THP) 4751 401298
Grand Alliance ATX/NAX
2931 275050
Grand Alliance SGX/GAX
2931 275050
Lykes (Gulf loop 1) (THP) 3000 281608
Gra
nd
Alli
an
ce
/CP
Sh
ips
TMM (Hapag-Lloyd/Lykes (Gulf
Loop 2)
(THP) 3028 284218
Maersk Sealnd TA2
3477 326322
Maersk Sealnd TA3/Andean
2682 125876
Ma
ers
k
Se
ala
nd
/Ne
w
Wo
rld
Alli
an
ce
New World Alliance APX (TA1)
4218 336514
Atlantic 3818 358300
MSC 3432 322094
MS
C/C
osc
o/H
an
jin/K
L
ine
/Ya
ng
min
g
MSC 3665 292416
Eastabout (ZEE) (TIL)
4113 38603
CM
A
CG
M/P
&O
N
ed
lloyd
/Co
nts
hip
/Ma
rfr
et
Westabout (TIL) (DKK)
2308 27077
ACL (GOT) 1850 183282
Atlanticcargo (TIL) 32850
Evergreen NUE (THT) 4085 325876
Italia/Lykes/TMM (THP) 2439 20606
Star Shipping 400 17280
Oth
ers
Melbridge Container Line
1015 3334
Canmar/OCCL 1 X (THP) 3500 328500
Canmar/OCCL 2 (MTR) 2633 247158
Cast (LPL) 2174 204046
Maersk Sealand/PONL/MESC X 2936 275596
Total annualised capacity in TEU 4,982,954
Source: Drewry Shipping Consulting Ltd, Drewry Container Quarterly, December 2003. Trade routes where information on ports called at and information on capacity was missing were omitted from the analysis.
125
Report prepared for the NMa

Charle s
Rive r
Asso c iate s
Although the general pattern therefore is that typically one of the Benelux ports is chosen for a call, some liners call at both Antwerp and Rotterdam in one string. In the case of Far East and transatlantic trade, five strings include both Antwerp and Rotterdam. On the level of alliances, the majority (10 out 16 alliances) of the Far East and transatlantic alliances call at both ports. One argument for having relationships with both ports is to keep up competition between the two. Also, multi-port calling is done to ensure that there is a potential substitute destination if something goes wrong in one of the ports (e.g. vessel collision or explosion of an oil tanker that blocks a port for some time).112
Zeebrugge is served by the CMA CGM/Contship/P&O Nedloyd/Marfret alliance on both trade routes and once by the Evergreen/Lloyd Triestino alliance on the Far East/Europe trade route. Other than Zeebrugge, no alternative port in the Benelux and northern France, neither the ports of Vlissingen, Amsterdam, or Wilhelmshaven are called at by the shipping lines analysed. Dunkirk is called at once by the CMA CGM/P&O Nedlloyd/Contship/Marfret alliance. We discuss potential entry by alternative ports in Section 7.13.
Comparing the frequency and capacity of strings calling at Antwerp and Rotterdam also shows the relative strengths of these two ports with regard to different trades. The annualised capacity share of the analysed lines on the Far East route calling at Antwerp is low, representing only 30% of the total capacity analysed. Antwerp’s role is much more significant with regard to transatlantic trade, with 15 strings calling at Antwerp, covering 77% of the total capacity analysed. Conversely, Rotterdam is significant with regard to Far East trade, with strings covering 88% of the annualised capacity analysed calling at Rotterdam and less significant with regard to transatlantic trade, with strings covering 51% of the annualised analysed capacity calling at Rotterdam.
The ports regard some carriers as their “home carriers”. For example, for the Benelux call on the transatlantic trade, Maersk calls only at Rotterdam and never at Antwerp. On the Far-East trade, only one of the three Maersk lines call at Antwerp. However, Maersk, which also operates a container terminal at Rotterdam, has recently moved strings to Antwerp.
The sequence of ports called at depends to a large extent on the trade route. As shown in Table 34 below, Antwerp is never the port of first call for lines on the Far East trade. This is likely to reflect the fact that the largest vessels are usually employed on that trade, which is also a traditional strength of the port of Rotterdam. For this particular trade route, ports of first call include Rotterdam, followed by Southampton and Hamburg. However, as Table 35 shows, Antwerp is port of first call on the transatlantic trade route for nine out of 27 trade routes, compared to Rotterdam who is port of first call for only three trade routes.
112 Interview with [confidential].
126
Report prepared for the NMa

Charle s
Rive r
Asso c iate s
Table 34: Sequence of calls on the Far-East/Europe trade (27 trade routes)
Rotterdam Antwerp Hamburg Bremer-haven
South-ampton
Felixtowe Le Havre
1st port of call 8 0 4 0 5 4 4
2nd
port of call 11 2 9 1 0 1 0
3rd
port of call 3 1 7 2 3 4 0
4th port of call 1 4 0 1 1 1 3
Source: Drewry Shipping Consulting Ltd, Drewry Container Quarterly, December 2003
Table 35: Sequence of call for Transatlantic/Europe trade (23 trade routes)
Rotterdam Antwerp Hamburg Bremer-haven
South-ampton
Felixtowe Le Havre
1st port of call 3 9 1 2 1 0 1
2nd
port of call 2 2 1 6 0 2 1
3rd
port of call 1 3 2 3 0 3 3
4th port of call 5 0 0 1 0 0 2
Source: Drewry Shipping Consulting Ltd, Drewry Container Quarterly, December 2003
In the Europe/Mid-East/South Asia trade a similar pattern emerges. Lines usually call at one of the two large Benelux ports (Antwerp or Rotterdam) and at one of the German ports (Hamburg or Bremerhaven). In fact, Hamburg is usually the first port of call, followed by Antwerp. Rotterdam is only called at once for the nine shipping routes.
In order to assess the comprehensiveness of the available data, Table 36 indicates the relative importance of the alliances analysed above in terms of their market share of total cargo throughput in TEUs in the port of Rotterdam in 2003. The alliances analysed in Table 32 and Table 33 represent around [confidential] percent of the total container throughput of the port of Rotterdam in 2003.113
113 The remaining alliances or lines analysed by the Drewry Shipping Quarterly are not listed in the top 40
alliances and hence we do not have data for these remaining alliances on the TEU throughput in Rotterdam. However the Top 40 alliances represent [confidential]of total throughput of the port of Rotterdam.
127
Report prepared for the NMa

Charle s
Rive r
Asso c iate s
Table 36: Market share of alliances in total TEU throughput in 2003 in the port of Rotterdam
Alliance Market share of alliance
Grand Alliance [confidential]
Maersk Sealand [confidential]
CKYH [confidential]
Evergreen/Lloyd Triestino [confidential]
CMA-CGM [confidential]
CSCL China Shipping Container Lines Co. [confidential]
Star Shipping [confidential]
MSC [confidential]
New World Alliance [confidential]
Melbridge Container Line [confidential]
OCCL [confidential]
UASC United Arab Shipping Corporation [confidential]
Others114
[confidential]
Total cargo throughput in 2003 (7,107,000 TEUs) 100.00%
Totals may not add up to 100 due to rounding. Source: Based on information received from the HbR on 26th July 2004. Although P&O Nedloyd is part of the CMA CGM/Contship/Marfret alliance in the transatlantic trade, it is also part of the Grand Alliance in the Europe Far East trade. The market share was calculated assuming that P&O Nedloyd is part of the Grand Alliance (P&O Nedloyd’s independent market share is 8%). Similarly, APL is also part of both the New World Alliance and CMA CGM/Norasia and was added to the New World Alliance. Maersk Sealand and New World Alliance are part of one alliance in the Europe transatlantic trade.
The analysis confirms that generally three main hinterland regions are distinguished for container terminal operators:
1. “North Continent West”, which comprises all terminals in the range between Rouen and Amsterdam, with competitive pressures primarily focused between Antwerp and Rotterdam, with additional capacity at Le Havre;
2. “North Continent East” consists primarily of the ports of Bremerhaven and Hamburg;
3. The “United Kingdom/Ireland market” encompasses the British Isles and includes the major United Kingdom gateway terminals.
As a fourth region, the “Scandinavia/Baltic market” can be identified. However, this market is primarily served by feeder links from terminals located in one or more of the three regions identified above.115
114 This includes liners calling at Rotterdam but not listed in Tables 32 and 33 and liners not part of the Top 40
listed in the data received from the HbR. The Top 40 alliances accounted for [confidential]of total cargo throughput in TEU of the port of Rotterdam in 2003.
115 See Regulation (EEC) No 4064/89 dated 03/07/2001, p. 12.
128
Report prepared for the NMa

Charle s
Rive r
Asso c iate s
In the Hutchison/RCPM/ECT decision, the Commission reports a number of quotes that indicate that competition from Southern European ports is seen as very limited and therefore excluded from the analysis.116 Moreover, it is concluded that the United Kingdom/Ireland and the continental markets constitute separate relevant product markets. The European Commission does not investigate whether the two markets in the North Continent (West and East) are to be considered as separate relevant product markets. However, it states that it can be concluded from market studies that there is a significant degree of overlap between the various North Continent hinterland markets.117 Note an important distinction between the market for terminal services and the market for providing port infrastructure. While terminal handling costs are largely charged per TEU, harbour dues are largely based on ship characteristics and not on the cargo loaded and discharged. Thus, from a harbour’s point of view, the number of calls is more important than the actual throughput. Stevedorers are concerned about throughput.
In a benchmarking study on the competitive position of the port of Rotterdam with regard to container services, PWC, in agreement with the task force of the port authority of Rotterdam, selected seven alternative ports to be studied in a benchmarking exercise. The selection was based on the geographic position and the existing hinterland connections and modes of transports available at the ports. The selected ports were Rotterdam, Vlissingen, Antwerp, Hamburg, Wilhelmshaven, Le Havre, and Felixstowe (PWC 2001). In a later update of the study, different ports were selected: Rotterdam, Antwerp, Hamburg, Bremerhaven, Le Havre (IBM 2003).
The port authorities in Antwerp and in Rotterdam both consider each other as the most important competitor in container services. There is little disagreement on the fact that Antwerp is the most relevant alternative to the port of Rotterdam.118
7.5 Structure of harbour dues and other relevant prices
In the port of Rotterdam, there are two tariffs for “container vessels in liner service”, depending on whether less or more than 51.3% of the GT of the vessel is loaded and/or discharged in the port. If the quantity of cargo moved is equal or higher than 51.3% of the vessels GT, the applicable tariff is a fixed fee per GT of the vessel. If the share of quantity moved is lower than 51.3% of the vessel’s GT, an additional fee per metric ton of moved cargo is levied.
116 See Regulation (EEC) No 4064/89 dated 03/07/2001, pp. 12 to 14. 117 See Regulation (EEC) No 4064/89 dated 03/07/2001, p. 14. 118 Statement by the HbR representative and statement by [confidential].
129
Report prepared for the NMa
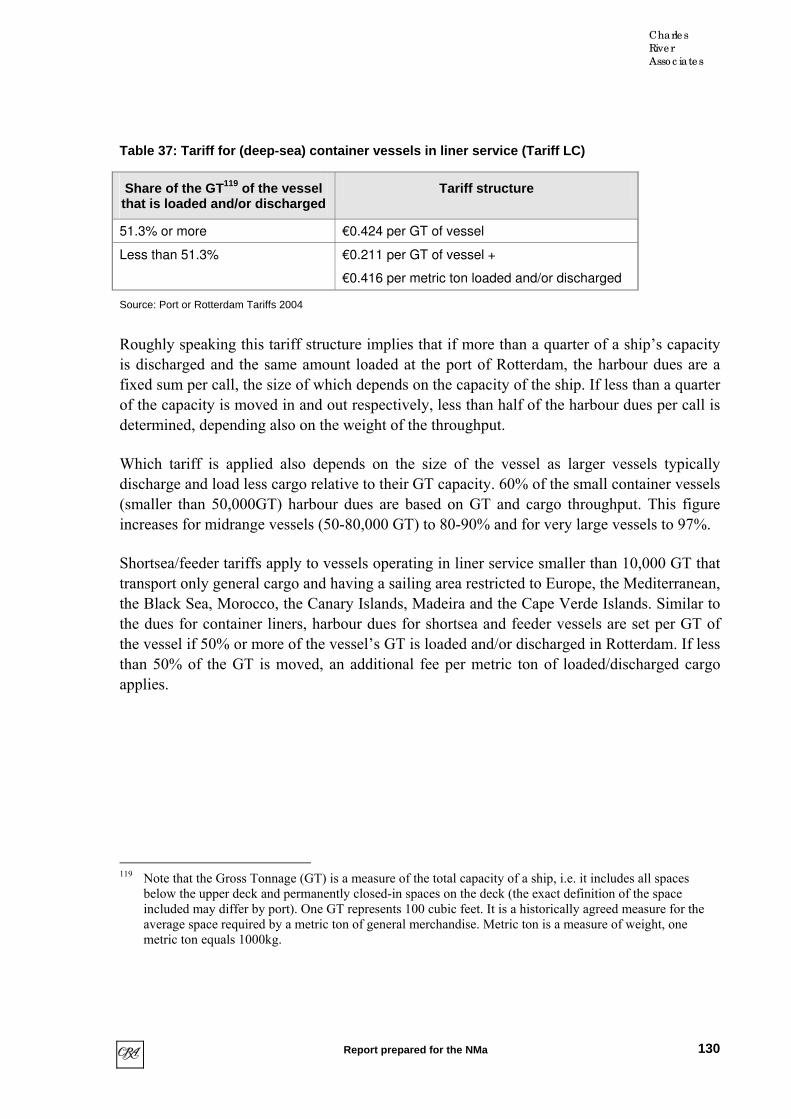
Charle s
Rive r
Asso c iate s
Table 37: Tariff for (deep-sea) container vessels in liner service (Tariff LC)
Share of the GT 119 of the vessel that is loaded and/or discharged
Tariff structure
51.3% or more €0.424 per GT of vessel
Less than 51.3% €0.211 per GT of vessel +
€0.416 per metric ton loaded and/or discharged
Source: Port or Rotterdam Tariffs 2004
Roughly speaking this tariff structure implies that if more than a quarter of a ship’s capacity is discharged and the same amount loaded at the port of Rotterdam, the harbour dues are a fixed sum per call, the size of which depends on the capacity of the ship. If less than a quarter of the capacity is moved in and out respectively, less than half of the harbour dues per call is determined, depending also on the weight of the throughput.
Which tariff is applied also depends on the size of the vessel as larger vessels typically discharge and load less cargo relative to their GT capacity. 60% of the small container vessels (smaller than 50,000GT) harbour dues are based on GT and cargo throughput. This figure increases for midrange vessels (50-80,000 GT) to 80-90% and for very large vessels to 97%.
Shortsea/feeder tariffs apply to vessels operating in liner service smaller than 10,000 GT that transport only general cargo and having a sailing area restricted to Europe, the Mediterranean, the Black Sea, Morocco, the Canary Islands, Madeira and the Cape Verde Islands. Similar to the dues for container liners, harbour dues for shortsea and feeder vessels are set per GT of the vessel if 50% or more of the vessel’s GT is loaded and/or discharged in Rotterdam. If less than 50% of the GT is moved, an additional fee per metric ton of loaded/discharged cargo applies.
119 Note that the Gross Tonnage (GT) is a measure of the total capacity of a ship, i.e. it includes all spaces
below the upper deck and permanently closed-in spaces on the deck (the exact definition of the space included may differ by port). One GT represents 100 cubic feet. It is a historically agreed measure for the average space required by a metric ton of general merchandise. Metric ton is a measure of weight, one metric ton equals 1000kg.
130
Report prepared for the NMa
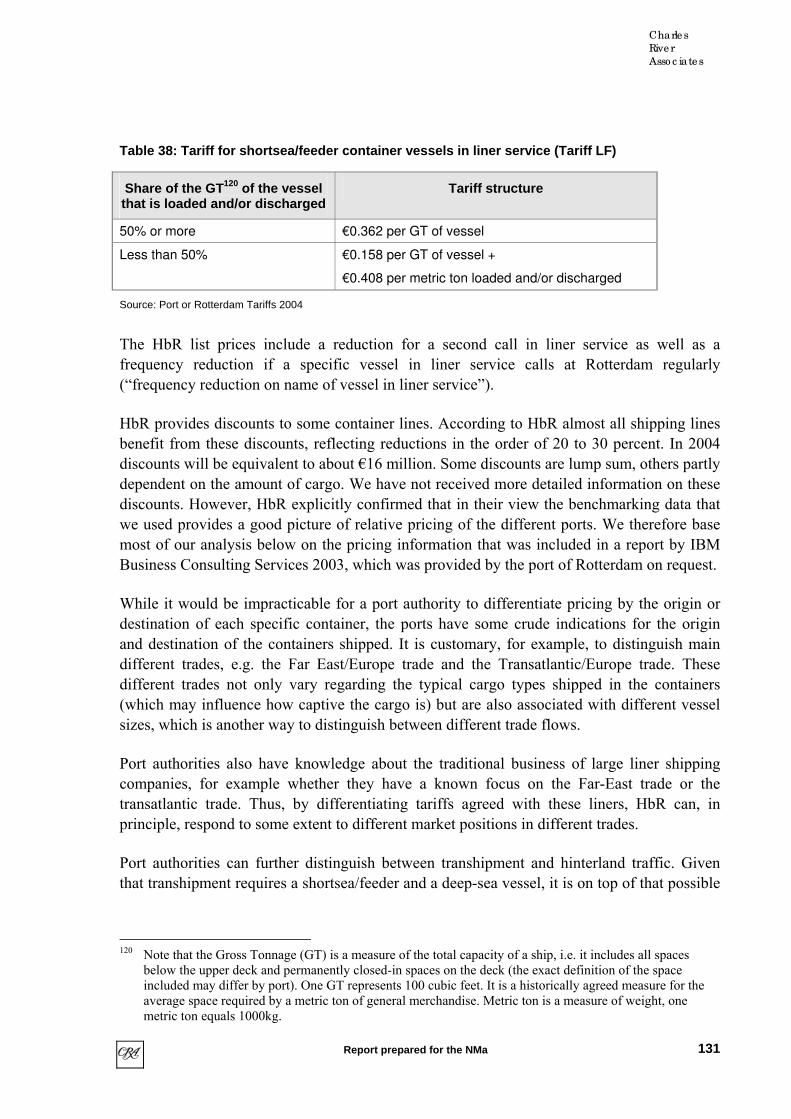
Charle s
Rive r
Asso c iate s
Table 38: Tariff for shortsea/feeder contai ner vessels in liner service (Tariff LF)
Share of the GT 120 of the vessel that is loaded and/or discharged
Tariff structure
50% or more €0.362 per GT of vessel
Less than 50% €0.158 per GT of vessel +
€0.408 per metric ton loaded and/or discharged
Source: Port or Rotterdam Tariffs 2004
The HbR list prices include a reduction for a second call in liner service as well as a frequency reduction if a specific vessel in liner service calls at Rotterdam regularly (“frequency reduction on name of vessel in liner service”).
HbR provides discounts to some container lines. According to HbR almost all shipping lines benefit from these discounts, reflecting reductions in the order of 20 to 30 percent. In 2004 discounts will be equivalent to about €16 million. Some discounts are lump sum, others partly dependent on the amount of cargo. We have not received more detailed information on these discounts. However, HbR explicitly confirmed that in their view the benchmarking data that we used provides a good picture of relative pricing of the different ports. We therefore base most of our analysis below on the pricing information that was included in a report by IBM Business Consulting Services 2003, which was provided by the port of Rotterdam on request.
While it would be impracticable for a port authority to differentiate pricing by the origin or destination of each specific container, the ports have some crude indications for the origin and destination of the containers shipped. It is customary, for example, to distinguish main different trades, e.g. the Far East/Europe trade and the Transatlantic/Europe trade. These different trades not only vary regarding the typical cargo types shipped in the containers (which may influence how captive the cargo is) but are also associated with different vessel sizes, which is another way to distinguish between different trade flows.
Port authorities also have knowledge about the traditional business of large liner shipping companies, for example whether they have a known focus on the Far-East trade or the transatlantic trade. Thus, by differentiating tariffs agreed with these liners, HbR can, in principle, respond to some extent to different market positions in different trades.
Port authorities can further distinguish between transhipment and hinterland traffic. Given that transhipment requires a shortsea/feeder and a deep-sea vessel, it is on top of that possible
120 Note that the Gross Tonnage (GT) is a measure of the total capacity of a ship, i.e. it includes all spaces
below the upper deck and permanently closed-in spaces on the deck (the exact definition of the space included may differ by port). One GT represents 100 cubic feet. It is a historically agreed measure for the average space required by a metric ton of general merchandise. Metric ton is a measure of weight, one metric ton equals 1000kg.
131
Report prepared for the NMa

Charle s
Rive r
Asso c iate s
to differentiate prices between transhipment and hinterland traffic by setting the prices of the shortsea/feeder ships.
7.6 Benchmarking
7.6.1 HARBOUR DUES
In order to get a first indication of pricing power by HbR in the relevant harbour dues for the container market, as well as to give proper attention to the cellophane fallacy problem in doing so, we compare the harbour dues and lease-related prices per TEU (container) or per ton (other cargo). In the short-run port authorities do not have the means to influence the quality of the basic service of providing port infrastructure such as quay walls, jetties and roads.121 Thus, a higher price does not reflect a better service provided by the port authority.. This means that higher pricing of the port of Rotterdam would then be an indication of pricing power relative to the relevant alternative ports.122 Note that the reverse conclusion is not possible. That is, if harbour dues for comparable services do not differ between ports, this may well reflect that current prices are competitive. However, it would also be consistent with ports operating in different relevant markets, and each port having pricing power, or, in fact, with collusion among the ports. Indications of differences in harbour dues, therefore, are an indication of pricing power relative to rival ports.
The benchmarking approach that this logic suggests is relatively simple for those cargo types for which comparative pricing data exists. It also is meaningful regarding the assessment of pricing power reflected in existing prices. However, it does not answer the question whether there is scope to increase prices (which we address in the following sections).
HbR has provided us with comparative information on harbour dues for typical vessels for containers. These statistics show the harbour dues per container for the main alternative ports.
121 Port authorities do, however, maintain the existing infrastructure, for example by dredging. 122 Higher prices at the port of Rotterdam may also reflect different policies regarding the financing of
investments. Pricing power relative to competing ports does not have a direct implication for an assessment of welfare in a dynamic context.
132
Report prepared for the NMa
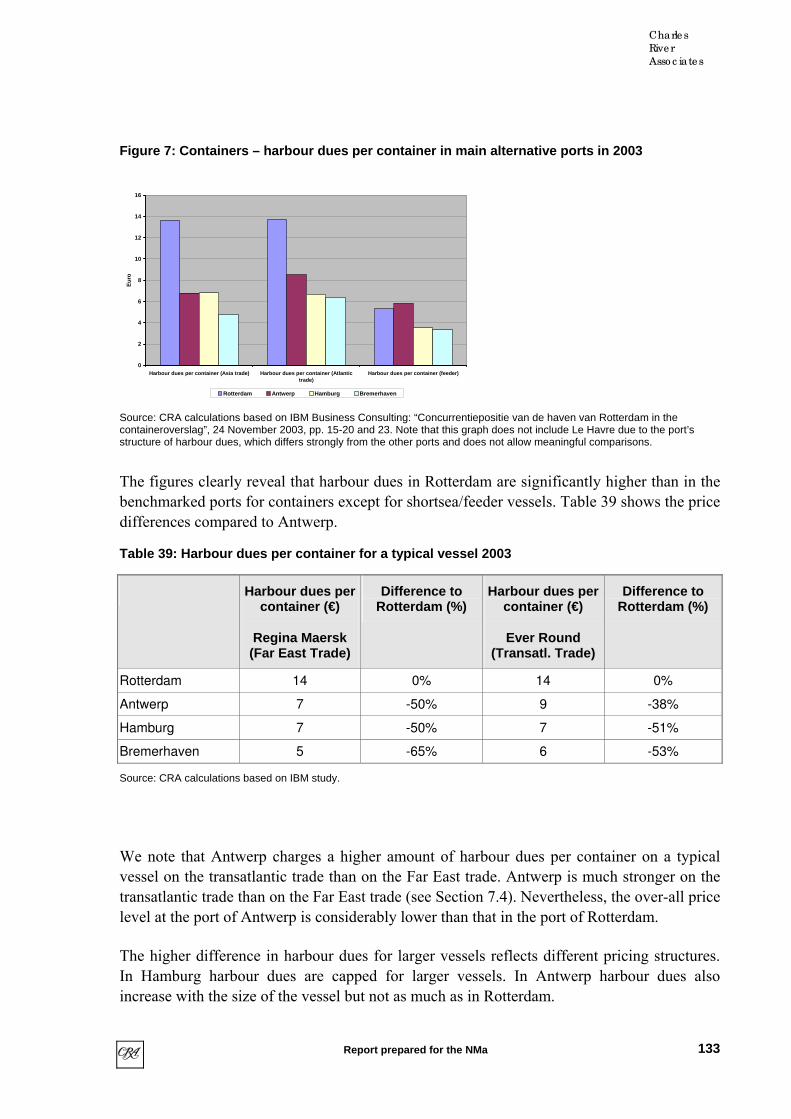
Charle s
Rive r
Asso c iate s
Figure 7: Containers – harbour dues per container in main alternative ports in 2003
0
2
4
6
8
10
12
14
16
Harbour dues per container (Asia trade) Harbour dues per container (Atlantictrade)
Harbour dues per container (feeder)
Eur
o
Rotterdam Antwerp Hamburg Bremerhaven Source: CRA calculations based on IBM Business Consulting: “Concurrentiepositie van de haven van Rotterdam in the containeroverslag”, 24 November 2003, pp. 15-20 and 23. Note that this graph does not include Le Havre due to the port’s structure of harbour dues, which differs strongly from the other ports and does not allow meaningful comparisons.
The figures clearly reveal that harbour dues in Rotterdam are significantly higher than in the benchmarked ports for containers except for shortsea/feeder vessels. Table 39 shows the price differences compared to Antwerp.
Table 39: Harbour dues per container for a typical vessel 2003
Harbour dues per container (€)
Regina Maersk (Far East Trade)
Difference to Rotterdam (%)
Harbour dues per container (€)
Ever Round (Transatl. Trade)
Difference to Rotterdam (%)
Rotterdam 14 0% 14 0%
Antwerp 7 -50% 9 -38%
Hamburg 7 -50% 7 -51%
Bremerhaven 5 -65% 6 -53%
Source: CRA calculations based on IBM study.
We note that Antwerp charges a higher amount of harbour dues per container on a typical vessel on the transatlantic trade than on the Far East trade. Antwerp is much stronger on the transatlantic trade than on the Far East trade (see Section 7.4). Nevertheless, the over-all price level at the port of Antwerp is considerably lower than that in the port of Rotterdam.
The higher difference in harbour dues for larger vessels reflects different pricing structures. In Hamburg harbour dues are capped for larger vessels. In Antwerp harbour dues also increase with the size of the vessel but not as much as in Rotterdam.
133
Report prepared for the NMa

Charle s
Rive r
Asso c iate s
The benchmarking analysis therefore suggests that current pricing for container services reflects pricing power. Indeed, the difference to those ports, which are considered as the most relevant alternatives to Rotterdam is significant. This suggests that if the port of Rotterdam were to charge the same prices as Antwerp or Amsterdam, it could profitably raise prices by more than 5 to 10%. Thus, the evidence suggests that the services of the port of Rotterdam are to be considered the relevant geographic market. The finding in the benchmarking section has no implications for the ability to raise prices further. HbR and other ports offer discounts to the shipping lines. We have not received evidence on these discounts and have therefore used the data provided by HbR.
For completeness, we report the harbour dues for feeder ships below. These will be discussed more extensively in the section on transhipment.
Table 40: Harbour dues per container for a typical feeder ship 2003
Harbour dues per container (€)
Difference to Rotterdam (%)
Rotterdam 5 0%
Antwerp 6 10%
Hamburg 4 -33%
Bremerhaven 3 -37%
Source: CRA calculations based on IBM study
7.6.2 LEASE RELATED PRICES
In the benchmarking study provided by HbR, lease related costs in Rotterdam, Antwerp, Hamburg, Bremerhaven and Le Havre were compared. The comparison (see Table 41) shows that in this respect, Rotterdam is also the most expensive port in this group of European ports. We briefly discussed the results of this study in Section 5. Here we discuss the results in more depth.
134
Report prepared for the NMa
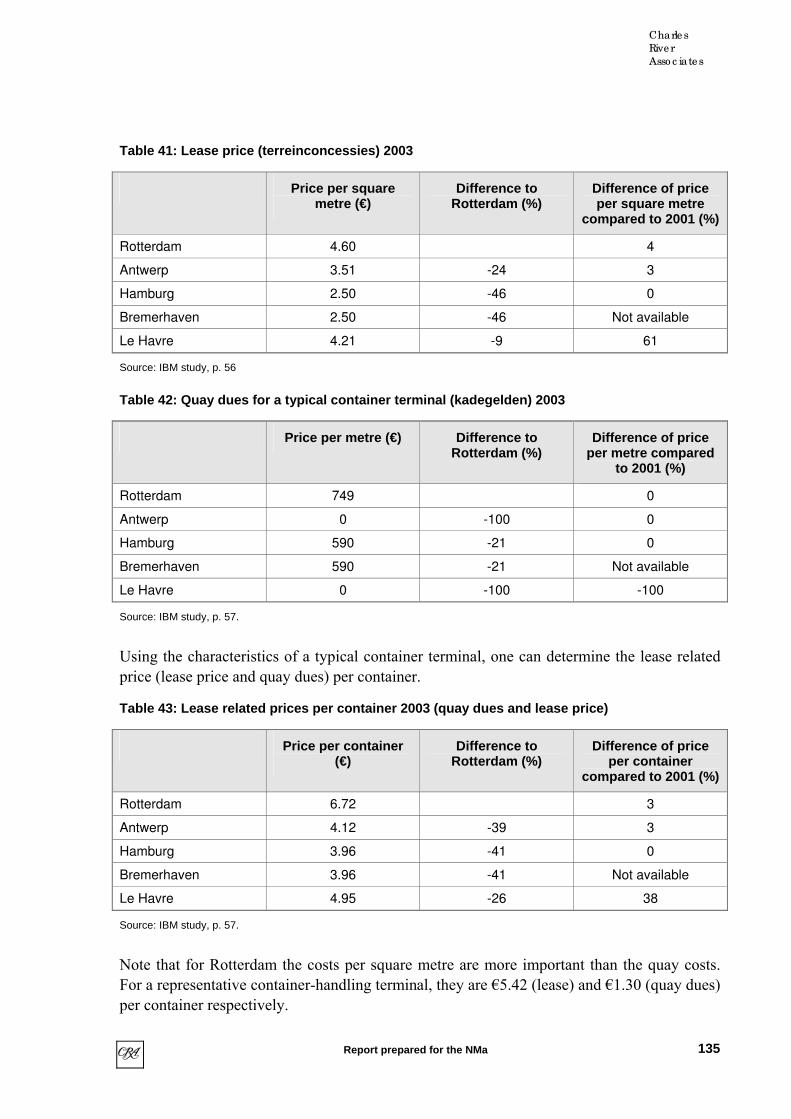
Charle s
Rive r
Asso c iate s
Table 41: Lease price (terreinconcessies) 2003
Price per square metre (€)
Difference to Rotterdam (%)
Difference of price per square metre
compared to 2001 (%)
Rotterdam 4.60 4
Antwerp 3.51 -24 3
Hamburg 2.50 -46 0
Bremerhaven 2.50 -46 Not available
Le Havre 4.21 -9 61
Source: IBM study, p. 56
Table 42: Quay dues for a typical container terminal (kadegelden) 2003
Price per metre (€) Difference to Rotterdam (%)
Difference of price per metre compared
to 2001 (%)
Rotterdam 749 0
Antwerp 0 -100 0
Hamburg 590 -21 0
Bremerhaven 590 -21 Not available
Le Havre 0 -100 -100
Source: IBM study, p. 57.
Using the characteristics of a typical container terminal, one can determine the lease related price (lease price and quay dues) per container.
Table 43: Lease related prices per container 2003 (quay dues and lease price)
Price per container (€)
Difference to Rotterdam (%)
Difference of price per container
compared to 2001 (%)
Rotterdam 6.72 3
Antwerp 4.12 -39 3
Hamburg 3.96 -41 0
Bremerhaven 3.96 -41 Not available
Le Havre 4.95 -26 38
Source: IBM study, p. 57.
Note that for Rotterdam the costs per square metre are more important than the quay costs. For a representative container-handling terminal, they are €5.42 (lease) and €1.30 (quay dues) per container respectively.
135
Report prepared for the NMa

Charle s
Rive r
Asso c iate s
7.6.3 LEASE RELATED PRICES AND HARBOUR DUES
In this section we combine the results from both analyses above. The results presented in Table 44 and Table 45 show that lease related fees and harbour dues are the highest in Rotterdam, followed by Antwerp which charges 38% (typical vessel transatlantic trade) to 46% (typical vessel Far East trade) less than Rotterdam.
Table 44: Lease related fees and harbour dues per typical container on the Far East trade 2003 (Regina Maersk)
Lease related cost per container (€)
Harbour dues per container (€)
Sum (€) Difference to Rotterdam (%)
Rotterdam 7 14 20 0%
Antwerp 4 7 11 -46%
Hamburg 4 7 11 -47%
Bremerhaven 4 5 9 -57%
Source: CRA calculations based on IBM study.
Table 45: Lease related fees and harbour dues per typical container on the transatlantic trade 2003
Lease related cost per container (€)
Harbour dues per container (€)
Sum (€) Difference to Rotterdam (%)
Rotterdam 7 14 20 0%
Antwerp 4 9 13 -38%
Hamburg 4 7 11 -48%
Bremerhaven 4 6 10 -49%
Source: CRA calculations based on IBM study.
The tables show that also when taking into account the lease payments Rotterdam charges significantly more than Antwerp.
7.7 Cargo flow analysis: Overview
A complementary approach to the harbour dues benchmarking method is to analyse cargo flows. If for a given origin-destination pair we know the different cost elements in the transport chain for shipping the cargo through alternative ports, we can determine the maximum differential of harbour dues that is possible before the shipper would be indifferent between the destinations (assuming constant quality between ports). If for a given type of cargo a large quantity of cargo flows are captive in the sense that it would not be moved to another port if harbour dues (or lease-related prices) were to increase by 5%, this would suggest that a 5% price increase would be profitable. The better the available data, the finer
136
Report prepared for the NMa
Charle s
Rive r
Asso c iate s
an analysis is possible. If the analysis reveals, however, that it would not be possible for a port to profitably raise prices, this would suggest that one would have to add competing ports and analyse whether such a price increase would be profitable for them if they were to raise prices jointly (as in the hypothetical monopolist or “SSNIP” test). This analysis assumes that existing prices are fairly competitive in the sense that price-cost margins are not too large.
The analysis needs to be complemented with a number of further elements including the analysis of capacity constraints, limited port choice due to draught restrictions, and network effects. Note that it certainly is not only the capacity of the ports that matter. The relevant bottleneck may also be other relevant infrastructure such as warehousing facilities or hinterland transport connections.
A detailed cargo flow analysis was part of the suggested module B for this study, which was however not chosen by the client in this stage of the study. We have, however, been able to gather some useful evidence from existing reports. We have also included some questions in our survey questionnaire that may allow indicative conclusions (see enclosed questionnaires).
Note that in order to improve exposition, we do not always explicitly refer to the possibility that existing prices may represent pricing power. We discuss the implications of high margins and the associated cellophane fallacy in Section 2.3.
There are two interlinked analyses given below: the first is a generalised cost analysis that determines the importance of harbour dues and lease-related prices in call costs and the overall transport chain. The second part of the study reported below is a captive business analysis that compares generalised costs of choosing alternative harbours for given origin and destination pairs in order to generate estimates of the captive business for various price differentials between ports.
7.7.1 GENERALISED COST
First, it is generally known that harbour dues (and lease-related prices that could be passed on to port users) account only for a small part of total transport cost. This results from the fact that HbR’s charges are only a small portion of total call costs. If, for example, the percentage of a shipper’s cost for a given cargo/route pair that is “caused” by HbR services is 10%, an increase in HbR’s prices of 10% will result in a change in total shipping cost for that cargo/route pair of about 1%. Given that the pricing of HbR affects only a small share of total cargo shipment costs that a shipper must pay, shippers may be less likely to switch to another port in response to a price increase by HbR. The fact that other costs make up for most of the call costs implies that HbR may enjoy fairly high pricing power, due to the limited pass-on of its price increases that generate substitution effects.
There are other, non-monetary, factors that affect the “cost” of a particular cargo routing, e.g. the time required for the shipment. In order to compare different routings, transport
137
Report prepared for the NMa

Charle s
Rive r
Asso c iate s
economists sometimes use the concept of “generalised cost”. These costs include all monetary costs of using a route but also monetary values for other factors, like the time required for the shipment. Thus, where the analysis of the monetary factors above already indicates that the harbour dues are only a very small part of total transport cost, their importance for switching decisions is even further lessened when the other factors that affect the generalised cost of choosing a particular route are also taken into account.
HbR says not to have a fully quantified model of generalised cost, but it did provide us with studies that have assessed total transport cost and, on a qualitative basis, a number of the other factors that affect the generalised cost of routing cargo through different ports. The following items come up as relevant in these studies:
Transport cost
Sea transport cost
Call costs
o Harbour dues
o Towage
o Pilotage
o Mooring/unmooring
o Other
Container handling cost
o Sea move, land move
Hinterland transportation
o Barge, road, rail
Non-monetary factors that affect generalised transport costs
Transport time
Availability of connections, frequency regarding the hinterland and feeders
Quality and speed of container handling
7.8 Cargo flow analysis: Port related and sea-side costs
Based on the results of the call cost model used by the port authority of Rotterdam, we can confirm the general intuition that harbour dues are only a small part of total transport chain costs.
138
Report prepared for the NMa
Charle s
Rive r
Asso c iate s
For containers, the share of harbour dues in total port-related costs is relatively low. The main part of total port-related costs are usually cargo handling costs, which can be up to 25 times higher than harbour dues (e.g. in Hamburg and Bremerhaven).
For both the transatlantic trade and the Far-East Europe trade, Le Havre is the closest port to call at coming from the sea. As the differences in sea-side costs for the different ports are independent of the hinterland transportation, we have included the difference in sea-side costs compared to Le Havre in the computations of the port related costs. We only include the additional and not the total sea transport costs for each port as the largest part of the sea-transport costs are independent of which port in Northern Europe is chosen.
Table 46 and Table 47 below show the port related costs per container for a typical call of Regina Maersk, representative for the Far East trade, and for a typical call of Ever Round, which is smaller than Regina Maersk and representative for the transatlantic trade.
Table 46: Port related costs per container for a typical call of Regina Maersk, Far East trade 2003
Rotterdam Antwerpen Hamburg Bremerhaven
Harbour dues per container 14 7 7 5
Other harbour call costs per container 11 9 14 12
Cost of container land move 110 85 137 137
Additional cost of sea transport per container (compared to Le Havre)
9 10 26 19
Total 144 111 184 173
Total excluding harbour dues 130 104 177 168
Source: CRA calculations based on IBM study
139
Report prepared for the NMa

Charle s
Rive r
Asso c iate s
Table 47: Port related costs per container for a typical call of Ever Round, transatlantic trade 2003
Rotterdam Antwerpen Hamburg Bremerhaven
Harbour dues per container 14 9 7 6
Other harbour call costs per container 16 14 18 17
Cost of container land move 110 85 137 137
Additional cost of sea transport per container (compared to Le Havre)
10 11 29 23
Total 150 119 191 183
Total excluding harbour dues 136 110 184 177
Source: CRA calculations based on IBM study.
Although there are differences, the broad pattern is similar for both typical calls analysed. We evaluate the pattern in more detail focussing on the Far East trade, which is the more important trade for HbR.
Figure 8: Port-related costs per container for a representative Asia trade vessel (Regina Maersk, 6.400TEU)
140
160
180
40
60
80
100
120
Eur
o
0
20
Rotterdam Antwerpen Hamburg Bremerhaven
200
Cost of container land moveAdditional cost of sea transport per container (compared to Le Havre)Other harbour call costs per containerHarbour dues per container
rt, but do consider the additional cost of shipping the container further than to the port of Le Havre (the first port in Northern Europe that container vessels coming from Asia (could) call at).
The figures for Regina Maersk, which is a good representative ship for the Far East trade, illustrate the relative importance of other port related costs. Comparing the current harbour
Source: CRA calculations based on IBM Business Consulting: “Concurrentiepositie van de haven van Rotterdam in the containeroverslag”, 24 November 2003, pp. 15-20, 23 and 29. Note that these figures exclude the cost of sea transpo
140
Report prepared for the NMa

Charle s
Rive r
Asso c iate s
dues at Rotterdam of €14 per container with the other port related cost of €130 per container shows that at given price levels at Rotterdam a ten percent difference in harbour dues (€1.4)
Th nd to R t kilom €359 from to Frankfurt/Main and €402 from Rotterdam to Hanover (see Table 48). It is clear from these figures that a few k ifference in distance compensate large differences in harbour dues and even l ces. A difference 0 kilometres in th ance of hinterland portation is equivalent to about €9 per container and could easily compensate a 50% difference (€7) in h dues between Rotterda d another port. Put differently, an increase in harbour dues by ten percent (€1.4) would, other things being equal, compensate a difference of 1.6 k s in the distance of hint d transportation.
would be outweighed by a difference in other port related cost of 1.1 percent.
An analysis of the data shows that the actual differences in other port related costs are significant. Compared to Rotterdam, other port related costs are 19 percent lower in Antwerp and 30 percent higher in the port with the highest other port related cost, Hamburg.
These figures also show that given current prices an increase in harbour dues in Rotterdam by 10 percent affects total port related costs of a liner company by less than 0.9 percent.
7.9 Cargo flow analysis: Hinterland transportation costs
e costs of hinterlaetre, e.g. €191 from Rotterdam to Genk,
transport from and otterdam are abou Rotterdam
€0.90 per container per
ilometres d canease-related pri of 1 e dist trans
arbour m an
ilometre erlan
Table 48: Cost of hinterland transport for containers shipped through Rotterdam in 2003
Hinterland origin / destination
Transport cost per container in €
Distance from Rotterdam in km
Price per container per km in €
Genk 191 187 1.02
Hannover 402 416 0.97
Frankfurt/Main 359 456 0.79
Strasbourg 335 576 0.58
Paris 425 447 0.95
Prague 735 863 0.85
Average 408 491 0.86
Source: CRA calculations based on IBM Business Consulting: “Concurrentiepositie van de haven van Rotterdam in the containeroverslag”, 24 November 2003, p. 27. Distances according to www.viamichelin.com.
These figures reveal that hinterland transportation costs are important for port choice. They also explain why, when being asked which port competes most intensively w
123ith Rotterdam,
most respondents immediately point to Antwerp. It is, however, also important to note that
123 The port authorities of both ports made this statement.
141
Report prepared for the NMa

Charle s
Rive r
Asso c iate s
the catchment areas of ports in the ARA range, i.e. those ports that are located between Antwerp and Amsterdam, have substantial overlap. This is due to the shared geographical proximity to the Benelux countries (see Figure 9) but also due to the shared access to Rhine corridor via waterways. The latter is discussed in more detail in Section 10. Finally, our survey results show that for those origins and destinations where most respondents124 chose Rotterdam as the preferred port for shipments Antwerp was chosen by the second highest number of respondents (Strasbourg, Bochum, Frankfurt/Main, Stuttgart, Munich). The only exceptions are Prague and Hanover where Rotterdam was named most often and one of the German ports (Bremerhaven, Hamburg) attracted the next highest number of choices. For Paris Le Havre was mentioned most often, Antwerp second and Rotterdam third. For Gent the port of Gent was chosen most often and Antwerp second, Rotterdam third.
Figure 9: The Hamburg-Le Havre range
Antwerp
Bremen / Bremerhaven Amsterdam
Zeebrugge
Dunkerque Ghent
Hamburg
Antwerp
RotterdamZeebrugge
Ghent
Hamburg
Le Havre
Source: CRA
Combmore
ined with existing data on cargo flows by country, it is possible to confirm somheuristic eliminations of ports. For example, for most cargo types the overlap of
nt areas of the f Rotterda the por Havre mited, that those ely to be same relev rket.
e of the
catchme port o m and t of Le is so liports are unlik in the ant ma
124 Note that the evaluation reported here refers to all respondents, not restricted by cargo type.
142
Report prepared for the NMa

Charle s
Rive r
Asso c iate s
Table 49: Hinterland transport cost per container per km in € (2003)
Rotterdam Antwerp Hamburg Bremerhaven Le Havre
Genk 1.021 1.382 0.975 0.980 1.120
Hannover 0.966 0.878 1.258 1.257 1.073
Frankfurt/Main 0.787 0.904 0.665 0.650 1.013
Strasbourg 0.582 0.705 0.856 0.843 0.870
Paris 0.951 0.663 0.938 0.967 1.303
Prague 0.852 0.917 0.773 0.713 1.036
Average price 0.860 0.908 0.911 0.902 1.069
Source: CRA calculations based on IBM study, p. 27.
In order to make a more precise statement it would be helpful to weigh the different destinations against the existing traffic flows. If most of the containers are transported to
ort, a change in harbour dues will have a smaller impact on volume shipped through this port than if final destinations are mostly in a range that can
effectively from several ports.
HbR has not been able to provide us with any data on hinterland traffic of containers coming
Figure 10 shows the density of containers shipped from the US to the various destinations in e defined as follows: Each area comprises hundred
tres. Areas with 1-9 TEUs per area are marked “0”, 10-99 TEUs per area “1”, per area “2”, 1,000-9,999 TEUs per area “3”, 10,000-99,999 TEUs per is
, and, finally, areas with more than 100,000 TEUs per area are marked “5”. The highest density is around the ports, which shows that the port bound traffic is also significant
y of US containers
[confidential]
locations very close to the relevant p
be served cost
from Asia. Based on containers coming from the US, HbR has made some forecasts for hinterland traffic to Germany, France and the Benelux countries for 2002 and 2010, but these forecasts are about 6 years old. HbR is currently working on new forecast studies, but those will only be available in a year or so. However, HbR provided some information on the destinations of transatlantic container traffic, which is based on information on the destinations of shipments that came from ports in the United States.125
Europe in 2002. The density levels arsquare kilome100-999 TEUsmarked “4”
in container traffic.
Figure 10: Densit
Source: GHR.
125 Phone conversation with Maurits van Schuylenburg (HbR) on 15 July 2004. GHR: “Krimpt het achterland
van Rotterdam?” August 2003.
143
Report prepared for the NMa

Charle s
Rive r
Asso c iate s
Fig destinafor moAntwer atchment area confirms that the overlap between these two oreinfor the high-density areas are in the Antwerp/Rotterdam catchment area.
Figure
[co d
Source: G
to Antwerp. Sealand was the home carrier of Rotterdam. Feeder services and intermodal services (rail and road) were routed via Rotterdam. After the merger these services were
• The success of MSC, the home carrier of Antwerp has played an important role. MSC
o the shipping lines and the mergers imply that
nes opened their own offices in various ports and stopped working with agents. These offices have regional targets and budgets while the agents were
It is inte prices is not mentioned in the note, not even cha e
Alt ntwerp is by far the most important alternative port to Rotterdam. The German ports (in particular Hamburg) are a relevant alternative for destinations like Hanover and Prague. However, these are much less eco mgenerally better served from
ure 11 shows the ideal location of the ARA range ports for most of the high-density tions. Figure 11 and Figure 12 show the increasing role of Antwerp as the leading port st of the overlapping catchment area. The substitution between Rotterdam and p as leading ports for a similar c
p rts is much more significant than the overlap with the German ports. This result is ced when taking into account that most of
11: Leading ports by destination
nfi ential]
HR.
Figure 12: Market share of the port of Rotterdam by destination
[confidential]
Source: GHR.
HbR’s (then GHR) own analysis of these developments points to the following reasons for the increasing role of Antwerp:126
• The merger of Maersk and Sealand lead to a move of more traffic
spread over a number of ports.
feeders significant cargo amounts via Antwerp.
• The different forms of cooperation f the containers are now shipped closer to the final destination while on sea.
• Many shipping li
less keen to lure away containers from colleagues in other ports.
resting to note that the change inng s in relative call costs, container handling costs or hinterland transportation costs.
ogether the analysis of hinterland transportation confirms that A
no ically relevant than the Rhine-Ruhr area and the Benelux countries, which are Rotterdam or Antwerp than from the German ports.
126 GHR: “Krimpt het achterland van Rotterdam?” August 2003.
144
Report prepared for the NMa
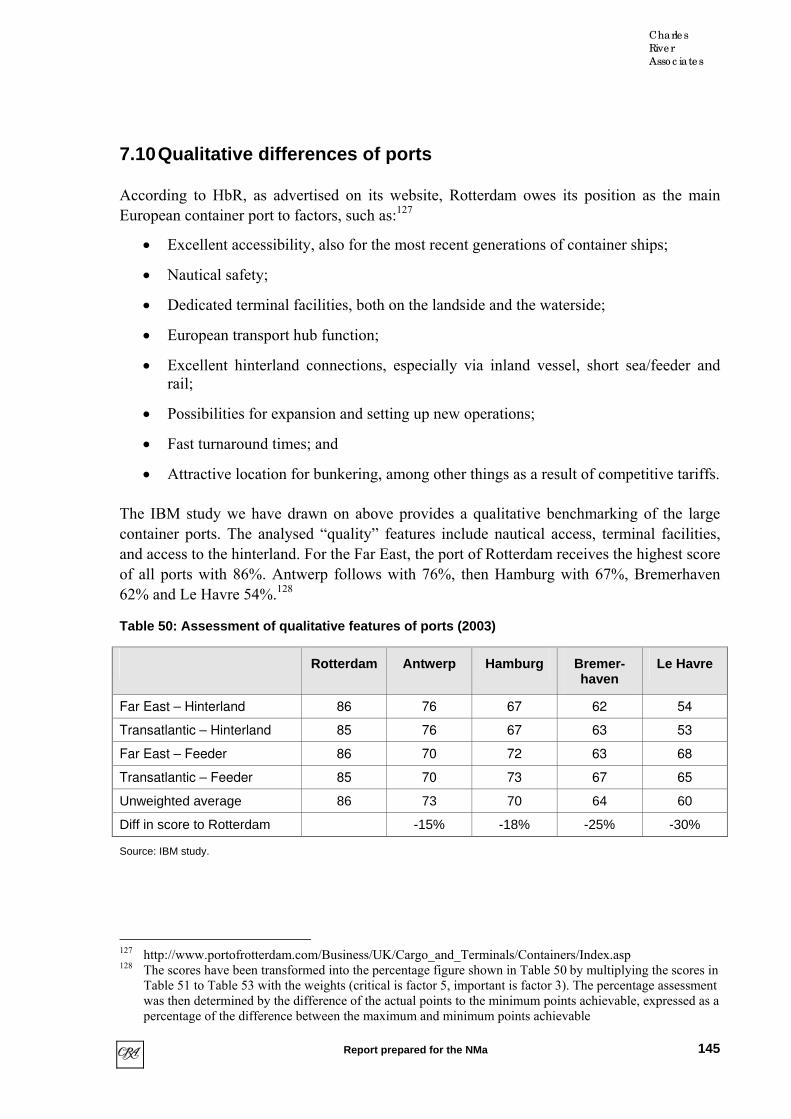
Charle s
Rive r
Asso c iate s
7.10 Qualitative differences of ports
According to HbR, as advertised on its website, Rotterdam owes its position as the main European container port to factors, such as:127
• Excellent accessibility, also for the most recent generations of container ships;
• Dedicated terminal fac on ate
nd conn ons, espe ly via inland vessel, s t sea/feeder and
expansion setting u w operat ;
nd times; and
nkering, among other things as a result of competitive tariffs.
The IBM study we have drawn on above provides a qualitative benchmarking of the large
with 86%. Antwerp follows with 76%, then Hamburg with 67%, Bremerhaven 128
Table 50: Assessment of qualitative features of ports (2003)
• Nautical safety;
ilities, both the landside and the w rside;
• European transport hub function;
• Excellent hinterla ecti cial horrail;
• Possibilities for and p ne ions
• Fast turnarou
• Attractive location for bu
container ports. The analysed “quality” features include nautical access, terminal facilities, and access to the hinterland. For the Far East, the port of Rotterdam receives the highest score of all ports 62% and Le Havre 54%.
Rotterdam Antwerp Hamburg Bremer-haven
Le Havre
Far East – Hinterland 86 62 576 67 4
Transatlantic – Hinterland 85 76 67 63 53
Far East – Feeder 86 70 72 63 68
Transatlantic – Feeder 85 70 73 67 65
Unweighted average 86 73 70 64 60
Diff in score to Rotterdam -15% -18% -25% -30%
Source: IBM study.
127 http://www.portofrotterdam.com/Business/UK/Cargo_and_Terminals/Containers/Index.asp 128 The scores have been transformed into the percentage figure shown in Table 50 by multiplying the scores in
Table 51 to Table 53 with the weights (critical is factor 5, important is factor 3). The percentage assessment was then determined by the difference of the actual points to the minimum points achievable, expressed as a percentage of the difference between the maximum and minimum points achievable
145
Report prepared for the NMa

Charle s
Rive r
Asso c iate s
Table 51, Table 52 and Table 53 below show the assessment of the individual factors that were used for the determination of the index using the example of a Far East shipment to the hinterland.
tical "quality" of container a Far East-Hi rland ipmenTable 51: Nau ports for nte sh t*
Weight RTM ANR HAM BRV LEH
Sailing time from Far East locations Imp 4 4ortant 3 3 4
Nautical accessability Critical 4 3 3 3 4
Traffic volume Important 4 3 3 2 2
* RTM (Rotterdam), ANR (Antwerp), HAM (Hamburg), BRV 1 being “bad”, 2 “neutral”, 3 “good” and 4 bei
(Bremerhaven), LEH (Le Havre). The score ranges from 1 to 4 with ng “excellent”.
Source: IBM study 2003, provided by HbR.
Table 51 confirms the good position of the port of Rotterdam regarding nautical criteria like sailing time and nautical accessibility.
ontainer ports for a Far East-Hinterland shipmenTable 52: Terminal "quality" of c t*
Weight RTM A NR HAM BRV LEH
Hub potential Important 4 3 3 3 2
Terminal size Important 4 4 3 3 3
Additional capacity at existing terminals Important 3 1 3 3 4
Flexibility (labour productivity, lay-out…)
Critical 2 3 3 3 2
Future options for expansion Critical 4 4 2 2 4
* RTM (Rotterdam), ANR (Antwerp), HAM (Hamburg), BRV (Bremerhaven), LEH (Le Havre). The score ranges from 1 to 4 with 1 being “bad”, 2 “neutral”, 3 “good” and 4 being “excellent”. Source: IBM study 2003, provided by HbR.
146
Report prepared for the NMa
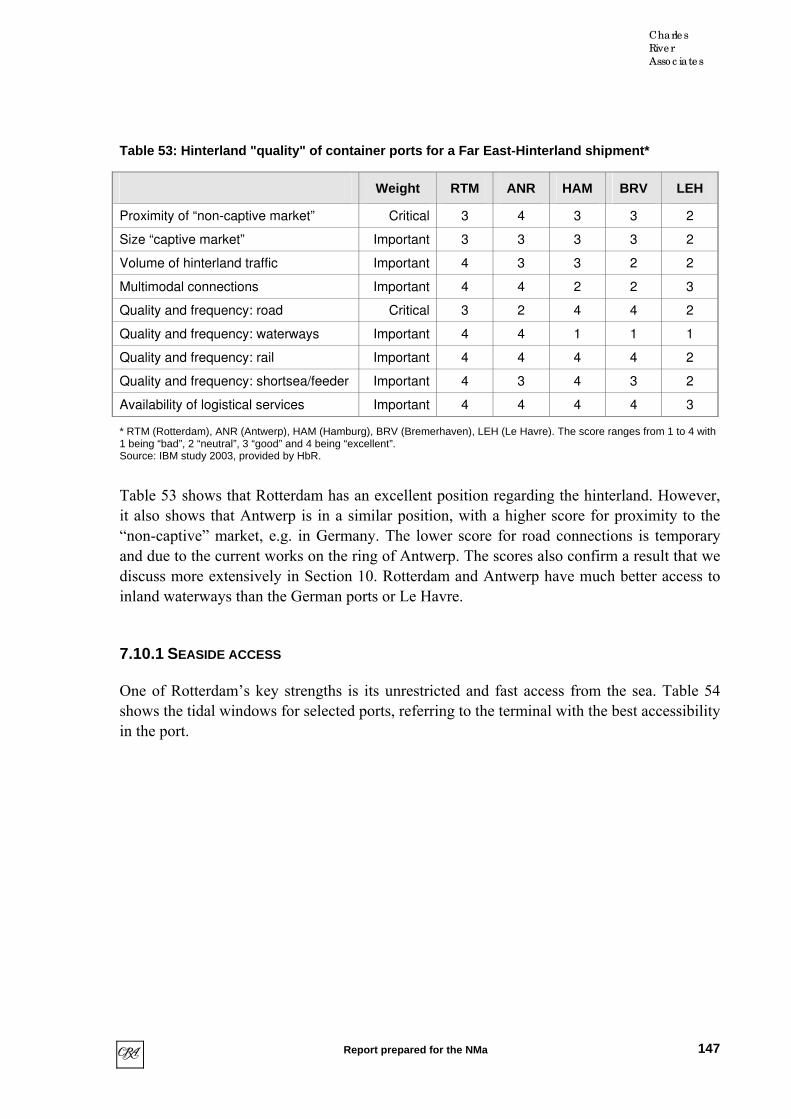
Charle s
Rive r
Asso c iate s
Table 53: Hinterland "quality" of container ports for a Far East-Hinterland shipment*
Weight RTM ANR HAM BRV LEH
Proximity of “non-captive market” Critical 3 4 3 3 2
Size “captive market” Important 3 3 3 3 2
Volume of hinterland traffic Important 4 3 3 2 2
Multimodal connections Important 4 4 2 2 3
Quality and frequency: roa Critical 3 2 4 4 2 d
Quality and frequency: w ays Important 4 4 1 1 1 aterw
Quality and frequency: ra Important 4 4 4 4 2 il
Quality and frequency: sh a/feeder Important 4 3 4 3 2 ortse
Availability of logistical ser s Important 4 4 4 4 3 vice
* RTM (Rotterdam), ANR (Antwer M (Hamburg), BRV merhaven), LEH (Le Havre). The score ranges from 1 to 4 with
tidal windows for selected ports, referring to the terminal with the best accessibility in the port.
p), HA (Bre1 being “bad”, 2 “neutral”, 3 “good” and 4 being “excellent”. Source: IBM study 2003, provided by HbR.
Table 53 shows that Rotterdam has an excellent position regarding the hinterland. However, it also shows that Antwerp is in a similar position, with a higher score for proximity to the “non-captive” market, e.g. in Germany. The lower score for road connections is temporary and due to the current works on the ring of Antwerp. The scores also confirm a result that we discuss more extensively in Section 10. Rotterdam and Antwerp have much better access to inland waterways than the German ports or Le Havre.
7.10.1 SEASIDE ACCESS
One of Rotterdam’s key strengths is its unrestricted and fast access from the sea. Table 54 shows the
147
Report prepared for the NMa

Charle s
Rive r
Asso c iate s
Table 54: Tidal windows for selected ports (largest window available 2001)
Port Tidal window (%) at draught of 14m
Tidal window (%) at draught of 15m
Rotterdam 100 100
Antwerp 36 22
Zeebrugge 57 40
Hamburg 83 63
Bremerhaven 100 82
Le Havre 100 100
Felixstowe 77 52
Southampton 51 38
Thamseport 52 38
Source: European Commission, Case No. COMP/JV.55 Hutchinson/RCPM/ECT, 3 July 2001, Annex 1.
Table 54 clearly reveals the substantial disadvantage of Antwerp with respect to nautical
ming twice a day, gives the port of Antwerp is considerable disadvantage in terms of attractiveness for shippers.
dently of the tide and can sail up or down river at any time.129 The port has recently announced that the largest existing container ship, with over 8,000 TEUs capacity, has called at Antwerp.
ociated planning problems are significant for ships of this size.
nd Bremerhaven scored 3, Le Havre and Rotterdam 4 out of 4 points.
HbR to xplain the diff
Another factor that provides a disadvantage in terms of sea-side access for the port in
translates, for some important hinterland destinations, into shorter hinterland transport time.
accessibility. Not only is the tidal window considerably smaller than one third of that of Rotterdam, the additional planning constraint over time, with the tide co
Note that the table refers to the year 2001. According to the port of Antwerp the river Scheldt, which links Antwerp to the navigable trade lanes of the world, has since further deepened its maximum draught to 15.6 metres for vessels sailing upriver of 14 metres for vessels sailing downriver. Ships with draughts up to 12.3 metres can use the Scheldt indepen
However, tidal restrictions and the ass
In the IBM study, the depth of the access waterway was judged to be a critical quality factor. Antwerp, Hamburg a
ld us that the disadvantages of the port of Antwerp regarding sea-side access eerences in harbour dues that were identified in the IBM benchmarking study.
Antwerp is the four to five hours required to cover the almost 80 km of difficult and relatively slow distance between the sea and the harbour on the river Scheldt. Note however, that this
129 http://www.portofantwerp.be/asp/news_detail.asp?id=391.
148
Report prepared for the NMa
Charle s
Rive r
Asso c iate s
7.10.2 HINTERLAND
The level of hinterland connections is a decisive factor for port choice. This is illustrated by the example of the Ceres terminal in Amsterdam. This terminal was built around 3 years ago and has as of yet not attracted any noteworthy amount of container handling. We have asked in our questionnaire why the shipping lines do not start to call at Amsterdam. The two prime reasons stated were the lack of hinterland connections and difficult sea-side access.
led to attract shipping lines. The logistical operations are not easily transferred. At a recent capacity shortage at Rotterdam P&O
same links. Antwerp is slightly advantaged for rail access, but still both ports have a rail share of hinterland transportation of about 9%.133
We asked the port authority of Rotterdam to provide evidence of switching to or from HbR, val ports.
According to HbR,
“[t]here are no exa ays a combination of ce, time, price, quality, etc. Coming closest to this kin ing are the withdrawal of
ontainer services from Maersk (AE2 2001 to Antw and P&ONL (loop D 2001 to
Just how important those factors are shows from the fact that both the container handling charges and the harbour dues in Amsterdam are about half the level of Rotterdam.130 This implies that in terms of monetary value the reduction must be several times the harbour dues of Rotterdam. Nevertheless, Amsterdam to date fai
Nedloyd re-routed a few thousand containers to Amsterdam. According to HbR these containers were then shipped on the road to the port of Rotterdam for further handling.131 [Confidential] Clearly this shows the importance of the capture effect of port infrastructure and connections.
The port of Zeebrugge also offers low handling charges, but has apparently had similar difficulties attracting significant volumes from established major ports.132
The port of Antwerp reports to believe that the relative position of Antwerp and Rotterdam with regard to hinterland transport is quite similar. This is especially true for inland waterways, where both have the
7.11 Evidence of switching
with a particular emphasis on the role of the harbour dues set by HbR or ri
mples of explicit pricing related switching. It is alwservisome c
d of switcherp)
Antwerp)”.134
This assessment is confirmed by our survey results. We asked port users whether they could provide an example when they switched volume to another port as a result of an increase in
130 Interview with HbR. 131 Interview with HbR on 14 Oct 2004. 132 European Commission, Case No. COMP/JV.55 Hutchinson/RCPM/ECT, 3 July 2001, p. 31. 133 Interview with [confidential] on 8 July 2004. 134 Information provided by HbR on 16 September 2004.
149
Report prepared for the NMa

Charle s
Rive r
Asso c iate s
harbour dues. The only liner shipping company that provided an example of such switching was [confidential], pointing to the move from Rotterdam to [confidential]. In a subsequent interview it was pointed out that the main reason for the move was that customers demanded additional calls at [confidential], partly due to an increase in growth of the traditional markets of [confidential], like the trade with Africa. That is, demand pull hinterland reasons where behind this switch, rather than, at least not in the first place, prices.
While there does not seem to be evidence of price-induced switching in the past therefore, many users of the port of Rotterdam in the container business that responded to our survey
me if harbour dues were to increase permwou in R e
The survey also asked respondents what share of the container volume they shipped through Rotterdam they considered lum itched if harbour dues increased by 10%. Weighing the answers by the respondents’ share of volume out of total
f all companies answeri he question yields a captive volume esti of 16%, ates that the containe ctor is, at given price levels, indeed one of the most
ve ones among the different cargo types. However, some respondents also referred raints at other orts, which mean that – even if liners wa o move
her ports – they might ot be able to switc s much as they would like. In ne large container liner answered that in princi le there was no cap e,
e to capacity shortages t other European p a maximum of 40% could be y from Rotterdam.135
share of volume shi d to other ports following an increase of total port costs plus cargo handling cost e weighted average of all respondents’ tes was
ainer business is relatively competitive. s, the same caveats with regard to capacity constraints apply.
(12 out of 15) stated that they would reduce voluanently by 10%. For a change in total ship
ld expect volumeping cost, all respondents d.
e that could not be sw
indicated that they otterdam to be reduc
to be “captive” vo
volume o ng t mate which indic r secompetitito the capacity const p nted tcargo to ot n h aparticular, obut that du
ports,
tive volum a
moved awa
In terms of the fte(call costs s), th estima50%, again supporting the view that the contNevertheles
Table 55: Captive volume and switched volume estimates based on the CRA survey
Segment Weighted average captive volume in %
Switched volume after price increase of 10%
Containers 16 50
Source: CRA questionnaire.
For strategic reasons, in questionnaires customers often overestimate their response to hypothetical price increases. The absolute values of the switching information provided should therefore be interpreted with care. However, the survey provides valuable evidence on the relative importance of rival ports. One question of our questionnaire asked to what extent respondents see other ports in the HLH as possible alternatives for the port of Rotterdam and
135 CRA questionnaire.
150
Report prepared for the NMa

Charle s
Rive r
Asso c iate s
how they evaluate those ports’ quality as a substitute for Rotterdam. The table below shows the responses to this question. They clearly confirm our finding that Antwerp is the most important competitor of the port of Rotterdam. In total 15 out of 16 respondents labelled Antwerp as a possible substitute for Rotterdam, with an (unweighted) average quality assessment of 1.5 (on a scale from –2 (very poor) to +2 (very good)). Amsterdam and Hamburg came in second, with Hamburg achieving an even higher quality score than Antwerp. Zeebrugge and Vlissingen were also mentioned by a significant share of respondents (44% and 38% respectively).
Table 56: Substitute ports for container respondents
Alternative port Number of respondents seeing
port as possible alternative for
Rotterdam, n=16
Average quality of the port as a substitute for
Rotterdam (not weighted, -2=very
poor, +2=very good), n=16
Average share of total volume shifted away
from Rotterdam moved to this port
(n=15)
Antwerp 15 1.5 48%
Amsterdam 10 0.8 16.7%
Hamburg 10 1.7 14.3%
Bremen/Bremerhaven 6 1.5 8.3%
Zeebrugge 7 0.6 4.7%
Vlissingen 6 0.3 3.3%
Dunkerque 3 0 0.1%
Le Havre 3 -0.3 0.7%
Wilhelmshaven 3 2 0%
Felixstowe 3 -0.7 2.3%
Gent 1 0 0%
Thamseport/Southampton 1 0 N/A
Source: CRA questionnaire. The question for columns 2 and 3 was: “Please indicate which of the following ports you would
all costs and cargo handling costs) by 10%, to shift volume to other ports.
The ta olume shifted pping costs f nd in particu s with regard to possible substitutes for the port of Rotterdam. The largest share – almost half – of the volume shifted away from Rotterdam would be re-routed to Antwerp. According to the survey results, also Amsterdam and Hamburg would benefit from the reduction of cargo in
consider as possible substitutes for the port of Rotterdam for the cargo type for which you fill out this form, even if they may not be the best alternative. For each port that you would consider as a possible alternative, please assess the quality as a substitute for Rotterdam by circling a number between “–2” and “2”. A circle around “-2” means that the port is a “very poor” substitute for Rotterdam, a circle around “2” means that it is a “very good” substitute.” The question for column 4 was: “Please indicate what proportion of the total volume (of the cargo type for which you fill out this form) shifted away from Rotterdam to other ports you would expect to route or to be routed to each of the following ports.” In the previous question, respondents had been asked whether they expected, in case of a hypothetical permanent increase of total costs of shipping cargo through Rotterdam (i.e. total port c
ble above also shows the average of respondents’ estimate of the share of v from Rotterdam to the other ports following an assumed increased of total shior Rotterdam (port call costs and cargo handling costs) by 10%. The shares, alar the ranking of the ports, are generally consistent with respondents’ answer
151
Report prepared for the NMa

Charle s
Rive r
Asso c iate s
Rotterd locate more c t d based on the
te to Le Havre (2.7% and 0.7% respectively), which supports the hypothesis that Le Havre is not a significant competitor for the port of
The survey evidence suggests a ranking in the relevance of rival ports at given prices.
es aid in Rotterdam and, more importantly, only half the terminal dues of Rotterdam without
error of the cellophane fallacy kind, if no g for these and taking into account
that the weighted average suggests a much lower importance of Amsterdam, the next most im peting ports are the two German ports, with Hamburg coming first, followed
, with Amsterdam being in a clear waiting
A twerp, Felixstowe and Thamesport, Hamburg and 136
am, followed by Zeebrugge and Vlissingen. The survey respondents would alargo volume from Rotterdam to Felixstowe than would be expec e
ranking of the UK port as an alternative for Rotterdam. However, this is likely to reflect the importance of transhipment in the container segment.
In our analysis of the survey results, we also took a weighted average of the shares of volume that respondents would shift from Rotterdam to the other ports, weighted by respondents’ shipments through Rotterdam in 2003. Just like the simple average, the shares analysis confirmed the view that Antwerp is the most important competitor for Rotterdam, receiving 43.1% of the volume shifted away from Rotterdam. The importance of Amsterdam dropped compared to the simple average, from 16.7% to 6.3%. On the other hand, the share of volume moved to Hamburg is somewhat higher for a weighted average, 19% compared to 14.3% with a simple average. However, the strong position of the German ports is also evident using the simple average. In both cases – with a weighted and simple average – only a very small share of volume can be expected to be shif d
Rotterdam.
Antwerp is by far the most important competing port, confirming the results obtained in the analysis of call pattern (see Section 7.4), hinterland (see Section 7.9), as well as general perception. The non-weighted average suggests that Amsterdam follows as the next most important rival. Note, however, that Amsterdam already charges only half the harbour dupattracting business. This suggests a danger ofadjustment is made for existing price differences. Adjustin
portant comby Bremerhaven. The ARA range ports then followposition.
In a recent merger inquiry by the European Commission, the collected evidence of carriers switching volume between ports suggested that switches of entire liner shipping services, or of individual strings, occur almost exclusively between ports in the same hinterland region (for example between Rotterdam and nBremerhaven).
“The investigation has furthermore revealed that the port handling charges are only one, and not the most important, factor when the shipping lines choose which port to call at. That choice is instead dictated primarily by hinterland connections, availability of feeder and relay services, direct coastal accesss and draught of access channels and berths as well as the timetable and schedule of the service in question. Service levels are also important. Once a
136 European Commission, Case No. COMP/JV.55 Hutchinson/RCPM/ECT, 3 July 2001, p. 10
152
Report prepared for the NMa

Charle s
Rive r
Asso c iate s
shipping line has started to operate a successful service calling at a particular port, they are therefore faced with a strong incentive to continue to call at the port in question. 137
In the inquiry, ECT, Hutchison and a subsidiary of HbR provided empirical evidence of port switches (partial switches and switches of entire services) between the years 1996 and 2001. The Commission points out that the evidence “…does not show that the switch of port has been motivated by price considerations. On the contrary, available data suggests that the switches have been motivated primarily by operational considerations (for example, MSC’s partial switch of larger vessels from Antwerp to Le Havre) or restructuring following new consortium arrangements. In case of the switch of Maersk Sealand transhipment volumes (feeder traffic to Norway and the Baltic) from R teot rdam to Bremerhaven in 2000, the prime
Fig the mid from the big ships to m etheir ha
Figure
drivers were the improvement of the feeder services and the loss of capacity at the old Delta Sea-Land terminal. The relative dearth of switches and the fairly stable market shares of the leading ports between 1997 and 1999 would tend to demonstrate that switches are not undertaken lightly by shipping lines.” 138
7.12 Transhipment
ure 13 shows that the share of transhipment TEUs in Rotterdam has been declining since 1990s. The reasons are that more volume leads to more direct calls
or ports, more multiporting. And also other ports haven invested quite much to improve ndling. So the competitive advantage of market leader Rotterdam has become less.
13: Percentage of transhipment TEUs in Rotterdam
15
17
19
perc
enta
ge
23
25
21
1990
1992
1994
1996
1998
2000
2002
year
137 European Commission, Case No. COMP/JV.55 Hutchinson/RCPM/ECT, 3 July 2001, p. 40 138 European Commission, Case No. COMP/JV.55 Hutchinson/RCPM/ECT, 3 July 2001, p. 41.
153
Report prepared for the NMa
Charle s
Rive r
Asso c iate s
Source: Information provided by HbR on 12 July 04.
There are two main reasons for the significant drop in the 2002 figure. First Maersk-Sealand transferred transhipment to ScandinaBremerhaven. Second, there were problem
via and the Baltic region from Rotterdam to s with customs, which also led to transfer of
anshipment containers to other ports.139
According to the recent merger decision of the European Commission referred to above, contain r term ort’s hinterland and ithin transhipment traffic, one can further distinguish between relay traffic (co ers d from a essel noth ep-se ssel, on it y fro e Far st to t S) and f ic (co ers m d fro deep vessel to a short-sea vessel, e.g. on its way from on industry reports (mOcean Shipping ultan ), the opea mm n has ued th he ran of ports c hi and cargo and ship cargo is different and there ears to be a “transhipment hub port market” including all North continental ports plus the UK ports and “various regional hinterland port ma ” (N Continent West from Rouen to A orth ontine East w Hamburg and Bremerhaven, the UK/Ireland ports and p cated in Scandinav d the tic S 141
t most deep-sea container vessels carry containers that are destined for the hinterland and for transhipment. The European Commission acknowledges that
h lower than terminal handling costs, which means that a change in prices changes relevant costs only to a very small extent.
r dues are mainly based on the size of the vessel and only to a smaller percentage on the weight of the containers loaded and discharged, the effect
tr
HbR expects that the transhipment rate will rise again up to round about the 22% mark.
e inal thro into tran
ughput cshipment
an be sp cargo that is transported to
lit into cargo destined fo other ports by vessel. W
r the res
ntain
pective p
move deep-sea v to a er de a ve e.g. s wa m th Ea he Ueeder traff ntain ove m a -sea
the Far East to the Baltic Sea). Based ainly a study undertaken by argCons ts140 Eur n Co issio at t ge
ompeting for nterl tran ment that app
rkets orthmsterdam, N C nt ithorts lo ia an Bal ea).
However, as argued above, hinterland and transhipment traffic are closely interlinked, especially given tha
considerations with regard to hinterland traffic are significantly more important for the choice of port than transhipment. We concur with this observation. In fact, we believe that there are two reasons why the effect of an increase in harbour dues will be less likely to induce switching of transhipment volume than a change in terminal handling costs:
• First, harbour dues are muc
• Second, given that harbou
of a change in harbour dues on the transhipment decision will be much less pronounced. It is therefore no surprise that transhipment volume is the highest where hinterland volume is the highest, the number of calls determine the potential transhipment volume. The actual transhipment volume will then only to a very minor degree be influenced by the charges for the deep-sea vessel.
139 Information provided by HbR on 25 October 2004. 140 Ocean Shipping Consultants: “North European Containerisation”, 2000. 141 European Commission, Case No. COMP/JV.55 Hutchinson/RCPM/ECT, 3 July 2001, paras 30-31.
154
Report prepared for the NMa

Charle s
Rive r
Asso c iate s
The second reasoning does not apply to the same extent for harbour dues charged for the feeder vessel. By reducing the amount of TEUs transhipped at a port, the number of feeder vessels calling at the port will be affected. However, logistical constraints remain. A shipment for the Baltic region is unlikely to be transhipped at Le Havre.
These views are confirmed by representatives from the liner shipping industry, who stated that it is more effective to focus on attracting mother ships than feeder vessels. Whichever port gets the mother ship gets the feeder traffic.142
7.13 Capacity expansion plans
There are a number of known future changes in terminal capacity, which will affect the relative importance of competing ports.
Table 57: Container term inal capacity developments in the HLH-range 2003 to 2007 (million TEUs)
2003 Capacity
CapacityAddition
2004
CapacityAddition
2005
Capacity Addition
2006
CapacityAddition
2007
2007 Capacity
2003 Capacity shares
(%)
2007 Capacity
Share (%)
Rotterdam 7.5 0.3 0.5 0.5 0.5 9.3 27 22
Hamburg 7.2 0.5 0.6 1.6 0.3 10.3 26 25
Antwerp 5.4 0.3 2.6 2.3 0.4 11 19 26
Bremerhaven 3.5 0.5 0.3 1.0 0.0 5.2 12 12
Le Havre 2.0 0.1 0.9 0.3 0.0 3.3 7 8
Zeebrugge 1.6 0.0 0.0 0.0 0.0 1.6 6 4
Amsterdam 1 0 0 0 0 1 4 2
Total 28.2 1.6 4.9 5.7 1.2 41.7 100 100
Source: Information provided by the HbR on 25 October 2004. The information source for Amsterdam is the Ceres website, see www.ceresglobal.com/pages/pressre.html, accessed on 21 Oct. 2004. Wilhelmshaven’s annual capacity, operational from 2010, will be 1.7 m TEU.
As shown in Table 57 the total capacity will increase from 28 million TEUs in 2003 to 41 million TEUs in 2007. Rotterdam’s capacity share will be reduced slightly. Given the importance of Antwerp as a competitor, the increase of capacity at Antwerp will be most relevant to Rotterdam. As the more detailed description below shows, this will begin to show effects in the second half of 2005.
142 Interview with [confidential] on 6 July 2004.
155
Report prepared for the NMa
Charle s
Rive r
Asso c iate s
7.13.1 ANTWERP (2005-2008)
One important addition of capacity will be in Antwerp. At the port of Antwerp a new container facility, Deurganckdok West is expected to become partly operational in the second half of 2005, completing the first phase of development and
143 providing an additional capacity
of nearly a million TEU to the port of Antwerp. Together with an increase of capacity of 1.45 million TEU in the HNN terminals (HNN Europe and HNN Nordzee Terminal), an
e million TEU and an increase of 0.3 million TEU in the HNN Deurganckdock, the total increase of capacity amounts to 2.75 million TEU in
fter the completion of the third phase of the Deurganckdok will be completed September 2007 and will provide a capacity of three million TEU, adding a capacity of 0.75 million TEU in 2007. Additionally, an expansion of
e capacity at the HNN
Us. The Deurganckdok West is expected to provide a total container capacity of at least 5.5 million
he present handling capacity of Antwerp.144
e te cargo handling abilities.
increase in the MSC Home terminal of on
2005. The second phase will be completed September 2006, providing an additional capacity of 1.2 million TEU at the HNN Deurgancksdock terminal. The HNN terminals will also expand their capacity by 0.7 million TEU in 2006. A
1.3 million TEU at the HNN terminals is expected in 2007. Thterminals will also increase by 1.2 million TEU in 2007. The final phase is expected to be completed in July 2008, and will provide a capacity of 3.6 million TEU. The container tidal dock will be situated closer to the sea than existing terminals, reducing vessel sailing time. Moreover, the new terminal is planned to have a quay length of 2,750 metres and a surface area of 200 hectares. When fully operational, the terminal will be equipped with more than 100 straddle carriers and 24 quay cranes, capable of handling vessels up to 20 containers wide. The container traffic in Antwerp grew by 14% in 2003, to 5.5 million TE
TEUs and therefore eventually double t
7.13.2 AMSTERDAM
As discussed in Section 7.10 Amsterdam may attract business in order to utilise existing terminal facilities. For that, it seems important that the port attracts a critical mass of volum in order to further develop its hinterland connections and on si
7.13.3 WILHELMSHAVEN (2009/2010)
The JadeWeserPort Development Company is planning to construct the first deep-sea port and container terminal in Germany in the port of Wilhelmshaven. The construction of deep-
143 The Deurganck dock is being built in several phases: phase 1: 1,260 metre quay wall on the western side.
Phase 2: 1,370 metre quay wall on the eastern side and 400 metre extension on the western side. Phase 3: 1,080 metre quay wall on the western side and 680 metres on the eastern side and 400 metre extension on the eastern side. Phases 1 and 2 are due to enter service in mid-2005. (http://www.portofantwerp.be/asp/news_detail.asp?id=392).
Information on the capacities of the different phases has been provided by the HbR on 25 October 2004. 144 http://www.portofantwerp.be/asp/news_detail.asp?id=414 and
http://www.portofantwerp.be/asp/news_detail.asp?id=391 .
156
Report prepared for the NMa

Charle s
Rive r
Asso c iate s
sea container terminal is deemed to be essential in view of the growth in the flow of goods. Moreover, new growth opportunities are opening up in the Baltic, particularly in Russia. Wilhelmshaven is considered to be a supplementary location to the ports of Hamburg and Bremerhaven and is the furthest east located deep-water port of the European North Range. Moreover, the continually increasing transfer capacities in the ports of Hamburg and Bremerhaven will reach their limits in the future because of their dependency on tides. According to the founding managing director of the JadeWeserPort, “We must be ready when the big ships come”.145
One of the crucial factors that influenced the decision in favour of the JadeWeser port was the present depth of the water (18 m below keel at low tide). Additionally, Wilhelmshaven offers relatively good seaside access (23 sea miles).146 The port is expected to have an annual container handling capacity of 2,7 million TEU and a container handling area of 120 ha.147 The port is expected to be in operation around 2009/2010.
7.13.4 BREMERHAVEN (2005 TO 2007)
The Eurogate and NTB terminals are planned to be expanded (CT IV), adding a capacity of year.148 Partial backyard space will be ready by mid 2005 and the
terminal is expected to be fully operational in 2007.
The planned Westerschelde Container Terminal involves the construction of a container quay on TEUs per year.149 However, it is not certain
perative public need’. The highest
2000 capacity is expected to increase to three million TEU in 2006. The planned terminals
1.5 million TEU per
7.13.5 WESTERSCHELDE CONTAINER TERMINAL /VLISSINGEN-OST
with a transhipment capacity of one milliwhether the plans will stand the test of ‘serving an imadministrative court in the Netherlands and a part of Zeeland dismissed the earlier plan for the construction of a large container terminal.150 The port of Rotterdam and a large, globally operating transhipment company from Antwerp are currently involved in the plans.
7.13.6 PORT 2000/LE HAVRE (2005)
Le Havre has gradually increased capacity in recent years. Starting from 1.5 million TEU in
145 See http://www.jadeweserport.info/web_en/index.php for a description of the planned port. 146 “Overview of the JadeWeser port”, see http://www.jadeweserport.info/web_en/index.php. 147 “Overview of the JadeWeser port”, see http://www.jadeweserport.info/web_en/index.php. 148 Information provided by the HbR, 25 October 2004 149 Port News Number 43, September 2004, see http://www.zeeland-
seaports.com/download/port%20news/port%20news%2043.pdf 150 Port News Number 43, September 2004, see http://www.zeeland-
seaports.com/download/port%20news/port%20news%2043.pdf
157
Report prepared for the NMa

Charle s
Rive r
Asso c iate s
will be accessible independently from tide times. The first four berths are expected to become operational mid-2005 and the remaining quays will be constructed depending on the traffic.151 The berths will be owned by Maersk/CMA CGM (2 each).152
GATE, TOLLERORT /HAMBURG (2010)
ill be three million TEU. The additional capacity of 0.2 million TEU is expected to be in operation from 2006.155 The Altenwerder container terminal in Hamburg has a current
place between 2005 and 2006 with an expansion of 1.3 million TEU.157 The expansion of the HHLA TCT is undergoing continuous expansion and is expected to reach a capacity of 1.9 million TEU by 2008.158 Hamburg and the
assenverwaltung are making preparations to adapt the waterways of the River Elbe to meet the demands of increasingly larger ships.159
ater depths.
7.13.7 ALTENWERDER, BURCHARDKAI , EURO
The port of Hamburg is currently capable of handling 3.7 million TEU of container traffic a year and once the Altenwerden and other expansion projects are finished, this amount will increase to 8 million TEU per year in 2010.153 The capacities of the existing container terminals (Eurogate, Burchardkai, Altenwerder and Tollerort) will be enhanced over the years, while the waterways frequented by vessels arriving from abroad as well as the berths including quay walls will be adjusted to the increasing size of container vessels.154 The reconstructed berth at the Eurogate terminal will be ready in mid 2005, the second berth will be ready early 2007 and the third berth early 2008. The eventual capacity at the Eurogate terminal w
capacity of 1.1 million TEU a year. This capacity will increase by 0.5 million TEU in 2005.156 The container terminal Burchardkai is the largest terminal for container handling in the port of Hamburg with a current capacity of 2.6 million TEU per year and plans are currently under way to increase the throughput to four million TEU annually. A majority of the expansion will take
Bundeswasserstr
7.13.8 ZEEBRUGGE
In October 2004 APM Terminals signed a letter of intent to manage and operate a container terminal in the port of Zeebrugge. Zeebrugge shares some of the advantages of the port of Rotterdam. It is located directly at the open sea and offers more than 15 metres w
151 “Les objectifs, Port 2000”, see http://www.havre-port.net/pahweb.html 152 Information from a document on North Europe Terminal Capacity, provided by the HbR, 25 October 2004 153 “Altenwerden Container Terminal”, see http://www.port-technology.com/projects/alternwerder/ 154 “Port enlargement – capacity expansion and infrastructural adaptation”, July 2004, see http://www.hafen-
hamburg.de/html-engl/home.htm155 Information from a document on North Europe Terminal Capacity, provided by the HbR, 25 October 2004 156 “Factsheet Altenwerder”, see http://www.hhla-cta.de/en/index.htm 157 “Container Terminal Burchardkai”, see http://www.hhla-cta.de/en/index.htm 158 Information from a document on North Europe Terminal Capacity, provided by the HbR, 25 October 2004 159 “Port enlargement – capacity expansion and infrastructural adaptation”, July 2004, see http://www.hafen-
hamburg.de/html-engl/home.htm
158
Report prepared for the NMa

Charle s
Rive r
Asso c iate s
7.13.9 ROTTERDAM ECT AND EUROMAX
A new container terminal planned to be built on the northwest corner of the Maasvlakte in Rotterdam. Euromax, a 50/50 joint venture between P&O Nedlloyd (PONL) and ECT will develop, build and operate the terminal. The works are expected to begin in the first half of 2005 and should be completed by the end of 2008. The new terminal will be progressively operational after 2007 with an annual capacity of 1.2 million TEU rising to 1.8 million TEU.160 Over the next fifteen years, container traffic is expected to grow at about 8% per year and, according to HbR, the capacity added by Euromax is expected to be sufficient to accommodate traffic growth until 2011.161 According to information provided by the HbR, capacity in the ECT Delta terminal will be expanded as the market expands. The APMT terminal will expand to the former DMU terminal.162
7.13.10 ROTTERDAM MAASVLAKTE II
When the container business started to develop, Rotterdam had some problems as a result of n by oil refineries, which need deep-sea access for the
large oil tankers. Therefore, the container industry first started to locate in other port areas
that Maasvlakte II will be developed by 2012. The capacity is not yet determined but will have a minimum capacity of 3 million
HbR ai t space will be efficiently used. dedicatis alwastevedo
the fact that most of the space was take
(i.e. not Maasvlakte I and not Europoort). Today, about 95% of the container business is located on the first Maasvlakte. Still, between 1975 and 1980, the port of Rotterdam recognised the need to develop more deep-sea areas for container terminals, which is why the plans for Maasvlakte II emerged.163 It is expected
TEU.164
ms at developing the new terminals on Maasvlakte II, so that the extensions of porThe port says it is not willing to allow the set-up of only
ed terminals that will then not be fully utilised. HbR argues in this context that there ys the need for a multi-purpose container terminal operated by an independent ring company.165
Information from a document on North Europe Terminal Capacity, provided by the HbR, 25 October 2004
fidential] questionnaire response and
160 161 [con
http://www.portofrotterdam.com/news/UK/Pressreleases/Pressreleases/HBR_28062004_01.asp?ComponentID=57244&SourcePageID=0.
162 Information from a document on North Europe Terminal Capacity, provided by the HbR, 25 October 2004 163 Interview with HbR on 5 July 2004. 164 Information from a document on North Europe Terminal Capacity, provided by the HbR, 25 October 2004 165 Interview with HbR on 5 July 2004.
159
Report prepared for the NMa

Charle s
Rive r
Asso c iate s
7.1 T
Duringpositioeffect o
It is geconcentration in port calls and an increase in transhipment.166 However, HbR also pointed out
4 rends
the course of our research we identified a number of trends that may affect the market n of the port of Rotterdam. As many of these trends have offsetting effects the overall n the market position of the port of Rotterdam is ambiguous.
nerally perceived to be the case that the trend to larger container vessels will lead to a
that with the increase in container traffic smaller ports get called at more often.
Figure 14: Maximum shipsize (TEU) built that year
Maximum shipsize (TEU)built in that year
0
1000
2000
3000
4000
5000
6000
7000
8000
9000
10000
1970 1975 1980 1985 1990 1995 2000 2005
year -->
TE
U -
->
Source: Information provided by HbR on 12 July 04.
The maximum ship size expected by HbR will be about 12500 TEU with a draught of 16-17m. The current maximum draught is 14.5 metres; in the next years maximum draught will be 15 metres. The increase in the shipsize will benefit ports like Rotterdam, which can offer unrestricted access for large vessels.
We identified the following other relevant trends:
• The share of carrier haulage differs across shipping companies. However, generally, forwarders are expected to take over more of the hinterland transport from liners. 167
• The Hamburg terminal operator HALA works together with Deutsche Bahn and has traditionally tried to attract trade flows to Bremerhaven and Hamburg. Whether they will be able to do so in the future is unclear now that DB has bought NS cargo. Railion has a strong influence on the direction of cargo flows. DB owns about 70-80%
166 European Commission, Case No. COMP/JV.55 Hutchinson/RCPM/ECT, 3 July 2001, p. 34. 167 Interview with [confidential] on 6 July 2004.
160
Report prepared for the NMa
Charle s
Rive r
Asso c iate s
of the German inland ports and hubs (e.g. in Munich). A changebelieved to potentially benefit the port of Rotterdam. Liner compan
in this policy is ies are also trying
to increase their influence on these hubs.168
the existing terminal ECT) commits this line to Rotterdam. Moreover, the European Rail Shuttle (ERS), which departs from Rotterdam, is owned by Maersk Sealand and
S operates a rail shuttle network in Continental Europe, and the German seaports with more than 18 destinations.
According to ERS its success is based on the availability of the base volume of the two shareholders, “which ensured and still ensures continuity and long term
at have traditionally focused on specific general cargo
• The introduction of road tolls in Germany is likely to have an effect on road mileage in Germany and could re-direct cargo flows from Hamburg and Bremerhaven to Rotterdam.169
• The works at the motorway ring of Antwerp currently negatively affect Antwerp. Once finished the hinterland road network of Antwerp will be of higher quality.
• P&O Nedlloyd’s planned investment in the Euromax terminal (a joint venture with
P&O Nedlloyd. ERinterlinking Rotterdam
stability”.170
The increasing containerisation implies that more and more general cargo (which is bound to the port) is shipped by container. This implies that in the future a higher share of containers may be “captured” and that ports thtypes (like Amsterdam on cacao) may have to attract container services to remain attractive.
168 Interview with [confidential] on 6 July 2004. 169 Interview with [confidential] on 6 July 2004. 170 http://www.ersrail.nl/facts.html
161
Report prepared for the NMa

8 Roll-on/roll-off and other general cargo
Roll-on/roll-off (roro) and other general cargo are the two least important cargo types in the port of Rotterdam, measured in terms of throughput in tons. Roro represents 3.2% and other general cargo 2.5% of total throughput in Rotterdam. These low shares reflect the strength of
re n
the share in total throughput. General cargo othe ners and distri ccounts for 8% of the harbour dues and 11% of the lease related revenue.171
RVIEW
Roro comprises cars and other vehicles that are shipped as trade goods and freight that is kept ied
d containers on chassis.
y services between Rotterdam and the east coast of the United Kingdom.172 In this trade, it is possible to distinguish routes
origin and destination of the roro cargo shipped through Rotterdam is located near the port of Rotterdam (Westland) or along the Rhine.
harbour dues to be paid in Rotterdam.
Rotterdam in bulk goods, but also the ongoing trend to containerise general cargo. The shaof general cargo other than containers and distribution in total revenues is slightly higher tha
r than contai bution a
8.1 Roll-on/roll-off
8.1.1 OVE
on trucks or on a trailer. Rotterdam has facilities for both accompanied and unaccompantransport an
Over 90% of HbR’s revenue in this sector is generated by ferr
across the Short French Sea (e.g. Calais-Dover), Western Channel routes (north coast of France and the south of the UK), and North Sea routes. Ferries from Rotterdam operate exclusively on the North Sea routes. The destinations served by Rotterdam are also served by the ports of Amsterdam (including IJmuiden), Antwerp, Vlissingen and Zeebrugge.
Zeebrugge accounts for the largest roro throughput of ports that operate on the North Sea trade. According to the Havenplan 2020 of HbR, competition with Zeebrugge is limited as most of the
This is confirmed by the benchmarking of harbour dues. Harbour dues for a representative roro vessel in Zeebrugge are almost half of those at Rotterdam. Rotterdam charges higher harbour dues than all other Benelux ports that operate on the North Sea trade, with one significant exception: Antwerp, which charges twice the
As with other cargo types, harbour dues are only part of generalised costs of a chosen trade route. However, the share of harbour dues in total call costs is higher than for containers and,
171 HbR Rentabiliteitsberichtgeving 2003. 172 Havenplan 2020, p. 38 and information provided by HbR 26 October 2004.
Report prepared for the NMa

Charle s
Rive r
Asso c iate s
depending on the nature of the cargo, the terminal costs may also be significantly lower (trucks do not require handling). However, other factors play an important role, like the time spent on sea (mostly overnight services) and the hinterland transportation costs in the United Kingdom. A small change in total route cost is therefore unlikely to lead to a significant shift from the North Sea trade to other Anglo/Continental trades. This suggests an upper bound for the relevant geographical market that is shown in Table 58.
Table 58: Roll-on/roll-off market shares for Benelux ports servicing North Sea routes in 2003
Throughput (million tons)
Share
Amsterdam 0.7 2%
Rotterdam 10.5 35%
Antwerp 6.0 20%
Vlissingen 2.1 7%
Zeebrugge 11.1 37%
Total 30.4 100%
Totals may not add up to 100 due to rounding. Source: CRA calculations based on port of RoVlissingen.
tterdam, “Port Statistics 2003” and information on the website of the port of
The key points that lead to this definition were the following:
cation of ports suggest that it is currently al to serve the east coast ain from other ports than those included in a ferry market. Close to respondents to our survey said that they
h to one of the markets ur definition. HbR considers Zeebrugge, nts for the largest roro throughput of ports that operate on the North Sea trade, as
idence that the hinterland on the continent is to a large extent local, or confined to the Benelux countries and locations in Germany along
For the decision to move cargo from the North Sea to the French short sea market total considered.
terdam can sustain higher price differences compared to Zeebrugge (46% less expensive), Amsterdam (-23%) and Vlissingen (-23%). The only exception to the rule that HbR’s harbour dues over all its types of cargo are the largest of all ports is roro harbour dues in Antwerp, which are double those of Rotterdam. According to HbR, however, this situation is likely to reflect the fact that the tariff benchmark in Antwerp captures the tariff for car cargo vessels rather than ferry
The non-existence of routes and the geographical lonot economic of Great Britthe North Se 90% of the would switc included in owhich accouthe most important competitor. There is also ev
the Rhine.
generalised cost (including hinterland transportation in Great Britain) are to beGiven the low share of harbour dues in total generalised cost, an increase in harbour dues by five to ten percent is unlikely to lead to a significant shift from the North Sea ferry market to other ferry markets, like the market for the French short sea.
Even across the ports serving the North Sea ferry market the port of Rot
163
Report prepared for the NMa
Charle s
Rive r
Asso c iate s
services. Antwerp has traditionally focussed more on cars, whereas Rotterdam’s main roro business is ferry services. The markets are likely to be separate, and the differentiated but equally raised harbour dues are an indication of pricing power of both Antwerp (for cars) and Rotterdam (for ferry services), rather than a competitive discipline for HbR.
Com aRot dbodies,limited. This conclusion was based on Hinterland considerations. This conclusion is con mthe leas g r erry market sho availab port seems mainly driven by transport cost considerations for the origin and destination pairs of the cargo.
p ring the ports that operate in the North Sea ferry market shows that the port of ter am has a market share of 35%. In the Havenplan 2020, published by HbR and other
competition with the most important rival in that market, Zeebrugge, was seen as
fir ed by the benchmarking analysis. Note, however, that the finding that roro traffic is t captive car o type would suggest that competition within the No th Sea f
uld be more intense. Contrary to cargo types like bulk cargo, specific investments and the ility of industry at the port seems less relevant. The choice of
8.1.2 PORT USERS
The following table shows the four most important roro customers of HbR in terms of income generated through harbour dues.
Table 59: Top four roro clients at the port of Rotterdam in 2003 in terms of harbour dues
Name of roro company Harbour dues paid in 2003
[confidential] [confidential]
[confidential] [confidential]
[confidential] [confidential]
[confidential] [confidential]
Source: Information provided by HbR on 16 September 2004.
All named companies operate ferry services between Rotterdam and the United Kingdom.
8.1.3 MAIN ROUTES AND THROUGHPUT IN THE ANGLO/CONTINENTAL MARKET
More than 90% of the roro throughput in Rotterdam is freight on ferries between Rotterdam (including Hoek van Holland, which is managed by HbR) and central and north United Kingdom.173 Some of the ferries also carry passengers but in both Antwerp and Rotterdam, passenger traffic plays a minor role and we do not analyse it separately.174
173 Havenplan 2020, Rotterdam 2004, p. 38. 174 Interview with [confidential] on 12 July 2004.
164
Report prepared for the NMa
Charle s
Rive r
Asso c iate s
From the shippers’ perspective, roro is part of the market for unitised freight services, which includes, besides the maritime services, freight services via the Channel Tunnel operated by Le Shuttle (Eurotunnel).
, Boulogne,
e east coast of the United Kingdom.
d
The duration of a crossing of a Short Sea servic bly shorter than a crossing on ea or the Western Channel and the Short Sea offers the highest number of In 2000 roughly 5.2 million freight units were carried on the Anglo/Continental
cluding Eurotunnel), with short Sea accounting for about half of that volume.179 est market shares for unitised freight services in this trade are at Calais, Le Shuttle
gge.180
erry operators calling at Rotterdam serve ports at the East Coast of the UK. P&O North tween the English port of Hull, Zeebrugge in
vice ration of crossing of about 6 hours on a normal ferry and a high speed service with a
transit time of 3 hours and 40 minutes. Cobelfret operates services from the CdMR Botlek
According to the Havenplan 2020, the cargo on the roro routes consists mainly of industrial and agricultural goods from Westland. Competition with Zeebrugge is said to be limited
The Anglo/Continental roro traffic can be divided in:
• Short Sea consisting of routes across the Short French Sea (Calais, DieppeDunkirk (and the Channel Tunnel)), the Belgian Straits (Ostend) and Dover, Folkstone, Ramsgate, and Newhaven in England.175
• North Sea consisting of routes between Zeebrugge, Rotterdam, Vlissingen176, Amsterdam177 and ports at th 178
• Western Channel consisting of routes between ports on the south coast of the UniteKingdom and ports on the north coast of France (e.g. Le Havre).
e is considerathe North Sfrequencies.market (inThe highand Zeebru
Four fSea Ferries run an overnight ferry service beBelgium and Rotterdam in Holland. Stenaline operates a Harwich – Hoek of Holland serwith a du
terminal at the port of Rotterdam to Purfleet and Immingham.181 Both destinations are also served from Zeebrugge. DFDS Tor Line operates services to Immingham (transit time about 9 hours) as well. Rotterdam furthermore has a number of roro services to Scandinavia.
175 http://www.zeebruggeport.be/N/beleidsplan.pdf and EEC 4064/89: P&O Stena Line merger decision,
7.8.2002. 176 The port of Vlissingen is managed by Zealand Seaports port authority which also manages the Port of
Terneuzen. 177 DFDS Seaways operates a ferry service between Newcastle and Ijmuiden. The port of Ijmuiden is managed
by the Amsterdam port authority. 178 In http://www.zeebruggeport.be/N/beleidsplan.pdf the port of Scheveningen was also mentioned. The
Norfolkline, a subsidiary of Maersk, operates a ferry service from Felixstowe to Snot included Scheveningen because no roro statistics are available and in 2002 the
cheveningen. We have total throughput of the
port was limited to 4.6 million tons. The possibilities for expansion are limited as the harbour is surrounded by housing areas (see http://www.minvenw.nl/dgg/dgg/nl/scheveningen.shtml).
179 EEC 4064/89: P&O Stena Line merger decision, 7.8.2002. 180 http://www.zeebruggeport.be/N/beleidsplan.pdf 181 http://www.cobelfret.com/con_03_01.html. According to HbR the port served by Cobelfret is Killinghome.
165
Report prepared for the NMa

Charle s
Rive r
Asso c iate s
because of the regional origin and destination of the cargo.182 HbR identifies the Benelux countries and locations in Germany along the river Rhine as the most important hinterland d
arket shares (in me hat operate on the North Sea routes. rted roro volume /Continental traffic.
Roro statistics for the entire HLH are not easily av include lift-on/lift-off traffic, which can also be categorised as
container traffic. Below we report the figures provided by HbR for all Benelux ports that
Table 60: Roll-on/roll-off market shares for Benelux ports servicing North Sea routes in 2003
estinations.
Table 60 lists m tric tons) for the ports tNote that the repo includes some non Anglo
ailable as some ports include roro traffic ingeneral cargo and some also
operate ferries on North Sea routes.
Throughput (million tons)
Share
Amsterdam 0.7 2%
Rotterdam 10.5 35%
Antwerp 6.0 20%
Vlissingen 2.1 7%
Zeebrugge 11.1 37%
Total 30.4 100%
Totals may not add up to 100 due to rounding. Source: CRA calculations based on port of Rotterdam, “Port Statistics 2003” and information on the website of the port of Vlissingen.
Rotterdam is a considered a small car port. The Rotterdam Car Terminal has ,000 ain car ports in the HLH range are Zeebrugge (1.5 million cars per year) and n (1.2 million). However, Antwerp183 is also considered a large car port and other
den and Barcelona.184
UCTURE OF HARBOUR DUES
has a specific tariff for roro vessels (whether or not in liner service). There are two r sea-going roro vessels, depending on whet ore than 67.8% of the GT of
arged in Rotterdam. If the quantity of cargo moved in Rotterdam is equal or higher than 67.8% of the vessel’s GT, the applicable tariff is a fixed fee per GT of the vessel. If the share of quantity moved in Rotterdam is lower than 67.8% of the vessel’s GT, an additional fee per metric ton of moved cargo is levied.
room for 35cars. The mBremerhavecar ports are Em
8.1.4 STR
Rotterdamtariffs fo her less or mthe vessel are loaded and/or disch
182 Havenplan 2020, Rotterdam 2004, p. 38. 183 There are specialised terminals operated by Hessenatie and Mexico Natie but motor cars are also handled
by a number of non-specialised terminals. 184 Interview with [confidential] on 8 July 2004.
166
Report prepared for the NMa
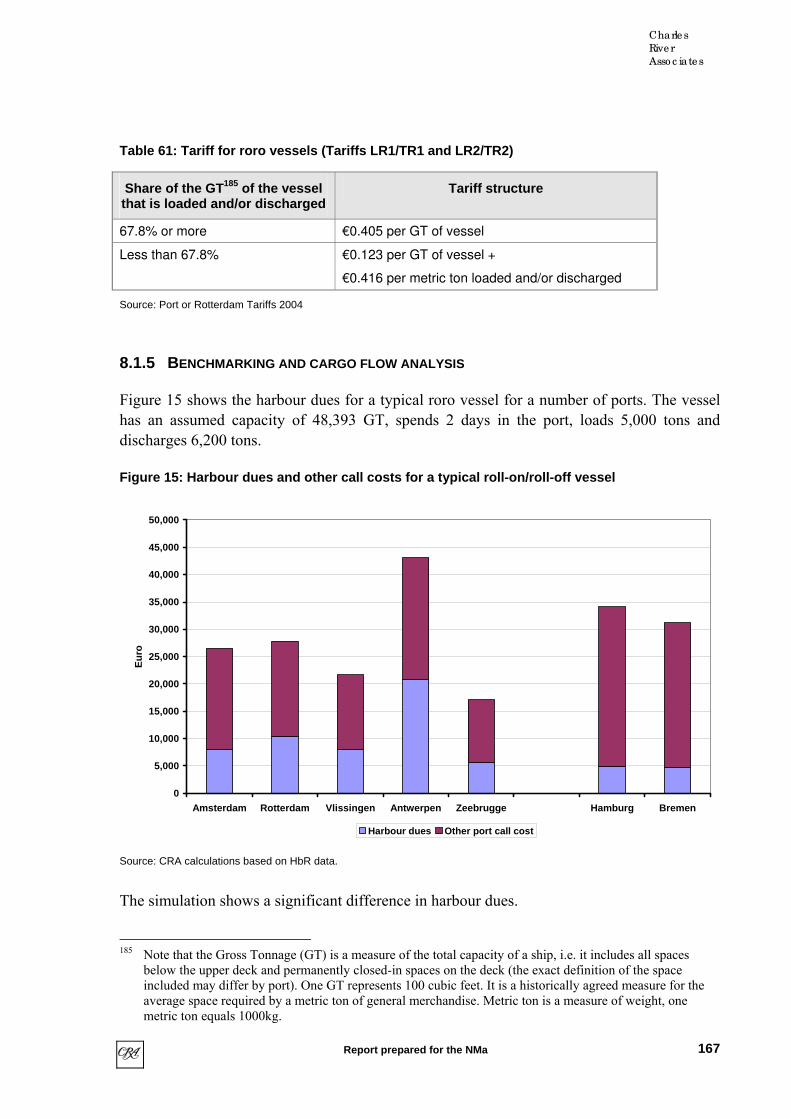
Charle s
Rive r
Asso c iate s
Table 61: Tariff for roro vessels (Tariffs LR1/TR1 and LR2/TR2)
Share of the GT 185 of the vessel that is loaded and/or discharged
Tariff structure
67.8% or more €0.405 per GT of vessel
Less than 67.8% €0.123 per GT of vessel +
€0.416 per metric ton loaded and/or discharged
Source: Port or Rotterdam Tariffs 2004
8.1.5 BENCHMARKING AND CARGO FLOW ANALYSIS
Figure 15 shows the harbour dues for a typical roro vessel for a number of ports. The vessel has an assumed capacity of 48,393 GT, spends 2 days in the port, loads 5,000 tons and discharges 6,200 tons.
Figure 15: Harbour dues and other call costs for a typical roll-on/roll-off vessel
25,000
30,000
35,000
40,000
45,000
50,000
Eur
o
15,000
0
5,000
10,000
20,000
Amsterdam Rotterdam Vlissingen Antwerpen Zeebrugge Hamburg Bremen
Harbour dues Other port call cost
Source: CRA calculations based on HbR data.
The simulation shows a significant difference in harbour dues.
185 Note that the Gross Tonnage (GT) is a measure of the total capacity of a ship, i.e. it includes all spaces
below the upper deck and permanently closed-in spaces on the deck (the exact definition of the space included may differ by port). One GT represents 100 cubic feet. It is a historically agreed measure for the average space required by a metric ton of general merchandise. Metric ton is a measure of weight, one metric ton equals 1000kg.
167
Report prepared for the NMa

Charle s
Rive r
Asso c iate s
Table 62: Percentage difference in harbour dues compared to Rotterdam
Harbour dues per call Difference to Rotterdam
Rotterdam 10,425
Amsterdam 8,074 -23%
Vlissingen 7,988 -23%
Antwerp 20,721 +99%
Zeebrugge 5,643 -46%
Hamburg 4,912 -53%
Bremen 4,776 -54%
Source: CRA calculations based on HbR data.
The benchmarking suggests significant price differences between ports. Antwerp charges double the amount of the next highest harbour dues per call (Rotterdam). According to HbR, however, this situation is likely to reflect the fact that the tariff benchmark in Antwerp captures the tariff for car cargo vessels rather than ferry services. Antwerp is big in cars, whereas Rotterdam’s main roro business is ferry services. Rotterdam in turn can price significantly higher than the other Benelux ports that operate in the North Sea ferry business.
Thus, with the exception of Antwerp the price benchmarking confirms the general picture that Rotterdam is at the upper end of the pricing range. Particularly interesting is the large difference to Zeebrugge, which serves similar destinations in central and north United Kingdom. This suggests that the port of Rotterdam has some pricing power.
For the given information the benchmarking would suggest that at equal prices, Rotterdam would be significantly constrained by Antwerp. Antwerp and Rotterdam together would not be constrained by the rival ports.
Harbour dues account for 37% of total call costs for the typical vessel (see Figure 15). For freight on trucks terminals costs are lower than those for containers and the hinterland transport mode is on the road. For accompanied freight, the time on ship is also a major factor determining cargo flows. Thus, compared to the analysis of container cargo flows in Section 7.8, harbour dues play a more important role in total call costs and terminal handling fees are likely to be lower for most shipments. However, hinterland transportation and the cost for the ferry are the largest cost items (see also Section 7.9). They have significant influence on the choice of the cargo routing. The fact that ferry operators offer transfers to Zeebrugge and Rotterdam from the same British ports despite the large difference in harbour dues is illustrative for this result.
168
Report prepared for the NMa

Charle s
Rive r
Asso c iate s
8.1.6 EVIDENCE OF SWITCHING
of switching in response to changes in harbour dues, confirming the overall picture obtained for other cargo types. However, we received only 3 responses from the sector in total.
o the North 186
8.1.7 TRENDS
We have not obtained evidence
The port choice of car terminals and car manufacturers depends on the logistical requirements of the car manufacturers. For example, Toyota imports 250,000 cars per year and has chosen Zeebrugge as a hub, because of the good short sea connection (they have introduced a hub and spoke system with spokes to UK and Valencia). Mazda has a greater focus nWest European hinterland and has chosen Antwerp as the main port.
In our survey we received responses from two firms operating in the car segment. Both have pointed to Zeebrugge and Antwerp as possible substitutes for their operations at Rotterdam. One respondent also regards Le Havre and Amsterdam as possible substitutes. One other respondent pointed out that there is no captive volume and that cargo could easily be shifted to Amsterdam.
A forwarding agency that specialises in general cargo and operates facilities in Rotterdam and Hamburg points to Antwerp and Hamburg as substitutes for Rotterdam.
HbR expects an increase in hinterland shipments of cars by barges to Germany. The port authority also hopes to accommodate another roro company in the port.
186 Interview with [confidential] on 8 July 2004.
169
Report prepared for the NMa
8.2 Other gener
ERVIEW
ral cargo cons f products like fruit, forest products and goods in lash units , paper). The se had been continuous lining, also reflecting the increase in
nerisation. Howeve 003 other general cargo increased again by 14%.187
is the agri-food throughput, which is often transported on specialised reefers and on pallets. The port of Rotterdam claims to have Europe’s most
y specialised transport companies are located at or very near the port. These companies offer temperature controlled storage space and offer services like quality and stock control, reconditioning, re-packaging,
.189
cargo. The trade pattern are heterogenous, there are
There is no available evidence on past switching in response to an increase in harbour dues. Th poi most important substitute port.
ber of respondents also portant but rnative.
arking analysis confirms picture obtained for other cargo types. the most expensive port, although harbour dues are very similar to those in
hing is confined mostly to the ARA-range ports and the overlap in the hinterland suggests that the ARA-range is an upper bound on the relevant market.
al cargo
8.2.1 OV
Other gene ists o(iron, steel ctor ly deccontai r, in 2
One important segment in Rotterdam
important trade and distribution centre for fresh fruit, vegetables and fruit juices.188 More than 200 specialised importers, exporters and distributors and more than fift
ripening and labelling
The availability, quality and price of these value added services are likely to be important factors for the choice of port for general no major trade routes.
e survey respondents nted to Antwerp as the Interestingly, a numrelevant alte
pointed to Vlissingen as a less im
Our benchm the generalRotterdam isAmsterdam. This evidence, the fact that switc
187 HbR Annual report 2003. 188 Havenplan 2020, p. 39. 189 HbR Fruitport brochure.
Report prepared for the NMa

Charle s
Rive r
Asso c iate s
Table 63: Market shares in the ARA range
Throughput (million tons)
Market share (%)
Amsterdam 5.8 17%
Rotterdam 8.3 25%
Antwerpen 14.4 43%
Vlissingen 5.3 16%
Total 33.8 100%
Totals mSource:
ay not add up to 100 due to rounding. CRA calculations
to the other cargo types, the results also indicate that pricing power for other r, for example, liquid bulk.
PORT USERS
HbR for other general cargo in terms of ough harbour dues.
Compared general cargo is not as pronounced as fo
8.2.2
The following table shows the main customers ofincome generated thr
Table 64: Top four general cargo clients at the port of Rotterdam in 2003 in terms of harbour dues
Name of liner company Harbour dues paid in 2003
[confidential] [confidential]
[confidential] [confidential]
[confidential] [confidential]
[confidential] [confidential]
Source: Information provided by HbR on 16 September 2004.
8.2.3 T HLH- HROUGHPUT IN THE RANGE
Table 65 shows the throughput in the HLH range. Note that the figures for Hamburg and Bremen are inflated as they include roro traffic as well. The statistics exclude Zeeland Seaports (Vlissingen and Terneuzen), which report a throughput of 5.3 million tons for other general cargo.
171
Report prepared for the NMa

Charle s
Rive r
Asso c iate s
Table 65: Throughput and market shares of ports in the HLH-range for general cargo other than roro and containers (2003)
Throughput (million tons)
Market share (%)
Hamburg* 2.6 6%
Bremen* 6.5 14%
Amsterdam** 5.8 12%
Rotterdam 8.3 18%
Antwerpen 14.4 31%
Gent 1.9 4%
Zeebrugge 0.7 1%
Duinkerken 1.6 3%
Le Havre 0 0%
Vlissingen** 5.3 11%
Total 47.1 100%
*Includes roro traffic. ***Includes Ijmuiden. ***Includes Terneuzen. Totals may not add up to 100 due to rounding. S
s that Antwerp, Rot unt for 68% of the throughput .
8.2.5 STRUCTURE OF HARBOUR DUES
Generalised cargo (other than container and roro) is usually shipped in tramp vessels, i.e. vessels that are chartered on a case-by-case basis and do not follow a specified schedule of calls. In Rotterdam, there are two tariffs for sea-going tramp vessels, depending on whether less or more than 133.2% of the GT of the vessel are loaded and/or discharged in Rotterdam. If the quantity of cargo moved in Rotterdam is equal or higher than 133.2% of the vessel’s GT, the applicable tariff is a fixed fee per GT of the vessel. If the share of quantity moved in Rotterdam is lower than 133.2% of the vessel’s GT, an additional fee per metric ton of moved cargo is levied.
ource: HbR port statistics
Table 65 show terdam and Amsterdam accoin the HLH range
8.2.4 TRADE PATTERN
For general cargo, there is no specific major trading route, but trading routes are worldwide.190 In 2003, about 66% of the throughput at the port of Rotterdam that was classified as “other general cargo” was incoming cargo, 34% was outgoing cargo.191
190 Information provided by HbR on 16 September 2004.
172
Report prepared for the NMa

Charle s
Rive r
Asso c iate s
Table 66: Tariff for tramp v essels (Tariffs TS1 and TS2)
Share of the GT 192 of the vessel that is loaded and/or discharged
Tariff structure
133.2% or more €0.858 per GT of vessel (TS 1)
Less than 133.2% €0.271 per GT of vessel +
€0.441 per metric ton loaded and/or discharged (TS2)
Source: Port or Rotterdam Tariffs 2004
Should a sea-going general cargo vessel operate in liner service, a different tariff is applicable. Again, there are two tariffs for non-container liner vessels, depending on whether less or more than 62.1% of the GT of the vessel are loaded and/or discharged in Rotterdam. If the quantity of cargo moved in Rotterdam is equal or higher than 62.1% of the vessel’s GT, the applicable tariff is a fixed fee per GT of the vessel. If the share of quantity moved in Rotterdam is lower than 62.1% of the vessel’s GT, an additional fee per metric ton of moved cargo is levied.
Table 67: Tariff for liner vessels (Tariffs LS1 and LS2)
Share of the GT 193 of the vessel that is loaded and/or discharged
Tariff structure
62.1% or more €0.518 per GT of vessel (LS1)
Less than 62.1% €0.260 per GT of vessel +
er metric ton loaded and/or discharged LS2) €0.416 p
Source: Port or Rotterdam Tariffs 2004
of HbRs revenue 194
The most relevant tariff is TS2, the tramp vessel tariff that is charged if the weight of the cargo loaded or discharged is less than 133.2% of the GT of the vessel. 84%in this segment stems from this tariff. 9% is billed according to the liner tariff LS2.
tterdam, Port Statistics 2003.
Gross Tonnage (GT) is a measure of the total capacity of a ship, i.e. it includes all spaces e upper deck and permanently closed-in spaces on the e exact definition of the space
ed may differ by port). One GT represents 100 cubic fee historically agreed m he pace required by a metric ton of general merchandise ton is a measure of w ne n equals 1000kg.
at the Gross Tonnage (GT) is a measure of the total capacity of a ship, i.e. it includes all spaces the upper deck and permanently closed-in spaces on the e exact definition of the space ed may differ by port). One GT represents 100 cubic fee historically agreed m he
of general merchandise. Metric ton is a measure of weight, one
194 Information provided by HbR 26 October 2004
191 Port of Ro192 Note that the
below th deck (thinclud t. It is a easure for taverage smetric to
. Metric eight, o
193 Note thbelowinclud
deck (tht. It is a easure for t
average space required by a metric tonmetric ton equals 1000kg.
173
Report prepared for the NMa
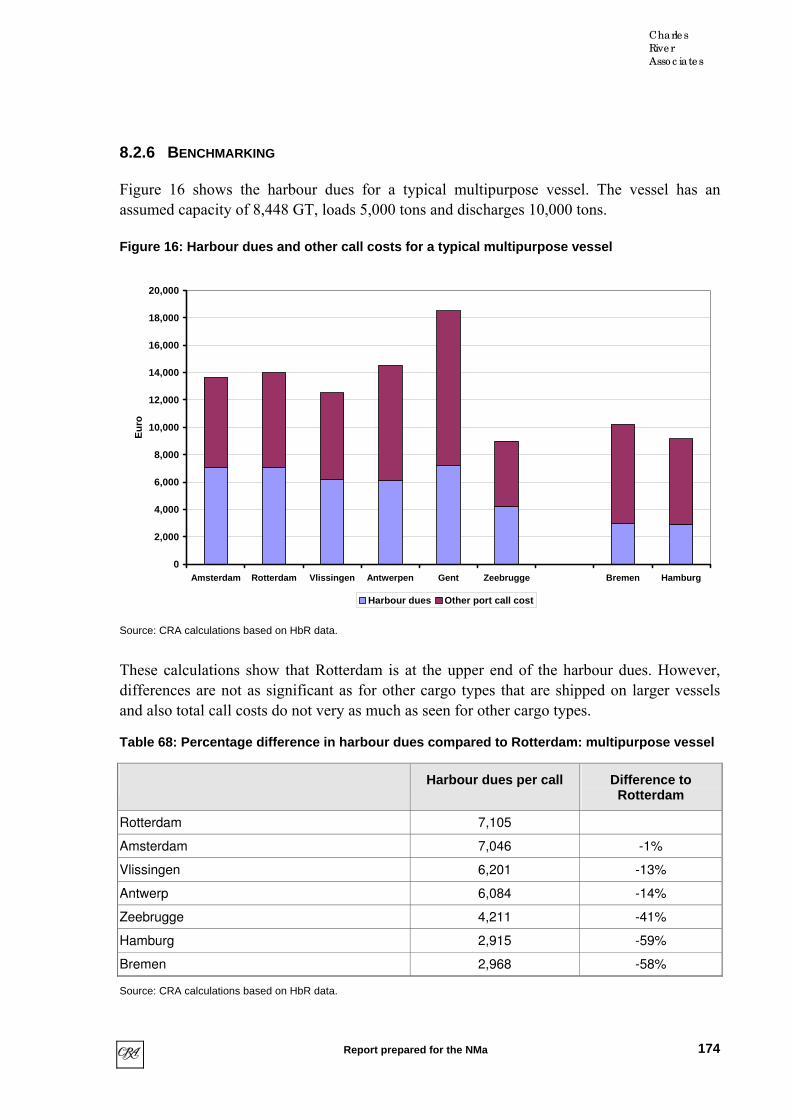
Charle s
Rive r
Asso c iate s
8.2.6 BENCHMARKING
Figure 16 shows the harbour dues for a typical multipurpose vessel. The vessel has an assumed capacity of 8,448 GT, loads 5,000 tons and discharges 10,000 tons.
Figure 16: Harbour dues and other call costs for a typical multipurpose vessel
10,000
12,000
14,000
16,000
18,000
20,000
Eur
o
0
2,000
4,000
6,000
8,000
Amsterdam Rotterdam Vlissingen Antwerpen Gent Zeebrugge Bremen Hamburg
Harbour dues Other port call cost
Source: CRA calculations based on HbR data.
These calculations show that Rotterdam is at the upper end of the harbour dues. However, differences are not as significant as for other cargo types that are shipped on larger vessels and also total call costs do not very as much as seen for other cargo types.
Table 68: Percentage difference in harbour dues compared to Rotterdam: multipurpose vessel
Harbour dues per call Difference to Rotterdam
Rotterdam 7,105
Amsterdam 7,046 -1%
Vlissingen 6,201 -13%
Antwerp 6,084 -14%
Zeebrugge 4,211 -41%
Hamburg 2,915 -59%
Bremen 2,968 -58%
Source: CRA calculations based on HbR data.
174
Report prepared for the NMa

Charle s
Rive r
Asso c iate s
The benchmarking suggests less pronounced price differences between the Dutch ports. However, Rotterdam remains the most expensive port.
8.2.7 EVIDENCE OF SWITCHING
The respondents to our questionnaire reflect the variety of other general cargo. One of the spondents provides freight forwarding, inland shipping and warehousing for paper, timber
and plywood. The respondent considers 50% of the total volume as captive, mainly due to pecific investments in facilities at or near the port but also because of long-term contracts
with other service providers in the port and due to the fact that generalised route cost is lower r Rotterdam than for other ports. The respondent would shift volume in response to a ten
percent increase in total cost of shipping cargo through Rotterdam. The main destination would be Antwerp (50%) followed by Bremen and Hamburg (15% each), Felixstowe (10%) and Amsterdam and Vlissingen (5% each).
Another respondent operates in the segment for specialised cargo. This respondent considers all shipments as captive. He mentioned that Antwerp tried to lure customers away from other ports by offering package deals for new type of cargo, mainly for offshore tug and barge. The respondent complained that HbR had no interest in special cargo and would not show any flexibility, which would lead to switching to other ports including Vlissingen. The respondent would choose Antwerp and Vlissingen as equally attractive alternative ports.
Yet another respondent that operates in freight forwarding of project cargo and machinery felt that there is no captive volume at all. The respondent mentioned that it had switched due to an increase in total call cost, however, and not due to a specific increase in harbour dues.
Another freight forwarding company that operates with steel tubes and oilfield related materials also felt that there is no captured volume. The respondent pointed out that there are less and less possibilities for break bulk liner shipments at the port of Rotterdam, which lead to a transfer of cargo to Vlissingen over the past 15 years. The transfer was also attributed to the high call cost at Rotterdam. In response to a 10% increase in total cost of shipping cargo through Rotterdam, that respondent would shift 50% of cargo to other ports, mainly to Antwerp (80%), but also to Vlissingen (20%).
On average about 50% of the cargo volume is considered as captive and only 22% of volume would be switched in response to a ten percent increase in total port related costs.
No respondent said to have switched in the past in response to an increase in harbour dues.
re
s
fo
175
Report prepared for the NMa
Charle s
Rive r
Asso c iate s
8.2.8 TRENDS
HbR hopes to acquire more general cargo (mainly steel and forest products) as a result of the accommodation of new breakbulk terminals at the port.
176
Report prepared for the NMa
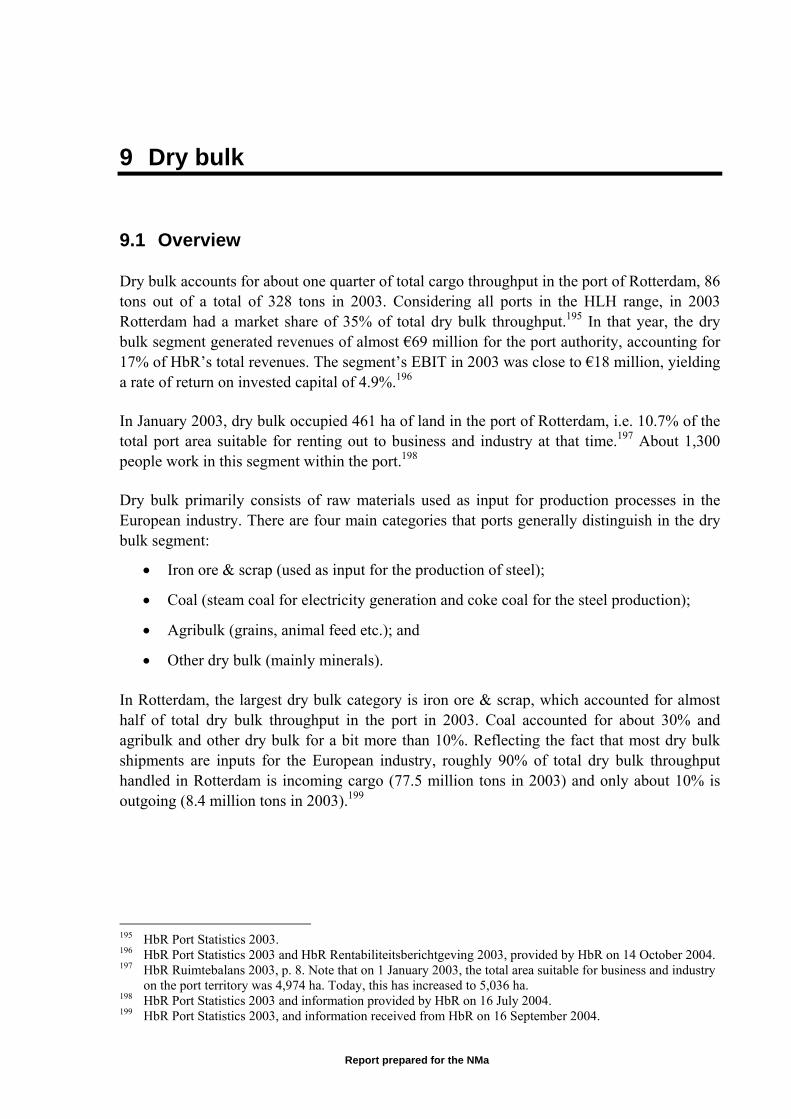
9 Dry bulk
9.1 Overview
Dry bulk accounts for about one quarter of total cargo throughput in the port of Rotterdam, 86 tons out of a total of 328 tons in 2003. Considering all ports in the HLH range, in 2003 Rotterdam had a market share of 35% of total dry bulk throughput.195 In that year, the dry bulk segment generated revenues of almost €69 million for the port authority, accounting for 17% of HbR’s total revenues. The segment’s EBIT in 2003 was close to €18 million, yielding
196
re four main categories that ports generally distinguish in the dry
r almost
a rate of return on invested capital of 4.9%.
In January 2003, dry bulk occupied 461 ha of land in the port of Rotterdam, i.e. 10.7% of the total port area suitable for renting out to business and industry at that time.197 About 1,300 people work in this segment within the port.198
Dry bulk primarily consists of raw materials used as input for production processes in the European industry. There abulk segment:
• Iron ore & scrap (used as input for the production of steel);
• Coal (steam coal for electricity generation and coke coal for the steel production);
• Agribulk (grains, animal feed etc.); and
• Other dry bulk (mainly minerals).
In Rotterdam, the largest dry bulk category is iron ore & scrap, which accounted fohalf of total dry bulk throughput in the port in 2003. Coal accounted for about 30% and agribulk and other dry bulk for a bit more than 10%. Reflecting the fact that most dry bulk shipments are inputs for the European industry, roughly 90% of total dry bulk throughput handled in Rotterdam is incoming cargo (77.5 million tons in 2003) and only about 10% is outgoing (8.4 million tons in 2003).199
195 HbR Port Statistics 2003. 196 HbR Port Statistics 2003 and HbR Rentabiliteitsberichtgeving 2003, provided by HbR on 14 October 2004. 197 HbR Ruimtebalans 2003, p. 8. Note that on 1 January 2003, the total area suitable for business and industry
on the port territory was 4,974 ha. Today, this has increased to 5,036 ha. 198 HbR Port Statistics 2003 and information provided by HbR on 16 July 2004. 199 HbR Port Statistics 2003, and information received from HbR on 16 September 2004.
Report prepared for the NMa

Charle s
Rive r
Asso c iate s
All dry bulk cargoes share certain characteristics. For example, the same handling facilities can be used for the different cargo types.200 Most dry bulk terminals in the port of Rotterdam handle at least two or even more dry bulk cargo types without the need to make any major changes to the handling infrastructure. The two largest dry bulk terminal operators in Rotterdam (EMO and EECV) handle both iron ore and coal. Moreover, one of the respondents to our survey confirmed that the same facility capacities can indeed be used for these two cargo types. EBS, the third largest terminal operator, handles coal, agribulk and other dry bulk. Iron ore and coal are also interrelated to some extent due to the fact that in ma clarg cship both co
In general, dry bulk cargo is mainly carried by panamax vessels (60,000-79,000 DWT). For iron rused. F er dry bulk, handysize carriers are widely employed as well (10,000-39,000 DWT). The different vessel sizes used have important implications for the nec aonly c i.e. the ports between
for general tramp vessel harbour dues is applicable. It depends on the vessel’s o discharged and/or loaded in
Rotterdam. Almost 80% of all dry bulk throughput in Rotterdam is charged with a fixed fee per GT of the vessel. HbR does not price differentiate between coal, iron ore and other dry bulk vessels, but offers a frequency reduction scheme for agribulk vessels. The introduction
bates was triggered by g demand from agibulk shippers.202 There is also a f for non-container line els, but this has practically no relevance.203
to Rotterdam, other ports in the ARA range – in particular Amsterdam and Antwerp riffs for very large dry k vessels in order to compensate shippers for the less
rable draught restrictions at th orts. This implies that, due to the absence of draught be expected to have more pricing power for larger vessels.
ny ases both substances are needed for the same end use, the production of steel. Many e ustomers, in particular German steel producers such as Thyssen Krupp Stahl (TKS),
mmodities through Rotterdam regularly.
o e shipments and coal, capesize vessels with 80,000 DWT and more are also commonly or minerals and oth
201
ess ry draught of the ship. In particular, many capesize vessels can – when fully loaded – all in Rotterdam and at no other port in the ARA range,
Amsterdam and Antwerp.
The overwhelming majority of dry bulk vessels does not operate in liner service. Hence, the tariff specifiedgross tonnage and in some cases on the amount of carg
of these re stronspecial tarif r vess
Contrary– cap their ta bulfavou ese prestrictions in Rotterdam, HbR can
200 This applies especially to transhipment, i.e. discharging and loading, equipment. (Floating) cranes can
handle in principle all dry bulk cargoes. For storage, separate facilities may be required in order not to mix up the different cargo types.
201 Benchmark Droge Bulk, p. 24 and additional information provided by HbR on 16 July 2004. 202 Other reasons for the introduction of this discount were the declining EU market for grains and efforts of
the port of Rotterdam to maintain its market shares. 203 Very late in the process of this study, HbR reported that for agribulk and dry bulk exceptional discounts are
granted for new volumes brought to Rotterdam. The negotiation of harbour dues also for dry bulk and mainly for agribulk and other dry bulk shipments was confirmed by our survey results. However, HbR did not provide any information about the level of these discounts, whether other ports granted similar incentives etc. Hence, we do not consider these discounts in our analysis, but assume that relative harbour dues for dry bulk cargo are reflected by the ports’ official list prices.
178
Report prepared for the NMa

Charle s
Rive r
Asso c iate s
HbR provided us with a list of ports that it perceives as its most important competitors in the dry bulk segment. We have not restricted our analysis to these ports, but have instead included all orts in the H aile lk throughput and capacity, draught restrictions, pr our dues, other port related costs and hinterland transport. We have also taken the results of our survey into account. Based on these inputs,
efined the different markets for dry bulk based on the different cargo types. Our ilar to, but not identica the assessment of HbR. In particular, based on the
available to us, we define t levant geographic m as follows:
Iron ore & scrap: Rotterdam as a lower bound and Rotterdam, Amsterdam, Antwerp bound.
• Coal: Rotterdam as a lower bound and Rotterdam, Amsterdam and Antwerp as an
• Agribulk: Rotterdam Rotterdam Antwerp and Gent as an upper bound.
• Other dry bulk: Rotterdam as a lower bound and Rotterdam, Amsterdam, werp,Gent, Zeebrugge an ssingen as an upper
arket shares of the port of Rotterdam in these market 70% (iron ore over 50% (coal) and 44% (agribulk) to 29% (other dry bulk), as can be seen in the
below.
: Relevant market for iron ore pper bound
p LH range in our deticing of harb
d analysis of dry bu
we have dresult is sim l withevidence he re arkets
• and Vlissingen as an upper
upper bound.
as a lower bound and , Amsterdam,
Ant d Vli bound
In 2003, m s ranged from& scrap)tables
Table 69 & scrap – u
Throughput in 2003 in million tons
Market share in 2003
Rotterdam 39.9 70%
Amsterdam 10.3 18%
Antwerp 6.9 12%
Vlissingen204
0.2 0%
Total 5 100% 7.3
Totals may Source: CR
not add up to 100 due to rounding. A calculations based on HbR Port St and information on the web e port of Vlissingen. atistics site of th
204 Note that although the market share of Vlissingen is very low in this market at the moment, this port still
provides fringe capacity for iron ore & scrap.
179
Report prepared for the NMa
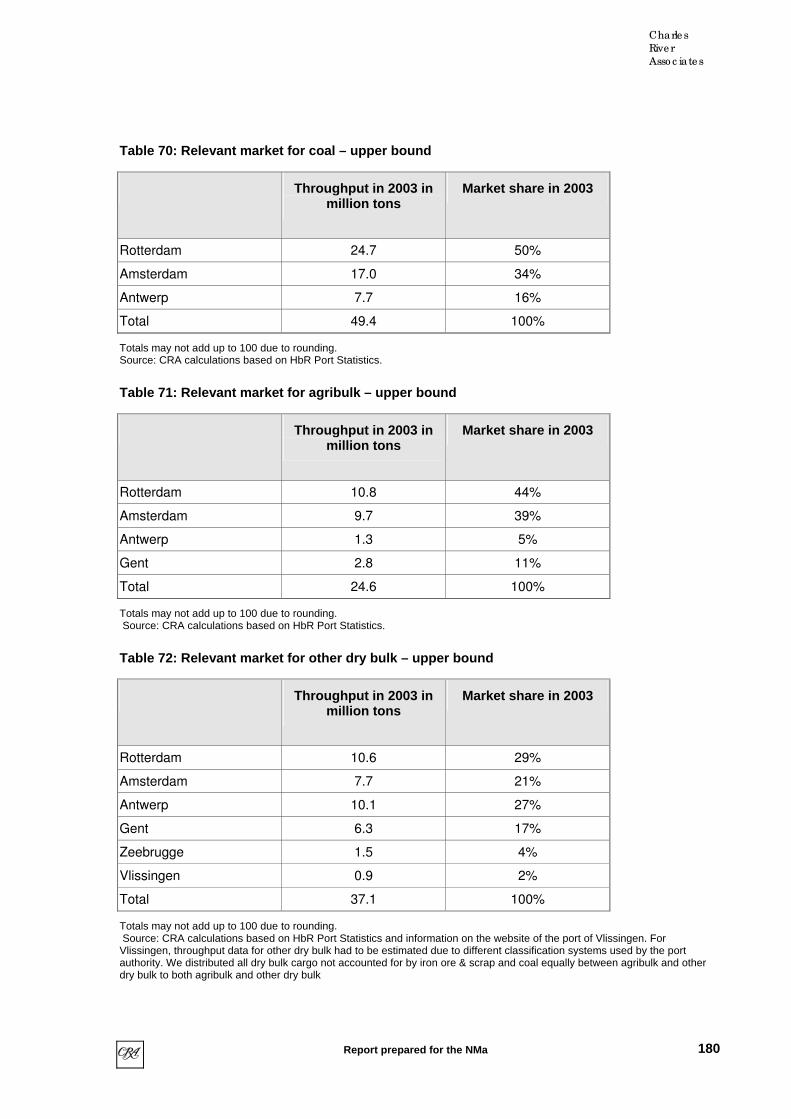
Charle s
Rive r
Asso c iate s
Table 70: Relevant market for coal – upper bound
Throughput in 2003 in million tons
Market share in 2003
Rotterdam 24.7 50%
Amsterdam 17.0 34%
Antwerp 7.7 16%
Total 49.4 100%
Totals may not add up to 100 due to rounding. Source: CRA calculations based on HbR Port Statistics.
Table 71: Relevant market for agribulk – upper bound
Throughput in 2003 in million tons
Market share in 2003
Rotterdam 10.8 44%
Amsterdam 9.7 39%
Antwerp 1.3 5%
Gent 2.8 11%
Total 24.6 100%
Totals may not add up to 100 due to rounding. Source: CRA calculations based on HbR Port Statistics.
Table 72: Relevant market for other dry bulk – upper bound
Throughput in 2003 in million tons
Market share in 2003
Rotterdam 10.6 29%
Amsterdam 7.7 21%
Antwerp 10.1 27%
Gent 6.3 17%
Zeebrugge 1.5 4%
Vlissingen 0.9 2%
Total 37.1 100%
Totals may not add up to 100 due to rounding. Source: CRA calculations based on HbR Port Statistics and information on the website of the port of Vlissingen. For Vlissingen, throughput data for other dry bulk had to be estimated due to different classification systems used by the port authority. We distributed all dry bulk cargo not accounted for by iron ore & scrap and coal equally between agribulk and other dry bulk to both agribulk and other dry bulk
180
Report prepared for the NMa
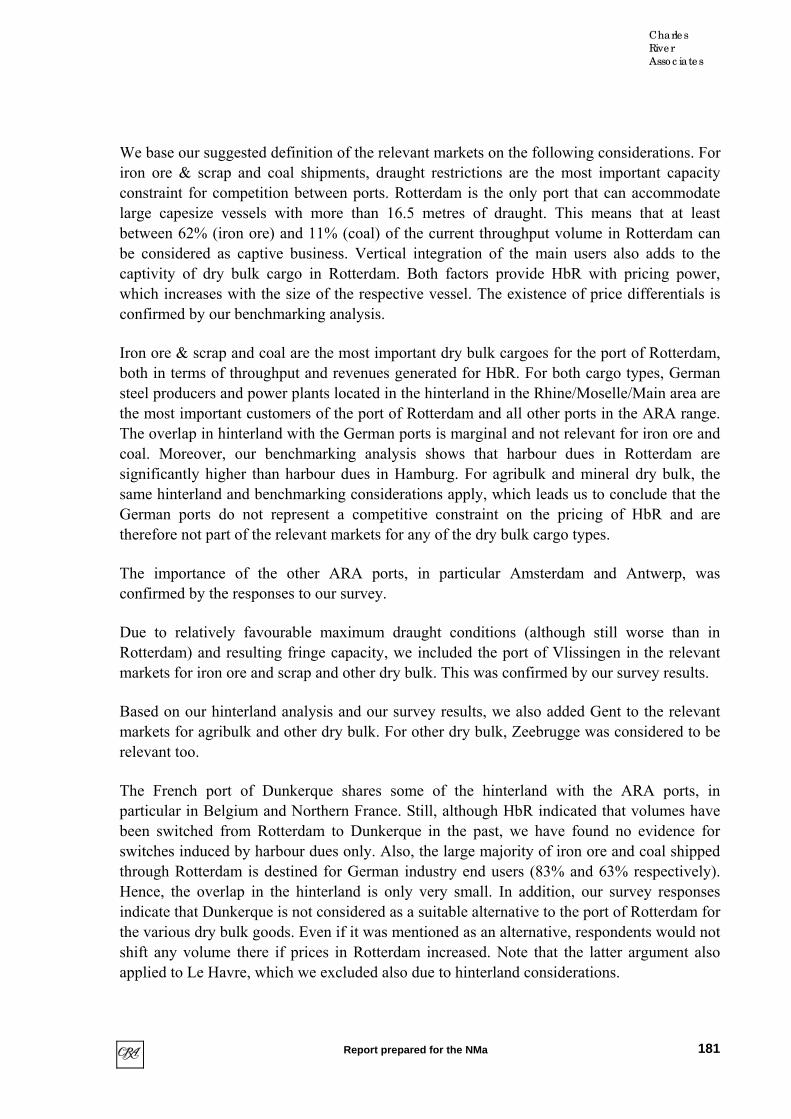
Charle s
Rive r
Asso c iate s
We base our suggested definition of the relevant markets on the following considerations. For iron ore & scrap and coal shipments, draught restrictions are the most important capacity constraint for competition between ports. Rotterdam is the only port that can accommodate large capesize vessels with more than 16.5 metres of draught. This means that at least between 62% (iron ore) and 11% (coal) of the current throughput volume in Rotterdam can be considered as captive business. Vertical integration of the main users also adds to the captivity of dry bulk cargo in Rotterdam. Both factors provide HbR with pricing power, which increases with the size of the respective vessel. The existence of price differentials is confirmed by our benchmarking analysis.
Iron ore & scrap and coal are the most important dry bulk cargoes for the port of Rotterdam, both in terms of throughput and revenues generated for HbR. For both cargo types, German steel producers and power plants located in the hinterland in the Rhine/Moselle/Main area are the most important customers of the port of Rotterdam and all other ports in the ARA range. The overlap in hinterland with the German ports is marginal and not relevant for iron ore and coal. Moreover, our benchmarking analysis shows that harbour dues in Rotterdam are
n harbour dues in Hamburg. For agribulk and mineral dry bulk, the same hinterland and benchmarking considerations apply, which leads us to conclude that the
The importance of the other ARA ports, in particular Amsterdam and Antwerp, was
survey results, we also added Gent to the relevant markets for agribulk and other dry bulk. For other dry bulk, Zeebrugge was considered to be
evidence for switches induced by harbour dues only. Also, the large majority of iron ore and coal shipped
indicate that Dunkerque is not considered as a suitable alternative to the port of Rotterdam for the various dry bulk goods. Even if it was mentioned as an alternative, respondents would not shift any volume there if prices in Rotterdam increased. Note that the latter argument also applied to Le Havre, which we excluded also due to hinterland considerations.
significantly higher tha
German ports do not represent a competitive constraint on the pricing of HbR and are therefore not part of the relevant markets for any of the dry bulk cargo types.
confirmed by the responses to our survey.
Due to relatively favourable maximum draught conditions (although still worse than in Rotterdam) and resulting fringe capacity, we included the port of Vlissingen in the relevant markets for iron ore and scrap and other dry bulk. This was confirmed by our survey results.
Based on our hinterland analysis and our
relevant too.
The French port of Dunkerque shares some of the hinterland with the ARA ports, in particular in Belgium and Northern France. Still, although HbR indicated that volumes have been switched from Rotterdam to Dunkerque in the past, we have found no
through Rotterdam is destined for German industry end users (83% and 63% respectively). Hence, the overlap in the hinterland is only very small. In addition, our survey responses
181
Report prepared for the NMa

Charle s
Rive r
Asso c iate s
Note that we have not defined different markets for smaller and larger vessels, although in all of the markets as defined above there are vessels that can only call in Rotterdam and at none of the other ports, due to Rotterdam’s good open sea access with no draught restrictions for fully loaded vessels. Given this competitive advantage, it is clear that the pricing power of HbR is less restricted by its competitors the larger the respective vessel is. This is especially relevant for iron ore and coal, which are often carried in large capesize vessels that need more than 17 metres of draught. Nevertheless, our analysis has shown that HbR has pricing power not only for large vessels, but also with respect to smaller vessels. This is confirmed by the benchmarking of harbour dues, which shows that while price differences between Rotterdam and other ports in the relevant market are largest for large vessels (harbour dues per ton of shipped cargo were 54% lower in Amsterdam than in Rotterdam for a shipment of 150,000 tons of steam coal in 2001), they can also be significant for smaller vessels. For example, in
bulk goods shipped into Europe is materials ean industry is dependent on imports of iron
ore, coal, agribulk and other mine
& scrap and coa an G a ost important end users of the cargo shipped through Rotterdam
hipped through Rot tin st . W an 60% is shipped erm , b ric duction. The port of Rotterdam a bo ll l
decreasing coal pro er es em l rough the European
agribulk are, for ex rosuch as minerals like chromium ag it inc ,
aoline) are used mainly for construction and as input for the chemical industry.206 The majority of agribulk and other dry bulk throughput shipped through Rotterdam is transported onwards to the Dutch and German hinterland.
Contrary to the container segment, dry bulk is mainly a tramp business, i.e. vessels are chartered for a particular shipment on a case-by-case basis and there are hardly any liner
2003 harbour dues per ton of shipped cargo for a shipment of 55,000 tons of coal were 18% less in Amsterdam than they were in Rotterdam.
9.2 Port users
As mentioned already, the primary type of dry for industrial production in Europe. The Europ
rals.
For iron orecompanies are the m
l, European d especially erman steel nd electricity. 80% of
the iron ore s terdam is des ed to German eel producers ith regard tocoal, more th onwards to G an end users oth for elect ity generationand steel pro ccounts for a ut 40% of a German coaimports. The duction in G
205many translat into higher d and for coa
shipments th ports.
End users of ample, the Eu pean food and cattle feed industry. Other dry bulk ( ore, m nesite, ilmen e, lead and z concentratebauxite, mineral sands, vermiculite and k
205 HbR Annual Report 2003, p. 10 206
http://www.portofrotterdam.com/Business/UK/Cargo_and_Terminals/Dry_Bulk/Investmentinformation/Agribulk/Index.asp, http://www.portofrotterdam.com/Business/UK/Cargo_and_Terminals/Dry_Bulk/Investmentinformation/Mineralsandotherdrybulk/Index.asp and HbR Annual Report 2003, p. 10.
182
Report prepared for the NMa
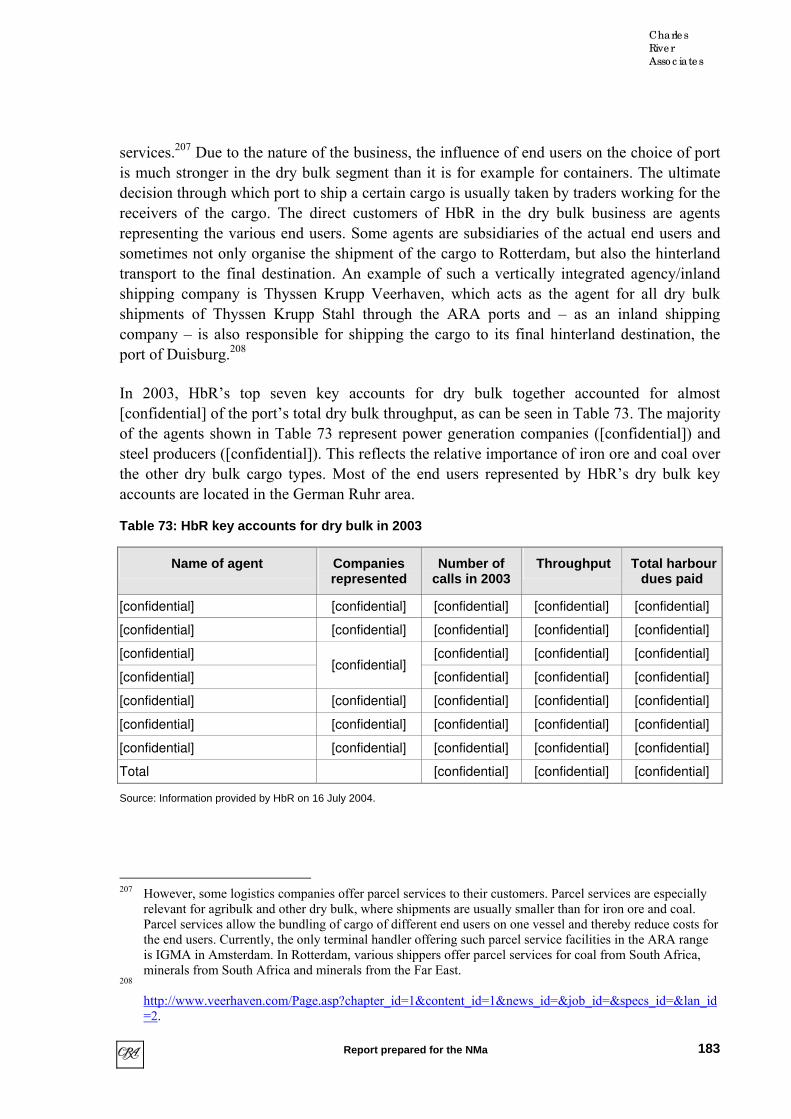
Charle s
Rive r
Asso c iate s
services.207 Due to the nature of the business, the influence of end users on the choice of port is much stronger in the dry bulk segment than it is for example for containers. The ultimate decision through which port to ship a certain cargo is usually taken by traders working for the receivers of the cargo. The direct customers of HbR in the dry bulk business are agents
In 2003, HbR’s top seven key accounts for dry bulk together accounted for almost
representing the various end users. Some agents are subsidiaries of the actual end users and sometimes not only organise the shipment of the cargo to Rotterdam, but also the hinterland transport to the final destination. An example of such a vertically integrated agency/inland shipping company is Thyssen Krupp Veerhaven, which acts as the agent for all dry bulk shipments of Thyssen Krupp Stahl through the ARA ports and – as an inland shipping company – is also responsible for shipping the cargo to its final hinterland destination, the port of Duisburg.208
[confidential] of the port’s total dry bulk throughput, as can be seen in Table 73. The majority of the agents shown in Table 73 represent power generation companies ([confidential]) and steel producers ([confidential]). This reflects the relative importance of iron ore and coal over the other dry bulk cargo types. Most of the end users represented by HbR’s dry bulk key accounts are located in the German Ruhr area.
Table 73: HbR key accounts for dry bulk in 2003
Name of agent Companies represented
Number of calls in 2003
Throughput Total harbour dues paid
[confidential] [confidential] [confidential] [confidential] [confidential]
[confidential] [confidential] [confidential] [confidential] [confidential]
[confidential] [confidential] [confidential] [confidential]
[confidential] [confidential]
[confidential] [confidential] [confidential]
[confidential] [confidential] [confidential] [confidential] [confidential]
[confidential] [confidential] [confidential] [confidential] [confidential]
[confidential] [confidential] [confidential] [confidential] [confidential]
Total [confidential] [confidential] [confidential]
Source: Information provided by HbR on 16 July 2004.
207 However, some logistics companies offer parcel services to their customers. Parcel services are especially
relevant for agribulk and other dry bulk, where shipments are usually smaller than for iron ore and coal. Parcel services allow the bundling of cargo of different end users on one vessel and thereby reduce costs for the end users. Currently, the only terminal handler offering such parcel service facilities in the ARA range is IGMA in Amsterdam. In Rotterdam, various shippers offer parcel services for coal from South Africa, minerals from South Africa and minerals from the Far East.
208 http://www.veerhaven.com/Page.asp?chapter_id=1&content_id=1&news_id=&job_id=&specs_id=&lan_id=2.
183
Report prepared for the NMa

Charle s
Rive r
Asso c iate s
For all dry bulk categories, the markets of end users are relatively concentrated. While this is especially significant for iron ore and coal, concentration is also increasing in the agribulk s
For iron ore an end users account for a relatively high share of total cargo
iary of [c l] million tons of iron ore and co idential] of total iron ore &
d coal that year (64 million tons).210 According to our survey, a large electricity comp hipped
m rdam in 2003, accounting for [confidential] of total coal thr t year (25 million tons).211
The significanc d users shipping dry bulk through Rotterdam is further enhanced l and RAG) have stakes in dry bulk
terminal facilities at the port of Rotterdam. Thyssen Krupp owns (together with its subsidiary Thyssen Krupp Veerhaven and Hüttenwerke Krupp Mannesmann) EECV, the second largest
put accou ssen Krupp utilises [confidential] of the capacity of EECV. As already mentioned, a large electricity company [confidential] receives the coal for its
volume away from Rotterdam in case of an increase in harbour dues by HbR.
The main origins of dry bulk cargo shipped to Rotterdam are Latin and North America, South Africa, and Australia. Some minerals also come from Asia and Europe. Table 74 shows the main trade routes for dry bulk cargo shipped to Rotterdam.
ector.209
d coal, only a few throughput in Rotterdam. For example, [confidsubsid
ential], the agent and inland shipping onfidential], shipped between [confidential] and [confidentiaal through Rotterdam in 2003, representing [conf
scrap an throughput inany, which operates a power generation facility on the Maasvlakte, s
[confidential] illion tons of coal through Rotteoughput in tha
e of major enby the fact that some of them (e.g. Thyssen Krupp Stah
coal and iron ore terminal in the port of Rotterdam. In fact, the annual cargo throughnted for by Thy 212
facilities directly from the EMO terminal via conveyor belts.213 To the extent that end users have made such investments, it can be expected that they have an interest in fully utilising their facilities and hence shipping cargo through Rotterdam. Clearly, vertically integrated port users will be less willing to shift
209 Benchmark Droge Bulk, p. 21, provided by HbR on 16 July 2004. 210 Interview with [confidential] , Port Statistics 2003. 211 CRA questionnaire and Port Statistics 2003. 212 Interview with [confidential], and information from www.eecv.nl. 213 [Confidential] and information provided by HbR on 5 July 2004.
184
Report prepared for the NMa

Charle s
Rive r
Asso c iate s
Table 74: Main trade routes of dry bulk shipments coming to Rotterdam
Cargo type Main routes trade
Iron ore Transatlantic (B Rotterdam, C da – Rotterdam
Australia – Euro
razil – ana )
pe
Coal Transatlantic (So Africa – Rotte , Colombia – Rotterdam)
Australia-Europe (Newcastle, Australia – Rotterdam)
uth rdam
Agribulk Transatlantic
(Lower Mississippi – Rotterdam. Co bia – Rotterdam azil – Rotterdalom , Br m)
Other dry bulk Transatlantic (S. Africa-Rotterdam)
Asia-Europe
Intra Europe
Source: Information provided by HbR on 16 July 2004 and 26 Oc 004.
Throughput and capacity constrai nts of dryARA range
. r
Amsterdam includes data for all Amsterdam ports, i.e. Amsterdam, Beverwijk,
tober 2
9.3 bulk ports in the
Table 75 shows the dry bulk throughput in the whole Hamburg-Le Havre range in 2003Table 76 shows the corresponding market shares. Note that the throughput data fo
Velsen/IJmuiden and Zaanstadall.
185
Report prepared for the NMa

Charle s
Rive r
Asso c iate s
Table 75: Dry bulk throughput in the HLH range in 2003, in million tons
Iron ores & scrap Coal Agribulk Other dry bulk
Hamburg 10.2 4.9 6.6 6
Bremen 4.6 1.5 1 1.6
Wilhelmshaven 0 1.5 0 0.7
Amsterdam 10.3 17 9.7 7.7
Rotterdam 39.9 24.7 10.8 10.6
Antwerp 6.9 7.7 1.3 10.1
Gent 4.1 3.6 2.8 6.3
Zeebrugge 0 0 0 1.5
Dunkerque 12.7 9.1 1.1 2.9
Le Havre 0 2.1 0.7 2.1
Vlissingen 0.2 1.1 0.9 0.9
Terneuzen 0 0.8 2.5 2.5
Total 88.9 74 37.4 52.9
Source: HbR Port Statistics 2003. Amsterdam data includes throughput data for all ports in the “Havenregio”, i.e. Amsterdam, Beverwijk, Velsen/IJmuiden and Zaanstadall. For Vlissingen and Terneuzen, information taken from the websites of the port authorities. For Vlissingen and Terneuzen, throughput data for agribulk and other dry bulk had to be estimated due to different classification systems used by the port authorities. We distributed all dry bulk cargo not accounted for by iron ore & scrap and coal equally between agribulk and other dry bulk to both agribulk and other dry bulk.
Table 76: Dry bulk market shares in the HLH range in 2003
Iron ores & scrap Coal Agribulk Other dry bulk
Hamburg 11% 18% 11% 7%
Bremen 5% 3%2% 3%
Wilhelmshaven 0% 2% 0% 1%
Amsterdam 26% 15% 12% 23%
Rotterdam 45% 33% 29% 20%
Antwerp 8% 310% % 19%
Gent 5% 5% 7% 12%
Zeebrugge 0% 0% 0% 3%
Dunkerque 14% 3% 5% 12%
Le Havre 0% 3% 2% 4%
Vlissingen 0% 1% 2% 2%
Terneuzen 0% 1% 7% 5%
Total 100% 100% 100% 100%
Totals may not add up to 100 due to rounding. Source: HbR Port Statistics 2003. Amsterdam data includes throughput data for all ports in the “Havenregio”, i.e. Amsterdam, Beverwijk, Velsen/IJmuiden and Zaanstadall. For Vlissingen and Terneuzen information was taken from the websites of the port
186
Report prepared for the NMa

Charle s
Rive r
Asso c iate s
authorities. For Vlissingen and Terneuzen, throughput data for agribulk and other dry bulk had to be esclassification systems used by the port authorities. We distributed all dry bulk cargo not accounted for
timated due to different by iron ore & scrap and
coal a
Based for oth s in the HLH range clearly are Rotterdam and Amsterdam. Zeebrugge does not seem to play a role tbusines
Capac
For mathe maare capcapesiz e a draught of up to 14 met s.ran aport usnumbemaximwith a where
Table 7
equ lly between agribulk and other dry bulk to both agribulk and other dry bulk.
on the whole HLH range, the market share of the port of Rotterdam ranges from 20% er dry bulk to 45% for iron ore & scrap. Based on Table 76, the main dry bulk port
a all for iron ore & scrap, coal and agribulk, but has some limited other dry bulk s.
ity constraints due to draught restrictions
ny dry bulk shipments, the most direct constraint with regard to the choice of port is ximum draught the various ports allow for. Typical vessels for the shipment of iron ore esize vessels with a draught of about 17 metres and more. Coal is also often shipped in e vessels (about 50%) or in panamax vessels, which can hav214re Table 77 shows the maximum draught possible in the various ports in the ARA
ge s well as in Gent and Dunkerque. These are the main ports that were mentioned by ers and by HbR as possible substitute ports for Rotterdam in the dry bulk business. The rs in Table 77 show that Rotterdam is the port with the best open sea access and the um draught. The EECV terminal on the Maasvlakte can accommodate dry bulk vessels draught of up to 23.65 metres. The second-deepest berth is available in Dunkerque,
vessels with a draught of up to 18 metres can call.
7: Maximum draught for dry bulk carriers in the ARA ports
Main terminals Maximum draught
Rotterd EMO, EECV, EBS 23.65 mam
Amsterdam ports OBA Bulk, Rietlanden, IGMA 16.5 m at Ijmiuden locks215
13.72 m in Amsterdam
Antwerp Delwaidedok Terminal, Kanaaldok Terminal, Leopolddok/Hansadok
Terminal, Belgian Scrap Terminal Waasland Canal
15.6 m
(restricted by depth of the Scheldt, max draught at berth 17.5 m)
Vlissingen/Terneuzen OVET 16.5 m216
Gent 13.5 m
Dunkerque Novrac / Seabulk 18 m
Source: Websites of the ports of Amsterdam/Ijmuiden, Rotterdam, Vlissingen/Terneuzen, Gent, Zeebrugge and Dunkerque and websites of terminal operators located at these ports.
214 Information provided by HbR on 16 July 2004 and 26 October 2004. 215 According to HbR, there are plans to increase the draught in Amsterdam to 17.5 metres in 2005
(information provided by HbR on 26 October 2004). If these plans are realised, our capacity constraint analysis might need to be revised.
216 According to HbR, there are plans to increase the draught in Vlissingen to 17 metres. However, the timing of this expansion is unclear (information provided by HbR on 26 October 2004).
187
Report prepared for the NMa

Charle s
Rive r
Asso c iate s
Some clarifying remarks on the choice of ports in the table above are due:
• Neither HbR nor our survey respondents mentioned Zeebrugge as an important port for iron o &re scrap, coal and agribulk. To our knowledge, Zeebrugge does not have
• In our survey, Moerdijk was mentioned by some respondents as a possible substitute coal. However, Moerdijk forms part
of the Moerdijk/Rotterdam ports, in which the harbour dues set by HbR apply. Hence, treat s a separat y in the rem this s
ither HbR nor of our surve rts as competitors of the port of Rotterdam iron ore & s we will s is is
nfirmed by our cargo flow and hinterland analysis. agribulk an r dry burg m a role too. However, based on our
chmarking and hinterland analysis, we conclude that the German ports are not part the relevant m or agribulk er dry bulk e
In principle, the Dunkerque aximum draught of 18 m ould he port of Rotterdam for large dry bulk carriers. However,
dents to our user survey when being asked which ports represent potential alternatives for Rotterdam for iron ore & scrap, coal and
any handling facilities for these cargo types and we therefore did not analyse its draught restrictions, which would mainly apply to iron ore and coal shipments.217
for the port of Rotterdam for iron ore & scrap and
we do not Moerdijk a e entit ainder of tudy.
• Ne any y respondents considered the German po for coal. A
218how, th
cobulk, HbR indicated that Ham
For d otheay play
benof arkets f and oth ither.
• port of , with a m etres, crepresent an alternative for tit was not mentioned by any respon
agribulk shipments. One respondent mentioned Dunkerque as a potential alternative for other dry bulk. However, respondents did not expect any other dry bulk cargo to be re-routed from Rotterdam to Dunkerque in case of an increase in total port related costs in Rotterdam. The same survey results apply to Le Havre.219 Based on these survey results we conclude that – despite their unconstrained seaside access – the French ports do not form a competitive constraint for HbR. In the following, we will therefore exclude them from the analysis of the relevant markets for all dry bulk cargo types.220
217 Compare Port of Zeebrugge, “Beleidsplan MBZ NV”. This strategic document does not discuss dry bulk
cargo at all. Also, Zeebrugge did not have any iron ore & scrap or coal throughput in 2003 (Port Statistics 2003).
218 Hansaport, the largest dry bulk operator in Germany located in Germany, ships 65% of its incoming iron ore and coal to the steel manufacturing plants of Salzgitter AG in North Germany. Most of the hinterland transport is done by rail, which is in sharp contrast to the hinterland transport patterns of the ARA ports (http://www.hafen-hamburg.de/html-engl/handbook/3.4.html). Due to hinterland transport restrictions, the ARA ports are not considered to be competitive in this area, which suggests two different geographic markets.
219 CRA questionnaire. 220 According to HbR, Dunkerque belongs to the most important competitors of the port of Rotterdam with
regard to iron ore and coal, especially for end users in Belgium and Northern France. However, 80% of the iron ore throughput and 63% of the coal throughput in Rotterdam are shipped to Germany, which means that the overlap in the Belgian and French hinterland is relatively small. Very late in the process of this study, HbR indicated that in the past there has been switching of iron ore volume from Rotterdam to Dunkerque. However, HbR did not provide any details on this switch and it was not confirmed by our survey responses. Hence, we still conclude that Dunkerque does not form part of the relevant market for iron ore and coal.
188
Report prepared for the NMa

Charle s
Rive r
Asso c iate s
The draught restrictions at other ports displayed in Table 77 show that a number of vessels, although not necessarily the cargo contained in them, are captured in Rotterdam when they are fully loaded.221
Table 78 presents the share of throughput for the different cargo types in Rotterdam by draught of the respective vessel.
Table 78: Share of dry bulk throughput by vessel draught
Vessel draught Iron ores Coal Agribulk Other dry bulk
Unknown 0.5% 2.5% 5.4% 4.0%
<10 m 8.0% 4.0% 34.2% 61.6%
10-15 m 4.3% 18.1% 60.4% 31.8%
15-17.5 m 25.3% 64.4% 0.0% 2.6%
>17.5 m 61.9% 11.1% 0.0% 0.0%
Total 100% 100% 100% 100%
Totals may not add up to 100 due to rounding. Source: Information provided by HbR on 26 October 2004.
The data in Table 78 shows the importance of large carriers especially for iron ore, but also for coal. For iron ore, about 62% of all cargo throughput was shipped in vessels with a draught of more than 17.5 metres, which means that they could not have called at any other port in the ARA range. For coal, the share of throughput shipped in vessels with more than 17.5 metres of draught was around 11%. Hence, at least 62% of the iron ore throughput and at least 11% of the coal throughput currently shipped through Rotterdam are captive business for the port, based on the current structure of vessels being used. Note that the share of captive throughput could be even higher, given that at least some of the vessels in the 15-17.5 metre category are likely to have a draught of more than 16.5 metres, which would mean that Rotterdam is the only ARA port where those vessels can call.
There are 2 to 3 vessels used for dry bulk shipments today that can only call at the port of Rotterdam at all times. One of them is the Berge Stahl, which was specifically designed and built for the transport of iron ore from Ponta da Madeira, Brazil, to Rotterdam. The Berge Stahl calls at Rotterdam about nine or ten times a year, carrying about 365,000 tons of iron ore each time.222 The vessel has a draught of 22.5 metres, which means that it is totally captured in the port of Rotterdam. No other port in the ARA range provides an alternative. Hence, about 3.65 million tons of iron ore – the maximum total shipments of the Berge Stahl
221 In principle, up to a maximum draught of 18 metres these vessels could call at Dunkerque too. However, for
the reasons explained above, we exclude Dunkerque from our analysis based on the survey evidence we gathered.
222 http://www.veerhaven.com/News.asp?chapter_id=30&News_ID=10
189
Report prepared for the NMa
Charle s
Rive r
Asso c iate s
per year – are captive iron ore business for the port of Rotterdam. This was about 9% of the total iron ore throughput in Rotterdam in 2003.223
As already mentioned, the usual vessel size employed for the shipment of agribulk and other dry bulk is significantly smaller than for iron ore and coal. As Table 78 shows, for agribulk, most throughput in Rotterdam was shipped in vessels with a draught between 10 and 15 metres, which means that the main ARA ports (Amsterdam, Antwerp and Vlissingen) could have accommodated the vessels too. For agribulk, there is currently no throughput that is bound to Rotterdam due to draught restrictions. For other dry bulk, there is some potentially
at other ports in the ARA range will mean giving up on the economies of scale of using large vessels for the
cargo. Coming back to the example of the Berge Stahle, it seems very n Krupp would use a different ship than the one specifically built for the
unloaded, in IJmuiden (maximum draught of
stricts access to the port of Antwerp to panamax and smaller vessels.226
According to HbR, it happens regularly that fully loaded vessels with a deep draught first call at Rotterdam, are partially unloaded and then ship their remaining cargo to another port with higher draught restrictions than Rotterdam.227 However, when fully loaded, these vessels are still obliged to call in Rotterdam before moving on to the next port. This “call pattern” could
captive throughput volume, but compared to iron ore and coal it is marginal (at most 2.6%). Most vessels shipping other dry bulk through Rotterdam could have called at any other ARA port.
Note that our estimates for captive business provided above are based on the assumption that the current pattern of vessel sizes remains constant. According to HbR, the size of the ships and the cargo load is ultimately determined by the brokers and charterers and those always have the option to choose smaller vessels that can call at other ports in Europe.224 While this argument is in principle true, it is nevertheless important to consider that a change in vessel size involves extra costs. Choosing smaller vessels in order to be able to call
sea transport of bulkunlikely, that Thyssepurpose of transporting iron ore from Brazil to Rotterdam.
While in principle many vessels are captured in Rotterdam due to their draught requirements, by discharging part of their cargo even the largest vessels can reduce their draught and subsequently enter many more European ports. In the ports of Amsterdam for example, large dry bulk vessels can by lightened, i.e. partly 16.5 metres) and subsequently pass the lock and enter the port of Amsterdam (maximum draught of 13.72 metres).225 The same approach can be applied in Antwerp, where vessels can be lightened on the river Scheldt before passing the port locks. Note that although the maximum draught at the terminals in Antwerp is 17.5 m (capesize), only vessels with a maximum of 15.6 m can steam up the river Scheldt, which effectively re
223 HbR Port Statistics 2003. 224 Information provided by HbR on 16 July 2004. 225 http://www.amsterdamports.com 226 “Port of Antwerp – The dry bulk alternative in the heart of Europe”, p. 3. 227 Information provided by HbR on 26 October 2004.
190
Report prepared for the NMa

Charle s
Rive r
Asso c iate s
represent a competitive constraint on HbR’s price setting if these partially unloading vessels generated significantly lower harbour dues than vessel who fully discharge in Rotterdam. Ho ed th hat o ulk t in Rotterdam is charged according to the tariff TS1, which is set as a fixed fee per GT and is levied only if 133.2% or more of the GT of the vessel are discharged and/or loaded in
n a escription of the tariff structure applicable to dry for the majority of dry bulk cargo shipped through Rotterdam, partial
unloading (at least not below 133.2% of their GT) d t loyed.
In addition to the practical considerations discussed ent applies. In general, given that port costs account for only a s hare of nsport chain cost of shipping dry bulk cargo (i.e. sea transport, port related cost rland transport, compare Section 9.8), switching of port users in response to an increase in port dues,
lves for lightening and the use e port of
ith regard to l dry bulk vessels, mainly as a result of its maxiconditions, to which some vessels have – in fact – been tailored. As the data in Table 78 reveal, this is especially relevant for iron ore and coal, where many large dry bulk vessels are used. For agribulk and other dry bulk, this particular constraint is less strict.
city
or e main dry bulk termi ors in the port of jf (EMO),
Ertsoverslag Europoor C.V. (EECV) and European Bulk Serives (EBS) – generate about 80%
EM EBS also a these cargo types, there are also various other, smaller terminal operators such as Marcor, EP Stevedoring, Maas Silo, Van Uden Ste
wever, HbR provid information at shows t almost 80% f all dry b throughpu
Rotterdam (see Sectiobulk vessels). Hence,
9.5 for a det iled d
oes not seem o be emp
above, a more general commmall s total tra
s and hinte
especially if it invohighly unlikely. Hencpower w
potential extra co, we concludearger
sts that the
of smaller has considerable pricing
vessels, is
mum draught Rotterdam
Terminal capa
Table 79 presents inf mation on the thre nal operatRotterdam. These three operators – Europees Massagoed Overslagbedri
of HbR’s total dry bulk related revenue and handle 86% of the port’s total dry bulk throughput.228
O, EECV and EBS are mainly active in the handling of iron ore & scrap and coal. h ndles agribulk and minerals. For
vedoring, Borax and Rotterdam Bulk Terminal.229
228 Based on information provided by HbR. 229 Information provided by HbR on 5 July 2004.
191
Report prepared for the NMa

Charle s
Rive r
Asso c iate s
Tab 7le 9: Dry bulk terminal operators in Rotterdam
Terminal operator Main cargo handled
Deepest quay (m)
Annual throughput
Maximum handling capacity
Maximum storage capacity
Europees Massagoed Overslagbedrijf (EMO) Maasflakte
Iron ore, coal 23.0 ca. 13 million tons of ore
ca. 20 million
Discharge 140,000 tons/day
6 million tons
tons of coal
35 million ns)
Loading
tons/day
Annthroughput capacity 60 million to
(2003: total of 50,000
to ual
ns
Ertsoverslagbedrijf t C.V. (EECV)
ort
Iron ore, since Dec 2003 also coal
22 million tons 33 million tons
Discharg3,000 tons/hour, barge loa4,000 tons/hou
Iron ore: 2.5-3.5 million tons
Coal: 850,000 tons
EuropoorEurop
23.65
e
ding
r
European Bulk Services Agribulk 16.0 (EBS) Europort
European Bulk Services Minerals, coal 14.5
10 million tons Loading/ discharge 500-1,500 tons/hour
N/a
(EBS) Botlek
Source: HbR, CRA questionnaire and information provided at www.eecv.nl, www.emo.nl and www.ebsbulk.nl.
Interestingly, the major dry bulk terminals in Rotterdam are (at least partly) owned by major users of the port, in particular steel and electricity companies:
• EMO: RAG230, Thyssen Krupp Stahl , Usinor (France), H.E.S. Beheer Holding;
According to HbR, the main dry bulk cargo terminals in the Hamburg-Le Havre for dry bulk are located in the following ports:
• Amsterdam (Terminals: OBA, Rietlanden, IGMA/Cargill; traditional specialisation coal and agribulk);
• EBS: H.E.S. Beheer Holding; and
• EECV: Thyssen Krupp Stahl, ThysseenKrupp Veerhaven and Hüttenwerke Krupp Mannesmann (dedicated terminal for TKS and HKM).
One of the smaller dry bulk terminals, Marcor Stevedoring, belongs to C. Steinweg Handelsveem, an integrated logistics company.
230 According to HbR, RAG intends to sell its stake in EMO per 1 January 2005 (information provided by HbR
on 26 October 2004).
192
Report prepared for the NMa

Charle s
Rive r
Asso c iate s
• Antwerp (Terminals: Sea Invest, for minerals also Northern Mainport; traditional specialisation coal and minerals); and
al in Amsterdam, Antwerp, Vlissingen, Terneuzen, and Gent. Current throughput data is likely to correlate with current capacity and can the capa vailable at nt ports
0: Iron ore & sc d coal through the main ARA and Dunkerqu
• Gent (Terminals: Cargill, Sea Invest; traditional specialisation agribulk).231
Table 80 shows the cargo throughput for iron ore & scrap and co
thereby indicate cities a the differe .
Table 8 rap an put in ports e
Iron ore & scrap and coal throughput in 2003 in million tons
Share of total
Rotterdam 64.6 56%
Amsterdam 27.3 23%
Antwerp 14 13% .6
Gent 7.7 7%
Vlissingen 1.3 1%
Terneuzen 0.8 1%
Total 116.3 100%
Totals may not add up to 100 due to rounding. Source: Information provided by HbR on 5 July 2004.
From T on ore & scra uggest that the rdam, Antwer e capacity available at Vlissingen and Terneuzen.
k terminals operating in Dutch ports: EBS Rotterdam (100%), Rotterdam Bulk Terminal (40%), EMO Rotterdam (31%), Maas Silo in Rotterdam (agribulk, 15%), OBA Group with terminals in Amsterdam and Vlissingen (49.97%), Overslagbedrijf Terneuzen “OVET” (33.3%), and other, smaller bulk terminals.232 Sea Invest, a Belgian company based in Gent, operates dry bulk terminals in Antwerp and Gent and is also active in French ports, among others Dunkerque.233
able 80 it is clear that in 2003 Rotterdam handled by far the largest amount of irp and coal throughput – 56% – in the group of ports analysed here. The data s main ports for iron ore & scrap and coal competing with Rotterdam are Amstep and Gent. There seems to be limited fring
Interestingly, most of the dry bulk terminals in the ARA range are horizontally related through joint shareholdings. In the Netherlands, H.E.S. Beheer Holding Company holds stakes in various dry bul
231 Information provided by HbR on 5 July 2004. As already explained, HbR also mentioned Dunkerque as a
possible competitor and included terminals in Dunkerque in this list. As discussed above, we excluded Dunkerque from the relevant market due to hinterland considerations and our survey responses.
232 http://www.hesbeheer.com/dutch/deelnemingen/index.htm. 233 www.sea-invest.be
193
Report prepared for the NMa
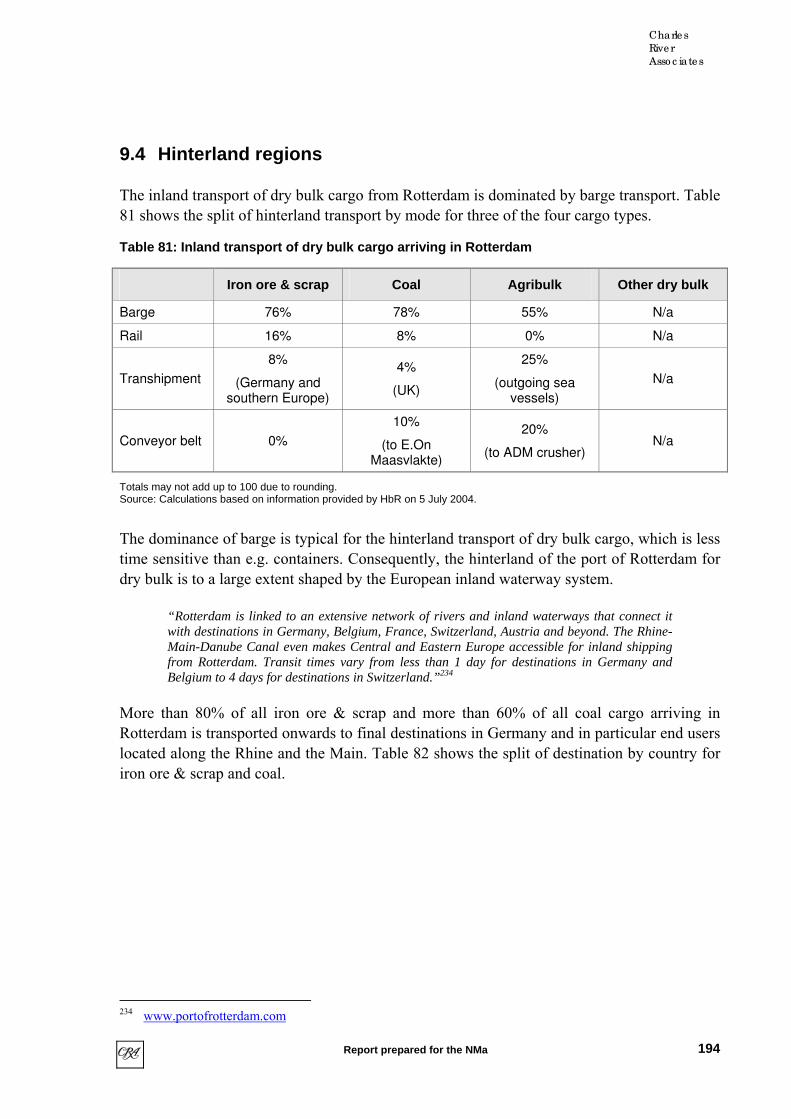
Charle s
Rive r
Asso c iate s
9.4 Hinterland regions
The inland ransport of d o from rdam is dominated by barge transport. Table 81 shows the split of hinterland transport by mode for three of the four cargo types.
Table 81: Inland transport of dry bulk cargo arriving in Rot
t ry bulk carg Rotte
terdam
Iron ore & scrap Coal Agribulk Other dry bulk
Barge 76% 78% 55% N/a
Rail 16% 8% 0% N/a
Transhipment
8%
(Germany ansouthern Europe)
(
25%
(outgoing seavessels
N/a d 4%
UK)
)
Conveyor belt 0%
1
(to E.On Maasvlakte)
20%
(to ADM crusher) N/a
0%
Totals may not add up to 100 due to rounding. mation provided by HbR on 5 July 2004.
“Rotterdam is linked to an extensive network of rivers and inland waterways that connect it
a ad the Main. Table 82 shows the split of destination by country for
iron ore & scrap and coal.
Source: Calculations based on infor
The dominance of barge is typical for the hinterland transport of dry bulk cargo, which is less time sensitive than e.g. containers. Consequently, the hinterland of the port of Rotterdam for dry bulk is to a large extent shaped by the European inland waterway system.
with destinations in Germany, Belgium, France, Switzerland, Austria and beyond. The Rhine-Main-Danube Canal even makes Central and Eastern Europe accessible for inland shipping from Rotterdam. Transit times vary from less than 1 day for destinations in Germany and Belgium to 4 days for destinations in Switzerland.”234
More than 80% of all iron ore & scrap and more than 60% of all coal cargo arriving in Rotterdam is transported onwards to final destin tions in Germ ny and in particular end users located along the Rhine an
234 www.portofrotterdam.com
194
Report prepared for the NMa

Charle s
Rive r
Asso c iate s
Table 8 Destination of iron ore & scrap and coal cargo arriv2: ing in Rotterdam
Iron ore & scrap
Coal Important end users
Netherlands 0% 23% E.On, Essent, Electrabel
Germany 83% 63%
E.On, RAG, RWE, Grosskraftwerk Mannheim, Zentralkokerei Saar, Thyssen Krupp Stahl, Dillinger Hütte, Hüttenwerke
Krupp Mannesmann
Belgium 6% 6% Cocherill Sambre / Arcelor
France 3% 4% Sollac / Arcelor
UK 0% 4% Innogy
Austria 3% 0% Voest Alpine
Turkey, Spain, Taiwan (scrap)
6% 0% n/a
Totals may not add up to 100 due to rounding. Source: Calculations based on information provided by HbR on 5 July 2004.
For agribulk, the most important destin s are end users in the Netherlands, Germany, other European countries and the Middle East. For other dry bulk, it is mainly end users in the
ation
Netherlands and Germany.235
According to HbR, the German steel industry and power plants are the most important customers for all ARA ports and therefore also for Rotterdam.236 Figure 17 shows some of the most important locations of the German steel industry. The density of steel mills is higher in the western part of Germany than it is in the north and the east. Also, most steel mills in the western part of Germany are located on inland waterways and thereby linked to the Rhine. This can be seen by comparing Figure 17 and Figure 18, which displays the German inland waterway system.
235 Information received from HbR on 5 July 2004. 236 Information provided by HbR on 26 October 2004.
195
Report prepared for the NMa

Charle s
Rive r
Asso c iate s
Figure 17: Location of the most important steel production facilities in Germany
Source: http://www.stahl-online.de/english/business_and_politics/companies_and_markets/steel_companies_germany.htm.
Figure 18: The German inland waterway system
Source: http://www.binnenschiff.de/downloads/karten_wasserstr/bundeswasserstrassen.pdf
196
Report prepared for the NMa
Charle s
Rive r
Asso c iate s
The location of many end users of dry bulk cargo along the river Rhine and its affluents provides a competitive advantage to the ARA ports compared to, for example, the German ports. From Hamburg, steel production sites in the northern and eastern parts of Germany (e.g. Peine and Salzgitter) can in principle be reached relatively easily by inland waterway transport over the Elbe and the Elbe-Seiten-Canal. Still, most of the bulk ore and coal shipped through Hansaport, the largest German dry bulk operator who is located in Germany, is transported to the hinterland by rail.237 It is widely known that e.g. Deutsche Bahn, the
an railway opera the German ports than the majority of iron ore throughput of
Hansaport is not destined to steel plants along the Rhine, but is transported to the steel plants f Germany.239 Many of the agribulk and other dry bulk
mburg also seem to focus m many than the 0 This indicates tha some small overlap, Hamburg and
in general serve n than the ARA ports.241
t the western part of Germany and the Benelux countries belong to the hinterland region of all ARA ports. This is not necessarily dependent on the same access to inland waterways. For example, Antwerp has traditionally been a rail port, also for the hinterland transport to Germany. In Antwerp, only about 31% of all ores and coal are shipped to the hinterland by barge, compared to almost 80% in Rotterdam. Rail accounts for 55% and road transport for 14% in Antwerp.242 This change in the modal split can be explained by the fact that for a very long time, Antwerp did not have a direct link with the
nd drastically reduced transport time from Antwerp to the Rhine and Moselle areas, which has led to higher growth of pus rland tr 3
The port of Duisburg performs an important hub function in the hinterland of the ARA ports. is for example reflected by the fact that the port authority of Amsterdam has a strategic
e in an inland coal terminal in Duisburg in to improve its logistical ch onfidential]
nt prices
Germ tor, offers lower prices for cargo shipments fromfrom other ports in the ARA range.238 In addition,
of Salzgitter AG in the north ooperators in HaWestern part.24
ore on Northern and Eastern Gert, although there may be
the German ports a different hinterland regio
It is widely acknowledged tha
river Rhine. The opening of the Scheldt-Rhine Canal has changed this a
hbarge hinte ansport in Antwerp.24
This alliance with the port of Duisburg and holds a stakorder ain.244 [C
9.5 Structure of harbour dues and other releva
As already mentioned, dry bulk is usually shipped in tramp vessels, i.e. vessels that are chartered on a case-by-case basis and do not follow a specified schedule of calls. In 237 http://www.hafen-hamburg.de/html-engl/handbook/3.4.html 238 Interview with [confidential], 6 July 2004. 239 http://www.hafen-hamburg.de/html-engl/handbook/3.4.html 240 See e.g. http://www.neuhof-hafen.de/besonder.html. 241 For a detailed discussion of the overlap in hinterland between the German and the ARA ports, see Section
7. 242 “Port of Antwerp – The dry bulk alternative in the heart of Europe”, p. 6. 243 “Port of Antwerp – Mainport for the 21st century”, p. 13.
197
Report prepared for the NMa

Charle s
Rive r
Asso c iate s
Rotterdam, there are two tariffs for sea-going tramp vessels, depending on whether less or more than 133.2% of the GT of the vessel are loaded and/or discharged in Rotterdam. If the
in Rotterdam is lower than 133.2% of the vessel’s GT, an additional fee per metric ton of moved cargo
3: Tariff for tramp ls (Tariffs TS1 and TS2)
quantity of cargo moved in Rotterdam is equal or higher than 133.2% of the vessel’s GT, the applicable tariff is a fixed fee per GT of the vessel. If the share of quantity moved
is levied.
Table 8 v esse
Share of the GT 245 of the el vessthat is loaded and/or dis d charge
Tariff structure
133.2% or more €0.858 per GT of vessel
Less than 133.2% €0.271 p +
€0.441 p ded and/or discharged
er GT of vessel
er metric ton loa
Source: Port or Rotterdam Tariffs 2004
In the very rare occasion that a sea-going dry bulk vessel operates in liner service, a different tariff applies. Again, there are two -container liner vessels, depending on whether less or more tha 1% of t are loaded and/or discharged in the
tity of cargo moved in Rotterdam is equal or higher than 62.1% of the vessel’s GT, the applicable tariff is a fixed fee per GT of the vessel. If the share of
tariffs for nonn 62. he GT of the vessel
port of Rotterdam. If the quan
quantity moved in Rotterdam is lower than 62.1% of the vessel’s GT, an additional fee per metric ton of moved cargo is levied.
Table 84: Tariff for liner vessels (Tariffs LS1 and LS2)
Share of the GT 246 of the vessel that is loaded and/or discharged
Tariff structure
62.1% or more €0.518 per GT of vessel
Less than 62.1% €0.260 per GT of vessel +
€0.416 per metric ton loaded and/or discharged
Source: Port or Rotterdam Tariffs 2004
244 http://www.amsterdamports.com/smartsite440.dws?highlight=100117105115098117114103 245 Note that the Gross Tonnage (GT) is a measure of the total capacity of a ship, i.e. it includes all spaces
below the upper deck and permanently closed-in spaces on the deck (the exact definition of the space included may differ by port). One GT represents 100 cubic feet. It is a historically agreed measure for the average space required by a metric ton of general merchandise. Metric ton is a measure of weight, one metric ton equals 1000kg.
246 Note that the Gross Tonnage (GT) is a measure of the total capacity of a ship, i.e. it includes all spaces below the upper deck and permanently closed-in spaces on the deck (the exact definition of the space included may differ by port). One GT represents 100 cubic feet. It is a historically agreed measure for the average space required by a metric ton of general merchandise. Metric ton is a measure of weight, one metric ton equals 1000kg.
198
Report prepared for the NMa

Charle s
Rive r
Asso c iate s
The relevance of the liner tariff is only marginal. According to HbR, only some combination vessels that carry general cargo together with a parcel of dry bulk are charged according to the liner tariffs. The general irrelevance of liner tariffs for dry bulk is shown in Table 85, which presents the split of total dry bulk throughput by the tariff applied to the vessel call.
Table 85: Split of dry bulk throughput by tariff applied to the vessel call
Tariff Code Share of throughput
LS1 0.03%
LS2 0.04%
TS1 78.29%
TS2 21.63%
Total 100.00%
Totals may not add up to 100 due to rounding. Source: CRA calculations based on information provided by HbR on 26 October 2004.
In principle, the same tariff applies to all dry bulk shipments, irrespective of the actual cargo (i.e. there is no differentiation between coal and iron ore for example). However, there are special frequency reductions available for agribulk vessels larger than 10,000 GT that are charged according to the tramp vessel tariffs. The frequency reduction is related to the number of calls per line (not per individual ship) and re-imbursed upon request. The reduction ranges from 10% (minimum of 6 calls per year) to a maximum of 25% for calls 51 and more per year. Table 86 shows the details of this reduction scheme.
Table 86: Frequency reduction fo ribulk vessels 10,000 GT charge ccording to tramp vessel tariff (TS1 or TS2)
r ag ≥ d a
Calls a year Reduction Per call
1 – 5 None
6 – 10 10% (also for call 1 to 5)
11 – 20 10% For call 1 to 10
15% For call 11 to 20
21 – 50 10%
15%
20%
For call 1 to 10
For call 11 to 20
For call 21 to 50
51 – > 10%
15%
20%
25%
For call 1 to 10
For call 11 to 20
For call 21 to 50
For call 51 and more
Source: Port or Rotterdam Tariffs 2004
199
Report prepared for the NMa
Charle s
Rive r
Asso c iate s
According to HbR, there are generally no discounts granted in the dry bulk business other than the frequency reductions for agribulk vessels. However, for agribulk and other dry bulk, incentives are granted on an exceptional basis for new cargo volumes brought to Rotterdam or moved to Rotterdam from other ports.247 HbR did not provide us with any details on these exceptional discounts and we could therefore not analyse them further but rely on published harbour dues for all ports. Note however that the granting of discounts for agribulk and other dry bulk is consistent with the responses we received to our user survey.
9.6 Benchmarking
9.6.1 HARBOUR DUES
In order to address the cellophane fallacy issues as well as to get a first indication of pricing power, we compare the harbour dues per ton. As discussed in Section 4, the basic service of providing port infrastructure such as quay walls, jetties and roads does not differ significantly between ports, which means that higher pricing of the port of Rotterdam would be an indication of pricing power relative to the relevant alternative ports.248 Note, as argued in Section 2.5 that the reverse conclusion is not possible. If prices do not differ, that is, this may reflect that current prices are competitive. However, it is also consistent with ports operating in different relevant markets and having pricing power or with collusion among ports.249
HbR has provided us with comparative information on harbour dues for typical vessels for dry bulk. These statistics show the harbour dues per ton for the main alternative ports as perceived by HbR.
247 Information provided by HbR on 26 October 2004. 248 Higher prices at the port of Rotterdam may also reflect different policies regarding the financing of
investments. Pricing power relative to competing ports does not have a direct implication for an assessment of welfare in a dynamic context.
249 Note that – as discussed in Section 7 - the benchmarking approach is relatively simple for those cargo types for which comparative pricing data exists and it is meaningful regarding the assessment of pricing power reflected in existing prices. However, it does not answer the question whether there is scope to increase prices (which we address in the following sections).
200
Report prepared for the NMa
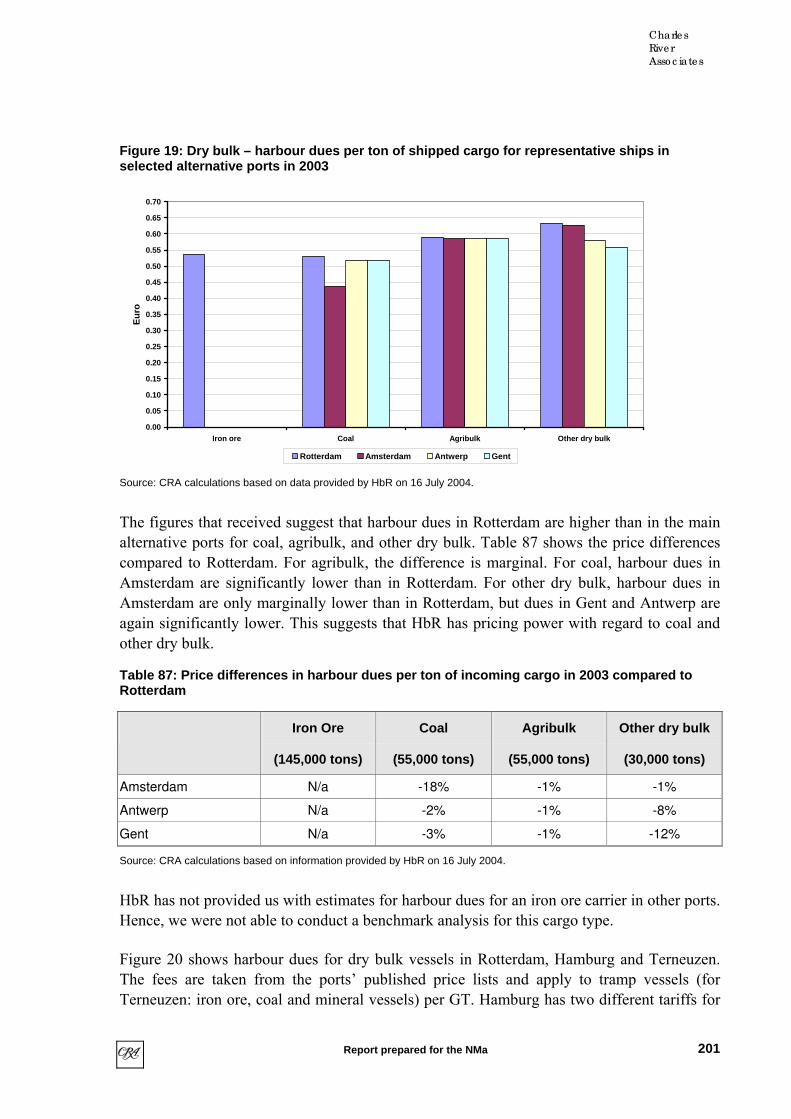
Charle s
Rive r
Asso c iate s
Figure 1 : Dry bulk – harbour dues per ton of shipped cargo for representative ship9 s in selected alternative ports in 2003
0.00
0.05
0.10
0.15
0.20
0.25
0.30
0.35
0.40
0.45
0.50
0.55
0.60
0.65
0.70
Iron ore Coal Agribulk Other dry bulk
Eur
o
Rotterdam Amsterdam Antwerp Gent
Source: CRA calculations based on data provided by HbR on 16 July 2004.
The figures that received suggest that harbour dues in Rotterdam are higher than in the main
to coal and other dry bulk.
Table 87: Price differences in harbour dues per ton of incoming cargo in 2003 compared to Rotterdam
alternative ports for coal, agribulk, and other dry bulk. Table 87 shows the price differences compared to Rotterdam. For agribulk, the difference is marginal. For coal, harbour dues in Amsterdam are significantly lower than in Rotterdam. For other dry bulk, harbour dues in Amsterdam are only marginally lower than in Rotterdam, but dues in Gent and Antwerp are again significantly lower. This suggests that HbR has pricing power with regard
Iron Ore
(145,000 tons)
Coal
(55,000 tons)
Agribulk
(55,000 tons)
Other dry bulk
(30,000 tons)
Amsterdam N/a -18% -1% -1%
Antwerp N/a -2% -1% -8%
Gent N/a -3% -1% -12%
Source: CRA calculations based on information provided by HbR on 16 July 2004.
HbR has not provided us with estimates for harbour dues for an iron ore carrier in other ports. Hence, we were not able to conduct a benchmark analysis for this cargo type.
Figure 20 shows harbour dues for dry bulk vessels in Rotterdam, Hamburg and Terneuzen. The fees are taken from the ports’ published price lists and apply to tramp vessels (for Terneuzen: iron ore, coal and mineral vessels) per GT. Hamburg has two different tariffs for
201
Report prepared for the NMa

Charle s
Rive r
Asso c iate s
seagoing tramp vessels coming from or going to overseas, depending on whether the ships are smaller or larger than 4,000 GT. For all dry bulk cargo types, vessels are usually larger than this threshold, which means that a tariff of €34.50 per 100 GT applies, i.e. €0.345 per GT
For the simulation of harbour dues shown in Figure 20, it was assumed that more than per
GT is charged in both Rotterdam and Terneuzen. As can be seen in Figure 20, harbour dues in Rotterdam are significantly higher than in Terneuzen and in Hamburg.250
Figure 20: Simulation of harbour dues f lk) vessels in 2004 per GT
(note that the tariff for vessels smaller than 4,000 GT is even lower, namely €0.248 per GT). In Terneuzen, tariffs are structured similar to Rotterdam: harbour dues for dry cargo vessels are set at €0.452 of the vessel’s GT or at €0.23 per GT plus €0.199 per ton of discharged/loaded cargo. The tariff leading to the total sum will be charged. Note that this tariff structure implies that a fixed fee per GT will only be charged if the cargo discharged and/or loaded is more than 111.6% of the vessel’s GT. In Rotterdam, the threshold is set at 133.2% of the vessel’s GT. Irrespective of the size of a vessel, harbour dues in Rotterdam are always higher than in Terneuzen.
133.2% of the vessel’s GT are discharged and/or loaded, which means that the fixed fee
or tramp (dry bu
0
0.1
0.2
0.3
0.4
Eur
o pe
r G
0.5
1
Hamburg
T
Source: CRA calculations based on port of Rotterdam Port Tariffs 2004, “Gebührenverordnung für die Hafen- und
0.6
of t
he v
esse
l 0.7
0.8
0.9
Rotterdam Terneuzen
Schifffahrtsverwaltung“ Hamburg and price list published at www.zeeland-seports.com. We assume that the respective vessel is larger than 4,000 GT and that more than 133.2% of its GT are discharged/loaded in the port.
250 HbR pointed out that in addition to harbour dues, shippers also have to pay quay dues when calling at the
port of Hamburg, which – according to HbR – has a significant impact on total port call costs in Hamburg. However, HbR also acknowledged that they did not know how these “Kajegebühren” are determined in practice. Further research and a phone conversation with the port of Hamburg revealed that there is indeed an extra charge, a so-called “Anlegegebühr”, if vessels moor at a public berth. According to information from the port marketing agency in Hamburg, this extra fee is not charged if vessels moor at a berth that belongs to a terminal. For dry bulk cargo, there are no public quays available in Hamburg, which means that we do not need to consider the “Anlegegebühr” in our analysis. In general, note that this fee for mooring at a public quay would also have to be paid in Rotterdam if dry bulk vessels moored at a public quay.
202
Report prepared for the NMa

Charle s
Rive r
Asso c iate s
Table 88 shows the price differences between Rotterdam, Terneuzen and Hamburg. A differential of 47% implies that the port of Terneuzen does not represent any constraints on the pricing of HbR. Together with the findings from the benchmarking study in 2001, the price differentials between Rotterdam and Bremen and Hamburg of around 60% also imply that Rotterdam does not compete with the German ports in the dry bulk business.
Table 88: Difference in harbour dues for tramp (dry bulk) vessels in 2004
Terneuzen Hamburg
Difference to Rotterdam -47% -60%
Source: Port of Rotterdam Port Tariffs 2004, “Gebührenverordnung für die Hafen- und Schifffahrtsverwaltung“ Hamburg and price list published at www.zeeland-seports.com.
The benchmarking analysis suggests that HbR’s current pricing for dry bulk services reflects some pricing power for coal and other dry bulk. We were not able to conduct an explicit benchmark analysis for large iron ore vessels. However, iron ore vessels are typically larger than coal vessels. Given Rotterdam’s locational advantage and absence of draught restrictions, it can be expected that the pricing power of Rotterdam increases with the size of the vessel. In fact, most other ports in the ARA range employ caps on their harbour dues for larger vessels in order to compensate shippers for the lower draught and extra efforts
g for harbour dues for coal shipments through several ARA ports (Rotterdam, Amsterdam, Antwerp and Vlissingen). Price differences between the ports were much more significant for this shipment than in the simulations provided to us by
(lightening, locks, additional sea transport on the river Scheldt).251
Besides the “official” port call cost simulations provided by HbR, we also received a benchmark study for the dry bulk sector from the port authority, which was written in 2001 by a student as part of her masters thesis. HbR pointed out that the study is no exclusive study conducted by professionals on behalf of HbR and we therefore do not base any of our conclusions on information contained in this study. However, it is interesting to note that the study also included a price benchmarkin
HbR. Table 89 presents the results of the study for illustrative purposes.
251 For example, in Antwerp tonnage dues for bulk carriers loading and/or discharging in the port are calculated
for a maximum of 85,000 GT. Berthing dues are calculated for a maximum of 115,000 tons (Reglementen en gebruiken van de haven van Antwerpen, p. 38).
203
Report prepared for the NMa

Charle s
Rive r
Asso c iate s
Table 8 : Price differences in harbour dues per ton of incoming cargo in 2001 compared to Rotterdam
9
Coal
(150,000 tons)
Amsterdam -54%
Gent N/a
Bremen N/a
Antwerp -21%
Vlissingen -15%
Source: CRA calculations based on “Benchmark Droge Bulk”, provided by HbR on 16 July 2004.
cargo through alternative ports, we can determine the maximum differential of
i ge quantity of cargo flows are captive, in the s b if harbour dues were to increase by 5%, this
is is possible. If the analysis shows that it for a port to profitably raise prices, this would suggest that one would
eting ports and analyse whether such a price increase would be profitable e to raise prices jo (that is, in accordance with the hypothetical
t). This analysis assumes that existing prices do not already reflect 252
Interestingly, the study results confirmed what one would expect: for a larger coal shipment (150,000 tons on a capesize vessel instead of 55,000 tons shipped on a panamax as in the simulations provided by HbR), the price premium in Rotterdam is much more pronounced and ranges from 15% to 54%.
9.7 Cargo flow analysis: Overview
A complementary approach to the benchmarking method is to analyse cargo flows. If for a given origin-destination pair we know the different cost elements in the transport chain for shipping theharbour dues that is possible before the shipper would be indifferent between the destinations (assum ng constant quality between ports). If for a given type of cargo a lar
ense that they would not would suggest that a 5% pri
e moved to another portce increase would be profitable.
The better the available data, the finer an analyswould not be possiblehave to add compfor them if they wer intly monopolist, or “SSNIP” tesmarket power.
252 As discussed before, note that the analysis needs to be complemented – as it is in this report – by a number
of further elements, including the analysis of capacity constraints, limited port choice due to draught restrictions, and the presence of network effects. Note that it is not only the capacity of the ports that matter. The relevant bottleneck may also be other relevant infrastructure such as warehousing facilities or hinterland transport connections.
204
Report prepared for the NMa
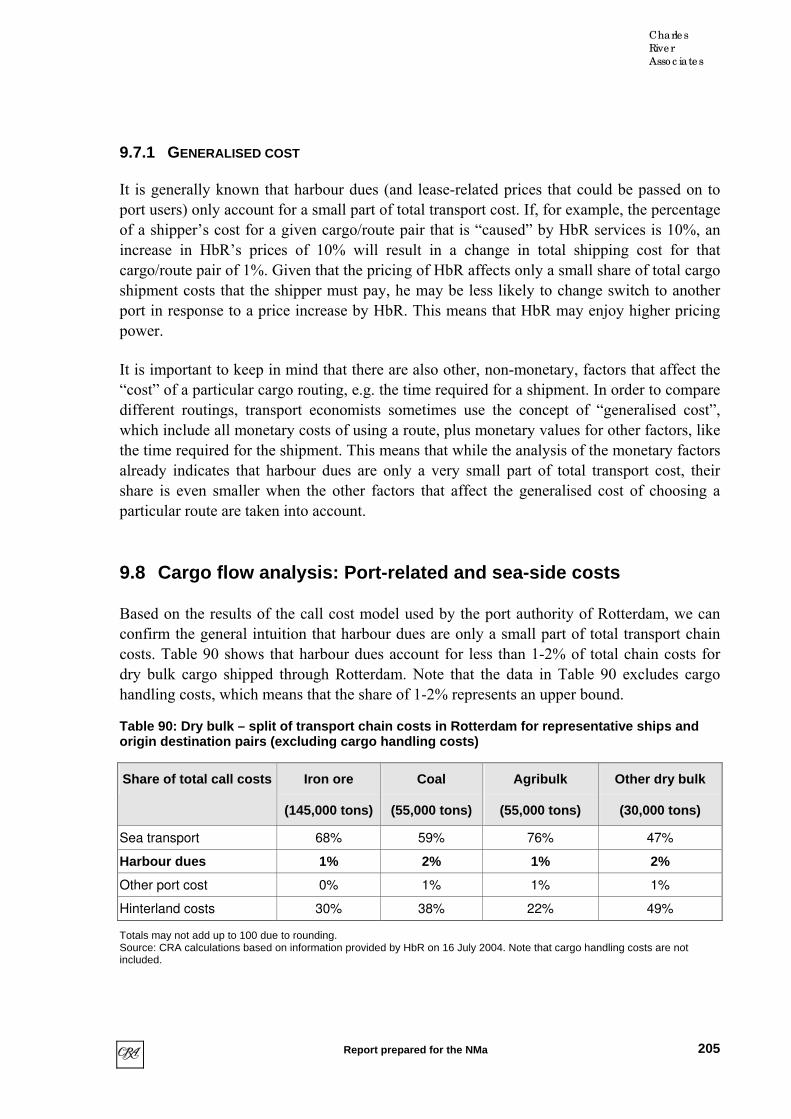
Charle s
Rive r
Asso c iate s
9.7.1 GENERALISED COST
It is generally known that harbour dues (and lease-related prices that could be passed on to port users) only account for a small part of total transport cost. If, for example, the percentage of a shipper’s cost for a given cargo/route pair that is “caused” by HbR services is 10%, an increase in HbR’s prices of 10% will result in a change in total shipping cost for that cargo/route pair of 1%. Given that the pricing of HbR affects only a small share of total cargo shipment costs that the shipper must pay, he may be less likely to change switch to another
s of the call cost model used by the port authority of Rotterdam, we can confirm the general intuition that harbour dues are only a small part of total transport chain
te hat the data in Table 90 excludes cargo handling costs, which means that the share of 1-2% represents an upper bound.
Table 90: Dry bulk – split of transport chain costs in Rotterdam for representative ships and origin destination pairs (excluding cargo handling costs)
port in response to a price increase by HbR. This means that HbR may enjoy higher pricing power.
It is important to keep in mind that there are also other, non-monetary, factors that affect the “cost” of a particular cargo routing, e.g. the time required for a shipment. In order to compare different routings, transport economists sometimes use the concept of “generalised cost”, which include all monetary costs of using a route, plus monetary values for other factors, like the time required for the shipment. This means that while the analysis of the monetary factors already indicates that harbour dues are only a very small part of total transport cost, their share is even smaller when the other factors that affect the generalised cost of choosing a particular route are taken into account.
9.8 Cargo flow analysis: Port-related and sea-side costs
Based on the result
costs. Table 90 shows that harbour dues account for less than 1-2% of total chain costs for dry bulk cargo shipped through Rotterdam. No t
Share of total call costs Iron ore
(145,000 tons)
Coal
(55,000 tons)
Agribulk
(55,000 tons)
Other dry bulk
(30,000 tons)
Sea transport 68% 59% 76% 47%
Harbour dues 1% 2% 1% 2%
Other port cost 0% 1% 1% 1%
Hinterland costs 30% 38% 22% 49%
Totals may not add up to 100 due to rounding. Source: CRA calculations based on information provided by HbR on 16 July 2004. Note that cargo handling costs are not included.
205
Report prepared for the NMa

Charle s
Rive r
Asso c iate s
Accor ng to HbR, cargo handling costs of dry bdi ulk terminals range from €1 to €3 per ton. We took the average of this range (€2) and used it, together with the other data on shipment costs pr R, to esti ts per ton for the different cargo types
harbour dues. The re are shown in Table 91. It becomes clear that also account for only a share of port-related costs, i.e. the costs of
ng call costs and cargo handling costs, but not rt costs. Still, due to e fact that discharging and loading of dry bulk
cal and complicated than for example the discharging and loading of container is, cargo handling costs charged by terminal operators represent a higher share of total
s than for other cargo ty pecially containers. For dry bulk, their share is %.
Estimate of total port related costs per ton and share of harbour dues
ovided by Hb mate total port related cosand the share of sults harbour dues smallshipping cargo through a particular port includiconsidering sea transpo this less technivessels port related cost pes, esabout 20
Table 91:
Total p ted costs ort relaper ton in €
Share of harbour dues
Iron ore (145,000 tons) 20% 2.72
Coal (55,000 tons) 19% 2.82
Agribulk (55,000 tons) 20% 2.90
Other dry bulk (30,000 tons) 21% 3.00
Source: Based on information received by HbR on 16 July 2003.handled based on HbR estimate.
Cargo handling costs are assumed to be €2 per ton of cargo
chmark study provided by HbR included some data, but we decided not to present it here due to the disclaimers HbR attached to the study.
d in capesize vessels, the change in other port related costs would have to be 2.3% in order to outweigh a 10% increase
Factories processing dry bulk are often located along rivers, mainly for logistical reasons. As a consequence, inland transportation for dry bulk is dominated by barge. This is true not only for Rotterdam, but also for most other ARA ports active in dry bulk. Access to inland waterways was mentioned by industry experts as a crucial qualitative factor for the choice of
Unfortunately, we did not obtain data that would have allowed us to estimate port related costs at other ports. The already mentioned ben
Still, it should be said that based on our analysis of the data contained in this study, there is no evidence that port related costs are necessarily always higher in Rotterdam than in other ports. According to the study, the share of harbour dues in total port related costs is significantly higher for large vessels in Rotterdam than in the other ports. Yet, an increase in harbour dues of 10% in Rotterdam would still be outweighed by a change in other port related costs of 1.4% for agribulk for example. For coal shippe
in harbour dues.
9.9 Cargo flow analysis: Hinterland transportation costs
206
Report prepared for the NMa
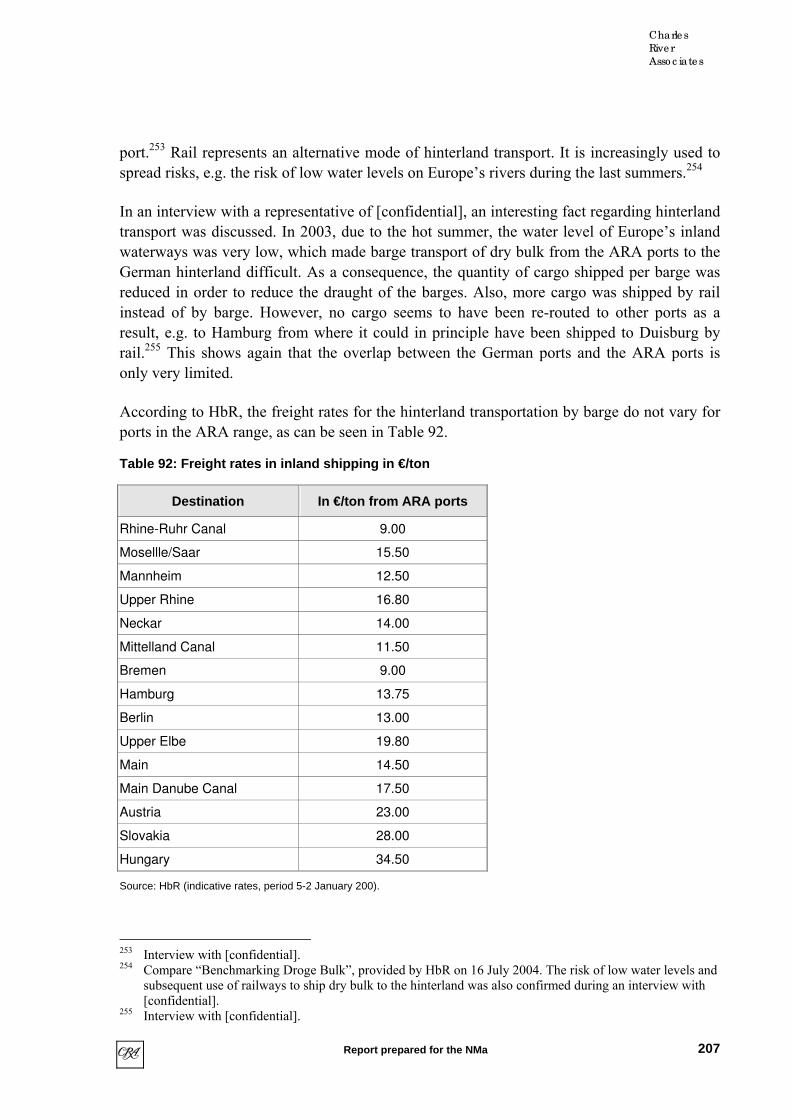
Charle s
Rive r
Asso c iate s
por 3
spread risks, e.g. the risk of low water levels on Europe’s rivers during the last summers.
In an intransport was discussed. In 2003, watGerman hinterland difficult. As a consequence, the quantity of cargo shipped per barge was red dinsteadresult, e.g. to Hamburg from where it could in principle have been shipped to Duisburg by
ht rates in inland shipping in €/ton
t.25 Rail represents an alternative mode of hinterland transport. It is increasingly used to 254
terview with a representative of [confidential], an interesting fact regarding hinterland due to the hot summer, the water level of Europe’s inland
erways was very low, which made barge transport of dry bulk from the ARA ports to the
uce in order to reduce the draught of the barges. Also, more cargo was shipped by rail of by barge. However, no cargo seems to have been re-routed to other ports as a
rail.255 This shows again that the overlap between the German ports and the ARA ports is only very limited.
According to HbR, the freight rates for the hinterland transportation by barge do not vary for ports in the ARA range, as can be seen in Table 92.
Table 92: Freig
Destination In €/ton from ARA ports
Rhine-Ruhr Canal 9.00
Mosellle/Saar 15.50
Mannheim 12.50
Upper Rhine 16.80
Neckar 14.00
Mittelland Canal 11.50
Bremen 9.00
Hamburg 13.75
Berlin 13.00
Upper Elbe 19.80
Main 14.50
Main Danube Canal 17.50
Austria 23.00
Slovakia 28.00
Hungary 34.50
Source: HbR (indicative rates, period 5-2 January 200).
253 Interview with [confidential]. 254 Compare “Benchmarking Droge Bulk”, provided by HbR on 16 July 2004. The risk of low water levels and
subsequent use of railways to ship dry bulk to the hinterland was also confirmed during an interview with [confidential].
255 Interview with [confidential].
207
Report prepared for the NMa

Charle s
Rive r
Asso c iate s
The fact that hinterland transport costs from Amsterdam and Rotterdam are the same was confirmed by one respondent to our survey.256
generally similar cost level, we were pointed to the fact that hinterland transport ities differ b n the diffe RA ports to qualitat ors. In p lar,
was reported to have the bes land waterway access due to the absence of locks ts proximity to the Rhine. Also, it benefits fro twork effects in the sense that the
of barges generally high r in Rotterdam RA ports. This could a competitiv antage and pricing power to HbR.
However, it is again important to take into account that harbour dues account for only a small share of total generalised route costs. This clearly enhances the pricing power of HbR.
el can transport up to 15,000 tons of dry bulk in a
ere already pointed out to us by interview partners and
Despite apossibil etwee rent A due ive fact articuRotterdamand i
t inm ne
availability is e than in other Aprovide e adv some
9.10 Qualitative differences of ports
According to HbR, Rotterdam owes its position as a main European port for dry bulk to factors such as:
• Rotterdam’s excellent accessibility to ocean-going vessels: up to 75 feet with a DWT of 365,000.
• The fact that a single inland vesssingle haul to and from locations in Germany, Belgium and France.
• Rotterdam’s many outstanding facilities for the handling, storage, and processing of any volume.
• The expertise offered by the many specialized shipbrokers, surveyors, laboratories, trading houses, forwarding agents, et cetera that are present in the port.257
The dry bulk benchmarking study that HbR provided us with includes a qualitative assessment of the different ports for the shipment of agribulk and steam coal. In the absence of other qualitative information, we decided to present these results here. Note however that the general findings of the study wrespondents to our survey. Hence, we do not rely on the benchmark study to formulate our conclusions.
In the dry bulk benchmark study, it is notable that the differences in the qualitative assessment of the different ports are marginal for the shipment of agribulk. Rotterdam achieved the lowest scores for hinterland transport by barge (61%) and hinterland transport by rail (55%), but this compares to only 62% and 58% for the leading ports respectively. Still,
256 CRA questionnaire. 257 http://www.portofrotterdam.com/Business/UK/Cargo_and_Terminals/Dry_Bulk/index.asp.
208
Report prepared for the NMa

Charle s
Rive r
Asso c iate s
the qualitative analysis shows that for agribulk, Rotterdam does not possess a qualitative advantage over other ports in the ARA range, in particular Amsterdam and Gent.258
The qualitative assessment for steam coal comes to a very different result. Here, Rotterdam is clearly the port with the highest quality score, both for barge and rail transport to the hinterland. Rotterdam achieved a score of 69% for barge transport and 66% for rail transport, which compares to 56% and 55% of the ports on the second place. Table 93 summarises the findings of the qualitative benchmarking. Factors considered ranged from sea accessibility and the availability of parcel services to the quality of terminal operators (access, working hours, quality control etc.) and a general assessment of the hinterland transport options, including proximity to the client.259
Table 93: Result of qualitative benchmarking of dry bulk ports in the ARA range
Rotterdam Amsterdam Gent Antwerp Vlissinge
Agribulk
Barge 61% 62% N/A N/A N/A
Rail 55% 58% 58% N/A N/A
Steam coal
Barge 69% 56% N/A 52% 47%
Rail 66% 53% N/A 55% 44%
Source: "Benchmark Droge Bulk", pp. 27 and 42, provided by HbR on 16 July 2004.
The qualitative benchmarking supports the finding that Rotterdam’s position is stronger for large vessels than for smaller ships. The benchmarking simulation assumed a shipment of 150,000 tons of steam coal in a capesize vessel, but of only 30,000 tons of agribulk in a panamax vessel. The significantly higher score of Rotterdam, compared to the other ports for steam coal, underlines the finding that Rotterdam is likely to possess pricing power for the shipment of large quantities of cargo in large vessels. Again, this seems to be mainly due to the better sea accessibility of Rotterdam compared to other ports. In the benchmarking study, Rotterdam scored 20 points for sea access for steam coal, while the second best port in this area (Vlissingen) scored only 12 points.
s and exit without detours and interference with sea going vessels) and the availability of
With regard to hinterland transport, one can once again point to the fact that the quality of access to hinterland connections is significantly better in Rotterdam because the port does not have any locks and tidal restrictions like other ports, e.g. Amsterdam. Also, Rotterdam has a better layout, which allows barge shippers to operate more efficiently in the port (swift acces
barges is significantly better than in other ARA ports.260 These excellent hinterland
258 “Benchmark Droge Bulk”, p. 27, provided by HbR on 16 July 2004. 259 “Benchmark Droge Bulk”, pp. 27 and 42, provided by HbR on 16 July 2004. 260 Interview with [confidential].
209
Report prepared for the NMa

Charle s
Rive r
Asso c iate s
connections in Rotterdam are one of the reasons why large end-users such as [confidential] ship the majority of their iron ore and coal imports through Rotterdam and have even invested in terminal facilities, even though this ties them to the port and makes them more vulnerable
will increase the attractiveness of the port of Rotterdam on this single dimension of hinterland connections on which it is at present inferior to some of its rivals.
9.11 Evi ence of s
HbR was unable to provide iden een in response to a change in harbour
that they have – in the st – reduced dry bulk volume at some port in the ARA harbour dues change relative to the other ports. However, there was only one
who was able to provi any details on such an actual switch in the past. A tramp y in the agribulk business, r uced volume in Rotterdam in 2001 following an increase
dues in Rotterdam. Th e was moved to Amsterdam, where lower harbour ng up on the survey, the respondent also
the fact that another pr advantage of Amsterdam compared to Ro am is that ap on the vessel size hich limits the maxi um total of harbour dues that are
tterdam, harbour dues are charged per GT of the vessel and (if TS2 is olume of cargo discharged and/or lo ed in Rotterdam without an upper
ording to the responden further important factor for port choice relates to the fact rt of Amsterdam has a terminal that offers parcel services. Parcel ices allow
e shipped by others and hence reduce the costs of 262
her specific vidence of switching in the past due to a increase in harbour dues, various respondents did indicate that they have in the past reduced volume at a
ing -
to possible pricing power of HbR.
With regard to rail access, Rotterdam achieved a slightly lower score in the benchmarking study than Gent and especially Antwerp. However, rail access in Rotterdam was judged to be comparable to Amsterdam and even significantly better than in Vlissingen.261 Hence, the port of Rotterdam does not seem to have a competitive disadvantage in rail transport based on this study. The construction of the Betuwe railway line that is presently underway, is expected to eliminate, by 2007, any railway bottleneck situations that may currently exist in the port of Rotterdam. This
d witching
us with any ev dues only. Nevertheless, som
ce of switching betwe respondents to our survey
ports for dry bulk
indicated parange when d respondent deagenc edin harbour e volumdues were offered. In a phone interview followipointed to ice tterdthere is a c , w mcharged. In Roapplicable) also the v adlimit. Acc t, athat the pobrokers to bundle cargo with volum
serv
chartering a vessel.
While there is no ot e n
port is response to increases in total port related costs, i.e. port call costs and cargo handlcosts. Switching occurred exclusively between ports in the ARA range, e.g. RotterdamAntwerp (other dry bulk), Rotterdam-Moerdijk (other dry bulk), Rotterdam-Amsterdam (agribulk), Rotterdam-Antwerp (iron ore, coal, agribulk, it is not clear to which cargo type theanswer related). The only evidence of switching outside the ARA range that we came across
261 “Benchmark Droge Bulk”, pp. 27 and 42, provided by HbR on 16 July 2004. 262 CRA questionnaire and phone interview with one respondent on 22 October 2004.
210
Report prepared for the NMa

Charle s
Rive r
Asso c iate s
during this study was an attempt of [confidential] to ship its coal and iron ore through Wilhelmshaven instead of Rotterdam in the 1980s. However, this decision was soon reversed as a result of problems t partner stressed that this n it does show that the ARA uely p ard of western Germany.263
erefore, there does not s m to be much evidence of switching in the past induced any users of the port of Rotterdam in the dry bulk business that
ded to our survey (19 ou f 19, that is) stated hat they would red volume if es were to increase pe anently by 10%. For a change in total shi g cost, 21
respondents indicated th they would expect vo me in Rotterdam to be reduced.
f the share of volume shifted to other port creas tal port costs) by 10%, the simple average of all
ates ranged from 42% for coal to 23% for iron ore & scrap, again at the iron o business is relatively captive.
ic reasons (and in our case possibly also because they give too little rd at first es for passing on overcharges to their customers when all their rivals face
arbour dues), customers often overestimate their response to hypothetical price te values o he switching inform ion provided should erefore be
interpreted with care. However, the survey provides valuable indication of the relative nts
y
with the hinterland shift of volume can
ports are uniq
ransport to Duisburg. Aot provide an example
ositioned with reg
lthough our interviewfor switching today, to the hinterland
While, th eeby changes in harbour dues, mrespon t o t uce harbour du rm ppinout of 24 at lu
In terms o s following an in e of torelated costs (call costs plus cargo handling respondents’ estimsupporting the view th re
For strateg regato their possibilitisimilar hincreases. The absolu f t at th
importance of rival ports. One question of our questionnaire asked to what extent respondesee other ports in the HLH as possible alternatives for the port of Rotterdam and how theevaluate those ports’ quality as a substitute for Rotterdam. The tables below show the results of this question.
263 Interview with [confidential].
211
Report prepared for the NMa
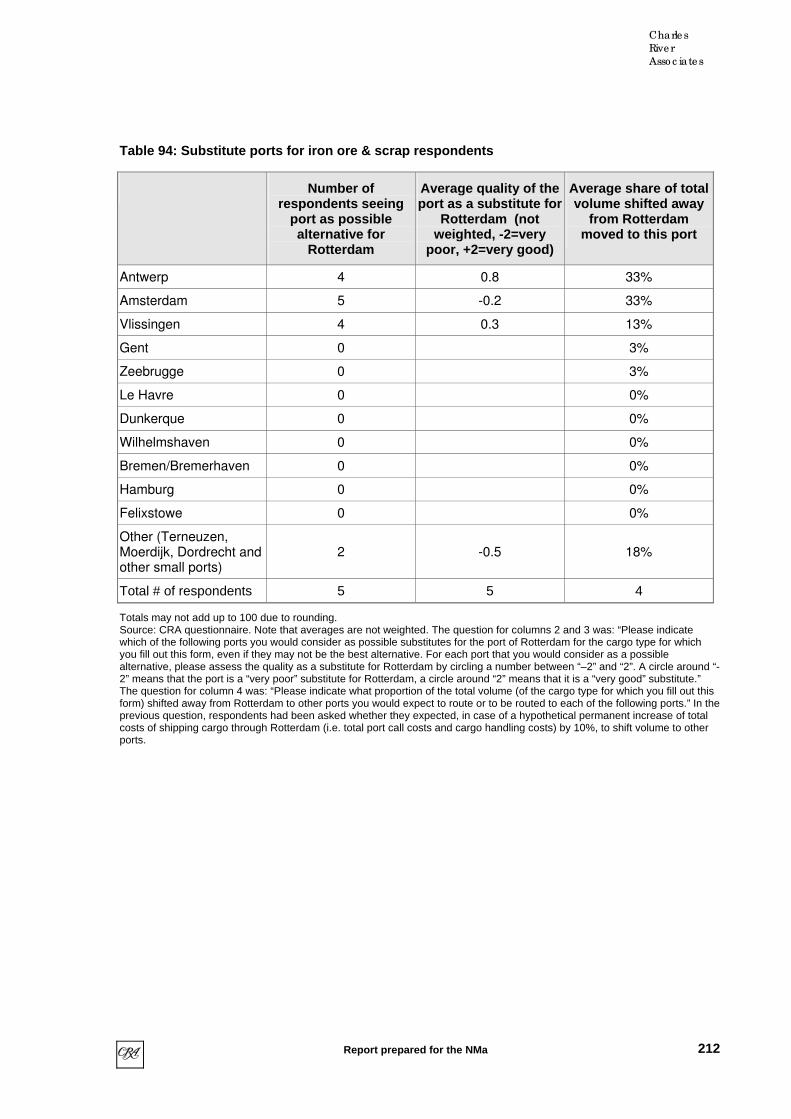
Charle s
Rive r
Asso c iate s
Table 9 : Substitute ports for iron ore & scrap respo4 ndents
Number of respondents seeing
port as possible alternative for
Rotterdam
Average quality of the port as a substitute for
Rotterdam (not weighted, -2=very
poor, +2=very good)
Average share of total volume shifted away
from Rotterdam moved to this port
Antwerp 4 0 33% .8
Amsterdam 5 -0 33% .2
Vlissingen 4 0 13% .3
Gent 0 3%
Zeebrugge 0 3%
Le Havre 0 0%
Dunkerque 0 0%
Wilhelmshaven 0 0%
Bremen/Bremerhaven 0 0%
Hamburg 0 0%
Felixstowe 0 0%
Other (Terneuzen, 2 -0.5 18% Moerdijk, Dordrecht and
other small ports)
Total # of respondents 5 5 4
Totals may not add up to 100 due to rounding. Source: CRA questionnaire. Note that averages are not weighted. The question for columns 2 and 3 was: “Please indicate which of the following ports you would consider as possible substitutes for the port of Rotterdam for the cargo type for which you fill out this form, even if they may not be the best alternative. For each port that you would consider as a possible alternative, please assess the quality as a substitute for Rotterdam by circling a number between “–2” and “2”. A circle around “-2” means that the port is a “very poor” substitute for Rotterdam, a circle around “2” means that it is a “very good” substitute.” The question for column 4 was: “Please indicate what proportion of the total volume (of the cargo type for which you fill out thisform) shifted away from Rotterdam to other ports you would expect to route or to be routed to each of the following ports.” In thpreviou
e
s question, respondents had been asked whether they expected, in case of a hypothetical permanent increase of total costs of shipping cargo through Rotterdam (i.e. total port call costs and cargo handling costs) by 10%, to shift volume to other ports.
212
Report prepared for the NMa

Charle s
Rive r
Asso c iate s
Table 95: Substitute ports for coal respondents
Number of respondents seeing
port as possible alternative for
Rotterdam
Average quality of the port as a substitute for
Rotterdam (not weighted, -2=very
poor, +2=very good)
Average share of total volume shifted away
from Rotterdam moved to this port
Amsterdam 6 53% 0.3
Antwerp 3 0.3 40%
Gent 1 3%
Zeebrugge 0 3%
Le Havre 0 0%
Dunkerque 0 0%
Vlissingen 4 0.7 0%
Wilhelmshaven 1 2.0 0%
Bremen/Bremerhaven 1 2.0 0%
Hamburg 1 2.0 0%
Felixstowe 0 0%
Other (Terneuzen, Moerdijk)
1 -1.0 0%
Total # of respondents 6 6 3
Totals may not add up to 100 Source: CRA questionnaire. N
due to rounding. ote that averages are not weighted. The question for c ns 2 and 3 was: “Please indicate
as possible substitutes for the port of Rotterdam for the cargo type for which
“-
olumwhich of the following ports you would consider you fill out this form, even if they may not be the best alternative. For each port that you would consider as a possible alternative, please assess the quality as a substitute for Rotterdam by circling a number between “–2” and “2”. A circle around2” means that the port is a “very poor” substitute for Rotterdam, a circle around “2” means that it is a “very good” substitute.” The question for column 4 was: “Please indicate what proportion of the total volume (of the cargo type for which you fill out this form) shifted away from Rotterdam to other ports you would expect to route or to be routed to each of the following ports.” In the previous question, respondents had been asked whether they expected, in case of a hypothetical permanent increase of total costs of shipping cargo through Rotterdam (i.e. total port call costs and cargo handling costs) by 10%, to shift volume to other ports.
213
Report prepared for the NMa
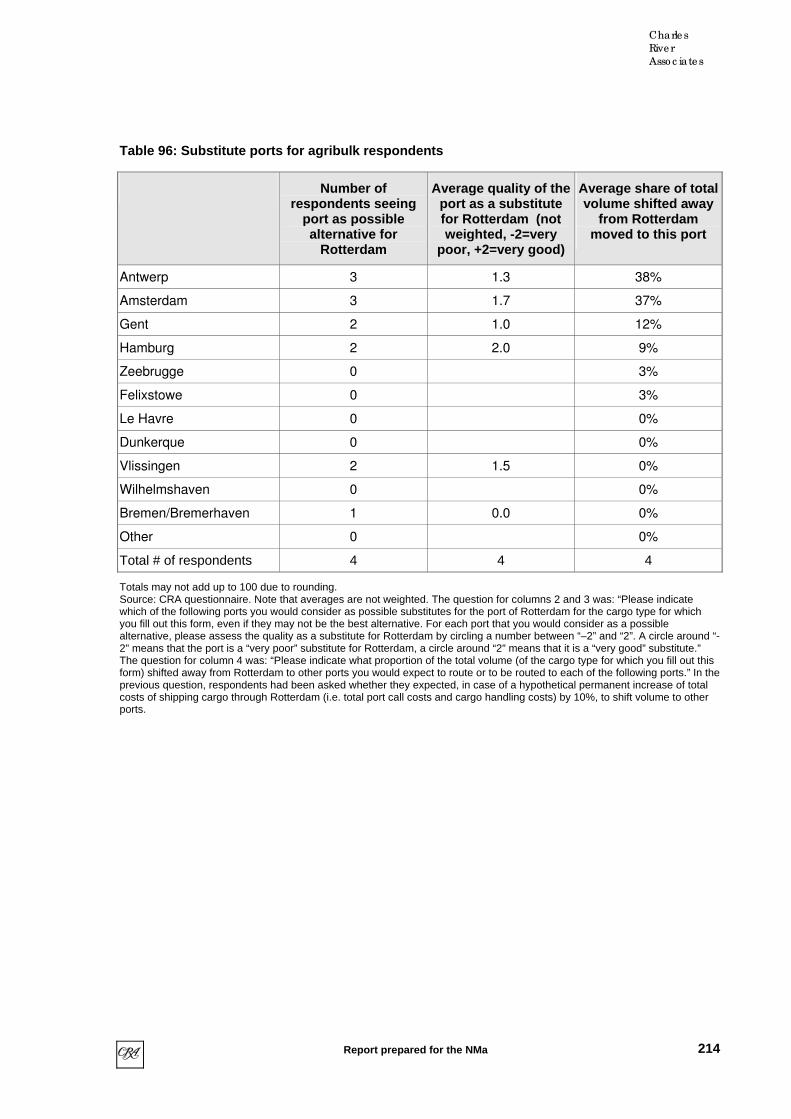
Charle s
Rive r
Asso c iate s
Table 96: Substitute ports for agribulk respondents
Number of respondents seeing
port as possible alternative for
Rotterdam
Average quality of the port as a substitute for Rotterdam (not weighted, -2=very
poor, +2=very good)
Average share of total volume shifted away
from Rotterdam moved to this port
Antwerp 3 1.3 38%
Amsterdam 3 1.7 37%
Gent 2 1.0 12%
Hamburg 2 2.0 9%
Zeebrugge 0 3%
Felixstowe 0 3%
Le Havre 0 0%
Dunkerque 0 0%
Vlissingen 2 1.5 0%
Wilhelmshaven 0 0%
Bremen/Bremerhaven 1 0.0 0%
Other 0 0%
Total # of respondents 4 4 4
Totals may not add up to 100 due to rounding. Source: CRA questionnaire. Note that averages are not weighted. The question for columns 2 and 3 was: “Please indicate which of the following ports you would consider as possible substitutes for the port of Rotterdam for the cargo type for which you fill out this form, even if they may not be the best alternative. For each port that you would consider as a possible alternative, please assess the quality as a substitute for Rotterdam by circling a number between “–2” and “2”. A circle around “-2” means that the port is a “very poor” substitute for Rotterdam, a circle around “2” means that it is a “very good” substitute.” The question for column 4 was: “Please indicate what proportion of the total volume (of the cargo type for which you fill out this form) shifted away from Rotterdam to other ports you would expect to route or to be routed to previous question, respondents had been asked whether they expected, in case of a
each of the following ports.” In the hypothetical permanent increase of total
ng costs) by 10%, to shift volume to other costs of shipping cargo through Rotterdam (i.e. total port call costs and cargo handliports.
214
Report prepared for the NMa
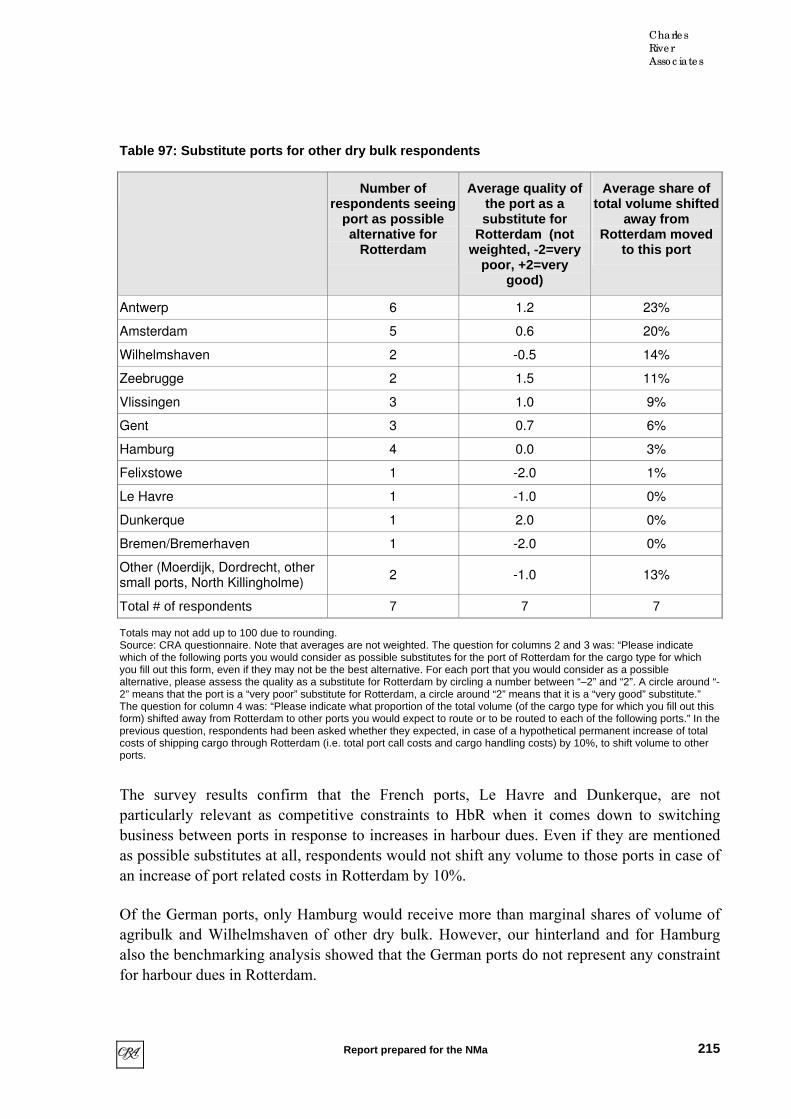
Charle s
Rive r
Asso c iate s
Table 9 : Substitute ports for other dry bulk respon7 dents
Number of respondents seeing
port as possible alternative for
Rotterdam
Average quality of the port as a substitute for
Rotterdam (not weight ery ed, -2=v
poor ery , +2=vgood)
Average share of total volume shifted
away from Rotterdam moved
to this port
Antwerp 6 1.2 23%
Amsterdam 5 0.6 20%
Wilhelmshaven 2 -0.5 14%
Zeebrugge 2 1.5 11%
Vlissingen 3 1.0 9%
Gent 3 6% 0.7
Hamburg 4 0.0 3%
Felixstowe 1 -2.0 1%
Le Havre 1 0% -1.0
Dunkerque 1 0% 2.0
Bremen/Bremerhaven 1 0% -2.0
Other (Moerdijk, Dordrecht, other ports, North Killingholme)
2 -1.0 13% small
Total # of respondents 7 7 7
Totals may not add up to 100 due to rounding. Source: CRA questionnaire. Note that averages are not weighted. The question for columns 2 and 3 was: “Please indicate
of Rotterdam for the cargo type for which you would consider as a possible
alternative, please assess the quality as a substitute for Rotterdam by circling a number between “–2” and “2”. A circle around “-2” means that th poor cle a ery good” substitute.” The question for n 4 was: “Plea the total volum for which you fill out this form) shifted away from Rotterdam to other xpect to route or to be routed to each of the following ports.” In the previous question, respondents had been asked whether they expected, in case of a hypothetical permanent increase of total costs of shipping cargo through Rotterdam (i.e. total port call costs and cargo handling costs) by 10%, to shift volume to other
ch ports, Le Havre and Dunkerque, are not rly relevant as competitiv straints to HbR when it comes down to switching
ss between ports in response creases in harbour dues. Even if they are mentioned substitutes at all, respond would not shift any volume to those ports in case of of port related costs in R dam by 10%.
Of the German ports, only Hamburg would receive more than marginal shares of volume of
otterdam.
which of the following ports you would consider as possible substitutes for the port you fill out this form, even if they may not be the best alternative. For each port that
e port is a “very colum
” substitute for Rotterdam, a cirse indicate what proportion of
ports you would e
round “2” means that it is a “ve (of the cargo type
ports.
The survey results confirm that the Frenparticula e conbusine to inas possible entsan increase otter
agribulk and Wilhelmshaven of other dry bulk. However, our hinterland and for Hamburg also the benchmarking analysis showed that the German ports do not represent any constraint for harbour dues in R
215
Report prepared for the NMa

Charle s
Rive r
Asso c iate s
Other ports that were mentioned by respondents to our survey included Moerdijk, Dordrecht and Terneuzen for iron ore & scrap, coal and other dry bulk. However, our benchmarking analysis has shown that Terneuzen does not seem to constrain the pricing of HbR, even for small vessels. Hence, we do not consider it to be part of the relevant market. With regard to Moerdijk and Dordrecht, as already mentioned, we excluded the ports from this study because the harbour dues set by HbR are applicable in all ports in the Moerdijk/Rotterdam area and hence also in Moerdijk and Dordrecht. Obviously, given that the ports act as one
urther on to the mainland are there, but would again require the services of one of the continental ports in the HLH region for these hinterlands. Although the possible use of smaller vessels would open up some new
to ignore competition from UK ports to the mainland destinations. Hence, we do not consider North Killingholme to be in the same
r the port of Rotterdam include at most Amsterdam, Antwerp and Vlissingen for iron ore & scrap, and Amsterdam and Anwerp
price-setting entity, it does not make sense to assume that the ports of Moerdijk and Dordrecht would represent an alternative to the port of Rotterdam.
One survey respondent also mentioned the British port of North Killingholme as a possible substitute for shipments through Rotterdam. However, according to HbR the overwhelming share of other dry bulk cargo shipped through Rotterdam is destined for the Dutch and German hinterland. Possibilities to ship from the UK f
competitive alternatives, we believe it is justified
market as Rotterdam.
Overall, the results of our survey confirm the remainder of our findings presented in this chapter and lead us to conclude that the relevant markets fo
for coal. For agribulk, we conclude that the relevant market includes at most Antwerp, Amsterdam and Gent. For other dry bulk, we define the market to include at most Antwerp, Amsterdam, Vlissingen, Gent and Zeebrugge. The following tables show the throughput and market shares of the different ports in these markets in 2003.
Table 98: Relevant market for iron ore & scrap – upper bound
Throughput in 2003 in million tons
Market share in 2003
Rotterdam 39.9 70%
Amsterdam 10.3 18%
Antwerp 6.9 12%
Vlissingen 0.2 0%
Total 57.3 100%
Totals may not add up to 100 due to rounding. Source: CRA calculations based on HbR Port Statistics and information on the website of the port of Vlissingen.
216
Report prepared for the NMa
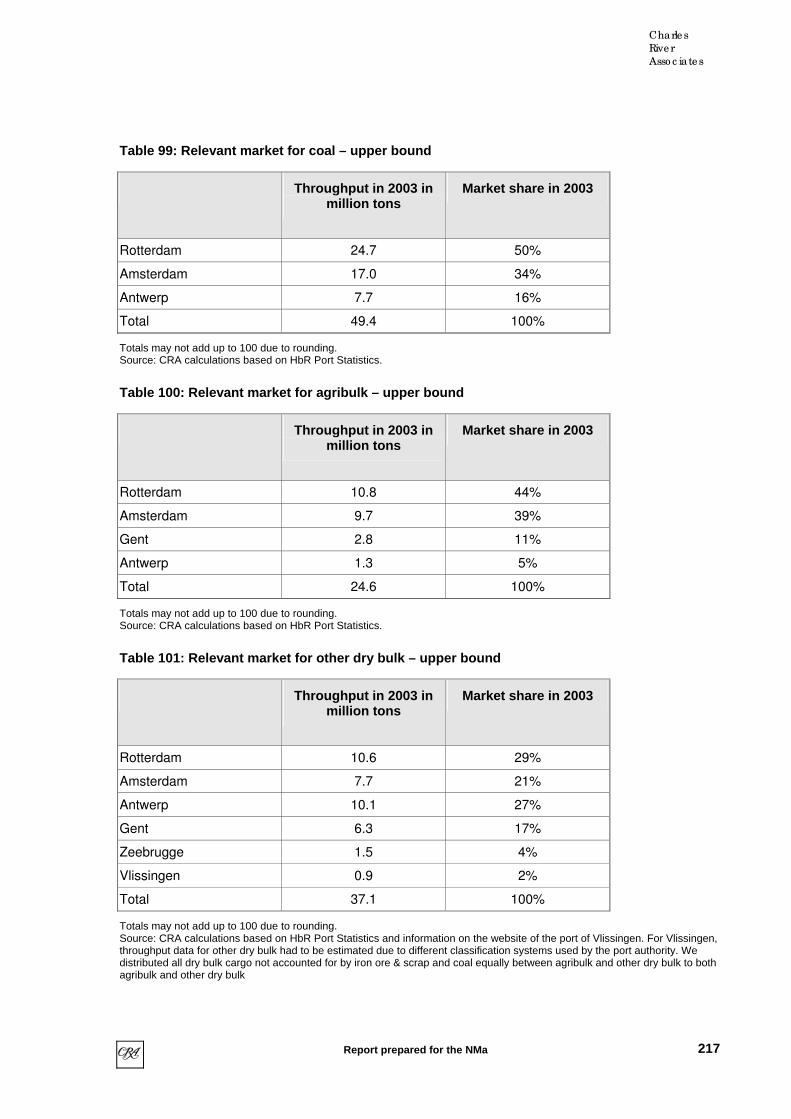
Charle s
Rive r
Asso c iate s
Table 99: Relevant market for coal – upper bound
Throughput in 2003 in million tons
Market share in 2003
Rotterdam 24.7 50%
Amsterdam 17.0 34%
Antwerp 7.7 16%
Total 49.4 100%
Totals may not add up to 100 due to rounding. Source: CRA calculations based on HbR Port Statistics.
Table 100: Relevant market for agribulk – upper bound
Throughput in 2003 in million tons
Market share in 2003
Rotterdam 10.8 44%
Amsterdam 9.7 39%
Gent 2.8 11%
Antwerp 1.3 5%
Total 24.6 100%
Totals may not add up to 100 due to rounding. Source: CRA calculations based on HbR Port Statistics.
Table 101: Relevant market for other dry bulk – upper bound
Throughput in 2003 in million tons
Market share in 2003
Rotterdam 10.6 29%
Amsterdam 7.7 21%
Antwerp 10.1 27%
Gent 6.3 17%
Zeebrugge 1.5 4%
Vlissingen 0.9 2%
Total 37.1 100%
Totals may not add up to 100 due to rounding. Source: CRA calculations based on HbR Port Statistics and information on the website of the port of Vlissingen. For Vlissingen, throughput data for other dry bulk had to be estimated due to different classification systems used by the port authority. We distributed all dry bulk cargo not accounted for by iron ore & scrap and coal equally between agribulk and other dry bulk to both agribulk and other dry bulk
217
Report prepared for the NMa
Charle s
Rive r
Asso c iate s
Clearly, market shares ofmarket power for these tw
70% for iron ore & scrap and 50% for coal indicate that HbR has o cargo types. This is in line with our finding that in general HbR
has more pricing power the larger the vessels are that are used for a shipment. The largest dry bulk carriers are indeed used for the shipping of iron ore and coal. As already mentioned, at
ll iron ore & scrap and 11% of all coal vessels calling in Rotterdam have an 16.5 metres and are thus captured in the port of Rotterdam.
For agribulk, a market share of 44% also implies that HbR is likely to have market power for the setting of harbour dues. For other dry bulk, where Rotterdam’s market share is 29%, this is less evident. However, our benchmarking analysis showed significant premiums of harbour dues in Rotterdam compared to other ARA ports. Still, the less clear-cut findings for agribulk and other dry bulk are in line with the fact that for these cargo types, smaller vessels are more commonly used than for iron ore and coal, the two most important dry bulk cargo types in
ns
orts for the handling of dry bulk. This is particularly relevant for coal, where imports are expected to continue to grow in the fut re, due f a r ountries. However, terminal operators s prepare for these deve
am, EEC ntly opened an addition inal which is intended to handle illion t coal each 264 Th ation of this coal is the steel
y in Germany. The two other coal erat EMO and EBS – also r realised new loading and unloading facilities.265
nt companies recently expanded, which will increase port tons and add storage capacity for over half a million
tons. According to the port authority of Amsterdam, the expansion is intended to meet increasing demand for coal imports of the German industry.266
According to HbR, there are plans to increase the maximum draught in the Amsterdam ports
qualitative factors such as the level and availability of hinterland connections are likely to remain. The same applied to the captive volume of major
least about 62% of aa draught of more th
terms of throughput and generated revenues for HbR.
9.12 Capacity expansion pla
There do not appear to be any capacity shortages in the large p
u to the closure oeem to
mines in Germ ny and othelopments.
European c
In Rotterd V rece al coal termabout 5.5 m ons of year. e final destinindustrexpanded o
large terminal op ors –
In Amsterdam, two coal transhipmetranshipment capacity by 3.3 million
to 17.5 metres in 2005 and to increase the maximum draught in Vlissingen to 17 metres (timing unknown).267 If these expansion plans are realised, this would provide shippers with a deep-draught alternative to Rotterdam in the ARA range and may therefore reduce HbR’s pricing power. However, other
264 www.eecv.nl 265 HbR Annual Report 2003, p. 10. 266 www.amsterdamports.nl 267 However, the timing of this expansion is unclear (information provided by HbR on 26 October 2004).
218
Report prepared for the NMa

Charle s
Rive r
Asso c iate s
customers due to investments in facilities at the port (e.g. Thyssen Krupp and electricity companies), which is another factor leading to pricing power for HbR in the dry bulk sector, especially for iron ore and coal.
9.13 Trends
One significant trend in the dry bulk business seems to be the concentration and vertical
e ago already. For example, the EECV terminal in Rotterdam was opened in the 1970 by a group of German steel companies in order to
thers and thereby realise economies of scale. Parcel services are likely to be more relevant for agribulk and other dry bulk (due to the
r coal and minerals. In any case, it seems unlikely that the increased use of parcel services would reduce the pricing power of the port of Rotterdam, given that bundling cargo volumes could mean using larger vessels, for which Rotterdam might be the qualitatively best port to call at. Nevertheless, both developments –
integration of cargo owners (especially for coal and iron ore), who get involved in the actual shipping and cargo handling. Such a trend has been indicated by several industry experts. However, this trend has set in quite some tim
increase their control over the handling of their coal and iron ore imports.268
Another trend in dry bulk that has already been mentioned are parcel services, which allow brokers and agents to bundle their cargo with that of o
lower volumes being shipped in these categories) than for iron ore and coal, where end-users usually import large quantities anyway. Currently the only parcel service provided by a terminal operator in the ARA range is located in Amsterdam. However, in Rotterdam several shippers and carriers offer parcel services fo
continued vertical integration and the increased use of parcel services – may well be long-term strategic reactions of port users to the dominant position of port authorities, for they are likely to increase their bargaining power if they are successful in the vertical and horizontal integration of production in the ports.
268 www.eecv.nl
219
Report prepared for the NMa

Charle s
Rive r
Asso c iate s
10 Liquid bulk
10.1 Overview
Wet bulk accounts for almost half of total throughput (153 million tons in 2003) in Rotterdam and about half of HbR’s total revenue from harbour dues (€101 million out of €201 million). Lease related revenue is below the throughput share and represents only 30% of total lease related income (€52 million out of €175 million).269 The importance of wet bulk is underpinned when looking at space utilisation at the port. In the port of Rotterdam, 2,400 ha
r call, oil products 20,000 and
of land are leased by the petrochemical sector (55% of the total port area).270
Table 102 shows that about two thirds of the liquid bulk throughput but only 15% of the number of calls in that sector are generated by crude oil. This reflects the size of the ships. On average oil tankers have a throughput of some 79,000 tons peliquid chemicals 17,000 tons per call.
Table 102: Liquid bulk throughput and calls in Rotterdam in 2003
Number of total calls
Share of calls Cargo throughput
in tons
Share of throughput
Crude oil 1,266 14% 99,825,848 65%
Oil products 1,365 15% 27,448,529 18%
Liquid chemicals
6,365 71% 25,235,432 17%
Total 8,996 100% 152,509,809 100%
Totals may not add up to 100 due to rounding. Source: HbR documents received on 22 July 2004
10.1.1 CRUDE OIL
Rotterdam is by far the largest crude oil port in the HLH range, accounting for 55% of the incoming crude oil. The next largest crude oil ports are Le Havre, with 20% and Wilhelmshaven, with 15% share in total crude oil throughput in the HLH. Antwerp and Dunkerque follow with 4% each.
269 stries and service providers not
re in lease revenue is lower. 270
many port. Today, “the port is loaded with oil companies” and there is not enough free space to accommodated the container business adequately (Interview with HbR on 5 July 2004).
Note that total lease related income also contains €35m revenues from induallocated to a particular cargo type. Thus, it is to be expected that the shaThis is not always seen as an advantage. Given that the leases involved mostly storage companies relocating fro other parts of the port to Maasvlakte I and Europoort, it is sometimes felt that the contracts did not add
significant value to the
220
Report prepared for the NMa

Charle s
Rive r
Asso c iate s
The mamillion tons crude oil coming into Rotterdam in 2003 is consumed by the refineries located at
, ng. Two of the German refineries are also linked with a
pipeline to Wilhelms Rotterdam aven therefore share customers, namely the two refineries in Germany, Shell and Ruhröl.
Le Havre is also connected to a pipeline but d ers linked to the th Rotterda is, together with the diff es in inland waterways, puts it in a
hoice of Wilhelmshaven, Le Havre and Rotterdam as locat r pipelines can be deap-sea ports. The larger vessels that ship crude oil from
etres, which only these ports can handle (see
oil segment, the port of Rotterdam constitutes the relevant geographic market.
onfirmed by the survey responses, which suggest that crude oil is the most captive cargo type handled in the port. A number of survey respondents also pointed to
alternative to Rotterdam. In order to supply the refineries, tankers must call at Rotterdam. Pipelines do not represent a feasible alternative, due to their limited capacity.272
The edue tcompla
rket shares can be explained by the location of the refineries. About half of the 100
or near the port. About a third is pumped through a pipeline to refineries based in Antwerp. Another 16% is pumped through the Rotterdam-Rhine pipeline to refineries in Venlo, WeselGelsenkirchen, Godorf and Wesseli
haven. Both ports, and Wilhelmsh
oes not share any custompipeline wi m. Th erencdifferent geographical market in liquid bulk.
The c ions foexplained by the fact that these are the Middle East require depths of up to 25 mSection 7.10 for a discussion of the tidal constraints).
The pipeline from Wilhelmshaven to the German refineries operates close to capacity. At the same time harbour dues in Wilhelmshaven are significantly lower than those in Rotterdam. Rotterdam is also reported to charge ten times higher harbour dues than Antwerp, which does not provide comparable sea-side access.271
This evidence suggests that with regard to port users in the crude
This conclusion is c
the ongoing competition case against HbR, which is backed by the large oil refineries. In this case, several dry bulk agencies claimed that the port of Rotterdam charges excessive and discriminatory harbour dues to oil tankers. In a preliminary ruling, the Rotterdam District Court found that for oil tankers, the geographic market for port services is the port of Rotterdam. According to the Court, the fact that the majority of refineries are located in Rotterdam means that – at least in the short and medium term – other ports do not represent a reasonable
p rception of the port users is exemplified by the reasons given for the higher harbour s a Rotterdam. One respondent pointed to the “monopoly position of Rotterdam” another
ined that “oil tankers are cash cows” for the port.
rview with [confidential] on 8 July 2004. htbank Rotterdam court decision of 28 November 2002, reference 106848/98-3016/HA ZA. Note that
rt did not decide whether HbR’s prices were discriminatory or not, but deferred the decision until
271 Inte272 Rec
the Coumore and clearer information about HbR’s accounts would be available. The case is still pending.
221
Report prepared for the NMa

Charle s
Rive r
Asso c iate s
10.1.2
Mineral oil products and other lito arequireprevail
Rotterdregardi les 60% of “other liquid bulk” and the next largest port in this segAm
A simproducts. R werp with 22% A8%, an
Minera to the hinterland. About 50 percent of the mineral oil products destined for the hinterland are shipped via pipelines, the remainder
as Antwerp, suggesting an upper bound on
ographic market is
10.1.3 MARKET DEFINITIONS AND MARKET POWER
Based on the available evidence, we find the following geographic market definitions:
• Crude oil: Rotterdam is the relevant geographic market;
• Mineral oil products: Rotterdam as a lower bound and Rotterdam and Antwerp as an upper bound; and
MINERAL OIL PRODUCTS AND OTHER LIQUID BULK
quid bulk (chemicals as well as oils and liquid fats) are also a l rge extent considered as captive cargo. The large petrochemical cluster at the port
s chemicals and oil products as input and produces them as output. A similar structure s for oils and liquid fats. Rotterdam is also used for shipments to the hinterland.
am offers the largest petrochemical cluster in the HLH range and has a strong position ng oils and liquid fats. Rotterdam hand
ment, Antwerp handles only 17% followed by Gent, Hamburg and sterdam with 5% each.
ilar ranking, albeit with more evenly distributed shares, emerges for mineral oil otterdam has the highest share in the HLH with 29%, followed by Ant
. msterdam has a share of 12%, followed by Wilhelmshaven with 9%, Le Havre with d Zeebrugge and Dunkerque with 6% each.
l oil products are also to a large extent pumped
via waterways. Other liquid bulk is mainly shipped via inland waterways, of which about 75% by barge. The high share of barging puts the ports in the ARA range in a strong position as they are best positioned to service clients in the petrochemical industry along the river Rhine.
Our hinterland analysis is confirmed by the survey responses. The only other port that was mentioned as a potential substitute to Rotterdam wthe relevant market that includes Antwerp.
We were unable to obtain benchmarks for harbour dues of mineral oil products or chemical products. None of the respondents could present evidence of switching in response to an increase in harbour dues. Based on the hinterland transport analysis, the exclusive mentioning of Antwerp as the only potential substitute port and the strong role of the existing industry located at the port, we conclude that the upper bound on the relevant geRotterdam and Antwerp. Given the dependence of the industry on industry located near or in the port, we conclude that Rotterdam has substantial pricing power.
222
Report prepared for the NMa

Charle s
Rive r
Asso c iate s
• her liquid bulk: Rotterdam as a lower bound and Rotterdam and Antwerp as an upper bound.
Table 103: Throughput and market shares for mineral oil products and other liquid bulk in tmarket Rotterdam-Antwerp in 2003
Ot
he
Mineral oil products Other liquid bulk
Throughput in 2003 in million
tons
Market share in 2003
Throughput in 2003 in million
tons
Market share in 2003
Rotterdam 27.5 6% 2 5 5.2 78%
Antwerp 21.2 % 7.1 22% 44
Total 48.7 100% 32.3 100%
Totals may nSource: CRA
ot add up to 100 due to roundi calcuations based on HbR 2
arket sha of Rot m and Antwerp. Rotterdam ar larger d b This ore ectio the s position of
and oi fats p being a small player. In fact imp t spe chem market. With r s to l
hput diff e is m less significant. This reflects not least that Antwerp also hosts a number of large refineries. Based on our analysis we find that
fined and turned into fuels (e.g. gasoline, diesel or jet fuel), naphta and/or aromatics. These products, in turn, are processed further in order to eventually become plastics, elastomers, fibres, resins, or coatings.
There are four oil refineries, which located at the port in the period 1948 to 1965:
• Nerefco (Netherlands Refining Company) is a joint venture of BP (69%) and Texaco (31%). It has a capacity of about 18m tons per year. First operations at Pernis were established in 1948. The Europoort location was built 1965. At Pernis the process units were closed down in 1997, but there is still a tank truck loading rack and 3 jetties for barge loading. The production site is Europoort with a size of 350 hectares with the process units and oil movement activities. Nerefco processes different types of crude out of 57 countries. The output is LPG, benzine, naphta (direct via pipeline to
ng. Port Statistics 003.
Table 103 shows the m res terda is by fwith respect to “other liqui ulk”. is m a refl n of trongRotterdam in chemicals l and than of AntwerAntwerp is considered as an ortan cialty icals egard mineraoil products the throug erenc uch
Rotterdam has market power in all for all types of liquid bulk cargo.
10.2 Port users
Rotterdam has a significant petrochemical sector in the port. This sector builds on a cluster of crude oil storage facilities, refineries, and petrochemical industry. Different types of crude oil are supplied by ship to the tank parks on the Maasvlakte and in Europoort, where they are stored and then piped on to the refineries for processing. Crude oil is re
223
Report prepared for the NMa

Charle s
Rive r
Asso c iate s
G ultra low sulphur diesel.273
• Shell (Shell Nederland Raffina ical nd Moerdij he refine have a city of ab t 20m tons. The
the la tes wer cluded 48 and . Som he mostly ba n crude t for the chemical plants,
y be inputs for other chem plants or lead to plastics cosmetics and other products. Moerdijk and Pernis are linked by p , which rn is l o
stomers in ny.274
international distribution centre for Q8 lubricants and fuels. The refinery has a capacity of about 2m tons. As the other
of about 10m
warehousing, tank cleaning companies, waste incineration and disposal.276 The companies are linked to a petrochemical cluster. The firms in the port of Rotterdam are linked by an extensive 1,500km intercompany-
s. The products produced at the port are then shipped to other ports or into the hinterland.
more of the chemical industry originating from Germany.
ermany), kerosine (direct pipeline to Schiphol airport and German airports), diesel,
derij) operates refineries at Pernis and petrochemplants at Pernis a k. T ries capa outentant contracts for rge si e con in 19 1959 e of trefined products (which in turn ma
sed o oil) are used as inpuical
ipeline in tu inked tSchiphol and cu Germa
• Kuweit Petroleum Europoort is a refinery and an
refineries, Kuweit Petroleum Europoort uses the terminal facilities offered, for example, by the Maasvlakte Olie Terminal.
• Esso (Esso Opslag Maatschappij) operates a refinery with a capacitytons at Botlek. The refineries produce or handle a range of products including LPG, gas, naphtha, kerosene, diesel, oil, domestic fuel oil, sulfur, petroleum cokes and various raw materials for the chemical sector.
There is also a gas condensate splitter by Koch (Koch Industries Inc.) based in Europoort. Up until now, the installation used gas condensates but increasing use of crude oil as feedstock is planned. The refinery produces mainly naphtha and kerosene and gas oil out of natural gas condensates. The naphtha is a feedstock for the chemical industry and is transported by inland barge to, for example, Antwerp, Vlissingen and Geleen. The kerosene is pumped by pipeline to Schiphol Amsterdam Airport. The storage and logistics of products and feedstock is done by the neighboring terminal Vopak Europoort.275
Altogether there are 44 petrochemical companies, 3 producers of industrial gases, 13 tank storage and distribution companies, 5 utilities centres, specialised
wide pipeline network, which allows the transfer of liquid bulk between plant
It is interesting to note that the majority of the main chemical producers in Rotterdam are of American origin, with headquarters in the United States. In contrast, Antwerp has attracted
273 http://www.nerefco.nl/pages/english/nerefcoenglish.htm. 274 http://www.shell.com. 275 http://www.portofrotterdam.com/news/UK/Pressreleases/Pressreleases/HBR_10092004_01.asp?ComponentI
D=58034&SourcePageID=0 276 Documents received from HbR 12 July 2004.
224
Report prepared for the NMa
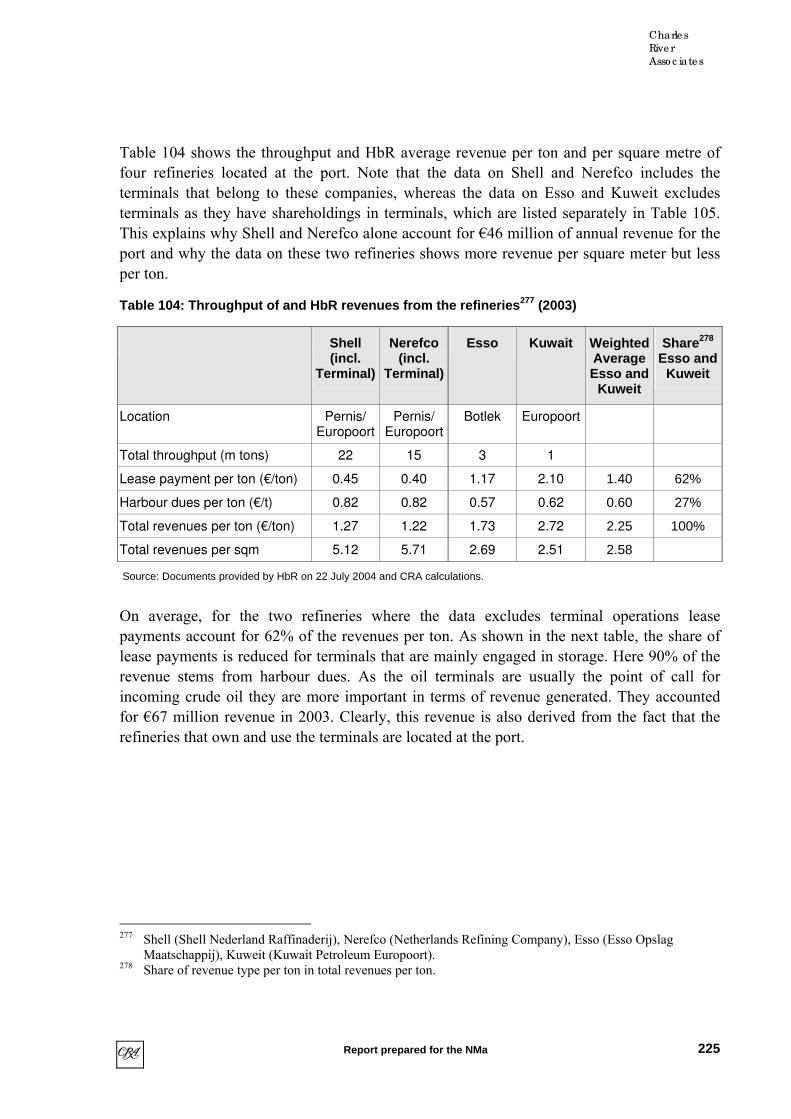
Charle s
Rive r
Asso c iate s
Table 104 shows the throughput and HbR average revenue per ton and per square metre of four refineries located at the port. Note that the data on Shell and Nerefco includes the terminals that belong to these companies, whereas the data on Esso and Kuweit excludes
rately in Table 105. million of annual revenue for the
port and why the data on these two refineries sho e per square meter but less
ghput of and HbR ries 277 (2003)
terminals as they have shareholdings in terminals, which are listed sepaThis explains why Shell and Nerefco alone account for €46
ws more revenuper ton.
Table 104: Throu revenues from the refine
Shell (incl.
Terminal)
Nerefco (incl.
Terminal)
Esso Kuwait Weighted Average Esso and
Kuweit
Share278 Esso and
Kuweit
Location Pernis/ Europoort
Pernis/ Europoort
Botlek Europoort
Total throughput (m tons) 22 15 3 1
Lease payment per ton (€/ton) 0.45 0.40 1.17 2.10 1.40 62%
Ha 0.82 0.82 .62 0.60 27% rbour dues per ton (€/t) 0.57 0
To 1.27 2.25 100% tal revenues per ton (€/ton) 1.22 1.73 2.72
Total revenues per sqm 5 2.51 2.58 .12 5.71 2.69
Source: Documents provided by HbR on 22 Ju
On average, for the two refine perations lease account for 62% of the table, the share of
ents is reduced for termrevenue stems from harbour due int of call for
de oil they are more ed. They accounted for €67 million revenue in 2003. he fact that the
ly 2004 and CRA calculations.
ries where the data excludes terminal opaymentslease paym
revenues per ton. As shown in the nextinals that are mainly engaged in storage. Here 90% of the
s. As the oil terminals are usually the poincoming cru important in terms of revenue generat
Clearly, this revenue is also derived from trefineries that own and use the terminals are located at the port.
277 Shell (Shell Nederland Raffinaderij), Nerefco (Netherlands Refining Company), Esso (Esso Opslag
Maatschappij), Kuweit (Kuwait Petroleum Europoort). 278 Share of revenue type per ton in total revenues per ton.
225
Report prepared for the NMa
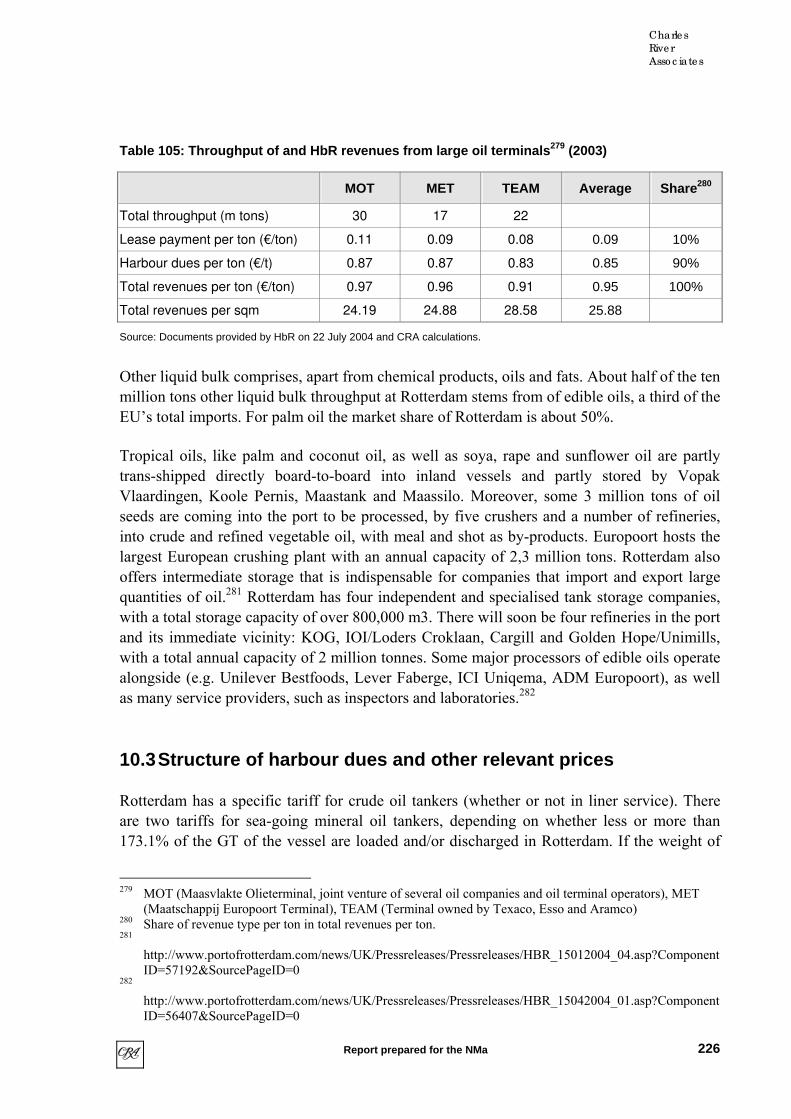
Charle s
Rive r
Asso c iate s
Table 105: Throughput of and HbR revenues from large oil terminals 279 (2003)
MOT MET TEAM Average Share280
Total throughput (m tons) 30 17 22
Lease payment per ton (€/ton) 0.11 0.09 0.08 0.09 10%
Harbour dues per ton (€/t) 0.87 0.87 0.83 0.85 90%
Total revenues per ton (€/ton) 0.97 0.96 0.91 0.95 100%
Total revenues per 24.19 24.88 28.58 25.88 sqm
Source: Documents provided by HbR on 22 July 2004 and CRA calculations.
prises, apart fromliquid bulk throu of edible oils, a third of the
EU’s total imports. For palm oil th
Tropical oils, like palm and coconut oil, as well as soya, rape and sunflower oil are partly
Rotterdam has four independent and specialised tank storage companies, with a total storage capacity of over 800,000 m3. There will soon be four refineries in the port
n, Cargill and Golden Hope/Unimills, with a total annual capacity of 2 million tonnes. Som e
s, Lever Faberge ADM Europoort), as well as m 282
10.3 Structure of harbour
Rotterdam has a specific tariff for crude oil tankers (whether or not in liner service). There are two tariffs for sea-going mineral oil tankers, depending on whether less or more than 173.1% of the GT of the vessel are loaded and/or discharged in Rotterdam. If the weight of
Other liquid bulk com chemical products, oils and fats. About half of the ten million tons other ghput at Rotterdam stems from
e market share of Rotterdam is about 50%.
trans-shipped directly board-to-board into inland vessels and partly stored by Vopak Vlaardingen, Koole Pernis, Maastank and Maassilo. Moreover, some 3 million tons of oil seeds are coming into the port to be processed, by five crushers and a number of refineries, into crude and refined vegetable oil, with meal and shot as by-products. Europoort hosts the largest European crushing plant with an annual capacity of 2,3 million tons. Rotterdam also offers intermediate storage that is indispensable for companies that import and export large quantities of oil.281
and its immediate vicinity: KOG, IOI/Loders Croklaae major processors of edible oils operat
, ICI Uniqema, alongside (e.g. Unilever Bestfoodany service providers, such as inspectors and laboratories.
dues and other relevant prices
279 MOT (Maasvlakte Olieterminal, joint venture of several oil companies and oil terminal operators), MET
(Maatschappij Europoort Terminal), TEAM (Terminal owned by Texaco, Esso and Aramco) 280 Share of revenue type per ton in total revenues per ton. 281
http://www.portofrotterdam.com/news/UK/Pressreleases/Pressreleases/HBR_15012004_04.asp?ComponentID=57192&SourcePageID=0
282 http://www.portofrotterdam.com/news/UK/Pressreleases/Pressreleases/HBR_15042004_01.asp?ComponentID=56407&SourcePageID=0
226
Report prepared for the NMa
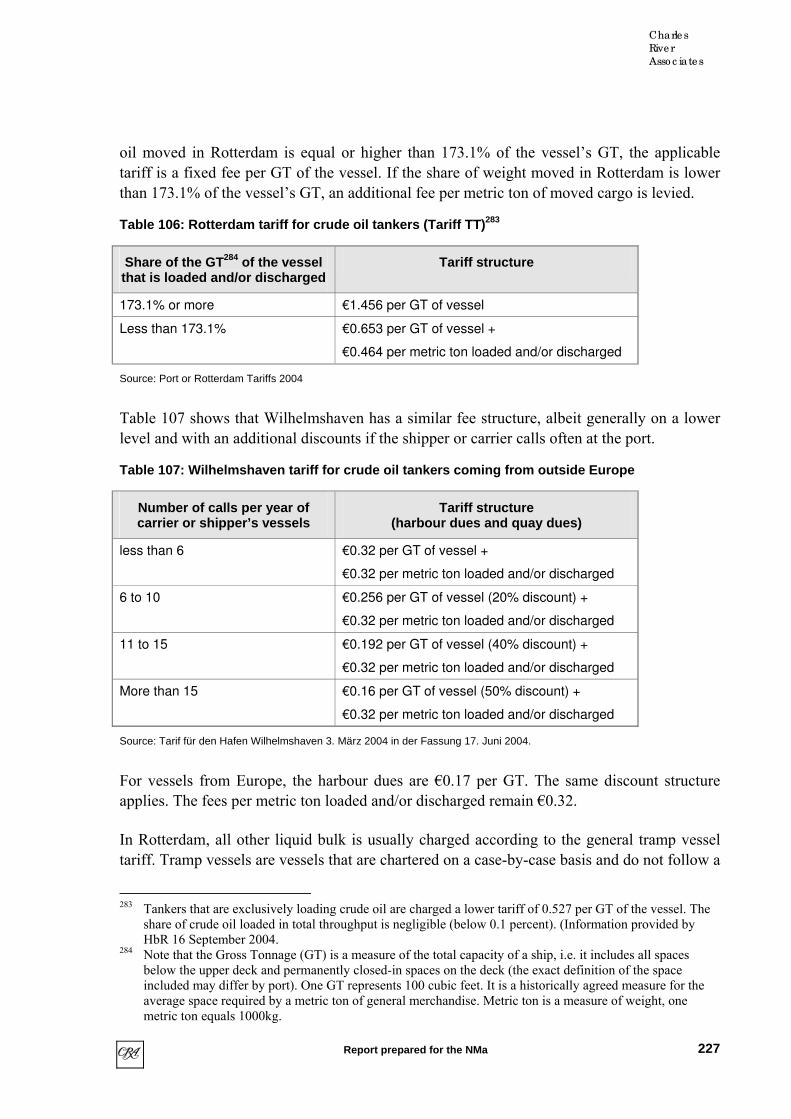
Charle s
Rive r
Asso c iate s
oil moved in Rotterdam is equal or higher than 173.1% of the vessel’s GT, the applicable tariff is a fixed fee per GT of the vessel. If the share of weight moved in Rotterdam is lower than 173.1% of the vessel’s GT, an additional fee per metric ton of moved cargo is levied.
Table 106: Rotterdam tariff for crude oil tankers (Tariff TT) 283
Share of the GT 284 of the vessel that is loaded and/or discharged
Tariff structure
173.1% or more er €1.456 p GT of vessel
Less than 173.1% p l +
p loa r d
€0.653
€0.464
er GT of vesse
er metric ton
ded and/o ischarged
Source: Port or Rotterdam T 04
7 shows tha helmsha has a si fee stru , albeit generally on a lower ith an addi al discounts if the shipper or carrier calls often at the port.
: Wilhelmshav rs coming fr
ariffs 20
Table 10 t Wil ven milar cturelevel and w tion
Table 107 en tariff for crude oil tanke om outside Europe
Number of calls pe r of r yeacarrier or shipper’s sels ves
Tariff structure (harb dues and quay dues) our
less than 6 €0.32 per GT of vessel +
2 per me n loaded or dischar €0.3 tric to and/ ged
6 to 10 56 per G essel (20% discount) +
per me n loade r discha
€0.2 T of v
€0.32 tric to d and/o rged
11 to 15
€0.32 per m
€0.192 per GT of vessel (40% discount) +
etric ton loaded and/or discharged
More than 15 €0.16 per GT of vessel (50% discount) +
€0.32 per metric ton loaded and/or discharged
Source: Tarif für den Hafen Wilhelmshaven 3. März 2004 in der Fassung 17. Juni 2004.
For vessels from Europe, the harbour dues are €0.17 per GT. The same discount structure applies. The fees per metric ton loaded and/or discharged remain €0.32.
In Rotterdam, all other liquid bulk is usually charged according to the general tramp vessel tariff. Tramp vessels are vessels that are chartered on a case-by-case basis and do not follow a
283 Tankers that are exclusively loading crude oil are charged a lower tariff of 0.527 per GT of the vessel. The
share of crude oil loaded in total throughput is negligible (below 0.1 percent). (Information provided by HbR 16 September 2004.
284 Note that the Gross Tonnage (GT) is a measure of the total capacity of a ship, i.e. it includes all spaces below the upper deck and permanently closed-in spaces on the deck (the exact definition of the space included may differ by port). One GT represents 100 cubic feet. It is a historically agreed measure for the average space required by a metric ton of general merchandise. Metric ton is a measure of weight, one metric ton equals 1000kg.
227
Report prepared for the NMa

Charle s
Rive r
Asso c iate s
specified schedule of calls. In Rotterdam, there are two tariffs for sea-going tramp vessels, depending on whether less or more than 133.2% of the GT of the vessel are loaded and/or discharged in Rotterdam. If the quantity of cargo moved in Rotterdam is equal or higher than
evied.
133.2% of the vessel’s GT, the applicable tariff is a fixed fee per GT of the vessel. If the share of quantity moved in Rotterdam is lower than 133.2% of the vessel’s GT, an additional fee per metric ton of moved cargo is l
Table 108: Tariff for tramp vessels (Tariffs TS1 and TS2)
Share of the GT 285 of the vessel that is loaded and/or discharged
Tariff structure
133.2% or more €0.858 per GT of vessel
Less than 133.2% €0.271 per GT of vessel +
€0.441 per metric ton loaded and/or discharged
Source: Port or Rotterdam Tariffs 2004
Should a sea-going wet bulk vessel operate in liner service, a different tariff is applicable.
s l. If the share of quantity moved in Rotterdam is lower than 62.1% of the vessel’s GT, an additional fee per metric ton of moved
Table 109: Tariff for liner vessels (Tariffs LS1 and LS2)
Again, there are two tariffs for non-container liner vessels, depending on whether less or more than 62.1% of the GT of the vessel are loaded and/or discharged in Rotterdam. If the quantity of cargo moved in Rotterdam is equal to, or higher than 62.1% of the vessel’s GT, the applicable tariff is a fixed fee per GT of the ve se
cargo is levied.
Share of the GT 286 of the vessel that is loaded and/or discharged
Tariff structure
62.1% or more €0.518 per GT of vessel
Less than 62.1% €0.260 per GT of vessel +
€0.416 per metric ton loaded and/or discharged
Source: Port or Rotterdam Tariffs 2004
average space required by a metric ton of general merchandise. Metric ton is a measure of weight, one metric ton equals 1000kg.
286 Note that the Gross Tonnage (GT) is a measure of the total capacity of a ship, i.e. it includes all spaces below the upper deck and permanently closed-in spaces on the deck (the exact definition of the space included may differ by port). One GT represents 100 cubic feet. It is a historically agreed measure for the average space required by a metric ton of general merchandise. Metric ton is a measure of weight, one metric ton equals 1000kg.
285 Note that the Gross Tonnage (GT) is a measure of the total capacity of a ship, i.e. it includes all spaces below the upper deck and permanently closed-in spaces on the deck (the exact definition of the space included may differ by port). One GT represents 100 cubic feet. It is a historically agreed measure for the
228
Report prepared for the NMa

Charle s
Rive r
Asso c iate s
10.4 Throughput and capacity of li quid bulk ports in North Europe
Table 110 provides an indication of market shares for relevant liquid bulk ports in the HLH range for three types of liquid bulk: crude oil, mineral oil products and petcokes (a variety of oil pro cts) and u ic li ls
Table 110: Throughput and marke r liqu the H in 2
du other liquid b lk goods, wh
t shares fo
h are mainly
id bulk in
quid chemica
LH range
.
003
Crude oil Mineral oil products Other liquid bulk
Throughput in 2003 in
million tons
Market share in
2003
Through putin 2003 in
million tons
Market share in
2003
Throughput in 2003 in
million tons
Market share in
2003
Rotterdam 99.8 55% 27.5 29% 25.2 60%
Antwerp 6.9 4% 21.2 22% 7.1 17%
Amsterdam 0 0% 11.6 12% 2 % 5
Wilhelmshaven 27.9 15% 8.6 9% 0.3 1%
Le Havre 35.2 19% 7.7 8% 1.7 4%
Dunkerque 6.8 4% 5.5 6% 0.9 2%
Hamburg 4.1 2% 5.3 6% 2.2 5%
Zeebrugge 0 0% 4.7 5% 0.2 0%
Bremen 0 0% 1.9 2% 0 0%
Gent 0 0% 0.8 1% 2.2 5%
Total 180.7 100% 94.8 100% 41.8 100%
Totals may not add up to 100 due to rounding. Source: CRA calcuations based on HbR Port Statistics 2003.
Capacities of the ports are determined by the capacities of the hinterland pipelines and other hinterland transportation, as well as by the capacities of the industry at the port. Another relevant restriction for crude oil and mineral oil tankers is the depth of the access channels.
Moreover, different ports specialise on different storage facilities. Rotterdam is more specialised on large scale storage, Antwerp has more storage for specific products.287
Larger crude oil tankers (200,000 to 235,000 GT) have a maximum draught of 22 to 25 metres. The only ports in the HLH that can accommodate these vessels are Rotterdam, Wilhelmshaven and Le Havre. Smaller crude oil tankers (su ch as 60 thousand GT) still
288
require a draught of about 15 metres. The average size of crude oil tankers calling at Rotterdam has recently decreased from 86,000 GT in 2001 to 60,000 GT in January to August 2004, reflecting the greater share of crude oil imported on smaller vessels from the
287 Information provided by HbR on 26 October 2004. 288 Information provided by HbR on 16 September 2004.
229
Report prepared for the NMa

Charle s
Rive r
Asso c iate s
North Sea.289 The remaining crude oil stems mainly from the Middle East and is shipped on larger vessels.
Rotterdam, Wilhelmshaven and Le Havre are the only ports that can accommodate the large nd the pipeline from
Wilhelmshaven is close to capacity.
average weight of 175,000 tons and are up to 440,000 tons large. Smaller vessels that carry crude oil from the north sea can be as small as 90,000 tons.291
il products, so that similar draught restrictions apply to the larger of these vessels. However, on average vessels are smaller than for crude oil transportation, the
ransportation of incoming cargo depend on the type of liquid bulk. We discuss
the result of continental Europe’s dependence on oil imports for the production of fuel and
crude oil tankers. Le Havre does not serve the same hinterland a
The largest-ever vessel to call at the Maasvlakte Oil Terminals (MOT) called in 1977 and was the Batillus, which could carry more than 550,000 tons. 290 Currently, vessels calling at the MOT have an
The vessels used for mineral oil products or petcokes are the same vessels as those that are used for crude o
average capacity of vessels for this cargo type is 30,000 GT, half of the average capacity of the crude oil ships.
Vessels for other liquid bulk (mainly chemicals, but also oils and fats) like chemicals are generally much smaller. The largest ship in Rotterdam (62,000 GT) had a maximum draught of 12 metres and the average size is only 12,000 GT.292
10.5 Liquid bulk origin and destination
Crude oil is almost exclusively shipped into the ports in the HLH range. About 36 percent of each, the mineral oil products and the other liquid bulk throughput in the HLH range is outgoing. Around 64 percent incoming cargo.
For liquid bulk, the main trading routes are Norway-Rotterdam, Houston-Rotterdam, Egypt-Rotterdam, Primorsk-Rotterdam and Far East-Rotterdam.293 The destination and the hinterland teach type in turn below.
10.5.1 CRUDE OIL
Virtually all of the crude oil throughput in the port of Rotterdam is incoming cargo, which is
289 Information provided by HbR on 16 September 2004. 290 www.mot.nl 291 Information provided by HbR on 1 November 2004. 292 Information provided by HbR on 16 September 2004. 293 Information provided by HbR on 16 September 2004.
230
Report prepared for the NMa

Charle s
Rive r
Asso c iate s
energy.294 Table 111 shows the arrival of the crude oil in the HLH range and some indication where it is consumed.
Table 111: Crude oil import in the HLH range, local capacity and pipelines (million tons)
Throughput Capacity of refinery at
port
Throughput through pipeline
Capacity of pipeline
Destination of pipeline
Rotterdam 100 56 30
6
16
30
10
22
Antwerp
Vlissingen
Gelsenk. Köln
Le Havre 35 36 4
Wilhelmshaven 28 10 4
14
8
15
Hamburg
Gelsenk. Köln
Duinkerque 7 7
Zeebrugge 7 7
Hamburg 4 10
Brunsbüttel 3 0
Vlissingen 1 7
Source: Information provided by HbR on 22 July 2004
f total crude oil coming to Northern Europe (total 184m tons) was tons), with Le Havre (35m tons) and Wilhelmshaven (28m tons)
in second and third place. Rotterdam and Wilhelmshaven are both connected to a pipeline to Both ports therefore share some customers (two refineries in
connected to a pipeline but does not share any ers
About half of the 100 million tons crude oil coming into Rotterdam in 2003 is consumed by the refineries located at or near the port. The other half is usually transported via pipelines to the hinterland through the Rotterdam-Rhine pipeline to Venlo, Wesel, Gelsenkirchen, Godorf and Wesseling (16m tons295), to Antwerp (30m tons296) through the Rotterdam-Antwerp pipeline and to Vlissingen (6m tons) through the Total pipeline.297
Table 111 also provides capacity figures for the North-West Pipeline, which services BP in Lingen, Ruhr Öl in Gelsenkirchen and Shell in Köln-Wesseling. The data suggests that while
In 2003, the largest share oshipped to Rotterdam (100m
the German hinterland. Germany, Shell and Ruhröl). Le Havre is alsocustom linked to the pipeline with Rotterdam. This, together with the differences in inland waterways, puts it in a different geographical market in liquid bulk.
294 Port Statistics 2003 and information provided by HbR on 16 September 2004. 295 About 10m tons go to Shell in Cologne and 6m tons to BP in Gelsenkirchen. 296 To refineries of Total, EM, BRC and Petroplus. 297 Information provided by HbR on 16 September 2004.
231
Report prepared for the NMa

Charle s
Rive r
Asso c iate s
the N pipeline is close to capacity (14m tons out of WO 15m tons), the pipelines from Rotterdam still have considerable excess capacity.
10.5.2 MINERAL OIL PRO KES AND OTHER LIQU
ing cargo of mineral oil products is stimulated by the Russian exports of High Fuel nkering market and transports to the Far East.298 After Singapore,
he most important bunker port in the world. In 2003 ships bunkered 11.4 ns.
nt extent derived from the demand and supply generated by the petrochemical industry located at or
t-to-point transport, linking companies in the port with companies in the hinterland (in particular the Netherlands, Belgium and Germany). Each year, some 60 million tons of various oil and chemical
in products being so transported are crude
d to Rotterdam are Germany, which received circa 16 million tons in 2002, 50% via inland waterway and 50%
illion tons via inland waterway in 2002. In 2002, aterway with 1 million tons.300
The main hinterland destinations for other liquid bulk are Belgium and Germany, which received in total around 7 million tons in 2002. About 75% of this is transported via inland waterway.
Rotterdam and the other ports in the ARA range, in particular Antwerp and Amsterdam,
ast-West corridor that links to Hamburg to important hinterland destinations like Berlin, Dresden or Prague. The nautical
DUCTS/PETCO ID BULK
The incomOils (HFO) for the buRotterdam is tmillion to
The shipment of mineral oil products and chemical products are to a significa
near the ports.
Liquid bulk companies use pipelines for large-scale poin
products pass through the pipeline network. The maoil and (semi) finished products such as naphtha, kerosene, liquefied petroleum gas and ethylene.299 For example, Rotterdam is linked to the only north-west Europe pipeline network for ethylene. The only other port linked to this pipeline is Terneuzen. HbR is actively engaged in some of these pipeline initiatives and holds shares in existing pipeline projects.
The main destinations in the hinterland for mineral oil products shippe
via pipeline, and Belgium, with 7 mSwitzerland was supplied via inland w
service the “Rhine corridor”, which is the most important inland waterway.301 Hamburg on the other hand is located on the Elbe, with access to the E
conditions on the river Elbe are significantly worse than those on the river Rhine, which
298 Information provided by HbR on 16 September 2004. 299 http://www.portofrotterdam.com/Business/UK/Transportlogistics/Transport/Pipelines/Index.asp 300 Information provided by HbR on 16 September 2004. 301 PINE: “Prospects for Inland Navigation within the Enlarged Europe” Final Report 2004, p. 154.
232
Report prepared for the NMa
Charle s
Rive r
Asso c iate s
explai the much higher share of barge transport ns in the ARA range ports compared to Hamburg.302
Many barge operators that specialise on liquid bulk p ed t connect the ARA range ports with the Rhine area. For example, Vopak, a large provider of liquid bulk barges, offers integrat servic egetab fats – all departing from ARA range ports. Their services in Hamburg are restricted to the North
rea.303
rovide integrat
es for chemicals, v
logistical services tha
le oils anded transport
German a
302 PINE: “Prospects for Inland Navigation within the Enlarged Europe” Final Report 2004, p. 162. 303 www.vopak.com
233
Report prepared for the NMa

Charle s
Rive r
Asso c iate s
Figure : Cargo flow inland waterways 21
Source: Waardevol Transport, www.inlandshipping.com, p. 13
ansport shows that the ports in the ARA range offer the best ccess to the Rhine corridor. Taking further into account the existence of petrochemical
clusters discussed in the previous section, Antwerp is the most relevant alternative port to Rotterdam. This is confirmed by our survey, which shows that the only port considered as a viable potential alternative to Rotterdam for mineral oil products and “other liquid bulk” is Antwerp.
The analysis of the hinterland tra
234
Report prepared for the NMa
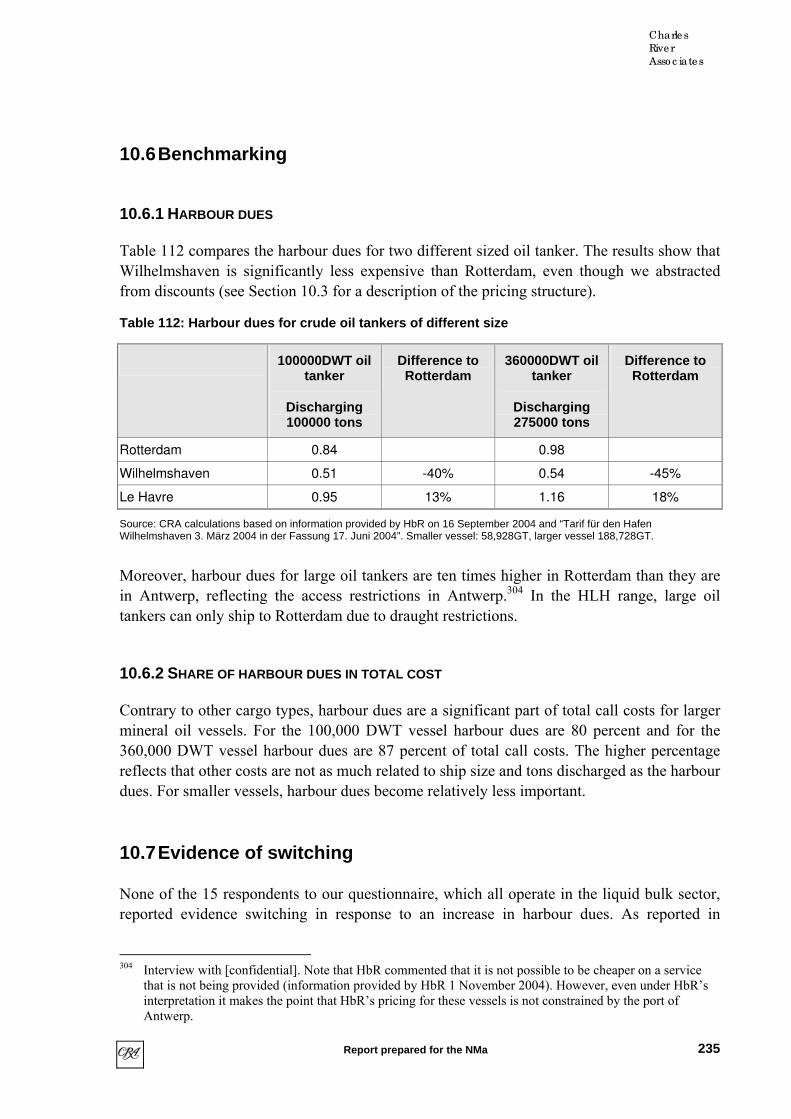
Charle s
Rive r
Asso c iate s
10.6 Benchmarking
10.6.1 HARBOUR DUES
Table 112 compares the harbour diffe r. The results show that Wilhelmshaven is significantly less expensive t though we abstracted
ounts (see Section 10.3 for a scription of the pricing structure).
arbour dues for crude oil tankers of different s
dues for two rent sized oil tankehan Rotterdam, even
from disc de
Table 112: H ize
100000DWT oil tanker
Discharging 100000 tons
Difference to Rotterdam
360000DWT oil tanker
Discharging 275000 tons
Difference to Rotterdam
Rotterdam 0.84 0.98
Wilhelmshaven 0.51 -40% 0.54 -45%
Le Havre 0.95 13% 1.16 18%
Source: CRA calculations based on information pro d by HbR on 16 Septem 04 and “Tarif für den H Wilhelmshaven 3. März 2004 in der Fassung 17. Juni 2004”. Smaller vessel: 58,928GT, larger vessel 188,72 .
es for large oil kers are ten times higher in Rotterdam an they are 304 oil
mineral oil vessels. For the 100,000 DWT vessel harbour dues are 80 percent and for the
10.7 Evidence of switching
None of the 15 respondents to our questionnaire, which all operate in the liquid bulk sector, reported evidence switching in response to an increase in harbour dues. As reported in
vide ber 20 afen8GT
Moreover, harbour du tan thin Antwerp, reflecting the access restrictions in Antwerp. In the HLH range, large tankers can only ship to Rotterdam due to draught restrictions.
10.6.2 SHARE OF HARBOUR DUES IN TOTAL COST
Contrary to other cargo types, harbour dues are a significant part of total call costs for larger
360,000 DWT vessel harbour dues are 87 percent of total call costs. The higher percentage reflects that other costs are not as much related to ship size and tons discharged as the harbour dues. For smaller vessels, harbour dues become relatively less important.
304 Interview with [confidential]. Note that HbR commented that it is not possible to be cheaper on a service
that is not being provided (information provided by HbR 1 November 2004). However, even under HbR’s interpretation it makes the point that HbR’s pricing for these vessels is not constrained by the port of Antwerp.
235
Report prepared for the NMa

Charle s
Rive r
Asso c iate s
Section 3, the summary statistics clearly show that liquid bulk is seen as the most captive cargo category.
The survey results suggest a ranking within the liquid bulk products with crude oil being the most and other liquid bulk being the least captive cargo type.
Table 113 reports which ports are considered as substitute ports for crude oil. The two respondents stated that they would switch volume to Antwerp and Wilhelmshaven. None of the ports is seen as a good substitute for Rotterdam.
Table 113: Substitute ports for crude oil respondents
Number of respondents seeing
port as possible alternative for
Rotterdam
Average quality of the port as a substitute for
Rotterdam (not weighted, -2=very
poor, +2=very good)
Average share of total volume shifted
away from Rotterdam moved to
this port
Le Havre 1 -1.0 0
Dunkerque 0 0
Gent 0 0
Zeebrugge 0 0
Antwerp 3 -1.3 75
Vlissingen 1 -1.0 0
Amsterdam 2 -1.0 0
Wilhelmshaven 2 -0.5 25
Bremen/Bremerhaven 0 0
Hamburg 0 0
Felixstowe 0 0
Other port 0 0
Total # of respondents 4 4 2
Source: CRA questionnaire. Note that averages are not weighted. The question for columns 2 and 3 was: “Please indicate which of the following ports you would consider as possible substitutes for the port of Rotterdam for the cargo type for which you fill out this form, even if they may not be the best alternative. For each port that you would consider as a possible alternative, please assess the quality as a substitute for Rotterdam by circling a number between “–2” and “2”. A circle around “-2” means that the port is a “very poor” substitute for Rotterdam, a circle around “2” means that it is a “very good” substitute.” The question for column 4 was: “Please indicate what proportion of the total volume (of the cargo type for which you fill out this form) shifted away from Rotterdam to other ports you would expect to route or to be routed to each of the following ports.” In the previous question, respondents had been asked whether they expected, in case of a hypothetical permanent increase of total costs of shipping cargo through Rotterdam (i.e. total port call costs and cargo handling costs) by 10%, to shift volume to other ports.
In the mineral oil products segment all three respondents for that question would exclusively switch to Antwerp. Antwerp is seen as providing reasonable quality as a substitute, as is Zeebrugge.
236
Report prepared for the NMa
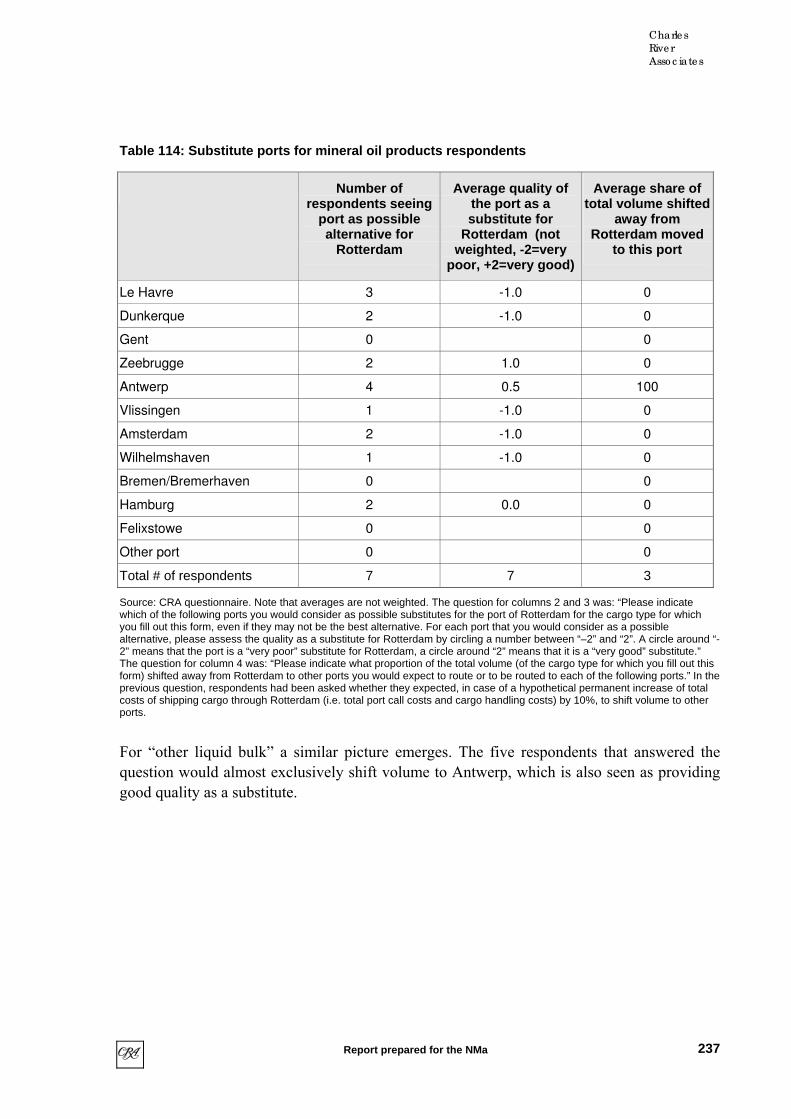
Charle s
Rive r
Asso c iate s
Table 114: Substitute ports for mineral oil products respondents
Number of respondents seeing
port as possible alternative for
Rotterdam
Average quality of the port as a substitute for
Rotterdam (not weighted, -2=very
poor, +2=very good)
Average share of total volume shifted
away from Rotterdam moved
to this port
Le Havre 3 -1.0 0
Dunkerque 2 -1.0 0
Gent 0 0
Zeebrugge 2 1.0 0
Antwerp 4 0.5 100
Vlissingen 1 -1.0 0
Amsterdam 2 -1.0 0
Wilhelmshaven 1 -1.0 0
Bremen/Bremerhaven 0 0
Hamburg 2 0.0 0
Felixstowe 0 0
Other port 0 0
Total # of respondents 7 7 3
Source: Cwhich of tyou fill oualternativ2” meansThe quesform) shifprevious costs of sports.
For “oquestiogood q
RA questionnaire. Note that averages are not weighted. The question for columns 2 and 3 was: “Please indicate he following ports you would consider as possible substitutes for the port of Rotterdam for the cargo type for which t this form, even if they may not be the best alternative. For each port that you would consider as a possible e, please assess the quality as a substitute for Rotterdam by circling a number between “–2” and “2”. A circle around “- that the port is a “very poor” substitute for Rotterdam, a circle around “2” means that it is a “very good” substitute.” tion for column 4 was: “Please indicate what proportion of the total volume (of the cargo type for which you fill out this ted away from Rotterdam to other ports you would expect to route or to be routed to each of the following ports.” In the question, respondents had been asked whether they expected, in case of a hypothetical permanent increase of total hipping cargo through Rotterdam (i.e. total port call costs and cargo handling costs) by 10%, to shift volume to other
ther liquid bulk” a similar picture emerges. The five respondents that answered the n would almost exclusively shift volume to Antwerp, which is also seen as providing uality as a substitute.
237
Report prepared for the NMa

Charle s
Rive r
Asso c iate s
Table 115: Substitute ports for other liquid bulk respondents
Number of respondents seeing
port as possible alternative for
Rot am terd
Average quality of the port as a substitute for
Rotterdam (not weighted, -2=very
poor, +2=very good)
Average share of total volume shifted
away from Rotterdam moved to
this port
Le Havre 3 0.0 1
Dunkerque 2 -1.0 0
Gent 1 -1.0 0
Zeebrugge 4 0.7 1
Antwerp 5 1.6 96
Vlissingen 2 0.5 0
Amsterdam 1 -1.0 0
Wilhelmshaven 0 0
Bremen/Bremerhaven 1 1.0 0
Hamburg 3 0.3 1
Felixstowe 1 -1.0 1
Other port 0 0
Total # of respondents 6 6 5
Source: CRA questionnaire. Note that averages are not weighted. The question for columns 2 and 3 was: “Please indicate hich of the following ports you would consider as possible substitutes for the port of Rotterdam for the cargo type for which u fill out this form, even if they may not be the best alternative. For each port that you would consider as a possible
alternative, please assess the quality as a substitute for Rotterdam by circling a number between “–2” and “2”. A circle around “-2” means that the port is a “very poor” substitute for Rotterdam, a circle around “2” means that it is a “very good” substitute.” The question for column 4 was: “Please indicate what proportion of the total volume (of the cargo type for which you fill out this form) shifted away from Rotterdam to other ports you would expect to route or to be routed to each of the following ports.” In the previous question, respondents had been asked whether they expected, in case of a hypothetical permanent increase of total costs of shipping cargo through Rotterdam (i.e. total port call costs and cargo handling costs) by 10%, to shift volume to other ports.
The survey responses also suggest that mineral oil is one of the most captive cargo types handled in the port. A number of survey respondents also pointed to the court case against HbR, which is backed by the large oil refineries. The perception of the customers is exemplified by the reasons given for the higher prices at Rotterdam. One respondent pointed to the monopoly position of Rotterdam” another complained that “oil tankers are cash cows”.
wyo
238
Report prepared for the NMa
Charle s
Rive r
Asso c iate s
10.8 Trends and expansion plans
There are discussions to lengthen existing crude oil pipelines from Russia to west Germany (e.gThis w much less captive.
Altto a shcontinushipping of liquid bulk through the port of Rotterdam remains the method of choice for access to the European hinterland.
Apart to our attention, either by HbR, its competitors or respondents to our questionnaire that would significantly affect the market pos
. the Shell refinery linked to the existing pipelines from Rotterdam and Wilhelmshaven). ould make the existing throughput at Rotterdam 305
hough the average vessel size for crude oil shipments has gone down in recent years due ift in emphasis towards oil imports from the North Sea, this trend is unlikely to e and may be reversed depending on the international political environment. Overseas
from these there were no major trends brought
ition of the port of Rotterdam.
rmation provided by HbR 26 October 2004. 305 Info
239
Report prepared for the NMa

11 F siderations urther con
Our anHbR. We generally conclude that HbR has pricing power relative to its rival ports and find relevant markets to be confined to the ARA range ports or smaller.
Three i e made here:
• In our analysis, we focused primarily on short-run pricing competition. However, ports also consider the long-run effects of their pricing decisions. Thus, while it may be possible for a port to exploit a dominant position over the course of several years,
filling newly available of Rotterdam may also
een brought to
rt like Rotterdam. Most of the pricing power of the port of Rotterdam is derived from its strategic location and good seaside access. From a welfare
eficial locations help allocating investment to
fficiency issues – which relate to competition – remain a potential concern then, in particular when HbR’s pricing
• rt industry is significantly influenced by
to essential facilities such as well as its Member States.
is beyond the scope of our
alysis has focused on the issue of market definition and market power on the part of
mportant comments are to b
such a strategy may deter investors later on, when it comes tospace. The other way around, an expanding port like the port consider the long-run effect of its pricing decisions. These issue shave bthe fore by the management of HbR.
• Taking a dynamic perspective may also change the welfare assessment of higher pricing of a po
perspective, it is clear that society prefers investments in Rotterdam to investments at other, less well-situated ports. Given that current pricing reflects the payback on initial investments, higher prices at benwhere it should go from a the point of view of total welfare. When added to these are the network effects and synergies that follow from the future Betuwe line, for example, a large single port may be socially preferably to several smaller ones from the perspective of productive efficiency. Allocative e
power is not kept in regulatory check.
Finally, the competitive environment in the pothe different financing of ports. A more detailed assessment of welfare and competition would have to take into account the levels of subsidies/state aid that different ports may receive. State aid issues in relationports are an area of great interest in the European Union, asHowever, we agreed with the NMa that such an analysispresent study.
Report prepared for the NMa

Charle s
Rive r
Asso c iate s
Annex I: List of contacts and interviews
Name Date of last contact
Form of contact
[Content of table is confidential]
241
Report prepared for the NMa
Charle s
Rive r
Asso c iate s
Annex II: Bibliography
1) Ashar, Asaf: “Strategic Pricing in Newly Privatised Ports” in: International Journal of Maritime Economics, Vol. 3, 2001; pp 52–78
ker, Director–
udie
7) het
8) tudiees Nr. 1, Kooperation Universität – Arbeiterkammer
9) ritime Policy
10) p –
11) t–Lefret, Corinne and Armani, Enrico–Maria: “Ports maritimes et
12) Maritime Future – A Contribution to the mission to ee and the
Committee of the Regions, COM (96) 84 final, March 1996
2) Bakker, Tammemoms: “Speech on behalf of the minister of Transport, Public Works and Water Management, Karla Peijs, given by Mrs. Tammenoms BakGeneral for Freight Transport, at the European Sea Ports Conference 2004 in Rotterdam”, June 2004
3) Buck Consultants International et al: “Prospects of inland navigation within the enlarged Europe – full final report”, March 2004
4) Centraal Planbureau and Gemeentelijk Havenbedrijf Rotterdam: “ConcurrentiestDuitsland – Onderzoek naar de concurrentiekracht van de havens van Rotterdam, Antwerpen, Hamburg en Bremen op de Duitse markt”, SDU Uitgevers, 1999
5) Dekker, Tom C.: “Krimpt het achterland van Rotterdam?”, Havenbedrijf Rotterdam, August 2003 (provided by HbR on 15 July 2004)
6) Deutsche Verkehrs–Zeitung: www.dvz.de
De Vries, C.J.: “Waardevol Transport, De maatschappelijke betekenis van goederenvervoer en de binnenvaart 2004-2005“
Dombois, Rainer and Heseler, Heiner: „Seaports in the Context of Globalization and Privatisation“, Maritime SBremen, March 2000
Dowd, Thomas J. and Fleming, Douglas K.: “Port Pricing” in: MaManagement, Vol. 21, No. 1, 1994; pp. 29–35
DTZ Consulting and Research: “Benchmark Study Le Havre – AntwerRotterdam”, link provided by HbR on 26 July 2004
Dussarconcurrence”, in: Competition Policy Newsletter, number 1, February 1998; pp. 32–37
European Commission: “Shaping Europe'sCompetitiveness of Maritime Industries”, Communication from the Comthe European Parliament, the Council, the Economic & Social Committ
242
Report prepared for the NMa

Charle s
Rive r
Asso c iate s
13)a", Commission Staff Working Document, SEC (2001) 234,
February 2001
14)Commission to the European Parliament and the Council, COM (2001) 35
final, February 2001
15) European Commission: “Merger Procedure Case No. COMP/JV.55–Hutchinson /
16) European Commission: “Merger Procedure Case No. COMP/JV.56–Hutchinson /
17)
19) European Commission: “Merger Procedure Case No.IV/36.253 – P&O Stena Line”,
20) an Commission: “Merger Procedure Case No. COMP/M.2838 – P&O Stena Line (Holding) Limited” August 2002
21) November 2002 concerning market access to port services”, EC No 61/2002, in: Official Journal of the
22) European Sea Ports Organisation, “Report of an Enquiry into the Current Situation in
23) ion: “European Sea Port Policy – Challenges and Solutions – Summary and Conclusions”, October 2001
24)
25) Gemeentelijk Havenbedrijf Rotterdam: “Doorsteekvariant Maasvlakte 2 – Business
26) ven 2004”, recommendations sent to the municipality of Rotterdam on 21 November 2003,
European Commission: "On Public Financing and Charging Practices in the Community Sea Port Are
European Commission: “Reinforcing Quality Service in Sea Ports”, Communication from the
RCPM / ECT”, July 2001
ECT”, November 2001
European Commission: “Seaports – a transport success story”
18) European Commission: “Seaports – gateways to sea transport growth”
January 1999
Europe
European Council: “Common position adopted by the council on 05
European Communities, C 299/E1, December 2002
the Major Community Sea Ports”, 1996
European Sea Port Organisat
European Sea Ports Organisation, “Annual Report 2003”
Case (main report and annexes)”, provided by HbR on 26 July 2004
Gemeentelijk Havenbedrijf Rotterdam: “Niet–fiscale Haventarie
provided by HbR on 26 July 2004
243
Report prepared for the NMa
Charle s
Rive r
Asso c iate s
27) Goss, R.O.: “Economic Policies and Seaports: 1. The economic functions of seaports” in: Maritime Policy Management, Vol. 17, No. 3, 1990; pp 207–219
Goss, R.O.: “Economic Policies and Seaports: 2. The diversity of port policies” in: Maritime P
28)olicy Management, Vol. 17, No. 3, 1990; pp 221–234
30) Goss, R.O.: “Economic Policies and Seaports: 4. Strategies for port authorities” in:
31) Haralambides, H.E.: “Competition, Excess Capacity, and the Pricing of Port
urnal of Maritime Economics, Vol. 4, 2002; pp 21–34
33) Financing and Pricing in the European Union: Theory, Politics and Reality” in: International Journal of Maritime
34) Havenbedrijf Rotterdam: “Explanation of Terms and Abbreviations Used”
35) bedrijf Rotterdam: “Fruitport”, brochure, February 2003
37) bedrijf Rotterdam: “City Port”, brochure, January 2004
39) Dry bulk”, presentation given on 12 July 2004
iven on 12 July 2004
4
42) Havenbedrijf Rotterdam: “Beste halfjaar ooit – Containers in dubblele cijfers – Groei Rotterdamse Haven versnelt”, provided by HbR on 15 July 2004
29) Goss, R.O.: “Economic Policies and Seaports: 3. Arte port authorities necessary?” in: Maritime Policy Management, Vol. 17, No. 3, 1990; pp 257–271
Maritime Policy Management, Vol. 17, No. 3, 1990; pp 273–287
Infrastructure” in: International Journal of Maritime Economics, Vol. 4, 2002; pp 323–347
32) Haralambides, H.E., Carriou, P. and Benacchio, M.: “Costs, Benefits and Pricing of Dedicated Container Terminals” in: International Jo
Haralambides, H.E., Verbeke A. and Musso E.: “Port
Economics, Vol. 3, 2001; pp 368–389
Haven
36) Havenbedrijf Rotterdam: “Annual Report 2003”, January 2004
Haven
38) Havenbedrijf Rotterdam: “World Port”, brochure, April 2004
Havenbedrijf Rotterdam: “
40) Havenbedrijf Rotterdam: “The container market – the position of the Port of Rotterdam”, presentation g
41) Havenbedrijf Rotterdam: “The Petrochemical Sector in the Port of Rotterdam”, presentation given on 12 July 200
244
Report prepared for the NMa

Charle s
Rive r
Asso c iate s
43) Havenbedrijf Rotterdam: “Prognose Containers naar het achterland”, provided by HbR on 15 July 2004
44) Havenbedrijf Rotterdam: “Belang droge bulksector”, presentation provided by HbR
45) Havenbedrijf Rotterdam: “Information on and contact details of dry bulk terminal
46) Havenbedrijf Rotterdam: “Key accounts for dry bulk and liquid bulk”, provided by
47) erdam: “Port Statistics 2003”, provided by HbR on 16 July 2004
49) m: “Response to CRA questions on containers”, provided by HbR on 16 July 2004
50) , (including throughput and market share data), provided by HbR on 16 July 2004
51) cing and tenants bulk (with attachment of lease list prices for 2004)”, provided by HbR on 16 July 2004
52) of wet bulk customers in 2003 (split into crude oil, oil products and other liquid bulk)”, provided
rovided by HbR on 22 July 2004
eived from key customers in the liquid bulk sector”, provided by HbR on 22 July 2004
55) ”, presentation provided by HbR on 22 July 2004
56) put of main container customers in 2003”, provided by HbR on 26 July 2004
57)
on 16 July 2004
operators in the port of Rotterdam”, provided by HbR on 16 July 2004
HbR on 16 July 2004
Havenbedrijf Rott
48) Havenbedrijf Rotterdam: “Port Tariffs 2004”, provided by HbR on 16 July 2004
Havenbedrijf Rotterda
Havenbedrijf Rotterdam: “Response to CRA questions on dry bulk”
Havenbedrijf Rotterdam: “Response to CRA questions on pri
Havenbedrijf Rotterdam: “Data on number of calls and total throughput
by HbR on 22 July 2004
53) Havenbedrijf Rotterdam: “Information on and contact details of liquid bulk key customers in the port of Rotterdam”, p
54) Havenbedrijf Rotterdam: “Information on lease and harbour due payments rec
Havenbedrijf Rotterdam: “Oil and refining
Havenbedrijf Rotterdam: “Information on through
Havenbedrijf Rotterdam: “Havenplan 2020 – Ruimte voor kwaliteit”, 2004
245
Report prepared for the NMa
Charle s
Rive r
Asso c iate s
58) Havenbedrijf Rotterdam: “Port Vision 2020: Rotterdam Quality Port” available at www.havenplan2020.nl
59) Heaver, Trevor D.: “The Implications of Increased Competition among Ports for Port Policy and Management” in: Maritime Policy Management, Vol. 22, No. 2, 1995; pp 125–133
60)
omic and legal analysis of the factors determining the competitiveness of seaports“, Editions De Boeck, 2002
63) van Rotterdam in de containeroverslag”, November 2003, provided by HbR on 8 July 2004
64) IBM Business Consulting: “Concurrentiepositie van de haven van Rotterdam in the
65) Jackson, Mick: “Short Sea Service Performance Indicators – Can we learn any lessons?”, speech at the BEST Conference in Brussels, March 2003
66) Justen, Franz: “Inland Waterways Freight Transport in 1990-2002 in the European Union and candidate countries”, September 2004
67) Kent, Paul E. and Ashar, Asaf: “Port Competition Regulation: A Tool for Monitoring for Anticompetitive Behaviour” in: International Journal of Maritime Economics, Vol. 3, No. 1, 2001; pp 27–51
68) Kent, Paul E. and Hochstein, Anatoly: “Port Reform and Privatization in Conditions of Limited Competition: the Experience in Columbia, Costa Rica and Nicaragua” in: Maritime Policy Management, Vol. 25, No. 4, 1998; pp 313–333
69) Lemper, Burkhard et al: “Die Wettbewerbsentwicklung und Kooperationsmöglichkeiten der deutschen Seehäfen im Verhältnis zu den Seehäfen der anderen Anliegerstaaten im Verkehrsraum Ostsee” December 2002
70) Looyen, Reginald, Buyst, Erik, and Devos, Greta (ed.): “Struggling for Leadership: Antwerp-Rotterdam Port Competition between 1870-2000”, Physica Verlag, 2003
Hoge Raad der Nederlanden 's–Gravenhage, “Ruling in Case 37375”, 7 May 2004
61) Howrey Simon Arnold & White: “THC Terminal Handling Charges, a Bone of Contention”, March 2003
62) Huysbrecht, M., Meersman, H., Van de Voorde, E., Van Hooydonk, E., Verbeke, A. And Winkelmans, E. (ed.): „Port Competitiveness – An econ
IBM Business Consulting: “Concurrentiepositie van de haven
containeroverslag”, 24 November 2003 – Bijlagen", provided by HbR on 15 July 2004
246
Report prepared for the NMa

Charle s
Rive r
Asso c iate s
71) Meersman, H.E., Van de Voorde, E. and Vanelslander, T.: “Port PricingConsiderations on Economic Principles, Competition and Wishful Thinking
Issues: ”, essay
prepared for the second seminar of the IMPRINT–EUROPE Thematic Network “Implementing Reform on Transport Pricing: Identifying Mode–Specific Issues”, May 2002
72) Meyrick and Associates and Tasman Asia Pacific: “Measures to Promote Effective nd Effic nt rt P ces”, prepared Marina and Ports G
the Australian Transport Council, October 1998
sso, nrico: “Ports: Competition & Co eness”, pre e niversity of Antw rp, Acad ic Year 2003–2004
lan e Mededingsaut riteit: „ esluit v de d ecteur g neraal v de erlandse Mede ingsauto teit – Zaak 166 / Vendex – KBB“, October 1998
, Theo E. “Container Shipping and Ports: an Overview” in: Review of Network Economics
OECD: “Ownership and Control of Ships”, Directorate for Science, Technology and mmittee, March 2003
77) OECD: “Regulatory Issues in International Maritime Transport”, Directorate for nsport
port Committee, January
79) Pearson, Richard: “Market Dynamics, the View from the Global Container Terminal Operator”, speech at the European Sea Ports Conference 2004 in Rotterdam, June 2004
80) Pettersen Strandenes, Siri and Marlow, Peter B.: “Port Pricing and Competitiveness in Short Sea Shipping” in: International Journal of Transport Economics, Vol. 27, No. 3, Oct 2000; pp 315–334
81) Piodi, Pedro: “European Sea Port Policy”, in: European Parliament Working paper, Tran 106 EN, April 1999
82) Planco Consulting GMBH: “Bedarfsanalyse für einen Tiefwasserhafen in der Deutschen Bucht” October 2000
a ient Co ainer Po racti for the roup of
73) Mu E mpetitiv sentation at thU e em
74) Neder ds o B an ir e anNed d ri
75) Notteboom, Vol. 3, Issue 2, 2004, pp 86–106
76) Industry – Maritime Transport Co
Science, Technology and Industry – Division of Tra
78) OECD: “Workshop on Maritime Transport”, Maritime Trans2003
247
Report prepared for the NMa
Charle s
Rive r
Asso c iate s
83) PMR: “result of the Market Consultation – Responces from prthe ideas and questions from the Dutch government about a pub
ivate-sector parties to lic-private partnership
in PMR”, April 2000
in de
“Gemeentelijk Havenbedrijf Rotterdam – Case Reebok:
and Economic performance of UK Ports” in: Maritime Policy Management, Vol. 24, No.
lz, Thomas: „Die Kulis der Globalisierung“, in: Der Spiegel,Vol. 24/2004, June 2004, available at http://www.spiegel.de/spiegel/0,1518,302949,00.html
89) Shortlines: “European Sea Ports in a Dynamic Market”, presentation given at the
nk Note No. 193, September 1999
84) Port of Antwerp: “Reglementen en gebruiken van de haven van Antwerpen 2004” De Lloyd, January 2004
85) PriceWaterhouseCoopers: “Concurrentiepositie van de haven van Rotterdamcontaineroverslag”, October 2001, provided by HbR on 6 July 2004
86) PriceWaterhouseCoopers: Analysis of pricing strategies for sites in Europe”, November 2000, provided by HbR on 26 July 2004
87) Saundry, Richard and Turnbull, Peter: “Private Profit, Public Loss: The Financial
4, 1997; pp 319–334
88) Schu
European Sea Ports Conference 2004 in Rotterdam, June 2004
90) Sommer, Dirk: “Private Participation in Port Facilities – Recent Trends”, in: Public Policy for the Private Sector, World Ba
91) TDC Trade.com: www.tdctrade.com
92) Traas, L: “Het system van kostprijsberekening en rentabiliteitsberichtgeving bij
)
95)
001
97) Unknown author: “International benchmarking of the Austrialian waterfront”
Havenbedrijf Rotterdam”, May 2004
93 Trace, Keith: "Privatising Australia's Ports" in: Policy, Autumn 1991, pp 15–18
94) Trace, Keith: “Promoting Efficiency and Contestability in Australia's Ports” in: Agenda, Vol. 4, No. 2, 1997; pp 143–154
TRi Maritime Research Group: “Container Transhipment and Demand for Container Terminal Capacity in Scotland”, December 2003
96) Tull, Malcolm and Reveley, James: “Privatization of Ports: A Malaysian Case Study”, Working Paper No. 182, School of Economic, Murdoch University, January 2
248
Report prepared for the NMa

Charle s
Rive r
Asso c iate s
98) Van de Leur, J. and Swanenvleugel, P. : « Allocatiedocument Havenbedrijf RN.V. Jaargang 2003, July 2003
otterdam
99) Van der Houwen, David: “Meer samen doen met de Duitsers”, in: Mainport News, May 1999
100) Van Kooij, Miriam: “Benchmark Droge Bulk – Concurrentiepositie van Rotterdam in de logistieke keten van sojameel an steam coal”, provided by HbR on 16 July 2004
101) Verhoeff, J.M.: “Seaport Competition: An Analysis of its Nature”, in: International Journal of Transport Economics, Vol. 4, 1977, pp 271–283
102) Verhoeff, J.M.: “Seaport Competition: Some Fundamental and Political Aspects” in: Maritime Policy Management, Vol. 8, No. 1, 1981; pp 49–60
103) Verhoeven, Patrick: “Seaports and the EU Agenda”, presentation given at the European Sea Ports Conference 2004 in Rotterdam, June 2004
104) World Bank: “Port Reform Toolkit”, October 2001
105) World Shipping Council: “European Commission Review of International Liner Shipping Competition and Regulation”, November 2003
249
Report prepared for the NMa

Charle s
Rive r
Asso c iate s
Annex III: Main alternative ports – other studies
Table 116: Most important cargo for ports in the HLH range
Oil and oil
products
Iron ore Coal Agribulk Roll-on/ roll-off
Food Break bulk
Container
Rotterdam X X X X
Amsterdam X X X
Vlissingen X X
Hamburg X X X
Wilhelmshaven X X
Bremerhaven X X
Bremen X X
Zeebrugge X X
Antwerp X X X X
Le Havre X X
Dunkerque X
Source: Based on KPMG: "Analyse Nederlandse Havens in Internationaal Perspectief", p. 7 (study for the Ministerie van Verkeer en Waterstaat).
• Dry bulk ports: Amsterdam, Gent and Duinkerken.
• Wet bulk ports: Wilhelmshaven, Duinkerken and Le Havre.
• Containers: Zeebrugge and Le Havre.306
306 KPMG: "Analyse Nederlandse Havens in Internationaal Perspectief", p. 7 (study for the Ministerie van
Verkeer en Waterstaat).
250
Report prepared for the NMa
Charle s
Rive r
Asso c iate s
Annex IV: Preliminary study of the NMa
The NMa conducted a preliminary study that determined the economic activities of HbR and formulated an analytical framework that guides the definition of the relevant markets. It then
tial market power of HbR.
ts or leases parcels of land.
In order to identify market power it is helpful to determine the position of HbR in the relevant its services. The NMa conducted a preliminary on market
definition.
rcels of land:
e owned by
ent that is specific to the current location.
• Geographical market definition depends on the ultimate destination of the freight.
Relevant findings related to the supply of port infrastructure:
• Ship-owners usually purchase a “package” of port infrastructure services and they ems likely that
these services can be seen as one relevant product. With regard to the geographic
will depend on the type of ships that are used, the type of cargo, and the route.
in these markets.
commissioned CRA to undertake a study to provide the information necessary to define the relevant markets in which HbR operates and to assess poten
In the preliminary study, the NMa identified that HbR is engaged in two main types of economic activities:
1. Distribution of parcels of land – HbR owns the land in the Rotterdam port area and ren
2. The supply of port infrastructure – HbR owns and operates the port infrastructure.
markets in which it offers
Relevant findings related to the distribution of pa
• For certain types of activities it is unlikely that locations other than thosHbR are adequate alternatives.
• Switching of customers to other locations will depend on the amount of investm
• Nautical and port service providers are likely limited to certain (types of) ports.
• Whether shippers could switch to other modes of transport or to other ports depends on the route and the cargo.
have to make use of these services when using the port. It therefore se
market the relevant question is whether ship-owners can switch to another port. This
In this project we provide further information and analysis in order to put the NMa in a position to determine the relevant markets and the position of HbR
251
Report prepared for the NMa
Annex V: Selected dimensions of port capacity
The capacity of maritime ports depends on a number of dimensions, including quayside length, container or bulk cargo storage facilities, and hinterland connections. There are also a
y ships with less than 14m and 10.5m of draught
was 3 million m2 of sheds, 382,800 m2 of sheds for storage of chemicals and 3 million m3 of coldstorage warehouses in 2001.308
dam has a total surface of 10,500 ha, the Port of Antwerp has a total size of 13,455 ha, avre (7,000 ha) and Hamburg (8,700 ha). Total quayside in 130 km in Antwerp, 5.25 km in Le Havre and 46 km in
309
ing their inal
Bremen also invests in increasing its container cargo capacity. Currently a quay
number of physical restrictions that limit the choice of maritime ports for certain customers. Below we list some selected empirical evidence regarding different capacity dimensions.
For example, the competitiveness of the Ports of Bremen and Bremerhaven is restricted by the fact that they can only be accessed brespectively.
With respect to storage facilities, Antwerp has the largest warehousing space of all European ports, 4.8 ha (Rotterdam 1.9 ha, Hamburg 0.9 ha, Amsterdam 0.6 ha, Bremen 0.5 ha).307 Covered storage capacity at the Port of Rotterdam
Antwerp also is the largest European port in terms of total quayside and total surface (which gives an indication of a port’s physical possibilities for expansion). While the Port of Rottermuch larger than the ports of Le HRotterdam is 80 km compared to Hamburg. Given its larger size, the Port of Antwerp might use capacities to compete more vigorously with the Port of Rotterdam.
Due to the increase in container cargo shipments, many ports have invested in increascontainer cargo processing capacity. The Port of Antwerp expects to finish the first termof its new container dock with an area of 80 ha (quay length of 1,250 m) in 2005. When it is fully operational, more than 5.5 million TEU can be handled in the new container dock. In 1995, the Port of Antwerp also started work on a new dock for non-containerised cargo. The total quay length will be 5 km, of which 3.1 km are already available.310
The Port of length of 3,300m provides 13 anchorages. In 2003, another anchorage with a quay length of 340m was added and a new container terminal is planned that will add another 4 anchorages.311
307 Antwerp Port Authority, http://www.portofantwerp.be/html/00_home/main_set_PB.html 308 http://www.portofrotterdam.com/Images/16_51396.pdf?lng=UK
p_port.pdf.
310 http://www.portofantwerp.be/html/02_PORTHANDBOOK/set_PH_05.html 311 http://www.bremen-ports.de/evopage/index.php?id=555&languageid=1
309 RALFH (Rotterdam, Antwerp, Le Havre, Felixstowe, Hamburg) Comparison of Ports, p. 12, available at http://europa.eu.int/comm/taxation_customs/customs/information_notes/c2002/documents/ralfh/ralfh_com
Report prepared for the NMa

Charle s
Rive r
Asso c iate s
253
Report prepared for the NMa

Annex VI: Acronyms and technical terms
Agribulk; Grain, Cattle-fodder and oilseeds.
Anglo-Continental routes; All routes between England and the Continent, comprising Short Sea routes, Western Channel routes and North Sea routes.
Backhaul; To haul a shipment back over part of a route that it has already travelled; return
ssels to lower the centre of gravity and improve stability.
Ballast tanks; Compartments at the bottom of a ship that are filled with liquids for stability
Beam; The width of a ship.
Belgian ports of Ostend and Zeebrugge.
mmercial area.
Berth; A place in which a vessel is moored or secured; place alongside a quay where a ship
Berthage; Charges for the use of a berth.
the terms of contract between a shipper and a transportation company. It serves as a document of title, a contract of carriage, and a receipt
Bogie; A set of wheels built specifically as rear wheels under a sea container.
Bond port; Port of a vessel’s initial customs entry to any country; also known as first port of
Bonded warehouse; A warehouse authorized by customs authorities for storage of goods on
movement of cargo, usually opposite from the direction of its primary cargo destination.
Ballast keel; A heavy keel fitted to sailing ve
and to make the ship seaworthy.
Belgian Straits; The sea crossing between ports in east Kent (for example, Dover, Ramsgate) and the
Belt line; A switching railroad operating within a port or other co
Berth term; Shipped under a rate that does not include the cost of loading or unloading.
loads or discharges cargo.
Bill of lading; A document that establishes
for goods.
call.
which payment of duties is deferred until the goods are removed.
Report prepared for the NMa
Charle s
Rive r
Asso c iate s
Break bulk; Loose, non-containerised cargo stowed directly into a ship’s hold; to unload and distribute a portion or all of the contents of a container.
facility for a specified period and then transfer the facility to a government or other public authority. The concessionaire bears the
Build-own-operate (BOO); A form of project wherein a private party or consortium agrees
rship of the facility. The concessionaire bears the commercial risk of operating the facility.
Bulk vessel; All vessels designed to carry bulk cargo such as grain, fertilizers, ore, and oil.
resist water; a partition separating one part of a ship from another part.
Cargo tonnage; Ocean freight is frequently billed on the basis of weight or measurement
tons are usually expressed as cargo measurement of 40 cubic feet (1.12 cubic meters) or cubic meters (35.3
ous goods that, under the International Maritime Dangerous Goods (IMDG) Code, must not be carried by a multi-purpose vessel.
y sea, inland waterway, rail, road, air, or by a combination of such modes. Also used as a synonym for “vessel” (e.g. bulk carrier).
Broker; A person who arranges for transportation of loads for a percentage of the revenue from the load.
Build-operate-transfer (BOT); A form of concession wherein a private party or consortium agrees to finance, construct, operate, and maintain a
commercial risk of operating the facility.
to finance, construct, operate, and maintain a facility previously owned and/or operated by a public authority. The concessionaire retains owne
Bulkhead; A structure to
Bunkers; Fuel used aboard ships.
Cabotage; Shipments between ports of a single nation, frequently reserved to national flag vessels of that nation.
Carfloat; A barge equipped with tracks on which railroad cars are moved by water.
tons. Weight tons can be expressed in terms of short tons of 2,000 pounds, long tons of 2,240 pounds, or metric tons of 1,000 kilograms (2,204.62 pounds). Measurement
cubic feet).
Cargo-only goods; Hazard
Carrier; Any person or entity who, in a contract of carriage, undertakes to perform or to procure the performance of carriage b
Cartage; Intra-port or local hauling of cargo by drays or trucks; also referred to as drayage.
255
Report prepared for the NMa

Charle s
Rive r
Asso c iate s
Central Corridor; international crossings between the ports of Holyhead and Liverpool in Great Britain and Dublin and Dun Laoghaire in the Republic of Ireland.
Chassis; A frame with wheels and container locking devices to secure the container for movement.
Cleaning in transit; The stopping of articles (such as farm products) for cleaning at a point
Clearance; The size beyond which vessels, cars, or loads cannot pass through, under, or over
e floor of a container to provide additional support or strength to a cargo-restraining device, or a device attached to a wharf to secure mooring lines.
cing specified new fixed investments during the period and for providing specified services associated with the
public sector at expiration of the contract.
ies, this fee is levied to retain upkeep of the approaches to waterways and canals.
Consolidation; Cargo containing shipments of two or more shoppers of suppliers. Container
Container freight station (CFS); A shipping dock where cargo is loaded ("stuffed") into or
Container pool; An agreement between parties that allows the efficient use and supply of
Container terminal; An area designated for the stowage of cargo in containers, usually and marine transportation, where containers are picked up,
dropped off, maintained, and housed.
Classification yard; A railroad yard with many tracks used for assembling freight trains.
between the point of origin and destination.
bridges, tunnels, highways, etc.
Cleat; A device secured on th
Common carrier; A transportation company that provides service to the general public at published rates.
Concession; An arrangement whereby a private party (concessionaire) leases assets from a public authority for an extended period and has responsibility for finan
assets; in return, the concessionaire receives specified revenues from the operation of the assets; the assets revert to the
Conservancy; In some countr
load shipments may be consolidated for one or more consignees.
unloaded ("stripped") from containers. Container reloading to/from sea containers to rail and motor carrier equipment is an activity typically performed in a container freight station.
containers; a common supply of containers available to the shipper as required.
accessible by truck, railroad,
256
Report prepared for the NMa

Charle s
Rive r
Asso c iate s
Container yard; A materials handling/storage facility used for completely unitised loads in containers and/or empty containers.
Container; A truck trailer body that can be detached from the chassis for loading onto a vessel, a rail car, or stacked in a container depot. Containers may be ventilated, insulated,
configurations. Typical containers may be 20 feet, 40 feet, 45 feet, 48 feet, or 53 feet in or 9.5 feet in height.
artial, depending on whether all or only some of its compartments are fitted with container cells.
Contraband; Cargo that is prohibited.
Contract carrier; Any person not a common carrier who, under special and individual
Controlled atmosphere; Sophisticated, computer controlled systems that manage the
ice where duties are paid, documents filed, etc., on foreign shipments.
engaged in entering and clearing goods through customs for a client (importer).
Dead weight tonnage (DWT); The total weight of cargo, loading equipment, bunker
Deconsolidation point; Place where loose or other non-containerised cargo is ungrouped for
Demurrage; The delay of a vessel or detention of a shipment beyond the stipulated time
refrigerated, flat rack, vehicle rack, open top, bulk liquid, dry bulk, or other special
length, 8 feet or 8.5 feet in width, and 8.5 feet
Containership; Ship equipped with cells into which containers can be stacked; containerships may be full or p
contracts or agreements, transports passengers or cargo for compensation.
mixture of gases within a container throughout an intermodal journey, thereby reducing decay.
Crossing; A single journey by ferry, for example Dover-Calais.
Customhouse; A government off
Customs broker; A person or firm, licensed by the customs authority of their country when required,
Cut-off time (Closing Time); The latest time a container may be delivered to a terminal for loading to a scheduled vessel, train, or truck.
Daily running cost; Cost per day of operating a ship.
supplies, water and spare parts which a fully loaded ship can carry.
delivery.
allowed for loading or unloading; the resulting payment to the owner for such delay or detention.
257
Report prepared for the NMa

Charle s
Rive r
Asso c iate s
Dock; For ships, a cargo handling area parallel to the shoreline.
Draft; The depth of a loaded vessel in the water, taken from the level of the waterline, to the lowest point of the hull of the vessel; depth of water, or distance between the bottom of the
ns for ships, and adequate water depth along waterside facilities.
Dry Bulk; Low density cargo, such as agri-food products, fertilizers and ores, scrap, coal and
Eminent domain; The sovereign power to take property for a necessary public use, with
capable of operating at speeds of more than 30 knots.
ty containers in a regional area are transferred to a “mother ship” for a long-haul ocean voyage.
, hovercraft and fast monohulls and catamarans.
. Some fixed costs continue even if no cargo is carried; for example, terminal leases, rent, and property taxes.
nt control. Merchandise, except contraband, may be stored in the zone without being subject to import duty regulations.
Forty-foot equivalent units (FEUs); Unit of measurement equivalent to one fortyfoot
ly referred to in FEUs or TEUs.
ship and the water line. Also referred to as draught.
Dredging; Removal of sediment to deepen access channels, provide turning basi
Driver-accompanied freight vehicle; Typically an articulated lorry and trailer, but also rigid lorries and vans of varying size.
other dry bulk that are transported in bulk carriers.
Dunnage; Material used in stowing cargo either for separation or the prevention of damage
reasonable compensation.
Fast craft; A generic term including hydrofoils, hovercraft, jetfoils, catamarans, monohulls and HSS vessels. All are
Feeder service; Transport service whereby loaded or emp
Ferry; Includes multi-purpose vessels, freight-only vessels, passenger-only vessels
Fixed costs; Costs that do not vary with the level of activity
Force majeure; The title of a common clause in contracts, exempting the parties for non-fulfillment of their obligations as a result of conditions beyond their control, such as earthquakes, floods, or war.
Foreign trade zone; A free port in a country divorced from customs authority but under governme
container. Two twenty-foot containers (TEUs) equal one FEU. Container vessel capacity and port throughput capacity are frequent
258
Report prepared for the NMa
Charle s
Rive r
Asso c iate s
Free trade zone; A zone, often within a port (but not always so located), designated by the government of a country for duty-free entry of any non-prohibited goods. Merchandise may
Freight forwarder; Person or company who arranges for the carriage of goods and
ecessary documentation and arranging Customs clearance.
shipment of bulk cargo whose weight is established on discharge from the ship.
uivalent size. A freight unit is typically expressed as five passenger car units-see PCU.
Freight, demurrage and defence; Class of insurance provided by a protection and
Gantry Crane; A crane or hoisting machine moored on a frame or structure spanning an f a ship.
Gateway; A point at which freight moving from one territory to another is interchanged between transportation lines.
and superstructures in tons
sport equipment, for example containers and trucks
as a result of a navigational error.
Groupage; The grouping together of several compatible consignments into a full container
GRP; Gross Regional Product
be stored, displayed, used for manufacturing, etc., with the zone and re-exported without duties being applied. Also referred to as free port.
associated formalities on behalf of a shipper. The duties of a forwarder include booking space on a ship, providing all the n
Freight payable at destination; Method of paying the freight often used for
Freight unit; A measure of volume. One freight unit equates to a 40-foot trailer, a standard-sized container or a rigid lorry of eq
indemnity club that covers legal costs incurred by a ship owner in connection with claims arising from the operation of his ship.
intervening space, and designed to hoist containers into our out o
GNP; Gross National Product
Gross tonnage (GT); The total volume of ship
Gross weight; Weight of goods, including packaging (such as bottles and crates) and the weight of the tran
Grounding; Deliberate contact by a ship with the bottom while the ship is moored or anchored as a result of the water level dropping or when approaching the coast
load. Also referred to as consolidation.
Hamburg-Le Havre range; Ports located between Hamburg and Le Havre.
259
Report prepared for the NMa

Charle s
Rive r
Asso c iate s
Harbour dues; Port charges to a vessel for each harbour entry, usually on a per gross registered ton basis for commercial vessels.
Harbour master; An officer who attends to berthing ships in a harbour.
Heavy lift charge; A charge made for lifting articles too heavy to be lifted by a ship’s tackle.
Hold; A ship’s interior storage compartment.
t, designed to run at a speed of about 40 knots in normal service.
Incoming; Goods discharged in a port.
y because the volume of cargo offered by that port justifies the cost of routing the vessel.
y that hauls export or import traffic between ports and inland points.
Interlining; An agreement between two or more ferry companies to accept each other's
ith another.
that offers a door-to-door service for freight combining road and rail transport and operates direct rail services through the Channel
odes where the equipment is compatible within the multiple systems.
Joint scheduling; A co-ordinated sailing schedule agreed between two or more ferry operators on one or more routes.
HSS vessel; High Speed Sea-Service vessel. A type of fast craf
In bond; Cargo moving under customs control where duty has not yet been paid.
Inducement; Placing a port on a vessel’s itinerar
Inland carrier; A transportation compan
tickets for travel on their vessels. This allows a passenger to travel outwards with one company and back w
Intermodal rail freight operator; A transport company
Tunnel.
Intermodal; Movement of cargo containers interchangeably between transport m
Irish Sea routes; Sea crossings between ports on the west coast of Great Britain and ports on the east coast of the island of Ireland:
Jetty; Structure projecting out to sea, designed to protect a port from the force of the waves but also used to berth ships.
Jumboising; Conversion of a ship to increase cargo-carrying capacity by dividing and adding a new section.
260
Report prepared for the NMa

Charle s
Rive r
Asso c iate s
Keel; A flat steel plate running along the centre line of a vessel.
Keelage; Dues paid by a ship making use of certain British ports.
, equal to one nautical mile (1,852 meters) per hour.
Landlord Port; An institutional structure whereby the port authority or other relevant public ip of the land, as well as responsibility for maintaining approach
channels and navigation aids; under this model, the port does not engage in any operational
Le Shuttle; The train service operated by Eurotunnel through the Channel Tunnel. There are
ansport of, respectively, passenger vehicles and freight vehicles between the terminals.
pany upgrades and expands an existing facility and manages its cash flows. The public authority holds title to the facility throughout the concession period and receives lease
Lift tank; Standardized portable tank for liquids or gases.
Lighter Aboard Ship (LASH); A specially constructed vessel equipped with an overhead
Lighter; An open or covered barge towed by a tugboat and used primarily in harbours and
Limited recourse financing; Project financing in which sponsors or governments agree to
kiest time in the life of an infrastructure project.
ovement of freight over the tracks of a transportation line from one city to another.
; A gangway between shore and ship suitable for vehicles. A double linkspan takes traffic at two levels simultaneously.
Knot; Measure of speed of a ship
Laden draught; Depth of water to which a ship is immersed when fully loaded.
agency retains ownersh
activities.
two types of service: Le Shuttle-Tourist and Le Shuttle-Freight, each with its own specially designed trains for the tr
Lease-develop-operate (LDO); A form of concession wherein, under a longterm lease, a private com
payments on the assets.
crane for lifting specially designed barges and stowing them into cellular slots on the vessel.
inland waterways to carry cargo to/from alongside a vessel.
provide contingent financial support to give lenders extra comfort; typically provided during the construction and start-up period of a project, which is generally the ris
Line haul; The m
Liner; A vessel sailing between specified ports on a regular basis.
Linkspan
261
Report prepared for the NMa

Charle s
Rive r
Asso c iate s
Liquid bulk; Crude oil, Mineral oil products/petcokes, and other liquid bulk oil fats.
Lloyds’ Registry; An organization maintained for the surveying and classing of ships so that insurance underwriters and others may know the quality and condition of the vessels
Lo-Lo (Lift on/Lift off); A type of vessel that allows cargo to be loaded or unloaded by
Malacca-max; Maximum size ships (containerships and bulkers) which can cross the ax reference is believed to be today the absolute maximum
possible size for container vessels.
Metric tons; 1,000 kilograms.
Mezzanine financing; A mix of financing instruments, including equity, subordinated debt,
cts carried on board one ship.
Mobile crane; General purpose crane capable of being moved from one part of a port to another.
Modal split; Mode of transport (barge- , rail-, and road)
t is able to accommodate passenger and freight traffic simultaneously.
Neo-bulk cargo; Uniformly packaged goods, such as wood pulp bales, paper, wood,
Net weight; Weight of goods (in kilograms), excluding all packaging
arantees or financial support is provided by the sponsors or governments to lenders for the project.
Non-vessel operating common carrier (NVOCC); A cargo consolidator in ocean trades s bills of
involved.
either ship or shore cranes.
Longshoreman; Individual employed locally in a port to load and unload ships.
Malacca Straits. The Malacca-m
completion guarantees, and bridge financing, the balance of which changes as the risk profile of a project changes; i.e., as a project moves beyond construction into operation.
Mixed cargo; Two or more produ
Moor; To attach a ship to the shore by ropes.
Multi-purpose vessel; A ship tha
cellulose, which store as solidly as bulk, but that are handled as general cargo.
Non-recourse financing; Project financing for which no loan gu
who buys space from a carrier and re-sells it to smaller shippers. The NVOCC issue
262
Report prepared for the NMa

Charle s
Rive r
Asso c iate s
lading, publishes tariffs, and otherwise conducts itself as an ocean common carrier, except that it does not provide the actual ocean or intermodal service.
r example, Newcastle. Hull. Felixstowe, Harwich, Sheerness, Ramsgate and Dover) to ports in Holland (Hook of Holland and Rotterdam), Belgium (Ostend and
n and Fleetwood in Great Britain and Larne and Warrenpoint in Northern Ireland.
On-carrier; Person or company who contracts to transport cargo from the port or place of
as truck, train or barge.
rried by a multi-purpose vessel.
exact one not being known when the goods are loaded.
Other general cargo; Sacks and bales 40-70 kg, big bags 180 kg and over, chets and crates,
Other liquid bulk; Chemical base products and oil fats.
Outgoing; Goods loaded in a port.
generally made of wood but occasionally steel or other materials, on which goods can be stacked. There are two principal sizes: the ISO pallet, which measures 1
Panamax; Maximum-size bulk carriers whose dimensions enable the ship to transit the
PCU; Passenger car unit. A standardized measure of volume. One PCU is equivalent to a standard-sized car. The volumes of other types of vehicle are expressed as PCU equivalents.
North Sea routes; Sea crossings on the North Sea and Belgian Straits from ports on the east coast of England (fo
Zeebrugge), Germany (Hamburg) and Denmark (Esbjerg).
Northern Corridor; domestic crossings between the ports of Ardrossa
discharge of a sea-going or ocean-going ship to another destination by a different means of transport, such
On-deck-only goods; Hazardous goods that, under the IMDG Code. must be stowed on open deck if they are ca
Optional cargo; Cargo that is destined for one of the ship’s discharge ports, the
Other dry bulk; Sand, gravel, clay, sulphur, cement, fertilizers and other raw materials
pallets and neo bulk
Overcarriage; The carriage of cargo beyond the port for which it was intended.
Pallet; A flat tray,
x 1.2 meters and the europallet at 0.8 x 1.2 meters.
Panama Canal when lock width is the limiting factor.
Passenger vehicles; Cars, coaches, caravans, campervans, whether used for tourism or business travel.
263
Report prepared for the NMa
Charle s
Rive r
Asso c iate s
Permanent dunnage; Strips of timber fixed to the frames of a ship to keep cargo away from the sides of the ship in order to avoid damage and condensation.
Pier; The structure perpendicular to the shoreline to which a vessel is secured for the purpose of loading and unloading cargo.
Piggy packer; A mobile container-handling crane used to load/unload containers to/from
Pilferage; Petty theft.
fee is normally based on the ship’s registered tonnage.
Platform flat; A shipping container without sides, ends or a roof. Normally 20 x 40 feet
Pontoon; Flat-bottomed vessel with a shallow draught
Pooling; Sharing of cargo or the profit or loss from freight by member lines of a liner
o “harbour dues”).
Port of registry; Place where a ship is registered with the authorities, thereby establishing its nationality.
id by a ferry operator to a point for access to the infrastructure. The charge is calculated on the basis of the actual volume of
eight vehicles) which passes through the port in question.
railcars.
Pilotage dues; Fee payable by the owner or operator of a ship for the services of a pilot; the
Pilotage; The act of assisting the master of a ship in navigation when entering or leaving a port or in confined water.
long, it is used for awkwardly shaped cargo that cannot fit on or in any other type of container.
Plimsoll mark/load lines; A series of horizontal lines painted on the outside of a ship marking the level that must remain above the surface of the water for the vessel’s stability.
conference.
Port dues; Charges levied against a ship owner or ship operator by a port authority for the use of a port (see als
Port of refuge; Port, not on a ship’s itinerary, which she calls at due to some unforeseen hazard at sea and where she may undergo repairs, refuel or rescue cargo.
Port transit charge; The variable cost element of the dues pa
traffic (passengers and passenger and fr
264
Report prepared for the NMa

Charle s
Rive r
Asso c iate s
Portable unloader; Type of ship unloader that is wheeled and capable of being moved around a port wherever needed. It is typically used in ports where there is no dedicated terminal with its own fixed equipment.
Project financing; Financing wherein the lender looks to a project’s cash flows to repay the
e it requires structuring the debt and equity such that a project’s cash flows are adequate to service the debt.
Ro/Ro; A shortening of the term “Roll on/Roll off”. A method of ocean cargo service using a
Sailing; A single ferry departure.
nd supplies for ships.
hip’s tackle; All rigging, etc., used on a ship to load or unload cargo.
Sea routes; The shortest distance links between ports in Kent (Dover, Folkestone and Ramsgate) and East Sussex (Newhaven) and ports on the north-east coast of
Channel Tunnel (Folkestone to Frethun/Coquelles).
Short Sea routes; The totality of routes on the Short French Sea and the Belgian Straits.
Side loader; A lift truck fitted with lifting attachments operating to one side for handling ontainers.
Southern Corridor; international crossings between the ports of Fishguard and Swansea in Great Britain and Rosslare and Cork in the Republic of Ireland.
Spotting; Placing a container where required to be loaded or unloaded.
Spreader; A piece of equipment designed to lift containers by their corner castings.
Pre-entry; Presentation to the customs authorities of export or import declarations prior to the clearance of goods.
principal and interest on debt, and to a project’s assets for security; also known as "structured financing" becaus
Reefer; Refrigerated container.
Relay; To transfer containers from one sea-going vessel to another.
RMPM; Rotterdam Municipal Port Management
vessel with ramps that allow wheeled vehicles to be loaded and discharged without cranes.
Ship chandler; An individual or company selling equipment a
S
Short French
France (Calais, Boulogne, Dieppe and Dunkirk). Also includes the
c
265
Report prepared for the NMa

Charle s
Rive r
Asso c iate s
Stack car; An articulated multiple platform rail car that allows contaistacked.
ners to be double
tacktrain; A rail service whereby rail cars carry containers stacked two high on specially operated unit trains.
Stevedore; Individual or firm that employs longshoremen to load and unload vessels.
Stevedoring charges; Fees for loading and stowing or unloading a ship.
Sto-ro; A vessel with capacity for break-bulk cargo as well as vehicles or trailer borne cargo.
Stowage factor; The average cubic space occupied by one tonne weight of cargo as stowed aboard a ship.
Straddle carrier; Mobile truck equipment with the capacity for lifting a container within its own framework.
Sturdons; Port workers engaged in the stowage of cargo in the holds of a ship.
Supply chain; A logistics management system that integrates the sequence of activities from delivery of raw materials to the manufacturer through to delivery of the finished product to the customer into measurable components.
Tare weight; The weight of wrapping or packing; added to the net weight of cargo to determine its gross weight.
Terminal charge; A charge made for a service performed in a carrier’s terminal area.
Terminal; An assigned area in which containers are prepared for loading into a vessel, train, truck, or airplane, or are stacked immediately after discharge from the vessel, train, truck, or airplane. Terminals can also be operated for other cargo types, e.g. dry bulk terminals, liquid bulk terminals etc.
Throughput charge; The charge for moving a container through a container yard off or onto a ship.
Throughput; Incoming and outgoing goods in a port.
Top off; To fill a ship that is already partly loaded with cargo. Typically occurs where there is a draught restriction at the first load port – the ship loads a quantity of cargo corresponding to the permissive draught, then fills up at the second port where there is no restriction.
S
266
Report prepared for the NMa
267
Charle s
Rive r
Asso c iate s
Report prepared for the NMa
Top stow cargo; Goods that are stowed on top of all others in a ship’s hold because of their relatively low density and the probability that they would be damaged if overstowed.
Toplift; Attachment to a fork-lift truck that is designed to lift a shipping container.
Towage; Charges for the services of tugs assisting a ship or other vessels in ports.
Tramp line; An ocean carrier company operating vessels on other than regular routes and schedules.
Transhipment port; A port where cargo is transferred from one carrier to another or from one vessel of a carrier to another vessel of the same carrier without the cargo leaving the port.
Transhipment; A distribution method whereby containers are moved between large mother ships and small feeder vessels, or between equally large ships plying north-south (Europe-Africa) and east-west (Asia-Europe) routes. Transhipment can also mean the transfer of cargo from one vessel to another, e.g. from sea-going bulk vessels to inland barges or vice versa.
Turnaround; The time it takes between the arrival of a vessel and its departure from port; frequently used as a measure of port efficiency.
Twenty-foot equivalent units (TEUs); Container size standard of twenty feet. Two twenty-foot containers (TEUs) equal one FEU. Container vessel capacity and port throughput capacity are frequently referred to in FEUs or TEUs.
Unaccompanied freight; Freight carried on unaccompanied trailers.
Unaccompanied trailer; The trailer of an articulated lorry without the tractor unit.
Unitisation; The consolidation of a quantity of individual items into one large shipping unit for easier handling.
Unitized freight; Freight stored in one of a variety of standardized modes for the purpose of transportation. The principal modes are driver-accompanied vehicles, unaccompanied trailers, containers, flats and lift tanks.
Unloader; Port apparatus employed to unload ships carrying dry bulk cargo.
Unmoor; To remove the ropes that attach a ship to the shore.
Unstuff; To unload a shipping container.

268
Charle s
Rive r
Asso c iate s
Report prepared for the NMa
Variable cost; Costs that vary directly with the level of activity within a short time. Examples include costs of moving cargo inland on trains or trucks, stevedoring in some ports, and short-term equipment leases.
Vessel manifest; Declarations made by international ocean carriers relating to the ship’s crew and contents at both the port of departure and arrival. All Bills of Lading are registered on the manifest.
Warehouse; A place for the reception, delivery, consolidation, distribution, and storage of goods and cargo.
Waybill; Document, issued by a shipping line to a shipper, which serves as a receipt for the goods and evidence of the contract of carriage.
Western Channel routes; Sea crossings between ports on the south coast of England (for example, Portsmouth, Southampton, Poole, Plymouth) and ports on the north coast of France (for example, Le Havre, Cherbourg, St Malo, Roscoff). Also includes crossings from the above-mentioned English ports to ports in northern Spain (Bilbao and Santander),
Wharf; Structure built alongside the water or perpendicular to the shore where ships berth for loading or discharging goods.
Wharfage; Charge assessed by a pier or dock owner against freight handled over the pier or dock or against a steamship company using the pier or dock.
Main sources:
1. Dictionary of Shipping Terms, Third Edition, Peter Brodie (1997)
2. The Main Encyclopedic Dictionary, Fifth Edition, Eric Sullivan (1996)

Report prepared for the NMa
Annex VII: Tenant and user questionnaire

P_600019/151.O428
Questionnaire for tenants of the Port of Rotterdam
Preliminary remarks
The Netherlands Competition Authority (NMa) is conducting an important study to which your contribution
would be extremely valuable (De Nederlandse Mededingingsautoriteit (NMa) verricht een onderzoek waaraan uw bijdrage buitengewoon waardevol zou zijn). The NMa is analysing the market position of the Port of
Rotterdam (Havenbedrijf Rotterdam), in particular concerning the supply of port infrastructure to port users
(terbeschikkingstelling van haveninfrastructuur) and the renting out of land on the port territory to tenants (de verhuur en uitgifte in erfpacht van bedrijfsterreinen en -panden in het havengebied). The background to this
study is the recent corporatisation (verzelfstandiging) of the port authority. The NMa would like to collect
information from port users (havengebruikers) through the attached survey and has commissioned
(ingeschakeld) Charles River Associates to support it during this project. HbR is well aware of the study and has
agreed to fully co-operate with the NMa and CRA.
Thank you for taking your time to fill out the questionnaire. If possible, the questionnaire should be completed
at the level of management (or by the person who is responsible for decisions regarding the location of your
company). You may not have the necessary information to answer all questions, but we would be grateful if you
could fill in those questions for which you have information. Please note that all information that you provide
will be used only for this study. Only statistical summaries of the information provided by tenants will be used in
the report and the response of any specific tenant will not be identifiable. (Ik wijs er met klem op dat de informatie die u verstrekt, alleen gebruikt wordt voor deze studie en in de rapportage niet herleidbaar zal zijn tot individuele bedrijven. In de rapportage zullen alleen statistische overzichten worden opgenomen.)
The questionnaire is drafted in English – and if deemed necessary – a Dutch translation is added. You are free
to answer the open questions in either Dutch or English. If you have questions about this form or need help in
completing it, please contact the project manager at CRA, Rainer Nitsche, or Julia Thielert at
[email protected] or Tel. +32 2 627 1400.
Please return the completed form in the enclosed envelope (no postage needed) until 15 September 2004.
You may also fax the completed questionnaire to the NMa at +31 70 330 33 70. Should you prefer to receive an
electronic version of this document, please send an email to [email protected].
Information about the responding entity (only in case we need to contact you to clarify your response)
Name of company: _______________________________________________________________________
Name and job title of the person responding:
Contact phone number:
Contact email address:

2
DEFINITIONS
lease contract : huurcontract of erfpachtcontract
lease price : huurprijs of erfpachtcanon (de termen terreinconcessie en kadegeld worden in de praktijk ook gebruikt)
harbour dues : zeehavengeld
Rotterdam port authority : Havenbedrijf Rotterdam (HbR)
tenants : huurders of erfpachters van bedrijfsterreinen en/of –panden van HbR
QUANTITATIVE SURVEY
Please specify which type of company you represent.
Type of company:
Forwarding and shipping company
Please specify, e.g. freight forwarding shipping companies, shipbrokers, liner agents, inland shipping, shortsea/feeder
shipping:
Cargo handling
Please specify, e.g. stevedores, terminals, warehousing, distribution, container depots, cargo superintendents, cargo
classification, cargo surveyors:
Transport company
Please specify transport mode:
Supplies-associated industries
Please specify, e.g. general industry, containers (sale, rental, lease & repair), bunkering, towage and salvage,
equipment/materials/shipstores, shipbuilding & repair, other service providers:
Finance and consultancy
Please specify the service you provide:
Other
Please specify:
If you deal with cargo, please specify type of cargo:
Please specify which cargo type your company focuses on. Please select only one of the following cargo types! If you deal with more than one cargo type or group of cargo types (i.e. liquid bulk, dry bulk, containers, roll-on/roll-off or other general cargo), we would highly appreciate if you could copy this questionnaire and fill in one form per cargo type for the most important types of cargo. Thank you in advance.

3
Crude oil Mineral oil products Other liquid bulk (please specify): Iron ore & scrap Coal Agribulk
Other dry bulk (please specify): Containers Roll-on/roll-off Other general cargo (please specify):
CHOICE OF LOCATION
If you deal with cargo: please answer the following questions for the cargo type for which you fill out this form.
1. The following table lists other ports in the Hamburg-Le Havre range and non-port locations (e.g. in the hinterland) that could represent an alternative for the port of Rotterdam with regard to the location of your company. Please indicate which of the following locations you would consider as possible substitutes for the port of Rotterdam for your company, even if they may not be the best alternative (Geeft u a.u.b. aan welke locaties u beschouwt als mogelijke substituten voor de Rotterdamse haven voor uw bedrijf, zelfs als ze misschien niet het beste alternatief zijn). For each location that you would consider as a possible alternative, please assess the quality as a substitute for Rotterdam (Beoordeelt u de mate waarin de betreffende haven een goed of slecht alternatief is voor Rotterdam) by circling a number between “–2” and “2”. A circle around “-2” means that the location is a “very poor” (“erg slecht”) substitute for Rotterdam, a circle around “2” means that it is a “very good” substitute.
Possible substitute? Quality as substitute for Rotterdam
Yes No Very poor Very good
Other ports
France
Le Havre -2 -1 0 1 2
Dunkerque -2 -1 0 1 2
Belgium
Gent -2 -1 0 1 2
Zeebrugge -2 -1 0 1 2
Antwerp -2 -1 0 1 2
The Netherlands
Vlissingen -2 -1 0 1 2
Amsterdam -2 -1 0 1 2
Germany
Wilhelmshaven -2 -1 0 1 2
Bremen/Bremerhaven -2 -1 0 1 2
Hamburg -2 -1 0 1 2
UK
Felixstowe -2 -1 0 1 2
Other (please specify):
-2 -1 0 1 2

4
Locations outside ports (locaties buiten de havens) (please specify)
Very poor Very good
-2 -1 0 1 2
-2 -1 0 1 2
-2 -1 0 1 2
-2 -1 0 1 2
2. We would like to learn more about how you think the quality of the port of Rotterdam compares with the quality of the location that you would consider as the next best alternative location for your company today (e.g. one of the ports or non-port locations mentioned in the previous question). In the table below, please assess the relative quality of the port of Rotterdam (beoordeelt u de kwaliteit van de Rotterdamse haven vergeleken met de beste alternatieve locatie voor uw bedrijf) by circling a number between “–2” and “2”. A circle around “-2” means that quality in the port of Rotterdam with regard to this specific factor is “very poor” (“erg slecht”) compared to the next best alternative location for your company, a circle around “2” means that quality in Rotterdam is “very good” compared to quality at the next best alternative location for your company.
Quality in Rotterdam compared to the next best alternative
location for your company
Very poor Very good
a. Lease conditions (e.g. price) (huur- of erfpachtvoorwaarden, bv. prijs)
-2 -1 0 1 2
b. Provision of suitable infrastructure (leveren van geschikte infrastructuur)
-2 -1 0 1 2
c. Sea access -2 -1 0 1 2
d. Proximity to your customers (afstand tot uw klanten) -2 -1 0 1 2
e. Synergies with other companies located in the port (synergie met andere bedrijven in de haven)
-2 -1 0 1 2
f. Quality of labour (kwaliteit van arbeidskrachten) -2 -1 0 1 2
g. Other factor(s) (please specify):
-2 -1 0 1 2
3. Please consider the situation of your company today. Do you feel that your company is “locked in” in the port of Rotterdam, i.e. do you think that it could not easily relocate even after termination of the lease contract? (Is uw bedrijf ‘opgesloten’ in de Rotterdamse haven, d.w.z. kan uw bedrijf niet eenvoudig verhuizen naar een andere locatie zelfs na beëindiging van het huur-/erfpachtscontract?)
Yes No
If yes, why do you feel that your company is locked in? (Zo ja, waarom is uw bedrijf ‘opgesloten’?) Please look at the following reasons that others have mentioned, add any reasons that are important in your case and then indicate the relative importance of each of the reasons by distributing a total of 100 points to them.

5
(Geeft u a.u.b. een indicatie van het belang van elke reden door per reden een aantal punten te geven, waarbij het totaal aantal punten op 100 uitkomt). Please check that the points add to exactly 100.
Reason Points
a. Specific investments made in facilities at or near the port.
b. Long-term contracts with port-bound (havengebonden) customers, e.g. ship owners.
c. Long-term contracts with other port tenants, e.g. terminal operators or storage companies.
d. No other location offers the infrastructure necessary for our business.
e. Other reason(s) (please specify):
Sum of points: 100
4. Suppose that the port of Rotterdam were to increase its lease prices for existing contracts permanently by 10% while the lease prices for all other locations stayed at their current levels. Do you think that your company would re-locate if the lease contract could be terminated easily and without penalty payments? (Veronderstel dat de kosten voor het gebruik van de grond (huurprijs/erfpachtscanon/terreinconcessie/kadegeld) in de Rotterdamse haven permanent met 10% worden verhoogd, terwijl de kosten voor grondgebruik op andere locaties op hetzelfde niveau blijven. Denkt u dat uw bedrijf dan naar een andere locatie zou verhuizen, indien het huur-/erfpachtscontract gemakkelijk en zonder boetes e.d. kon worden beëindigd?)
Yes No
INFORMATION ABOUT YOUR LEASE RELATIONSHIP WITH THE PORT
If you deal with cargo: please answer the following question for the cargo type for which you fill out this form.
5. Please provide information about the lease relationship of your company with the port authority of Rotterdam in 2003 (if you have several lease contracts, please provide the information on an extra sheet and attach it to the questionnaire). If you do not have exact information, please provide an estimate.
a. What was the total area leased (huur/erfpacht) by you in the port of
Rotterdam in 2003? m2
b. Please specify the total area you had options/reservations for in 2003. m2
c. In which year was your lease contract originally concluded?
d. In which year does your current lease contract end?
6. If applicable, please indicate the total volume of cargo volume shipped through Rotterdam in 2003 that your company was involved in (e.g. through shipping, (un-) loading, storing etc.):
___________ (tons) (TEUs)
Not applicable (please move to question 9)

6
7. What proportion of this volume would you consider as “captive volume”, i.e. volume that could not be switched to other ports within a year even if e.g. harbour dues (zeehavengeld) in Rotterdam were increased permanently by 10%? (Welk deel van het totale volume dat u bij de vorige vraag heeft vermeld, beschouwt u als ‘captive volume’, d.w.z. volume dat u niet naar andere havens kunt/zult verplaatsen binnen een jaar zelfs indien bv. het zeehavengeld in Rotterdam permanent met 10% zou worden verhoogd?)
% I do not think there is any “captive” volume
If you think that there is “captive” volume, why do you consider it as “captive”? Please look at the following reasons that others have mentioned, add any reasons that you consider as important and then indicate the relative importance of each of the reasons by distributing a total of 100 points to them (geeft u a.u.b. een indicatie van het belang van elke reden door per reden een aantal punten te geven, waarbij het totaal aantal punten op 100 uitkomt). Please check that the points add to exactly 100.
Reason Points
a. Specific investments made in facilities at or near the port (e.g. by cargo owners or shipping lines).
b. Long-term contracts with service providers, like terminal operators or storage companies, in the port.
c. Generalised route costs (i.e. total transport chain costs per ton or TEU) for the cargo volume are significantly lower (aanzienlijk lager) for the port of Rotterdam than for alternative ports.
d. Other reason(s) (please specify):
Sum of points: 100
8. For transport, cargo handling, and forwarding & shipping companies: What is your company’s capacity for cargo handling/shipping in the port of Rotterdam per year?
___________ (tons) (TEUs)
LEASE PRICES
If you deal with cargo: please answer this question for the cargo type for which you fill out this form.
9. In the lease contract that your company signed with the port authority of Rotterdam, did your company negotiate a discount on the official lease prices published by the port, or did the port authority offer additional costless services to your company? (Heeft uw bedrijf een korting op de officiële huurprijs/erfpachtscanon uitonderhandeld of heeft het Havenbedrijf gratis extra diensten aan uw bedrijf aangeboden?)
No, my company did not receive any discount on the official lease price (geen korting gekregen).
Yes, my company received a discount on the official lease price (korting gekregen).
Amount (hoogte van de korting): %
No, my company did not receive any costless services from the port (geen gratis extra diensten).
Yes, my company received costless services from the port (gratis extra diensten).
I do not know.
10. If the port authority offered additional costless services to your company (instead of or in addition to a discount on the official lease price), what did those services include? (Wat waren de eventuele gratis extra diensten?)

7
11. If you have knowledge about lease prices at other locations, are lease prices in the port of Rotterdam higher than they would be at the location you consider to be the next best alternative for your company today? (Is de huurprijs/erfpachtcanon in de Rotterdamse haven hoger dan op de locatie die u als het beste alternatief voor uw bedrijf beschouwt?)
Yes No I do not have any knowledge about lease prices at other locations.
12. If your answer to the previous question was yes, what do you believe are the reasons for this price differential (Indien uw antwoord op de vorige vraag ‘Yes’ was: wat denkt u dat de redenen zijn voor deze prijsverschillen)? Please consider the following arguments that others have mentioned and, if applicable, add any arguments that are important in your case.
Reason Yes No
a. Better infrastructure at Rotterdam?
b. Better services at Rotterdam (incl. labour supply)? (Betere diensten in Rotterdam, incl. aanbod van arbeid?)
c. Better sea access in Rotterdam?
d. Better hinterland connections (achterlandverbindingen?
e. Better synergies with other companies in Rotterdam (clusters)?
f. Other reason(s) (please specify):
13. Are you aware of any examples of landlords attempting to lure companies of your type away from their current location to other locations? (Zijn er voorbeelden van grondaanbieders die proberen bedrijven weg te lokken van hun huidige locatie naar een andere locatie?)
Yes No
If yes, please specify:
IMPACT OF CAPACITY EXPANSION
If you deal with cargo: please answer this question for the cargo type for which you fill out this form.
14. Has your company ever expressed an interest in leasing more land in the port of Rotterdam and was rejected by the port authority? (Heeft uw bedrijf ooit interesse getoond om meer grond te huren/pachten in de Rotterdamse haven en is (het verzoek van) uw bedrijf afgewezen?) (If no, please move to question 17.)
Yes No I do not know
15. If yes, what was the reason for the rejection? (Zo ja, wat was de reden voor de afwijzing?)
8
a. There was no suitable land available (geen geschikte grond beschikbaar).
b. There was suitable land available, but it was given to another applicant. (Geschikte grond was al aan een andere kandidaat gegeven.)
c. Other (please specify):
16. There are plans to expand (uitbreiden) the capacity of the port of Rotterdam through the development (ontwikkeling) of Maasvlakte II. Do you think this envisaged expansion (beoogde uitbreiding) will lead to any of the changes listed in the table below?
Do you think the development of Maasvlakte II will lead to… Yes No
a. Lower lease prices in Rotterdam?
b. Higher investments in infrastructure in Rotterdam by HbR?
c. Higher investments in infrastructure in Rotterdam by third parties?
d. Other changes (please specify):
Please explain your reasoning:
17. Do you have any knowledge about plans for capacity expansions at other ports in the Hamburg-Le Havre range? If yes, please specify. (Bent u op de hoogte van plannen voor capaciteitsuitbreiding van andere havens in het Hamburg-Le Havre gebied?)
PERFORMANCE AND COMPETITIVENESS
If you deal with cargo: please answer this question for the cargo type for which you fill out this form.
18. Please consider the following table. Indicate which changes, compared to the situation today, you would expect as a result of the corporatisation of the Rotterdam port authority and which changes you would expect if – hypothetically – the port authority was to be fully privatised (i.e. full private ownership). (Welke veranderingen, vergeleken met de huidige situatie, verwacht u als resultaat van de verzelfstandiging van het Rotterdamse havenbedrijf en welke veranderingen verwacht u indien – hypothetisch – het Havenbedrijf volledig zou worden geprivatiseerd (d.w.z. indien de eigendom volledig in privéhanden zou komen).
Corporatisation of the port authority Full privatization of the port authority
Do you expect an effect on…
No
Yes, I expect an increase
Yes, I expect a reduction No
Yes, I expect an increase
Yes, I expect a reduction
a. Pricing of land?
b. Pricing of harbour dues
9
(havengeld)?
c. Investment?
d. Service quality?

10
19. Have you ever had any negative experience with the port authority or one of its daughter companies (e.g. terminal operators) that you would consider as “anti-competitive”, i.e. not normal competitive practice and possibly an attempt of HbR to abuse potential market power? Please explain. (Heeft u negatieve ervaringen met het Havenbedrijf of een van haar dochterbedrijven (bv. terminal operators) die u als concurrentiebeperkend zou beschouwen, d.w.z. die in het normale commerciële verkeer niet gangbaar zijn en misschien een poging van HbR zijn om potentiële marktmacht te misbruiken? Gelieve uw antwoord toe te lilchten.)
Qualitative survey
If you deal with cargo: please answer this question for the cargo type for which you fill out this form.
It would be very helpful for our study if you could provide information on the following questions. If you need
more space than is provided here, we would appreciate if you would answer the questions on an extra sheet
and attach it to the questionnaire (if you do so, please indicate the question to which your response relates).
20. Please describe the nature of specific investments in port infrastructure and suprastructure that you have made. Describe the contractual relationships with the port (length of time etc.). Would you be able to move the facilities to another port? (Beschrijft u a.u.b. de aard van specifieke investeringen die u hebt gemaakt in haveninfrastructuur en gebouwen en machines. Omschrijft u a.u.b. de contractuele relaties met het Havenbedrijf (tijdsduur etc.). Is het mogelijk de faciliteiten te verplaatsen naar een andere haven?)
21. What do you see as the main strengths and weaknesses of the port of Rotterdam as a landlord? (Wat beschouwt u als de belangrijkste sterke en zwakke punten van de Rotterdamse haven als verhuurder/erfverpachter?)

11
22. Are there any concerns regarding the competitiveness between ports or between service providers within ports that you wish to bring to our attention? (Heeft u zorgen over de mate van concurrentie tussen havens of tussen dienstenaanbieders in havens, die u onder onze aandacht wilt brengen?)
23. Suppose you would start your company tomorrow. In which port would you locate your company?
a. Which port-characteristics are essential for this choice?
b. Do other ports constitute real alternatives for the port of first choice? If they do: which ports are these? If they do not: why are other ports not suitable?
P_600019/150.O428
Questionnaire for users of the Port of Rotterdam
Preliminary remarks
The Netherlands Competition Authority (NMa) is conducting an important study to which your contribution
would be extremely valuable (De Nederlandse Mededingingsautoriteit (NMa) verricht een onderzoek waaraan uw bijdrage buitengewoon waardevol zou zijn). The NMa is analysing the market position of the Port of
Rotterdam (Havenbedrijf Rotterdam - HbR), in particular concerning the supply of port infrastructure
(terbeschikkingstelling van haveninfrastructuur) and the renting out of land on the port territory (de verhuur en uitgifte in erfpacht van bedrijfsterreinen en -panden in het havengebied). The background to this study is the
recent corporatisation (verzelfstandiging) of the port authority. The NMa would like to collect information from
port users (havengebruikers) through the attached survey and has commissioned (ingeschakeld) Charles River
Associates (CRA) to support it during this project. HbR is well aware of the study and has agreed to fully co-
operate with the NMa and CRA.
Thank you for taking your time to fill out the questionnaire. If possible, the questionnaire should be completed
at the level of management (or by the person who is responsible for decisions regarding the routing of cargo
flows). You may not have the necessary information to answer all questions, but we would be grateful if you
could fill in those questions for which you have information. Please note that all information that you provide
will be used only for this study. Only statistical summaries of the information provided by tenants will be used in
the report and the response of any specific tenant will not be identifiable. (Ik wijs er met klem op dat de informatie die u verstrekt, alleen gebruikt wordt voor deze studie en in de rapportage niet herleidbaar zal zijn tot individuele bedrijven. In de rapportage zullen alleen statistische overzichten worden opgenomen.)
The questionnaire is drafted in English – and if deemed necessary – a Dutch translation is added. You are free
to answer the open questions in either Dutch or English. If you have questions about this form or need help in
completing it, please contact the project manager at CRA, Rainer Nitsche, or Julia Thielert at
[email protected] or Tel. +32 2 627 1400.
Please return the completed form in the enclosed envelope (no postage needed) until 15 September 2004.
You may also fax the completed questionnaire to the NMa at + 31 70 330 33 70. Should you prefer to receive
an electronic version of this document, please send an email to [email protected].
Information about the responding entity (only in case we need to contact you to clarify your response)
Name of company: _______________________________________________________________________
Name and job title of the person responding:
Contact phone number:
Contact email address:

2
DEFINITIONS
harbour dues : zeehavengeld
hinterland : achterland
Rotterdam port authority : Havenbedrijf Rotterdam (HbR)
QUANTITATIVE SURVEY
Please specify which type of company you represent.
Type of company:
Forwarding and shipping company
Please specify, e.g. freight forwarding, shipping companies, shipbrokers, liner agents, inland shipping,
shortsea/feeder shipping:
Cargo handling
Please specify, e.g. stevedores, terminals, warehousing, distribution, container depots, cargo superintendents, cargo
classification, cargo surveyors:
Transport company
Please specify transport mode:
Supplies-associated industries
Please specify, e.g. general industry, containers (sale, rental, lease & repair), bunkering, towage and salvage,
equipment/materials/shipstores, shipbuilding & repair, other service providers:
Other
Please specify:
Type of cargo:
Please specify which cargo type your company ships or handles. Please select only one of the following cargo types!
If you deal with more than one cargo type or group of cargo types (i.e. liquid bulk, dry bulk, containers, roll-on/roll-
off or other general cargo), we would highly appreciate if you could copy this questionnaire and fill in one form per
cargo type for the most important types of cargo. Thank you in advance.
Crude oil Mineral oil products Other liquid bulk (please specify): Iron ore & scrap Coal Agribulk
Other dry bulk (please specify): Containers Roll-on/roll-off Other general cargo (please specify):
CHOICE OF PORT
1. Are you or your company responsible for deciding about the routing of cargo, i.e. do you make the actual decision which port to use for a specific shipment? Yes No

3
Even if your answer to this question is no, we will sometimes ask you in this questionnaire to assume that you have the power to decide about the routing of cargo flows. This will allow us to benefit from your industry expertise (e.g. regarding the quality at certain ports), even if in reality you may not be able to influence which port is used. (Indien uw antwoord op de vorige vraag ‘No’ was, gelieve dan bij het invullen van de vragen te doen alsof u wel de beslissingen neemt over de routering van cargo. Dit stelt ons in staat om een beroep te doen op uw kennis en expertise (bijvoorbeeld inzake de kwaliteit van bepaalde havens), ook als u in de praktijk uw havenkeuze vast staat).
2. Please indicate the total volume of shipments through Rotterdam in 2003 that your company was involved in (as shipowner, shipping agency, cargo owner etc.) (only the cargo type for which you fill out this form):
___________ (tons) (TEUs)
For containers: Please specify which share of this volume is transshipment volume: %
3. What proportion of the total volume that you specified in the previous question would you consider as “captive volume”, i.e. volume that could/would not be switched to other ports within a year even if e.g. harbour dues (zeehavengeld) in Rotterdam were increased permanently by 10% while harbour dues in all other ports stayed at their current levels? (Welk deel van het totale volume dat u bij de vorige vraag heeft vermeld, beschouwt u als ‘captive volume’, d.w.z. volume dat u niet naar andere havens kunt/zult verplaatsen binnen een jaar zelfs indien bv. het zeehavengeld in Rotterdam permanent met 10% zou worden verhoogd terwijl het zeehavengeld in andere havens op hetzelfde niveau blijft?)
% I do not think there is any “captive” volume
4. If you think that there is “captive” volume (only the cargo type for which you fill out this form), why do you consider it as “captive”? Please look at the following reasons that others have mentioned, add any reasons that you consider as important and then indicate the relative importance of each of the reasons by distributing a total of 100 points to them (geeft u a.u.b. een indicatie van het belang van elke reden door per reden een aantal punten te geven, waarbij het totaal aantal punten op 100 uitkomt). Please check that the points add to exactly 100.
Reason Points
a. Specific investments made in facilities at or near the port (e.g. by cargo owners or shipping lines).
b. Long-term contracts with service providers, like terminal operators or storage companies, in the port.
c. Generalised route costs (i.e. total transport chain costs per ton or TEU) for the cargo volume are significantly lower (aanzienlijk lager) for the port of Rotterdam than for alternative ports.
d. Other reason(s) (please specify):
Sum of points: 100
5. Through which of the following ports did you ship cargo in 2003 (only the cargo type for which you fill out this form)? For each of the ports, please indicate the share of your total shipments going through this port in 2003 (gelieve voor elke haven te vermelden hoeveel procent van uw totale ‘shipments’ in 2003 via die haven liep).
Did you ship cargo through this port?
Yes No Share of volume shipped through this port
France Le Havre %
Dunkerque %
Belgium
Gent %
Zeebrugge %
Antwerp %

4
The Netherlands
Vlissingen %
Rotterdam %
Amsterdam %
Germany
Wilhelmshaven %
Bremen/Bremerhaven %
Hamburg %
UK
Felixstowe %
Other (please specify):
%
Total ∑100%
6. Let us assume you can decide on the routing of cargo flows, even if you cannot in reality (we nemen aan dat u kan beslissen over de routering van de cargo flows, zelfs indien u dat in werkelijkheid niet kunt). Please indicate which of the following ports you would consider as possible substitutes for the port of Rotterdam for the cargo type for which you fill out this form, even if they may not be the best alternative (geeft u a.u.b. aan welke havens u beschouwt als mogelijke substituten voor de Rotterdamse haven voor uw type cargo, zelfs als ze misschien niet het beste alternatief zijn). For each port that you would consider as a possible alternative, please assess the quality as a substitute for Rotterdam (beoordeelt u de kwaliteit als een alternatief voor Rotterdam) by circling a number between “–2” and “2”. A circle around “-2” means that the port is a “very poor” (“erg slecht”) substitute for Rotterdam, a circle around “2” means that it is a “very good” substitute.
Possible substitute? Quality as substitute for Rotterdam
Yes No Very poor Very good
France
Le Havre -2 -1 0 1 2
Dunkerque -2 -1 0 1 2
Belgium
Gent -2 -1 0 1 2
Zeebrugge -2 -1 0 1 2
Antwerp -2 -1 0 1 2
The Netherlands
Vlissingen -2 -1 0 1 2
Amsterdam -2 -1 0 1 2
Germany
Wilhelmshaven -2 -1 0 1 2
Bremen/Bremerhaven -2 -1 0 1 2
Hamburg -2 -1 0 1 2
UK
Felixstowe -2 -1 0 1 2
Other (please specify):
-2 -1 0 1 2
7. This question goes into more detail with regard to the quality of the port of Rotterdam relative to other ports. In the table below, please assess the quality and costs of a) Rotterdam versus Antwerp, and b) Rotterdam versus the next best alternative port for the cargo type for which you fill out this form (please fill in the name of the port).
Quality in Rotterdam compared to Antwerp
Quality in Rotterdam compared to (please specify):
Very poor
Very good
Very poor
Very good
a. Proximity (nabijheid) to origin and destination in terms of sailing time and nautical access (toegang).
-2 -1 0 1 2 -2 -1 0 1 2
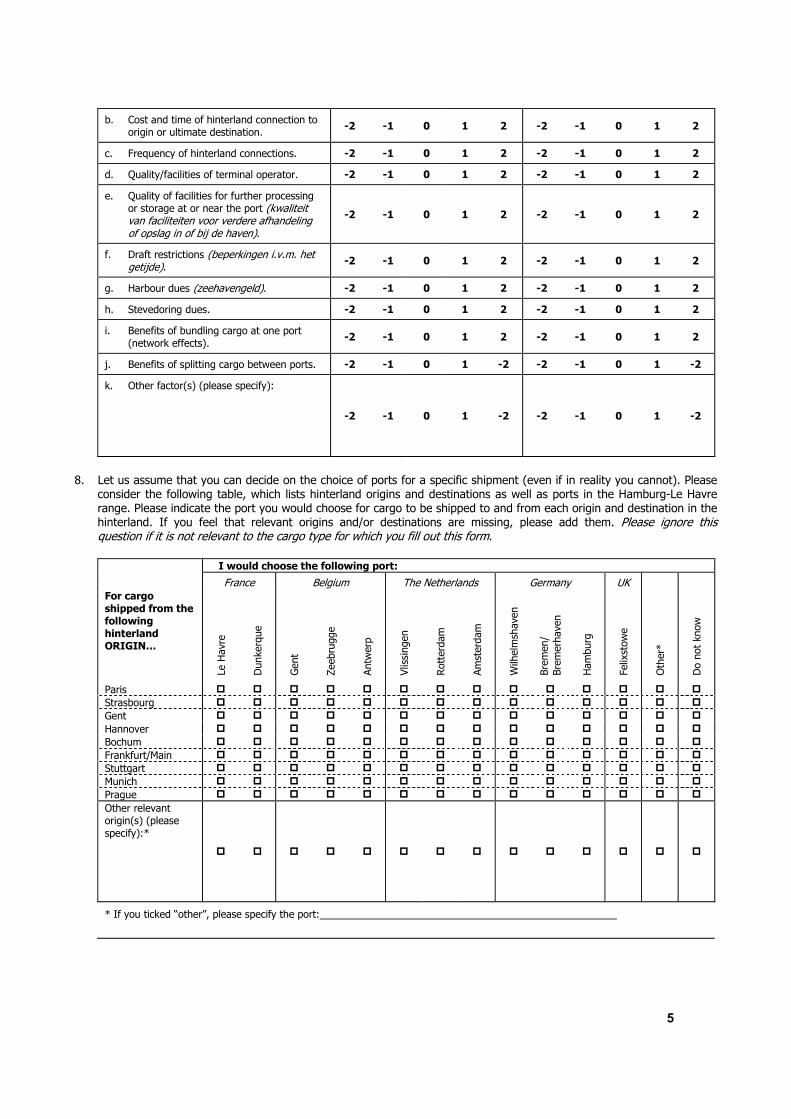
5
b. Cost and time of hinterland connection to origin or ultimate destination.
-2 -1 0 1 2 -2 -1 0 1 2
c. Frequency of hinterland connections. -2 -1 0 1 2 -2 -1 0 1 2
d. Quality/facilities of terminal operator. -2 -1 0 1 2 -2 -1 0 1 2
e. Quality of facilities for further processing or storage at or near the port (kwaliteit van faciliteiten voor verdere afhandeling of opslag in of bij de haven).
-2 -1 0 1 2 -2 -1 0 1 2
f. Draft restrictions (beperkingen i.v.m. het getijde).
-2 -1 0 1 2 -2 -1 0 1 2
g. Harbour dues (zeehavengeld). -2 -1 0 1 2 -2 -1 0 1 2
h. Stevedoring dues. -2 -1 0 1 2 -2 -1 0 1 2
i. Benefits of bundling cargo at one port (network effects).
-2 -1 0 1 2 -2 -1 0 1 2
j. Benefits of splitting cargo between ports. -2 -1 0 1 -2 -2 -1 0 1 -2
k. Other factor(s) (please specify):
-2 -1 0 1 -2 -2 -1 0 1 -2
8. Let us assume that you can decide on the choice of ports for a specific shipment (even if in reality you cannot). Please consider the following table, which lists hinterland origins and destinations as well as ports in the Hamburg-Le Havre range. Please indicate the port you would choose for cargo to be shipped to and from each origin and destination in the hinterland. If you feel that relevant origins and/or destinations are missing, please add them. Please ignore this question if it is not relevant to the cargo type for which you fill out this form.
I would choose the following port:
France Belgium The Netherlands Germany UK
For cargo
shipped from the following
hinterland ORIGIN…
Le H
avr
e
Dunke
rque
Gent
Zeebru
gge
Antw
erp
Vlis
singen
Rott
erd
am
Am
sterd
am
Wilh
elm
shave
n
Bre
men/
Bre
merh
ave
n
Ham
burg
Felix
stow
e
Oth
er*
Do n
ot
know
Paris
Strasbourg
Gent
Hannover
Bochum
Frankfurt/Main
Stuttgart
Munich
Prague
Other relevant origin(s) (please specify):*
* If you ticked “other”, please specify the port:

6
I would choose the following port:
France Belgium The Netherlands Germany UK For cargo shipped to the
following hinterland DESTINATION…
Le H
avr
e
Dunke
rque
Gent
Zeebru
gge
Antw
erp
Vlis
singen
Rott
erd
am
Am
sterd
am
Wilh
elm
shave
n
Bre
men/
Bre
merh
ave
n
Ham
burg
Felix
stow
e
Oth
er*
*
Do n
ot
know
Paris
Strasbourg
Gent
Hannover
Bochum
Frankfurt/Main
Stuttgart
Munich
Prague
Other relevant destination(s) (please specify):**
** If you ticked “other”, please specify the port:
SWITCHING
9. Did you ever reduce volume at a port for one of the reasons listed in the table below (heeft u ooit volume verminderd in een haven wegens een van de redenen in de onderstaande tabel)? If you are not responsible for deciding about the routing of cargo, have you ever heard of incidents where cargo volume was reduced at a port for one of the reasons listed in the table below?
If yes, please indicate: Did you ever reduce volume / have you heard of incidents where volume was
reduced at a port because of… Yes No When? At which port was volume reduced?
To which other port was the volume
shifted (verplaatst)?
a. An increase in harbour dues?
b. An increase in total call costs?
c. A capacity expansion (capaciteitsuitbreiding) at other ports?
d. Other reason(s) (please specify):
10. The previous questions dealt with actual switching behaviour in the past. Suppose now that the port of Rotterdam were to increase its harbour dues permanently by 10% while harbour dues in all other ports stayed at their current levels (veronderstel dat het zeehavengeld in Rotterdam permanent met 10% wordt verhoogd, terwijl het zeehavengeld in andere havens op hetzelfde niveau blijft). Would your company shift (verplaatsen) any cargo volume that is currently shipped through Rotterdam to other ports? If you do not have power (beslissingsmacht) over the routing of cargo flows, do you expect that those who decide about cargo flows would shift volume away from Rotterdam in such a case?
Yes No

7
11. Suppose next that the total costs of shipping cargo through Rotterdam (i.e. total port call costs and cargo handling costs) were to increase permanently by 10% while the costs of calling at all other ports stayed at their current levels (Veronderstel dat de totale kosten voor shipping via Rotterdam permanent met 10% worden verhoogd, terwijl de kosten in andere havens op hetzelfde niveau blijven).
a. Would you shift volume to other ports or would you expect that those who have power over the routing of cargo flows would shift volume from Rotterdam to other ports (only the cargo type for which you fill out this form)?
Yes No
b. If yes, please provide an estimate of the proportion of volume currently shipped through Rotterdam Rotterdam (of the cargo type for which you fill out this form) that you would shift or expect to be shifted to other ports (Geeft u a.u.b. een schatting: hoeveel procent van het volume dat nu via Rotterdam loopt, zal uw bedrijf via andere havens laten lopen als de totale kosten voor Rotterdam permanent met 10% zouden stijgen, terwijl de kosten voor andere havens gelijk zouden blijven):
%
c. Please indicate what proportion of the total volume (of the cargo type for which you fill out this form) shifted away from Rotterdam Rotterdam to other ports you would expect to route or to be routed to each of the following ports (see table below).
Share of shifted “Rotterdam” volume you would expect to move to this port
France Le Havre %
Dunkerque %
Belgium
Gent %
Zeebrugge %
Antwerp %
The Netherlands
Vlissingen %
Amsterdam %
Germany
Wilhelmshaven %
Bremen/Bremerhaven %
Hamburg %
UK
Felixstowe %
Other (please specify):
%
Total ∑100%
IMPACT OF CAPACITY EXPANSION
12. There are plans to expand (uitbreiden) the general capacity of the port of Wilhelmshaven and the capacity of the port of Rotterdam (through Maasvlakte II) and to expand the capacity of the port of Antwerp for containers (through the gradual (geleidelijke) opening of the Deurganck dock, which will eventually (uiteindelijk) add 5.5 million TEU of container capacity per year). Please indicate whether you expect these envisaged expansions (beoogde uitbreidingen) to lead to any of the changes listed in the table below.
Expansion of
Wilhelmshaven Expansion of Rotterdam
Expansion of Antwerp (for
containers only)
Do you think that the
envisaged port expansion will lead to…
Yes No Yes No Yes No
a. Lower harbour dues in Rotterdam?
b. Lower terminal dues in Rotterdam?
c. Better quality of services in Rotterdam?

8
Please explain your reasoning:
13. The following question only relates to containers (deze vraag heeft alleen betrekking op containers). We understand that the port of Amsterdam offers a new container terminal where both harbour dues and stevedoring costs are about half of the level in Rotterdam (wij begrijpen dat de haven in Amsterdam een nieuwe container terminal heeft waar het zeehavengeld en de stuwadoorskosten ongeveer de helft zijn van die in Rotterdam). Still, the port of Amsterdam seems to have been unsuccessful in attracting significant container volume. If applicable, please explain the factors that drove your choice not to transfer significant container business to Amsterdam (Indien van toepassing, legt u a.u.b. uit welke factoren van belang waren voor uw beslissing om niet aan aanzienlijk deel van uw container business naar Amsterdam te verplaatsen). In the table below, please look at the reasons that others have mentioned for not moving business to Amsterdam, add any reasons that are important in your case and then indicate the relative importance of each of the reasons by distributing a total of 100 points to them. Please check that the points add to exactly 100.
Reason for not moving business to Amsterdam Points
a. Level of connections to the hinterland
b. Distance to hinterland locations
c. Seaside access
d. Other reason(s) (please specify):
Sum of points: 100
If you did move volume to Amsterdam, please explain why:
PRICING OF PORTS
14. If you are involved in paying harbour dues to the port of Rotterdam, do you negotiate harbour dues with the port authority (onderhandelt u over het zeehavengeld met het Havenbedrijf Rotterdam)?
Yes No
15. We understand that the port authority of Rotterdam has yearly consultation rounds with port user representatives before proposing new harbour dues. Do you believe that these rounds influence the ultimate pricing decision (Gelooft u dat de jaarlijkse consultatierondes de uiteindelijke beslissing over de hoogte van het zeehavengeld beïnvloeden)?
Yes No
Please explain why you think or why you do not think that the consultation rounds influence prices.

9
16. If you have knowledge about harbour dues in Rotterdam and at other ports, please specify in the table below – for your cargo/ship type – at which ports in the Hamburg-Le Havre range harbour dues are generally lower than at the port of Rotterdam.
Harbour dues are… (zeehavengeld is …)
Higher in Rotterdam
(hoger in Rotterdam)
Equal or lower in Rotterdam
(gelijk of lager in Rotterdam) Do not know
France Le Havre
Dunkerque
Belgium Gent
Zeebrugge
Antwerp
The Netherlands Vlissingen
Amsterdam
Germany
Wilhelmshaven
Bremen/Bremerhaven
Hamburg
UK Felixstowe
Other (please specify):
17. If applicable, what do you believe are the reasons for these price differentials (Indien van toepassing: wat denkt u dat de redenen zijn voor deze prijsverschillen)? Please look at the following arguments that others have mentioned and, if relevant, add any arguments that are important.
Reason Yes No
a. Better services at Rotterdam
b. Better access to Rotterdam
c. Better hinterland connections in Rotterdam
d. Other reason(s) (please specify):
18. Do you perceive that there is a traditional sequencing in price setting of harbour dues (one port starts, others follow)? (Ervaart u dat er een traditionele volgorde is bij het vaststellen van de hoogte van het zeehavengeld (één haven begint, anderen volgen)?)
Yes No
If yes, which port would usually go first (Zo ja, welke haven gaat meestal eerst)? ______________
19. Are differences between harbour dues of different ports relatively stable (Zijn de verschillen in zeehavengeld relatief stabiel)?
Yes No
20. Are there examples of ports trying to lure customers and their cargo volume away from other ports (Zijn er voorbeelden van havens die proberen klanten en hun cargo-volume weg te lokken van andere havens)? Yes No
If yes, please explain (which ports, which cargo type, when and how)?

10
PERFORMANCE AND COMPETITIVENESS
21. Please consider the following table. Indicate which changes, compared to the situation today, you would expect as a result of the corporatisation of the Rotterdam port authority and which changes you would expect if – hypothetically – the port authority was to be fully privatised (i.e. full private ownership). (Welke veranderingen, vergeleken met de huidige situatie, verwacht u als resultaat van de verzelfstandiging van het Rotterdamse Havenbedrijf en welke veranderingen verwacht u indien – hypothetisch – het havenbedrijf volledig zou worden geprivatiseerd (d.w.z. indien de eigendom volledig in privéhanden zou komen).
Corporatisation of the port authority Full privatization of the port authority
Do you expect an effect on… No
Yes, I
expect an increase
Yes, I
expect a reduction
No
Yes, I
expect an increase
Yes, I
expect a reduction
a. Pricing?
b. Investment?
c. Service quality?
22. Have you ever had any negative experience with the port authority or one of its daughter companies (e.g. terminal operators) that you would consider as “anti-competitive”, i.e. not normal competitive practice and possibly an attempt of HbR to abuse potential market power? Please explain. (Heeft u negatieve ervaringen met het Havenbedrijf of een van haar dochterbedrijven (bv. terminal operators) die u als concurrentiebeperkend zou beschouwen, d.w.z. die in het normale commerciële verkeer niet gangbaar zijn en misschien een poging van HbR zijn om potentiële marktmacht te misbruiken? Gelieve uw antwoord toe te lilchten.)
Qualitative survey
It would be very helpful for our study if you could provide information on the following questions. If you need
more space than is provided here, we would appreciate if you would answer the questions on an extra sheet
and attach it to the questionnaire (if you do so, please indicate the question to which your response relates).
23. Please describe the nature of specific investments in port infrastructure and suprastructure by your company. Describe your contractual relationships with the port (length of time etc.). Would you be able to move the facilities to another port? (Beschrijft u a.u.b. de aard van specifieke investeringen door uw bedrijf in haveninfrastructuur en gebouwen en machines. Omschrijft u a.u.b. uw contractuele relaties met de haven (tijdsduur etc.). Is het mogelijk de faciliteiten te verplaatsen naar een andere haven?)

11
24. If available, please provide information on the total cost of calling at the port of Rotterdam (disbursement accounts, split into: Harbour dues, cargo handling, other) and at other ports in the Hamburg-Le Havre range. (Geeft u a.u.b. informatie over de totale kosten om gebruik te maken van de Rotterdamse haven (zeehavengeld, cargo-afhandelkosten, overige kosten) en van andere havens tussen Hamburg en Le Havre.)
25. If you have detailed information on the hinterland transport of the cargo shipped by you (origin and destination, transport modes), please provide this information for the ports you call at. (Geeft u a.u.b. voor elke haven waarvan u gebruik maakt gedetailleerde informatie over het ‘achterland-transport van de door u getransporteerde cargo (oorsprong en bestemming, wijzen van transport).)
26. Please explain the decision-making process of at which ports to call, the sequencing of calls (if applicable, e.g. for liner business) and the key factors considered. How often do you revise these decisions? (Beschrijft u a.u.b. het besluitvormingsproces m.b.t. van welke havens gebruik wordt gemaakt, de volgorde waarin havens worden aangedaan (indien van toepassing, bv. bij ‘liner business’) en de belangrijkste factoren die daarbij in aanmerking worden genomen. Hoe vaak worden deze beslissingen heroverwogen?)
27. What do you see as the most important trends in your business that will affect the pricing and the service quality at the port of Rotterdam? (Wat beschouwt u als de belangrijkste trends die de prijsvorming en servicekwaliteit van de Rotterdamse haven zullen beïnvloeden?)

12
28. Are there any concerns regarding the competitiveness between ports or of service providers within ports that you wish to bring to our attention? (Heeft u zorgen over de mate van concurrentie tussen havens of tussen dienstenaanbieders in havens die u onder onze aandacht wilt brengen?)