study on the efficiency and effectiveness of public...
TRANSCRIPT

EUROPEAN COMMISSION
Study on the efficiency and effectiveness of public spending on tertiary education
Miguel St. Aubyn, Álvaro Pina, Filomena Garcia and Joana Pais
Economic Papers 390| November 2009
EUROPEAN ECONOMY

Economic Papers are written by the Staff of the Directorate-General for Economic and Financial Affairs, or by experts working in association with them. The Papers are intended to increase awareness of the technical work being done by staff and to seek comments and suggestions for further analysis. The views expressed are the author’s alone and do not necessarily correspond to those of the European Commission. Comments and enquiries should be addressed to: European Commission Directorate-General for Economic and Financial Affairs Publications B-1049 Brussels Belgium E-mail: [email protected] This paper exists in English only and can be downloaded from the website ec.europa.eu/economy_finance/publications A great deal of additional information is available on the Internet. It can be accessed through the Europa server (ec.europa.eu) ISBN 978-92-79-13365-7 DOI: 10.2765/30348 © European Communities, 2009

Study on the efficiency and effectiveness of public spending on tertiary education
Third report (second draft) Miguel St. Aubyn,1 Álvaro Pina, Filomena Garcia, and Joana Pais ISEG - Technical University of Lisbon December 2008 Abstract: Public tertiary education systems in the EU Member States are studied by comparing used resources with education and research outputs and outcomes. Efficiency in public tertiary education systems across EU countries plus Japan and the US is assessed with semi-parametric methods and stochastic frontier analysis. A core group of efficient countries is identified. A good quality secondary system, output-based funding rules, institutions’ independent evaluation, and staff policy autonomy are positively related to efficiency. Moreover, evidence is provided that public spending on tertiary education is more effective in what concerns labour productivity growth and employability when it is coupled with efficiency. Key words: efficiency; effectiveness; public spending; tertiary education; universities
1 Team leader and corresponding author. ISEG, Rua Miguel Lupi, 20, P-1249-078 Lisboa (Portugal). E-mail: [email protected].

Contents: Introduction............................................................................................................................................................. 3 1. Concepts, data and preliminary analysis ............................................................................................................. 5
1.1 Concepts....................................................................................................................................................... 5 1.2 A literature survey...................................................................................................................................... 12 1.3 Data ............................................................................................................................................................ 16 1.3 Preliminary analysis ................................................................................................................................... 21
2. Efficiency Assessment ...................................................................................................................................... 34 2.1 The semi-parametric analysis method ........................................................................................................ 34 2.2 Main results from the semi-parametric analysis......................................................................................... 36 2.3 More results from the semi-parametric analysis: the "research" and the "teaching" models...................... 47 2.4 The stochastic frontier method ................................................................................................................... 48 2.5 Results from the stochastic frontier analysis .............................................................................................. 50 2.6 A summary of efficiency results................................................................................................................. 52
3. Effectiveness Assessment ................................................................................................................................. 55 3.1 The effectiveness assessment approach...................................................................................................... 55 3.2 Effectiveness results concerning labour productivity................................................................................. 56 3.3 Effectiveness results concerning employability ......................................................................................... 60 3.4 A summary of effectiveness results............................................................................................................ 63
Conclusions........................................................................................................................................................... 65 Annex. Case studies. ............................................................................................................................................. 68
Netherlands ...................................................................................................................................................... 68 United Kingdom............................................................................................................................................... 79 Portugal ............................................................................................................................................................ 89
References........................................................................................................................................................... 101 Appendix A – Data ............................................................................................................................................. 106 Appendix B - Data sources and remarks............................................................................................................. 114 Appendix C - The OECD questionnaire ............................................................................................................. 119 Appendix D - Data Envelopment Analysis alternative models........................................................................... 130 Appendix E - Stochastic Frontier Analysis alternative models........................................................................... 140 Appendix F - Effectiveness alternative models................................................................................................... 142
2

Introduction
This is the final report of a study on the efficiency and effectiveness of public spending on
tertiary education in the EU commissioned by the Directorate General Economic and
Financial Affairs of the European Commission to an ISEG/Technical University of Lisbon
team, under contract number ECFIN/329/2007/486218.
In this report we outline the conceptual framework, present data, and discuss the appropriate
input, output, and environment indicators, and take into account the specific features of each
country in order to compare properly the tertiary education systems in the EU Member States.
Special care is given to the wide-ranging nature of tertiary education, where research and
teaching activities cohabit from the individual to the institutional level.
Efficiency of public spending on tertiary education is evaluated using two different methods:
a semi-parametric method and the stochastic frontier analysis (SFA). The first method
includes data envelopment analysis (DEA) as a first stage and the regression of the obtained
efficiency scores on explanatory factors as a second step. The latter is essentially a regression
of total tertiary education cost on the considered outputs and factor costs, including the
explicit modelling of country-specific efficiency scores. Results from the semi-parametric and
SFA methods are essentially consistent. A core of more efficient European countries is
identified (the UK and the Netherlands), while important inefficiencies are recognised in other
countries. Countries with secondary education systems of good quality and where tertiary
education is organised along certain lines (in terms of staff policy autonomy and flexibility, of
independent and public evaluation of institutions, and of output oriented funding rules) tend to
obtain better results in education and research from the resources used.
Effectiveness of tertiary education is the relation between this activity and final goals rather
than closely related outputs. As a matter of fact, tertiary education is one of the driving forces
of growth. In this report we show that there is a link between labour and total factor
productivity and spending in education. However, this link is only effective when spending is
efficient. In other words, what really matters is that money and resources are spent in such a
way that one gets outputs that in a broader layer are related to productivity and growth.
Moreover, we present evidence of a link between tertiary education efficiency and
3

employability. Unemployment rates among tertiary education graduates are lower than those
among individuals that attained secondary level only, and this difference increases when
public tertiary education is more efficient.
This report is organised as follows. The first section covers the important definitions of
efficiency, effectiveness, and related concepts and sets some key measurement issues. We
include a description of collected data and present some indicators constructed from them.
The analysis provided is introductory and intends essentially to describe data and their
usefulness for the subject at hand, and to give the reader a first impression of the main issues
at stake. The second section describes the methods to be followed in order to assess efficiency
on tertiary education provision across countries and its determinants and presents results from
the application of semi-parametric and stochastic frontier methods. The third section is
focused on the effectiveness of public spending on tertiary education. An annex contains three
case studies, two concerning more efficient countries (the Netherlands, the UK) and one about
a less efficient system (Portugal). Finally, the report ends with the conclusions that can be
drawn from our study.
4

1. Concepts, data and preliminary analysis
1.1 Concepts
Definition of efficiency
Efficiency is essentially a comparison between inputs used in a certain activity and produced
outputs. When, with a given amount of inputs or resources, a decision making unit (DMU) –
be it a company, a government body, or a country – attains that level of output or outputs that
is the maximum attainable under the existing technology, that DMU is said to be efficient,
i.e., it operates on the production possibility frontier. When it produces less than what can
possibly be attained, the DMU is considered to be inefficient.
FIGURE 1: THE PRODUCTION POSSIBILITY FRONTIER
Figure 1 illustrates these concepts in a simplified one input – one output framework. DMUs
A, B, and C are located on the production possibility frontier, and are therefore efficient. On
the other hand, DMU D is inefficient. With the level of input it uses it produces d1 units of
output. Production should increase by d2 units if the possibility frontier were to be attained. A
possible measure of DMU D’s inefficiency is the so-called output efficiency coefficient,
(d1+d2)/d1, related to the vertical distance to the frontier. In a similar manner, it is possible to
measure an input efficiency coefficient, associated to the horizontal distance to the frontier.
A dual approach to efficiency measurement is adequate when more that one output is to be
considered and the researcher uses a parametric method like stochastic frontier analysis. This
dual approach implies the estimation of a cost frontier, instead of a production frontier. The
cost frontier will be a function of outputs and of input costs. Inefficiency will in this case be
5

evaluated as a measure of the excess cost each unit is incurring relative to minimum
(efficient) cost.
Applying these concepts to tertiary education entails defining the DMUs, characterizing
inputs and outputs, and also developing a method or methods to estimate the production or
cost frontiers, all points to be covered in what follows.
The decision-making units
One of the main objectives of the study is to compare the EU Member States and a country-
level analysis is envisaged. Accordingly, the DMU set includes the different public tertiary
education systems, which roughly corresponds to all public instructional educational
institutions of tertiary education across the EU (to be made precise below). Luxembourg was
excluded as its only university was only established in 2003. Japan and the US are also taken
in the analysis in order to gain more insight and to add statistical significance to the results.
However, in practice, effective consideration of all these countries will depend on data
availability. Countries to be considered in the study are listed in Table 1.
TABLE 1: COUNTRIES TO BE CONSIDERED IN THE STUDY Country Name Country
Code Country Name Country
Code Austria AT Italy IT Belgium BE Japan JP Bulgaria BG Lithuania LT Cyprus CY Latvia LV Czech Republic CZ Malta MT Germany DE Netherlands NL Denmark DK Poland PL Estonia EE Portugal PT Greece EL Romania RO Spain ES Sweden SE Finland FI Slovenia SI France FR Slovak Republic SK Hungary HU United Kingdom UK Ireland IE United States US
Finally, note that Table 1 contains both small and large countries. In order to have a
meaningful comparison, variables will usually be taken in per capita terms, i.e., divided by
population.
6

Public system vs. private system
This study is integrated in the study of efficiency and effectiveness of public spending. As
such, the institutions under analysis in each country are either public or government-
dependent private. These concepts, as defined in European Commission (2007), are:
• public institutions: institutions that are directly or indirectly administered by a public
education authority;
• private government-dependent institutions: institutions that are directly or indirectly
administered by a non-governmental organisation (church, trade union, a private business
concern, or other body) and which, according to the definition in the UNESCO-
UIS/OECD/Eurostat (UOE) questionnaire, receive over 50% of their core funding from the
public authorities;
• private independent institutions: institutions that are directly or indirectly administered
by a non-governmental organisation (church, trade union, a private business concern, or
other body) and which, according to the definition in the UOE questionnaire, receive less
than 50% of their core funding from the public authorities.
Table 2 summarises the structure of the tertiary education systems in each country under
study. In ideal terms, one would like to include all public institutions, and weight each private
government-dependent institution according to the percentage of funds it receives from public
sources. Such detailed data is not available. As a matter of fact, it was not even possible to
obtain a list of private government-dependent institutions per country. However, we could
obtain lists of public and or private institutions per country. We have then considered in our
sample:
• all institutions, when, in one given country, institutions are all either public or public
and private government-dependent;
• public institutions only, when there are some private independent institutions. In these
cases, private government-dependent institutions, if they exist, could not be
considered, as it was not possible to disentangle them from the private independent
institutions. This happened for France, Germany, and Spain;
• public and government-dependent institutions, when both are important, whereas
independent private institutions are negligible. This is the case of Estonia, Latvia,
Lithuania, and Slovenia.
7

In what follows, we will refer to the institutions we have considered in each country, be it
public only or both public and government-dependent, by PGD.
TABLE 2: STRUCTURE OF TERTIARY EDUCATION SYSTEMS Public Private
Government-Dependent
Private Independent
Institutions to Consider
Observations
Austria X X All
Belgium X X All
Bulgaria X X Public institutions
Cyprus X X Public institutions
Czech Republic X X Public institutions
Some negligible private government-dependent institutions exist.
Denmark X All
Estonia X X X Public and gov. dependent inst.
Some negligible private institutions exist.
Finland X X All
France X X X Public institutions
Germany X X X Public institutions
Greece X All
Hungary X X All
Ireland X X Public institutions
Italy X X Public institutions
Japan X X Public institutions
Latvia X X X Public and gov. dependent inst.
Lithuania X X X Public and gov. dependent inst.
Private universities are few and negligible.
Malta X All
Netherlands X X All
Poland X X X Public institutions
Some negligible private government-dependent institutions exist.
Portugal X X Public institutions
Romania X X Public institutions
Slovakia X X All Some negligible private institutions exist.
Slovenia X X X Public and gov. dependent inst.
Some negligible private government-dependent institutions exist.
Spain X X X Public institutions
Some negligible private government-dependent institutions exist.
Sweden X X All
United Kingdom X X All
United States X X Public institutions
Source: OECD Online Education Database, complemented by inspection of government websites.
Outputs and their measurement
Tertiary educational systems are supposed to produce and disseminate knowledge, and this
activity is pursued along two main dimensions: teaching and research. It is important
8

therefore to properly define outputs that are at the same time measurable, not too numerous
relative to the number of DMUs to be studied, and clearly related to teaching and research.
As in other studies concerning the efficiency of universities, measures of the number of
graduates will be considered as outputs of teaching activities.2 Quality of teaching is to be
measured by resorting to survey data. The THES (Times Higher Education Supplement) - QS
(Quacquarelli Symonds) World University Rankings provide data on two important surveys.3
One concerns graduates' employability as perceived by recruiters and the other relates to
quality perceptions among peers. These surveys provide scores on individual universities. In a
process to be described later, we computed country scores from those original university
scores and obtained a “recruiter view country indicator” and a “peer view country indicator.”
These indicators will be used to scale the number of graduates in each country.
Research output is to be evaluated by means of measures derived from the number of
publications and their impact. We aggregate to country level the number of published papers
in academic journals by considering the location of the authors’ affiliation. Furthermore,
quality of such publications is taken into account by means of the number of citations
received. In fact, in a manner to be made precise below, we have computed a citation index,
which we then use to weight the number of publications. The Web of Science database
elaborated by The Thomson Corporation is our source on this matter.
Inputs and their measurement
As in many studies on efficiency in education (see section 1.2), the number of full-time
equivalent academic staff is the input considered. This category includes all personnel whose
primary or major assignment is instruction or research (covering, namely, those holding an
academic rank with such titles as professor, associate professor, assistant professor, instructor,
lecturer, or the equivalent of any of these academic ranks). Ideally, we would also like to
consider non-academic staff, whose main function is to administer students, teachers, and
researchers and who facilitates the teaching and research process in general, as well as the 2 See, for example, Flegg et al. (2004). 3 The Institute of Higher Education from the Shanghai Jiao Tong University also produces a well known world ranking of universities. We did not use data from that ranking because it would imply a double counting in what concerns publications and citations. On the other hand, the qualitative survey data we took from the THES-QS ranking is not superimposing to the information we collected from other sources.
9

total time spent by students in order to have a degree, and some measure of the physical
capital used (e.g., buildings and libraries). Nevertheless, such data is not available for most
countries/years comprised in this study.
The total number of students is the other input we included. Students are an input in so far as
they constitute the essential resource used to produce one of the main tertiary education
outputs – the number of graduates. Implicitly in our approach, students who do not achieve
graduation are an indicator of waste in education, as time, labour, capital, and expectations
were spent without a measurable outcome.4
Cost (money) measures
In order to implement a multi-dimensional cost function model, we have to consider the total
cost of the tertiary educational system. In one model,5 we have considered wages in the
services sector as a proxy for wages in tertiary education across countries, so we could have
data for the whole sample. Other alternatives proved less adequate:
- Dividing staff costs by the number of full-time equivalents in the
Unesco/OECD/Eurostat database was considered, but missing values are too numerous.
- The International Labour Organization (ILO) collects information on wages paid in
the month of October to tertiary education teachers of mathematics or languages and
literature, but we could not use it for several reasons: the data do not capture variation in the
number of months paid each year, nor in employers’ social security contributions and missing
values are very numerous. Moreover, the ILO makes very few adjustments to the national
replies to the questionnaires provided.
- Eurostat has data on average annual gross earnings in education. However, apart
from neglecting social security contributions paid by employers (and, of course, comprising
non-tertiary education), this variable presents missing values in all years for more than half of
the countries in our sample. Eurostat also has annual information on monthly labour costs in
education, with somewhat better country coverage (only 5 EU members without any annual
entries), though often with very short time spans (e.g., countries with data for only 2 or 3 4 As mentioned in section 1.2, some studies on university efficiency follow our approach (for example, Flegg et al., 2004). Others, however, consider the number of students as an output, rather than an input (for example, Abbott and Doucouliagos, 2003). We think there is an essential distinction between enrolled students as such, who are simply working to achieve a goal, and graduates, students who have achieved that goal. Assuming enrolled students as an output would result in a bias towards efficiency for those systems where drop out rates are high and we wish to consider this as a waste symptom. 5 Wages were considered in the "alternative SFA model;" see Appendix E.
10

years). We have checked that the available observations are highly correlated with our chosen
proxy (even when “old” and “new” Member States are considered separately), which suggests
that the use of the latter does not distort significantly the analysis.
Exogenous and environment factors
These are factors that potentially determine efficiency scores. In Figure 1, exogenous and
environment factors explain in part why the DMU D is below the production possibility
frontier. One could for example expect that under a less adverse environment DMU D could
have been found producing d1c instead of d1.
These variables are to be introduced in both efficiency measurement models to be used (two-
stage DEA and SFA), as explained in the proper sections. Here, we make reference to the
most likely factors and corresponding variables that may be found to be significant:
i) Universities’ organisation and funding schemes
The way universities are organised is probably the first factor that comes to mind in what
concerns explaining inefficiencies. We consider institutional indicators taken from Oliveira
Martins et al. (2007). These authors constructed a composite indicator from a questionnaire in
such a way that low values are associated to input rigidity, supply restrictions, and absence of
accountability and high values linked to input flexibility, no supply restrictions, and high
accountability.6
ii) Quality of secondary education
As in most countries the majority of the tertiary students have obtained their secondary
degrees in that very same country, it is possible that better quality in secondary education
affects efficiency in tertiary education. Examples of measures of secondary education quality
are PISA scores, which we include here, and drop out rates.
Definition of effectiveness and outcomes
While efficiency derives from a relationship between inputs and outputs, and refers
essentially to the extent to which outputs are attained while minimising production costs,
effectiveness refers, in our view, to the connection between inputs, outputs and more general,
6The questionnaire used to build the composite indicator is available in Appendix C.
11

second layer type objectives or outcomes. According to this preferred definition, while
outputs from tertiary education are graduated students or published papers, outcomes to which
these outputs in principle concur may be higher productivity, employability, innovation, or
economic growth.
Outcomes to be considered
When considering effectiveness of tertiary education across countries, we will be asking the
following questions:
i) Are increasing tertiary education spending levels affecting in a positive way labour
productivity or total factor productivity?
ii) How does efficiency in tertiary education promote employability? Namely, does efficiency
explain the gap between graduates’ unemployment rate and that of people with secondary
education only?
iii) And how does efficiency in spending affect the relationship between tertiary education
spending and labour productivity?
1.2 A literature survey
Despite the long history in studying universities costs, it is only recently that it is taken into
account the presence of inefficiency in university production. In fact, while previous work in
general assumed that the university produces on the minimum-cost frontier, recent empirical
analysis allows for inefficiencies using two main categories of methods, namely, DEA
methods and SFA.
The scope of most of these studies, with only a few exceptions, is limited to the higher
education institutions of a single country and the approaches are varied. Firstly, the output of
universities can be generally categorized into teaching and research. Some works focus only
on one of these dimensions, while others cover both. Second, concerning the choice of
outputs and inputs, there is no definitive study to guide the selection of these factors in
educational application. Various variables have been employed as measures of teaching
output. The number of degrees conferred, the number of graduates, or full-time equivalent
student enrolment are the most common, with, eventually, a distinction between the
undergraduate and the graduate level and arts and sciences. There is no reason why students
12

should be considered a better measure than the number of graduates: degrees awarded neglect
the education of those who attend but do not graduate, but measure completions and the level
of accomplishment. McMillan and Datta (1998) use the full-time equivalent number of
students. A study that uses the number of graduations as a measure of outcome is Abbott and
Doucouliagos (2003), whereas Athanassopoulos and Shale (1997) employ the number of
graduates; Johnes (2006) and Flegg et al. (2004) divide the number of degrees awarded in
graduate and postgraduate degrees; Warning (2004) distinguishes between graduations in
sciences and in social sciences. Adjustment for quality is rare, namely through peer
evaluation, given the lack of consistent qualitative measures in higher education. Both Flegg
et al. (2004) and Johnes (2006) aim at evaluating universities in the UK and use graduations
weighted by degree classification.
The means for estimating the value of the research output is not less controversial. It has been
assessed by means of the number of patents obtained, as well as publications and citations
(see Athanassopoulos and Shale, 1997, and Warning, 2004). An alternative approach is to use
government or external research finance attracted by a university as a proxy for both quantity
and quality of the research output, even though some argue that this may well be considered
an output, instead of an input. This is the case of Abbott and Doucouliagos (2003), Flegg et
al., or McMillan and Datta (1998).
If there is no consensus on which output measures to use and, in many cases, output selection
is driven by the availability of reliable data, inputs are more readily quantifiable. Since
university inputs must be purchased, expenditure becomes an aggregate input measure (see
Athanassopoulos and Shale, 1997). Faculty are typically incorporated in full-time equivalent
numbers or as salary expenses. This may be extended to include all academic staff or even
non-academic staff, again in numbers or costs. Abbott and Doucouliagos (2003), Johnes,
2006, and Flegg et al., 2004 consider staff in numbers and Warning (2004) in costs. Other
separately designated inputs are the full-time equivalent number of students (see Flegg et al.,
2004, and Johnes, 2006), expenditure on inputs other than labour inputs, and proxies for the
university's capital stock. Johnes (2006) for instance, uses the value of interest payments and
depreciation as a measure of the capital stock.
All the aforementioned studies apply DEA to study efficiency in the higher education sector;
other examples include Tomkins and Green (1988), Beasley (1990, 1995), Johnes and Johnes
13

(1993), Sarrico et al. (1997), Sarrico and Dyson (2000). Among the few articles that apply
SFA to higher education, we only mention two key studies, both concerning universities in
the UK. Izadi et al. (2002) estimates a constant elasticity of scale (CES) cost frontier. The
dependent variable is total expenditure and the independent variables are the number of
undergraduate students in arts and in sciences, the number of graduate students, and the value
of research grants received. Apart from these, Stevens (2005) also considers staff costs and, in
order to account for the quality of the teaching output, the proportion of first-class degrees,
while controlling for input quality by means of the average scores of students entering the
university.
To the best of the authors’ knowledge, attempts to make efficiency analysis of the higher
education sector at the international level are only a few. Joumady and Ris (2005) compare
universities in 8 different countries (Italy, Spain, France, Austria, Germany, the Netherlands,
United Kingdom, and Finland), using a large sample of recent higher education graduates
responses to a survey conducted in 1998. Their aim is to evaluate the adequacy of the skills of
recent graduates from different universities to the labour market requirements. Thus, they
focus on teaching and define efficiency as the ability to, first, generate human capital
competencies and, second, to match the competencies provided with the competencies
required, and outputs are taken along these lines. Inputs are students' qualification and grade
before enrolment in higher education, study conditions and teaching quality provision, and
intensity of job search. By computing average efficiency scores, Joumady and Ris (2005)
distinguishes between three groups of countries, namely the UK, Netherlands, and Austria,
that have relatively good performance, France and Germany, that are located on an average
level of inefficiency, and finally, Spain, Finland, and Italy, that exhibit the worst
performances.
Agasisti and Johnes (2007) use DEA to compare technical efficiency of English and Italian
universities in the period 2002-3 to 2004-5. This study includes as outputs the number of
graduates and the total amount of external grants and contracts for research, thus covering
both dimensions - teaching and research. As inputs, they consider the total number of
students, the total amount of financial resources/incomes, the number of PhD students, and
the number of academic staff. By looking at the evolution of technical efficiency scores over
the four-year period, Agasisti and Johnes (2007) conclude that whereas Italian universities are
improving their technical efficiency, English universities are obtaining stable scores.
14

Nevertheless, the typical English HE institution is measured as being much more efficient
than its Italian counterpart. Finally, Agasisti (2008) is the only article that performs a cross-
country comparison using countries as decision-making units. It conducts a DEA on the HE
sector of some European countries for the period 2000-2003, focusing on the teaching
dimension only. Agasisti uses as outputs the population that has attained tertiary education,
employment rates of graduates, and the percentage of foreign students. Inputs are the students
to teachers ratio, entry rates, and expenditure on educational institutions. Agasisti then
concludes that the UK has the best performance, essentially due to the high graduation rates
experienced and the good results in terms of foreign students’ attraction. France, Germany,
and Ireland also display good performances. The Nordic countries are characterized by
relatively low efficiency scores given the extremely high levels of spending, while Eastern
countries have both relatively low levels of spending and low performances, except for the
Slovak Republic, which results as an efficient country.
In what effectiveness is concerned, there is a vast literature studying the impact of education
on economic growth, though many contributions do not disaggregate education by levels, so
as to study the importance of tertiary education. Abundant research is also available on the
link between education and labour market outcomes, though often drawing on micro data.
Our survey of these strands of literature will be selective, and mainly guided by the approach
taken in section 3 of this report.
Some studies address the importance of education for output or productivity growth within
the more general framework of the growth effects of fiscal policy, especially of public
expenditure and its composition. From this perspective, one tests the explanatory power of
public spending on education in a growth regression, controlling for other variables, such as
capital accumulation, initial income levels or other budget items. Examples include
Blankenau et al. (2007) and Devarajan et al. (1996). The latter study contains a detailed
disaggregation of central government expenditure, including, among many other categories,
tertiary education spending (for which no significant beneficial growth effects were found).7
7 The sample period is 1970-1990 and the study draws on data from the IMF’s Government Finance Statistics. In past issues of this source total education outlays were broken down into schools, universities and other spending, but this disaggregation has been discontinued.
15

While the approach in the previous paragraph can be regarded as input-based, it is also
possible to consider how education outputs contribute to economic growth. By far the most
widely used output is average years of schooling, which is taken as a proxy for human capital
and included in a production function alongside other production factors, such as labour and
physical capital (see, e.g., De la Fuente and Domenech, 2006; Cohen and Soto, 2007). A few
studies disaggregate total human capital by levels of education –e.g., Pereira and St. Aubyn
(2008) or Vandenbussche et al. (2006), the latter study suggesting that the growth effects of
tertiary education are stronger the closer economies are to the technological frontier. For the
purposes of the present report, however, a disadvantage of this approach is that it neglects one
of the main outputs of tertiary education, namely scientific research.
It holds that in most countries and years schooling minimizes the risk of unemployment, and
hence the unemployment rate among those with tertiary education attainment is smaller than
among groups with lower levels of attainment (see, e.g., Blondal et al., 2002). On the basis of
micro data (individual-level data from household surveys), Boarini and Strauss (2007)
estimates for several countries the employability premium from tertiary education (relative to
upper secondary education) controlling for other individual characteristics, and find an
average value of roughly two percentage points. Biagi and Lucifora (2008) studies the impact
of education on unemployment using data from Labour Force Surveys for 10 European
countries, and conclude that, controlling for a host of other factors (e.g., demographic
variables or the business cycle), higher educational attainment (measured by the share of
those with more than primary education) reduces unemployment rates, both for less educated
and (especially) for more educated groups. In section 3 of this report we intend to go one step
further and investigate the determinants of cross-country variation in the employability
premium from tertiary education.
1.3 Data
Data on inputs, teaching outputs, and financial data were drawn from the OECD (Online
Education Database) whenever possible to ensure data comparability across countries. Such
data are available for the period 1998-2005 only, thus considerably restricting the scope of
our study. Moreover, in order to derive consistent time series for the period considered, the
16

OECD data were combined with other sources, notably Eurostat.8 In what research outputs
are concerned, the ISI Web of Science was the main source. Finally, indexes on the quality of
teaching were drawn from THES (Times Higher Education Supplement), the institutional
variables were taken from Oliveira Martins et al. (2007), and macroeconomic data from
AMECO and Eurostat. Precise definitions of the variables used are given in what follows.
Appendix A contains the data and details on sources and some remarks are available in
Appendix B.
Input data
Academic staff:
Definition: Number of members of the academic staff (comprising all personnel whose
primary or major assignment is instruction or research and so covers personnel who hold an
academic rank with such titles as professor, associate professor, assistant professor, instructor,
lecturer, or the equivalent of any of these academic ranks), working in both PGD institutions
of tertiary education (including ISCED levels 5 and 6) in full-time units.
Students in PGD Institutions:
Definition: Number of students enrolled in PGD institutions of tertiary education (ISCED
levels 5 and 6) in full-time units.
Expenditure/financial data
Total Expenditure on PGD Institutions in Percentage of GDP:
Definition: Annual expenditure on PGD institutions in percentage of GDP at tertiary level of
education (ISCED levels 5 and 6).
8 We think it is important to point out that UOE databases on education are incomplete, with a good number of missing figures and unclassified items. Apart from measurement errors, this conditioned our empirical work when it came to model specification and periods considered in a manner that will be clarified in the following parts of this report.
17
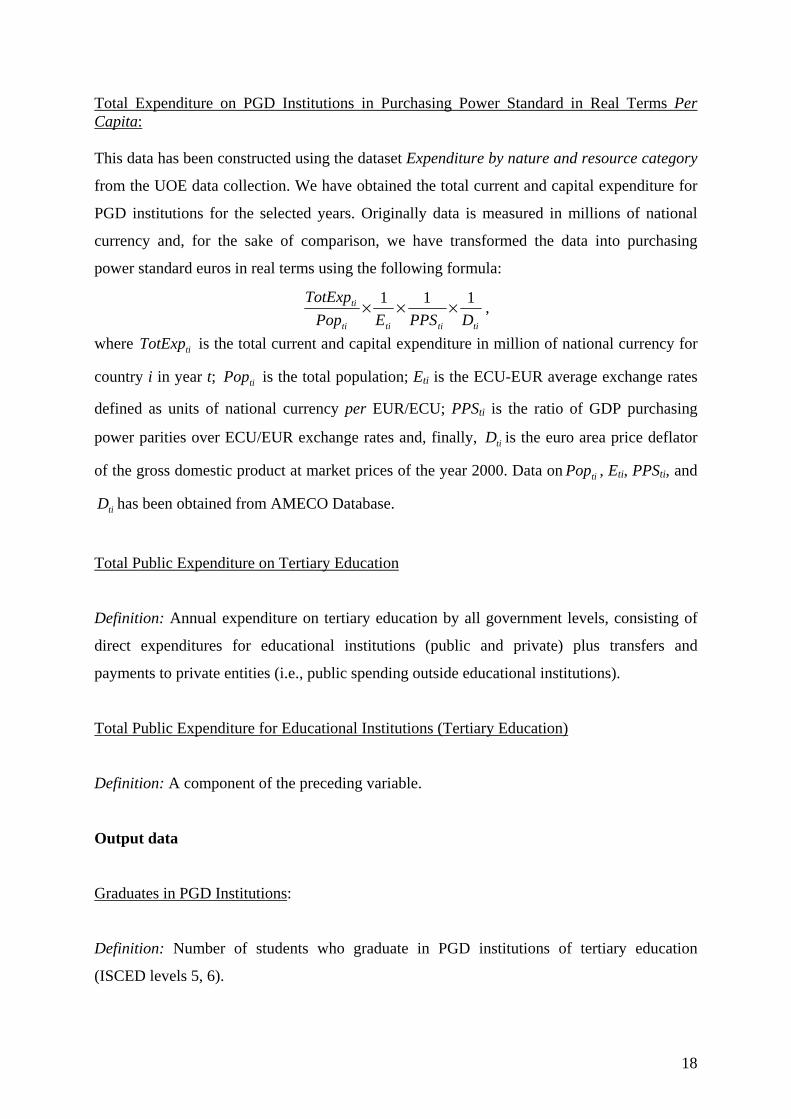
Total Expenditure on PGD Institutions in Purchasing Power Standard in Real Terms Per Capita: This data has been constructed using the dataset Expenditure by nature and resource category
from the UOE data collection. We have obtained the total current and capital expenditure for
PGD institutions for the selected years. Originally data is measured in millions of national
currency and, for the sake of comparison, we have transformed the data into purchasing
power standard euros in real terms using the following formula:
titititi
ti
DPPSEPopTotExp 111 ××× ,
where is the total current and capital expenditure in million of national currency for
country i in year t; is the total population; Eti is the ECU-EUR average exchange rates
defined as units of national currency per EUR/ECU; PPSti is the ratio of GDP purchasing
power parities over ECU/EUR exchange rates and, finally, is the euro area price deflator
of the gross domestic product at market prices of the year 2000. Data on , Eti, PPSti, and
has been obtained from AMECO Database.
tiTotExp
tiPop
tiD
tiPop
tiD
Total Public Expenditure on Tertiary Education
Definition: Annual expenditure on tertiary education by all government levels, consisting of
direct expenditures for educational institutions (public and private) plus transfers and
payments to private entities (i.e., public spending outside educational institutions).
Total Public Expenditure for Educational Institutions (Tertiary Education)
Definition: A component of the preceding variable.
Output data
Graduates in PGD Institutions:
Definition: Number of students who graduate in PGD institutions of tertiary education
(ISCED levels 5, 6).
18

THES - QS recruiter survey ranking:
Definition: Classification of world universities according to results from a survey filled by
recruiters from all over the world (2005, 2006, and 2007) and concerning the employability of
graduates.
THES - QS peer survey ranking:
Definition: Classification of world universities according to results from a survey filled by
academics from all over the world (2005, 2006, and 2007).
Published articles:
Definition: Number of published articles in a given year with at least one author affiliated to a
given country's institution and included in the ISI Web of Science database. The data
collection methodology was the following. Firstly, we obtained a list of the PGD institutions
for each country. Then, for each year and each country, we searched all publications for
which at least one author was affiliated to an institution of that particular country. From these,
we selected the publications from the universities belonging to the relevant list, i.e., the list of
the PGD institutions. The ISI platform does not allow for searches in which the number of
publications in one year exceeds 100 000. In cases where that situation arose, namely the US,
we have split the search into the different states and then removed the papers that included
authors in more than one state, to avoid double counting of these publications.
Citations:
Definition: Number of citations of articles published and cited within a five-year period with at least one author affiliated to a given country's institution and included in the ISI Web of Science database. The data collection was done as follows: after having obtained the list of relevant institutions in each country, we looked for the number of citations of papers published in a certain year in the five subsequent years, whenever possible. Whenever the number of publications of a country exceeded 10 000, in which case the ISI platform does not return any valid number, we partitioned that country’s set of institutions so as to obtain groups of institutions that publish at most 10 000 articles per year. We then obtained all citations for
19

the publications of each group of institutions, excluding those already considered in a different group to avoid double-counting, and summed them up to obtain the number of citations of the country’s publications.
Institutional and environment data
Supply of tertiary education (STE)
Definition: STE is a composite indicator of the institutional set-up of tertiary education,
aggregating scores for input flexibility, output flexibility, and accountability.
Input flexibility (IF):
i) Selection of students: autonomy to choose the number of students and their profile.
ii) Budget autonomy: autonomy to decide on the level of tuition fees and to raise other funds,
as well as to decide on the structure of expenditure.
iii) Staff policy: autonomy to hire, set the wages, and to dismiss the academic staff.
Output flexibility (OF):
Autonomy to set course content, to offer more diversified studies, and to decide on the
(in)existence of constraints associated with numerus clausus.
Accountability (Ac):
i) Evaluation: presence of an independent evaluator, involvement of stakeholders in the
evaluation process, and availability of public evaluation reports.
ii) Funding rules: input or output-oriented funding.
PISA
Definition: PISA is an internationally standardised assessment that was jointly developed by
participating countries and administered to 15-year-olds in schools. The survey was
implemented in 43 countries in the first assessment in 2000, in 41 countries in the second
assessment in 2003, and in 57 countries in the third assessment in 2006. Tests are typically
administered to between 4 500 and 10 000 students in each country. We have considered the
20

average of the PISA assessments on reading, mathematics, and science in year 2000 as a
measure of the student preparation for university studies.
1.3 Preliminary analysis
FIGURE 2
Expenditure on PGD Institutions of Higher Education as Percentage of GDP
2005
0,000,200,400,600,801,001,201,401,601,802,00
Finl
and
Den
mar
kS
wed
enU
nite
dP
olan
dG
reec
eS
love
nia
Uni
ted
Aus
tria
Net
herla
nds
Bel
gium
Lith
uani
aP
ortu
gal
Fran
ceIre
land
Hun
gary
Ger
man
yE
ston
iaS
pain
Bul
garia
Cze
chIta
lyS
lova
kia
Mal
taJa
pan
Figure 2 expresses the total public expenditure on tertiary education institutions in percentage
of GDP in 2005. It varies from 1.73% (Finland) to 0.49% (Japan). The average is 1.2%.9
Figure 3 illustrates the number of academic staff in PGD institutions relative to the total
country population. This number varies between 3.7 (Sweden) and 0.8 (Japan). Romania has
the lowest figure available for a EU country, 1.1. Notice that Sweden and Finland have a very
high number of academics per 1000 inhabitants whereas the UK is below average. Also
striking are the cases of Bulgaria, Estonia, and Spain with values well above the average
(2.0).
9 Note that, in total, the US expenditure on education is much higher than European countries’ expenditure, but this is mainly due to private funding.
21

FIGURE 3
Academic Staff per 1000 Inhabitants2005
0
0,5
1
1,5
2
2,5
3
3,5
4S
wed
enFi
nlan
dLi
thua
nia
Est
onia
Spa
inIre
land
Net
herla
nds
Pol
and
Hun
gary
Slo
vaki
aP
ortu
gal
Ger
man
yG
reec
eU
nite
d S
tate
sA
ustri
aFr
ance
Bul
garia
Bel
gium
Mal
taC
ypru
sU
nite
d K
ingd
omS
love
nia
Latv
iaIta
lyC
zech
Rep
ublic
Rom
ania
Japa
n
Figure 4 depicts the share of students in the tertiary education enrolled in PGD institutions. Note that the countries in which 100% of the students are enrolled in these tertiary education institutions are countries in which there are no private independent universities, or in which these institutions are very small (Austria). Observe that in the analysed countries the weight of the public sector in tertiary education is very high, except for Japan, in which only 21% of the students are enrolled in public tertiary education institutions.
FIGURE 4
Share of Students in PGD Institutions
0,000
0,200
0,400
0,600
0,800
1,000
1,200
Aus
tria
Bel
gium
Den
mar
kFi
nlan
dG
reec
eH
unga
ryM
alta
Net
herla
nds
Slo
vaki
aS
wed
enU
nite
dIta
lyLi
thua
nia
Irela
ndG
erm
any
Cze
chS
pain
Fran
ceB
ulga
riaE
ston
iaR
oman
iaU
nite
dP
ortu
gal
Latv
iaP
olan
dS
love
nia
Japa
nC
ypru
s
22

The number of students in ISCED levels 5 and 6 per member of the academic staff is
illustrated in Figure 5. Slovenia has a very high ratio of students per member of the academic
staff (35), whereas Japan and Cyprus have a much lower ratio (7.8 and 5.4, respectively).
FIGURE 5
Students per Academic Staff2005
0,0
5,0
10,0
15,0
20,0
25,0
30,0
35,0
40,0
Slov
enia
Gre
ece
Latv
iaU
nite
d Ki
ngdo
mR
oman
iaU
nite
d St
ates
Italy
Belg
ium
Hun
gary
Cze
ch R
epub
licLi
thua
nia
Pola
ndIre
land
Finl
and
Fran
ceSl
ovak
iaAu
stria
Net
herla
nds
Esto
nia
Bulg
aria
Spai
nM
alta
Portu
gal
Swed
enG
erm
any
Japa
nC
ypru
s
In terms of graduations (Figure 6 and Figure 7) we observe that Ireland, Lithuania, and the
UK have a good performance both in the number of graduates per 1000 inhabitants and per
member of academic staff. We observe a high variance across countries (see Figure 7). The
worst performances in Europe are from Austria, Germany, and Cyprus, with a very low
number of graduates.
23

FIGURE 6
Graduates per 1000 Inhabitants2005
0,00
2,00
4,00
6,00
8,00
10,00
12,00
14,00
16,00Ire
land
Lith
uani
aU
nite
d K
ingd
omP
olan
dD
enm
ark
Fran
ceLa
tvia
Finl
and
Bel
gium
Hun
gary
Est
onia
Slo
vaki
aM
alta
Net
herla
nds
Sw
eden
Uni
ted
Sta
tes
Italy
Spa
inR
oman
iaS
love
nia
Gre
ece
Por
tuga
lC
zech
Rep
ublic
Bul
garia
Aus
tria
Ger
man
yJa
pan
Cyp
rus
FIGURE 7
Graduates per Academic Staff2005
012345678
UK
Irela
ndLi
thua
nia
Latv
iaR
oman
iaSl
oven
iaPo
land
Fran
ceBe
lgiu
mM
alta
Italy
Cze
ch R
epH
unga
ry US
Slov
akia
Cyp
rus
Net
herla
nds
Gre
ece
Aust
riaEs
toni
aPo
rtuga
lSp
ain
Finl
and
Bulg
aria
Ger
man
ySw
eden
Japa
n
Note that the indicator “graduates per academic staff” can be used to analyze the efficiency of
the teaching system as graduates are one of the outputs of tertiary education and academic
staff is one of the inputs. In Figure 7 we observe that, on average, the number of graduates per
academic staff is between 3 and 4, but some countries can achieve twice this value. It will be
interesting to compare the number of publications per academic staff and the number of
24

graduates per academic staff given that these are the two outputs of the tertiary education
system.
Another important indicator is the graduation rate, defined as the percentage of graduates over
the number of students in each period. It can be interpreted as a turnover rate of tertiary
education. This variable can be observed in Figure 8.
FIGURE 8
Graduates per Student2005
0.00
0.10
0.20
0.30
0.40
0.50
0.60
Japa
nIre
land
Fran
ceM
alta
Uni
ted
Kin
gdom
Den
mar
kP
olan
dLi
thua
nia
Rom
ania
Bel
gium
Slo
vaki
aLa
tvia
Por
tuga
lN
ethe
rland
sB
ulga
riaIta
lyC
ypru
sE
ston
iaH
unga
ryC
zech
Rep
ublic
Spa
inG
erm
any
Uni
ted
Sta
tes
Aus
tria
Sw
eden
Finl
and
Slo
veni
aG
reec
e
The number of published articles is one possible measure of scientific production. This
measure is plotted in Figure 9. Again, this number is divided by the population to scale the
indicator.
25

FIGURE 9
Publications 1000 Inhabitants2005
0
0,2
0,4
0,6
0,8
1
1,2
1,4
1,6
Swed
enFi
nlan
dD
enm
ark
Net
herla
nds
Belg
ium
Uni
ted
King
dom
Aust
riaIre
land
Slov
enia
Ger
man
yG
reec
eU
nite
d St
ates
Esto
nia
Italy
Spai
nPo
rtuga
lJa
pan
Fran
ceH
unga
ryC
zech
Rep
ublic
Cyp
rus
Pola
ndSl
ovak
iaLi
thua
nia
Mal
taLa
tvia
Bulg
aria
Rom
ania
Scientific production as measured by the indicator in Figure 9 is particularly high in the
Nordic countries (Sweden, Finland, and Denmark) and the Netherlands. Note that all these
countries are above the US, the greater producer in absolute terms.
It is possible to decompose the number of articles per capita in two other interesting
indicators, the number of articles per member of the academic staff, and academic staff per
capita:
populationstaffacademic
staffacademicarticlesofnumber
populationarticlesofnumber ×= . (1)
Articles’ production per capita depends both on the academic staff productivity and on the
relative importance of the academic staff respective to total population. As it will be shown in
the following lines, this decomposition allows a deeper analysis of differences across
countries.
26

TABLE 3: DECOMPOSITION OF THE PRODUCTION OF ARTICLES 2005 Articles
per 1000 Inhabitants
Articles per
Academic Staff
Academic Staff per
1000 Inhabitants
Austria 0.87 0.47 1.85 Belgium 0.96 0.56 1.71 Bulgaria 0.09 0.05 1.75 Cyprus 0.24 0.15 1.57 Czech Rep 0.30 0.21 1.47 Estonia 0.50 0.19 2.65 Finland 1.26 0.37 3.42 France 0.34 0.19 1.76 Germany 0.59 0.30 1.96 Greece 0.54 0.28 1.91 Hungary 0.31 0.15 2.10 Ireland 0.78 0.34 2.31 Italy 0.49 0.33 1.48 Japan 0.40 0.48 0.83 Latvia 0.10 0.07 1.48 Lithuania 0.19 0.07 2.77 Malta 0.14 0.08 1.67 Netherlands 0.96 0.44 2.18 Poland 0.24 0.11 2.16 Portugal 0.42 0.21 2.02 Romania 0.06 0.06 1.10 Slovakia 0.20 0.10 2.05 Slovenia 0.72 0.46 1.55 Spain 0.49 0.20 2.47 Sweden 1.52 0.42 3.66 UK 0.92 0.59 1.55 US 0.53 0.28 1.87
Table 3 displays the aforementioned decomposition across countries in 2005. Some countries
are not included due to missing data. The following observations apply:
• the countries with the highest production per capita (Finland and Sweden) are also
countries with a large academic staff. Productivity of this academic staff is above
average;
• some countries achieve above average production per capita (the Netherlands and the
UK) essentially due to a high academic staff productivity, while displaying a smaller
than average academic staff;
• a third group of countries, while employing an above average academic staff, produces
below average. This group includes Spain, Portugal, Hungary, Slovakia, Estonia,
Poland, and Bulgaria;
27

• finally, some countries not only exhibit lower productivity, but also have a relatively
small academic staff. This is the case of Romania, Latvia, Malta Cyprus, and Czech
Republic.
The number of times an article is cited by another article constitutes a usual measure of its
impact. The average number of citations per article is one possible measure of the quality of a
country’s scientific production. We have computed a citation index based on the data
available on the ISI Web of Knowledge:
∑
∑+
=
+
=+ = 4
4
4, t
tkk
t
tkk
tt
pub
cpubCitIndex , for t=1998,…,2001, (2)
where cpubk represents the number of citations in year k and pubk is the number of
publications in year k.
Figure 10 exhibits the average of the Citation Indexes for the different periods.
FIGURE 10
Average ISI Citation Index
0,00
1,00
2,00
3,00
4,00
5,00
6,00
Net
herla
nds
Uni
ted
Sta
tes
Finl
and
Uni
ted
Kin
gdom
Den
mar
kA
ustri
aS
wed
enB
elgi
umG
erm
any
Italy
Fran
ceJa
pan
Irela
ndS
pain
Mal
taH
unga
ryE
ston
iaP
ortu
gal
Pol
and
Cyp
rus
Cze
ch R
epub
licG
reec
eB
ulga
riaS
love
nia
Slo
vaki
aLa
tvia
Lith
uani
aR
oman
ia
It is worth to highlight countries such as the Netherlands, the US, Finland, and Sweden, which
not only produce a high number of publications, but also have a high impact in terms of
citations. Eastern European countries exhibit a weaker performance.
28
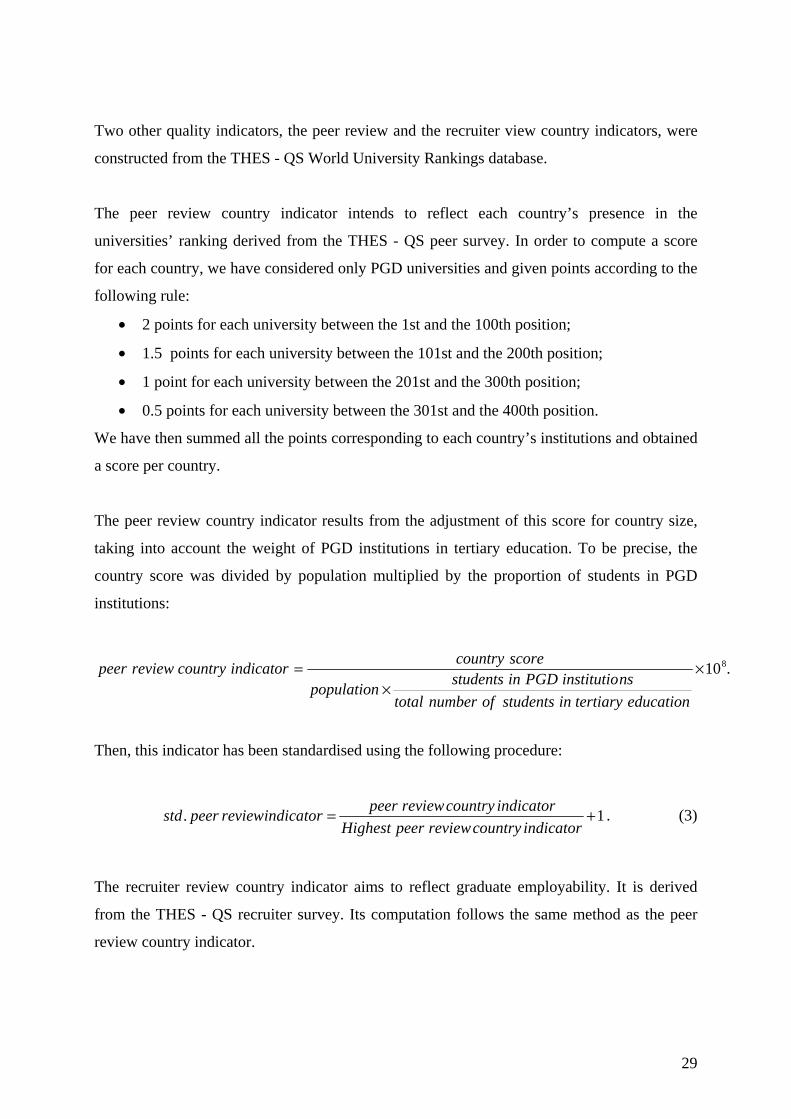
Two other quality indicators, the peer review and the recruiter view country indicators, were
constructed from the THES - QS World University Rankings database.
The peer review country indicator intends to reflect each country’s presence in the
universities’ ranking derived from the THES - QS peer survey. In order to compute a score
for each country, we have considered only PGD universities and given points according to the
following rule:
• 2 points for each university between the 1st and the 100th position;
• 1.5 points for each university between the 101st and the 200th position;
• 1 point for each university between the 201st and the 300th position;
• 0.5 points for each university between the 301st and the 400th position.
We have then summed all the points corresponding to each country’s institutions and obtained
a score per country.
The peer review country indicator results from the adjustment of this score for country size,
taking into account the weight of PGD institutions in tertiary education. To be precise, the
country score was divided by population multiplied by the proportion of students in PGD
institutions:
.108××
=
educationtertiaryinstudentsofnumbertotalnsinstitutioPGDinstudentspopulation
scorecountryindicatorcountryreviewpeer
Then, this indicator has been standardised using the following procedure:
. 1peer reviewcountry indicatorstd peer reviewindicatorHighest peer reviewcountry indicator
= + . (3)
The recruiter review country indicator aims to reflect graduate employability. It is derived
from the THES - QS recruiter survey. Its computation follows the same method as the peer
review country indicator.
29

In Figure 11 we plot the standardised recruiter review country indicator. Recruiters regard the
Universities in Ireland and in the UK as providing highly employable graduates. On the other
hand, Spanish, Polish, and Portuguese universities perform poorly on this strand. Other
countries, for which the standardised recruiter review country indicator equals 1, do not have
any university in the top 400.
The standardised peer review country indicator is depicted in Figure 12. Considering their
size, Finland, Ireland, and Sweden are the countries with more universities pointed out by
peers as being excellent. Spain, Poland, and Greece also perform poorly on this indicator, but
note should be taken that some countries were not included in the graphs because their score
was null.
FIGURE 11
Standardised Recruiter ReviewCountry Indicator
0.00
0.50
1.00
1.50
2.00
2.50
Irela
ndU
nite
d K
ingd
omN
ethe
rland
sJa
pan
Sw
eden
Bel
gium
Finl
and
Den
mar
kA
ustri
aG
erm
any
Fran
ceU
nite
d S
tate
sG
reec
eIta
lyP
ortu
gal
Pol
and
Spa
inC
zech
Rep
ublic
Bul
garia
Cyp
rus
Est
onia
Hun
gary
Latv
iaLi
thua
nia
Mal
taR
oman
iaS
lova
kia
Slo
veni
a
30

FIGURE 12
Standardised Peer Review Country Indicator
0,00
0,50
1,00
1,50
2,00
2,50
Finl
and
Irela
ndS
wed
enN
ethe
rland
sB
elgi
umD
enm
ark
Uni
ted
Kin
gdom
Aus
tria
Japa
nG
erm
any
Fran
ceU
nite
d S
tate
sP
ortu
gal
Italy
Spa
inC
zech
Rep
ublic
Pol
and
Gre
ece
Bul
garia
Cyp
rus
Est
onia
Hun
gary
Latv
iaLi
thua
nia
Mal
taR
oman
iaS
lova
kia
Slo
veni
a
FIGURE 13
PISA 2000 - average of reading, science and mathematics scores
400420440460480500520540560
Japa
nFi
nlan
dU
KN
ethe
rland
sA
ustri
aIre
land
Sw
eden
Bel
gium
Fran
ceC
zech US
Den
mar
kH
unga
ryG
erm
any
Spa
inS
lova
kia
Italy
Gre
ece
Por
tuga
lR
oman
ia
The average of the PISA indicator is 496.6. The highest scores are attained by Japan, Finland,
the UK, and the Netherlands. The US have a slightly above average score and the lowest
scores belong to Greece, Portugal, and Romania.
31

FIGURE 14
Score for Funding Rules Indicator
0123456789
Por
tuga
lFr
ance
Finl
and
Irela
ndB
elgi
umA
ustri
aU
KD
enm
ark
Ger
man
yIta
lyN
ethe
rland
sS
pain
Gre
ece
Sw
eden
Hun
gary
Cze
chJa
pan
US
Rom
ania
Slo
vaki
a
Portugal performs extremely well in the Funding Rules indicator. The average of this
indicator is 5. The worse performing countries are Romania and Slovakia.
FIGURE 15
Score for Staff Policy Indicator
0
2
4
6
8
10
12
Aus
tria
Cze
chD
enm
ark
Japa
nN
ethe
rland
sS
lova
kia
Sw
eden UK
US
Rom
ania
Irela
nd
Italy
Finl
and
Ger
man
yP
ortu
gal
Bel
gium
Spa
in
Gre
ece
Hun
gary
Fran
ce
Several countries attain the maximal value for the staff policy indicator, namely Austria,
Czech Republic, Denmark, Japan, the Netherlands, Slovakia, Sweden, the UK, and the US.
The lowest score is for France followed by Hungary, Greece, and Spain.
32

FIGURE 16
Score for Evaluation Indicator
0123456789
Hun
gary UK
Net
herla
nds
Ger
man
yIta
lyIre
land
Cze
ch US
Slo
vaki
aS
pain
Sw
eden
Japa
nFr
ance
Bel
gium
Rom
ania
Aus
tria
Den
mar
kP
ortu
gal
Finl
and
Gre
ece
Figure 16 exhibits the scores for the evaluation indicator. Hungary, the UK, and the
Netherlands present the highest scores and Portugal, Finland, and Greece present the lowest
ones.
Constructed variables In the estimation of the following sections we will use two composed variables: wgrad or
weighted graduates, which reflects the number and quality of graduates, and wpub, a measure
of the number of publications weighted by the number of citations. To be precise we have
computed these two variables in the following way:
. . . .10002t t
std peer rev ind std recruiter rev indwgrad graduates per pop += × (4)
and t ( ) twpub IndexCit t pub= × , where ( )IndexCit t is the average of citation indices that
included year t in their construction.
33

2. Efficiency Assessment
We applied two different methods in order to measure efficiency in the provision of tertiary
education and to identify the relevant non-discretionary (exogenous and environment)
variables. Firstly we used a two-stage semi-parametric method, Data Envelopment Analysis
(DEA) followed by a regression of output scores on non-discretionary variables; and
secondly, a Stochastic Frontier Analysis (SFA) method, including the estimation of a multi-
dimensional cost-minimising model with explanatory variables for the inefficiency effect. We
turn now into an explanation of these two methods and the ensuing results.
2.1 The semi-parametric analysis method
The two-stage procedure can be briefly described in the following manner.
In the first stage, the researcher identifies relevant inputs (X) and outputs (Y). Then, the
following mathematical programming problem is computed, for a given i-th DMU:
0 1'1
tos.
,
≥=
≥≤
λλ
λλδ
δδλ
nXxYy
Max
i
ii
ii
. (5)
In problem (5), δi is a scalar satisfying 1≥iδ . It measures technical efficiency of the i-th unit
as the distance to the efficiency frontier, the latter being defined as a linear combination of
best practice observations. With 1>iδ , the decision unit is inside the frontier (i.e., it is
inefficient), while 1=iδ implies that the decision unit is on the frontier (i.e., it is efficient). In
what comes next, we will define as the country i DEA output efficient score, which
is necessarily greater then zero and no higher than 1. An interesting intuition is that
1−iδ=iμ
iμ is the
34

fraction country i is producing of its potential efficiency level. It follows that 1=iμ when
country i is efficient.
This first stage is known as Data Envelopment Analysis, originating from Farrell (1957)
seminal work and popularised by Charnes, Cooper, and Rhodes (1978). A full presentation of
the method may be found in Coelli et al. (2005). Afonso and St. Aubyn (2005) have applied
DEA to education and health efficiency across OECD countries.
In the second stage, the following regression is estimated:
i iz iμ β ε= + , (6)
where iμ is the efficiency score that resulted from stage one, i.e., from solving (4). zi contains
non-discretionary variables, i.e., exogenous and environment factors.
Typical two-stage applications include the estimation of (6) using censored regression
techniques (Tobit).10 Recently, Simar and Wilson (2007) have criticised the two-stage
method, as results are likely to be biased in small samples and propose an alternative
estimation and inference procedures based on bootstrap methods. Afonso and St. Aubyn
(2006) have applied both the Tobit and the Simar and Wilson bootstrap procedures in the
second stage to estimate efficiency in secondary education across countries and contain a
relatively detailed explanation of methods. Results from the two methods were very similar.
In our study, we have used the Tobit estimation procedure only.
When panel data is available, it becomes possible to apply DEA to more than one period. The
researcher will then obtain as many efficiency scores as periods for each country. The mere
comparison of those scores is informative as it shows whether a country became closer to or
farther away from the efficiency frontier. However, one has to be aware that the frontier itself
is usually not static. If that is the case, it becomes important to know if that frontier changed
over time, and by how much. In fact, and after applying DEA in two different periods, the
Malmquist index allows the decomposition of “total factor productivity change” (M) into
“efficiency change” (E) and “technical change” (T): 10 See Simar and Wilson (2007) for an extensive list of published examples of the two step approach.
35

iii TEM ×= . (7)
In equation (7), Ei is given by the ratio of efficiency scores for country i, and Ti measures the
change in the production possibility frontier in country i’s vicinity.11
2.2 Main results from the semi-parametric analysis
The first stage (data envelopment analysis)
TABLE 4: VARIABLES IN THE TWO-STAGE PROCEDURE Inputs
Outputs
(in per capita terms)
Non-discretionary variables
Model DEA1:
Academic Staff
Students
(in per capita terms)
Model DEA2:
Spending in PGD institutions
(in percentage of GDP)
Weighted graduates
Weighted published articles
Selection of students
Budget autonomy
Staff policy
Output flexibility
Evaluation
Funding rules
PISA results
Table 4 summarises the variables used with this method.12 We have considered two models,
which are referred as model DEA1 and model DEA2. The output part of these models being
exactly the same, they differ in what concerns the way inputs are measured.
In model DEA1 we have considered academic staff and students as our inputs. Inputs are
therefore measured in physical units, which seems a natural way to measure and compare
resources used across units (countries) that differ markedly in what concerns the cost of these
resources (prices and wages). Note that it was not possible to collect data for other inputs.
One envisaged possibility was to have a third input that would contain other resources used in
the tertiary sector, in the manner of Flegg et al. (2004) when analysing British universities.13
11 A more complete explanation of the Malmquist index can be found in Coelli et al. (2005). 12 See Appendix A for data on inputs, some non-discretionary variables, and data used to construct the outputs. 13 These authors included staff, students, and total expenditure other than that on academic and academic-related staff as inputs. See section 1.2 for more examples.
36

However, this variable was scarcely available and the use of it would drastically reduce the
number of countries in our sample.
In model DEA2 we have considered a financial measure of outputs used. Considering
nominal spending in PGD institutions has one advantage over using physically measured
inputs, as virtually all costs are included. However, it carries also some drawbacks, as
differences in costs across countries are controlled in an imperfect way. The widely used PPS
correction (i.e., using the same acquisitive power euros across countries) is not enough when
it comes to DEA. As wages are a very important part of tertiary education costs, countries
where earnings are considerably lower would become artificially more efficient.14 Measuring
financial costs as percentage of GDP seems to be more suitable. It can be assumed as an
approximation that any two countries that spend the same proportion of GDP on their tertiary
education institutions use a comparable level of resources in this activity.15
In both models outputs are considered in per capita terms, in order to make it possible to
compare countries that are very different in size (both Malta and the US are in the sample).
Our two outputs, weighted graduates and weighted publications, reflect the double nature of
tertiary institutions, which is education and research. As explained in section 1, graduates are
weighted by quality inferred from the peer review and the recruiter review. Publications are
weighted by citations, which is a measure of their impact and usefulness in subsequent
research.16
It was not possible to compute weighted graduates, academic staff, and students per capita for
all years and countries, due to missing data. However, and by dividing the whole time span in
two sub-periods (1998-2001 and 2002-2005), it was possible to have values for those
variables for all countries by averaging existing data.
14 A DEA model where PPS measured costs were considered as the input is presented in Appendix D. 15 This approximation is more appropriate for activities where most inputs are nontradable across borders, as is the case of education. 16 The consideration of these two types of output and weighting for quality is common in the literature on the efficiency of tertiary education institutions. As noted in section 1.2, examples of studies that consider both types of output are McMillan and Datta (1998), Flegg et al. (2004), and Stevens (2005), as well as references therein. Worthington (2001) surveys efficiency measurement techniques in education.
37

Table 5 to 8 summarise results for the two sub-periods. They include the outputs, the inputs,
and the efficiency scores. In both cases countries are ranked according to the latter. In Figure
17 we display these rankings for both models.17 Note that for each model we present two
tables, one referring to an input-oriented DEA and the other to an output-oriented DEA. In an
input oriented DEA, the efficiency coefficient refers to the horizontal distance to the frontier
while in an output-oriented it relates to the vertical distance (see Figure 1). Efficient countries
are the same under both orientations and their coefficient equals 1. “Peers” are those efficient
countries that dominate inefficient ones. For example, Austria in period 1 is worse than a
linear combination of the Netherlands, UK and Japan production conditions, these latter
countries being Austria’s peers.
TABLE 5: DATA ENVELOPMENT ANALYSIS MODEL DEA 1 (PHYSICALLY MEASURED INPUTS), INPUT ORIENTED
Period 1 - 1998-2001 Period 2 - 2002-2005 Coefficient Ranking Peers Coefficient Ranking Peers
Austria 0.777 13 Netherlands, UK, Japan 0.963 9 Netherlands, Denmark, Japan Belgium 0.846 10 Japan UK 0.973 8 Denmark, UK, Japan Bulgaria 0.521 21 Japan, Romania 0.517 21 Japan Cyprus 1.000 1 Cyprus 0.870 10 Japan Czech Republic 0.624 17 Japan, Romania 0.618 18 Japan Denmark 0.816 11 Netherlands, UK, Japan 1.000 1 Denmark Estonia 0.411 27 Japan, UK 0.360 28 UK, Japan Finland 1.000 1 Finland 0.975 7 UK, Ireland, Sweden France 0.591 19 Japan, UK 0.644 17 UK, Japan Germany 0.643 15 Netherlands, UK ,Japan 0.644 16 Netherlands, Japan, Denmark Greece 0.598 18 Japan Romania 0.511 22 Japan Hungary 0.488 23 Japan, Romania 0.466 23 Japan, UK Ireland 1.000 1 Ireland 1.000 1 Ireland Italy 0.808 12 UK ,Japan 0.685 12 UK, Japan Japan 1.000 1 Japan 1.000 1 Japan Latvia 0.544 20 Japan, Romania 0.668 13 Japan, UK Lithuania 0.294 28 Japan, UK 0.402 26 UK, Japan Malta 0.639 16 Japan, Romania 0.650 15 Japan Netherlands 1.000 1 Netherlands 1.000 1 Netherlands Poland 0.493 22 Japan, UK 0.542 20 Japan ,UK Portugal 0.461 25 Japan, Romania 0.438 25 Japan Romania 1.000 1 Romania 0.840 11 Japan Slovakia 0.466 24 Japan, Romania 0.448 24 UK, Japan Slovenia 0.909 9 Romania, Japan 0.664 14 Japan Spain 0.441 26 Japan, Romania 0.389 27 Japan, UK Sweden 1.000 1 Sweden 1.000 1 Sweden United Kingdom 1.000 1 UK 1.000 1 UK United States 0.655 14 UK, Japan 0.605 19 Japan, UK
17 In Appendix D we present some results from alternative DEA models.
38

TABLE 6: DATA ENVELOPMENT ANALYSIS MODEL DEA 1 (PHYSICALLY MEASURED INPUTS), OUTPUT ORIENTED
Period 1 - 1998-2001 Period 2 - 2002-2005 Coefficient Ranking Peers Coefficient Ranking Peers
Austria 0.761 11 Netherlands, UK 0.962 9 Denmark, Japan, Netherlands
Belgium 0.839 10 Netherlands, UK 0.972 8 Denmark, Japan, UK
Bulgaria 0.313 26 Ireland, Japan, UK 0.343 25 Ireland, Japan, UK
Cyprus 1.000 1 Cyprus 0.277 28 Japan, Sweden
Czech Republic 0.298 27 Ireland, Japan, UK 0.352 23 Ireland, Japan, UK
Denmark 0.874 9 Netherlands, Sweden, UK 1.000 1 Denmark
Estonia 0.460 17 Ireland, Japan, UK 0.366 22 Ireland, Japan, UK
Finland 1.000 1 Finland 0.996 7 Ireland, Sweden, UK
France 0.566 16 Ireland, Japan, UK 0.599 11 Ireland, Japan, UK
Germany 0.649 12 Japan, Netherlands, Sweden 0.660 10 Japan, Netherlands, Sweden
Greece 0.273 28 Japan, UK 0.294 27 Ireland, Sweden, UK
Hungary 0.323 24 Ireland, Japan 0.333 26 Ireland, Japan, UK
Ireland 1.000 1 Ireland 1.000 1 Ireland
Italy 0.627 13 Japan, UK 0.506 14 Japan, UK
Japan 1.000 1 Japan 1.000 1 Japan
Latvia 0.346 23 Ireland, Japan, UK 0.469 17 Japan, UK
Lithuania 0.368 21 Ireland, Japan 0.398 19 Ireland
Malta 0.429 19 Ireland, Japan 0.480 16 Ireland, Japan, UK
Netherlands 1.000 1 Netherlands 1.000 1 Netherlands,
Poland 0.431 18 Ireland, Japan 0.482 15 Ireland, Japan, UK
Portugal 0.365 22 Ireland, Japan, UK 0.376 21 Ireland, Japan, UK
Romania 1.000 1 Romania 0.545 13 Japan, UK
Slovakia 0.316 25 Ireland, Japan 0.346 24 Ireland, Japan
Slovenia 0.593 15 Japan, UK 0.414 18 Japan, UK
Spain 0.382 20 Finland, Ireland, UK 0.382 20 Ireland, Japan, UK
Sweden 1.000 1 Sweden 1.000 1 Sweden
United Kingdom 1.000 1 UK 1.000 1 UK
United States 0.598 14 Netherlands, UK 0.550 12 Denmark, UK
39

TABLE 7: DATA ENVELOPMENT ANALYSIS MODEL DEA 2 (FINANCIALLY MEASURED INPUTS), INPUT ORIENTED
Period 1 - 1998-2001 Period 2 - 2002-2005 Coefficient Ranking Peers Coefficient Ranking Peers
Austria 0.707 10 UK, Japan 0.904 6 Sweden, Japan Belgium 0.844 8 UK, Japan 0.876 8 Sweden, UK, Japan Bulgaria 0.426 24 Japan 0.486 20 Japan Czech Republic 0.605 14 Japan 0.531 17 Japan Denmark 0.656 11 Netherlands, UK 0.733 10 Sweden, UK, Japan Estonia 0.519 18 Ireland, Japan 0.551 15 Ireland, Japan Finland 1.000 1 Finland 0.904 7 Sweden, UK, Ireland France 0.617 12 Ireland, Japan 0.579 13 Ireland, Japan Germany 0.724 9 UK, Japan 0.716 11 Sweden, Japan Greece 0.516 19 Japan 0.423 24 Japan Hungary 0.467 23 Japan 0.471 22 Ireland, Japan Ireland 1.000 1 Ireland 1.000 1 Ireland Italy 0.610 13 Japan, UK 0.618 12 Sweden, Japan Japan 1.000 1 Japan 1.000 1 Japan Lithuania 0.529 17 Ireland, Japan 0.542 16 Ireland, Japan Malta 0.860 7 Japan 0.867 9 Japan Netherlands 1.000 1 Netherlands 0.994 5 Sweden, UK, Japan Poland 0.553 16 Ireland, Japan 0.502 19 Ireland, Japan Portugal 0.490 22 Japan 0.486 21 Japan Slovakia 0.598 15 Japan 0.564 14 Ireland, Japan Slovenia 0.371 25 Japan 0.394 25 Japan Spain 0.490 21 Japan 0.525 18 Ireland, Japan Sweden 1.000 1 Sweden 1.000 1 Sweden United Kingdom 1.000 1 UK 1.000 1 UK United States 0.492 20 UK, Japan 0.440 23 Sweden, Japan, UK
40

TABLE 8: DATA ENVELOPMENT ANALYSIS MODEL DEA2 (FINANCIALLY MEASURED INPUTS), OUTPUT ORIENTED
Period 1 - 1998-2001 Period 2 - 2002-2005 Coefficient Ranking Peers Coefficient Ranking Peers
Austria 0.694 9 Sweden, Netherlands 0.886 8 Sweden, Japan
Belgium 0.826 7 Netherlands, UK, Finland 0.858 9 Sweden, UK, Japan
Bulgaria 0.284 23 Ireland, Japan 0.233 25 Ireland, Japan Czech Republic 0.313 22 Ireland, Japan 0.282 24 UK, Ireland, Japan Denmark 0.754 8 Finland, Ireland, UK 0.897 7 Ireland, Sweden Estonia 0.465 17 UK, Ireland, Japan 0.407 16 Japan, UK, Ireland Finland 1.000 1 Finland 0.995 5 Sweden, Ireland France 0.579 12 UK, Ireland, Japan 0.451 14 Japan, UK, Ireland Germany 0.664 10 UK, Japan 0.658 11 Sweden, Japan Greece 0.280 24 Japan, UK, Ireland 0.289 23 Sweden, UK, Ireland Hungary 0.330 21 Ireland, Japan 0.306 22 Sweden, UK, Ireland Ireland 1.000 1 Ireland 1.000 1 Ireland Italy 0.509 13 UK, Japan 0.536 12 Sweden, UK, Japan Japan 1.000 1 Japan 1.000 1 Japan Lithuania 0.467 16 Ireland, Japan 0.398 17 Ireland Malta 0.597 11 Ireland, Japan 0.698 10 Ireland, Japan Netherlands 1.000 1 Netherlands 0.993 6 Sweden, UK, Japan Poland 0.495 15 Ireland, Japan 0.395 18 Ireland Portugal 0.337 20 UK, Ireland, Japan 0.310 21 Japan, UK, Ireland Slovakia 0.371 19 Ireland, Japan 0.336 19 Ireland, Japan Slovenia 0.273 25 Finland, Ireland, UK 0.315 20 Sweden, UK, Ireland Spain 0.439 18 Japan, UK, Ireland 0.417 15 UK, Ireland, Japan Sweden 1.000 1 Sweden 1.000 1 Sweden United Kingdom 1.000 1 UK 1.000 1 UK
United States 0.498 14 UK, Finland, Netherlands 0.484 13 Ireland, Sweden
41

FIGURE 17
DEA rankings (based on average input coefficients)
0
5
10
15
20
25
0 5 10 15 20 25
DEA1 ranking
DEA
2 ra
nkin
g
Ireland, Japan, Sweden, UK
Netherlands Finland
MaltaBelgium
Austria
Denmark
Italy
Germany
Czech Republic
France
Hungary
Greece
Bulgaria
Portugal
United States
Poland
Slovenia
Slovakia
SpainEstonia
Lithuania
The following remarks apply to these first stage results:
• efficiency scores are very similar in both periods. Only a couple of countries changed
their position in a striking manner, like Romania and Cyprus in the output oriented
DEA1 model. In fact, Cyprus is in technical terms efficient by default in that model -
it is not a peer of any other country. This means that although no country is found to
be more efficient than Cyprus, it is also the case that Cyprus is not found to be more
efficient than any other country. This status is completely altered in period 2. Romania
is an almost efficient by default country in period 2. Even if it appears as peer of some
other countries, the fact is that withdrawing Romania from the sample does not alter
efficiency coefficients for other countries (see Appendix D).
• Ireland, Japan, Sweden, the UK, and the Netherlands were the countries to be found
always at the production possibility frontier (or very close to it). In some cases this
was essentially due to excellent scientific production (Sweden, Finland, and the
Netherlands), whereas Ireland attained its position due to the graduation output, which
is not only high in number but also the best in perceived quality (see section 1). The
UK is a very good achiever on both counts (education and research) using a
comparatively small number of resources (academic staff is below average).
• in contrast, another group of countries appears as highly inefficient. Bulgaria, Spain,
Hungary, the Czech Republic, Slovakia, Estonia, Portugal, and Greece display usually
low scores. Some of these countries have more tertiary students than average (Spain,
42
Hungary, Slovakia, Estonia, and Greece). However, these students seem to take a long
time to graduate, or an important number of them do not conclude graduation. In all
these countries, graduation output is considerably below average. Moreover, and even
if academic staff is not too low and sometimes clearly above average (Estonia, Spain),
scientific production is low in quantity and quality;
• some of the bigger EU countries (France, Germany, and Italy) are located well below
efficiency levels. In the case of Germany, this is due to a small number of graduations
compared to the average country. This is also the most important Italian weakness. As
far as France is concerned, scientific production is comparatively low, while
graduations are above average;
• the US also come out as quite inefficient. Still, we remind the reader that we are
considering the public sector only and private institutions are important in this
country. The academic staff for this country is below average. However, the number
of enrolled students is high and above average, and, on the other hand, graduations are
not impressive. Scientific production is slightly above average, but clearly below
levels that characterize more productive countries in this matter (the UK and the
Nordic countries). Again, one should note that some of the more research-oriented US
universities, being private, were not considered in this study.
Changes over time
In Tables 9 and 10, we compare the two considered periods by displaying the Malmquist
index decomposition. Observation of the “average” figures (final row of the table) lets us
conclude that changes over time in total factor productivity (+12.8 percent in DEA1 and
+16.5 percent in DEA2) was substantial and essentially derived from technical change (+22.4
percent) in DEA2 rather than from efficiency changes, while in model DEA1 technical and
efficiency changes seem to contribute evenly for total factor productivity. Some countries,
like Austria and Denmark, approached efficiency levels in a significant way in both models.
Austria reduced the academic staff and the number of students, without worsening the
scientific production and only slightly reducing the number of weighted graduates. Denmark
exhibits the best comparative performance, as it increased both weighted graduates and
weighted publications.
43

Almost all countries benefited from technical change, as can be inferred from Tables 9 and
10, where the corresponding index is almost always greater than 1. This index corresponds to
an expanding production possibility frontier. These expanded possibilities affect countries
differently, as we did not impose constant returns to scale.
TABLE 9: DATA ENVELOPMENT ANALYSIS: MALMQUIST DECOMPOSITION (2005-2002 COMPARED TO 1998-2001)
MODEL DEA1 (PHYSICALLY MEASURED INPUTS)
Pure efficiency
change
(1)
scale efficiency
change
(2)
total efficiency
change
(3)=(1)×(2)
technology change
(4)
total factor productivity
change
(5)=(4) ×(3) Romania 0.545 2.837 1.547 1.048 1.621 Latvia 1.355 0.994 1.347 1.072 1.444 Austria 1.264 1.008 1.275 1.081 1.379 Denmark 1.144 1.079 1.235 1.098 1.356 Lithuania 1.084 1.255 1.360 0.984 1.338 Belgium 1.159 1.011 1.172 1.119 1.312 Czech Republic 1.180 0.991 1.169 1.040 1.215 Slovakia 1.094 1.116 1.221 0.995 1.215 Poland 1.120 1.053 1.179 1.007 1.187 France 1.058 1.059 1.120 1.029 1.153 Germany 1.016 1.011 1.027 1.105 1.135 United Kingdom 1.000 1.000 1.000 1.126 1.126 Sweden 1.000 1.017 1.017 1.104 1.123 Malta 1.119 1.010 1.130 0.994 1.122 Bulgaria 1.096 0.995 1.090 1.011 1.102 Greece 1.074 0.904 0.971 1.134 1.102 Italy 0.806 1.191 0.960 1.140 1.094 Hungary 1.031 1.028 1.060 1.029 1.091 Netherlands 1.000 1.000 1.000 1.074 1.074 Japan 1.000 1.000 1.000 1.042 1.042 Finland 0.996 0.946 0.942 1.098 1.035 Portugal 1.032 1.005 1.037 0.998 1.035 Ireland 1.000 1.000 1.000 1.014 1.014 Spain 0.999 0.956 0.955 1.048 1.002 United States 0.920 0.966 0.889 1.119 0.994 Slovenia 0.699 1.207 0.843 1.140 0.961 Cyprus 0.277 2.536 0.701 1.188 0.834 Estonia 0.796 1.051 0.837 0.997 0.834 average 0.961 1.103 1.060 1.064 1.128
44

TABLE 10: DATA ENVELOPMENT ANALYSIS: MALMQUIST DECOMPOSITION (2005-2002 COMPARED TO 1998-2001)
MODEL DEA2 (FINANCIALLY MEASURED INPUTS)
pure efficiency
change
(1)
scale efficiency
change
(2)
total efficiency
change
(3)=(1)×(2)
technology change
(4)
total factor productivity
change
(5)=(4) ×(3) Austria 1.278 0.976 1.248 1.173 1.464 Ireland 1.000 1.000 1.000 1.412 1.412 Slovenia 1.155 1.088 1.256 1.103 1.385 Sweden 1.000 1.091 1.091 1.171 1.277 Denmark 1.189 0.941 1.118 1.124 1.257 Hungary 0.926 1.003 0.929 1.352 1.256 Slovakia 0.905 0.974 0.881 1.402 1.235 Italy 1.053 1.007 1.060 1.125 1.192 Czech Republic 0.903 1.007 0.910 1.304 1.187 Malta 1.169 0.720 0.842 1.407 1.184 Lithuania 0.853 0.989 0.843 1.402 1.182 Belgium 1.039 1.003 1.042 1.108 1.155 Greece 1.032 0.965 0.996 1.159 1.154 Finland 0.995 1.017 1.012 1.135 1.148 Portugal 0.917 1.003 0.921 1.242 1.143 Bulgaria 0.820 0.988 0.810 1.402 1.135 Netherlands 0.993 0.976 0.969 1.144 1.108 Germany 0.991 0.975 0.966 1.145 1.106 Estonia 0.873 0.992 0.866 1.271 1.101 United Kingdom 1.000 1.000 1.000 1.076 1.076 Spain 0.950 0.991 0.941 1.141 1.074 France 0.780 1.010 0.788 1.309 1.031 Poland 0.798 0.917 0.731 1.402 1.025 Japan 1.000 0.887 0.887 1.118 0.992 United States 0.972 0.911 0.886 1.117 0.990 average 0.977 0.975 0.952 1.224 1.165
The second stage (explaining inefficiency)
Table 4 included all variables that we selected and that could probably have an influence on
output scores. They were already described in section 1. They are seven in total.
Six of them refer to institutional characteristics of the tertiary education system (selection of
students, budget autonomy, staff policy, output flexibility, evaluation, and funding rules).
Recall that these are qualitative variables, such that a high score (close to the maximum of 10)
reflects more intensity on that particular characteristic. The minimum score is 0.
45

PISA is a variable containing the average score of students from a given country in the PISA
2000 exercise. This variable intends to reflect quality and knowledge skills of secondary
students. The a priori is that more qualified secondary students will enhance efficiency in the
tertiary system, as they are less prone to give up studying or to take more years than normal at
university.
TABLE 11: TOBIT REGRESSION OF DEA1 COEFFICIENTS ON EXPLANATORY VARIABLES two period average input coefficients two period average output coefficients Coefficient Standard
Error t-ratio Coefficient Standard
Error t-ratio
Constant -1.549 0.7672 -2.019 -2.286 0.7341 -3.114 PISA 0.004089 0.001584 2.582 0.005448 0.001526 3.571 Staff policy 0.03996 0.01815 2.201 0.03364 0.01808 1.861 Adjusted R-squared 0.2731 0.5034 Number of observations 20 20 Left censored observations 0 0 Right censored observations 5 5 Mean dependent variable 0.7563 0.6822 Standard error of regression 0.1858
0.1999
Table 11 includes results from the Tobit regression of DEA1 coefficients on the above-
mentioned set of explanatory variables (see equation (4)). Only 20 countries were included in
the regression.18 Non-significant variables were excluded from the final specification.
Inspection of Table 11 allows us to conclude that:
• the PISA variable is highly significant, as seen by the very high t-statistic. Education
quality, as proxied by PISA results, is an important explanatory factor when it comes
to explain inefficiency;
• the way staff policy is conducted is also significant. The ability to hire and dismiss
academic staff and to set wages increases efficiency.
18 As mentioned in section 1, we only had explanatory variables data for Austria, Belgium, the Czech Republic, Denmark, Finland, France, Germany, Greece, Hungary, Ireland, Italy, Japan, the Netherlands, Portugal, Romania, Slovakia, Spain, Sweden, the United Kingdom, and the United States.
46

TABLE 12: TOBIT REGRESSION OF DEA2 COEFFICIENTS ON EXPLANATORY VARIABLES two period average input
coefficients two period average output coefficients
Coefficient StandardError
t-ratio Coefficient Standard Error
t-ratio
Constant -3.4119 0.5865 -5.817 -4.972 0.6867 -7.240 Funding rules 0.04835 0.02392 2.021 0.0756 0.02796 2.704 Output flexibility -0.03816 0.01935 -1.972 -0.05803 0.02264 -2.563 PISA 0.007866 0.001266 6.211 0.01069 0.001482 7.213 Staff policy 0.02837 0.01115 2.544 0.03907 0.01304 2.998 Adjusted R-squared 0.7302 0.7964 Number of observations 19 19 Left censored observations 0 0 Right censored observations
4 4
Mean dependent variable 0.7258 0.6658 Standard error of regression 0.1115
0.1296
Table 12 displays results from a Tobit regression of DEA2 coefficients on the significant
explanatory variables. Along with PISA and staff policy, funding rules for institutions also
affect efficiency. Moreover, output flexibility appears to have a negative effect on efficiency,
as if greater diversity in supplied courses and degrees were more costly.
2.3 More results from the semi-parametric analysis: the "research" and the "teaching" models
It is well known that in DEA models with more than one output a unit may be efficient when
it excels in one dimension even if it is below average in others. We have considered restricted
versions of our DEA models where we have only one output, either weighted graduates (the
"teaching model") or weighted publications (the "research model"). More detailed results are
presented in Appendix D. Here, we refer to Figure 18, where output efficiency scores are
compared for both models considering physically measured inputs.
47

FIGURE 18
Reasearch vs. Teaching models2002-2005
0.000
0.100
0.200
0.300
0.400
0.500
0.600
0.700
0.800
0.900
1.000
0.200 0.300 0.400 0.500 0.600 0.700 0.800 0.900 1.000
"Teaching" coefficient
"Res
earc
h" c
oeffi
cien
t
Netherlands
Finland
Malta
BelgiumAustriaDenmark
Italy
Germany
Czech Republic
France
Hungary
Greece
Bulgaria
Portugal
United States
Poland
Slovenia
Slovakia
Spain
Estonia
Lithuania
Sweden UK
Ireland
Cyprus
RomaniaLatvia
The UK is efficient on both accounts, and is represented by a point in the top right corner of
the graph. Countries like Slovenia, Spain, or Greece have similar scores in both models. Some
countries, however, are clearly located to the right and below the straight thick line. These
countries are more efficient if teaching is considered than in what concerns research. Ireland
and France are in this group, as all Eastern European countries except Slovenia. On the other
hand, the Nordic countries, Austria, and Belgium are clearly more efficient in research than in
teaching, as they are above and to the left of the straight line that equalizes scores in both
models.
2.4 The stochastic frontier method
The multi-dimensional cost-minimising approach proposed by Battese and Coelli (1995) is
also explained by Coelli et al. (2005). The reader may refer to Stevens (2005) for an
application to universities, as mentioned in section 1.2.
Accounting for multiple outputs within a stochastic frontier analysis usually implies resorting
to dual methods, i.e., the direct estimation of a frontier production function is replaced by a
cost minimisation problem (see Coelli et al., 2005).
48

Assume the following stochastic cost frontier:
0 1 2ln ln lnit it it it itc wpub wgradβ β β η ε= + + + + , (8)
where i indexes a country, and t indexes time (years) and:
• cit is the total cost with PGD institutions in country i, measured as a percentage of
GDP;
• wgradit, one of the considered outputs, are student graduations weighted by quality
and per capita;
• wpubit, the other output, are publications weighted by citations per capita.
In equation (8), is a normally distributed random error, while iε iη stands for a non-negative
inefficiency effect, assumed to have a truncated normal distribution. Variables are in log form
and estimated parameters are therefore elasticities.19
As in the two-stage semi-parametric procedure, inefficiency effects are to be explained by
nondiscretionary factors represented by zi:
0 1 1 ...it m m itz zη θ θ θ η= + + + + , (9)
where the z’s are filled by variables mentioned in Table 13, which sums up variables used
with this method. All variables were described in section 1, and already used in section 2, but
here we take annual frequencies.
19 An alternative stochastic frontier model is presented in Appendix E. The dependent variable is the total cost with PDG institutions measured in real purchasing power standards euros per capita. Considering this variable calls for the introduction of wages as an explanatory variable and it was not possible to find a good proxy for wages in tertiary education, as explained in section 1. This alternative approach leads to less convincing results.
49

TABLE 13: DEPENDENT VARIABLES IN THE COST-MINIMISING MODEL Input prices Outputs Non-Discretionary Variables
Wages in Services
Weighted graduates Weighted Articles
Selection of students Budget autonomy Staff policy Output flexibility Evaluation Funding rules PISA results
Estimation of equation (8) produces estimates for the following parameters of interest:
• the βs, the coefficients associated to the outputs;
• the θs, coefficients associated to nondiscretionary factors that explain inefficiency;
• σε and ση, the standard deviations of itε and itη , respectively.
By computing 2
2η
2η ε
σγ
σ σ=
+ it is possible to produce a likelihood ratio (LR) statistic to test
0γ =
0
. This LR statistic has a mixed chi-square distribution (see Coelli, 1996). Note that
γ = would imply there were no random inefficiency effects.
Moreover, these estimates make it possible to recover the implied annual efficiency
coefficients for each country.
2.5 Results from the stochastic frontier analysis
The model just described was estimated by maximum likelihood using the software Frontier,
version 4.1c.20 The parsimonious selected model, which we call "SFA" is described in Table
14.
20 This software was written by Tim Coelli and is freely available online from the site http://www.uq.edu.au/economics/cepa/frontier.htm.
50

TABLE 14: SFA ESTIMATION RESULTS (DEPENDENT VARIABLE: COST IN PERCENTAGE OF GDP)
Coefficient Standard-Error t-ratio Cost function:
constant -1.194 36.37 -0.03283 lwgrad 0.2581 0.04353 5.929 lwpub 0.2707 0.02717 9.961
Inefficiency: constant 4.843 36.35 0.1332
staff policy -0.01002 0.007332 -1.367 evaluation -0.03954 0.01373 -2.880
funding rules -0.06146 0.01816 -3.394 PISA2000 -0.007158 0.009246 -7.742
2ˆεσ 0.03601 0.004052 8.888
γ 0.09920
LR statistic (γ=0) 59.67
We start by noting that the inefficiency component of the model is highly significant. The LR
statistic equals 59.67, and clearly exceeds the critical value at 0.1 percent for a mixed chi-
square distribution with 6 degrees of freedom (which is 21.666, according to the tabulation of
Kodde and Palm, 1986).
The cost elasticities of each output, weighted graduations and weighted publications, are
equal to 0.2581 and 0.2707, respectively.
Three institutional variables were found to influence efficiency: staff policy, evaluation, and
funding rules. All affect negatively the costs and hence increase efficiency as can be noticed
by the negative coefficients. Moreover, results from the secondary education system as given
by PISA scores were also important for the efficiency performance at tertiary level.21
Table 15 displays efficiency scores implied by the SFA model. These were computed as the
ratio between the total cost under efficiency conditions and total observed cost.22 The
21 Staff policy is the least significant among all explanatory variables. Withdrawing it led to less reliable estimated efficiency scores. Main results from a variant without staff policy are presented in Appendix E. 22 It is more common in the SFA literature to compute efficiency scores as the inverse of those displayed in Table 15, i.e., as a ratio between total observed cost and cost under efficiency conditions. These coefficients would be comprised between 1 and infinity. Our transformation ensures some comparability to DEA efficiency scores, as our SFA scores also vary between 0 and 1.
51

efficiency frontier is achieved when the score equals 1, and a country is less efficient when its
score is further from 1 and closer to 0.
TABLE 15: SFA, EFFICIENCY SCORES 1998 1999 2000 2001 2002 2003 2004 2005 Average Ranking
(average) United Kingdom 0.730 0.733 0.738 0.737 0.734 0.737 na na 0.735 1
Japan 0.725 0.720 0.718 0.720 0.721 0.714 0.712 0.720 0.719 2 Netherlands 0.687 0.681 0.683 0.682 0.684 0.683 0.685 0.687 0.684 3
Finland 0.679 0.675 0.678 0.679 0.678 0.678 0.678 0.680 0.678 4 Ireland 0.625 0.624 0.622 0.632 0.637 0.645 0.647 0.650 0.635 5 Austria 0.573 0.568 0.585 0.588 0.586 0.592 0.590 0.588 0.584 6 Sweden 0.576 0.578 0.579 0.580 0.580 0.580 0.583 0.588 0.581 7 Belgium na na 0.571 0.569 0.571 0.574 0.578 0.580 0.574 8 France 0.562 0.563 0.565 0.566 0.567 0.559 0.559 0.562 0.563 9
Czech Republic 0.505 0.507 0.509 0.509 0.508 0.507 0.509 0.511 0.508 10 Germany 0.508 0.509 0.509 0.509 0.507 0.504 0.507 0.509 0.508 11 Denmark na 0.504 0.506 0.502 0.500 0.507 0.508 0.512 0.506 12
United States 0.494 0.493 0.493 0.488 0.486 0.485 0.492 0.492 0.491 13 Spain 0.473 0.475 0.473 0.473 0.473 0.473 0.475 0.477 0.474 14
Hungary 0.466 0.468 0.471 0.474 0.471 0.470 0.480 0.482 0.473 15 Italy 0.463 0.460 0.461 0.459 0.459 0.460 0.470 0.470 0.463 16
Portugal 0.425 0.427 0.429 0.428 0.433 0.430 na na 0.429 17 Slovakia na 0.422 0.424 0.421 0.423 0.423 0.418 0.425 0.422 18 Greece na na na 0.326 0.325 na 0.323 0.323 0.324 19
Due to missing data, some scores are not available for some countries and years.23 Countries
are ranked from the more efficient (the UK) to the less efficient (Greece), according to the
average scores presented in the last column. In general terms, country positions do not vary
much across time. The UK was always the efficiency leader, followed by Japan, the
Netherlands, Finland, and Ireland. Greece remained always in the last place. Four of the more
populous states in the EU, France, Germany, Italy, and Spain were always far from the
efficiency frontier, with scores not revealing an increasing tendency.
2.6 A summary of efficiency results
We have evaluated efficiency across countries resorting to two different methodologies. It is
worth stressing those differences before we engage in a comparison of results:
23 The estimation method allows for an unbalanced panel of data.
52

• DEA is a nonparametric method. The a priori assumptions about the production
possibility frontier shape are kept to a minimum. These are convexity and variable
returns to scale. On the other hand, SFA is a regression method and a good number of
parameters are estimated. Namely, this implies an a priori choice of a functional form
for the cost function. In our DEA estimates, we were agnostic till the end about the
outputs relative importance. As a consequence, a country that excels in one type of
production (e.g., publications) but is less fruitful in the other type (e.g., graduations)
may well appear as efficient under DEA. However, it may well fall in SFA rankings,
as this method considers both outputs with a relative importance implicit in the
regression estimated coefficients;
• We followed a production approach when applying DEA while we resorted to a cost
minimisation framework when using SFA. Our DEA models were essentially a
relationship between inputs and outputs, either measured in physical or monetary
terms. When it came to SFA, we considered cost with tertiary education institutions as
the dependent variable in a regression and outputs as explanatory variables. This
different formulation, by itself, may induce dissimilar results.
• DEA is a first step of what is properly designated as a two-stage semi-parametric
approach. In a second stage, scores previously obtained are regressed on conditioning
factors. The SFA approach differs in this respect as it implies only one step. While in
the DEA first stage typically more than one country is found at the production
possibility frontier, this is rarely the case with SFA.
• The SFA maximum likelihood estimation method allows for an unbalanced panel,
while for DEA calculations it is necessary to have a complete panel. We could
therefore consider annual data for SFA, while we had to consider averaged data along
more than one year with DEA. On the other side of the coin, we could include all
countries in the DEA estimations (first step), while a smaller number only could be
considered with SFA, due to missing data on environmental and institutional
variables.
53

FIGURE 19
DEA and SFA rankings Models DEA2 and SFA
20Greece
Slovakia18
Portugal
Italy
Hungary 16
Country rankings derived from DEA2 and SFA are compared in Figure 19. Countries were
ordered from the more efficient to the less efficient on both accounts, excluding those for
which there were DEA estimates only. We considered the average scores across all years.
Visually, one observes that rankings are correlated – countries that perform with SFA tend to
be those well classified with DEA, as is the case with the UK (first on both accounts), Japan,
the Netherlands and Ireland. Also, those that perform poorly essentially coincide – Portugal,
Greece, or Hungary.
Last but not least, there is one striking and important similarity between the two approaches.
Environmental and institutional factors that explain efficiency essentially coincide. These
factors are:
- the quality of secondary education, as proxied by the PISA results;
- the nature of funding rules;
- staff policy and;
- evaluation.
0
2
4
6
8
10
12
14
0 2 4 6 8 10 12 14 16 18 20
UK Netherlands
Finland
BelgiumAustria
Denmark
Germany
France
United States
Czech Republic
Spain
Japan
Ireland
Sweden
54

3. Effectiveness Assessment
3.1 The effectiveness assessment approach
At stated previously, effectiveness differs from efficiency as it refers to a relationship between
tertiary education and second layer goals or outcomes, for which we consider two
possibilities: aggregate labour productivity and graduates’ employability. While the latter
concerns the matching between higher education outputs and labour market needs, the former
is a very close determinant of income per capita, a widely used indicator of economic well
being. Figure 20 clarifies the relationship between efficiency and effectiveness.
FIGURE 20: EFFICIENCY AND EFFECTIVENESS
INPUTS(e.g. academicstaff)
COND. FACTORS(e.g. institutional)
OUTPUTS(e.g. publicationsand graduations)
LABOUR PRODUCTIVITY
EFFECTIVENESS
EFFICIENCY
EMPLOYABILITY
INPUTS(e.g. academicstaff)
COND. FACTORS(e.g. institutional)
OUTPUTS(e.g. publicationsand graduations)
LABOUR PRODUCTIVITY
EFFECTIVENESS
EFFICIENCY
EMPLOYABILITY
When testing the relationship between resources used in education and outcomes (labour
productivity and graduates’ employability), we will take on board the results of the efficiency
assessment carried out in the preceding section. If efficiency is important and if we were
successful in measuring it, then it should be the case that what is relevant is not so much the
amount of resources spent but also if they are used up in an efficient way. It turns out that
empirical results will uphold this approach.
55

3.2 Effectiveness results concerning labour productivity
The relationship between tertiary education spending and labour productivity was assessed
starting from the following growth equation:
iiiii usinvlprodlprodlprod ++++= 3210 98)98/05( ββββ , (10)
where i indexes countries, lprod98 (lprod05) is labour productivity relative to that of the USA
in 1998 (2005), inv denotes gross fixed capital formation and s is public spending on tertiary
education. Both inv and s are defined as a percentage of GDP and averaged over 1998-2005.24
In estimating our parameter of interest, β3, the equation above controls for the effects of
capital accumulation and of initial productivity levels, as commonly found in growth
regressions. The use of the investment ratio as a proxy for capital accumulation (following
Kneller et al., 1999) stems from the unavailability of capital stock estimates for almost half
of the countries in our sample. However, since the change in the capital stock is preferable on
conceptual grounds, we will include it in an alternative specification (see below).
Variable lprodi is labour productivity (defined as GDP per person employed) in country i
divided by labour productivity in the USA. National productivities are measured in
purchasing power parity terms25, so that lprod can be used on the right-hand side as an
indicator of initial conditions that takes due account of differences in national price levels.
The dependent variable, (lprod05/lprod98)i, corresponds to the difference between country i
and the USA in labour productivity growth from 1998 to 2005.
Equation (10) does not allow for differentiated effects across countries according to their
different degrees of efficiency. Therefore, we also estimate the following:26
iiiiii useffinvlprodlprodlprod ++++= .98)98/05( 3210 ββββ , (11)
24 Or over a shorter period, if data availability so imposes. 25 AMECO variable 1 0 212 0 HVGDE (GDP at current market prices per person employed, 1000 PPS). 26 Ventelou and Bry (2006) use a similar approach for evaluating the impact of public spending on growth.
56

where effi is the average efficiency score of country i. Note that the impact of more spending
on public tertiary education is equal to β3effi, equivalent to β3 if country i is efficient (effi=1)
but smaller than β3 if the country is inefficient (effi<1). We estimate equation (11) with the
three sets of input efficiency scores described in section 2 of this report, i.e., variable eff
successively equals DEA1, DEA2 and SFA. These scores were averaged across the 1998-
2005 period, which was therefore used in the definition of the remaining variables, as
mentioned above27.
TABLE 16: TERTIARY SPENDING, EFFICIENCY, AND LABOUR PRODUCTIVITY REGRESSION RESULTS (EU COUNTRIES ONLY)
Equation (10) (11), DEA1
(11), DEA2 (10) (11),
SFA coef. -0.510*** -0.527*** -0.486*** -0.367*** -0.371*** std. dev. (0.080) (0.080) (0.083) (0.119) (0.118) lprod98
P-value 0.000 0.000 0.000 0.002 0.002 coef. 0.819 0.936 1.187* 0.204 0.236 std. dev. (0.687) (0.681) (0.683) (0.612) (0.695) inv
P-value 0.233 0.169 0.082 0.739 0.734 coef. 3.538 4.138 7.053** 1.561 2.719 std. dev. (2.829) (2.533) (3.321) (2.450) (5.552) s or eff.s
P-value 0.211 0.102 0.034 0.524 0.624 Obs 26 26 23 17 17
R2 0.735 0.741 0.710 0.583 0.584 The source for variables lprod98, lprod05 and inv is the AMECO database, Spring 2008 release. Asterisks *, **,
and *** denote significance at 10%, 5% and 1% levels, respectively. Standard errors are heteroscedasticity-
consistent (Eicker-White). R2 is computed as the squared correlation coefficient of actual and fitted values.
In Table 16 we report regression results for equations (10) and (11). Variables lprod98 and
inv present the expected signs, though the latter often fails to reach statistical significance.
The coefficient of public spending on tertiary education is always positive, but imprecisely
estimated, and hence not statistically different from zero, in equation (10).28 The same holds
when adjusting spending for SFA scores (final column of Table 16). However, if one uses
DEA scores instead, tertiary spending reaches borderline significance (10,2%) in the case of
DEA1, and becomes highly significant (3,4%) in the case of DEA2.
27 Input coefficients were preferred to output coefficients as they are used to correct spending. Results using an alternative SFA model efficiency scores are given in Appendix F. 28 This equation was estimated twice, with samples matching those for which DEA or SFA efficiency scores were available.
57

The USA and Japan were excluded from the regressions in Table 16. In Appendix F we report
results including those two countries (Table F2), where the improved significance of DEA-
corrected spending can no longer be detected. Though this is a reminder that the results in
Table 16 should be regarded with prudence, the exclusion of the two non-European countries
can actually be justified on grounds of their much smaller public share in total tertiary
education spending (recall section 1). In other words, for the USA and Japan variables s and
eff.s are a rather poor proxy for the amount and efficiency of total resources devoted to
tertiary education, and it is total resources (public or private) and the ensuing outputs that
should ultimately matter for outcomes such as productivity.
In a simple growth accounting framework, labour productivity growth can be decomposed
into the contributions of capital deepening and of total factor productivity (TFP). To bring our
modelling approach closer to that framework we proceed in two steps. First, we replace in the
previous equations the investment ratio by a more accurate indicator of capital deepening.
Second, we study whether public spending on tertiary education – corrected or not by
efficiency scores – exerts any beneficial impact on TFP.
We measure capital deepening on the basis of variable kli, defined as the net capital stock per
person employed in country i29 divided by the corresponding capital/labour ratio in the USA.
As before, the suffix 98 (05) denotes values for 1998 (2005). Hence (kl05/kl98)i gives the
difference between country i and the USA in capital deepening (i.e., in the growth of capital
per worker) from 1998 to 200530. With this variable, equations (10) and (11) become,
respectively:
iiiii usklkllprodlprodlprod ++++= 3210 )98/05(98)98/05( ββββ (12)
iiiiii useffklkllprodlprodlprod ++++= .)98/05(98)98/05( 3210 ββββ (13)
Table 17 presents the econometric results for equations (12) and (13). Capital deepening
strongly contributes to labour productivity growth, whereas initial productivity levels
29 To derive national capital/labour ratios we divide variable OKND by variable NETD (both from AMECO). 30 Capital deepening is defined relative to the USA for consistency with labour productivity. Notice, however, that if one used capital deepening in each country “by itself” (i.e., no longer relative to the USA) all results would be unchanged, except for parameter β2.
58

completely lose their explanatory power. As for spending on tertiary education, results
confirm and even reinforce those of Table 16: expenditure by itself is not statistically
significant, but becomes so when corrected for efficiency, regardless of the method used to
measure the latter (DEA1, DEA2 or SFA). Nonetheless, one should not lose sight of the fact
that we are working with a rather small sample: only 14 EU members (those prior to the 2004
enlargement bar Luxemburg), for which the AMECO database contains figures for capital
stocks. Unlike in the case of Table 16, adding the USA and Japan to the sample does not
cause efficiency-corrected spending to lose explanatory power (see Appendix F).
TABLE 17: TERTIARY SPENDING, EFFICIENCY, CAPITAL DEEPENING AND LABOUR PRODUCTIVITY
REGRESSION RESULTS (EU COUNTRIES ONLY)
Equation (12) (13), DEA1
(13), DEA2
(13), SFA
coef. 0.052 0.016 0.033 0.038 std. dev. (0.137) (0.130) (0.130) (0.136) lprod98
P-value 0.705 0.903 0.801 0.782 coef. 1.170*** 1.165*** 1.267*** 1.255*** std. dev. (0.367) (0.347) (0.348) (0.353) kl05/kl98
P-value 0.001 0.001 0.000 0.000 coef. 4.456 3.998* 5.417*** 7.747* std. dev. (2.977) (2.088) (2.102) (4.000) s or eff.s
P-value 0.134 0.055 0.010 0.053 Obs 14 14 14 14
R2 0.508 0.526 0.560 0.524 The source for variables lprod98, lprod05 and kl05/kl98 is the AMECO database, Spring 2008 release. Asterisks
*, **, and *** denote significance at 10%, 5% and 1% levels, respectively. Standard errors are
heteroscedasticity-consistent (Eicker-White). R2 is computed as the squared correlation coefficient of actual and
fitted values.
We now turn to the possible impact of tertiary education public spending and its efficiency on
total factor productivity. In equations (14) and (15), tfp05 (tfp98) is total factor productivity in
year 2005 (1998). The remaining variables were already introduced in previous specifications,
1β being our parameter of interest in both equations.
0 1( 05 / 98)i itfp tfp s uiβ β= + + (14)
0 1( 05 / 98) .i itfp tfp eff s ui iβ β= + + (15)
59

Table 18 summarizes results from the econometric estimation of equations (14) and (15).
Again, we are dealing with a small sample of 14 EU countries and some prudence applies.
The tertiary education public spending coefficient is positive and it becomes statistically
significant when corrected by DEA efficiency scores (but not by SFA)31.
TABLE 18: TERTIARY SPENDING, EFFICIENCY AND TOTAL FACTOR PRODUCTIVITY REGRESSION RESULTS (EU COUNTRIES ONLY)
Equation (14) (15), DEA1
(15), DEA2
(15), SFA
coef. 4.589 4.508** 5.610** 7.069 std. dev.
2.877 2.210 2.313 4.466 s or eff.s
P-value 0.111 0.041 0.015 0.113 Obs 14 14 14 14 R2 0.146 0.213 0.251 0.150
The source for variable tfp05/tfp98 is the AMECO database, Spring 2008 release. Asterisks *, **, and ***
denote significance at 10%, 5% and 1% levels, respectively. Standard errors are heteroscedasticity-consistent
(Eicker-White). R2 is computed as the squared correlation coefficient of actual and fitted values.
Overall, the empirical evidence suggests that efficiency matters for effectiveness, results
being fairly robust to different methods for efficiency assessment. When weighed by
efficiency scores, public spending on tertiary education has a positive and statistically
significant impact on labour productivity and on TFP. In a growth accounting framework, the
latter can be regarded as one of the contributors to the former.
3.3 Effectiveness results concerning employability
We also investigate whether the efficiency of public tertiary education spending influences
the employability of graduates. Taking unemployment rates as the dependent variable, the
following equation is estimated:
iiiii ueffUgradshareUterU ++++=− 3210 2564)sec25642564( ββββ , (16)
31 Adding the USA and Japan to the sample does not cause efficiency-corrected spending to lose explanatory power (see Appendix F).
60

where i indexes countries and gradshare is the dimension of the adult (25-64) population
having attained tertiary education (ISCED 5-6) relative to (i.e., divided by) adults with
secondary education attainment (ISCED 3-4). The unemployment rates U2564, U2564ter and
U2564sec refer respectively to the total population aged 25-64 and to those in this age range
having attained tertiary or secondary education. As in the case of labour productivity, variable
eff successively equals DEA1, DEA2 and SFA.
In equation (16) our parameter of interest is β3, which should take a negative value if it is the
case that more efficient spending reduces graduates’ unemployment risk relative to those with
secondary education only. Variable gradshare controls for the relative abundance of
graduates (a supply-side effect in the labour market), and U2564 for other structural
characteristics of the labour market. All variables except eff are ten-year averages32 (1998-
2007), so as to minimize cyclical effects.
TABLE 19: EFFICIENCY IN TERTIARY SPENDING AND UNEMPLOYMENT RISK OF ADULTS
REGRESSION RESULTS (EU COUNTRIES ONLY)
DEA1 DEA2 SFA coef. 0.023*** 0.025*** 0.024*** std. dev. (0.007) (0.008) (0.007)
gradshare
P-value 0.002 0.001 0.001 coef. -0.633*** -0.718*** -0.660*** std. dev. (0.075) (0.065) (0.097)
U2564
P-value 0.000 0.000 0.000 coef. 0.003 -0.016* -0.043** std. dev. (0.011) (0.009) (0.021)
eff
P-value 0.811 0.068 0.047 Obs 26 23 17 R2 0.810 0.812 0.759
The source for variables U2564, U2564ter, U2564sec and gradshare is Eurostat. In the case of Malta, we have
constructed the dependent variable using Eurostat data on employment rates and activity rates in the 25-64 age
interval for the respective levels of educational attainment: as is well known, unemployment (u), employment (e)
and activity (a) rates can be related by u = 100*(1-e/a). Asterisks *, ** and *** denote significance at 10%, 5%
and 1% levels, respectively. Standard errors are heteroscedasticity-consistent (Eicker-White). R2 is computed as
the squared correlation coefficient of actual and fitted values.
32 Due to missing values, averaging sometimes takes place over a shorter period.
61

Results in Table 19 show a highly significant effect of variable gradshare, with the expected
sign: a higher relative supply of graduates increases their relative unemployment rate. The
overall unemployment rate (U2564) seems to exert the opposite effect, increasing the
“employability premium” of tertiary attainment. Finally, in two out of three specifications,
more efficient spending is found to minimize the relative unemployment risk of graduates:
namely, this is the case for efficiency scores DEA2 and SFA. We have checked that this effect
stems from the efficiency of spending, rather than from the financial outlays themselves:
public spending on tertiary education – either by itself (variable s) or adjusted for efficiency
with any of the three sets of scores (variable eff.s) – fails to exert any statistically significant
influence on the dependent variable.
The samples considered in Table 19 only comprise European countries. As in the analysis of
labour productivity, we find that including the USA and Japan causes efficiency scores to lose
their statistical significance (full results are reported in Appendix F).
Since our efficiency scores refer to the recent past, one would expect that they have an impact
not only on the employability of graduates in general, but also – and perhaps especially – on
the employability of young graduates. To check whether such an effect exists, we estimate a
modified version of equation (16) where the dependent variable is restricted to the 25-29 age
range:
iiiii ueffUgradshareUterU ++++=− 3210 2564)sec25292529( ββββ . (17)
62

TABLE 20: EFFICIENCY IN TERTIARY SPENDING AND UNEMPLOYMENT RISK OF YOUNG WORKERS REGRESSION RESULTS (EU COUNTRIES ONLY)
DEA1 DEA2 SFA coef. 0.015 0.025 0.032 std. dev. (0.021) (0.019) (0.020)
gradshare
P-value 0.487 0.197 0.108 coef. -0.733*** -0.838*** -0.955*** std. dev. (0.190) (0.140) (0.169)
U2564
P-value 0.000 0.000 0.000 coef. -0.023 -0.077*** -0.240*** std. dev. (0.031) (0.023) (0.048)
eff
P-value 0.450 0.001 0.000 Obs 26 23 17 R2 0.328 0.402 0.466
We have constructed the dependent variable using Eurostat data on employment rates and activity rates in the
25-29 age interval for the respective levels of educational attainment: as is well known, unemployment (u),
employment (e) and activity (a) rates can be related by u = 100*(1-e/a). Asterisks *, **, and *** denote
significance at 10%, 5% and 1% levels, respectively. Standard errors are heteroscedasticity-consistent (Eicker-
White). R2 is computed as the squared correlation coefficient of actual and fitted values.
The coefficients of variables gradshare and U2564 in Table 20 are broadly similar to their
counterparts in Table 19, though the former variable loses statistical significance. More
importantly, the impact of efficiency (measured by scores DEA2 or SFA) is substantially
reinforced, both numerically and statistically.33 Therefore, a better efficiency performance of
higher education institutions in the 1998-2005 period (used to estimate DEA and SFA scores)
seems to benefit particularly those who were studying at that time, or shortly before.
3.4 A summary of effectiveness results
The main message conveyed by the previous analysis is that efficiency matters for
effectiveness. Public spending on tertiary education as a percentage of GDP only becomes
significantly associated to higher labour productivity growth, or to faster TFP growth, when
adjusted for efficiency. As for the other outcome considered – the employability of graduates,
proxied by their relative unemployment risk – the empirical support for the importance of
efficiency is even stronger, especially in the case of young workers, i.e., those studying
roughly in the same period used for the computation of efficiency scores. It is also
33 No results are presented for a sample including the USA and Japan as we could not find data for U2529ter and U2529sec for these two countries.
63

encouraging that, with only a few exceptions, the significance of efficiency is robust to the
different estimation methodologies discussed in Section 2 (DEA1, DEA2, SFA).
Conclusions in the previous paragraph, however, do not go without some qualifications. First,
the time span considered is rather short (for data availability reasons), preventing us from
explicitly taking account of lagged and dynamic effects through panel data modelling. One
should note, however, that our analysis of the employability of young graduates goes some
way to alleviate this problem, by better aligning the sample years with the likely generation of
labour market effects. Second, the cross-section dimension of the sample becomes quite small
in some specifications, and results are sometimes sensitive to whether the USA and Japan are
included or not (though their exclusion can be plausibly justified on grounds of their much
smaller public share in total tertiary education spending). Finally, and as regards the failure to
find significant impacts of public spending by itself, one should note that our specification for
employability does not easily lend itself to the detection of such an impact: for instance,
higher spending probably implies more abundant graduates, and therefore a supply-side
increase in their unemployment risk. Therefore, though efficiency matters, it would be rash to
conclude that only efficiency matters, dismissing the amount of spending as irrelevant.
64

Conclusions By estimating efficiency of tertiary public education provision across countries, with proper
assessment of variables that explain inefficiency, and also by studying the effectiveness of
public spending on higher education, a number of conclusions are warranted. These are:
Inefficiency in spending is an important issue when it comes to public tertiary education. In
both our approaches, semi-parametric and stochastic frontier analysis, we could estimate a
production possibility or cost frontier, and infer that an important group of countries was
found to be operating under inefficiency conditions irrespective of the methods used. These
were not only South and Eastern European countries, but also some of the more populous EU
member states (France, Germany, and Italy). Also the US public tertiary education sector was
found to be very far from efficiency.
Tertiary education systems in a core group of countries in Europe are clearly more efficient. If
it is a fact that inefficiency is pervasive across Europe, it is also true that some European
countries differ from the rest, in so far as they present clearly better results (outputs) from the
consumed resources (inputs). The UK and to a lesser extent the Netherlands appear at the top
of the efficiency ranking irrespective of method or models used.34 On the other hand, some
countries tend to be consistently placed at the bottom league (the Czech Republic, Greece,
Portugal, and Slovakia).
Tertiary education efficiency is related to institutional factors and also to the quality of
secondary education. The quality of secondary education, as measured by results attained by
students at PISA internationally comparable tests, is one of the factors that is consistently
correlated to country efficiency scores. Other factors pertain to higher education institutional
features. These are:35
- The funding rules followed in each country. When funding to institutions depends more
on outputs (e.g., graduations and publications) and less on historical attributions or
inputs, efficiency tends to increase.
34 This group broadly coincides with those countries mentioned as having a better performance in a recently published Bruegel report (see Aghion et al., 2008). 35 Again, we note a broad correspondence to the factors identified by Aghion et al. (2008).
65

- Evaluation systems. Efficiency tends to be higher in countries where institutions are
publicly evaluated by stakeholders and/or independent agencies.
- Staff policy. Institutions’ autonomy to hire and dismiss academic staff and to set their
wages is correlated with higher efficiency.
Efficient spending matters for labour and total factor productivity. Our analysis of
effectiveness showed that there is a positive correlation between tertiary education spending
corrected by efficiency scores and labour and total factor productivity. This suggests that the
link between resources used in tertiary education and broader outcomes like productivity goes
through efficiency. This is evidence in favour of the greater importance of efficiency in higher
education spending, as it is not only a matter of public finance but also a way of promoting
innovation and growth.
Efficient spending matters for employability. We found that the employability of graduates
increases where tertiary education is more efficient. The difference in unemployment rates
among graduates and among those with secondary education depends positively on country
efficiency scores. This evidence is stronger when young graduates are considered.
Some countries specialise in teaching and others in research. Efficiency analysis showed that
some countries seem to specialise more in research than in the teaching part of tertiary
education. This is the case of the Nordic countries, of Austria, of Belgium and the
Netherlands. Others are more efficient in teaching (Ireland, France, the East European
countries). The United Kingdom was found to be efficient on both accounts.
These conclusions lead us to put forward the following broad policy implications.
Spending increases, if they occur, have to be carefully managed and should go hand in hand
with institutional reforms. From our analysis it becomes clear that better performing countries
are not necessarily those where more resources are spent on higher education. It is efficient
spending that matters. It follows that increased spending will be much more successful in
output terms if it is efficiency enhancing.
Institutional reform of tertiary educational systems should focus on the following points:
66

- promoting accountability of tertiary education institutions, with careful and fair
evaluation ensured by independent bodies;
- increasing competition, by rising the institutions’ autonomy in what concerns staff
policy, namely in its ability to hire and dismiss and to set wages;
- designing financial schemes that relate funding to the institutions’ performance in output
terms, rather than relying in inputs used or in historical trends.
67

Annex. Case studies.
Netherlands
The Netherlands are one of the top performers in the EU higher education system. The
performance in teaching is average in numerical terms, but it is the research dimension that
achieves excellence (see Figure 18). Quality in both dimensions is extremely high. Dutch
performance compares to that of the Nordic countries, namely Denmark, Finland, and
Sweden, but good value for money is one of the main characteristics of the entire Dutch
higher education system.
In what follows, we briefly characterize the Dutch higher education system with the purpose
of identifying best practices.
Brief characterization of the Tertiary education system in the Netherlands
Analysis of the data
The input figures for tertiary education reveal relatively modest scores. The number of
academic staff per 1000 inhabitants was 2.18 in 2005, slightly above average, whereas
countries like Sweden (3.66) and Finland (3.42) have higher numbers. The number of students
per member of 1000 inhabitants was 34.6 in 2005, again close to the average value of 35.7.
Total annual investment in education is just below EU average, even though public
expenditure on PGD institutions is quite high (333.7 against an average of 242.1 real Euros
PPS per capita).
Regarding outputs, by reviewing an indicator of the ‘graduation ratio’ (the relationship
between the number of graduates and the number of students) the Netherlands are an average
performer, since in 2005 about 20% of the students graduate, whereas in the UK the score is
27.7% and in Japan, the incontestable leader, the score is 53.4%. Quality indicators, however,
show that the Dutch students are perceived to be among the best. In fact, the Netherlands are
placed third in the recruiter review country indicator, just below Ireland and the UK, and
fourth in the peer review country indicator, below the Nordic countries.
68

In research, the score of the Netherlands is excellent. The number of scientific publications
per 1000 inhabitants was 0.96 in 2005, quite above the average score of 0.54 for the sample
total and only surpassed by the Nordic countries (Sweden, Finland, and Denmark). This fact
reveals that the Dutch academic staff is more productive than the average in terms of the
number of publications. When one considers the impact of scientific productions, the
Netherlands is among the world top. In fact, it attains the maximum value for the average of
ISI citation index in the period 1998-2005.
The more general picture is that, in comparison to the other countries under analysis,
investment is relatively modest but the output is good and in some cases excellent. The
Netherlands thus have an elaborated and well balanced system of institutions that perform
well under the given circumstances.
As for the factors that may explain such performance, the Netherlands obtain the highest
score for the Staff Policy Indicator and is ranked third in terms of the Evaluation Indicator.
The Funding Rules Indicator is slightly above the average value of 5, whereas the Output
Flexibility Indicator, which appears to be negatively related to efficiency, is 5.9, well below
the average of 6.7.
Structure of institutions and funding arrangements
The higher education system in the Netherlands is nowadays based on a three-cycle degree
system, consisting of a bachelor, master, and PhD. Until 2002, the first two cycles at research
universities were combined in a single integrated cycle.
There are two types of programmes: research oriented education, traditionally offered by
research universities, and professional higher education, traditionally offered by hogescholen,
or universities of professional education. These programmes differ not only in focus, but also
in access requirements, length, and degree nomenclature. Research activities are not
traditionally the task of hogescholen, but of universities, academic medical centres, and
research institutes.
There are thus four categories of publicly funded institutions of tertiary education and
research:
69

- Hogescholen: 44 government-funded hogescholen in total;
- Universities: 14 universities including the Open University, having a task in
education but also in research;
- Academic medical centres: 8 in total, with a triple task: education (bachelor,
master, medical specialists, and PhD), research, and patient care; and
- Research institutes: funding organisations for university research, as well as
highly specialised top quality research organisations themselves.
As for research, the Dutch research system consists of universities, non-university research
institutes, and other research centres (technological institutes). Its heart lies in the universities
and academic medical centres.
Institutions of tertiary education in the Netherlands obtain funds from both public and private
sources. Many publicly funded institutes also undertake commercial activities and receive
tuition fees. The universities speak of three budget streams, two public and one private:
• public formula funding goes directly to institutes of higher education for all their tasks (first
stream);
• another stream of public funding goes via the research council to research proposals in
competition (second stream);
• private income for commissioned research or other tasks (third stream), business.
Thus, investments in research activities consist of public funds and private funds. The public
expenditure for research activities at universities and research institutions amounted to €
3.569 billion in 2003, 0.75% of the GDP but decreasing. This figure is above the average EU-
25 figure of 0.64%.36 Private expenditure on research is more modest. Funding the tertiary
system is primarily a governmental task.
36 Data taken from the OECD Thematic Review of Tertiary Education – The Netherlands (2006).
70

Explanatory factors for efficiency
Four explanatory variables have proved to be relevant in explaining efficiency, namely, staff
policy, output flexibility, evaluation, and funding rules. In what follows, we characterize the
Dutch higher education system along each of these dimensions.
1. Staff Policy
1.1. Hiring/Firing
1.1.1. Autonomy to hire and dismiss academic staff
The Dutch institutions are the decision makers in the field of staff recruitment.
1.2. Wages
1.2.1. Autonomy to set wages
Negotiating terms of employment are delegated to the institutions’ branch organisations (the
association of universities and the association of hogescholen). It is thus an internal affair.
Furthermore, the institutions of tertiary education and research are autonomous for spending
their formula funding received from the government for recruitment of personnel and working
conditions.
2. Output Flexibility
2.1. Course content and exams
2.1.1. Autonomy to set course content
The actual content of curricula and research programmes is up to the institutions themselves,
with the remark that the NVAO (the Accreditation Organisation of The Netherlands and
Flanders) checks if the profile of a programme is geared to the labour market versus more
academically oriented. Furthermore, certain requirements (e.g., those of the accreditation)
have to be met in order to receive public funding. And steering at a central level is
accomplished by means of financial incentives (as described below in the section on public
funding).
71

2.1.2. Are there academic fields for which the final exam and/or the study
programme are the same in all tertiary education institutions throughout the
country/jurisdiction?
The law regulates several aspects of the institutions of tertiary education and research.
Namely, each programme is obliged to have a specific ‘education and exam regulation,’
which governs the content of the curriculum and the procedures concerning exams. Still,
defining study programmes and exams are set by the institutions themselves.
2.2. Offer of short studies
2.2.1. Do tertiary education institutions offer short study programmes (max. duration
below 3 years)?
In the period of time under analysis in this report there were no short study programmes
offered. Still, short courses with a duration of 2 years, complying with the level descriptor for
short higher education in the Bologna framework, became available in hogescholen from
September 2006 onwards. This change was due to labour market demand and to the fact that
the Netherlands seemed to have a lack of diversity within qualifications - with only bachelor,
master degrees, and PhD - when compared to other European countries.
2.3. Student Choice
2.3.1. Do tertiary education institutions admit part-time learners, distance-learners,
and learners with professional experience (outside the usual enrolment
requirements)?
Part-time education is offered, namely at hogescholen, as well as dual education, which
combines study and work in the same area. Moreover, the Open University, a public funded
university, has been providing distance-learning courses in higher education since 1984. The
Open University offers full degree courses, but students can also take part of a course or a few
subjects only.
Not only secondary education provides a basis for tertiary education. Some learners that have
had ‘less’ formal education, but acquired enough skills and knowledge to enter higher
72

education through their working experience, are admitted after an entrance examination. The
Open University even offers some courses, which have no entrance requirements.
2.4. Regional Mobility
2.4.1. What is the percentage of students enrolled into tertiary education institutions
outside their region of high-school graduation?
In what international mobility is concerned, the numbers of foreign students in the
Netherlands is well below OECD level and is a fraction of the figures shown by countries
such the UK, Belgium, and Germany. The average percentage of foreigners has grown from
2.98% in 1999 to 4.04% in 2003. The number of foreign students in universities is higher
(5.6%) than in hogescholen (3.17%). Both figures have grown steadily over the reported
years.
2.5. Existence of numerus clausus
2.5.1. Are there academic fields into which entry is restricted or rationed by
national/regional regulations?
A numerus clausus set by the government (ministers of Education and Health jointly) exists
only for students in medicine, dentistry, and some paramedical programmes. However,
legislation allows central government to set a maximum enrolment number for certain courses
based on labour market considerations. This is the case of the programmes in the arts (music,
fine arts). Otherwise, higher education institutions are obliged by law to admit any student
with the required secondary school certificate.
3. Evaluation
The aim of the Dutch higher education institutions is laid down by law: universities have aims
in terms of research and education, hogescholen primarily in education. How they do this is
their own responsibility. Nevertheless, quality assurance is obligatory.
73

3.1. Institutional evaluation
There are a number of actors involved with surveillance and control, namely, NVAO (the
Accreditation Organisation of The Netherlands and Flanders), the inspectorate of higher
education, and the accountancy division of the ministry.
3.1.1. Ministerial oversight
The inspectorate of higher education is an independent part of the ministry. Its task is to check
if institutes abide with rules and regulations, and to oversee the functioning of the system.
The accountancy division of the ministry checks whether the expenditure of both ministry and
institutions complies with the financial regulations.
3.1.2. Evaluation by an independent agency
3.1.2.1.Teaching
Until 2002, the institutions of tertiary education and research themselves (through their
respective branch organisations, the association of universities and the association of
hogescholen) organised the quality assurance. They had developed a system (originating
around 1990) in which self-evaluation was complemented by ‘peer review.’ Results had to be
made public by law. The Minister of Education was still responsible for the quality of (higher)
education, and had the right to intervene in the case of serious concern about the quality of a
programme or the quality assurance system. But on the whole the institutes themselves were
responsible for quality assurance.
In 2002 there was an important change in the quality assurance system for higher education
(at both hogescholen and universities). The way quality assurance was organised changed into
a system of accreditation of programmes, in order to be more internationally comparable.
In this new system, NVAO (the Accreditation Organisation of The Netherlands and Flanders)
awards accreditations to programmes, based on a report produced by an independent
assessment organisation. Existing programmes have to be accredited every 6 years. New
programmes have to be accredited before students can be registered. If a programme is not
74

accredited, it will lose the right to public funding and the right to award degrees.
Accreditation organisations evaluate six main areas: goals, programme (must have
relationship with research in the case of universities, or with professional field in the case of
hogescholen, must be coherent), staff (must be of sufficient quantity and quality), facilities
(sufficient material facilities and tutoring), internal quality assurance (systematic evaluation
of the programme, in which judgments of staff, students, alumni, and professional field must
be incorporated), and results (quality of graduates must meet minimum standards, and output
in terms of graduates must meet target figures based on comparable programmes).
3.1.2.2.Research
Quality assurance of research is organised through the ‘Standard Evaluation Protocol for
public research organisations’ and handled by the universities in interaction with the KNAW
(Royal Academy of Science) and NWO (Research Council).
This protocol provides both the procedures for assessing the quality of research and the
criteria that are used. The main criteria are quality (international recognition and innovative
potential), productivity (scientific output), relevance (scientific and socio-economic impact),
and vitality/feasibility (flexibility, management, and leadership).
All universities are obliged to evaluate their research activities every three years.
Additionally, every six years an external committee – completely independent of the research
institutes involved – assesses these research activities. The external assessment covers both
the content of the research programme and the management, strategy and mission of the
research centre where it is carried out. The results are made public, serving the accountability,
and they are also used as a management tool by institutes.
In conclusion, assessment of research quality is still very much performed by the sector itself.
Together with the competitive allocation of research council funds, described in section 4.1
below, there is adequate steering on quality of research.
75

3.2. Stakeholder evaluation
3.2.1. Students’ evaluation
On a yearly basis, a large survey among students in tertiary education programmes is
conducted in both hogescholen and universities. Students assess the quality of their
programme on a standardised number of topics. An overview of the results aimed at future
students is then compiled giving information on the quality of programmes, which also serves
as a benchmark instrument for the institutes themselves.
3.3. Labour market
Even though a number of measures aim at reconciling the number of students in different
disciplines supplied by the higher education sector and labour market demand, no formal
quality assessment exercise is made by employers. In fact, systematic evaluations for the
entire spectrum of courses in tertiary education do not exist in the Dutch system.
3.4. Public Information
3.4.1. Outside observers (e.g., rankings in news magazines, international
organisations)
Evidence of the quality of Dutch tertiary education is found in several international university
rankings. In rankings such as the Academic Ranking of World Universities 2005 or the Times
Higher Education Supplement (2004) the position of Dutch institutions is good. In some
areas, they do perform in the first rank in a European context (10 of 13 universities in the
European top 100, 12 of 13 appear in World top 500).
3.5. Are the results of the quality assessments to be made publicly available?
Before 2002, peer review results were made public by law. After this date, quality assurance
results obtained though institutional evaluation have been used to fill a database providing
information on study programmes. Also, the results of the students’ assessment are publicly
available.
76

4. Funding rules
As mentioned above, there is a system of three streams of money. The first stream is the
stream directly financed by the Minister of Education, Science, and Culture. The second
stream is the NWO (the Dutch organisation for Scientific Research) and KNAW funding. The
first stream is about twice the size of the second stream. The third stream consists of direct
commissions for research and education from private companies, central government, the EU,
and NGOs.
4.1. Public funding
The first stream of money crucially depends on the registered number of students and number
of diplomas (successful completions), the latter having the biggest weight in the funding
formula. It is thus mainly output oriented. The formula funding also envisages maintenance of
buildings and includes a budget for (fundamental) research that is based on history.
Unlike the funding mechanisms of education, which are largely based on output, the
distinctive feature of the second stream of money to finance research is competition on the
basis of scientific quality (peer reviews). The amount a university acquires in the second
stream depends on the quality of the research proposals. Through the second stream central
government is thus able to influence competition and quality aspects of research.
NWO (the abbreviation for the Dutch organisation for Scientific Research) is the organisation
that, besides governing several research institutes, allocates research funds to universities.
Three allocation procedures are used by NWO:
- Fixed budgets for scientific priorities: NWO identifies promising scientific
fields, describing the kind of research to be performed;
- Specific programmes: to stimulate talented young scientists or specific target
groups (ethnic minorities, women);
- The ‘open competition:’ for which scientists in all fields can submit research
proposals that are evaluated by experts and awarded grants when among the
most promising.
77

4.2. Do the results of quality assessments have an effect on funding decisions?
NVAO (the Accreditation Organisation of The Netherlands and Flanders) determines whether
a programme meets the requirements for government funding. All Bachelor and Master
Programs at Dutch universities and hogescholen need to be accredited in order to (continue
to) receive part of the government budget.
4.3. Private funding
4.3.1. Tuition fees and/or households
Funding by students consists primarily of tuition fees. With some exceptions the tuition fee
set by the government was € 1496 in the academic year 2005-06.
4.3.2. Business, abroad, other
Contributions by companies are primarily made in terms of research assignments. Like all
other continental European countries, the Netherlands does not have a history of companies
contributing directly to the higher education institutions by making donations. Through
participation in dual courses, giving access to research facilities, commissioning research and
other contacts, companies do, however, play a vital role in the system. Still, the contribution
made by private businesses to research activities is far below average compared to other
OECD countries
5. PISA
The Dutch secondary system is performing among the best measured by the international
PISA benchmark. Practically all graduates from secondary education progress into further
education, mostly into hogeschool or university. Access is irrespective of gender or socio-
economic background.
78

United Kingdom
The United Kingdom appears in our analysis as top performer, both when we consider only
research outputs and only teaching outputs, as can observed in Figure 18. It is hence
important to analyze closely the British tertiary education system to identify the conditions
that contribute to this success.
Brief characterization of the Tertiary education system in UK
Analysis of the data
Some analysis of the data may provide insights on why the UK achieves such high levels of
efficiency. In what concerns inputs we observed that Academic staff per 1000 inhabitants is
low compared to the average of the countries considered in the study (1.55/1.97). On the
contrary the number of students per 1000 inhabitants is higher than average, which implies
that there is a high ratio of Students per Academic Staff. Although this could be considered as
a negative feature for producing graduates, observing the outputs we have precisely the
opposite: in the indicator of Graduates per 1000 Inhabitants, UK is placed third and it presents
the highest level of Graduates per Academic Staff. So, we have that few academics per
student are able to produce a high number of graduates. Moreover, quality indicators also
show that graduates of UK institutions are perceived as the second best by recruiters whe
compared to the other countries’ graduates. This can be explained both through the efficiency
of academic staff and by the a priori quality of students as indicated by PISA scores, where
the UK are placed second after Japan.
Considering the second output of Tertiary Institutions, research, UK has the sixth highest
number of publications per 1000 Inhabitants. Also these publications have a high quality
measured by the average number of citations (ISI citation index of 5 on an average of 3.55).
Regarding the explanatory factors found relevant for efficiency, we find that the UK has the
highest scores for the Staff Policy Indicator and the Evaluation Indicator. As for funding
rules, the score is not as high, with UK in the 7th position with a score of 5.5 (the average is
5.0).
79

Structure of institutions and funding arrangements
In UK, higher education is provided mainly in universities and higher education colleges. All
these institutions receive public funds but are independent and self-governing.37 The
expenditure on PGD in the UK as a percentage of GDP is one of the highest among the
European countries. In 2005, UK was fourth in this indicator, after Finland, Denmark, and
Sweden. However UK universities are not exclusively public funded. The funding is also
complemented by non-government funding, which represents around 40% of total funding as
can be observed in Figure 21. Part of the non-government funding comes from private tuition
fees.
FIGURE 21: SOURCES OF INCOME OF UNIVERSITIES AND COLLEGES IN THE UK (2005)
Source: Higher Education Funding Council for England publication 2005/10.
Also from Figure 21 we observe that around 40% of the total higher education institutions’
funding is of the responsibility of higher education Funding Bodies, independent from the
government. This has been a tradition of the British system since 1970, and it prevents
political influences on the funding of individual universities.
Governance and regulatory framework
Since 1991, the UK has abolished the difference between Polytechnic Institutions and
Universities, creating a single sector of teaching and research institutions. The objective was
to foster competition between a wider range of institutions such that it would lead to increased
efficiency and effectiveness.
37 There is a very small group of private colleges, government independent, which provide academic programmes for about 0.3-0.5% of all higher education students, mainly in medical-related, business, or theological subjects.
80

This measure led to the creation of 30 new universities. Criteria were set for higher education
colleges to gain their own powers for awarding degrees and for gaining university status.
The specific roles of the Government, Funding Councils, and individual institutions are
specified by law.
1) The Government sets the total funding for universities and has the power to set
conditions to the Funding Councils covering national developments that it wishes to
promote. The Government is not however able to determine the general (or block)
grants to individual universities or to intervene in such areas as the content of
academic programs, the appointment of staff (including Vice-Chancellors), or the
admission of students.
2) The Funding Bodies advise the Government on the needs of higher education and
allocate available funds for teaching and research. They also have responsibility for
promoting high quality teaching and research, encourage interactions with business
and the community, promote widening access and increasing participation, inform
students about the quality of higher education available, and ensure the proper use of
public funds.
3) Each institution has a governing body who sets the mission and strategic plans and
also monitors, supports (and, if necessary, challenge) the performance both of the
institution, and of the Vice-Chancellor and senior colleagues. The governing bodies
provide the first line of accountability in terms of ensuring that institutions meet the
needs of students, local communities, and society (including employers) at large.
4) The National Audit Office (NAO) audits the expenditure of higher education
institutions.
5) The Quality Assurance Agency for Higher Education (QAA) ensures the external
quality of higher education. It is independent of UK governments and is owned by the
organisations that represent the heads of UK universities and colleges. The QAA’s
role is to judge how well institutions fulfil their responsibility for managing the
academic standards and quality of their awards.
As already mentioned, the advantage of the existence of Funding Councils is that decisions
about funding for individual universities are not subject to political pressures. The main factor
for allocating funds for teaching is the number of students completing a specified element of
their program. Funds for research are linked closely with the assessed quality and volume of
81
research. Hence the allocation of funds will influence significantly the relative emphasis on
teaching and research in individual universities. One potential disadvantage of the separate
Funding Bodies is the excessive bureaucracy. To limit this effect, the UK Government has an
active policy toward reducing imposed bureaucracy on public institutions.38
In addition to the funds from Funding Bodies, institutions may apply for research grants from
the Research Councils, the European Union and other bodies. They are also encouraged to
raise their own funds, for example through the recruitment of overseas students, the
development of short professional courses, the setting up of science parks for external
companies, the creation of university companies, or donations from alumni.
Explanatory factors for efficiency
1. Staff policy
1.1 Hiring/Firing
1.1.1 Autonomy to hire and dismiss academic staff
Universities and colleges determine the criteria for appointing and promoting staff. These
depend on the missions of individual universities and colleges. Generally, more emphasis is
being placed on teaching quality and contributions to business and the community. Whenever
recruitment problems exist, universities may adopt special measures to recruit staff – such as
employing staff in employment elsewhere to teach part-time.
1.2 Wages
1.2.1 Autonomy to set wages
As private sector institutions, the universities and colleges have considerable autonomy in
what concerns wage definition. They set their own salaries, although the majority chooses to
work with other institutions to agree common salary scales for all but the senior staff.
Universities are also allowed to reward excellence in teaching and research, according to their
own set of rules and objectives.
38 It has been estimated by the Higher Education Funding Council for England that the cost of bureaucracy for English universities and colleges has been cut by 25% in the four years to 2004 and there is a similar target for the next four years.
82

2. Output Flexibility
2.1 Course content and exams
2.1.1 Autonomy to set course content
Each institution reviews and determines its own set of academic programs and course
contents in line with the strategy that it has set itself and its assessment of demand from
students. It also determines its emphasis on pure and applied research, having regard to its
assessment of the scope for obtaining funds for research.
2.2 Offer of short studies
2.2.1 Do tertiary education institutions offer short study programmes (max.
duration below 3 years)?
Typical courses last for three years (if taken full-time) and lead to a Bachelors degree with
Honours, having a title such as Bachelor of Arts or Bachelor of Science. Also at this level
there are short courses and professional 'conversion' courses, based largely on undergraduate
material, and taken usually by those who are already graduates in another discipline, leading
to Graduate Certificates or Graduate Diplomas.
Foundation degrees are two-year degrees, which aim to give people the intermediate technical
and professional skills that are in demand from employers, and to provide more flexible and
accessible ways of studying.
There are also short courses at the Masters level often forming part of Continuing
Professional Development programmes and leading to Postgraduate Certificates and
Postgraduate Diplomas.
2.3 Student choice
2.3.1 Do tertiary education institutions offer a range of courses within each
study programme among which students can choose?
Yes, higher education institutions offer a range of courses and short courses within each study
programme.
83

2.3.2 Do tertiary education institutions admit part-time learners, distance-
learners, and learners with professional experience (outside the usual
enrolment requirements)?
Part-time studying and distance learning is a reality in UK higher education institutions as
there has always been a substantial number of adult students taking degree qualifications part-
time. In Figure 22 we observe that roughly one fourth of all students are part-timers. The new
Foundation Degrees may be attractive to more adults studying part-time. Individual
institutions set their own level of fees for part-time courses. Apart from distance learning,
competition is more restricted than for full-time courses because most part-time students
study locally. The fees depend more on what students or their employers are willing to pay.
Although the numbers of students are close to the numbers of full-time students, the fee
income is substantially less because part-time fees reflect the part-time teaching and learning
requirements. Many other universities and colleges provide some courses through distance
learning, including e-learning.
FIGURE 22: FULL-TIME AND PART-TIME STUDENTS IN UK INSTITUTIONS
2.4 Regional mobility
2.4.1 What is the percentage of students enrolled into tertiary education
institutions outside their region of high-school graduation?
Groups of universities and colleges are being formed on a regional basis with the aim of
making a maximum contribution to the local and regional economy. However, certain regions
are still net importers of students, as for example, Yorkshire, North East, East Midlands, and
North West.
84

FIGURE 23: REGIONAL FLOWS OF STUDENTS IN UK
Source: OECD- Thematic Review of Tertiary Education
2.5 Existence of numerus clausus
2.5.1 Are there academic fields into which entry is restricted or rationed by
national/regional regulations?
The UK is regarded as having a highly selective system with fixed numbers for every course
and different levels of additional selection procedures. However, there are also well-
developed alternative routes into higher education, namely through part-time courses.
3. Funding rules
3.1 Public funding
There are four stages in calculating the main element of the Higher Education Funding
Council for England allocation of teaching funds:
85

FIGURE 24: STEPS IN THE CALCULATION OF THE FUNDING FOR TEACHING
Source: OECD- Thematic Review of Tertiary Education
Public funding of research in distributed by the Office of Science and Technology to the
different Research Councils aiming to support specific research and programmes across the
UK, much of it on the basis of competitive bids from researchers in universities and colleges.
FIGURE 25: SOURCES OF RESEARCH INCOME
Source: Higher Education Funding Council for England Guide 2005/10; figures in £ million
The instrument for the allocation of research funds is the Research Assessment Exercise
(RAE). The RAE has two purposes. First, it provides comprehensive information on the
quality of UK research in every subject area. Secondly, it provides a basis for the allocation of
funds in line with the government’s policy. The RAE outcome determines the main allocation
86

(90%) of research funds by the Funding Councils. The precise formula varies between the
Funding Councils, although each formula is based on a link between funding and research
quality. The allocations for research differentiate significantly according to the assessed
quality of research.39
3.2 Outcome oriented
3.2.1 Funding depend on the number of graduates and/or completed PhDs
The main factor for allocating funds is the number of students graduating from specific
courses.
3.2.2 Public funding depend on the number of publications
Funds for research depend on the number of publications and quality of these publications.
3.2.3 Public funding depend on other outputs
Funds for research are linked closely with the assessed quality and volume of research.
3.2.4 Funding depend on outcomes (e.g., final marks, results of evaluations
by external commissions or students; quality-adjusted number of publications).
An incentive is the funding available to reward good teaching alongside the negotiated
settlements for academic pay. There are initiatives also to raise the status of teaching in higher
education – the selective National Teacher Fellowships and associated monetary prizes, the
designation of Centres for Excellence in Teaching and Learning (CETLs), and raising the
status of the profession of teaching.
3.2.5 Do the results of quality assessments have an effect on funding
decisions?
Quality assessments are the main instrument for allocation of funding.
39 In England, nine universities out of over 130 institutions receive about one half of the total funding allocated on the basis of research quality. At the other end of the spectrum, many universities receive funding in recognition of high quality research in one or two subject areas; and a few may not receive any RAE funding.
87

3.3 Private funding
3.3.1 Tuition fees and/or households
3.3.1.1 Funding from tuition fees
Higher education institutions have always charged tuition fees for part-time undergraduate
students and postgraduate students. There have been tuition fees also for full-time home
undergraduates for over 50 years. The full-time fees varied between some 10-20% of the
average costs of tuition and were paid in full for most students as part of the student
maintenance grant. In 1998, the Government decided to set a tuition fee of £1000 for full-time
undergraduate students. For the first time, these fees would be paid by students or their
parents. Institutions charging higher fees than at present are required to use part of the extra
income to support wider access. Subsidised loans will be available to meet the cost and will
be repaid after graduation according to a graduate’s income.
4. Evaluation
The Evaluation of Higher education in UK is very well developed. There exist several
mechanisms for this evaluation:
a) The Funding Bodies have established a system of subject review of teaching and
learning in both the new and existing universities for each subject. The subject reviews
included observation of teaching and were carried out by panels comprising mainly
senior academic staff appointed by the Funding Bodies. The functions of subject
review and audit were later managed by the Quality Assurance Agency.
b) Research Assessment Exercise (already mentioned) evaluates the Research being done
in each institution.
The results of the evaluation are regularly published under Teaching Quality Information
(TQI). The purpose of TQI is to make available accurate and up-to-date information about
quality and standards to potential students and other stakeholders, such as employers. The
TQI consists of quantitative and qualitative data published for each HEFCE funded
institution.
The results of the RAE are also publicly available.
88

Portugal
Portugal appears in our analysis as a poor performer, both when we consider only research
outputs and only teaching outputs, as can observed in Figure 18. Other countries have similar
performances like Bulgaria, Estonia, Greece, Hungary, and Spain. It is important to analyze
closely one of these underperforming countries to identify the conditions that contribute to the
inefficient use of resources. We analyze the case of Portugal.
Brief characterization of the Tertiary education system in Portugal
Analysis of the data
Some analysis of the data may provide insights on why Portugal is not able to obtain high
levels of efficiency.
In what concerns inputs we observed that Academic staff per 1000 inhabitants is above
average (2.0/1.9). On the contrary the number of students per 1000 inhabitants is a lot below
average, which implies that there is a low ratio of Students per Academic Staff. Although this
could be considered as a positive feature for producing graduates, observing the outputs we
have precisely the opposite: Portugal graduates an average of 5.2 individuals per 1000
inhabitants, a low number compared to the average (6.9). Also concerning the indicator of
Graduates per Academic Staff Portugal fairs poorly (2.573 as compared to an average of
3.599). So, we have that a high number of academics per student produce a small number of
graduates. Moreover, quality indicators also show that graduates of Portuguese institutions are
not particularly perceived as high quality by recruiters (standardized recruiter review places
Portugal in the middle of the rankings).
These results can be explained by the a priori low quality of students as indicated by PISA
scores, where Portugal is placed in the second last position (last position is occupied by
Romania).
Considering the second output of Tertiary Institutions, research, Portugal has 0.42
Publications per 1000 inhabitants, a value which is below average (0.541). Although these
89

figures have improved in time, some work has to be done in what concerns improving the
quality of research. Portugal occupies the 17th position in the ISI citation index.
Regarding the explanatory factors found relevant for efficiency, we find that Portugal has the
highest scores for the Funding Rules Indicator signifying that funds are allocated effectively.
However Portugal appears third from last in the Evaluation Indicator. Regarding the Staff
Policy Indicator, Portugal is below average, which is a reflection of the low autonomy that
TEI have on hiring/dismissing staff, promoting and establishing incentives and salaries.
Structure of institutions and funding arrangements
Portugal has a binary system integrating universities and polytechnics, both public and
private.
Public universities have pedagogical, scientific, and financial autonomy. Although with
increasing importance, research in universities is still relatively undervalued in comparison
with teaching. Polytechnics are expected to have stronger vocational character than
universities and to develop applied research activities, with closer ties to regional and local
authorities. Polytechnics are also expected to play a role in regional development.40
FIGURE 26 - EVOLUTION OF THE OVERALL NUMBER OF STUDENTS
(GRADUATE AND POST-GRADUATE)
ENROLLED IN HIGHER EDUCATION IN PORTUGAL, 1990/91 – 2005/06
Source: OECD-Thematic Review of Tertiary education
Country Background Report: Portugal
40 This explains why the legislation imposes that local authorities play a role in the polytechnics’ governance bodies and that these institutions can set a number of vacancies for students from the respective region.
90

The expenditure on PGD in Portugal as a percentage of GDP is slightly above average
(around 5%). Universities also obtain funds non-public sources, namely fees, earned income
and investment, as can be observed in Figure 27.
FIGURE 27: RELATIVE WEIGHT OF DIFFERENT TYPES OF INCOME IN PGD (2004)
57%
26%
7%
The relative weight of different types of incohigher education institutions 2004
Source: OECD-Thematic Review of Tertiary education
- Country Background Report: Portugal
Non-government funding constitutes around 40% of total income, 25% of it coming from
fees.
Governance and regulatory framework
The purpose of this section is to describe the system of governance and regulation in higher
education in Portugal. It also seeks to present significant policy measures that ensure the links
between the parts of the system.
1) The government through the Ministry of Science, Technology and Higher Education is
responsible for establishing the macro level policies for science, technology and
higher education. The Ministry has several policy tools to steer and manage the
research and higher education system.
a. the most important are the control over the distribution of resources (both the
current yearly budget as well as the budget for investments in new buildings),
b. the definition of research priorities,
c. the power of decision about the creation of new institutions (both public and
private),
d. the control of the number of the academic and non-academic staff of public
institutions,
91

e. the decision on new proposals for study programmes made by public
polytechnics and the private sector,
f. the determination and setting of the numerus clausus system that allows for the
control of the size of the system.
g. negotiating collectively the salaries of academic and non-academic staffs of
public institutions, who are civil servants.
2) Public institutions can determine study programmes including curriculum content,
staff recruitment and promotion, the internal distribution of resources and have degree
granting power. Public universities have additional autonomy as they can decide on
the creation of new study programmes.
3) Private institutions have complete discretion over their resources, staff recruitment
including work and salary conditions.
4) The Foundation for Science and Technology (FCT), created in 1995, has the mission
of mission of promoting the advancement of scientific and technological knowledge in
Portugal. It exploits and promotes the opportunities with the potential to meet the
highest international standards for the creation of knowledge in different domains.
FCT is currently dependent on the Ministry of Science, Technology and Higher
Education. FCT’s mission is:
a. promotion of advanced human resources training, through the continued
funding of postgraduate awards, mainly for the preparation of doctorates and
post-doctoral research;
b. funding of scientific research and technological development projects in all
scientific areas;
c. support for the development and management of R&D infrastructures;
d. promotion of the mobility of researchers;
e. promotion of scientific communication through the funding of a series of
activities aimed at promoting communication between scientists and
disseminating the national scientific production. This includes support for
participation at scientific meetings, production of scientific periodical and non-
periodical publications and funding of scientific societies.
FCT’s mission is mainly carried out through the award of funding, decided upon after
considering the merits of the proposals submitted for its approval, which are usually
promoted by scientific institutions, research teams or duly qualified citizens.
92

System’s weaknesses
1) Lack of effective regulation:
The system grew without adequate regulation, resulting in a network of institutions
and study programmes that in most cases do not correspond to the government
priorities (to increase the number of graduates in key social and economic areas
relevant for the country’s development, to increase the diversity of higher education
provision, to ensure a balanced geographical provision of higher education and to
open the system to students from all socio-economic backgrounds).
2) Contradictions between the increasing autonomy conceded to the institutions and the
traditionally centralized and over-bureaucratic system.
3) Little coordination between the different sectors of the higher education system
(universities and polytechnics, public and private institutions) and between institutions
in the same sector.
4) Historical organizational issues. Previous to 1974, higher education was little
developed and access to it was not broad. In the aftermath of the revolution there was
an uncontrolled expansion of enrolments and the system became increasingly difficult
to manage. A consequence was the hiring of a large number of academics, some of
which lacking the qualities for the enhancement of appropriate research and teaching.
The organisational problems were exacerbated by lack of tradition in evaluation and
accountability, which made it quite difficult to assess reforms and their effectiveness.
5) Deficient system of incentives for academics. Civil servants have their salary levels
collectively set and never individually negotiated. Financial incentives or benefits
such as bonuses are not available. Reward systems are quiescent and competition
reduced to limited promotion opportunities at the higher levels of the career structure.
To become a tenured faculty member, it is necessary to be hired in the academic
career, to hold a PhD degree (universities) or a master degree (polytechnics), and to
have some professional activity (usually 5 years) in teaching and research activities.
University staff have an extremely high teaching load (6 to 9 hours a week), as
compared to other countries in our study.
6) Low qualification of academic staff. Although increasing, the percentage of academic
staff with a PhD is still low by international standards.
7) Poor graduation rates. Graduation rates are a measure of the success of education
programmes and of pedagogical efficiency. There are several social, economic,
93

psychological, and organisational reasons for not completing higher education. A
relevant one is the access system to higher education based on numerus clausus, which
often implies students to enrol in degrees, which are far from their study interests.
Another reason concerns low levels of attainment in secondary education.
Explanatory factors for efficiency
1. Staff Policy
1.1. Hiring/Firing
1.1.1. Autonomy to hire and dismiss academic staff
There are hiring restrictions in place on the number of permanent staff. Staff increase will
usually require the consent of the Ministry of Finances, which may be difficult to obtain in
periods of financial stringency. Moreover, the academic, administrative and technical staffs in
the different scales (full professor, associated professor, administrator, etc.) are set by law in
all public higher education institutions.
In contrast, private institutions have complete autonomy on personnel matters, namely in what
the nature and duration of contracts is concerned.
1.2. Wages
1.2.1. Autonomy to set wages
All members of the academic staff in public universities and public polytechnics are civil
servants, having their salary levels collectively set and never individually negotiated.
Financial incentives or benefits such as bonuses are not available, so that competition is
reduced to limited promotion opportunities at the higher levels of the career structure.
In contrast, private institutions can negotiate salary levels.
2. Output Flexibility
2.1. Course content and exams
2.1.1. Autonomy to set course content
94

The autonomy of public universities is sanctioned by the Constitution and the University
Autonomy Act (Law 108/88) in principle confers public universities a high degree of
autonomy, including pedagogical, scientific, financial autonomy and all the buildings have
been transferred to the ownership of the institutions.
The University Autonomy Act (1988) and the Polytechnics Autonomy Act (1990) granted
significant levels of autonomy to the public higher education institutions, especially to
universities.
Universities have the right to create, suspend, and cancel courses; to design study
programmes and subject contents, to define educational methods, select methods of
evaluation, and new pedagogical experiments; the freedom in teaching and learning.
Still, new degrees must be registered with the Ministry. Registration can only be rejected if
the degrees are considered illegal (for instance because of duration or number of credits).
Public polytechnics are less autonomous, being required to ask for prior Ministry approval to
create, suspend, or cancel study programmes
Private institutions of higher education have a high degree of autonomy, but are still obliged
to get permission from the Ministry before starting any new degree or changing their study
programmes.
2.2. Offer of short studies
2.2.1. Do tertiary education institutions offer short study programmes (max. duration
below 3 years)?
Short cycle technological specialisation courses were recently strengthened but they are still
not well established.
2.3. Student Choice
2.3.1. Do tertiary education institutions offer a range of courses within each study
programme among which students can choose?
95

In Portugal, the study programmes have been officially organised in credits since 1980, but
only recently has this system become compulsory. Moreover, in many cases, assignment of
credits to a course tends to be based on a rather rigid way of counting the number of
classroom hours of teaching, without consideration for the student’s actual workload. Year-
by-year syllabus of courses is often established rigidly for each programme, so that students
are not allowed to stray away from this fixed curriculum. The number of optional credits is
very small and closely related to the programme main theme and in general choice may take
place only in the last year of the programme.
2.3.2. Do tertiary education institutions admit part-time learners, distance-learners,
and learners with professional experience (outside the usual enrolment
requirements)?
Portuguese institutions admit part-time learners and working students, even though the
number of students that fall in these categories is quite low. Moreover, the Open University
for long-distance learning has long been created. Still, lifelong education is still a relatively
underdeveloped area of the Portuguese education system.
Until 2005, students over 25 years of age and without formal qualifications could enter higher
education by sitting in special entrance examinations. Since the number of students using this
alternative entrance road was very limited − representing only 1% of total first year
enrolments in 2004-05 −, in 2006, the government reduced the age criterion to 23 years to
encourage candidates to higher education.
Apart from the special entrance examinations, institutions do not admit students from non-
traditional access routes, and there is no tradition in the area of recognition of informal
training activities.
2.4. Regional Mobility
2.4.1. What is the percentage of students enrolled into tertiary education institutions
outside their region of high-school graduation?
Student mobility in Portugal is rather low and the percentage of students living with parents
remains high. In a similar way, occupancy of student residences covers only about 4% of the
96

overall population in higher education and, therefore, is still comparatively lower than in most
European countries.41
One factor that has contributed to the reduced mobility (after admission in a higher education
institution) is the existing limit to the transfer of students between programmes between
different higher education institutions, which results from the generalised numerus clausus
system. In general, every year each institution opens only a limited number of vacancies for
transfers between programmes and between institutions and students enter a competition to
fill these vacancies.
2.5. Existence of numerus clausus
2.5.1. Are there academic fields into which entry is restricted or rationed by
national/regional regulations?
In Portugal, there exists a generalized system of numerus clausus that allows the state to
determine the maximum number of enrolments in each scientific or professional area.
3. Evaluation
3.1. Institutional evaluation
3.1.1. Evaluation by a government-funded agency
Quality assessment of research centres and their activity is under the supervision of FCT (the
Foundation for Science and Technology). FCT is currently dependent on the Ministry of
Science, Technology, and Higher Education and its mission is to promote the advancement of
scientific and technological knowledge in Portugal. One of FCT’s tasks is to gather
independent panels of international experts to assess the quality and productivity of research.
The implementation of this assessment model took place in 1996. The third assessment
exercise took place in 2002-2004, focusing on the activities carried out in the period 1999-01,
as well as on the activity plans. One hundred and eighty international experts, including some
41 Data taken from OECD Thematic Review of Tertiary Education – Country Background Report: Portugal, 2006.
97

Portuguese experts working in foreign institutions, made up the panels responsible for the
evaluation.
3.2. Stakeholder evaluation
3.2.1. Students’ evaluation
Every semester, a large survey among students in tertiary education programmes is conducted
in most universities. Students assess the quality of their programme and teaching on a
standardised number of topics.
3.3. Are the results of the quality assessments to be made publicly available?
The reports produced by the assessment panels organised by FCT and the units’ replies are all
made public through the Internet. Funding by the FCT continues to be based on the
assessment evaluation and the rating attributed to the unit.
4. Funding rules
4.1. Public funding
Public funding for higher education teaching and research activities consists of two main
mechanisms:
- Public funding for higher education institutions:
• Direct basic funding to public institutions for teaching (through a funding
formula);
• Contractual funding to public institutions (through contracts for specific
issues);
• Direct funding to students (social support of individual grants);
• Indirect funding to students (includes meals, accommodation, sports and
healthcare).
- Public funding for science and technology:
98

• Direct funding to institutions through R&D units based on periodic
evaluation (through pluriannual funding of FCT, defined upon evaluations
every 3 years);
• Competitive funding for R&D activities (through projects);
• Competitive funding for people (through individual grants for researchers).
The allocation rationale is currently both input and output-oriented and has been changing to
become progressively performance-based. In its 2006 budget, the Government adopted a new
formula that progressively introduced criteria related to quality and performance. Since
nowadays higher education institutions compete for students, so that the number of students
represents some level of performance, the new formula is based on the overall number of
students, but includes the following quality factors:
- Qualification of teaching staff, as measured by the fraction of PhDs in the total
number of teachers of each institution;
- Graduation rate, as measured based on two indicators:
the number of graduates in terms of the first cycle;
and the number of master and PhD degrees awarded.
In addition, the formula includes the following two institutional factors to answer to specific
characteristics of each individual institution and training area:
- Average personnel cost for each institution, to account for the specific
characteristics of the teaching and non-teaching staff of each institution
- Specific student/teacher ratio for each scientific area.
Research funding is mainly a task of FCT, depending on both output quantity and quality and,
in some cases, negotiated on a contract basis with achievement of objectives being a
requirement for future funding.
4.2. Do the results of quality assessments have an effect on funding decisions?
In the case of research, the level of funding always depends on previous assessments.
99

4.3. Private funding
4.3.1. Tuition fees and/or households
Funding coming directly from the government is by far the largest funding source of
Portuguese higher education institutions. Student fees are the third source of funding in
importance and have presented a clear growth pattern in nominal terms in recent years,
especially due to changes in the funding law in 1997 and 2003. However, they still play a
small role for Portuguese public higher education institutions.
4.3.2. Business, abroad, other
The second major source of funding of Portuguese higher education institutions is earned
income (without tuition fees). This funding source has acquired a more prominent role in
recent years and often contributes with about a quarter of the funds to many institutions,
though its importance varies from institution to institution. Some of them, due to their
location, prestige and disciplinary composition, are more successful in obtaining funds
through this source.
As for research, direct funding from industry exists on a small scale.
5. PISA
In 2002 only 13% of the population completed upper secondary education. This low
percentage of upper secondary graduation severely limits enrolments in higher education and
acts as an obstacle to the adoption of organisational structures in higher education that would
allow greater labour flexibility and adaptation, associated with increasingly competitive
markets, and scientific development.
100

References
Abbott, M. and C. Doucouliagos (2003). The Efficiency of Australian Universities: A Data Envelopment Analysis, Economics of Education Review, 22 (1), pages 89-97. Agasisti, T. (2008). Performances and Spending Efficiency in Higher Education: A European Comparison. Agasisti, T. and Johnes (2007). Beyond Frontiers: Comparing the Efficiency of Higher Education Decision-Making Units Across Countries, Education Economics, iFirst, 1-22. Afonso, A. and M. St. Aubyn (2005). Non-parametric Approaches to Education and Health Efficiency in OECD Countries. Journal of Applied Economics, 8 (2), November, pages 227-246. Afonso, A. and M. St. Aubyn (2006). Cross-country efficiency of secondary education provision: A semi-parametric analysis with non-discretionary inputs. Economic Modelling, 23(3), pages 476-491. Aghion, Ph., M. Dewatripont, C. Hoxby, A. Mas-Colell, and A. Sapir (2008). Higher aspirations: An agenda for reforming European universities. Bruegel Blueprint Series, Brussels. Athanassopoulos, A. and E. Shale (1997). Assessing the Comparative Efficiency of Higher Education Institutions in the UK by Means of Data Envelopment Analysis, Education Economics, 5 (2), pages 117-134. Barro, R and J.-W. Lee (2001). Schooling quality in a cross-section of countries. Economica 68, pages 465– 488. Battese, G. E. and T. J. Coelli (1995). A model for technical efficiency effects in a stochastic frontier production function for panel data. Empirical Economics, 20, pages 325–332. Beasley, J. E. (1990). Comparing University Departments, Omega International Journal of Management Science, 18, pages 171-183. Beasley, J. E. (1995). Determining Teaching and Research Efficiencies, Journal of Operational Research Society, 46 (4), pages 441-452.
Biagi, F. and C. Lucifora (2008). Demographic and education effects on unemployment in
Europe, Labour Economics, 15, pages 076-1101.
101

Blankenau, W., N. Simpson, and M. Tomljanovich (2007). Public Education Expenditures, Taxation and Growth: Linking Data to Theory. American Economic Review, 97(2), pages 393-397. Blondal, S., S. Field and N. Girouard (2002). Investment in human capital through upper-secondary and tertiary education, OECD Economic Studies, 34, pages 41-89. Boarini, R. and H. Strauss (2007., The private internal rates of return to tertiary education:
new estimates for 21 OECD countries, OECD Economics Department Working Papers No.
591.
Charnes, A., W. Cooper, and E. Rhodes (1978). Measuring the efficiency of decision-making units. European Journal of Operational Research, 2, pages 429–444. Coelli, T. (1996). A Guide to Frontier version 4.1: A Computer Program for Stochastic Frontier Production and Cost Function Estimation, CEPA working papers, nº7/96, University of New England, Australia. Coelli, T., P. Rao, C. O'Donell and G. Battese (2005). An Introduction to Efficiency and Productivity Analysis, 2nd edition. Kluwer, Boston. Cohen, D. and M. Soto (2007), Growth and human capital: good data, good results, Journal of
Economic Growth, 12: 51-76.
De la Fuente, A. and R. Domenech (2006). Human capital in growth regressions: How much difference does data quality make? Journal of the European Economic Association, 4(1), pages 1-36. Devarajan, S., V. Swaroop, and H. Zou (1996). The composition of public expenditure and economic growth. Journal of Monetary Economics, 37, pages 313-344. European Commission (2007). Key Data on Higher Education in Europe - 2007 Edition. Brussels, Luxembourg. Farrell, M., (1957). The measurement of productive efficiency. Journal of the Royal Statistical Society. Series A 120, pages 253–290 (Part 3). Flegg, A. T., Allen, D. O., Field, K., and Thurlow, T. W. (2004). 'Measuring the efficiency of British universities: a multi-period data envelopment analysis'. Education Economics, 12(3), pages 231 – 249.
102

Hansson, B. (2007). Effects of Tertiary Expansion: Crowding-out effects and labour market matches for the higher educated. OECD Education Working Papers, No. 10, OECD Publishing. doi:10.1787/085513474523. Izadi, H., G. Johnes, R. Oskrochi, and R. Crouchley (2002). Stochastic Frontier Estimation of a CES Cost Function: The Case of Higher Education in Britain. Economics of Education Review, 21, pages 63-71. Johnes, J. (2006). Data envelopment analysis and its application to the measurement of efficiency in higher education , Economics of Education Review, 25, pages 273-288. Johnes, G. and J. Johnes (1993). Measuring the Research Performance of UK Economics Departments: An Application of Data Envelopment Analysis, Oxford Economic Papers, 45, pages 332-347. Joumady, O. and C. Ris (2005). Performance in European higher education: A non-parametric production frontier approach, Education Economics, 13 (2), pages 189-205. Kneller, R., M. Bleaney and N. Gemmell (1999). Fiscal Policy and Growth: Evidence from OECD Countries. Journal of Public Economics, 74, pages 171-190. Kodde, D. and F. Palm (1986). Wald Criteria for Jointly Testing Equality and Inequality Restrictions. Econometrica, 54(5), September, pages 1243-1248. McMillan, M. and D. Datta (1998). The Relative Efficiencies of Canadian Universities: A DEA Perspective. Canadian Public Policy – Analyse de Politiques, 24(4), ages 485-511. OECD (1998). Education at a Glance 1998. Paris. OECD (1999). Education at a Glance 1999. Paris. OECD (2000). Education at a Glance 2000. Paris. OECD (2001). Education at a Glance 2001. Paris. OECD (2002). Education at a Glance 2002. Paris. OECD (2003). Education at a Glance 2003. Paris. OECD (2004). Education at a Glance 2004. Paris. OECD (2005). Education at a Glance 2005. Paris.
OECD (2008). Education at a Glance 2008. Paris.
103

OECD (2000). Knowledge and skills for life, First results from the OECD program for International Student Assessment, PISA 2000. Paris. OECD (2003).Learning for Tomorrow's World: First Results from PISA 2003. Paris. OECD (2006). PISA 2006: Science Competencies for Tomorrow’s World. Paris. OECD (2006). Thematic Review of Tertiary Education: Country Reports UK, Netherlands, and Portugal. Oliveira Martins, J., R. Boarini, H. Strauss, C. de la Maisonneuve, and C. Saadi (2007). The Policy Determinants of Investment in Tertiary Education. OECD Economics Department Working Papers, No. 576, OECD Publishing. doi:10.1787/085530578031. Pereira, J. and M. St. Aubyn (2008). What level of education matters most for growth?
Evidence from Portugal, Economics of Education Review, article in press.
Sarrico, C.S., S. Hogan, R. Dyson, and A. Athanassopoulos (1997). Data envelopment analysis and university selection, Journal of the Operational Research Society, 48 (12), pages 1163-1177. Sarrico, C.S. and R.G. Dyson (2000). Using DEA for planning in UK universities -- an institutional perspective, Journal of the Operational Research Society, 51(7), pages 789-800. Simar, L. and P. Wilson (2007). Estimation and inference in two-stage, semi-parametric models of production processes. Journal of Econometrics, 127(1), pages 31-64. Stevens, P. (2005). A Stochastic Frontier Analysis of English and Welsh Universities. Education Economics, 13(4), pages 355-374. Tomkins, C. and R. Green (1988). An experiment in the use of data envelopment analysis for evaluating the efficiency of UK university departments of accounting, Financial Accountability and Management, 4(2), pages 147-164. Vandenbussche, J., Ph. Aghion, and C. Meghir (2006). Growth, Distance to Frontier and Composition of Human Capital. Journal of Economic Growth, 11(2), pages 97-127. Ventelou, B. and X. Bry (2006), The role of public spending in economic growth: Envelopment methods. Journal of Policy Modeling, 28, pages 403-413. Warning, S., (2004). Performance Differences in German Higher Education: Empirical Analysis of Strategic Groups, Review of Industrial Organization, n.24, pages 393-408.
104

Worthington, A. (2001). An Empirical Survey of Frontier Efficiency Measurement Techniques in Education. Education Economics, 9(3), pages 245-268.
105

Appendix A – Data Remark: In the following tables, data for France, Germany, and Spain refer to public institutions of tertiary education.
TABLE A1– ACADEMIC STAFF IN PGD INSTITUTIONS PER 1000 INHABITANTS
1998 1999 2000 2001 2002 2003 2004 2005
Austria AT 1.80 2.02 na 2.01 2.02 2.08 1.87 1.85 Belgium BE na na 1.61 1.75 1.64 1.71 1.72 1.71 Bulgaria BG na na na na na na 1.69 1.75 Cyprus CY na 1.30 1.22 1.29 1.39 1.58 1.70 1.57 Czech Republic CZ 1.42 1.38 1.39 1.33 1.40 1.40 1.50 1.47 Denmark DK 2.17 na na na na na na na Estonia EE 2.15 2.34 2.24 2.44 na 2.65 2.64 2.65 Finland FI 2.23 2.87 3.04 3.12 3.25 3.34 3.42 3.42 France FR 2.14 1.67 1.63 1.66 1.70 1.74 1.70 1.76 Germany DE 1.93 1.93 1.94 1.94 1.96 2.02 2.04 1.96 Greece EL 1.31 1.37 1.43 1.70 1.49 1.72 1.86 1.91 Hungary HU 1.70 1.80 1.81 1.91 1.97 2.01 2.06 2.10 Ireland IE 1.95 2.04 2.06 2.34 2.46 2.74 2.89 2.31 Italy IT 1.01 1.16 1.19 1.27 1.27 1.39 1.45 1.48 Japan JP 0.88 0.90 0.91 0.92 0.92 0.91 0.91 0.83 Latvia LV 1.56 1.67 1.52 1.77 1.62 1.36 1.38 1.48 Lithuania LT 2.90 3.16 3.17 na 2.79 2.84 2.77 2.77 Malta MT na 0.34 na na 1.57 1.10 1.13 1.67 Netherlands NL 1.59 2.23 2.17 2.21 2.20 2.17 2.18 2.18 Poland PL 1.85 na 1.93 1.96 1.99 2.04 na 2.16 Portugal PT na na 1.91 na na 2.06 2.01 2.02 Romania RO na 0.78 0.85 0.89 0.98 1.07 1.09 1.10 Slovakia SK 1.86 1.73 1.94 1.92 2.03 2.06 2.04 2.05 Slovenia SI 0.91 0.95 0.96 1.06 1.13 1.11 1.57 1.55 Spain ES 1.91 2.00 2.04 2.19 2.36 2.40 2.43 2.47 Sweden SE 3.05 2.88 3.01 3.10 3.35 3.57 3.70 3.66 United Kingdom UK na 1.45 1.47 1.50 1.51 1.53 1.57 1.55 United States US 1.74 1.78 1.80 1.79 1.88 1.95 1.86 1.87 Sources: OECD (Online Education Database – UOE database), Eurostat, and AMECO
106

TABLE A2 – STUDENTS IN PGD INSTITUTIONS PER 1000 INHABITANTS 1998 1999 2000 2001 2002 2003 2004 2005
Austria AT 31.0 31.6 32.6 32.9 27.7 28.3 29.2 29.7 Belgium BE na 34.4 34.7 34.9 35.5 36.1 37.1 37.2 Bulgaria BG 28.4 28.9 28.7 27.8 25.5 25.6 25.2 25.8 Cyprus CY na 7.4 6.6 6.2 7.3 8.1 8.4 8.5 Czech Republic CZ 19.9 21.4 23.3 24.0 25.2 26.3 28.9 29.9 Denmark DK 34.6 35.7 35.4 35.6 36.5 37.4 38.3 38.4 Estonia EE 24.1 26.8 29.6 32.3 34.9 37.4 38.6 39.6 Finland FI 48.5 50.9 52.2 53.9 54.6 55.9 57.4 58.3 France FR 29.4 28.8 28.4 28.1 27.7 28.7 28.9 29.1 Germany DE 24.2 24.0 23.6 23.9 24.8 25.7 26.7 25.2 Greece EL 34.5 35.6 38.7 43.7 48.2 50.9 54.0 58.3 Hungary HU 24.8 27.3 30.1 32.4 34.9 38.5 41.8 43.2 Ireland IE 36.4 37.7 40.1 40.9 42.1 42.7 43.1 41.6 Italy IT 28.6 27.7 29.1 29.6 30.3 31.1 32.0 32.2 Japan JP 6.6 6.7 7.1 7.1 7.2 7.2 7.3 6.4 Latvia LV 26.4 30.7 33.7 37.7 38.4 39.5 40.8 41.0 Lithuania LT 26.4 29.5 33.5 37.5 41.0 46.1 49.6 53.0 Malta MT na 14.9 16.2 18.9 18.3 22.5 19.6 23.4 Netherlands NL 29.4 29.7 30.6 31.4 32.0 32.5 33.4 34.6 Poland PL 24.8 27.4 29.9 33.3 35.8 37.2 38.3 39.2 Portugal PT 22.7 23.5 24.9 26.6 27.5 27.8 27.5 26.8 Romania RO 11.1 12.4 14.4 17.1 20.0 23.2 24.9 26.7 Slovakia SK 20.9 22.8 25.2 26.8 28.3 29.4 30.6 33.7 Slovenia SI 34.2 39.6 41.7 45.4 49.2 49.6 50.6 53.5 Spain ES 39.2 39.5 39.8 39.1 38.3 37.9 37.2 36.1 Sweden SE 31.7 37.8 39.1 40.2 42.9 46.3 47.8 47.3 United Kingdom UK 33.1 35.5 34.4 35.0 37.8 38.4 37.6 38.0 United States US 35.5 35.0 34.4 35.3 42.4 43.8 43.7 43.7 Sources: OECD (Online Education Database – UOE database), Eurostat, and AMECO
107

TABLE A3 – EXPENDITURE IN PGD INSTITUTIONS IN REAL EUROS PPS PER CAPITA
1998 1999 2000 2001 2002 2003 2004 2005
Austria AT 333.00 343.55 302.23 291.09 277.45 284.49 310.69 336.52 Belgium BE 100.06 277.90 309.15 323.42 326.91 310.05 295.81 302.31 Bulgaria BG na 55.82 61.84 65.30 68.82 70.78 68.83 71.40 Cyprus CY na na na na na na na na Czech Republic CZ 94.85 101.84 105.93 116.93 125.26 140.97 150.27 154.06 Denmark DK 353.11 369.98 391.59 447.55 475.05 421.15 451.80 433.81 Estonia EE na na na na na na na 127.70 Finland FI 329.07 365.24 379.78 374.24 383.89 382.58 409.86 401.70 France FR 203.47 210.55 218.03 217.80 219.30 250.23 255.29 260.24 Germany DE 211.34 220.81 221.74 222.33 229.62 246.80 245.72 242.69 Greece EL 156.45 137.00 123.13 168.22 193.77 200.54 239.22 273.17 Hungary HU 93.17 99.54 117.82 125.26 144.12 159.31 135.54 143.31 Ireland IE 276.02 307.81 361.31 327.93 323.18 301.65 319.73 328.32 Italy IT 162.76 181.29 197.72 215.16 210.59 215.24 187.41 196.67 Japan JP 94.48 103.32 109.20 109.59 106.10 116.31 120.88 112.55 Latvia LV na na na na na na na na Lithuania LT na 61.18 57.65 92.52 98.72 117.07 121.27 129.03 Malta MT na 73.40 79.88 105.55 108.77 91.07 91.30 77.98 Netherlands NL 257.55 293.11 303.13 320.10 317.30 314.09 325.37 337.93
Poland PL 92.28 80.17 66.72 93.94 114.98 118.62 126.94 145.69
Portugal PT 130.66 141.57 147.96 156.82 145.98 158.63 159.84 178.97
Romania RO na na na na na na na na
Slovakia SK na 73.06 74.30 89.91 90.87 98.13 123.84 111.64
Slovenia SI na na na na na na 220.03 235.64
Spain ES 160.78 170.00 186.94 197.08 205.66 207.64 208.06 208.76
Sweden SE 336.81 361.51 390.30 384.39 403.34 415.18 424.76 409.45
United Kingdom UK 211.85 213.70 220.41 235.55 252.65 250.65 256.74 314.09
United States US 398.14 423.53 446.63 485.43 515.86 535.91 486.61 518.91 Sources: OECD (Online Education Database – UOE database), Eurostat, and AMECO
108

TABLE A4 – GRADUATES IN PGD INSTITUTIONS PER 1000 INHABITANTS 1998 1999 2000 2001 2002 2003 2004 2005
Austria AT 3.55 2.24 3.34 3.60 2.61 3.86 4.05 4.27 Belgium BE na na 6.77 6.96 7.20 7.31 7.53 7.75 Bulgaria BG 4.56 4.81 5.13 5.34 5.64 5.25 5.07 4.98 Cyprus CY na 1.77 1.77 1.47 1.63 1.42 1.42 1.56 Czech Republic CZ 2.90 3.30 3.60 4.12 3.98 4.47 5.08 5.07 Denmark DK na 5.92 6.39 7.47 7.44 8.07 8.79 9.35 Estonia EE na na na na na na na 6.97 Finland FI 8.37 7.88 7.72 7.31 7.44 7.74 7.90 7.86 France FR 7.20 7.25 7.18 7.18 7.41 8.02 7.95 8.97 Germany DE 4.00 3.91 3.77 3.69 3.65 3.76 3.93 4.10 Greece EL na na na 3.56 3.98 na 4.47 5.51 Hungary HU 4.38 4.81 5.93 5.76 6.23 6.78 6.82 7.42 Ireland IE 9.72 10.27 10.61 11.39 10.88 12.80 12.93 13.48 Italy IT 2.64 2.82 3.19 3.37 3.63 4.11 5.32 6.20 Japan JP 4.00 4.17 4.36 4.26 4.11 3.95 3.90 3.42 Latvia LV 3.92 4.68 5.63 7.44 6.58 6.89 7.62 8.19 Lithuania LT 5.26 6.00 6.93 7.58 8.20 9.48 10.34 11.24 Malta MT 3.47 5.10 5.14 4.75 5.17 5.38 na 6.79 Netherlands NL 5.55 5.06 4.83 5.24 5.47 5.67 6.12 6.71 Poland PL 5.82 5.51 6.62 8.16 8.70 9.07 9.21 9.37 Portugal PT 4.35 4.41 4.48 4.63 4.69 4.75 4.77 5.21 Romania RO 2.09 1.93 2.16 2.44 3.21 4.92 5.35 5.65 Slovakia SK na 4.03 4.29 4.98 5.37 6.32 6.73 6.93 Slovenia SI 4.03 4.16 4.51 4.61 5.43 5.24 5.94 5.64 Spain ES 5.54 6.04 5.80 6.06 6.24 6.31 6.21 5.89 Sweden SE 4.24 4.72 5.12 5.19 5.50 5.91 6.41 6.69 United Kingdom UK 7.97 8.11 8.56 9.33 9.48 10.10 9.95 10.51 United States US 5.65 5.37 5.73 5.75 5.96 6.32 6.52 6.61
Sources: OECD (Online Education Database – UOE database), Eurostat, and AMECO
109

TABLE A5 – PUBLICATIONS IN PGD INSTITUTIONS PER 1000 INHABITANTS 1998 1999 2000 2001 2002 2003 2004 2005
Austria AT 0.69 0.74 0.74 0.79 0.78 0.82 0.84 0.87 Belgium BE 0.71 0.75 0.74 0.78 0.81 0.86 0.90 0.96 Bulgaria BG 0.07 0.07 0.07 0.07 0.07 0.07 0.08 0.09 Cyprus CY 0.16 0.16 0.15 0.15 0.19 0.20 0.22 0.24 Czech Republic CZ 0.17 0.19 0.20 0.22 0.25 0.27 0.30 0.30 Denmark DK 0.78 0.79 0.81 0.87 0.90 1.01 1.03 1.00 Estonia EE 0.26 0.33 0.32 0.35 0.34 0.39 0.45 0.50 Finland FI 1.06 1.10 1.15 1.18 1.18 1.24 1.26 1.26 France FR 0.30 0.32 0.32 0.32 0.33 0.33 0.35 0.34 Germany DE 0.52 0.55 0.54 0.55 0.55 0.56 0.57 0.59 Greece EL 0.26 0.26 0.29 0.35 0.41 0.44 0.50 0.54 Hungary HU 0.14 0.15 0.20 0.25 0.26 0.27 0.28 0.31 Ireland IE 0.47 0.47 0.51 0.53 0.60 0.61 0.73 0.78 Italy IT 0.36 0.38 0.39 0.41 0.43 0.46 0.48 0.49 Japan JP 0.35 0.36 0.37 0.37 0.38 0.39 0.40 0.40 Latvia LV 0.08 0.09 0.09 0.10 0.10 0.09 0.10 0.10 Lithuania LT 0.05 0.06 0.07 0.08 0.10 0.12 0.16 0.19 Malta MT 0.09 0.08 0.06 0.07 0.10 0.12 0.08 0.14 Netherlands NL 0.84 0.84 0.85 0.84 0.87 0.87 0.96 0.96 Poland PL 0.11 0.11 0.12 0.15 0.16 0.18 0.21 0.24 Portugal PT 0.19 0.24 0.26 0.28 0.31 0.35 0.40 0.42 Romania RO 0.03 0.04 0.04 0.04 0.05 0.06 0.06 0.06 Slovakia SK 0.18 0.19 0.18 0.18 0.18 0.19 0.22 0.20 Slovenia SI 0.37 0.45 0.53 0.51 0.53 0.60 0.59 0.72 Spain ES 0.35 0.37 0.38 0.40 0.42 0.44 0.46 0.49 Sweden SE 1.09 1.14 1.17 1.26 1.37 1.38 1.42 1.52 United Kingdom UK 0.71 0.73 0.77 0.82 0.83 0.86 0.89 0.92 United States US 0.48 0.48 0.48 0.48 0.48 0.49 0.51 0.53
Sources: ISI Web of Knowledge and AMECO
110

TABLE A6 – ISI CITATION INDEX 1998-2002 1999-2003 2000-2004 2001-2005
Austria AT 4.35 4.66 4.77 5.16 Belgium BE 4.27 4.72 4.74 4.98 Bulgaria BG 1.89 2.30 2.49 2.63 Cyprus CY 3.13 2.94 2.50 2.33 Czech Republic CZ 2.33 2.53 2.56 2.90 Denmark DK 4.66 4.36 4.95 5.37 Estonia EE 2.77 2.92 2.96 3.12 Finland FI 4.71 4.90 4.97 5.14 France FR 3.67 3.84 3.92 4.21 Germany DE 4.27 4.49 4.51 4.86 Greece EL 2.20 2.32 2.43 2.71 Hungary HU 2.47 2.78 3.15 3.54 Ireland IE 3.35 3.55 3.61 3.85 Italy IT 3.87 3.99 3.96 4.12 Japan JP 3.66 3.85 3.89 4.10 Latvia LV 1.74 1.86 2.13 2.21 Lithuania LT 1.92 1.94 1.88 1.76 Malta MT 5.76 2.48 2.17 2.45 Netherlands NL 5.17 5.37 5.25 5.51 Poland PL 2.74 2.82 2.82 2.98 Portugal PT 2.69 2.92 2.91 3.07 Romania RO 1.45 1.52 1.58 1.63 Slovakia SK 1.82 2.04 2.02 2.23 Slovenia SI 2.08 2.03 2.11 2.39 Spain ES 3.22 3.33 3.30 3.46 Sweden SE 4.57 4.56 4.68 5.10 United Kingdom UK 4.75 4.79 4.86 5.00 United States US 5.00 5.16 5.19 5.36
Sources: ISI Web of Knowledge
111

TABLE A7 – STANDARDISED RECRUITER REVIEW AND PEER REVIEW INDEXES
Recruiter Review Index
Peer Review Index
Austria AT 1.26 1.59 Belgium BE 1.38 1.77 Czech Republic CZ 1.00 1.00 Denmark DK 1.00 1.00 Finland FI 1.03 1.08 France FR 1.30 1.75 Germany DE 1.00 1.00 Greece EL 1.31 2.00 Ireland IE 1.14 1.23 Italy IT 1.20 1.38 Japan JP 1.10 1.07 Netherlands NL 1.00 1.00 Poland PL 2.00 1.94 Portugal PT 1.08 1.15 Romania RO 1.47 1.58 Spain ES 1.00 1.00 Sweden SE 1.00 1.00 United Kingdom UK 1.00 1.00 United States US 1.50 1.82
112

TABLE A8 – SCORES FOR THE MAIN CATEGORIES OF THE COMPOSITE INDICATOR
Input Flexibility
Selection of Students
Budget Autonomy
Staff Policy
Output Flexibility Accountability Evaluation Funding
Rules Austria AT 6.80 2.80 7.70 10.00 6.60 5.30 5.10 5.50 Belgium BE 5.20 2.53 6.10 6.97 7.37 5.60 5.43 5.80 Czech Republic CZ 7.90 7.50 6.30 10.00 8.20 5.30 6.60 4.00 Denmark DK 7.70 7.00 6.20 10.00 7.30 5.00 4.60 5.30 Finland FI 7.40 7.10 7.70 7.50 8.40 5.10 4.00 6.20 France FR 3.80 2.80 6.80 1.80 6.40 6.10 5.60 6.60 Germany DE 5.80 2.80 7.20 7.50 3.00 6.10 6.90 5.20 Greece EL 1.90 1.70 0.90 3.20 3.60 3.50 2.30 4.60 Hungary HU 6.80 8.90 8.50 3.20 7.30 6.30 8.30 4.30 Ireland IE 7.80 5.50 10.00 7.90 6.60 6.30 6.70 5.90 Italy IT 6.20 3.70 7.00 7.90 6.40 6.00 6.80 5.20 Japan JP 8.20 6.60 8.20 10.00 9.10 5.10 6.20 3.90 Netherlands NL 6.30 1.30 7.70 10.00 5.90 6.30 7.50 5.10 Portugal PT 6.20 3.90 7.20 7.40 7.30 6.20 4.60 7.80 Romania RO 6.90 6.60 5.80 8.30 5.00 4.20 5.30 3.10 Slovakia SK 8.40 6.70 8.50 10.00 8.20 4.70 6.50 2.90 Spain ES 7.60 10.00 7.90 4.90 5.70 5.70 6.50 4.80 Sweden SE 8.40 8.90 6.20 10.00 5.50 5.60 6.50 4.60 United Kingdom UK 7.80 6.70 6.80 10.00 8.20 6.60 7.70 5.50
United States US 8.20 6.10 8.50 10.00 7.00 5.10 6.60 3.60
Source: Oliveira Martins et al. (2007)
TABLE A9 – PISA 2000 PISA 2000
Austria AT 514 Belgium BE 508 Czech Republic CZ 500 Denmark DK 497 Finland FI 540 France FR 507 Germany DE 487 Greece EL 460 Hungary HU 488 Ireland IE 514 Italy IT 473 Japan JP 543 Netherlands NL 525 a) Portugal PT 456 Romania RO 410 a) Slovakia SK 482 a) Spain ES 487 Sweden SE 513 United Kingdom UK 528,00
United States US 499,00
a) drawn from PISA 2006 Source: PISA publications 2000.
113

Appendix B - Data sources and remarks Academic Staff
Main Sources: OECD (Online Education Database – UOE database, Dataset: Educational
Personnel) and Eurostat (Dataset: Teachers (ISCED 0-4) and academic staff (ISCED 5-6) by
employment status (full-time, part-time, full-time equivalence) and sex).
Remarks: Most data was taken from the OECD dataset, which classifies academic personnel
into public, government-dependent private, and independent private institutions, with the
exceptions that follow. For some years and countries for which no data was available from
OECD - namely Bulgaria, Cyprus, Estonia, Latvia, Lithuania, Malta, Portugal in 2003 and
2005, Romania, Slovakia, and Slovenia - some numbers were recovered from Eurostat, where
only data for academic staff in all institutions is available, according to the methodology that
follows. In the case of Bulgaria, Estonia, Latvia, Lithuania, Portugal, Romania, and Slovenia,
countries where private independent universities are relevant, we computed the proportion of
academic staff in PGD universities using the weight of the public sector as follows:
.)(studentsall
nsinstitutioPGDinstudentsEurostatesuniversitiallinstaffAcademic ×
Students in PGD Private Institutions:
Source: OECD (Online Education Database – UOE database, Dataset: Students enrolled by
type of institution) and Eurostat (Dataset: Students by ISCED level, type of institution
(private or public) and study intensity (full-time, part-time))
Remarks: Most data was extracted from OECD, except for the following. Data for Bulgaria,
Cyprus, Estonia, Latvia, Lithuania, Malta, Romania, Slovakia, and Slovenia was drawn form
Eurostat.
114

Expenditure/financial data
Total Expenditure on PGD Institutions in Percentage of GDP:
Source: Eurostat (Dataset: Expenditure on public educational institutions).
Total Expenditure on PGD Institutions in Purchasing Power Standard in Real Terms Per Capita. Source: This data has been constructed using the dataset Expenditure by nature and resource
category from the UOE data collection, as well as data on population, ECU-EUR average
exchange rates, GDP purchasing power parities, and the euro area price deflator of the gross
domestic product at market prices of the year 2000 obtained from AMECO Database.
Total Public Expenditure on Tertiary Education
Source: OECD (Online Education Database – UOE database).
Total Public Expenditure for Educational Institutions (Tertiary Education)
Source: OECD (Online Education Database – UOE database).
Remarks: Though less comprehensive than the preceding variable, it presents the advantage
of comparability with private direct expenditures for educational institutions.
Output data
Graduates in PGD Institutions:
Source: OECD (Online Education Database – UOE database, Dataset: Graduates by field of
education and Graduates by age), Eurostat (Dataset: Graduates by ISCED level, type of
institution (private or public), age and gender), and UIS (UNESCO Institute for Statistics,
115

Dataset: Graduates by broad field of education in tertiary education). Data for France and
Germany only includes public institutions.
Remarks: Most data was taken from the OECD dataset, which divides graduates into ISCED
5B and ISCED 5A and 6, and finally ISCED 6 in public and private institutions. Data for
graduates in PGD institutions is scarce.
To overcome the problem of lacking of data, we have constructed a proxy of the number of
graduates in PGD institutions using the data of Students in ISCED 5 and 6 in PGD institutions
and Students ISCED 5 and 6 in all institutions. Namely, we computed the proportion of
students in PGD institutions over the students in all institutions and used this proportion to
obtain an estimate of the graduates in PGD institutions. The same methodology was used to
recover graduates in ISCED 5 and ISCED 6 separately in PGD institutions.
For those years and countries for which no data was available from OECD, numbers were
recovered from Eurostat (namely for Greece from 2001 to 2002, Portugal from 1998 to 2002,
Slovenia from 1998 to 2005, and the US for 2002) and from the UIS (namely for Bulgaria,
Estonia, Latvia, Lithuania, and Romania).
THES - QS recruiter survey ranking:
Source: THES (Times Higher Education Supplement) - QS (Quacquarelli Symonds) World
University Rankings. Data available online: www.topuniversities.com.
Remarks: The recruiter review is only one of the indicators used by THES - QS to rank
universities. Other indicators concern the peer review (see below), international staff,
international students, the staff/student ratio, and citations of academic work.
THES - QS peer survey ranking:
Source: THES (Times Higher Education Supplement) - QS (Quacquarelli Symonds) World
University Rankings. Data available online: www.topuniversities.com.
Remarks: The peer review is only one of the indicators used by THES - QS to rank
universities. Other indicators concern the employer review (see above), international staff,
international students, the staff/student ratio, and citations of academic work.
116

Published articles:
Source: ISI Web of Knowledge, Thomson Scientific, The Thomson Corporation. Data
available online to ISI subscribers (www.isiwebofknowledge.com).
Remarks: The ISI Web of Science Database includes the Science Citation Index expanded
(available data from 1900), the Social Sciences Citation Index (available data from 1956) and
the Arts & Humanities Citation Index (available data from 1975). Data were collected from
1998 onwards.
Citations:
Source: ISI Web of Knowledge, Thomson Scientific, The Thomson Corporation. Data
available online to ISI subscribers (www.isiwebofknowledge.com):
Remarks: The ISI Web of Science Database includes the Science Citation Index expanded
(available data from 1900), the Social Sciences Citation Index (available data from 1956), and
the Arts & Humanities Citation Index (available data from 1975). Data were collected from
1998 onwards.
Institutional and environment data
Supply of tertiary education (STE)
Source: Oliveira Martins et al. (2007)
Remarks: The indicator has been constructed on the basis of a questionnaire sent to OECD
member countries, 28 of which have provided answers. We extended coverage to the
remaining countries considered in our study (see Table 1) and had positive replies from
Cyprus and Romania. For this purpose, we have sought and obtained permission from the
OECD Economics Department to use their questionnaire.42
42 We are grateful to Joaquim Oliveira Martins for his help in obtaining this permission.
117

PISA
Source: PISA publications - Programme for International Student Assessment (PISA).
Macroeconomic data
Our main source for macroeconomic variables including population is the AMECO database,
Spring 2008 release. Data for activity rates, employment rates, and unemployment rates were
drawn from Eurostat.
118

Appendix C - The OECD questionnaire
119
120

121

122

123

124

125

126

127

128

129

Appendix D - Data Envelopment Analysis alternative models
TABLE D1: MODEL DEA1 – TEACHING (RESEARCH IS NOT CONSIDERED)
INPUT ORIENTED DEA Period 1 - 1998-2001 Period 2 - 2002-2005
Coef. Rank Peers Coef. Rank Peers Austria 0.450 24 Japan, Romania 0.456 20 Japan Belgium 0.755 7 Japan, UK 0.726 6 UK, Japan Bulgaria 0.521 15 Romania, Japan 0.517 17 Japan Cyprus 1.000 1 Cyprus 0.870 4 Japan Czech Republic 0.624 10 Romania, Japan 0.618 13 Japan Denmark 0.537 14 Ireland, Japan, UK 0.637 11 Ireland, Japan, UK Estonia 0.411 26 UK, Japan 0.360 27 Japan, UK Finland 0.498 18 Ireland, Japan, UK 0.417 24 Ireland, Japan, UK France 0.591 12 Japan, UK 0.644 10 Japan, UK Germany 0.456 23 Romania, Japan 0.445 22 Japan Greece 0.596 11 Japan, Romania 0.511 18 Japan Hungary 0.488 20 Romania, Japan 0.466 19 Japan, UK Ireland 1.000 1 Ireland 1.000 1 Ireland Italy 0.739 8 Japan, Romania 0.636 12 Japan Japan 1.000 1 Japan 1.000 1 Japan Latvia 0.544 13 Japan, Romania 0.668 7 Japan, UK Lithuania 0.294 28 UK, Japan 0.402 25 Japan, UK Malta 0.639 9 Romania, Japan 0.650 9 Japan Netherlands 0.515 16 Japan, UK 0.531 15 Ireland, Japan, UK Poland 0.493 19 Japan, UK 0.542 14 Japan, UK Portugal 0.461 22 Romania, Japan 0.438 23 Japan Romania 1.000 1 Romania 0.840 5 Japan Slovakia 0.466 21 Japan, Romania 0.448 21 Japan, UK Slovenia 0.898 6 Romania, Japan 0.664 8 Japan Spain 0.441 25 Japan, Romania 0.389 26 Japan, UK Sweden 0.335 27 Japan, UK 0.346 28 Japan, Ireland, UK United Kingdom 1.000 1 UK 1.000 1 UK United States 0.514 17 Japan, UK 0.520 16 Japan, UK
130

TABLE D2: MODEL DEA1 – RESEARCH (TEACHING IS NOT CONSIDERED)
OUTPUT ORIENTED DEA Period 1 - 1998-2001 Period 2 - 2002-2005
Coef. Rank Peers Coef. Rank Peers Austria 0.256 28 Ireland, Japan 0.302 25 Ireland, Japan Belgium 0.688 6 Ireland, Japan, UK 0.666 4 Ireland, Japan, UK Bulgaria 0.313 25 Ireland, Japan, UK 0.343 20 Ireland, Japan, UK Cyprus 1.000 1 Cyprus 0.235 28 Ireland, Japan Czech Republic 0.298 26 Ireland, Japan, UK 0.352 18 Ireland, Japan, UK Denmark 0.525 10 Ireland, Japan 0.614 5 Ireland, Japan, UK Estonia 0.437 12 Ireland, Japan 0.315 24 Ireland, Japan Finland 0.626 7 Ireland 0.519 8 Ireland France 0.529 9 Ireland, Japan 0.599 6 Ireland, Japan, UK Germany 0.353 18 Ireland, Japan 0.316 23 Ireland, Japan Greece 0.273 27 Japan, UK 0.274 27 Ireland, UK Hungary 0.323 22 Ireland, Japan 0.333 21 Ireland, Japan, UK Ireland 1.000 1 Ireland 1.000 1 Ireland Italy 0.333 21 Japan, UK 0.369 17 Japan, UK Japan 1.000 1 Japan 1.000 1 Japan, Latvia 0.346 20 Ireland, Japan, UK 0.469 12 Japan, UK Lithuania 0.368 17 Ireland, Japan 0.398 15 Ireland Malta 0.429 14 Ireland, Japan 0.480 11 Ireland, Japan, UK Netherlands 0.508 11 Ireland, Japan 0.503 9 Ireland, Japan Poland 0.431 13 Ireland, Japan 0.482 10 Ireland, Japan, UK Portugal 0.350 19 Ireland, Japan 0.325 22 Ireland, Japan Romania 1.000 1 Romania 0.545 7 Japan, UK Slovakia 0.316 23 Ireland, Japan 0.346 19 Ireland, Japan Slovenia 0.587 8 Japan, UK 0.410 13 Japan, UK Spain 0.315 24 Ireland, UK 0.302 25 Ireland, Japan Sweden 0.396 15 Ireland, Japan 0.409 14 Ireland United Kingdom 1.000 1 UK 1.000 1 UK, United States 0.381 16 Ireland, Japan, UK 0.382 16 Ireland, UK
131

TABLE D3: MODEL DEA1 (WITHOUT ROMANIA AND CYPRUS)
INPUT ORIENTED DEA Period 1 - 1998-2001 Period 2 - 2002-2005
Coef. Rank Peers Coef. Rank Peers Austria 0.777 11 UK, Netherlands, Japan 0.963 9 Neth., Denmark, Japan Belgium 0.846 8 Japan, UK 0.973 8 Denmark, UK, Japan Bulgaria 0.533 19 Japan 0.517 19 Japan Czech Republic 0.652 14 Japan 0.618 16 Japan Denmark 0.816 9 UK, Netherlands, Japan 1.000 1 Denmark Estonia 0.411 25 Japan, UK 0.360 26 UK, Japan Finland 1.000 1 Finland 0.975 7 UK, Ireland, Sweden France 0.591 17 Japan, UK 0.644 14 UK, Japan Germany 0.643 15 Netherlands, UK, Japan 0.644 14 Neth., Japan, Denmark Greece 0.621 16 Japan 0.511 20 Japan Hungary 0.497 20 Japan 0.466 21 Japan, UK Ireland 1.000 1 Ireland 1.000 1 Ireland Italy 0.808 10 UK, Japan 0.685 10 UK, Japan Japan 1.000 1 Japan 1.000 1 Japan Latvia 0.552 18 Japan 0.668 11 Japan, UK Lithuania 0.294 26 UK, Japan 0.402 24 UK, Japan Malta 0.657 12 Japan 0.650 13 Japan Netherlands 1.000 1 Netherlands 1.000 1 Neth. Poland 0.493 21 Japan, UK 0.542 18 Japan,UK Portugal 0.471 23 Japan 0.438 23 Japan Slovakia 0.481 22 Japan 0.448 22 UK, Japan Slovenia 0.928 7 Japan 0.664 12 Japan Spain 0.441 24 Japan 0.389 25 Japan, UK Sweden 1.000 1 Sweden 1.000 1 Sweden United Kingdom 1.000 1 UK 1.000 1 UK United States 0.655 13 Japan, UK 0.605 17 Japan, UK
132

TABLE D4: MODEL DEA1 (WITHOUT ROMANIA AND CYPRUS)
OUTPUT ORIENTED DEA Period 1 - 1998-2001 Period 2 - 2002-2005
Coef. Rank Peers Coef. Rank Peers Austria 0.761 9 UK, Netherlands 0.962 9 Neth., Denmark, Japan Belgium 0.839 8 UK, Netherlands 0.972 8 Denmark, UK, Japan Bulgaria 0.313 24 Ireland, Japan, UK 0.343 24 Ireland, Japan, UK Czech Republic 0.298 25 Ireland, Japan, UK 0.352 22 Ireland, UK, Japan Denmark 0.874 7 UK, Sweden, Netherlands 1.000 1 Denmark Estonia 0.460 15 UK, Ireland, Japan 0.366 21 UK, Ireland, Japan Finland 1.000 1 Finland 0.996 7 Ireland, Sweden, UK France 0.566 14 UK, Ireland, Japan 0.599 11 Ireland, Japan, UK Germany 0.649 10 Netherlands, Japan, Sweden 0.660 10 Sweden, Japan, Neth. Greece 0.273 26 UK, Japan 0.294 26 UK, Ireland, Sweden Hungary 0.323 22 Ireland, Japan 0.333 25 Ireland, UK, Japan Ireland 1.000 1 Ireland 1.000 1 Ireland Italy 0.627 11 UK, Japan 0.506 13 UK, Japan Japan 1.000 1 Japan 1.000 1 Japan Latvia 0.346 21 Ireland, Japan, UK 0.469 16 UK, Japan Lithuania 0.368 19 Japan, Ireland 0.398 18 Ireland Malta 0.429 17 Ireland, Japan 0.480 15 Ireland, Japan, UK Netherlands 1.000 1 Netherlands 1.000 1 Neth. Poland 0.431 16 Japan, Ireland 0.482 14 Ireland, UK, Japan Portugal 0.365 20 UK, Ireland, Japan 0.376 20 UK, Ireland, Japan Slovakia 0.316 23 Japan, Ireland 0.346 23 Japan, Ireland Slovenia 0.593 13 UK, Japan 0.414 17 UK, Japan Spain 0.382 18 UK, Finland, Ireland 0.382 19 UK, Ireland, Japan Sweden 1.000 1 Sweden 1.000 1 Sweden United Kingdom 1.000 1 UK 1.000 1 UK United States 0.598 12 UK, Netherlands 0.550 12 UK, Denmark
133

TABLE D5: MODEL DEA2 – TEACHING (RESEARCH IS NOT CONSIDERED)
INPUT ORIENTED DEA Period 1 - 1998-2001 Period 2 - 2002-2005
Coef. Rank Peers Coef. Rank Peers Austria 0.374 22 Japan 0.437 19 Japan Belgium 0.691 5 Ireland, Japan 0.558 7 Ireland, Japan Bulgaria 0.426 21 Japan 0.486 16 Japan Czech Republic 0.605 7 Japan 0.531 11 Japan Denmark 0.436 20 Ireland, Japan 0.419 22 Ireland, Japan Estonia 0.519 13 Ireland, Japan 0.551 9 Ireland, Japan Finland 0.520 12 Ireland, Japan 0.430 20 Ireland, Japan France 0.617 6 Ireland, Japan 0.579 5 Ireland, Japan Germany 0.495 16 Japan 0.491 15 Japan Greece 0.516 15 Japan 0.423 21 Japan Hungary 0.467 19 Japan 0.471 18 Ireland, Japan Ireland 1.000 1 Ireland 1.000 1 Ireland Italy 0.570 9 Japan 0.553 8 Japan Japan 1.000 1 Japan 1.000 1 Japan Lithuania 0.529 11 Ireland, Japan 0.542 10 Ireland, Japan Malta 0.860 4 Japan 0.867 3 Japan Netherlands 0.517 14 Ireland, Japan 0.524 13 Ireland, Japan Poland 0.553 10 Ireland, Japan 0.502 14 Ireland, Japan Portugal 0.490 17 Japan 0.486 16 Japan Slovakia 0.598 8 Japan 0.564 6 Ireland, Japan Slovenia 0.371 23 Japan 0.394 23 Japan Spain 0.490 17 Japan 0.525 12 Ireland, Japan Sweden 0.363 24 Ireland, Japan 0.388 24 Ireland, Japan United Kingdom 0.948 3 Ireland, Japan 0.778 4 Ireland, Japan United States 0.335 25 Ireland, Japan 0.337 25 Ireland, Japan
134

TABLE D6: MODEL DEA2 – TEACHING (RESEARCH IS NOT CONSIDERED)
OUTPUT ORIENTED DEA Period 1 - 1998-2001 Period 2 - 2002-2005
Coef. Rank Peers Coef. Rank Peers Austria 0.225 24 Ireland, Japan 0.213 24 Ireland Belgium 0.657 4 Ireland, Japan 0.477 7 Ireland Bulgaria 0.284 21 Ireland, Japan 0.233 21 Ireland, Japan Czech Republic 0.313 20 Ireland, Japan 0.248 19 Ireland, Japan Denmark 0.486 9 Ireland 0.520 5 Ireland Estonia 0.461 12 Ireland, Japan 0.337 13 Ireland, Japan Finland 0.626 5 Ireland 0.519 6 Ireland France 0.571 7 Ireland, Japan 0.404 9 Ireland, Japan Germany 0.335 16 Ireland, Japan 0.224 23 Ireland, Japan Greece 0.273 22 Ireland, Japan 0.205 25 Ireland Hungary 0.330 18 Ireland, Japan 0.276 18 Ireland Ireland 1.000 1 Ireland 1.000 1 Ireland Italy 0.266 23 Ireland, Japan 0.289 17 Ireland, Japan Japan 1.000 1 Japan 1.000 1 Japan Lithuania 0.467 11 Ireland, Japan 0.398 11 Ireland Malta 0.597 6 Ireland, Japan 0.698 3 Ireland, Japan Netherlands 0.468 10 Ireland, Japan 0.403 10 Ireland Poland 0.495 8 Ireland, Japan 0.395 12 Ireland Portugal 0.334 17 Ireland, Japan 0.241 20 Ireland, Japan Slovakia 0.371 15 Ireland, Japan 0.336 14 Ireland, Japan Slovenia 0.213 25 Ireland, Japan 0.226 22 Ireland Spain 0.423 13 Ireland, Japan 0.308 15 Ireland, Japan Sweden 0.383 14 Ireland 0.409 8 Ireland United Kingdom 0.941 3 Ireland, Japan 0.688 4 Ireland United States 0.319 19 Ireland 0.303 16 Ireland
135

TABLE D7: MODEL DEA2 – RESEARCH (TEACHING IS NOT CONSIDERED)
INPUT ORIENTED DEA. Period 1 - 1998-2001 Period 2 - 2002-2005
Coef. Rank Peers Coef. Rank Peers Austria 0.707 9 UK, Japan 0.904 5 Sweden, Japan Belgium 0.844 7 UK, Japan 0.861 8 Sweden, Japan Bulgaria 0.426 23 Japan 0.486 17 Japan Czech Republic 0.605 12 Japan 0.531 14 Japan Denmark 0.656 10 Netherlands, UK 0.721 9 Sweden, Japan Estonia 0.485 21 Japan 0.515 15 Japan Finland 0.937 5 Sweden, Netherlands 0.866 7 Sweden, Japan France 0.490 18 Japan 0.468 19 Japan Germany 0.724 8 UK, Japan 0.716 10 Sweden, Japan Greece 0.516 15 Japan 0.423 23 Japan Hungary 0.467 22 Japan 0.444 20 Japan Ireland 0.421 24 Japan, UK 0.640 11 Sweden, Japan Italy 0.610 11 UK, Japan 0.618 12 Sweden, Japan Japan 1.000 1 Japan 1.000 1 Japan Lithuania 0.527 14 Japan 0.433 22 Japan Malta 0.860 6 Japan 0.867 6 Japan Netherlands 1.000 1 Netherlands 0.988 3 Sweden, Japan Poland 0.516 15 Japan 0.403 24 Japan Portugal 0.490 18 Japan 0.486 17 Japan Slovakia 0.598 13 Japan 0.547 13 Japan Slovenia 0.371 25 Japan 0.394 25 Japan Spain 0.490 18 Japan 0.500 16 Japan Sweden 1.000 1 Sweden 1.000 1 Sweden United Kingdom 1.000 1 UK 0.962 4 Sweden, Japan United States 0.492 17 UK, Japan 0.438 21 Sweden, Japan
136

TABLE D8: MODEL DEA2 – RESEARCH (TEACHING IS NOT CONSIDERED)
OUTPUT ORIENTED DEA.. Period 1 - 1998-2001 Period 2 - 2002-2005
Coef. Rank Peers Coef. Rank Peers Austria 0.694 8 Sweden, Netherlands 0.886 5 Sweden, Japan Belgium 0.815 6 UK, Netherlands 0.839 7 Sweden, Japan Bulgaria 0.031 25 Netherlands, UK 0.049 25 Sweden, Japan Czech Republic 0.166 20 UK, Japan 0.215 19 Sweden, Japan Denmark 0.711 7 Sweden 0.731 8 Sweden Estonia 0.247 16 UK, Japan 0.331 14 Sweden, Japan Finland 0.992 5 Sweden 0.873 6 Sweden France 0.329 14 UK, Japan 0.320 15 Sweden, Japan Germany 0.664 9 UK, Japan 0.658 9 Sweden, Japan Greece 0.193 18 UK, Japan 0.258 18 Sweden, Japan Hungary 0.123 21 UK, Netherlands 0.210 20 Sweden, Japan Ireland 0.353 12 Sweden, Netherlands 0.572 10 Sweden, Japan Italy 0.509 10 UK, Japan 0.527 11 Sweden, Japan Japan 1.000 1 Japan 1.000 1 Japan Lithuania 0.040 24 UK, Japan 0.051 24 Sweden, Japan Malta 0.256 15 UK, Japan 0.135 21 Sweden, Japan Netherlands 1.000 1 Netherlands 0.986 3 Sweden, Japan Poland 0.100 23 UK, Japan 0.110 23 Sweden, Japan Portugal 0.184 19 UK, Japan 0.266 17 Sweden, Japan Slovakia 0.120 22 UK, Japan 0.120 22 Sweden, Japan Slovenia 0.206 17 Sweden, Netherlands 0.269 16 Sweden, Japan Spain 0.343 13 UK, Japan 0.380 12 Sweden, Japan Sweden 1.000 1 Sweden 1.000 1 Sweden United Kingdom 1.000 1 UK 0.955 4 Sweden, Japan United States 0.472 11 Sweden, Netherlands 0.371 13 Sweden
137

Model DEA3 is an alternative DEA model where the input is real spending in PGD institutions measured in purchasing power standards per head of population. Results are less reliable than those presented in the main text as there is no control for differences in wages across countries.
TABLE D9: MODEL DEA3
(INPUT IS REAL SPENDING IN PPS) INPUT ORIENTED DEA.
Period 1 - 1998-2001 Period 2 - 2002-2005 Coef. Rank Peers Coef. Rank Peers
Austria 0.621 17 UK, Japan 0.837 13 Sweden, Japan Belgium 0.789 11 UK, Japan 0.851 12 Sweden, UK, Japan Bulgaria 1.000 1 Bulgaria 1.000 1 Bulgaria Czech Republic 0.706 14 Bulgaria, Japan 0.624 19 Japan, Bulgaria Denmark 0.603 18 Finland, UK 0.694 16 Sweden, UK, Japan Estonia 0.715 13 UK, Lith., Japan 0.858 10 Japan, UK, Bulgaria Finland 1.000 1 Finland 0.989 7 Sweden, UK, Ireland France 0.535 21 UK, Lith., Japan 0.552 21 Bulgaria, UK, Ireland Germany 0.688 15 UK, Japan 0.711 15 Sweden, Japan Greece 0.512 23 Bulgaria, Japan 0.438 24 Japan, Bulgaria Hungary 0.645 16 Bulgaria, Japan 0.682 17 UK, Bulgaria, Japan Ireland 1.000 1 Ireland 1.000 1 Ireland Italy 0.568 19 UK, Japan 0.627 18 Sweden, Japan Japan 1.000 1 Japan 1.000 1 Japan Lithuania 1.000 1 Lith. 1.000 1 Lith. Malta 0.777 12 Bulgaria, Japan 0.854 11 Ireland, Lith., Bulgaria Netherlands 0.974 9 Finland, UK 0.919 9 Sweden, UK, Japan Poland 1.000 1 Poland 0.959 8 Ireland, Lith., Bulgaria Portugal 0.551 20 Japan, Bulgaria 0.601 20 Japan, Bulgaria Slovakia 0.833 10 Bulgaria, Japan 0.781 14 Ireland, Bulgaria, UK Slovenia 0.380 24 Bulgaria, Japan 0.459 23 Japan, Bulgaria Spain 0.535 21 Japan, Lith., Bulgaria 0.548 22 UK, Bulgaria, Japan Sweden 1.000 1 Sweden 1.000 1 Sweden United Kingdom 1.000 1 UK 1.000 1 UK United States 0.355 25 UK, Japan 0.330 25 Sweden, UK, Japan
138

TABLE D10: MODEL DEA3 (INPUT IS REAL SPENDING IN PPS)
OUTPUT ORIENTED DEA. Period 1 - 1998-2001 Period 2 - 2002-2005
Coef. Rank Peers Coef. Rank Peers Austria 0.667 14 Finland, UK 0.823 14 Japan, Sweden Belgium 0.801 10 Finland, UK 0.842 11 Japan, Sweden, UK Bulgaria 1.000 1 Bulgaria 1.000 1 Bulgaria Czech Republic 0.479 23 Japan, Lith., UK 0.518 21 Bulgaria, Ireland, UK Denmark 0.749 11 Finland, Ireland 0.897 10 Ireland, Sweden Estonia 0.719 12 Ireland, Poland, UK 0.830 13 Bulgaria, Japan, UK Finland 1.000 1 Finland 0.997 7 Ireland, Sweden, UK France 0.601 18 Ireland, Poland, UK 0.533 19 Bulgaria, Ireland, UK Germany 0.640 15 UK, 0.680 16 Japan, Sweden Greece 0.359 24 Ireland, Poland, UK 0.353 25 Bulgaria, Japan, UK Hungary 0.604 17 Ireland, Poland, UK 0.647 17 Bulgaria, Ireland, UK Ireland 1.000 1 Ireland 1.000 1 Ireland Italy 0.490 20 Japan, UK 0.588 18 Japan, Sweden, UK Japan 1.000 1 Japan 1.000 1 Japan Lithuania 1.000 1 Lith. 1.000 1 Lith. Malta 0.638 16 Japan, Lith., UK 0.835 12 Bulgaria, Ireland, Lith. Netherlands 0.980 9 Finland, UK 0.914 9 Japan, Sweden, UK Poland 1.000 1 Poland 0.955 8 Bulgaria, Ireland, Lith. Portugal 0.487 21 Ireland, Poland, UK 0.525 20 Bulgaria, Japan, UK Slovakia 0.675 13 Japan, Lith., UK 0.758 15 Bulgaria, Ireland, Lith. Slovenia 0.288 25 Ireland, Poland, UK 0.396 24 Japan, Sweden, UK Spain 0.512 19 Ireland, Poland, UK 0.497 22 Bulgaria, Japan, UK Sweden 1.000 1 Sweden 1.000 1 Sweden United Kingdom 1.000 1 UK 1.000 1 UK United States 0.484 22 Finland, Ireland 0.484 23 Ireland, Sweden
139

Appendix E - Stochastic Frontier Analysis alternative models
TABLE E1: SFA ESTIMATION RESULTS WITHOUT STAFF POLICY (DEPENDENT VARIABLE: COST IN PERCENTAGE OF GDP)
Coefficient Standard-
Error t-ratio
Cost function: constant -1.410 232.4 -0.006065
lwgrad 0.2669 0.04363 6.118 lwpub 0.2568 0.02584 9.941
Inefficiency: constant 5.030 232.4 0.02164
evaluation -0.03978 0.01388 -2.867 funding rules -0.05180 0.01743 -2.973
PISA2000 -0.007369 0.0009321 -7.906
2ˆεσ 0.03646 0.004091 8.912
γ 0.2229
LR statistic (γ=0)
57.93
Alternative stochastic frontier model:
0 1 2 3ln ln ln lnit it it it it itc wage wpub wgradβ β β β η ε= + + + + + ,
• cit is the total cost with PGD institutions in country i, measured in real purchasing power standards euros per capita;
• wageit is an input price, the average wage in the services sector, measured in real purchasing power standards euros;
• wgradit, one of the considered outputs, are student graduations weighted by quality and per capita;
• wpubit, the other output, are publications weighted by citations per capita.
140

TABLE E2: ALTERNATIVE SFA MODEL ESTIMATION RESULTS
(DEPENDENT VARIABLE: REAL COST IN PPS) Coefficient Standard-Error t-ratio Cost function:
constant -4.085 0.3918 -10.43 lwage 0.2177 0.4958 4.390
lwgrad 0.3046 0.04004 7.608 lwpub 0.5260 0.1006 5.227
Inefficiency: constant 0.9547 0.2502 3.815
evaluation -0.07312 0.02674 -2.734 funding rules -0.05543 0.03859 -1.436
2ˆεσ 0.0511 0.007888 6.482
γ 0.2359 0.1891 1.246
LR statistic (γ=0) 15.17
TABLE E3: ALTERNATIVE SFA MODEL, EFFICIENCY SCORES 1998 1999 2000 2001 2002 2003 2004 2005 Average Ranking
(average) United Kingdom 0.909 0.912 0.915 0.915 0.908 0.912 na na 0.912 1
Netherlands 0.887 0.870 0.869 0.863 0.869 0.871 0.875 0.874 0.872 2 Japan 0.873 0.865 0.863 0.862 0.865 0.851 0.845 0.854 0.860 3
Hungary 0.847 0.844 0.848 0.858 0.848 0.843 0.873 0.877 0.855 4 Germany 0.847 0.845 0.845 0.844 0.840 0.832 0.837 0.844 0.842 5
Italy 0.839 0.828 0.822 0.812 0.817 0.821 0.855 0.856 0.831 6 Ireland 0.831 0.814 0.794 0.819 0.826 0.848 0.853 0.856 0.830 7 France 0.824 0.826 0.824 0.826 0.828 0.807 0.806 0.812 0.819 8
Portugal 0.802 0.805 0.808 0.805 0.824 0.814 na na 0.810 9 Spain 0.826 0.825 0.810 0.805 0.802 0.801 0.803 0.804 0.810 10
Belgium na 0.750 0.801 0.798 0.803 0.815 0.824 0.827 0.802 11 Sweden 0.766 0.762 0.761 0.768 0.766 0.764 0.770 0.784 0.768 12 Austria 0.723 0.708 0.749 0.759 0.756 0.770 0.759 0.752 0.747 13
Czech Republic 0.744 0.689 0.757 0.755 0.752 0.750 0.751 0.752 0.744 14 Slovakia na 0.742 0.746 0.723 0.728 0.723 0.697 0.721 0.726 15 Finland 0.739 0.724 0.722 0.724 0.720 0.724 0.719 0.725 0.725 16
Denmark na na 0.688 0.677 0.672 0.698 0.696 0.705 0.689 17 United States 0.703 0.695 0.693 0.679 0.671 0.669 0.690 0.684 0.686 18
Greece na na na 0.609 0.604 na 0.589 0.584 0.597 19
141

Appendix F - Effectiveness alternative models
TABLE F1: TERTIARY SPENDING, EFFICIENCY AND LABOUR PRODUCTIVITY REGRESSION RESULTS (EU COUNTRIES ONLY, ALTERNATIVE SFA SCORES)
Equation (11),
alternative SFA
coef. -0.370*** std. dev. (0.120) lprod98
P-value 0.002 coef. 0.132 std. dev. (0.699) inv
P-value 0.850 coef. 0.983 std. dev. (4.844) s or eff.s
P-value 0.839 Obs 17
R2 0.579 Sources and notes as under Table 16.
Efficiency scores are those from table E3.
TABLE F2: TERTIARY SPENDING, EFFICIENCY AND LABOUR PRODUCTIVITY
REGRESSION RESULTS (ALL COUNTRIES)
Equation (10) (11), DEA1
(11), DEA2 (10)
(11), alternative
SFA (11), SFA
coef. -0.483*** -0.488*** -0.434*** -0.326*** -0.333*** -0.331***std. dev. (0.080) (0.084) (0.090) (0.112) (0.114) (0.113)lprod98
P-value 0.000 0.000 0.000 0.004 0.004 0.003coef. 0.739 0.762 0.954 0.208 0.050 0.140std. dev. (0.693) (0.690) (0.708) (0.615) (0.703) (0.694)inv
P-value 0.286 0.269 0.178 0.735 0.943 0.841coef. 3.456 2.763 4.473 1.494 -0.108 1.215std. dev. (2.937) (2.677) (3.593) (2.507) (4.607) (5.730)s or eff.s
P-value 0.239 0.302 0.213 0.551 0.981 0.832Obs 28 28 25 19 19 19
R2 0.709 0.708 0.658 0.524 0.520 0.521
Sources and notes as under Table 16.
142

TABLE F3: TERTIARY SPENDING, EFFICIENCY, CAPITAL DEEPENING AND LABOUR PRODUCTIVITY
REGRESSION RESULTS (EU COUNTRIES ONLY, ALTERNATIVE SFA SCORES)
Equation (13),
alternative SFA
coef. 0.043 std. dev. (0.140) lprod98
P-value 0.758 coef. 1.191*** std. dev. (0.360) kl05/kl98
P-value 0.001 coef. 6.341 std. dev. (4.426) s or eff.s
P-value 0.152 Obs 14
R2 0.492 Sources and notes as under Table 17.
Efficiency scores are those from table E3.
TABLE F4: TERTIARY SPENDING, EFFICIENCY, CAPITAL DEEPENING AND LABOUR PRODUCTIVITY
REGRESSION RESULTS (ALL COUNTRIES)
Equation (12) (13), DEA1
(13), DEA2
(13), alternative
SFA (13), SFA
coef. -0.029 -0.031 -0.011 -0.026 -0.029 std. dev. (0.111) (0.104) (0.105) (0.113) (0.110) lprod98
P-value 0.795 0.768 0.915 0.815 0.793 coef. 0.983*** 1.065*** 1.174*** 1.019*** 1.092*** std. dev. (0.301) (0.293) (0.298) (0.316) (0.301) kl05/kl98
P-value 0.001 0.000 0.000 0.001 0.000 coef. 3.298 3.706* 5.023*** 4.646 6.709* std. dev. (2.281) (1.919) (1.914) (3.483) (3.532) s or eff.s
P-value 0.148 0.053 0.009 0.182 0.058 Obs 16 16 16 16 16
R2 0.484 0.520 0.552 0.473 0.511
Sources and notes as under Table 17.
143

TABLE F5: TERTIARY SPENDING, EFFICIENCY AND TOTAL FACTOR PRODUCTIVITY
REGRESSION RESULTS (EU COUNTRIES ONLY, ALTERNATIVE SFA SCORES)
Equation (14),
alternative SFA
coef. 5.997 std. dev. 4.669 s or eff.s
P-value 0.199
Obs 14
R2 0.108 Sources and notes as under Table 18.
Efficiency scores are those from table E3.
TABLE F6: TERTIARY SPENDING, EFFICIENCY AND TOTAL FACTOR PRODUCTIVITY REGRESSION RESULTS (ALL COUNTRIES)
Equation (14) (15) DEA1
(15) DEA2
(15) alternative
SFA
(15) SFA
coef. 3.457 3.950* 4.745** 4.180 5.986 std. dev. 2.452 2.091 2.097 3.796 4.031
s or eff.s
P-value 0.159 0.059 0.024 0.271 0.138 Obs 16 16 16 16 16 R2 0.097 0.172 0.195 0.063 0.115
Sources and notes as under Table 18.
144

TABLE F7: EFFICIENCY IN TERTIARY SPENDING AND UNEMPLOYMENT RISK OF ADULTS REGRESSION RESULTS (EU COUNTRIES ONLY, ALTERNATIVE SFA SCORES)
alternative SFA
coef. 0.022** std. dev. (0.009)
gradshare
P-value 0.011 coef. -0.575*** std. dev. (0.092)
U2564
P-value 0.000 coef. -0.005 std. dev. (0.030)
eff
P-value 0.868 Obs 17 R2 0.725
Sources and notes as under Table 19.
Efficiency scores are those from table E3.
TABLE F8: EFFICIENCY IN TERTIARY SPENDING AND UNEMPLOYMENT RISK OF ADULTS REGRESSION RESULTS (ALL COUNTRIES)
DEA1 DEA2 alternative SFA
SFA
coef. 0.023*** 0.022** 0.020** 0.022*** std. dev. (0.008) (0.009) (0.009) (0.008)
gradshare
P-value 0.004 0.011 0.020 0.005 coef. -0.595*** -0.661*** -0.527*** -0.592*** std. dev. (0.080) (0.077) (0.103) (0.116)
U2564
P-value 0.000 0.000 0.000 0.000 coef. 0.006 -0.007 0.011 -0.028 std. dev. (0.011) (0.009) (0.032) (0.021)
eff
P-value 0.566 0.434 0.719 0.179 Obs 28 25 19 19 R2 0.800 0.790 0.695 0.710
Sources for EU countries and notes as under Table 19. For the USA and Japan, variable gradshare is an average
of years 1999 and 2006, collected respectively from OECD(2001) and OECD(2008); the unemployment rates are
2000-2006 averages, from OECD(2008) in the case of U2564ter and U2564sec, and from stats.oecd.org in the
case of U2564.
145

146
TABLE F9: EFFICIENCY IN TERTIARY SPENDING AND UNEMPLOYMENT RISK OF YOUNG WORKERS REGRESSION RESULTS (EU COUNTRIES ONLY, ALTERNATIVE SFA SCORES)
alternative SFA
coef. 0.023 std. dev. (0.029)
gradshare
P-value 0.424 coef. -0.532** std. dev. (0.226)
U2564
P-value 0.019 coef. -0.096 std. dev. (0.105)
eff
P-value 0.364 Obs 17 R2 0.179
Sources and notes as under Table 20.
Efficiency scores are those from table E3.