study on the effective integration of distributed energy ... · insights. delivered. study on the...
TRANSCRIPT

Insights. Delivered.
Study on the effective integration of DistributedEnergy Resources for providing flexibility to theelectricity system
Final report to The European Commission
20 April 2015
Proj no: 54697590000

20 April 2015 2A report to The European Commission
Study on the effective integration of Distributed EnergyResources for providing flexibility to the electricity system
Disclaimer
This document has been prepared for the European Commission however it reflects theviews only of the authors, and the Commission cannot be held responsible for any use whichmay be made of the information contained therein.

20 April 2015 3A report to The European Commission
Study on the effective integration of Distributed EnergyResources for providing flexibility to the electricity system
AcknowledgementThe work is a result of the contribution of several organizations, and more importantly thepeople behind those organisations. The work has been followed by a steering committeeconsisting of representatives of the European Commission and CEER. During the studyinterviews with several industry association and market participants including CEDEC,ENTSO-E, EFET, EDF, Eurelectric, Eurogas, GDF SUEZ, GEODE, Ngenic and SEAM.SEAM was one of several aggregators suggested to by SEDC for interviews.
We are very grateful for all the valuable comments and suggestions received from thesteering committee and the consulted organisations. Any remaining errors or omissions arethe sole responsibility of the analysis team.

20 April 2015 4A report to The European Commission
Study on the effective integration of Distributed EnergyResources for providing flexibility to the electricity system
(left blank)

20 April 2015 5A report to The European Commission
Study on the effective integration of Distributed EnergyResources for providing flexibility to the electricity system
Table of Contents
Foreword 9List of acronyms 10Executive Summary 111 Introduction 171.1 Background 171.2 Flexibility 181.3 Distributed Energy Resources 181.4 A policy framework 191.5 Scope and outline of the report 222 Demand for flexibility from new sources 232.1 Global flexibility gap 232.2 Local flexibility gap 31
2.2.1 Voltage problems 322.2.2 Reverse power flows 322.2.3 Congestions 332.2.4 Grid losses 332.2.5 Case studies 34
3 Flexibility value streams 393.1 Regulated beneficiaries 40
3.1.1 System level 433.2 Unregulated beneficiaries 48
3.2.1 Local level 483.2.2 Global level 49
4 Market value of flexibility 514.1 Price volatility in the day-ahead market 514.2 Price on the day-ahead and intraday market varies 574.3 Intraday market prices revealing the value of flexibility 585 DER provision of flexibility 645.1 Demand Response and electrification of heat sector 64
5.1.1 Demand management in industrial installations 655.1.2 Demand management in the commercial and residential sector 655.1.3 Prosumers 675.1.4 Power to Heat 67

20 April 2015 6A report to The European Commission
Study on the effective integration of Distributed EnergyResources for providing flexibility to the electricity system
5.2 Distributed Generation 685.2.1 Flexibility in biogas power plants 685.2.2 Flexibility in combined heat and power (CHP) 685.2.3 Flexibility from variable renewable energy sources 69
5.3 Distributed storage 705.3.1 Pumped hydro storage 715.3.2 Compressed Air Energy Storage 715.3.3 Flywheels 725.3.4 Batteries 725.3.5 Power to Gas 72
5.4 Batteries of electric vehicles (EV) 735.5 Role of enabling ICT and communication infrastructure 745.6 Sources of value for DER flexibility 745.7 Cost effectiveness of DER 78
5.7.1 Cost structure of DER 785.7.2 Key drivers affecting DER cost-effectiveness 795.7.3 Drivers impacts on cost effectiveness of DER 825.7.4 Cost effectiveness of DER flexibility – Main messages 87
6 Linking supply and demand of flexibility – the value chains 896.1 Different trading arrangements related to flexibility 89
6.1.1 Time horizons 896.1.2 Arrangements for acquiring resources 91
6.2 Existing market places – a brief overview 936.2.1 Difference between capacity and energy remuneration mechanisms 946.2.2 Capacity remuneration 946.2.3 Future and forwards markets 956.2.1 Day-ahead market 956.2.2 Intraday market 966.2.3 Balancing markets 96
6.3 Regulated markets 966.4 Unregulated markets 1046.5 Imbalance responsibility and imbalance settlement 110
6.5.1 Imbalance responsibility for RES 1106.5.2 Imbalance settlement 111
7 Roles and relations in the market 1147.1 The current model 114
7.1.1 Transmission system operator, TSO 115
20 April 2015 7A report to The European Commission
Study on the effective integration of Distributed EnergyResources for providing flexibility to the electricity system
7.1.2 Distribution system operator, DSO 1167.1.3 Central generator 1167.1.4 Supplier 1167.1.5 Balance responsible party 1167.1.6 Consumers 117
7.2 Changes in roles and responsibilities in a future model 1177.2.1 Roles and responsibilities 1177.2.2 Aggregators 1187.2.3 Prosumers 1227.2.4 Balance responsible party 1237.2.5 Distribution system operator 1247.2.6 Transmission System Operator 1247.2.7 Traditional generators 124
7.3 Reactive or Active demand side participation in the day-ahead market 1257.4 Capturing the value streams today – some good examples 126
7.4.1 Demand response and PJM 1267.4.2 Aggregator in Austria – frequency control from electrical heaters 1287.4.3 Aggregator in Finland – frequency control from demand response 1307.4.4 Aggregator of heat pump control in Sweden 1317.4.5 Future business cases – using storage as a service 133
8 Current barriers 1358.1 Lack of markets 1358.2 Lack of market access 138
8.2.1 Market access for aggregators 1388.2.2 Market rules and product definition 140
8.3 Lack of price pass-through 1428.3.1 Regulated end-user prices 1428.3.2 Feed-in tariffs 1458.3.3 Net metering 1458.3.4 Fixed prices are dominating 145
8.4 Economic regulation of DSOs 1488.4.1 Classification of storage and unbundling of distribution 1498.4.2 Network tariffs 1508.4.3 Taxation and surcharges 151
8.5 Technical barriers 1519 Key findings 1539.1 The power system changes 153

20 April 2015 8A report to The European Commission
Study on the effective integration of Distributed EnergyResources for providing flexibility to the electricity system
9.2 Distributed Energy Resources can provide flexibility 1549.3 There are still barriers for Distributed Energy Resources 15510 Recommendations 15710.1 Flexibility needs adequate markets and remunerations 15710.2 Regulators have to establish a level playing field for all actors 15910.3 The future is consumer centric 16011 References 162APPENDIX 165Technological fact sheets 166

20 April 2015 9A report to The European Commission
Study on the effective integration of Distributed EnergyResources for providing flexibility to the electricity system
Foreword
This report has been prepared for the European Commission under the Framework ServiceContract No SRD MOVE/ENER/SRD.1/2012-409-lot2 by a consortium led by PwC. For thisstudy the work has been led by Sweco in cooperation with Ecofys, Tractebel Engineeringand PwC.
The work was divided into three tasks:
■ Task 1: Description of different flexibility resources, their level of maturity inproviding services to the market and identification of the need for flexibility fromDER and the potential for these resources in the EU.
■ Task 2: Analyse existing situation for DER participation in the energy market witha focus on market conditions and identification of barriers for decentralisedflexibility to participate in energy markets and provide services to different actors.
■ Task 3: Conclusions and recommendation for the further development andintegration of decentralised flexibility resources on EU level.
The analysis team has been led by Niclas Damsgaard (Sweco). Task leaders for task 1 havebeen Georgios Papaefthymiou and Katharina Grave (Ecofys) and task leader for task 2 hasbeen Jakob Helbrink (Sweco). In addition the core team has consisted of Vincenzo Giordano(Tractebel Engineering) and Paolo Gentili (PwC). In addition to the core team valuablecontributions have been made by several of our colleagues from the participatingcompanies.
In addition to the interviews a stakeholder consultation workshop was held in Brussels on 24September, 2014 during which a draft version of the report was presented and discussed.The participants had been provided with the draft report in advance of the workshop, butstakeholders were also invited to provide written comments after the workshop.

20 April 2015 10A report to The European Commission
Study on the effective integration of Distributed EnergyResources for providing flexibility to the electricity system
List of acronyms
AA-CAES Advanced Adiabatic Compressed-Air Energy StorageBRP Balance Responsible PartyBaU Business As UsualCapital Expenditure CAPEXCHP Combined Heat and PowerCAES Compressed-air energy storageProsumers Consumers with local generationDAM Day-ahead marketDR Demand ResponseDER Distributed Energy ResourcesDG Distributed GenerationDSO Distribution System OperatorEV Electrical VehicleENOP Energy Options MarketFIT Feed-in TariffsFCR Frequency Containment ReserveFRR Frequency Restoration ReserveG2V Grid to vehicle, power from grid to vechiclesHHI Herfindahl-Hirschmann IndexISP Imbalance Settlement PeriodIoT Internet of ThingsID Intraday marketLCOE Levelised cost of electricityO&M Operation and maintenance costsOPEX Operational ExpenditurePV Photo voltaic electricity generationPHS Pumped hydro storageRES Renewable Energy SourcesRR Restoration ReserveSTOR Short Term Operating ReserveTOTEX Total ExpenditureTSO Transmission System OperatorVRES Variable Renewable Energy SourcesV2G Vehicle to Grid injectionVPP Virtual Power PlantWAP Weighted Average Price

20 April 2015 11A report to The European Commission
Study on the effective integration of Distributed EnergyResources for providing flexibility to the electricity system
Executive Summary
This study focuses on the efficient market integration of Distributed Energy Resources (DER)in order to provide flexibility to the power system. The undergoing changes in the powersystem with increasing shares of Variable Renewable Energy Sources (VRES) will increasedemand for flexibility and at the same time decrease supply of flexibility from traditionalsources. Because VRES are mainly connected to the distribution grids, their expansion putsa focus on local integration challenges. Flexible DER can provide services to fill flexibilitygaps on the local and on the transmission level. The technologies needed are available, thechallenge is to adjust to the institutional set-up and the technical environment to make themmarket ready. During the implementations of these changes it is important to remember thatthe introduction of DER flexibility provision should always be built around providing economicefficiency, and that DER flexibility provision is not a target by itself.
DER can provide flexibility
Growing shares of VRES in the generation portfolio increase the demand for flexibility. Dailypatterns in demand for power generation lose their predictability. Changes in load from onehour to the next hour (ramps) grow. VRES are mainly connected to distribution grids. Inaddition to other distributed generation (DG), they therefore increase the complexity ofdistribution grid management. At the same time, VRES and DG replace supply fromtraditional sources of electricity generation. Existing central power plants have loweroperational times and cannot balance the changes in residual demand. They cannot coverthe flexibility gap on distribution grid level.
There are plenty of options to provide flexibility on the distribution grid level. Their potentialisnot fully used. The study gives an overview on the characteristics of available flexibilityoptions from DER. Technological evolutions are reducing the cost of DER flexibility, and thecost-effectiveness of DER flexibility is on the rise. Increasing price volatility improves thebusiness case for flexibility.
There are several concrete examples of DER providing flexibility to the system alreadytoday. Flexible generation from DG and storage options are already locally used to balancedemand and supply in electricity systems. Also, demand side participation is by no means anew concept, but can be traced back to the 1960s via Time-of-Use tariffs. Worth noting isthat the traditional Time-of-Use tariffs are better suited for a system where both demand andsupply is predictable and known on forehand, which is expected to be reduced in a futurewith significant shares of VRES.
The energy customers need to be in focus
The customers will be central in the transition to a low carbon electricity system with highshares of renewable energy. When large shares of generation capacity is not controllableand depends on weather phenomena, the demand side has to react to system needs. Inaddition consumers who also have their own production (“prosumers”) are likely to become
20 April 2015 12A report to The European Commission
Study on the effective integration of Distributed EnergyResources for providing flexibility to the electricity system
more common, making the customers even more central. Increasing the customers’responsiveness, will benefit both the total power system and contribute to empowering thecustomers. In the end, the entire purpose of the energy system is to serve the needs of theconsumers.
Aggregators are crucial for DER integration and coordination is needed
There are plenty of distributed generation and storage facilities as well as flexible consumersand prosumers that can provide flexibility. Each one of these are small. Aggregators areneeded to capture the flexibility from many small size sources. This crucial role can be filledby many different types of entities, e.g. suppliers, retailers, telecommunication companies orspecialised new companies. Competition between these entities can stimulate innovationand development of new services and solutions. Clarifying the roles and responsibilities ofan aggregator is therefore essential to facilitate active participation of DER in electricitysystems.
While the aggregator role is important for the integration of DER, it may also give rise toconflict of interests. The actions of an aggregator can have negative impacts on other marketparticipants. For instance, it may give rise to imbalances for Balance Responsible Parties(BRP). There is a need for coordination between aggregators and BRPs when an aggregatoris operating on the deregulated market segments such as Day-Ahead (DAM) and Intraday(ID) markets. In particular, if an aggregator is an active market participant on these markets itis necessary that the aggregator has its own balance responsibility, or an agreement with aBRP. It is important to emphasize that no market participant, being an aggregator or acustomer, is allowed to “sell back” energy which it has not bought in the first place. Demandreduction is thus not a product that can be sold on the market, unless the energy previouslyhas been purchased.
Provision of ancillary services in real time, such as balancing or congestion management, isin many ways simpler. The key issue here is that adjustments have to be made in thesettlement process ex-post in order not to financially penalize (or unduly remunerate) thirdparty market participants, e.g. other BRPs. As long as the appropriate adjustments in thesettlement are done, there is limited need for coordination between the aggregator andaffected BRPs.
In addition to coordination between aggregators and BRPs, there will also be a need forcoordination between DSOs and TSOs. DSO grid operation is expected to become morecomplex and go from the traditionally passive operation to a more active operation similar tothe operation of the transmission grid. DSO actions may then interfere with the TSO’soperation. This indicates a need for coordination between the TSO and DSO, potentially withsome type of platform for bid exchange and activation of resources. There might also ariseconflicts between DSO and TSO. When the conflicts relates to physical requirements, it isimportant to remember that the conflicts that need to be resolved are subject to the physicalconstraints. Effectively, physical constraints may in some cases limit the availability of DERfor market participation. As local problems can only be solved at the local level, the physical

20 April 2015 13A report to The European Commission
Study on the effective integration of Distributed EnergyResources for providing flexibility to the electricity system
needs of the DSO will take precedence. However, if it is more an economic competition forthe same resource the willingness-to-pay will determine who gets access to the resource.
Barriers for aggregators and DER remain
Generally speaking there are several barriers for both aggregators and DER. Market rulesand product definitions are historically designed to fit with the needs of central generators.While there is a process of adjusting these to facilitate for new resource providers, there ismore to be done. For example, minimum bid size and bid increments have been loweredsubstantially in day-ahead markets (DAM). Currently the threshold in DAM is typically at 0.1MW, which implies good possibilities for aggregators and DER participation. While such adecrease has taken place also in some balancing markets, minimum bid size and bidincrements remain high in many balancing markets and in some cases are as high as 50MW. This constitutes an important barrier for DER market participation. Furthermore,activation rules could have significant impact on the possibilities for demand sideparticipation, and this impact need to be considered when defining such rules. Longactivation periods (duration) or high frequency of activation may for example exclude manytypes of demand side participation. In the demand response participation on the PJM market(US) there are several different demand response “products” that can be supplied where theduration and frequency varies.
Communication infrastructure is essential
In order to make use of DER to provide flexibility especially on the system level,communication infrastructure is essential. Depending on installed functionalities, smartmeters can enable the adoption of dynamic tariffs and the introduction of demand responsebased on price signals. This requires that Smart Meter data (including prices in highresolution) can be made available to the user. This is not always the case for deployed smartmeters but solutions exist to add this functionality. As already commonplace in the US, smartmeters could also allow the introduction of automatic demand response programs to mitigatepeak events without relying on price signals. In this case grid operators or utilities need directaccess to smart devices to adjust their consumption to flexibility needs.
In addition to the metering and communication infrastructure specific for the power market,the connectivity is increasing fast with other types of metering and communication (“Internetof Things”). There are already examples of business cases for flexibility that is not using theofficial metering equipment and communication infrastructure. In the study one example fromAustria illustrates how an aggregator provides frequency reserves to the TSO from domesticelectrical water heaters using the SMS and cellular technology for communication andcontrol.
The true value of flexibility is not always revealed in market prices
First of all it is important to recognize that the value of flexibility varies significantly both on ageographical level and across time. In many cases the underlying market value is still likelyto be a limiting factor for DER participation. This could for instance be due to abundant

20 April 2015 14A report to The European Commission
Study on the effective integration of Distributed EnergyResources for providing flexibility to the electricity system
alternative resources, such as reservoir hydro power plants in parts of Europe. However, thetrue value of flexibility is not always revealed in the market prices.
Increasing the revealed value of flexibility by reducing the length of Imbalance SettlementPeriods (ISP)
One example analysed in the study is the impact of different Imbalance Settlement Periods(ISP). The German intraday market offers contracts both on an hourly and 15-minute basis.By studying the price differences between the contracts systematic differences could bedetected. The hourly prices hide some of the value of flexibility, and shortening the ISPscould contribute to revealing more of the true value. There are also other considerations thatneed to be balanced against when determining the appropriate ISP and the value ofshortening ISP will also differ across markets. It is therefore not necessarily the case that thesame ISP is optimal for all markets. Worth noting is that the current trend is towards shorterISP throughout Europe, and in the latest draft of the Network Codes it is enforced that theISP should not be longer than 30 minutes.
Revealing the local value of flexibility by a more granular spatial market representation
The value of flexibility is also different in different areas. On a market level this is shown bydifferences in price volatility between different parts of Europe (based on DAM prices), andmodel simulations also indicate that while an increase in volatility can be expected it is likelythat there will be geographical differences across Europe also in the future.
However, the true local value of flexibility is not completely revealed in these prices as theuse of fairly large bidding areas in most of Europe hide local differences and limit theincentives for flexibility in areas where it is most needed. Italy is one country divided intoseveral prices zones, as well as separate prices for some congested nodes. The pricevolatility is significantly higher in some of the congested nodes, showing a clearly highervalue of flexibility in these areas. It is however only the generators that meet the local price,while customers meet a weighted average price across the areas, implying that thecustomers do not meet the full local value of flexibility through these market prices. Again,there will be several circumstances that need to be considered when defining bidding areas,but a sufficiently granular spatial market resolution is needed to reflect the characteristics ofthe network in a reasonable way and reveal the local value of flexibility. However, goingfurther down into the distribution level there will be even more local conditions leading todifferent values of flexibility. This is not likely to ever be revealed in e.g. the DAM or IDmarket price, as it would require an extreme granularity.
Ensuring pass-through of market value of flexibility
Even if the market prices on DAM and ID reveal the value of flexibility, the information is notalways passed-through to end-customers or other providers of flexibility. There are severalregulatory and institutional arrangements that prevent this from happening. Regulated end-user prices are common in many European countries, and are likely to limit, or completelyremove, any short term price pass-through. The value of flexibility will then not be revealed

20 April 2015 15A report to The European Commission
Study on the effective integration of Distributed EnergyResources for providing flexibility to the electricity system
to the end-customers. Furthermore, the feed-in tariffs effectively insulates the producer fromthe market prices and also removes incentives for flexibility. Thirdly, lack of hourly meteringand/or net metering of prosumers leads to customers do not face the real-time value of theelectricity. In the case of net metering, the grid is artificially used as storage for the prosumerand the value of electricity will be the same independently if it is consumed or produced.
Network tariffs should also reflect the value of flexibility. However, the value of flexibilitycould also be revealed through bilateral contracts, or tendering, which is likely to be the casefor products that have very local characteristics.
Organised market places not the only solution
For very local markets it is likely that the market concentration will be high, with possibly onlyone or a few suppliers of flexibility. DER can add competition to concentrated markets, but itis likely that some markets will remain very concentrated. For instance, there will be caseswhere there is only one or a few potential providers of local services in a part of a distributiongrid. At the same time it is important to remember that it is often difficult to foresee thepossibilities of opening up markets. The supply may be larger than expected.
In markets that nevertheless remain highly concentrated and illiquid, the impact of onemarket participant on market prices could be significant. One additional supplier of flexibilitycould then significantly reduce the (shadow) value of flexibility and undermine the businesscase. In these cases other arrangements such as tendering and capacity payments couldthen be more suitable.
Taxes and network tariffs affect the business case for storage
Charging of distributed storage is in many cases regarded as consumption and subject topaying consumption taxes and surcharges. In contrast, large scale pumped hydro storageare often exempted from paying consumption taxes. For the distributed storage this createsa wedge between the price paid for charging the storage and the price received whendischarging. The price differences that are needed to finance a storage will then have toincrease before the storage becomes profitable.
Similar effects may arise due to the design of network tariffs, where storage could be subjectboth to consumption and production subscriptions. This may also be the case for pumpedhydro connected to the transmission grid. Storage should pay for the costs it causes thenetwork owner, but this type of tariff structure make the business case for storage moredifficult.
DSO regulation and tariff setting important
Increased use of DER for the operation of the DSO network would typically imply a decreasein CAPEX (reduced investments in grid) and an increase in OPEX (remuneration of flexibilityprovision). Throughout Europe the electricity networks are subject to monopoly regulation,

20 April 2015 16A report to The European Commission
Study on the effective integration of Distributed EnergyResources for providing flexibility to the electricity system
although the details of the regulations differ. This study has not included a mapping of thenational DSO regulations, but points at some general issues.
First of all, a common regulatory model is to build up the regulated revenues from CAPEXand OPEX. The CAPEX remuneration is determined by the regulatory asset base, andreduced investments leading to a reduced asset base, will then decrease the CAPEXremuneration. OPEX remuneration is done in several different ways, but typically an OPEXincrease is not allowed to be passed on directly into the regulated revenue. This could leadto incentives not to optimize the CAPEX/OPEX mix. The problems are even more severe ifthe increase in OPEX comes before a decrease in CAPEX, which would be the case if futureinvestments are avoided or postponed. This is of key importance as the vast majority of thelocal flexibility needs have historically been resolved by grid reinforcement (CAPEX).
In general, focusing on total costs (TOTEX) rather than CAPEX and OPEX separately shouldprovide better incentives for the DSO to optimize. In practice the regulatory arrangementswill be complex, and are not outlined in detail in this study.
In addition to the regulation of the overall revenues, the tariff structures are sometimessubject to regulation. Typically there is a non-discriminatory condition, but the regulation mayalso go further prescribing the tariff structure. For the purpose of integrating DER it isimportant that the network tariffs are designed in a way that provides the proper incentivesbased on the local conditions. As the local conditions will differ, the DSOs should be allowedflexibility in designing tariffs tailored to the solutions that best meet the local needs, withoutunduly restrictive regulation.
Concluding remarks
As the power system is changing the demand for flexibility is likely to increase. At the sametime the supply of flexibility from traditional sources is likely to decrease. DERs could beimportant contributors of flexibility to bridge this gap.
As the study shows that flexibility options from DER are available, and the cost-effectivenessof DER flexibility is on the rise, it is important that the institutional arrangements are adaptedto accommodate for DER flexibility. While the EU policy and regulatory setup allows for DER,there are remaining barriers. This ranges from regulatory set-up, market arrangements aswell as a general need to develop business models and approaches. Flexibility fromregulators, TSOs and DSOs and a readiness to adapt rules and regulations that can supportdeveloping business cases are important.
New roles will also develop in the market. Customers will play a central role in the futuresystem. The customers will provide demand response, but with prosumers becoming morecommon they will also have access to generation. Aggregators will however be important torealize the potential of many small resource providers, being customers, distributedgeneration or storage. The current market design is for historical reasons often based on theneeds of central generators. This has already started to change, and should continue inorder to integrate flexibility from DER.

20 April 2015 17A report to The European Commission
Study on the effective integration of Distributed EnergyResources for providing flexibility to the electricity system
1 Introduction
Power systems in Europe are undergoing a significant change. Decarbonisation andtechnological development are increasing reliance on renewable technologies, primarilyvariable weather-dependent resources such as wind and solar. Accommodating therelatively less controllable and predictable output of the new technologies is driving changesin the composition and operation of the entire power grid.
Balancing of generation and consumption at all times requires flexibility in the system.Traditionally, flexibility was provided in power systems almost entirely by monitoring thesupply side and controlling the generation.
Increasing reliance on variable renewable energy sources (VRES) for large fractions of theelectricity production in power systems introduces new challenges to power system planningand operation. In this respect, increasing controllability and flexibility of the (variable) supplyand of the demand is a key pathway towards a more robust system.
1.1 Background
Power systems comprise power sources (supply) and sinks (demand) which aregeographically spread and are connected through the power network. Their operation isdefined based on a set of system rules aiming to ensure a spatial and temporal balancing ofgeneration and consumption at all times (see Figure 1).
Figure 1: Schematic representation of the power system operational principle.
Source: Ecofys
Traditionally, differences in demand and supply in power systems have been balancedalmost entirely by monitoring the supply side and controlling the generation. The generationfleet had to follow all variations in the demand (variability) and to ensure that the system

20 April 2015 18A report to The European Commission
Study on the effective integration of Distributed EnergyResources for providing flexibility to the electricity system
stays in balance in the case of the sudden loss or any other change of a generating unit(uncertainty). Thus, variability has historically been an issue primarily related to demand,while uncertainty was an issue primarily related to supply. The main duty of power networksis to transport/distribute energy and interconnect areas. Finally, the system operational rulesdefine how resources are utilised on day-to-day operation.
1.2 Flexibility
With the introduction of variable supply sources, power system planners and operators arerecognizing that power systems need new ways of balancing supply and demand. Theconcept of “flexibility” in power systems gained importance:
"On an individual level, flexibility is the modification of generation injectionand/or consumption patterns in reaction to an external signal (price signal oractivation) in order to provide a service within the energy system. Theparameters used to characterise flexibility in electricity include: the amount ofpower modulation, the duration, the rate of change, the response time, thelocation etc." (Eurelectric, 2014)
Flexibility services include “up regulation” that means providing additional power as neededto maintain system balance, and “down regulation” that means reducing the poweravailability in the system. “Ramping capability”1 is an expression of how fast flexibleresources can change demand or supply of power.
1.3 Distributed Energy Resources
Distributed energy resources (DER) consist of small- to medium- scale resources that areconnected mainly to the lower voltage levels (distribution grids) of the system or near the endusers. Key categories are:
■ Distributed generation (DG): power generating technologies in distribution grids.The category comprises dispatchable resources like cogeneration units or biogasplants and variable renewable energy sources (VRES) that depend on fluctuatingenergy sources like wind and solar irradiation.
■ Energy storage: batteries, flywheels and other technologies that demandelectricity and supply electricity at a later point in time
■ Demand response (DR): Changes of electric usage by end-users from theirnormal consumption patterns in response to market signals such as time-variableprices or incentive payments
In particular in the longer run when such technologies are likely to replace larger shares oftraditional generation technologies this could incur challenges to the power system. A basicchallenge introduced by variable renewable generation is that it increases the complexity ofsystem balancing (in spatial and temporal terms) due to the unpredictability and spatial
1 Ramping is defined as the power change (could be both generation and load) between twoconsecutive time periods.

20 April 2015 19A report to The European Commission
Study on the effective integration of Distributed EnergyResources for providing flexibility to the electricity system
dispersion of power production. Another important challenge is that to a significant extentvariable renewable generators are also likely to be connected to low and medium voltagedistribution systems. The introduction of such distributed energy resources (DER) creates aparadigm shift in power systems. In ‘traditional’ power systems, power generation is mainlyconnected to the high voltage transmission grid in the form of centrally controlled large scalepower plants. Distribution grids were traditionally designed as ‘passive’ networks, containingmainly loads. In such power systems, power flows are uni-directional, from the high voltagetransmission grid to the loads in the lower voltage levels of the system. Increasedpenetration levels of DER transform distribution grids to ‘active’ systems which, together withloads, contain high shares of generators and energy storage devices. This new systemstructure implies bi-directional power flows between distribution and transmission systems,since distribution grids will export power at times when local generation exceedsconsumption. This evolution brings higher complexity in the management of distributionsystems, but also new possibilities to optimise the overall system by allowing distributionsystems to participate actively in the system operation and by allowing DER to participateactively in the distribution system management.
The idea of power system flexibility has been introduced to describe the modification ofgeneration injection and/or consumption patterns in reaction to an external signal (pricesignal or activation) in order to provide a service within the energy system. This generallyencompasses the extent and speed with which generation or consumption levels can bechanged. Historically, DER only marginally contributed to power system flexibility. But theprovision of flexibility from DER can also contribute to both global/market wide and localflexibility challenges. There are however several challenges for efficient market participationof flexible DER, and new designs or business models are likely to be needed to facilitateflexible DER. Addressing these issues can improve the prospects for DER, facilitate higherlevels of variable renewable resources on the grid, and allow the customers to take over anactive role for distribtion systems on the optimal operation of the power system.
1.4 A policy framework
Energy policy is formed in the interaction between several, possibly conflicting, targets.Security of supply will always be a key target in any energy policy, although the emphasis onsecurity of supply will differ over time and geographies depending on a number of factors.Energy production and transmission of energy will always have some negativeenvironmental impact and environmental sustainability has for a long time also been a keytarget in energy policies. The type of environmental problems addressed has shifted overtime. As problems around local pollution have decreased, the main emphasis moved toclimate change. The third target relates to economic efficiency, i.e. how can we ensure theenergy supply in the most cost efficient manner. Sometimes the focus is a bit narrower, witha strong emphasis on e.g. low prices and industrial competitiveness which is not necessarilythe same thing as an economic efficient supply.
While these three elements always play a role in virtually any energy policy the emphasisshifts over time. There seems to be a tendency that if the focus is biased towards one ofthese elements, which balance will over time shift back and more emphasis will be put on theother two.

20 April 2015 20A report to The European Commission
Study on the effective integration of Distributed EnergyResources for providing flexibility to the electricity system
Figure 2. The energy policy triangle
This study focuses on the efficient integration of DER and there is a clear link from theenergy policy targets to the focus of the study, which is illustrated by the policy cascadeFigure 2. This cascade starts with the overarching energy policy targets (security of supply,environment and economic efficiency). With the introduction of large shares of VRES, newsources of flexibility are needed, and DER can provide at least part of that flexibility in orderto maintain a secure energy system.
It is well established that efficient markets will also lead to efficient outcomes. A cornerstoneof European energy policy is therefore the establishment of the internal energy market, withall its different elements. Through market integration the resources are expected to be usedmore efficiently which will both reduce costs and decrease environmental impact since lessefficient power plants are not needed to the same extent. Market integration is also expectedto improve the security of supply as disturbances in the system not only need to be met bydomestic resources, but trade can to a larger extent help to alleviate problems.
Thirdly there is a general expectation, which is also supported by this report, that thetransformation of the electricity system towards more VRES, will both increase the demand(need) for flexibility in the power system, and over time reduce the supply of flexibility fromconventional generation sources. The VRES will both come in the form of centralised largeparks and smaller distributed resources. The VRES in general creates a flexibility gap on asystem level, but distributed VRES can also create new needs for flexibility at the local level.DERs can at the same time contribute to filling this gap. Given the central role of markets indeveloping an efficient system, market integration of flexible DERs becomes crucial. This isthe main focus of this report.
A final step in this cascade is the customer centric approach and the empowerment ofcustomers. DER includes generation, storage and demand side measures. All of these areimportant. However, while distributed generation and storage may be supplied independently

20 April 2015 21A report to The European Commission
Study on the effective integration of Distributed EnergyResources for providing flexibility to the electricity system
of customers we expect that the customers will play a key role in the future. The emergingtrend towards consumers who are also producers, so called prosumers, illustrates this. Theinvolvement of the customers, independently of whether they are prosumers or pureconsumers, is likely to be vital for the successful integration of DER. This drives towards acustomer centric approach, which also has an additional value that it can empower energycustomers.
Figure 3. An energy policy cascade
Source: Sweco, team analysis
A customer centric approach does not mean that we expect that all customers will be activein supplying flexibility or participating in the different markets. First of all, we expect that mostcustomers are not particularly interested in spending a significant amount of time orresources on this, i.e. very few customers will be active themselves on a day-to-day basis.Rather there will be solution providers of different kinds that will support the customers andenable their market participation. We expect that so called aggregators will play a key rolenot only for demand side participation but also for other DERs (e.g. small scale generators).
Secondly, the possibilities for customers to actually supply flexibility will differ. Somecustomers will have a significant amount of flexible load, at least at some points in time.Looking at the household sector it ranges from large houses with electric heating orsignificant cooling demand, to small apartments with limited electricity consumption. Suchdifferences also exist in other sectors. The key will be to enable participation of thecustomers that have the underlying potential for flexibility. If this is successful it will alsobenefit non-active customers since it reduces the overall cost of the system.
The organised energy market places typically have strong and active supply sides(generators), but rather weak and inactive demand side (customers). This leads to less
Energy policytargets
•Security of supply•Environment•Economic efficiency
Developmentand use ofmarkets
•Reduced production costs•Increased competition•Reduced environmental
impact•Increased security of supply
Marketintegration offlexible DERs
•Use markets tofacilitate efficientintegration of flexibleDER
Customercentric
• Empowerment ofcustomers

20 April 2015 22A report to The European Commission
Study on the effective integration of Distributed EnergyResources for providing flexibility to the electricity system
efficient outcomes, difficulties for the markets to function well at all time and potentially alsoproblems with market power. In addition to increasing the efficiency of the system, theempowerment of customers will also strengthen the role of the customers in the energymarkets.
1.5 Scope and outline of the report
The study follows value chains of flexibility in distribution grids and identifies barriers forthese value chains to be fully materialized. We start with defining and discussing flexibilitygaps, and from that identify the value streams from flexibility, i.e. different uses for flexibility.We then outline how different types of DER can contribute to providing flexibility and how thesupply and demand can be linked. This also includes outlining roles and responsibilities in afuture markets that can facilitate efficient integration of DER, but also identify key barriers.Based on this analysis we provide our key findings and recommendation.
The outline of the report is as follows
■ Chapter 2 investigates how a flexibility gap is expected to appear in EU powersystems in the future, identifying the need for flexibility.
■ Chapter 3 looks at the flexibility value streams, with a focus on the users offlexibility in regulated and deregulated parts of the sector.
■ Chapter 4 presents an overview of the market value of flexibility based onavailable and comparable market data.
■ Chapter 5 presents a mapping of the different DER resources and technologiesconcerning their key characteristics for flexibility provision. This includesinvestment costs, technical constraints, barriers and first comments on theirpotential role in future systems. The chapter also assesses the cost effectivenessof DER.
■ Chapter 6 looks at the value chains linking supply and demand of flexibility.■ Chapter 7 provides an overview of current roles and responsibilities in the market.
The chapter also includes a presentation of some selected business cases forDER participation.
■ Chapter 8 studies how the roles and responsibilities would change in a future withmore DER participation. In particular we look at aggregators and prosumers, butalso how roles of other market participants change.
■ Chapter 9 investigates the current barriers for integration of DER.■ Chapter 10 concludes with findings and recommendations.■ In appendix we provide fact sheets for a the DER resources and technologies
presented in chapter 5.

20 April 2015 23A report to The European Commission
Study on the effective integration of Distributed EnergyResources for providing flexibility to the electricity system
2 Demand for flexibility from new sources
As described above the energy system is undergoing substantial changes that create a needfor flexibility from new type of sources. These changes can be traced back to two keydevelopments: the introduction of generation capacity in distribution grids and theincorporation of higher shares of VRES (such as wind and solar energy) to the system2.These developments add to the need for power system flexibility and to the emergence of a“flexibility gap” in the following ways:
a) VRES increases supply side variability and uncertainty, increasing the need forflexibility;
b) VRES and DG can temporarily displace conventional thermal generation capacity,especially peaking units, tending to reduce the availability of conventionalflexible resources on the system;
c) In the longer run, VRES and DG displace conventional power plants and thereforereduce the programmable generation capacity;
d) Generation capacity that is connected to lower voltage levels (distribution networks)induce a radical transformation local distribution systems, from passivenetworks (which include only loads) to active systems which include loads andgeneration and can manage power production and consumption locally.
Although implications depend highly on the specifics of each system, the overarching effectscan be traced into two key aspects: changes in the residual demand, which reveal thechallenges on a system operation level (global flexibility gap) and changes in the systemarchitecture by the incorporation of DG in distribution systems which induce the challengeson the distribution systems level (local flexibility gap). In systems with increasing shares ofVRES, a “flexibility gap” may emerge that will need to be covered by new flexibility options.To illustrate how this gap may emerge, we split our analysis into analysis of global systemaspects (impacts at system operation level) and local aspects (impacts to local networks andsystems).
2.1 Global flexibility gap
In this section we investigate flexibility implications on the power system operation whenintegrating higher VRES shares. Generation from VRES (mainly wind and solar) replacesconventional generation to the extent the fluctuating sources are available. The differentsupply structure changes the operational regime of power required from conventional powerplants. In systems with VRES, the operation of the conventional fleet needs to follow the
2 The terms DG and VRES are used to differentiate between aspects related to unit size(DG) and controllability (VRES). Of course units can belong in both categories, such assmall-sized wind farms or PV installations. However, VRES include also large-scaleinstallations, which add to the impact to the system operation.

20 April 2015 24A report to The European Commission
Study on the effective integration of Distributed EnergyResources for providing flexibility to the electricity system
fluctuations of the residual electricity demand in the system, this is demand minus VRES.The analysis of the variability of residual demand reveals key impacts of VRES on systemlevel: the load changes more often and the differences increase.
To illustrate the increase in flexibility requirements for higher VRES penetration scenarios weanalyse the impacts of VRES on
a) daily patterns,b) yearly dynamic ranges,c) yearly ramping ranges,d) day-ahead markets and one) other (smaller than hourly) timeframes.
The impact of VRES depends on the characteristics of electricity demand and on the chosenVRES scenario. Therefore we analyse three examples for EU countries with differentdemand patterns and varying VRES (wind and PV) penetration levels in terms of share ofVRES generation on the yearly demand:
1. Germany as a central European state, where VRES generation could currentlycover approximately 14,5% of the yearly demand (Eurostat, 2014). Specifically, thecurrent share of wind energy is close to 9,5% and that of PV approximately 5%. Ouranalysis examined penetration levels starting from low (0-20%) to high (60-80%)consisting of balanced growth of both wind and PV based on the current situation.
2. Sweden, representing a Northern European state, with a current share of VRES ofapproximately 8%, while the share of hydro power is about 50%. In case of Swedenthe current share of wind energy is approximately 7,7% and that of PV 0,3%(Eurostat, 2014).. The analysis is therefore performed for VRES shares of up to40%, consisting mainly of wind, assuming that the share of hydro productionremains stable.
3. Spain, as a Southern European state, with a current share of VRES ofapproximately 23%. Wind energy shows high shares around 19% while the currentshare of PV is 4% (Eurostat, 2014).. Similar penetration levels as in the Germancase were examined, consisting again of balanced growth of both wind and PVbased on the current situation.
Regional patterns for wind and solar radiation are used and the analysis is performed onhourly resolution due to data availability. Note that this analysis assumes no additionalflexibility in the system. This means, there is no curtailment of VRES, no changes in cross-border electricity transport patterns, no storage options, and no demand response. Instead,actively operating VRES is treated as a separate source of flexibility in section 5.1 (“ActivePower Control of Renewable Energy”).

20 April 2015 25A report to The European Commission
Study on the effective integration of Distributed EnergyResources for providing flexibility to the electricity system
a) Impact on daily patterns
VRES increase the variability of the residual demand every day. Figure 4 illustrates thechanges in residual demand for a week in spring for Germany. At VRES penetration levels ofapproximately 60%, negative residual demand values appear. The original demand patternsshow nearly repeating demand on weekdays and lower demand on the weekend (right sideof the graph). These patterns are completely changed by increasing levels of windgeneration.
Figure 4: Daily patterns of electricity demand (No RES) and residual electricitydemand (different penetration levels).
Source: Ecofys
The original demand patterns in Spain (left graph in Figure 5) show a stronger peak demandat noon. The integration of 20% VRES does not radically change the residual demandpatterns, and mainly increases the afternoon valley. However, the variability of residualdemand is increasing when exceeding 40% penetrations. At shares of 60% VRES negativevalues for residual demand are likely.
Similar effects are observed on the Swedish residual demand (spring period) as the share ofVRES increases, as can be seen in the right graph of Figure 3. The integration of wind wouldimply residual demand close to zero already at shares of 40% in the generation mix.
Concluding, the analysis of daily patterns shows that the introduction of VRES brings aradical change of the residual demand patterns, by increasing its daily variability and bytotally altering the otherwise repeating patterns of weekday/weekend demand. This implies asimilarly radical change on the generation system planning: power plants cannot planoperation in a repeating daily pattern but should adjust operation daily.

20 April 2015 26A report to The European Commission
Study on the effective integration of Distributed EnergyResources for providing flexibility to the electricity system
Figure 5: Daily patterns of electricity demand (No RES) and residual electricitydemand (different penetration levels)
Source: Ecofys analysis for Spain (left) and Sweden (right)
b) Impact on yearly dynamic ranges
Figure 6 illustrates the corresponding change in yearly demand duration curves forGermany. All 8760 hourly demand values of the example year are sorted largest to smallest.This is a common approach in the engineering and analysis departments and shows the loadduration curve. The figure shows the increasing variability in residual demand with growingVRES penetration levels. While the absolute peak decreases little, low values become moreoften. With very high VRES shares, significant oversupply events occur: VRES generation insingle hours are below original demand of the same hour, the residual demand is negative.The same trend also applies for the cases of Spain and Sweden. Concluding, higher VRESshares increase the yearly variability of residual demand, and push the overall load curvedownwards, without however reducing significantly system peak.
20 April 2015 27A report to The European Commission
Study on the effective integration of Distributed EnergyResources for providing flexibility to the electricity system
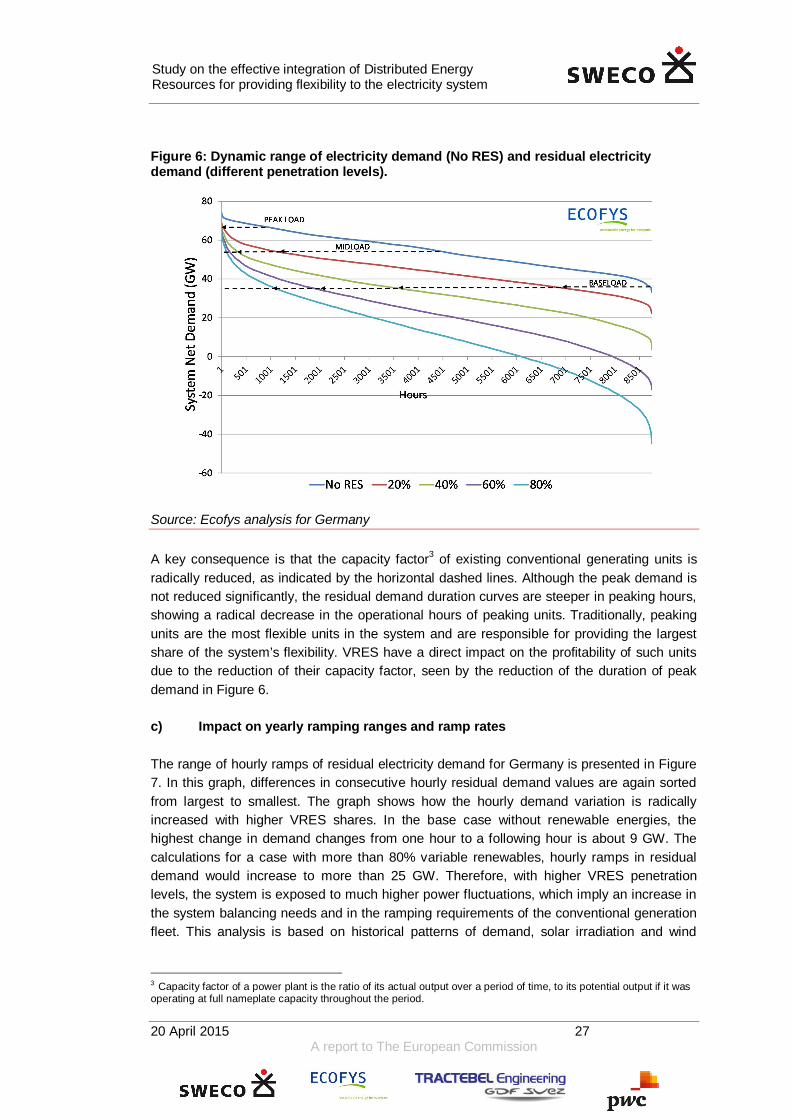
Figure 6: Dynamic range of electricity demand (No RES) and residual electricitydemand (different penetration levels).
Source: Ecofys analysis for Germany
A key consequence is that the capacity factor3 of existing conventional generating units isradically reduced, as indicated by the horizontal dashed lines. Although the peak demand isnot reduced significantly, the residual demand duration curves are steeper in peaking hours,showing a radical decrease in the operational hours of peaking units. Traditionally, peakingunits are the most flexible units in the system and are responsible for providing the largestshare of the system’s flexibility. VRES have a direct impact on the profitability of such unitsdue to the reduction of their capacity factor, seen by the reduction of the duration of peakdemand in Figure 6.
c) Impact on yearly ramping ranges and ramp rates
The range of hourly ramps of residual electricity demand for Germany is presented in Figure7. In this graph, differences in consecutive hourly residual demand values are again sortedfrom largest to smallest. The graph shows how the hourly demand variation is radicallyincreased with higher VRES shares. In the base case without renewable energies, thehighest change in demand changes from one hour to a following hour is about 9 GW. Thecalculations for a case with more than 80% variable renewables, hourly ramps in residualdemand would increase to more than 25 GW. Therefore, with higher VRES penetrationlevels, the system is exposed to much higher power fluctuations, which imply an increase inthe system balancing needs and in the ramping requirements of the conventional generationfleet. This analysis is based on historical patterns of demand, solar irradiation and wind
3 Capacity factor of a power plant is the ratio of its actual output over a period of time, to its potential output if it wasoperating at full nameplate capacity throughout the period.

20 April 2015 28A report to The European Commission
Study on the effective integration of Distributed EnergyResources for providing flexibility to the electricity system
speeds in Germany. The 80% case is a theoretical outcome, if no export and import capacityand no flexibility option is available.
Figure 7: Hourly ramping range of electricity demand (No RES) and residual electricitydemand (different penetration levels).
Source: Ecofys analysis for Germany
Figure 8: Normalised hourly ramp rates for Germany, Spain, Sweden.
Source: Ecofys analysis

20 April 2015 29A report to The European Commission
Study on the effective integration of Distributed EnergyResources for providing flexibility to the electricity system
The range of hourly ramp rates for Spain, Sweden and Germany are compared in Figure 8.Nominal hourly ramps are divided by the total value of the preceding hour to show therelative changes of residual demand. In the case of no RES in the electric power system thenet demand in Spain has the highest maximum ramp rates with 30%, Sweden has muchlower rates of maximum 17%. The German example shows highest ramp rates of 21%.Increasing the share of VRES to 40% the ramp rates in all countries increase (in absoluteand relative values), indicating the higher variability and ramping requirements of thesystems. Spanish ramp rates increase by 10%, Swedish rates by 57%. In Germany, demandchanges and changes in infeed from renewables have more often opposite directions, so themaximum ramp rate increases by only 1%.
Concluding, in all cases we see that higher VRES shares lead to radical increases in rampsof residual demand, having a direct impact on the system balancing requirements.
d) Impact on day ahead markets
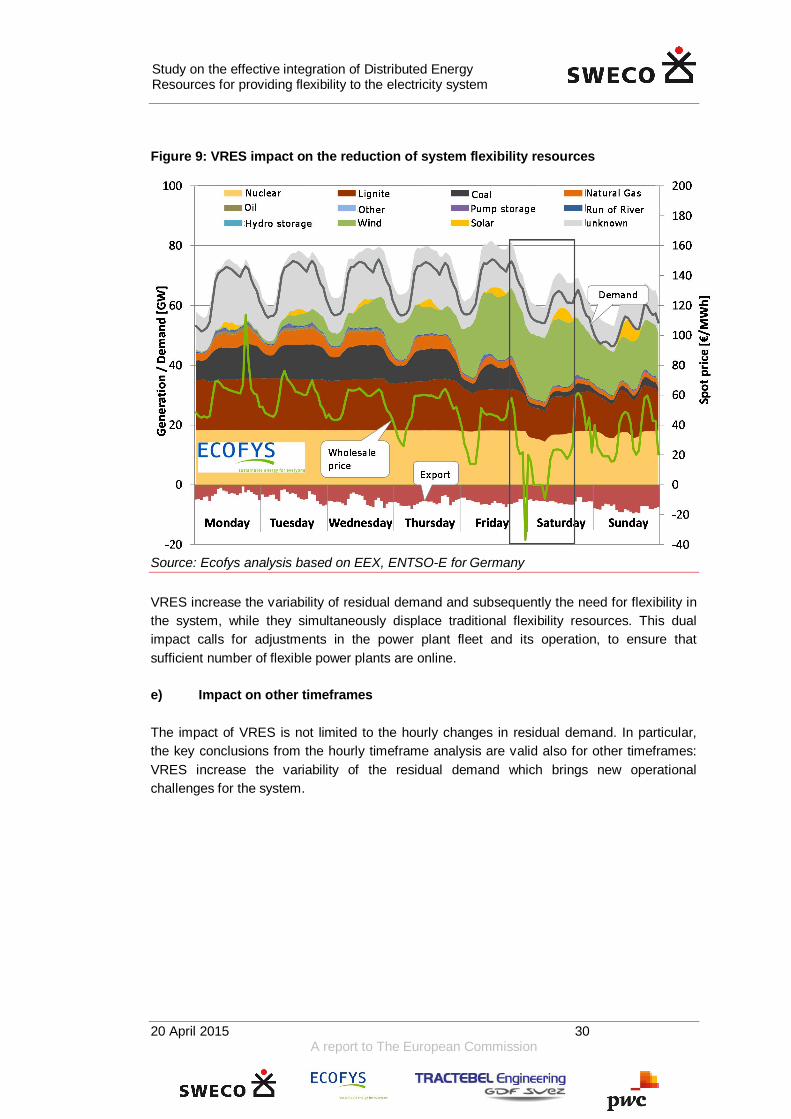
The limits of the power system flexibility are already visible in some European memberstates. An example is presented in Figure 9, based on the operation of the German systemfor one week in February 2011 (ex-post data). A typical ‘flexibility event’ can be observed inthe case of high wind generation in the demand valley between Friday night and Saturdaymorning. In this event the conventional power park reached its flexibility limits (peakingplants were shut down and base load units (nuclear and lignite) were operated at minimumgeneration levels), while exports were at maximum levels. The increased need for flexibilitywas translated to near zero and negative spot market prices for the specific time window.
20 April 2015 30A report to The European Commission
Study on the effective integration of Distributed EnergyResources for providing flexibility to the electricity system
Figure 9: VRES impact on the reduction of system flexibility resources
Source: Ecofys analysis based on EEX, ENTSO-E for Germany
VRES increase the variability of residual demand and subsequently the need for flexibility inthe system, while they simultaneously displace traditional flexibility resources. This dualimpact calls for adjustments in the power plant fleet and its operation, to ensure thatsufficient number of flexible power plants are online.
e) Impact on other timeframes
The impact of VRES is not limited to the hourly changes in residual demand. In particular,the key conclusions from the hourly timeframe analysis are valid also for other timeframes:VRES increase the variability of the residual demand which brings new operationalchallenges for the system.

20 April 2015 31A report to The European Commission
Study on the effective integration of Distributed EnergyResources for providing flexibility to the electricity system
Figure 10: Examples and timeframes of fluctuations in the system
Source: Ecofys
Figure 10 shows different operational timeframes and typical examples of how fluctuations inVRES affect the power system flexibility. Locally, PV generation can drop because of clouds,and storms can increase the wind speeds in minutes, increasing intra-hourly fluctuations. Atthe same time, there can be several hours or even days without any VRES generation at all,which increases the daily and hourly fluctuations and affects the daily planning of thesystem. Finally, the changes in VRES yearly energy content (e.g. strong and weak windyears) introduce long-term energy fluctuations that affect the long-term system planning.
2.2 Local flexibility gap
The global flexibility gap analysis in the previous section presents the flexibility implicationson system level when integrating higher shares of VRES. As VRES are usually connected todistribution grid level, further challenges arise on a local level. In this section we map howthe integration of higher penetrations of fluctuating DG impose new challenges for theoperation and design of distribution systems.
In general, the incorporation of VRES in distribution grids brings similar effects to theresidual demand of the local grids as the ones presented above on system level. Thefluctuations and variability of local residual demand increase. Due to the designcharacteristics of these systems (radial structure, vicinity to customers, lower voltage levels)this creates several problems with the distribution system operation and design (Coster,2010), (Ackerman & Knyazkin, 2009), (Eurelectric, 2013).
One main issue is the control of active and reactive power in the system. In times of localoversupply, reverse power flows can occur, electricity is fed to upper grid levels. Thisoversupply causes problems with keeping voltage and current variations within operationallimits. VRES can cause congestions in the distribution networks and impact grid losses.Additionally, power quality can be affected. Fluctuating electricity generation can cause localproblems with the protection and the fault level4 of the grid.
4 The fault level at a given point of the electric power supply network is the maximum current that would flow in caseof a fault.
Dailyfluctuations
Seasonalfluctuations
Yearlyfluctuations
Hourlyfluctuations
Intrahourlyfluctuations
Strong andweak wind
years
Low PVgeneration in
winter
Day and nightdifferences inPV generation
Wind frontsand movement
of sun
Clouds, storms

20 April 2015 32A report to The European Commission
Study on the effective integration of Distributed EnergyResources for providing flexibility to the electricity system
Traditionally, fluctuations in distribution grids were caused by changes in local demand.DSOs solved such issues by network expansion measures, e.g. increasing line capacities orinstalling voltage support devices. Such network development strategies are best suited todeal with demand increase situations, which were the key driver for the development oftraditional distribution systems. Such strategies could be less cost-effective or not able tofully solve the problems related to residual demand variability increase. Therefore alternativestrategies provided by flexibility actions are needed. In order to understand the nature ofthese problems, we present these issues in more detail in the section below.
2.2.1 Voltage problems
One of the important tasks of DSOs is maintaining voltage within certain limits in order tosupply customers with acceptable and conform power quality. In power systems withoutdistributed generation the customers who are remotely located from the main substation aresupplied with voltages of lower magnitude than the customers who are located close to themain substation. The traditional way to cope with this problem is the installation of specificequipment which controls and regulates the voltage along the power lines. Examples arevoltage regulators, transformer tap changer, capacitors, switched capacitors, boosttransformers, compound transformers or phase shifters.
Integration of DER into the medium and low voltage networks changes the voltage profilesalong the distribution grids. The injection of active power increases voltage at the connectionpoint and the local area around the injection point. If there is not enough demand in thedistribution network to consume the generated electricity, then the voltage may locallyincrease and lead to violations of overvoltage operational limits. These voltage problems putat risk customer facilities and network components and violate obligatory standards onpower quality. Such voltage problems can become worse when DER inject reactive powerinto the grid without performing a voltage control function.
The critical voltage deviation depends on the relative location of the DER in the distributionnetwork. The closer DER is to the main substation (connection to the higher voltage level),the lower its critical impact is on the voltage profile of this area. Generally parts of thedistribution grid remotely located from the main substation are considered weak as thetransfer capability of the power lines in these areas is limited. In such parts of the distributionnetworks the impact of DER on the voltage profile is more critical.
2.2.2 Reverse power flows
When the local production of DG exceeds the local load, reverse power flows appear and thelocal grid exports towards the higher voltage grid. Most of the existing distribution networksare designed assuming a unidirectional power flow from centralized generating stationssituated at the high voltage transmission system towards the customers situated at the lowervoltage system levels. The phenomenon of reverse power flows fundamentally changes thedesign and management of distribution networks as networks need to be designed for peakgeneration in addition to peak load. For example the protection settings, composition ofprotection devices or concepts for automatic load-shedding must be adjusted. Furthermore,

20 April 2015 33A report to The European Commission
Study on the effective integration of Distributed EnergyResources for providing flexibility to the electricity system
the reverse and fluctuating power flow requires extensive system operations by thedistribution network operators to control the limits of their assets and regulate the power flow.
2.2.3 Congestions
Power system congestion occurs when planned or actual flows across a system componentexceed its safe design capacity. Current distribution system operators’ (DSO) experienceshows that generation located on distribution systems can be difficult to plan for, andresulting flows can cause unanticipated congestion, especially in rural areas. Similarproblems may occur in cases of massive connection of new loads in the system due tosector electrification, e.g. in the case of electric vehicles in urban areas. Typically congestionat the transmission system level is handled by re-dispatching (i.e., adjust the scheduledgeneration of power plants) centralised power plants. At the distribution system level,congestion has historically been dealt with by planned upgrades of distribution systemcomponents. Such upgrades however cannot follow the pace of the rapid generationdevelopments of VRES in the distribution networks leading to temporary congestions. Inaddition, it is currently discussed if a network design which integrates very seldom peaks ofgeneration by VRES is a cost-optimal solution. Instead of grid extension, additional flexibilityoptions may be more cost-effective to avoid congestions.
2.2.4 Grid losses
The effect of DG on grid losses relate to their impact to the total power flows in the systemand depend on two factors: the amount of injected power and the location of DG in the grid.When DG is close to demand, the injected power is consumed. In this case the power lossesare reduced compared to the case without DG. However, grid losses may increase forremotely connected DG. Losses can also increase during the night when there is lowdemand and simultaneously high wind energy production. In active distribution networks5,DG units are often also responsible for voltage control. Where there is high penetration ofvariable distributed generation, this voltage support action can be translated into additionalreactive power and thus to an increase in reactive power losses in the network. (ECOFYS,2013) 6
Figure 9 shows that with low share of DG the grid losses drop in comparison to distributiongrids without DG, but once there are large injections of distributed generation into the DSOnetwork grid losses tend to increase.
5 Active distribution networks are distribution systems comprising of loads and DG where power flows are bi-directional, in contrast to the traditional structure of ‘passive’ distribution networks which contain only loads, wherepower flows are uni-directional (see analysis in section 1.1)6 Besides reactive energy injection systems, smart transformers along with associated automation systems,coordinated through Advanced Distribution Management Systems, can be used to fine tune voltage. This fine-tunedvoltage control infrastructure designed for DER can also be used to minimise technical losses.

20 April 2015 34A report to The European Commission
Study on the effective integration of Distributed EnergyResources for providing flexibility to the electricity system
Figure 11: Grid losses related to the penetration of DG
Source: (Gerwent, 2006)
2.2.5 Case studies
In this section, two case studies highlight reactive and active power issues in the distributionnetworks of Germany and Sweden caused by the high share of VRES, DG and other DER indistribution systems.
Case study 1: VRES/DG Curtailment in distributions networks (ECOFYS, 2012)
Local flexibility gap issues: congestions problems, reverse power flow
The following case study highlights the impact of wind power on the development of a localflexibility gap in the distribution system. Schleswig-Holstein (S-H) is a German federal statein the north of Germany next to the border of Denmark. The special characteristics of thisregion are:
■ According to estimations, 100% of the yearly regional demand could be coveredby regional VRES energy production in 2014
■ 98% of RE capacity is connected to the distribution grid (0,4kV, 10-20kV, 110kV),and the largest share (67%) on medium voltage level (10-20kV)
Figure 10 shows the distribution of the installed wind capacity in Schleswig – Holstein (S-H)as well as the total RE installed capacity per type and voltage level. The deeper blue colourson the map (left part of the figure) indicate higher levels of wind capacity.

20 April 2015 35A report to The European Commission
Study on the effective integration of Distributed EnergyResources for providing flexibility to the electricity system
Figure 12: Distribution of installed wind capacity in Schleswig-Holstein (left) andinstalled capacity per technology and voltage level (right) in Schleswig-Holstein
Source: Ecofys based on the plant register of the German transmission system operators
DSOs in this region face many challenges due to the high integration of VRES andespecially wind energy (67% of the whole RE capacity). Due to system inflexibility, DSOsresort to curtailment for ensuring secure grid operation. Between 60 and 80% of allcurtailment actions in Germany appear in this region. In total, 5% of wind energy productionis curtailed and the highest share of this curtailment (more than 80%) occurs in the mediumvoltage level. Key reasons for this are:
■ VRES installations in lower voltage levels increase constantly, however the grid isnot developed with the same pace to allow the alleviation of congestion problems.In addition, the construction of the planned reinforcements/extensions of theoverlaying high voltage transmission system is delayed and it is deemed veryexpensive.
■ The local imbalances between demand and supply lead to reverse power flows. Inparticular, low voltage (0.4kV) and medium voltage (10-20kV) grids feed energyback into the high voltage grid (110kV) and to the transmission system (>110kV).

20 April 2015 36A report to The European Commission
Study on the effective integration of Distributed EnergyResources for providing flexibility to the electricity system
■ So far, the DSO capability for implementing different options to solve congestionproblems is limited. The most common option is that of controlling the activepower of the power units (curtailment)7.
In Figure 13, the wind capacity allocation is compared to the intensity of DER curtailment indifferent areas of Schleswig–Holstein (S-H). The deeper red colours on the map (left)indicate higher intensity of generation curtailment. Dark red indicates regions with more than200 hours of curtailment per year. The deeper blue colours on the map (right) indicate higherlevels of installed wind energy capacity. The areas with the higher installed capacities ofwind power plants presented the highest share of DER curtailment incidents. This isexplained by the fact that curtailment (mainly of large wind farms, reported 95% of the cases)has been the only flexibility action taken by the DSO to resolve these temporary congestions.
Figure 13. Wind capacity energy allocation in northern Germany and DER curtailment
Intensity of DER curtailment (hours peryear)
Wind capacity allocation in the region ofSchleswig – Holstein (2013)
Source: Ecofys
Grid extension is the traditional way to solve this problem and should be performed inadvance in the grid planning phase. However it is often the case that grid cannot beextended as fast in order to facilitate all DG. For this reason in the region of Schleswig-Holstein (S-H) temporary congestions appear due to construction delays of the planned gridextensions. However it is under discussion whether grid extension is the most cost-effectivesolution, since congestion events occur only a few times per year (Wieben et al, 2014). Theregulation obliges the network operators to make the necessary investments to reinforce andextend the grid in order to absorb all the energy produced by DG (worst-case scenariodesign).
Case Study 2: Increased DER in a distribution grid in Sweden (Damsgaard, et al., 2014)
7 Curtailment has to be justified by grid congestion problems and is just allowed, if all possible market mechanismsare exhausted. Regarding the current regulation, first conventional power plants need to be reduced to a technicalminimum, before RE can be curtailed. Producers get a refund for their curtailed energy of at least 99 % of themarket value at the time of curtailment.

20 April 2015 37A report to The European Commission
Study on the effective integration of Distributed EnergyResources for providing flexibility to the electricity system
Local flexibility gap issues: voltage control (load peaks and voltage fluctuations), reversepower flow
In the local distribution grids changes in local generation and load are in many cases likely tobe substantial over the coming decades. For this study case, the impact of such changes isanalysed using actual metered data for individual distribution grid customers.
The effect of high shares of VRES was analysed for a Swedish suburban distribution grid.The study compared the current operation of a substation (year 2012) with its futureoperation under an increased DER scenario (PV and electric vehicles (EVs) (Damsgaard, etal., 2014). The scenario is based on existing scenarios developed within the researchprogramme “North European Power Perspectives (NEPP)”. The future scenario estimatesthat in 2037 in this specific substation of the suburban distribution grid the amount of the gridconnected solar systems and electric vehicles will substantially increase.
Figure 14 shows the hourly power flow (kWh/h) in a suburban distribution substation(50kV/10kV) in Sweden, comparing the current situation (actual data) with the potentialfuture scenario (simulated data). Gaps are due to missing values. The future scenarioimplies a change in residual demand peaks. They are increased due to the charging of EVsthat do not react to price or grid signals. However, the biggest difference is that the gridbecomes a net exporter at the substation level (the red line goes below zero), feeding energyback to the grid and not just to the residential consumers.
Figure 14: Impact of increased local generation in a distribution grid (power flow in aSubstation (50kV/10kV)
Source: Sweco Energy Markets
Figure 15 shows the energy consumption and the maximum-minimum of electric power on amonthly basis in 2012 and in 2037 for the same substation. In addition to reverse power

20 April 2015 38A report to The European Commission
Study on the effective integration of Distributed EnergyResources for providing flexibility to the electricity system
flows and increased peak load, the interval (gap) between maximum and minimum powerper month increases in the 2037 scenario. The increase of this interval implies biggerchallenges for DSOs in terms of voltage control as power changes relate to voltage changes.The new operating conditions have an impact on grid equipment as well as on customer’sdevices. The effects of increased penetration of solar PV and EVs were examined in aresidential area for a substation (10kV/0,4kV) on the same grid. The effects on voltage weresimilar at the low voltage level as they were at medium voltages. A striking result is thatdifference between minimum and maximum power levels increased by 500% in July.
Figure 15: Monthly energy consumption (blue) and maximum-minimum of power(black) per month in years 2012, 2037 in a substation.
Substation (50kV/10kV) in a suburban grid in 2012
Substation (50kV/10kV) in a suburban grid in 2037
Source: Sweco Energy Markets
Summarizing the findings of the case study, the increase of PV and EVs leads to newoperational conditions that should be handled by DSOs:
■ Higher peaks of consumption due to the electric vehicle charging■ Periods of reverse power flow■ Higher power fluctuations which implies higher voltage fluctuations

20 April 2015 39A report to The European Commission
Study on the effective integration of Distributed EnergyResources for providing flexibility to the electricity system
3 Flexibility value streams
The value of flexibility ultimately stems from the different needs of the power systems andthe actors in that system. The system need of flexibility is described in chapter 2. Thischapter concentrates on the actors in European electricity markets that seek to contractflexibility options for several reasons.
One main group of actors are transmission system operators (TSOs) being systemresponsible for the overall transmission network. They balance out ramps in demand andsupply on the transmission system level and guarantee a stable frequency in a definedregion. In their territory as well as on the borders to neighbouring territories, they have tomanage congestions.
Distribution system operators (DSOs) are responsible for the system stability on distributiongrid level. Both types of system operators act as natural monopolists – there is no competitorthat operates grids in their defined territory. That is why they are monitored by regulationauthorities.
All other actors compete on liberalised markets They are organised in balance responsibleparties (BRPs). If actors trade on different markets for electricity they try to buy at cheapestprices and supply at highest prices. They make use of price differences between markets(arbitrage). By competing on different markets, they reduce price differences.
Figure 16. Need and provision of flexibility services
Source: Ecofys

20 April 2015 40A report to The European Commission
Study on the effective integration of Distributed EnergyResources for providing flexibility to the electricity system
Figure 16 connects the flexibility needs to the actors. DER can provide flexibility on a global,but at the same time at a local level in its distribution grid system. Their services can be usedby TSOs, DSOs and BRPs.
DER flexibility can address flexibility needs both at system level (transmission system,related to the global flexibility gap) and local level (distribution systems, related to the localflexibility gap). As stated above the beneficiaries of the flexibility may either be in theregulated part of the electricity sector (TSO, DSO) or in the unregulated part.
Figure 17. Categorisation of flexibility needs
Source: Team analysis
The local need for flexibility will be superior the system need for flexibility due to the law ofphysics: local physical constraints cannot be handled globally. However, if one considers theneed and use of flexibility in the long-term, the local need for flexibility can be resolved viagrid reinforcement. This may or may not be cost optimal, depending on the circumstances.An alternative to grid reinforcement could be to utilise local flexibility, which then could leadto a conflict between the global and local need for flexibility, if the provision of flexibility isscarce. In a scarcity situation the local conditions will prevail, once again due to the law ofphysics.
3.1 Regulated beneficiaries
At local level, the value of flexibility is dependent on its physical location in the grid. DSOscan procure flexibility to optimally manage the distribution grid as an alternative to traditional(and possibly more costly) grid expansion investments, addressing grid issues related to the
DSO:grid management
BRP:Optimization forsingle customers
TSO:Balancing
Congestionmanagement
System adequacy
BRP:Portfolio
optimization andarbitrage
Reg
ulat
ed
Libe
ralis
ed
Local
Global

20 April 2015 41A report to The European Commission
Study on the effective integration of Distributed EnergyResources for providing flexibility to the electricity system
local flexibility gap, such as voltage control, congestion management, reverse power flows,increase of distribution losses. Flexibility options at distribution grid level can provide supportto DSO grid management and increase DG hosting capacity via active power control andreactive/voltage control.8).
Connection of distributed generation has historically often been managed according to a “fitand forget” approach. DG connection is sized at planning stage to withstand worst casescenarios, without considering any flexibility of DGs to adapt to grid conditions duringoperations. This leads to more conservative and onerous DG connection requirements.Electricity demand capacity is managed in the same way. So far, demand is not expected toreact to network or market signals.
Flexibility in demand can reduce peaks in demand on the DSO and on the TSO level byshifting demand from times of peak demand to times with lower demand or by shedding theload, i.e. cutting demand without possibility to catch up later (demand response).
In general, possible options to enable DSOs’ use of flexibility for distribution gridmanagement encompass the inclusion of DER flexibility in the regulatory asset base (e.g.storage), bilateral contracts between DSO and flexibility providers (e.g. aggregators), set-upof local markets to allow DSO procurement of flexibility based on grid operating conditions.Currently, several European pilots (NiceGrid , Grid4EU, Venteea9, E-Energy E-telligencepilot project10) are testing technical platforms that allow DSOs to monitor and dispatchdistributed energy resources to ensure optimal grid management.
The activation of flexibility on the distribution grid level includes two or three actors; theprovider, possibly an aggregator (intermediary), and the DSO (end-user). Depending on thenumber of providers, or the capacity of the average provider, the need for an aggregator isvarying. The level of sophistication in the communication and automation level of activationwill also play an important difference in the usefulness of aggregators. The providers offlexibility are likely to be remunerated by a capacity payment due to the long planninghorizon, and the risk for local markets (DSO). The alternative (reinforcing the grid) has a(very) long planning-horizon, and the consequences of failing to meet the requirements (e.g.unserved demand/generation) are to be considered as severe, which further pushes towardscapacity remuneration. These capacity remunerations could potentially be combined with anactivation fee. Challenges and barriers for a successful implementation are mainly related tofirmness of supply, implementation of a suitable communication infrastructure, DSOregulation and the inclusion of the flexibility remuneration in the revenue cap (increasedOPEX, see also section 8.4). Also, conflicts might arise between the BRP and the activationof the flexibility, if successfully deployed in a large scale and there is no communication inadvance, as this will yield an imbalance from the scheduled portfolio demand.
8 A number of on-going pilot projects are studying new DSO planning and operational toolsthat explicitly include DER flexibility among grid management options of the DSO (e.g.GREDOR https://gredor.be/)9 www.nicegrid.fr/; ; http://www.grid4eu.eu; www.nicegrid.fr/10www.e-energy.de/en/89.ph;;

20 April 2015 42A report to The European Commission
Study on the effective integration of Distributed EnergyResources for providing flexibility to the electricity system
As described below, DER flexibility is already being trialled out to support DSO gridmanagement, with an on-going shift from the pilot to the commercial phase.
■ Demand FlexibilityDSOs are starting to use demand flexibility as an alternative to gridreinforcements, especially in those cases where capacity limits are reached onlyfor a few hours per year.For example in the UK, UK Power Networks has set-up a bilateral contract withthe aggregator Enernoc for the provision of demand response service to limitpower congestions in selected grid areas and avoid reinforcements. Under thisscheme, the DSO can activate DR flexibility during peaks occurring Monday-Friday from October to March11. Flexibility providers receive payments forcontracted capacity and an energy payment when the flexibility is actuallyactivated. UK Power Network’s business plan forecasts savings of around £40million [€52M]12 from DR schemes from 2015 until 2023, on the ground ofsuccessful trials carried out so far.13
Similarly, in the US, utilities can procure demand flexibility via bilateral contractswith aggregators for grid management purposes. For example, in 2013, over 900MW of Demand Response were contracted by utilities for grid emergencymanagement14.
■ Distributed generationCurtailment of distributed generation is another form of DER flexibility that DSOsare already using to address grid management issues. In Germany, following theon-going high penetration of DGs, remote dispatchability by DSO is nowmandatory for medium/large CHP (> 100kW) and PV facilities (> 30kW). DSOshave the possibility to curtail DG generation to meet grid congestions, withcompensation of 95 % of lost income. However the situation varies widely inEurope and a number of European Countries (e.g. Austria) do not allow thispractice or allow it only in case of system security events at both transmission ordistribution level (e.g. UK, Spain). (Eurelectric, 2013)
■ Distributed storageThe use of distributed storage for grid management purposes is also being trialledout, mainly at pilot level. For example, in Italy, the leading Italian DSO, EnelDistribuzione, is currently testing distributed Li-Ion battery storage (2MW/1MWh)in 3 primary distribution systems to reduce the variability of the power flows insections of the distribution grid with high penetration of RES (e.g. alleviating power
11 Intelligent Distribution Networks - DR for Network Support & Renewable Integration,Enernoc, 2011.http://www.dena.de/fileadmin/user_upload/Veranstaltungen/2011/Vortraege_Verteilnetze/EnerNOC.pdf12 Considering 1£=1.3€ (currency change at January 2015)13 UK Power Networks Business Plan 2015-2023, ANNEX9 – Smart Grid Strategy, March201414 Demand Response as a Power System Resource: Program Designs, Performance, andLessons Learned in the United States; RAP report, May 2013

20 April 2015 43A report to The European Commission
Study on the effective integration of Distributed EnergyResources for providing flexibility to the electricity system
flow variations in case of wind gusts or passage of clouds). The goal is to increasethe predictability of the exchanges between the distribution and the transmissiongrid at the primary substations If this pilot proves to be successful, EnelDistribuzione intends to seek regulatory permission to install additional 46 storagesystems (1-2MVA; 1-2MWh) in HV-MV substations for a total of 60-80 MW.15.In the UK, UK Power networks is installing (commissioning by 2014) in adistribution primary substation one of the largest battery systems (6MW/10MWh)in Europe, in order to balance the influx of intermittent renewables and to helpsupport capacity constraints (project is expected to defer £6M [~7.8M€]16 of gridreinforcements)17.
■ Electric vehiclesEV Smart charging flexibility can be also used to support distribution gridmanagement. A number of pilot projects are currently considering how EV smartcharging flexibility can be integrated in DSO planning and operational tools, inorder to optimize grid investments. (e.g. PlangridEV; GreenEmotion18;). Noevidence of commercial implementation to date has been found.
3.1.1 System level
At system level, the following flexibility is needed in balancing supply and demand, incongestion management and to assure system adequacy.
a) Balancing
Balancing services are necessary to ensure the continuous equilibrium of demand andsupply in the system. Balancing energy is needed in two ways. Upward regulation requiresan increase of generation or a reduction of demand. Downward regulation reducesgeneration or increases demand.
Balancing services for the TSO are divided into energy and non-energy products. The non-energy products include the primary regulating power (Frequency Control Reserve (FCR))which is, on average, not resulting in any net energy over the activation as it will varynaturally around the set point (set generation or consumption level). Therefore, the providersof FCR are usually not remunerated by energy units, but rather capacity (EUR/MW/Hz). The“energy-products” (Frequency Restoration Reserve (FRR), Restoration Reserve (RR))includes the slower products, and can result in energy volume during activation. From atraditional perspective the different products have been procured and remunerated via both acapacity and an activation component in many market regimes, which is foreseen to be afeasible case for the future provision. The value of the flexibility will originate from severalstreams:
15 ENEL plans for storage introduction in Italian distribution network, presentation byChristian Noce, ENEL, November 2012.16 16 Considering 1£=1.3€ (currency change at January 2015)17 http://www.younicos.com/en/media_library/press_releases/014_2013_07_30_UKPN.html18 www.plangridev.eu/; www.greenemotion-project.eu;www.lowcarbonlondonevproject.co.uk

20 April 2015 44A report to The European Commission
Study on the effective integration of Distributed EnergyResources for providing flexibility to the electricity system
a. more (central) generator capacity available for the wholesale market as lessgenerator capacity will be reserved for ancillary services
b. ramping of (central) generators will be more expensive compared to the(competitive) demand resources
c. Increasing liquidity and competition on the supply side of the regulating markets,lowering costs for the system
The TSO procures resources (“capacity”) with different time horizons in the various memberstates, ranging from months to days before delivery. The energy products could in theoryinterfere with the BRP if activated volumes are not accounted for in the settlementcalculation ex-post. However this should be a relatively small challenge as the TSO shouldhave the necessary overview in order to include activation in the imbalance settlementcalculations ex-post.
In terms of time response requirements, balancing services are typically classified as follows:
■ Primary reserve typically requires response time of up to a few seconds. Primaryreserve is automatically activated by the user’s system control according topredefined frequency band.
■ Secondary reserve requires response time slower than the Primary reserve(indicatively 30 seconds and 15 minutes). Grid users that provide secondaryreserve must have the appropriate facilities for communicating in real time with theTSOs control centres, and their facilities must comply with certain technicalrequirements.
■ The tertiary reserve enables the TSO to cope with a significant or systematicimbalance in the control area and/or resolve major congestion problems. Unlikethe primary and secondary reserves, the tertiary reserve is typically activatedmanually at TSO's request. Grid users need to comply with certain technicalrequirements in order to sign a contract with the TSO to take part in the tertiaryreserve.
Central generators, which are able to change their output (ramp) rapidly, start and stop withshort notice, have historically been used to provide balancing services. However, distributedenergy resources are expected to increasingly offer balancing services.
The value chain for generation adjustments for short-term congestion management used bythe TSO/DSO is anticipated to have 2 or 3 participants; the distributed generation facilities,an aggregator (intermediary) and then the final user of flexibility (TSO/DSO).
The possibility to use DER flexibility to provide balancing services depends on the technicalrequirements of reserves and on the specific characteristics of DERs.
For example, distributed storage (batteries and flywheels) has the necessary fast-rampingcapability to provide frequency control. In the US, in 2011 a ruling from the Federal Energy

20 April 2015 45A report to The European Commission
Study on the effective integration of Distributed EnergyResources for providing flexibility to the electricity system
Regulatory Commission (FERC Order 75519) increased the remuneration for “fast”responding frequency regulation sources, such as batteries and flywheels, to incentivize theiradoption. Tens of MW of grid-scale storage devices are currently being implemented toprovide fast balancing services in the US. Following the historic California storage mandateof 1.3GW by 2020 issued in 2013, as of mid-2014 more than 2,000 megawatts of energystorage projects had applied to interconnect with the state’s grid, according to recent datafrom the Independent System Operator in California.20
Aggregation of EVs to provide grid balancing services (via demand response/smart chargingor via injection of power in the grid (V2G application)) is also envisioned but it is currentlyexplored mainly at pilot level.
For what concerns distributed renewable sources, as their generation adjustment is oftenasymmetric, i.e. only curtailment of generation, in the case of wind and solar power theflexibility transaction might be dependent on the usage and support of such asymmetricproducts. Assuming a scenario where the flexibility needs to be offered symmetrically, theoutput of generation facilities will be limited below the maximal available output in order tooffer the extra generation which will effectively mean at a close to zero or negative value,assuming remuneration based on dispatched energy. This demand for symmetry drives foran opportunity cost for non-programmable generators, where the marginal cost is low orclose to zero. The opportunity costs are likely too high, however should easily be included inthe bids for short-term congestion management. If the bids are competitive (i.e. cheaper thanother offers), they should be accepted.
In general, DER flexibility is increasingly being used in Europe to provide balancing services,with requirements and opportunities varying among countries.
For example, in the UK, National Grid21 has set-up a number of programmes to integrateDER flexibility for the provision of balancing reserves. Examples include:
■ Frontline – Under this programme, National Grid contracts flexible demand andstorage (batteries, cooling/heating systems) that can be activated quickly (lessthan 1 second) to provide frequency control. Capacity payments are foreseen forcapacity contracted by National Grid in this scheme.
■ Short Term Operating Reserve (STOR): demand competes with generation toprovide fast balancing reserve to National Grid. Typically demand flexibility iscomposed of commercial and industrial interruptible loads equipped with back-upgeneration. The scheme foresees capacity payment (currently around~30£/kW/y)22 and an activation fee for (around 50-60 hours a year of utilization).
19 www.ferc.gov/whats-new/comm-meet/2011/102011/E-28.pdf20 http://www.greentechmedia.com/articles/read/californias-massive-on-paper-grid-energy-storage-market21 http://www.flexitricity.com/core-services/footroom22 22 ~39€/KW/y:Considering 1£=1.3€ (currency change at January 2015)

20 April 2015 46A report to The European Commission
Study on the effective integration of Distributed EnergyResources for providing flexibility to the electricity system
The minimum aggregation bid is 3MW, and the flexible capacity need to beactivated within 20 minutes for at least two hours.
■ Footroom – Under this programme, National Grid contracts downward regulationto prevent wind curtailment at times of high wind generation when electricity pricesbecome negative. Flexibility is provided by flexible loads (demand, storage etc.)which can increase demand and controllable distributed generation (e.g. CHP)that can reduce electricity generation. Capacity payments are in the order of £15 -£35k per MW23. Flexible loads also benefit from consumption at periods ofnegative prices.
In France, around 400MW of flexible demand is presently contracted by the TransmissionSystem Operator (RTE) for tertiary reserve (“marché ajustement”)24. The response time offlexible loads has to be less than 2 hours and the minimum aggregation bid is of 10 MW.RTE also has bilateral contracts with industrial customers to procure additional reserve viainterruptible loads (for a maximum of 400MW), that can be activated up to 10 days per year.
In Germany, starting from June 2013, monthly auctions are organized to procure up to 3000MW of balancing reserves from fast responding flexible distribution loads (less than 15minutes activation time or less than 1 second for frequency control). The scheme foresees amaximum aggregation size of 50 MW, with loads that need to be attached to the perimeter ofthe same DSO. In 2013 it was foreseen a fixed remuneration of 2500 €/MW/month(30€/kW/year) and an activation fee between 100 and 400€/MWh (Bundesministeriums derJustiz und für Verbraucherschutz und Juris GmbH, 2012).
b) Congestion management
Typically congestion management actions include preventive actions (allocation of theavailable cross-border capacities) and remedial actions (redispatch measures after capacityallocation).
Transmission system operators are increasinglly usingDER flexibility as remedial actions forcongestion management. (In the future, epecially in grid areas where structural infrastructurebottlenecks are present, DER flexibility could also be included in the process of calculatingthe available cross-boreder capacity)
In France, in winters 2012/2013 and 2013/2014, the French Transmission System OperatorRTE has contracted 70MW of demand response (with a minimum bidding size of 1MW) inBretagne, to assure supply at peak times in a region which depends on limitedinterconnections with other French regions. The return of experience has been positive. For
23 ~€20- €45k per MW:Considering 1£=1.3€ (currency change at January 2015)24 Services système et mécanisme d’ajustement, CRE, 2013.http://www.cre.fr/reseaux/reseaux-publics-d-electricite/services-systeme-et-mecanisme-d-ajustement

20 April 2015 47A report to The European Commission
Study on the effective integration of Distributed EnergyResources for providing flexibility to the electricity system
example in 2012/2013, RTE has successfully activated 16MW on the 12th of December2012 and 41 MW on the 17th of January 2013 to solve congestions at peak times.25
Italian southern regions have recently witnessed massive on-going penetration of variablerenewable generation (PV and wind) whose generation is constrained by transmission gridbottlenecks. The Italian System Operator, Terna, has invested in three large energy-intensive battery storage systems in southern Italy, each with an average capacity ofapproximately 10 MW and 80 MWh. The scope is to ensure greater flexibility in themanagement of renewable power plants, and to increment the transmission grid’s capacity toabsorb renewable power without creating congestions.26
c) System adequacy (meeting peak demand)
System adequacy refers to the capability of the power system to reliably serve peakdemand. The peak-shifting for generation capacity adequacy (Security of supply-long term)value chain is foreseen to include two, or three, participants; the provider (industrial ordomestic consumers (provider), possibly an aggregator (intermediary), and the TSO/DSO(end-user)). The remuneration is via capacity or direct tariff incentives, and the tradinghorizon is foreseen to be relatively long-term (yearly). Another alternative is ToU tariffschemes, which have proven to be useful in long-term peak-shifting27. One of the challengesmight be reduced predictability when the need for flexibility (“shifting”) is needed in a systemwith significant generation from VRES, making the “programming” of appliances to consumeduring “off-peak” harder. A conflict could arise between the grid needs, and the balancingneeds, e.g. a BRP could be imbalanced while the grid is under significant load (opposite“directions” demanded), why the signal from these two actors could be conflicting. The“optimal” hierarchy should again be according to laws of physics, e.g. the grid should besuperior to market incentives if conflicting.28 The needed equipment for communicatingsignals/activation could be the same as for several other value chains, for example for short-term demand adjustments.
DER flexibility can typically contribute to system adequacy via a reduction of peak demand(via load shedding/demand response; auto-consumption) or via increasing the availability ofDG generation (via DG combined to storage; use of heat storage to allow electricity-drivenoperation of CHPs etc.).
25 http://www.enerzine.com/15/15976+effacer-la-consommation---rte-reitere-son-experimentation-en-bretagne+.html26 Storage Applications in the Italian Transmission Grid, InnoGrid2020+ Seminar - Integrationof storage in network management – why, when, where, how?, Brussels, 20 February 201327 According to interview with one stakeholder ToU tariffs have been used in France since1960’s. Approximately 80 % of the hot water tanks in France are programmed to start duringoff peak, which is estimated to shift 9 TWh of energy annually, corresponding toapproximately 3 GW of installed peak load capacity. Synergy effects are reduced investmentneeds in the grid of more than 100 MEUR/annum.28 The market should provide correct incentives for “system needs”, e.g. in the case of aconflict this indicates market signal failure due to market design flaws, rather than twocompeting buyers of flexibility.

20 April 2015 48A report to The European Commission
Study on the effective integration of Distributed EnergyResources for providing flexibility to the electricity system
In particular, the use of flexible loads for peak shaving is increasingly being considered as anecessary and economic rational means to ensure system adequacy, particularly to off-setgeneration capacity that is used only a few hours per year. For example, according to theload curve of the Belgian high-voltage network operator Elia in 2012, the last 400MW ofgeneration capacity in Belgium were only used for 13 hours29.
Traditional investments to ensure system adequacy include dispatchable generators(typically centralized and fossil-based) and grid interconnectors.
In the PJM market area (US), capacity auctions are organized to procure necessary capacityto meet forecasted peak demand three years in advance. Generators, demand response andenergy efficiency resources are able to compete on an equal basis. Currently, the capacitymarket is by far the main source of valorisation for demand response in the PJM area(around 10GW of demand response capacity was contracted in the latest auction for2017/201830). For example, Enernoc, the largest US aggregators, reports capacity paymentsof around 185 M$ [160M€]31 for a total of 4GW of contracted demand response capacity32.
A number of European countries are about to implement capacity markets (e.g. UK, France)to ensure system adequacy. DER flexibility, and particularly demand response, is expectedto be able to participate. In Sweden/Finland, demand side resources are already included inthe national strategic reserves, with aggregators currently making bids for aggregateddemand resources.
3.2 Unregulated beneficiaries
3.2.1 Local level
a) Optimization of single customers’ portfolio of generation and consumption
DER flexibility can be used by prosumers to optimize their generation and consumptionprofiles thus reducing their energy bills. For example, a consumer who is equipped with PVcould use demand flexibility or a distributed storage system to minimize the costs ofprocuring grid-supplied electricity. Storage combined to solar systems are alreadycommercially deployed in Europe and US. For example, in 2013, Germany set-up a 50M€funding to support decentralized storage system to be coupled with PV generation(commercial/residential customers) and around 4,000 solar-plus-battery systems have beeninstalled up to May 2014 (according to the Solar Industry Association)33. In California,integrated PV and storage systems for residential and commercial customers increasinglyhave a business case via reduction of peak demand charges.Several non-utility companiesare installing big batteries in buildings, mainly based on the business case of reducing peak
29 www.elia.be30 http://pjm.com/~/media/markets-ops/rpm/rpm-auction-info/2017-2018-base-residual-auction-report.ashx31 Considering 1$=0.86 € (currency change at January 2015)32 http://www.navigantresearch.com/blog/a-dark-day-for-demand-response33 http://www.navigantresearch.com/blog/germany-supports-solar-storage

20 April 2015 49A report to The European Commission
Study on the effective integration of Distributed EnergyResources for providing flexibility to the electricity system
demand charges (component of the tariff based on the monthly peak consumption) forcommercial and industrial customers34.
3.2.2 Global level
b) Portfolio optimization and arbitrage
Portfolio optimization refers to the use of flexibility by commercial actors (e.g. retailers) tooptimize their position on the wholesale market, e.g. optimising the deviations fromgeneration/demand from forecasted schedules or contracting flexibility to hedge risks.
Flexibility can also be used to optimize a portfolio of distributed energy resources bidding onpower markets via virtual power plant-VPPs.
Examples include:
■ A RES generator using distributed storage to smooth out the intermittency of RESand to make RES predictable, thus reducing imbalances, in those contexts whereRES generator face balancing responsibility).
■ A retailer choosing to activate demand response to reduce energy procurementcosts in a period of high electricity prices.
■ an aggregator optimizing the outputs of a different set of resources composing aVPP to launch a supply bid on the wholesale market
The use of DER flexibility (e.g. demand response) by balancing responsible parties isalready commercially mature.
The optimization of distributed energy resources into virtual power plants is progressivelymoving from pilot projects to commercial stage. For example in Germany, RWE started itsfirst VPP pilot project in 2008 (8.6MW) and is expected to manage a VPP portfolio of over200MW in 201535 increasing its commercial value.
In the US, distributed storage (Li-Ion batteries) in the scale of 20-50KW (installed atcommercial customers’ premises) are currently being aggregated and are bidding on a day-ahead demand response programme managed by the California Independent Systemoperator. The offers are accepted if lower than wholesale energy prices. The minimum sizeof accepted bid is 100kW36.
Peak-shifting for portfolio optimization (both long- and short-term) is a value chain thatgenerally involves two, or three-four actors; the provider (industrial or domestic consumers(provider), possibly an aggregator (intermediary), the BRP (end-user or trader), and possiblya third party BRP (end-user)). The portfolio optimization could in principal originate from two
34 http://www.greentechmedia.com/articles/read/Sharp-Jumps-Into-Distributed-Storage35 resnick.caltech.edu/docs/d-Siemens_Grid3.pdf36 http://www.greentechmedia.com/articles/read/aggregating-building-batteries-into-grid-resources

20 April 2015 50A report to The European Commission
Study on the effective integration of Distributed EnergyResources for providing flexibility to the electricity system
demands; resolving inevitable forecast errors (both consumption and generation) by revisingconsumption so that the scheduled positions are met during the imbalance settlement periodor as a traded product in order to balance other third party BRP portfolios. The underlyingdemand is identical; utilizing consumption flexibility in order to balance portfolios at aneffective cost. There are several challenges that need to be resolved in the successfuldeployment of this transaction; metering and the remuneration of “participating” end-consumers (e.g. domestic consumers) due to the lack of “reference balancing consumption”with consumer settled by their consumption profiles, controlling of appliances/activation, theplanning horizon for activation, the impact on underlying processes that use electricity(mainly related to industrial consumers). The remuneration is foreseen to mainly be viacapacity payments ahead of delivery, however traded relatively short-term continuously. Thereason for this is that the activation might be irregular and that suppliers might require returnon invested money with reduced risk. An automatic activation is foreseen (due to largenumber of end-consumers). Furthermore, the settlement period is foreseen to be relativelyshort, and for profiled consumers the “reference consumption point” (probably handled via‘baseline method’) might pose a challenge. There are synergies with the other long-termpeak-shifting value chain as the needed equipment for control is similar.

20 April 2015 51A report to The European Commission
Study on the effective integration of Distributed EnergyResources for providing flexibility to the electricity system
4 Market value of flexibility
The focus of this study is on the efficient integration of DER in order to provide flexibility tothe electricity system. This implies that there should be an underlying value of the flexibility,which exceeds the cost of providing it. For products and services traded on markets, thisvalue should be revealed through the market prices if the markets are properly designed. Inthis section we study the current market value across Europe based on available marketdata. As the availability and comparability of market data varies depending on which type ofmarket we are looking at, the main focus in this section is on day-ahead prices. Forillustrative purpose we also present a possible future situation based on model simulations. Itshould be noted that this is only one possible development, and the exact results dependson a number of assumptions that drive the results.
We then also compare between day-ahead and intraday prices for Germany (continentalthermal dominated system) and Sweden (Nordic, hydro dominated system). We alsocompare the value of flexibility revealed through market prices depending on the temporalresolution (15-minutes and 1 hour) in the German market.
4.1 Price volatility in the day-ahead market
The first indicator that we use is the price volatility in the day-ahead market. In Figure 18 thestandard deviation of the day-ahead price for 2012-2013 is shown. The standard deviationcaptures price variation both within days and between seasons and years. From the map wecan distinguish different groups of countries/market areas. The price volatility in the Nordicregion is low in comparison to most other European countries, which is expected given thehigh share of reservoir hydro power. North-central/eastern part of continental Europe alsohas a relative low price volatility, while Italy stands out in the opposite direction. Italy is alsointeresting given that fact that it has many price zones37. In particular some of the smallerprice zones (nodes) with limited generation capacity have significantly higher price volatilitythan other price zones. This provides a local value of flexibility, which appears smaller inareas with larger price zones.
Figure 19 shows the within-day average price spread, i.e. the average difference betweenthe highest and lowest price within a given day. This is an indicator for the value of beingable to adjust production or consumption between peak and off-peak hours. The overallpicture is similar to the standard deviation, with lower price spreads in the Nordic region, andnorth-central/eastern part of continental Europe. However, the countries of the IberianPeninsula also appear to have a low daily price spread.
37 As some of the regions are physically very small (basically nodes) only 6 are illustrated inthe map.

20 April 2015 52A report to The European Commission
Study on the effective integration of Distributed EnergyResources for providing flexibility to the electricity system
Figure 18. Day-ahead market price volatility (standard deviation),2012-2013
Source: Market data from European power exchanges, calculationsby Sweco
Figure 19. Average daily price spread (EUR/MWh), 2012-2013
Source: Market data from European power exchanges, calculationsby Sweco
444037333026231916129
N/A
12211199887765544331209
N/A

20 April 2015 53A report to The European Commission
Study on the effective integration of Distributed EnergyResources for providing flexibility to the electricity system
Figure 20 illustrates the importance of the hourly price variations in different regions ofEurope for seven days in beginning of 2012. SE2 (hydro dominated price zone in NorthernSweden) shows an almost non-existent price variation within the day or over the week. Themarket value of flexibility in the day-ahead market is thus (very) limited. Of course therecould be a value of being flexible on intra-day and balancing markets, but given the amountof easily regulated hydro power that value is also expected to be low. Local flexibility indistribution networks could of course be valuable, although the (marginal) value of globalflexibility is very low. All else equal, it will however be more difficult for flexible DER as theycannot count on a high remuneration of flexibility on the (global) power market.
Germany and Italy show a clearly different pattern. While Italian prices are much higher thanGerman prices during this period, both countries have a large variation between the highestand lowest prices. Germany also has hours with negative prices. If those market priceswhere pass-through to producers (and consumers) this would clearly create a value offlexibility on the day-ahead market.
Figure 20. Hourly prices, 1-7 January 2012 (EUR/MWh)
Source: Data from power exchanges
While it is difficult to make a direct mapping from the price volatility to the profitability of DERflexibility on a general level, one can expect that if the conditions otherwise are similar, theincentive to provide flexibility from DER will differ depending on the market circumstances.However, this is not by itself a reason for policy interventions, but simply reflects thedifferences in value of flexibility across markets. It is only if the low price volatility is due to
-100
-50
0
50
100
150
200
1 7 13 19 25 31 37 43 49 55 61 67 73 79 85 91 97 103
109
115
121
127
133
139
145
151
157
163
EUR/
MW
h
Hour
SE2 GER GB ITA ESP

20 April 2015 54A report to The European Commission
Study on the effective integration of Distributed EnergyResources for providing flexibility to the electricity system
the existence of price caps, subsidization of e.g. generation or similar disturbances that apolicy response is called for.
The price volatility is expected to increase in the future. Figure 21 - Figure 24 show possiblefuture (2030) price volatility (measured as standard deviation and average daily pricespread) for two scenarios based on model simulations using Sweco’s European powermarket model Apollo. The model results of course depend on a number of assumptions(demand development, generation mix, fuel prices, CO2-price level, etc.), but given realisticassumptions increased volatility is likely. The two modelled scenarios differ in respect to e.g.economic growth and demand, fuel prices, carbon prices etc. The general result is that theprice volatility can be expected to increase, but the magnitude of the increase is highlyuncertain. The model allows for some demand response, but demand response beyond whatis assumed in the model could also contribute to decrease the price volatility.

20 April 2015 55A report to The European Commission
Study on the effective integration of Distributed EnergyResources for providing flexibility to the electricity system
Figure 21. Simulated future day-ahead market price volatility(standard deviation), 2030 – LOW scenario
Source: Sweco Energy Markets, Apollo model simulations
Figure 22. Simulated future day-ahead market price volatility(standard deviation), 2030 – HIGH scenario
Source: Sweco Energy Markets, Apollo model simulations
9285787164585144373023
N/A
9285787164585144373023
N/A

20 April 2015 56A report to The European Commission
Study on the effective integration of Distributed EnergyResources for providing flexibility to the electricity system
Figure 23. Average daily price spread (EUR/MWh), 2030 – LOWscenario
Source: Sweco Energy Markets, Apollo model simulations
Figure 24. Average daily price spread (EUR/MWh), 2030 – HIGHscenario
Source: Sweco Energy Markets, Apollo model simulations
2151951761571381199980614223
N/A
2151951761571381199980614223
N/A

20 April 2015 57A report to The European Commission
Study on the effective integration of Distributed EnergyResources for providing flexibility to the electricity system
4.2 Price on the day-ahead and intraday market varies
A second indicator for the value of flexibility is the price differences between different timeframes. Figure 25 shows the price difference between intraday and day-ahead markets forthe German and Swedish (price area SE2, hydro dominated area in Northern Sweden)markets during 2012-2013. Again we can distinguish between different groups of countries,where the spread of the intraday price is expected to be significantly larger for thermaldominated markets like the German system, compared with the hydro dominated regions(like the SE2 bidding area).
Figure 25. Price difference intraday vs. day-ahead markets in the Nordics andGermany.
Source: Sweco
Small deviation between intraday and day-ahead prices could be explained by a number ofdifferent factors. One important factor is the resource availability.
In the future with increasing shares of variable generation, it is likely that the predictability willdecrease both on the system level and local level. In a system where the difference betweenday-ahead and intraday prices is likely to be small (e.g. SE2), the effects on reducedpredictability of the supply-demand equilibrium is smaller compared with a system with alarger spread between day-ahead and intraday prices (e.g. Germany).
Another possible factor reducing the value of flexibility is artificially low balancing prices. Thisis often due to market design features (worth mentioning is low balancing prices due tosubsidies from the TSO). Regulation resources are in many cases procured by the TSO, andremunerated via capacity and activation fees. If the capacity charges are not reflected in theimbalance price, the imbalance price will be artificially low.

20 April 2015 58A report to The European Commission
Study on the effective integration of Distributed EnergyResources for providing flexibility to the electricity system
4.3 Intraday market prices revealing the value of flexibility
This section illustrates the importance of why a sufficient settlement period38 is needed inorder to reveal the value of flexibility. There is clear price pattern for the first and last 15-minutes of a given hour. The price pattern is here described and explained briefly, illustratingwhere the valuation of flexibility originates from. The value is clearly revealed in the historicalquarterly prices, and is dependent on the system load. In a system where there is significantcontribution from VRES, the residual load ramping is expected to be even more volatile andless predictable compared to today’s situation, most likely increasing the need of intra-hourflexibility. Additionally, this section effectively illustrates the need for proper market design(and sufficiently short settlement periods) and how improper market design (e.g. too longsettlement periods) hides the true value of flexibility.
Case study: The German intraday and imbalance settlement period
Market prices from the German intraday market from year 2013 were analysed, both on anhourly and a 15-minute basis. The hypothesis was that a certain need for flexibility would berevealed in the historical prices. In general, a portfolio manager would be active on themarket if there is a need to update/change its position, and if there is a value/cost associatedwith being longer or shorter balanced. If the position is long, i.e. excess generation in theportfolio or short, i.e. demand exceeds the generation, then there is need for flexibility.Another example of a need for flexibility would be the TSO which could potentially use the IDfor re-dispatch and counter trade in order to relax the transmission grid. Another applicationfor the ID traders would be outages from power/consumption facilities and therefore theavoidance of imbalances (and imbalance costs).
The German intraday market nowadays offers both hourly and 15-minute contracts. Thecontracts for the following day opens at 3PM (hourly contracts) and at 4PM (quarterlycontracts), both the hourly and the quarterly contracts trade period closes 45 minutes prior todelivery. Thus the trading period varies between 7-31 hours.
Since the Germany intraday market is not cleared with an auction procedure, hence there isnot one single marginal price, the analysed prices were the weighted average price (WAP).The WAP represents all the transactions for a single time step (hour or 15-minute), weightedby the traded volume.
38 The definition of settlement period is described in chapter 6.5.

20 April 2015 59A report to The European Commission
Study on the effective integration of Distributed EnergyResources for providing flexibility to the electricity system
Figure 26. Historical market prices for German during year 2013, 15-minute values
Source: EPEX Spot
The average price on the intraday market per 15-minute and hourly time step and theaverage hourly load can be observed in the figure below.
Figure 27. Weighted average price for the German market per 15-minutes and hour ofthe day, and the average load per hour during year 2013.
Source: Sweco, data from EPEX Spot
In order to understand the underlying reasons for the price pattern in each interval (“IntervalA”, “B”, “C” see figure above), hence the “need for flexibility”, one would have to look into theload throughout the day (grey dashed curve and the grey columns along the right axis in thefigure above). On a typical day the price pattern can be divided into three different time
Interval A Interval B Interval C Interval A

20 April 2015 60A report to The European Commission
Study on the effective integration of Distributed EnergyResources for providing flexibility to the electricity system
periods (“intervals”); A, B and C. For example Interval A is defined to be, typically, betweenthe hours 21-06. Obviously the exact hours for a given day vary, as does the price formation.The load is characterized during interval A to be “off peak”, and the first derivative of thehourly average load is relatively close to zero (small changes in load). We assume that,assuming a properly functioning market, that a certain scarcity/need for flexibility is indicatedvia a relatively high(er) market price. In principle, due to the hourly resolution from the day-ahead market, the production plans based on the market outcome will result in a within thehour imbalance, if not resolved via one of the 15-minute contracts traded on the intradaymarket. On average, the cost of regulation will be higher when the “system” rampingdirection is in the opposite direction (e.g. down regulation will be more costly when the“system-trend” ramping direction is up-wards, and vice versa). For a graphical illustration ofthis, see figure below.
Figure 28. Schematic illustration of the hourly ramping effects and the incurredsystematic imbalances between load and market outcome “load”.
Source: Sweco
Interval A
Interval A is characterized by a low, reasonably constant, load, often referred to as “offpeak”. Interval A spans between hour 21-06. The price on the intraday market is relativelyuniform within the hour, meaning that the average prices on the 15 minute contracts are notsignificantly different. It should be noted that the price for the first quarter (“00-15”) is slightlyhigher than the other quarterly contracts, however not as significantly as during interval Band C. Furthermore, worth mentioning is that the average price on the intraday market isrelatively low compared to interval B & C.

20 April 2015 61A report to The European Commission
Study on the effective integration of Distributed EnergyResources for providing flexibility to the electricity system
Interval B
Interval B is characterized by a rapid increase of load, starting approximately at hour 6 in themorning and lasting until hour 13. It is between these hours that the load transforms from offpeak to peak, and the majority of the daily positive ramping occurs. Historically speaking, thisis when mid- and peak-load (central) generators are started. If one looks at the differencebetween the continuous load and the hourly average load it can be seen that the continuousload will be below the hourly average load for the first two quarters, and during the last twoquarters the continuous load will be above the hourly average load, see the figure below fora schematic illustration.
Figure 29. Schematic illustration of the systematic imbalance between the continuousand hourly average load during upwards regulation.
Source: Sweco.
As can be observed in the figure above, the need for balancing/regulating power will besystematically larger during hours with significant change in the continuous load curve. Thesteeper the continuous curve is (larger change), the larger the imbalance between theaverage hourly load and continuous load for the first and last quarters. As the load needs tobe balanced with generation at any point in time, any deviation between the actual load andthe scheduled production plans needs to be resolved by the TSO (via regulating power andbalancing energy). Looking at Figure 30 it can be observed that the average price on theintraday market is higher during the first quarter compared to the price during the last 15minutes. The reason is because the cost of “flexibility” follows the ramping. Considering thefirst quarter in hour 06-07 in Figure 30, there is in general need for down regulation (systemis short) in order to balance the continuous load. This contradicts with the overall movementof the system, i.e. if a certain generation unit reduces its output the need for future upregulation will be increased in order to be balanced during the next settlement period. This isrevealed in Figure 30 above, where the average price during the first quarter (blue curve) is

20 April 2015 62A report to The European Commission
Study on the effective integration of Distributed EnergyResources for providing flexibility to the electricity system
approximately 3 times higher compared to the price in the last quarter (red curve) for thesame hour (hour 8-9).
Interval C
Interval C is characterized by peak-load and generally occurs between hours 13-18. Theload development during these hours is on average relatively constant, however there is aslight decrease in load between the morning peak (around 09-10) and the afternoon peak(around 18-19) looking at the annual average load. However the general trend for interval Cis a decreasing load, which is more obvious when one is looking at the load and ID pricepattern curves for the month of June and January separately, see figures below.
Figure 30. The German intraday quarterly average price for the month of January.
Source: Sweco, data from EPEX Spot
The load curve (grey dashed) for January illustrates the need for regulating power and thecorresponding cost effectively. A clear pattern can be observed where the price of the first15 minutes of an hour is ~1.5 times higher on average during the hours with increase load(hour 7-12, 17-19), and the opposite average cost (roughly 1.7 times more expensive duringthe last quarter) during the hours when the load is reduced (13-16). This pattern that can beobserved for January during mid-day (hour 13-16) does not appear for the month of June (orany of the other summer months), as the afternoon peak is not as clear as during the wintermonths. This is also reflected in the average price curves, see figure below.

20 April 2015 63A report to The European Commission
Study on the effective integration of Distributed EnergyResources for providing flexibility to the electricity system
Figure 31. The German intraday quarterly average price for the month of June.
Source: Sweco, EPEX Spot
In the figure above showing the average intraday prices there is a clear pattern of thequarterly costs and the need for regulating power. During the first half of the day (hour 6-13)the first 15 minutes show approximately 5 times higher prices on average compared to thelast 15 minutes of the hourly contracts. The exact opposite relation occurs during the secondhalf of the day (system load is decreasing) show approximately 10 times higher price onaverage for the last 15 minutes compared to the first 15 minutes.
The conclusion that can be drawn from the case study is that the need for a representativeand adequate market model needs to be in place in order to reveal the true value offlexibility. Depending on the regime and technological characteristics, the adequate ISPlength will vary. For a hydro dominated region like the Nordics the value of flexibility will beless varying as for thermal dominated markets (e.g. the German market), thus reducing theneed for a shorter ISP. The length of the ISP should balance proper system representationwith burden on market participants and liquidity.

20 April 2015 64A report to The European Commission
Study on the effective integration of Distributed EnergyResources for providing flexibility to the electricity system
5 DER provision of flexibility
Traditionally the flexibility of the system has primarily been provided by large centralizedconventional generation resources, e.g. thermal and hydro power plants. As illustrated inchapter 2, the changes of the power system both increase the overall demand for flexibilityand reduce the supply of flexibility from the traditional sources. Subsequently, the demandfor flexibility from distributed energy resources increases. The suppliers of flexibility atdistribution grid level will be consumers, distributed generation and storage providers. Someconsumers already rely on or will in future have their own generation capacity available andare then often referred to as “prosumers”.
DER comprises generation, storage and demand units connected to the distribution systems.In the following analysis options are grouped in four categories:
■ demand response and electrification of other sectors■ distributed generation■ distributed storage■ electric vehicles
The following chapters give a short overview on DER flexibility options. The focus lies on thecosts associated to the exploitation of DER flexibility, including investment costs andoperational costs. This analysis considers only the extra costs necessary to make DERsflexible (DER flexibility scenario) with respect to the business as usual (BaU) situation (“deltacosts” of flexibility). For example, if a smart meter roll-out is already taking place in BaU, thecost of the smart meter is internalized in the BaU scenario and not included in the investmentcost to activate DER flexibility in the DER flexibility scenario.
5.1 Demand Response and electrification of heat sector
In future energy systems demand response has the potential to play a key role providingflexibility for system operation. Many studies reveal a huge potential for shifting or sheddingoptions of electricity demand in EU. Most electricity consumers are connected to thedistribution grid. Demand response potential can be allocated at industrial, commercial andresidential consumers. An increasing number of consumers are becoming prosumers, i.e.,also producing electricity in addition to consuming.
Additional potential for flexibility lies in the electrification of other sectors, like heating (e.g.heat pumps, direct heating) including dedicated power-to-heat applications. This sectionanalyses in detail the following options:
■ Demand management in industrial installations■ Demand management in the commercial and residential sector■ Prosumers■ Power to heat
20 April 2015 65A report to The European Commission
Study on the effective integration of Distributed EnergyResources for providing flexibility to the electricity system
Demand response programmes comprise a source of flexibility through the following ways:
■ Demand reduction■ Demand increase■ Shifting demand in time
The capital and operational costs to enable flexibility of demand vary significantly dependingon the type of consumers.
The cost per MW of flexible demand is generally lower for industrial consumers than forcommercial and residential customers. In fact, the higher potential for flexible demand forlarge-scale consumers increases the effectiveness of the costs associated to theimplementation of necessary hardware and software assets and to the acquisition of a newclient.
5.1.1 Demand management in industrial installations
Industrial demand is shaped by the characteristics of specific industrial processes, andvaries among industries. Some industrial installations involve processes that offer a level offlexibility-- the potential to shift energy requirements of the process in time. Examples of suchprocesses include electrolysis (high DR potential, very energy intensive process), cementand paper mills, electric boilers, and electric arc furnaces.
Concerning the industrial demand the biggest flexibility potential is to be found in the energyintensive industries. However the switching of industrial loads in energy intensive operationsis more complicated than in less energy intensive operations due to the existence of specialrequirements in the industrial processes. The metal production and the chemical industryprovide numerous flexible loads. Other industries with high flexibility potential are glass,ceramics, food, paper, automobile and machinery industry. Although industrial demandresponse programmes are already developed the unexploited potential of this group is stillbig.
Costs for providing flexibility are generally modest if the primary process is not disrupted.Communication and control equipment is generally already installed at industrialinstallations. Costs generally relate to change of shifts in personnel, and potentiallyadditional on-site storage of intermediary products. Furthermore administration andmarketing costs contribute to the total cost of this option as process managers have to beconvinced to use their potential for providing flexibility. The potential of the option is high andis easy to realise, however its realisation will depend on sufficient incentives. Costsassociated with reduced production can be high and are usually avoided.
5.1.2 Demand management in the commercial and residential sector
In the residential and in the commercial sector, demand management can especially beapplied in cross-section processes such as providing heating and cooling. This includesdifferent levels of electricity demand, e.g. selective timing of the cooling of cold storagewarehouses as well as automatic adjustments in the demand of refrigerators. Other potential

20 April 2015 66A report to The European Commission
Study on the effective integration of Distributed EnergyResources for providing flexibility to the electricity system
demand management technologies include air conditioning, compressing air for mechanicaluse or even rescheduling of washing processes in households. An important factor toestimate the flexibility potential of demand response is the duration of the implementedprogramme on each group of customers and more precisely on each type of controllableload. It is estimated that the volume of controllable smart appliances (washing machine,tumble dryers, dishwasher, refrigerator etc.) in the EU by 2025 will be at least 60 GW –shifting this load from peak times to other periods can reduce peak-generation needs in theEU by about 10%. (Seebach, et al., 2009).
In order to harvest this tremendous residential potential, investment in information andcommunication technologies (ICT) is necessary. Smart appliances, home automation andsmart meters are the main instruments to tap this potential. ICT technology can facilitate theinteroperability of smart devices. Interoperability will depend heavily on standardisation ofappliances and of the different communication protocols.
The commercial sector makes up 30% of total energy consumption throughout Europe. Forthese consumers, heating and cooling is the main source of consumption (up to 80%).(European Commission, 2013). According to a holistic demand management programmedeveloped by DENA, in a typical German distribution grid area consisting of all groups ofcustomers, the commercial sector should play a leading role providing the highest flexibilitypotential among all the three sectors. Especially the heating and cooling systems ofcommercial customers show a very high flexibility potential (Deutsche Energie Agentur,2012). Some municipal water systems can provide the direct equivalent to pumped storagehydro by timing the reservoir refill to the needs of the power grid. Pooling of different demandpotentials makes use of inherent reservoir storage.
Demand response in the residential and commercial sector can be procured manually orautomatically. Calculations for DR potentials are very much depending on the assumptionsof procurement. If consumers have to react individually to price signals, potential for DR isvery low. If appliances are remotely controlled, tremendous potential for flexibility istheoretically available, especially in demand shifting, e.g. in air conditioning systems.
At residential level, a significant cost share of a demand response programme consists in theinstallation of smart meters and of home gateways (energy boxes) and smart appliances forhome energy management. However, it should be considered that this enablinginfrastructure for residential demand response might be made available by paralleldevelopments in the power system. In particular, the roll-out of smart meters is taking placein several countries due to policy decisions. Moreover, in some context, the penetration ofhome gateways and smart appliances is taking place driven by a business proposition whichis rather centred on home comfort solutions (home security, domotics) rather than simply onenergy management. Therefore, in these cases, it could be considered that the cost of theenabling infrastructure for residential demand response largely accrue to externaldevelopments, with significant positive impact on the cost-effectiveness of residentialdemand response.

20 April 2015 67A report to The European Commission
Study on the effective integration of Distributed EnergyResources for providing flexibility to the electricity system
In this hypothesis, the costs of residential and commercial demand response should includeonly the additional investment costs for putting in place the residential demand responseprogrammes (e.g. the cost of the aggregation platform of the DR service provider; anyadditional hardware/software asset) and the operational cost for implementing and runningthe demand response programme (e.g. customer acquisition and retention; billing; etc.). Incase of demand management programmes administrative and marketing costs should betaken into consideration being part of the service/market launch and the whole life cycle ofthe provided service.
5.1.3 Prosumers
Consumers that possess generation capacity (on their own premises) are summarised as“prosumers”. In the residential sector this can be households that acquired roof top PVpanels with integrated battery storage. In the commercial sector, emergency back-upsystems are common. They can be used to provide additional electricity in periods of highprices or need for grid management. Industrial customers often have own plants that deliverelectricity and heat at the same time (CHP). They can be profitable because of higherefficiency and lower tax burdens. Electricity production from CHP plants can be adjustedaccording to signals from the market or the grid system (see below).
The costs of activating these flexibility providers are low as communication infrastructure isoften already installed. Main costs occur because of aggregating the rather small entities.
5.1.4 Power to Heat
Electricity can be used to replace other fuels such as gas or oil for heating purposes. Oneoption is direct resistance heating: an electric current through a resistor converts electricalenergy into heat energy. Flexibility is provided by selectively energizing heaters and storingthe generated heat for later use.
Thermal energy can be efficiently stored in a number of ways, most commonly used areinsulated ceramic brick containers and hot water tanks. Heat is released as needed by theend user from storage. Electric heat pump technology offers a more efficient technology toconvert electricity to heat. Heat pumps effectively move heat energy from a source of heat(e.g., ambient air) to the end use or storage.
Heat pump technology is most familiar in air conditioners and refrigerators. The principle isthe same but the direction of heat flow is out of the ambient air from the conditioned incooling applications, whereas the flow is into the heated space in heating applications. Heatpumps are in fact reversible and can perform both heating and cooling functions—simultaneously in some applications.

20 April 2015 68A report to The European Commission
Study on the effective integration of Distributed EnergyResources for providing flexibility to the electricity system
5.2 Distributed Generation
Small-scale generation technologies form the first group of flexibility options. It includes:
■ Biogas and biomass power plants■ Combined heat and power plants■ Wind and PV (VRES)
5.2.1 Flexibility in biogas power plants
Flexibility on the biogas production itself is possible but very limited. The reaction timeexpands over several hours to days. It could be ramped to about 50% of the capacity. Theanaerobic digestion in biogas production has to run continuously 8760 h/a. More promisingflexibility options are biogas storage and CHP operation according to electricity productionneeds. Biogas storage facilities are usually constructed to store 3 – 6 hours of biogasproduction and could be enlarged for provision of flexibility. The electricity production viaBiogas plants makes use of Gas-Otto-engines which can ramp up and down in seconds.Because of subsidy regulation, high capital costs and the need for the cogenerated heat,they are often run in base-load operation. Additional capacity of the engine could provideflexibility in operation.
5.2.2 Flexibility in combined heat and power (CHP)
Combined Heat and Power plants produce electricity by heat that is generated from a centralprocess. There are three main types of CHP, based on their central operation:
■ Industrial CHP, that mainly produces heat for an industrial process and the powergeneration follows the variations of the industrial heat demand,
■ Residential CHP, used for district heating which follow daily/seasonal patternsaccording to the district heat demand,
■ Micro-CHP, which are small-scale installations that are used for local residentialheating purposes.
Due to their dependence on other primary tasks (heat production and heat supply), CHPplants often provide little flexibility. In general, heat driven CHP installations do hardlyrespond to electricity market prices and therefore represent a significant part of inflexiblecapacity in the system. If a heat storage system is applied, CHP plants can respond tochanges in the residual demand and their operation can be optimised to electricity prices.This flexibility could reduce must-run capacity in the system.
CHP are typically inflexible resources for the power system as their electricity output isconstrained by the heat requirements of the process connected to the CHP. CHP canbecome provider of flexibility with the integration of heat storage, in order to decouple thegeneration of electricity and of heat to a certain extent.
Investment costs for flexibility of CHP therefore include the installation of heat storage and ofan energy management system, possibly with a gateway to receive external signals andcommands.

20 April 2015 69A report to The European Commission
Study on the effective integration of Distributed EnergyResources for providing flexibility to the electricity system
The operational costs of flexibility can be expressed in terms of any economic loss due toadditional operational costs from the flexible use of the CHP (e.g. losses in the heat storage;less efficiency of the CHP; higher maintenance costs etc.). It is assumed that the introductionof the heat storage does not affect the heat supply to the industrial/commercial processassociated to the CHP.
5.2.3 Flexibility from variable renewable energy sources
Active power control of renewable power plants refers to the adjustment of the renewableresource’s power production in various response timeframes to assist in balancing thesystem generation and load or congestion management. Wind turbines and PV installationshave the technical capability for providing fast response to regulation signals. By curtailingpower production, these installations can provide down regulation. Up regulation can beprovided by operating units at generation levels below their potential generation value at agiven time, and increasing to the normal level if needed. Both operations come at theexpense of an overall reduction in VRES output.
The integration of higher shares of VRES is a key driver for the power system transformationand the need for new flexibility resources. Their participation in provision of flexibility canthus be a solution with major potential, especially for systems with very high VRES shares.However, there are several challenges to implementing greater VRES controls. First, due totheir stochastic nature, provision of flexibility from VRES is related to uncertainty. In addition,even though the installations have the technical potential to perform this task, often theregulatory / market environment present significant barriers. The actual use of thecommunication infrastructure between grid operator and power unit and the operationalframework can pose key limitations to the realisation of this option as well. For example, insystems where renewable energy is subsidised, the renewable producer operates VRES tomaximise the produced energy and has no incentive to curtail production.
Although, this option faces political and perceptual challenges associated with “wasting”renewable energy, there can be significant cost savings for the power system by moreintelligently operating renewable resources. For example, to the extent rapid changes in windor solar output are expected due to large-scale weather fronts, or partly cloudy conditions,units can be constrained to more limited operating regimes — limiting lost generation to theso-called “rare events” for which large levels of balancing reserves would otherwise beneeded. Nevertheless, active control of renewable generation is a common practice in areaswith high congestion levels.
Flexibility of renewable-based DG is typically related to two actions:
1. Active power control (via curtailment)
2. Volt-var (reactive power) control
Investment costs include the equipment to make PV and wind generators remotelycontrollable. This includes the installation of a smart converter (e.g. smart inverter for PVinstallations able to control PV curtailment, volt/var regulation, etc.) and any necessary

20 April 2015 70A report to The European Commission
Study on the effective integration of Distributed EnergyResources for providing flexibility to the electricity system
gateway for remote monitoring and controllability. It is worth mentioning that in a number ofcountries, also following grid code prescriptions, distributed generation units are increasinglyequipped with built-in smart functionalities for their grid interface (e.g. smart inverter). Thissignificantly reduces the additional investment costs necessary to activate the flexibility ofDGs, and improves the cost-effectiveness. For existing DG systems, retrofit costs to addsmart functionalities should instead be considered in the investment cost of DG flexibility.
The operational costs of flexibility is associated to the curtailment of generation (opportunitycosts), that can be expressed on a levelised cost of electricity basis. This cost is constantlyreducing, due to advances in solar and wind technology and scale effects39. The operationalcost of reactive power control is low, and depends on possible impact to the injected activepower due to changes in the power factor.
It is often assumed that RES-based DGs only can provide down-regulation (via curtailment).In principle, however, RES-based DGs could also provide up-regulation (increase ofgeneration level) if they are normally operated below their nominal capacity.
5.3 Distributed storage
Small scale storage options can provide flexibility on distribution grid levels by enabling time-shifting of local demand and supply. The analysis includes
■ Pumped hydro storage,■ Compressed-air energy storage (CAES),■ Battery technologies e.g. conventional (lead acid, lithium ion), high temperature
batteries and flow batteries,■ Flywheels, and■ Power to gas storage.
It is worth mentioning that storage penetration is constantly increasing worldwide and a rapidexpansion of installations is forecasted. For example, according to Information HandlingServices, Cambridge Energy Research Associates (IHS CERA), cited by the US Departmentof Energy,, 340 MW of storage were installed in 2012/2013 worldwide, and installation ratecould reach 6 GW per year in 2017, to achieve 40 GW installed by 202240. GTM Researchforecasts 720 MW of distributed storage (batteries, thermal and flywheels) to be deployed inthe United States between 2014 and 202041.Distributed storage assets are installed for the provision of power system flexibility.Therefore the investment costs of flexibility include also the storage asset together with any
39 “Revolution Now The Future Arrives for Four Clean Energy Technologies“, US Departmentof Energy, available at http://energy.gov/sites/prod/files/2013/09/f2/200130917-revolution-now.pdf40 Grid Energy Storage,US DoE report, December 2013; IHS-CERA report ‘The Role of EnergyStorage in the PV Industry – World – 2013;41 http://www.greentechmedia.com/articles/read/Commercial-Energy-Storage-Market-to-Surpass-720-MW-by-2020

20 April 2015 71A report to The European Commission
Study on the effective integration of Distributed EnergyResources for providing flexibility to the electricity system
necessary investment for enabling communication and control capabilities, like the interfacewith the grid or with distributed generation at prosumers’ premises.
In terms of costs, we consider together the capital and operational cost of the storage asseton a LCOE (Levelised cost of electricity) basis. Thus the cost of storage flexibility isexpressed in €/MWh on a LCOE basis. It is assumed that the LCOE includes also theinvestment costs of communication and control equipment.
Several studies report a constant reduction of LCOE of storage, particularly of batteries. Forexample, recent studies estimate that the LCOE of Li-ion batteries will reduce from 700-800$/KWh [~600-700€/KWh] in 2013 to 300-400 $/KWh [~250-350€:KWh]42 in 2020 (RockyMountain Institute, 2014). These numbers and other information on investment costs arepresented in the fact sheets in appendix.
5.3.1 Pumped hydro storage
Pumped hydro (PHS) stores energy mechanically. Electricity is used to pump water from alower reservoir to an upper reservoir and recovering the energy by allowing the water to flowback through turbines to produce power, similar to traditional hydro power plants. Pumpedstorage technology is mature, has low O&M costs and is not limited by cycling degradation.Capital costs are higher compared to i.e. gas fired power plants and very specific geographicrequirements are needed. Final investment costs depend on size, siting and construction.
Pumped hydro storage power plants are common technology and have significant sharewithin Europe. Because of their optimal size, they are typically connected to the transmissionnetwork. There are only very few pumped hydro storages installed connected to thedistribution grid level in Europe. Their number is not expected to grow significantly in thefuture.
5.3.2 Compressed Air Energy Storage
In compressed air energy storage (CAES), energy is stored mechanically by running electricmotors to compress air into enclosed volumes. For discharge, the electrical energy is fed intothe inlet of a combustion turbine. The combustion turbine consumes some fossil fuel in itsoperation, but it can generate almost three times the energy of a similarly sized conventionalgas turbine.
A second generation of Advanced Adiabatic CAES technology (AA-CAES) captures the heatenergy during compression and returns it by heating the air as it passes to the combustionturbine inlet for carbon free operation. Another approach involves compressing andexpanding the air slowly such that it nearly maintains the same temperature. Key barriers tothe technology are its efficiency, high capital costs and the specific siting requirements. Alsovery often a primary fuel source like gas is required for the compressors. CAES technologyis more common in US while there are recent projects on small scale and distributionnetwork connection within Europe.
42 42 Considering 1$=0.86 € (currency change at January 2015)

20 April 2015 72A report to The European Commission
Study on the effective integration of Distributed EnergyResources for providing flexibility to the electricity system
5.3.3 Flywheels
Flywheels are rotating masses that store electricity in the form of kinetic energy. Energy istransferred in and out using a motor-generator that spins a shaft connected to the rotor. Tominimise the energy lost during rotation, flywheels are often maintained in a vacuum and reston very low friction bearings (e.g. magnetic). The rotor is the main component of theflywheel. Rotor characteristics such as inertia and maximum rotational rate determine theenergy capacity and density of the devices. The motor-generator and associated powerelectronics determine the maximum power of the flywheel, allowing for power and energycapacities to be decoupled. Key advantages of the technology are the fast response timesand the provision of inertia for grid stabilisation, while key barrier are high investment costs.
5.3.4 Batteries
Batteries refer to electrochemical energy storage technologies that convert electricity tochemical potential for storage and then back to electricity. Batteries can be broken down intothree main categories:
■ conventional batteries, that are composed with cells which contain two electrodes(e.g. lead acid, lithium ion)
■ high temperature batteries that store electricity in molten salt (e.g. NAS), and■ flow batteries that make use of electrolyte liquids in tanks (e.g. Zn/Br Redox,
FE/Cr Redox)
Batteries have a very fast response time and high efficiencies, but they have high capitalcosts.
5.3.5 Power to Gas
Power to Gas refers to chemical energy storage, namely the use of electric energy to createfuels that may be burned in conventional power plants. Key fuel is synthetic methane (andhydrogen to some degree). The procedure consists of two steps:
■ 1. Electricity is used in electrolysis to split water into hydrogen and oxygen.■ 2. Hydrogen is reacted with carbon dioxide to create methane.
Methane is the main constituent of natural gas and therefore can be injected to the existinginfrastructure for natural gas (grid and storage). The high storage capacity of the gas grid(e.g. approximately 400 TWh for the German gas grid) could then be used for medium- andlong-term storage purposes. A first demonstration project of kW-scale has been built andoperated in Germany and a 6 MW plant also began operation in 2013 in Germany.
Key strength of chemical storage over some of the other technologies is its high energydensity (kWh/m3) compared to most of the other technologies and its high shifting period.Key barrier is the low efficiency.

20 April 2015 73A report to The European Commission
Study on the effective integration of Distributed EnergyResources for providing flexibility to the electricity system
5.4 Batteries of electric vehicles (EV)
Electric vehicles are expected to play a bigger role in the transport sector. Electric vehiclesmake use of electricity stored in electric vehicle batteries, selectively charged by the gridwhen the vehicle is parked at a charging spot. The characteristics of transportation demandallow fleets of EVs to be used as a flexibility option for the power system in two keyoperational modes:
1. G2V (Grid-to-Vehicle, where fleets of EVs are operated as a DSM option, enabling ashifting of the charging times) or
2. V2G (Vehicle-to-Grid where in addition to charging, the batteries of EVs could bedischarged and feed power to the grid)
Due to their primary use as means of transportation, the provision of flexibility from EVs issubject to many constraints and is inherently uncertain. EVs form a parallel development.Their investment costs are driven by the transport sector. So far, there is still a lack ofbusiness models due to their high costs compared to other transport options.
Assuming an increase of EVs due to the need in the transport sector, studies show thatavailable EVs can be a competitive flexibility option because they are expected to be highlyavailable during evening and night time hours (charging at home). During daytime theiravailability depends on the existence of charging infrastructure in other locations (e.g. work).If the batteries of EVs are used to provide flexibility, their life length is shortened. Therefore,the usage of EVs for flexibility is also highly dependent on the manufacturer of the batteriesand the provided warranty.
Investment costs to provide EV flexibility relate to the installation of a gateway to monitor andcontrol the charging station and to the on-board EV converter, to ensure smart chargingcapabilities.
Implementation of V2G services requires additional costs to enable bidirectional chargingstation-EV.
However, it could be considered that investments enabling smart charging of EVs are part ofthe primary use of EVs and thus driven by the developments in the transport sector, and notby the need to provide flexibility to the system. In this respect, it can be assumed that theinvestment costs to provide EV flexibility are low and could potentially be related only to theadditional investments to add V2G capabilities to EV and charging infrastructure.
Operational cost of flexibility can be expressed in terms of increased maintenance, reducedefficiency and of reduced battery lifetime due to charging and discharging patterns.
In terms of penetration of EVs, it is worth noting that that EV battery costs are significantlyreducing, thanks to technological advances and scale effects, and this will favour the

20 April 2015 74A report to The European Commission
Study on the effective integration of Distributed EnergyResources for providing flexibility to the electricity system
availability of EVs to provide flexibility to the power system. According to the US DoE, thecost of manufacturing an EV battery has dropped by 50 percent between 2009 and 201243.
5.5 Role of enabling ICT and communication infrastructure
In general, the presented resources for flexibility on the DSO level are smaller than powerplants that are main providers of flexibility in the traditional electricity system. In order tomake use of DER to provide flexibility especially on the system level, communicationinfrastructure is essential.
Depending on installed functionalities, smart meters can enable the adoption of dynamictariffs and the introduction of demand response based on price signals. This requires thatSmart Meter data (including price) can be made available to the user. This is not always thecase for deployed smart meters but solutions exist to add this functionality. For example, inItaly, the deployment of SmartInfo devices is being trialled out to allow the communication(via power line communication) between the smart meter and the home area network. Anumber of smart home kit on the market also includes modules to communicate meter datato the energy box44.
However, as already commonplace in the US, smart meters could also allow the introductionof demand response programs to mitigate peak events without relying on price signals ordirect communication smart meter-energy box. In that case, the utility communicates, viainternet, to a smart energy box or a smart thermostat the need to shift consumption on apeak hour for the following day. The consumer is rewarded based on the quantity of reducedconsumption which is measured ex-post thanks to the smart meter (e.g. Rush Hour Rewardprogram)
5.6 Sources of value for DER flexibility
Table 1 summarises the key findings and shows qualitatively the technical potential of DERflexibility and the maturity of mechanisms for their valorisation, thus giving an indication ofthe potential value of DER flexibility in the short-medium term (5-10 years). The table takesinto account on the one hand the potential use of DER flexibility to provide system benefitsfrom a theoretical point of view and on the other hand the emergence of regulatory/marketmechanisms for the valorisation of DER flexibility. The qualitative evaluation is intended tohighlight trends of how sources of value of DER flexibility are becoming available in mostmature markets in Europe and US. It does not reflect all possible national market/regulatoryconditions.
43 “Revolution Now The Future Arrives for Four Clean Energy Technologies“, US Departmentof Energy, available at http://energy.gov/sites/prod/files/2013/09/f2/200130917-revolution-now.pdf44 e.g. http://www.pluzzy.com/en/home-automation/module-for-electronic-electricity-meter-p9#Close

20 April 2015 75A report to The European Commission
Study on the effective integration of Distributed EnergyResources for providing flexibility to the electricity system
The table’s notation should be thus understood as follows:
■ / Limited potential value could be exploited in short-medium term■ + Low potential value could be exploited in short-medium term■ ++ Medium potential value could be exploited in short-medium term■ +++ High potential value could be exploited in short-medium term
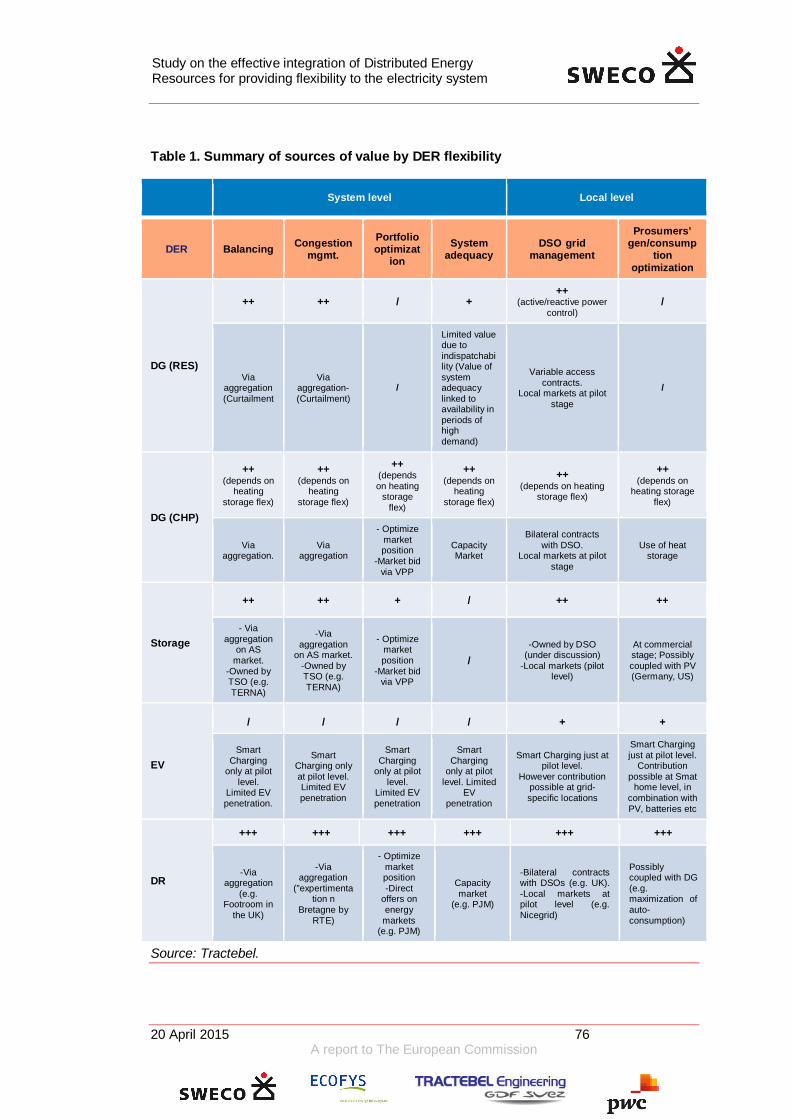
20 April 2015 76A report to The European Commission
Study on the effective integration of Distributed EnergyResources for providing flexibility to the electricity system
Table 1. Summary of sources of value by DER flexibility
System level Local level
DER Balancing Congestionmgmt.
Portfoliooptimizat
ionSystem
adequacyDSO grid
management
Prosumers’gen/consump
tionoptimization
DG (RES)
++ ++ / +++
(active/reactive powercontrol)
/
Viaaggregation(Curtailment
Viaaggregation-(Curtailment)
/
Limited valuedue toindispatchability (Value ofsystemadequacylinked toavailability inperiods ofhighdemand)
Variable accesscontracts.
Local markets at pilotstage
/
DG (CHP)
++(depends on
heatingstorage flex)
++(depends on
heatingstorage flex)
++(dependson heating
storageflex)
++(depends on
heatingstorage flex)
++(depends on heating
storage flex)
++(depends on
heating storageflex)
Viaaggregation.
Viaaggregation
- Optimizemarketposition
-Market bidvia VPP
CapacityMarket
Bilateral contractswith DSO.
Local markets at pilotstage
Use of heatstorage
Storage
++ ++ + / ++ ++
- Viaaggregation
on ASmarket.
-Owned byTSO (e.g.TERNA)
-Viaaggregation
on AS market.-Owned byTSO (e.g.TERNA)
- Optimizemarketposition
-Market bidvia VPP
/-Owned by DSO
(under discussion)-Local markets (pilot
level)
At commercialstage; Possiblycoupled with PV(Germany, US)
EV
/ / / / + +
SmartCharging
only at pilotlevel.
Limited EVpenetration.
SmartCharging onlyat pilot level.Limited EVpenetration
SmartCharging
only at pilotlevel.
Limited EVpenetration
SmartCharging
only at pilotlevel. Limited
EVpenetration
Smart Charging just atpilot level.
However contributionpossible at grid-specific locations
Smart Chargingjust at pilot level.
Contributionpossible at Smat
home level, incombination withPV, batteries etc
DR
+++ +++ +++ +++ +++ +++
-Viaaggregation
(e.g.Footroom in
the UK)
-Viaaggregation
(”expertimentation n
Bretagne byRTE)
- Optimizemarketposition-Direct
offers onenergymarkets
(e.g. PJM)
Capacitymarket
(e.g. PJM)
-Bilateral contractswith DSOs (e.g. UK).-Local markets atpilot level (e.g.Nicegrid)
Possiblycoupled with DG(e.g.maximization ofauto-consumption)
Source: Tractebel.

20 April 2015 77A report to The European Commission
Study on the effective integration of Distributed EnergyResources for providing flexibility to the electricity system
Table 2. Examples of present valorization of DER flexibility and on-going extensionsof use, system level
Sources ofvalue
Examples of current valorization ofDER flexibility
Examples of extension ofuse of DER flexibility
Syst
emle
vel
Balancing
§ In France, around 400MW of flexibledemand is presently contracted by (RTE) fortertiary reserve (“marché ajustement”).
§ In Germany, monthly auctions areorganized to procure up to 3000MW ofbalancing reserves from fast respondingflexible distribution loads (less than 15minutes activation time or less than 1second for frequency control).
§ In the UK National Grid contractsdownward regulation to prevent windcurtailment at times of high windgeneration when electricity prices becomenegative. Flexibility is provided by flexibleloads (demand, storage etc.) which canincrease demand and controllabledistributed generation (e.g. CHP) reducingelectricity generation.
§ On-going trend forreduction of theminimum market biddingsize to favour marketintegration of aggregatedDERs
§ Regulation evolving tosupport inclusion ofdemand response inenergy (e.g. 2014 NEBEFrules in France) and inancillary service markets(e.g. since 2014aggregation ofdistribution-connected DRresources possible intertiary reserve in Belgiumsince 2014)
§ In the US, evolution ofregulation to reward fastbalancing resources (eg.distributed storage)
Congest.
§ In France, in winters 2012/2013 and2013/2014, RTE has contracted 70MW ofdistribution connected demand response(with a minimum bidding size of 1MW) inBretagne, to assure supply at peak times ina region which depends on limitedinterconnections with other French regions
§ In Italy, Terna, has invested in three largeenergy-intensive battery storage systemswith an average capacity of approximately10 MW and 80 MWh. The scope is toincrement the transmission grid’s capacityto absorb renewable power withoutcreating congestions.
§
Portfoliooptimization
§ In Germany, RWE started its first VPP(virtual power plant) pilot project in 2008(8.6MW) and is expected to manage a VPPportfolio of over 200MW in 2015. DERflexibility is aggregated for optimization ofportfolio of balancing responsible partiesand retailer
§ /
Systemadequacy
§ In the US, around 10GW of demandresponse capacity was contracted in thelatest capacity market auction for2017/2018. Enernoc, the largest USaggregators, reports capacity payments ofaround 185 M$ [160M€] for a total of 4GWof contracted demand response capacity.
§ Inclusion of demand-sideresources into futurecapacity markets in UKand France
Source: Tractebel.

20 April 2015 78A report to The European Commission
Study on the effective integration of Distributed EnergyResources for providing flexibility to the electricity system
Table 3. Examples of present valorization of DER flexibility and on-going extensionsof use, local level
Sources ofvalue
Examples of current valorization ofDER flexibility
Examples of extension ofuse of DER flexibility
Loca
llev
el
DSO gridmanagement
§ In the UK, UK Power Networks has set-up abilateral contract with the aggregatorEnernoc for the provision of demandresponse service to limit power congestionsin selected grid areas and avoidreinforcements. UK Power Network’sbusiness plan forecasts savings of around£40 million [€52M] from DR schemes from2015 until 2023
§ In California, utilities have contracts ofaround 900MW of distributed DR for gridemergency
§ DSOs (e.g. Enel,UKPowerNetworks) piloting storagefor grid management
§ DSOs (e.g. in DE) remotelycontrolling DGs for gridsecurity
Prosumersgen/consumptionoptimization
§ In California, PV+storage systems forresidential/commercial customersincreasingly have a business case viareduction of peak demand charges.
§ Home energy management systems arebeing marketed by utilities, telecoms andICT companies (smart energy boxes, smartplugs, smart thermostats etc.).
§ Coupled with smartmeters, smartthermostats) areincreasingly used forresidential DR programs inthe US
Source: Tractebel.
5.7 Cost effectiveness of DER
In this section, we summarise the cost structure of DER and the main drivers of the expectedevolution of power systems in Europe that affect the cost-effectiveness of DER flexibility. Theanalysis separately focuses on the impact of these drivers on the costs and on the value ofDER flexibility. We then draw conclusions on the expected evolutions of the cost-effectiveness of DER flexibility, in particular with reference to traditional alternatives likeflexible central generation units and network reinforcements.
5.7.1 Cost structure of DER
Table 4 reports a summary of key findings on the typical capital and operation investments tomake DER flexible. As mentioned, some of these costs could be avoided (in blue), if externaldevelopments (e.g. penetration of smart meters; penetration of EV charging infrastructure)make part of the enabling infrastructure for DER flexibility already available.

20 April 2015 79A report to The European Commission
Study on the effective integration of Distributed EnergyResources for providing flexibility to the electricity system
Table 4. Capital and operational costs of DER flexibility
DER Main CAPEX for flex [k€/MW] Main OPEX for flex [€/MWh]
DG (wind)Smart converter/controllerCommunication GatewayIntegration in a VPP platform
Curtailment of generation (opportunity cost)
DG (PV)Smart converter/controllerCommunication GatewayIntegration in a VPP platform
Curtailment of generation (opportunity cost)
MiniCHPHeat storageSmart converter/controllerCommunication GatewayIntegration in a VPP platform
Any Loss of efficiency due to heat storage/e-driven operation
MicroCHP Installation of heat storage. EMS,communication infra.
Any Loss of efficiency due to heat storage/e-driven operation
Distributedstorage (Li-Ion)
LCOE of the storage assetSmart converter/controller; communication gateway; integration in a VPP platform
EV
Chargers with smart converter/controller and
communication gateway.
Bidirectional converters for V2G
Any additional cost for performance degradation
to due to smart charging and V2G.
DRIndustrial
Smart Meter and communication gateway, EMSIntegration in a VPP platform
Very low (assumed that industrial processes arenot affected)
DRcommercial
Smart meter; communication gateway ; EMSIntegration in a VPP platform Low
DRresidential
Smart meter; communication gateway; energybox; in-home displays; smart appliancesIntegration in a VPP platform
Medium (cost for customer acquisition andretention; running a more complex aggregationplatform with several distributed loads)
Source: Tractebel.
Evolutions of regulatory and market structures are not considered here. This analysis iscarried out in the next chapters of the report.. In the following sections, we briefly present theconsidered drivers:
5.7.2 Key drivers affecting DER cost-effectiveness
The following five key drivers are found to be the most influential on the development of DERcost-effectiveness. The key argumentation is presented below.
1. Penetration of RES (large-scale)
Penetration of (variable) RES, particularly wind and solar, is steadily increasing acrossEurope. Currently, policy incentives have represented a main driver (e.g. 20% target set bythe European Commission, feed-in tariffs etc.). As reduction of generation costs of REScontinue and reach grid parity, a tipping point could be reached for increased massivepenetration of RES.

20 April 2015 80A report to The European Commission
Study on the effective integration of Distributed EnergyResources for providing flexibility to the electricity system
2. Penetration of distributed generation
The penetration of distributed generation, particularly renewable based (e.g. photovoltaic), isalso dramatically increasing, thanks to policy incentives and reduction of generation costs. InGermany, Denmark and Spain, the penetration of distributed generation is already higherthan 40% of total installed capacity. This trend is expected to rapidly continue in severalEuropean countries. The rapid spread of distributed generation is completely transformingthe way that distribution grid are planned and operated, as bidirectional power flows at locallevel need to be taken into account.
3. Electrification of other sectors
The use of electricity is expected to be increasingly extended in a number of energyservices, like transport (via electric vehicles) and heat (via heat pumps). In particular, theelectrification of a share of the transport sector (via electric vehicles and plug-in hybrids) isexpected to generally increase the level of demand of electricity. A strong increase of peakdemand can be expected, if no smart charging becomes available.
Progress on EV adoption has been slow but penetration is steadily increasing, supported bypolicy-driven initiatives. For example, in terms of charging infrastructure, the Netherlands willcarry out by 2015 a full roll out of a nationwide fast-charging network. In France, from 1stJuly 2015 all buildings with parking lot (commercial/residential) are required to be equippedwith recharging plugs (up to 4kW).
In terms of EV penetration, the absolute value of EVs and plug-in hybrid sold in 2013 is stilllow compared to internal-combustion-engine vehicles; however some countries are startingto witness significant increase of EV sales. For example in the Netherlands EV and Plug-inhybrids accounted for around 5% of the market in 2013. In Norway, during the first quarter of2014 all-electric car sales reached a record 14.5% market share of new car sales and nowEVs represent 1% of the total cars registered in Norway45.
Therefore it is expected that EV penetration will increasingly have an impact on the evolutionof the power systems and, accordingly, on the value of DER flexibility. For example, SmartEV charging could provide necessary demand flexibility in areas with high PV generationwhere a low net demand during the day and high ramp up of demand in late afternoon couldoccur.
Moreover, the potential of flexibility of EVs is expected to be boosted by its integration withdistributed generation and batteries in the Smart Home, to contribute to the optimization ofprosumers’ load/generation. For example, according to UBS, in Europe the payback time forunsubsidized investment in electric vehicles paired with rooftop solar and battery storage will
45
http://www.rvo.nl/sites/default/files/2014/01/Special%20elektrisch%20vervoer%20analyse%20over%202013.pdfhttp://www.greencarreports.com/news/1091290_one-percent-of-norways-cars-are-already-plug-in-electrics

20 April 2015 81A report to The European Commission
Study on the effective integration of Distributed EnergyResources for providing flexibility to the electricity system
be as low as six to eight years by 2020. Most favourable conditions are expected in Spain,Germany and Italy.
4. Energy efficiency
Initiatives to improve energy efficiency are at the core of the European energy policy (e.g.the European Union has set a target of 20% reduction of energy consumption by 2020compared to a baseline scenario). Energy efficiency is expected to continue to play atransformative role in the future power system. Energy efficiency provides structuralreduction of electricity demand including at peak times.
5. Roll out of smart meters and smart homes
Driven by policy requirements, the roll-out of Smart Meters is taking place in most Europeancountries. According to a recent benchmarking report by the European Commission, 200million smart meters for electricity (representing approximately 72% of all Europeanconsumers) will be installed by 202046.
In parallel, even before the installation of smart meters, several consumers are starting toembrace smart home technologies. Smart home systems are already widely available on themarket. They include among their functionalities home energy management services (energybox) but more generally provide home comfort solutions, ranging from home security todomotics. In other words, in a number of countries, the smart home development is alreadytaking place, to some extent independently from the implementation of demand responseprogrammes, and is providing the enabling infrastructure for future demand responseprogrammes.
In these contexts, it can be assumed that the cost of part of the enabling infrastructure(smart home box, smart appliances, in-home displays, etc.) does not accrue to DERflexibility investments.
It appears that the main motivation for consumers to adopt Smart Home systems becomingavailable on the market is not limited to the energy savings that are currently possible withdetailed monitoring of energy consumption, but includes more generally home comfortsolutions (domotics, home security etc.). For example it is worth mentioning that severalactors (utility, telecoms etc.) are already marketing smart home boxes which include also theenergy monitoring functionality via smart plugs. These systems, even without smart meters,allow scheduling, controlling and monitoring the consumption of home appliances using asmartphone. With the introduction of smart meters and of dynamic tariffs, these systemscould allow also the implementation of demand response based on price signals, as it isalready the case in a number of demand response programs in the US.
46 http://ec.europa.eu/energy/gas_electricity/smartgrids/smartgrids_en.htm

20 April 2015 82A report to The European Commission
Study on the effective integration of Distributed EnergyResources for providing flexibility to the electricity system
5.7.3 Drivers impacts on cost effectiveness of DER
Table 5 reports the impact of the evolution of the drivers on the need for flexibility in thepower system and on the availability of sources of flexibility in the system. For example, theon-going penetration of variable renewables (e.g. PV) determines a significant increase inthe flexibility needs of the power system in order to off-set their variability and to mitigateissues on distribution grids that were not designed to host significant amount of distributedgeneration. In terms of available flexibility in the system, the impact of penetration of variableRES is mixed. On the one hand, it is, pushing out flexible central generators out of the meritorder (several GW of gas power plants are being mothballed in Europe) but on the otherhand the possibility to active curtailment of variable RES in strategic points of the grid canprovide the necessary flexibility to solve distribution congestion issues and increase thehosting capacity for new distributed generators.
For what concerns the need for flexibility, as already discussed in chapter 2, we note that theon-going evolutions of the power system, particularly the penetration of RES, DGs andelectrification trends, are increasing the need for flexibility at system level (global flexibilitygap) as well as at local level driven by the high penetration of distributed generation (localflexibility gap).
Concerning the role of traditional sources of flexibility in the system, we note two key trends:
1. The cost-effectiveness of central power plants is negatively affected by the on-goingpenetration of RES and DG. Firstly, an increase of operational costs and of the wearand tear of the equipment is observed due to operation at suboptimal operating pointand due to higher cycling frequencies (Troy, et al., 2012). Secondly, the reduction ofcapacity factor of peaking plants brings the economic rentability of flexible centralunder strain. Finally, due to their remote position in higher voltage levels of thesystem, central power plants cannot access sources of flexibility value at local leveland contribute solutions to close the local flexibility gap.
2. The cost-effectiveness of reinforcements is negatively affected by the on-goingpenetration of RES and DGs. Traditionally, reinforcements for DG hosting capacityare typically decided under worst-case planning scenarios (fit and forget47). Thispractice becomes infeasible or too expensive with increasing penetrations of DGs asthe nominal capacity of the new grid assets is used only a few hours per year (asexplained in the examples in section 2.2.5). Finally, network reinforcements are
47 This analysis should be done on a case-by-case basis, as it depends on localcircumstances. However fit and forget is in fact likely not to be an optimal solution from asociety point of view, especially when a large number of DGs needs to be connected. It istrue in fact that the maximum allowable DG capacity connection is usually calculated basedon deterministic procedures and assuming the worst case scenario, i.e. maximum substationvoltage, minimum network loading conditions and maximum DG output power. Nevertheless,the simultaneous occurrence of all these conditions is not likely, which means that there isconsiderable room for improvement, if appropriate control actions are developed for networkoperation (e.g. possibility to modulate active and reactive power of DGs).

20 April 2015 83A report to The European Commission
Study on the effective integration of Distributed EnergyResources for providing flexibility to the electricity system
increasingly facing public opposition, with higher uncertainties, long delays andhigher permitting costs.
As a consequence, new opportunities to enable DER flexibility are becoming available, andoverall the potential value that DER flexibility can capture is strongly increasing.
Table 5. Impact of drivers on flexibility needs and flexibility available
DRIVERS Impact of drivers onFLEXIBILITY NEEDS
Impact of drivers onAMOUNT OF FLEXIBILITY AVAILABLE IN
THE SYSTEM
Penetration of RES
Increase of balancing needs (highervariability of net demand)
Mothballing of central flexible units dueto economic and technical strain: Highercycling costs and sub-optimal operating
conditions; lower capacity factorsIncrease of available (downward)
flexibility due to higher potential for REScurtailment
Increase need of market actors tohedge against volatility of prices /
Penetration of DG
Increase of flex needs for DSOs’congestion management
Distributed generation providinglocational flex to DSOs and, via
aggregation, global flex to system level
Increase of need for optimization ofgeneration/demand profiles for
prosumers (e.g. auto-consumption)/
Penetration of smartmeters/smart home
devices/
Enabling residential/commercial demandresponse
Increase for flex supply, particularly at locallevel (DSOs’ and prosumers’ needs), and,
via aggregators, also at system level.
Energy efficiency
Possible reduction of flex needs due tolower peak demand (both at system/
local level). Less potential for demand response (partof value of demand response already
captured by energy efficiency)Possible increase of flex needs due tohigher variability of net-demand
Electrification (EV, heatpumps)
Increase of flex needs to avoid higherpeak demand (needs at system and
local level)
Increase of available flex supply (systemland local level).
Higher potential for peak load shifting (viademand response) via heat pumps, EV,
airco etc. (e.g. possibility to synchronize EVcharging to periods of high PV production )
Source: Tractebel analysis
Table 5 summarises the impacts of the drivers on the evolution of the potential valueassociated to DER flexibility. In the table, a positive impact is highlighted in green, a negativeimpact in red.

20 April 2015 84A report to The European Commission
Study on the effective integration of Distributed EnergyResources for providing flexibility to the electricity system
Table 6 and Table 7 reports the impact of the drivers on the evolution of the costs of DERflexibility. In the table, a positive impact is highlighted in green, a negative impact in red.
We can observe two main dynamics which are leading to the reduction of costs of DERflexibility:
1. On-going evolutions in the power system are leading to the deployment ofinfrastructures which enable DER flexibility and reduce its implementation costs:
■ Penetration of EVs and charging infrastructure (driven by transport policyincentives), provides part of the enabling infrastructure for activation of EVflexibility.
■ Penetration of smart meters (driven by policy decisions), is laying the foundationsof the enabling infrastructure for activation of demand flexibility.
■ Penetration of smart home devices, mainly driven by domotics marketdevelopments, is laying the foundations of the enabling infrastructure for activationof demand flexibility, particularly at residential level.
2. Technological evolutions are significantly reducing the cost of DER flexibility
■ Constant reduction of LCOE (levelised cost of electricity) of RES reduces theopportunity cost of DG curtailment
■ Constant reduction of LCOE for distributed storage and of reduced uncertaintiesover its charging/discharging performances reduces the cost of storage flexibility
■ Manufacturers increasingly provide built-in smart functionalities in converters forDG-grid connection (e.g. smart inverters). Increasingly baseline assets are smart-grid ready (in other words the delta cost, compared to the BaU, to activate DERflexibility is reduced).
■ Reduction of EVs cost due to scale effect■ On-going standardization in Europe is expected to drive down device costs and
transaction costs due to lack of interoperability

20 April 2015 85A report to The European Commission
Study on the effective integration of Distributed EnergyResources for providing flexibility to the electricity system
Table 6. Impact of drivers on the value of DER flexibility
DRIVERS Value fromflexible DG
Value from EVsmart charging Value from DR
Value fromdistributed
storage
Penetration ofRES
Higher flex needsfor balancing(systemlevel)àHigher valueto provide flexibility
/ Higher flex needs(systemlevel)àHigher valueto provide flexibility,especially to meetnet-demand.
/
Penetration ofDG
Higher flexneedsàHighervalue to provideflexibility for DSOsgrid management,also at planningstage, to defer gridinvestments and toincrease DG hostingcapacity.
Higher value toprovide flexibility forDSOs gridmanagement, alsoat planningtimeframe
Higher value toprovide flexibility forDSOs gridmanagement, alsoat planningtimeframeHigher value toprovide flexibility toprosumers tooptimizegeneration/demand
Higher value toprovide flexibility forDSOs gridmanagement, alsoat planningtimeframeHigher value toprovide flexibility toprosumers tooptimize DG/storage
Penetration ofsmartmeters/smarthome
/ Higher value toprovide flexibility toprosumers forload/generationoptimization
Higher value toprovide flexibility toprosumers forload/generationoptimization
/
Energyefficiency
/ / Lower demand(includingpeak)àlowerpotential fordemand response.On the other hand,lower demandmeans higher shareof net demand withhighvariabilityàpotentialhigh value for fast-ramping flexibleloads.
/
Electrification(EV, heatpumps)
/ Higher value toprovide flexibility forDSOs gridmanagement, alsoat planningtimeframe
Higher peakdemandàHighervalue due to higherpotential of peakload shifting
/
Technologicalevolutions
Higher flexibility(e.g. volt/var controlrange) thanks toprogresses in smartconverters
With storagecapable to meetstrictercharging/dischargingconstraints, higherflex value byaccessing more flexremunerations.Future opportunity ofV2G (Nocommercialavailability yet)
Higher potentialthanks to integrationof smart devicesenabling automateddemand responsewith minimal humanintervention
With storagecapable to meetstrictercharging/dischargingconstraints, higherflex value byaccessing more flexremunerations.Lower costs due touncertainties andrisks of batterywarranty.
Source: Tractebel

20 April 2015 86A report to The European Commission
Study on the effective integration of Distributed EnergyResources for providing flexibility to the electricity system
Table 7. Impact of drivers on the cost of DER flexibility, cont.
DRIVERS Cost of flexfrom DG-RES
Cost of flexfrom EV Cost of flex from DR
Cost of flexfrom
distributedstorage
Penetration ofRES (policy
driver)
-Scale effect isdriving down LCOEof DG/RES
/ / /
Penetration ofDG
(policy driver)
-Scale effect is
driving down LCOE
of DG/RES
-DGs increasingly
equipped with
converters with
built-in smart
functionalities (e.g.
smart inverters)
/ /
-For certain
application,
reduction due to
integrated
DG+storage
system design
Penetration ofsmart meters
(policydriver)/smart
home (domoticsmarket driver)
/ /
-Reduction, as cost of DR flex
CAPEX mostly internalized by
on-going roll-out of smart
meters and “smart home”
assets (e.g. smart appliances;
energy boxes)
/
Energy efficiency(policy driver) / / / /
Electrification(EV, heat pumps) /
-Reduction, as cost
of EV flex CAPEX
mostly internalized
by EV and charging
infra investments
(driven by transport
not by power
system needs)
/
-Reduction of
costs of batteries
thanks to scale
effect due to EV
penetration
Technologicalevolutions
-On-going reduction
of LCOE of DG-
RESàreduction of
opportunity cost of
curtailment
-Reduction of costs
due to
standardization and
scale effects
-Reduction of costs due to
standardization, more active
consumer
participation/awareness, scale
effectàlower transaction costs,
larger VPP platform
-On-going
reduction of LCOE
of distributed
storage
Source: Tractebel.

20 April 2015 87A report to The European Commission
Study on the effective integration of Distributed EnergyResources for providing flexibility to the electricity system
5.7.4 Cost effectiveness of DER flexibility – Main messages
This chapter has provided a qualitative assessment of the evolution of the cost-effectivenessof DERs to address the global and local flexibility gaps identified in chapter 2, in particularwith reference to traditional options like central flexible generation and reinforcements. Theanalysis aimed at:
■ Assessing how cost-effectiveness of DER is evolving, by analysing the evolutionsof the costs of DER flexibility and of the sources of value associated to it.
■ Carrying out a qualitative comparison of the evolution of cost-effectiveness ofDERs to provide system flexibility over traditional options (central flexiblegeneration, local reinforcements).
A number of key drivers affecting the cost-effectiveness of DER flexibility has been identifiedand analysed, such as on-going penetration of variable RES, particularly at distribution leveland reduction of their generation cost; on-going roll-out of smart meters; on-goingpenetration of Evs and charging infrastructure; on-going market penetration of smart homekits and smart home devices (e.g. smart thermostats).
In particular, we have analysed how each driver impacts the overall need of flexibility in thepower system and the availability of flexibility means in the system. The main points that canbe extracted from this chapter are the following:Flexibility options from DER are available. Plenty of controllable demand, storage andgeneration units are connected to distribution grids. They need communication infrastructureto provide flexibility on the global level and local level which in many cases is available dueto parallel developments.
The potential value that DER flexibility can capture is strongly increasing On-goingdevelopments in the power system are clearly leading to an increased value of flexibility inthe system, both at system and local level,.
In particular, at local level, with the growing penetration of distributed energy resources,flexibility increasingly shows a locational value (e.g. flexibility to solve congestion in thedistribution grid). This creates significant opportunities for DER flexibility, as DERs are inprinciple able to provide flexibility at both system and local level.
Technological evolutions are reducing the cost of DER flexibility. Levelised cost ofelectricity from VRES and distributed storage decrease constantly, thus reducing theopportunity cost of curtailment as a source of flexibility. Manufacturers increasingly providebuilt-in smart functionalities in their DG-grid converters and baseline assets are increasinglysmart-grid ready. Economies of scale reduce the costs of electric vehicles (EV) and the on-going standardisation in Europe is expected to drive down device and transaction coststhanks to improved interoperability. Likewise the cost of distributed storage technologies likebatteries are steadily declining, making them increasingly competitive in stand-alongapplications to provide grid services or to be integrated in behind the meter applications (e.g.in conjunction with PV systems).

20 April 2015 88A report to The European Commission
Study on the effective integration of Distributed EnergyResources for providing flexibility to the electricity system
A number of on-going power system developments are expected to act as catalyst forthe cost-effectiveness of DER flexibility –A number of on-going market, technological andpolicy developments are contributing to the set-up of an enabling infrastructure to activateDER flexibility. For example:
The on-going penetration of EVs and of charging infrastructure offers the potential for newflexible electricity demand when smart charging programs or dynamic recharging tariffs areadded. (Smart EV charging could for example provide necessary demand flexibility in areaswith high PV generation where a low net demand during the day and high ramp up ofdemand in late afternoon could occur.)
The on-going penetration of smart home devices, including energy related devices (smartthermostats, smart energy boxes, smart plugs etc.), which are triggered mainly by on-goingdevelopments in the general domotics market, already provides energy monitoring andcontrol functionalities on the consumer side, even without smart meters.
The on-going roll-out of smart meters, coupled with upcoming smart energy boxes and smartappliances (see previous point), would enable demand response programs to activatedemand flexibility (e.g. via price signals). In a scenario where smart energy boxes, smartappliances etc. are already appearing in the market thanks to domotics developments, thecost of demand response developments would be reduced and consumer adoptionincentivized.
Cost-effectiveness of DER flexibility is on the rise overall. On-going evolutions in thepower system are leading to the deployment of infrastructures which enable DER flexibilityand reduce its implementation costs:
■ Penetration of EVs and charging infrastructure (driven by transport policyincentives), provides part of the enabling infrastructure for activation of EVflexibility.
■ Penetration of smart meters (driven by policy decisions), is laying the foundationsof the enabling infrastructure for activation of demand flexibility.
■ Penetration of smart home devices, mainly driven by domotics marketdevelopments, is laying the foundations of the enabling infrastructure for activationof demand flexibility, particularly at residential level.
The potential value that DER flexibility can capture is strongly increasing. How marketchanges might enable DER options to provide flexibility in economic terms will be furtherelaborated in the final report.
Flexibility can be provided by both supply and demand as well as by energy storage.Physical or institutional extensions of market areas and changes in market regulation canalso open access to flexible supply and demand resources in both time and geography.

20 April 2015 89A report to The European Commission
Study on the effective integration of Distributed EnergyResources for providing flexibility to the electricity system
6 Linking supply and demand of flexibility – thevalue chains
This section will briefly present the existing typical market places for electricity, followed bythe different market mechanisms related to flexibility provision/procurement.
6.1 Different trading arrangements related to flexibility
6.1.1 Time horizons
In order to have a satisfying and efficient linkage between providers and procurers offlexibility it is crucial to have suitable remunerations, and a sufficient planning horizon.Depending on which need, and which provision of flexibility one refers to, differentremuneration and planning horizons are appropriate. In general, there are two differentremuneration mechanisms; activation and capacity remuneration. Additionally, penalizationcan be applicable as the avoidance of costs can provide the appropriate incentives forefficient operation. One or several of the remuneration/cost mechanisms can be combined inorder to achieve the optimal incentive(s) for a successful and effective integration of DERs.
Capacity remuneration may be suitable whenever the frequency and usage is uncertain,which is often the case of products that are typically activated a couple of hours during oneyear, if at all. An example of such products/services could be demand adjustment in order tomeet extreme demand peaks, hence ensuring security of supply during hours with very highdemand possibly in combination with plant outage(s). Demand adjustment can be usedduring these (rare) events to ensure security of supply and system adequacy. As certaininvestments are needed in order to activate the demand response during these events, acertain remuneration level is required in order to ensure a profitable investment. Withcapacity remuneration mechanism providers are remunerated for keeping capacity availablewhenever needed. It is not rare that the capacity is furthermore remunerated when activatedadditionally to the capacity remuneration.
For the products that are activated frequently with a high probability and that can becontinuously traded, capacity remuneration is of less importance. A concrete example wouldbe portfolio optimization which will be continuously balanced, possibly on the intradaymarket, and where flexibility will be traded as products (volumes of energy). Here the (likelyautomatic) activation of e.g. demand response could be remunerated via activated volume,however possibly in combination with capacity payments.
Different services/products are anticipated to have different planning horizons andparticipants, thus requiring different market places. Furthermore, some services areexpected to be less suitable for deregulated market places and competition, and couldpossibly be handled by technical requirements, rather than through markets. For examplelocal voltage problems due to local generation could potentially be resolved via technicalrequirements in the generation equipment.
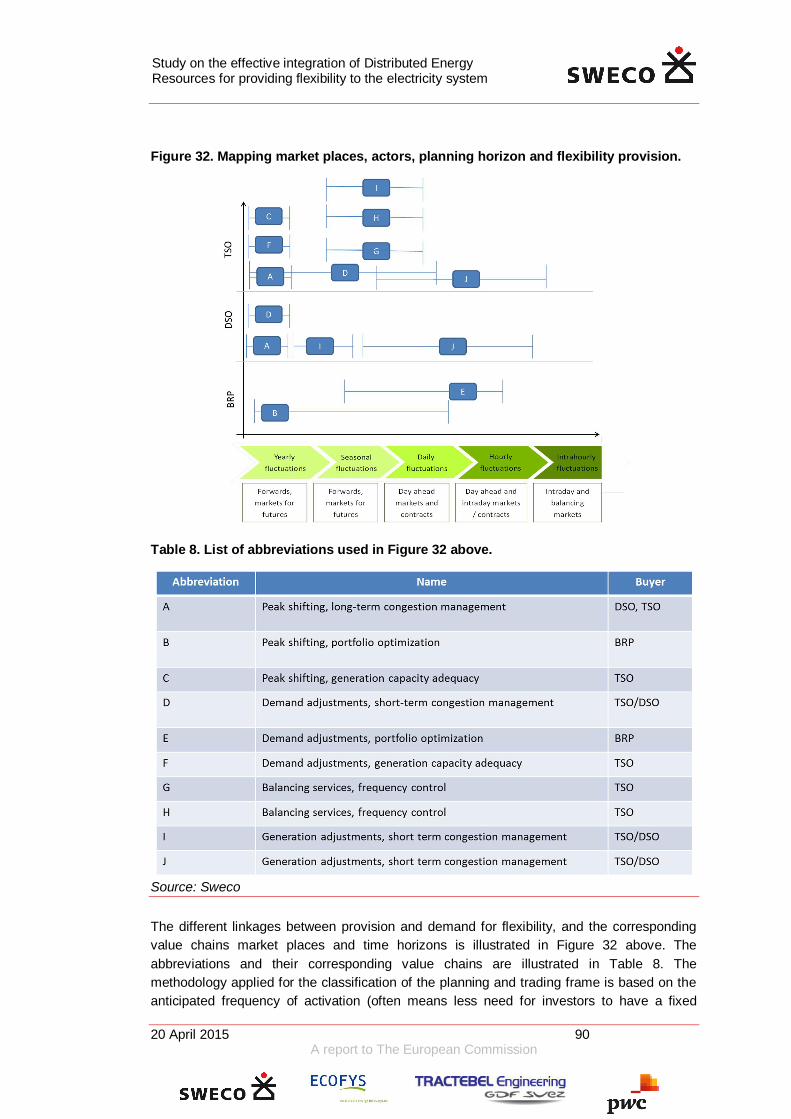
20 April 2015 90A report to The European Commission
Study on the effective integration of Distributed EnergyResources for providing flexibility to the electricity system
Figure 32. Mapping market places, actors, planning horizon and flexibility provision.
Table 8. List of abbreviations used in Figure 32 above.
Source: Sweco
The different linkages between provision and demand for flexibility, and the correspondingvalue chains market places and time horizons is illustrated in Figure 32 above. Theabbreviations and their corresponding value chains are illustrated in Table 8. Themethodology applied for the classification of the planning and trading frame is based on theanticipated frequency of activation (often means less need for investors to have a fixed

20 April 2015 91A report to The European Commission
Study on the effective integration of Distributed EnergyResources for providing flexibility to the electricity system
remuneration, e.g. capacity remuneration), consequences (redundancy and alternativeresources in the case of delivery failure) and a suitable planning horizon (in order to ensureadequacy and supply of demand).
6.1.2 Arrangements for acquiring resources
The different types of markets and linking provision and demand of a certain product can bedesigned in many different ways. Broadly the following types of procurement mechanismsexist:
a. Direct bilateral contractingb. Tenderingc. Markets/auctionsd. Regulation/grid codee. Tariff design
Direct bilateral contracting do not take place through any exchange, but via directcommunication between two parties (possibly involving a broker). The bilateral agreementsare not necessarily structured, i.e. they can be formulated in order to fit the needs andpreferences of the involved parties, e.g. in theory they could have any time horizon or format.This is one of the benefits of bilateral contracting, compared with other procurement designs.Due to this, the bilateral contracts can be used for a wide range of services. A con of non-standard bilateral contracts is that the traded services can be hard to compare with othersimilar non-standardized products, thus making it less transparent and stimulating liquidity.This pushes for the need for participants to have a high degree of product valuation andinsight, and could potentially lead to speculation in the value/costs for the counterpartproviding a particular service.
Tendering is in its simplest form a call from a user of a certain product/service. The call fortenders includes the prerequisites of the particular service (could be activation time,minimal/maximal bid size, location, etc.). The providers of the service/product can formulatetheir bids according to the prerequisites and the most beneficial bid(s) is(are) accepted. Oneof the benefits with tendering would be the ability to customize the bids/requirements; themajor con would be the lack of standardization in order to stimulate liquidity and competitionfrom the supply side (if the prerequisites vary). The administrative burden is higher thanother mechanisms.
Markets/auctions is in practice operated via continuous trading (bilateral agreements andtrading of standardized products) or via gate closure (auction). Both of these designs requirea certain level of standardization of products, and stimulate liquidity and competition. Theauctions enables the market operator to gather bids (liquidity) and clear the marketaccording to the most beneficial (often price) offers, and to remunerate participants either viapay-as-bid or marginal pricing. In the case of continuous auctions pay-as-bid applies. Thebenefit of using markets/auctions is that services/products are forced into standardizationand therefore stimulating competition and liquidity. The con would be lack of customizabilityand therefore might favour certain technologies and/or actors participation on the market andpossibly be ill-fitted for specific needs/demands of certain actors. If many different variationsof in principle the same service is procured, in order to cover all the different preferences of

20 April 2015 92A report to The European Commission
Study on the effective integration of Distributed EnergyResources for providing flexibility to the electricity system
all different needs (possibly flexibility) two challenges potentially arise. The different productswill start to compete about the same resources, and a competitive actor will always allocatehis provision to the market that remunerates the highest. Combining this with many differenttraded products, the supply & liquidity might be reduced, resulting in increased risks ofmarket power and poor market operation. In order to find the optimal product portfolio offlexibility products the fundamental needs should thus be well-defined, and the standardizedproducts should be composed based on those definitions. The optimal mix of tradedproducts and services is expected to vary with various market regimes and technologicalcharacteristics.
Regulation is another alternative for acquiring services. This is materialised via technicalrequirements in order to ensure the system operation, and is already today a reality viatechnical constraints on generation from generation units (e.g. a particular generator is notallowed to exceed a certain level of reactive power, etc.) and on large scale consumers(industrial equipment should have a maximal level of flicker, harmonics, etc.). For example,the Swedish TSO require that BRPs that have a planned ramping of generation of 200 MWor more between two consecutive hours, have to start their ramping 15 minutes before thehourly shift (e.g. at hour XX:45), and end their ramping at 15 minutes past the hourly shift(e.g. at hour XX+1:15) and ramp linearly. The result is smoother ramping of generation, thusreducing the need for flexibility (balancing power) during the hourly shifts. A con ofintroducing such a prerequisite is that it might favour certain actors, potentially creating abarrier for non-beneficial actors. Furthermore, related to the Swedish example with rampingabove, is that certain requirements could possibly be solved more efficiently via marketmechanisms (e.g. a third party BRP might have cheaper/better regulating resourcesavailable), rather than “self-ramping” as a BRP. The benefit of such regulations is that theneed for regulating power is reduced.
Different tariff designs will lead to different incentives. Previously an example of time-of-usetariffs in France have been made48, where certain demand response has been achieved andthus reducing the peak load by a certain amount by having higher retail prices during periodswhen capacity is limited. There are many different tariff designs, which all provide theirspecific incentives;
■ Progressive tariffs give incentives on energy efficiency, rather than reducingsystem peaks and/or providing flexibility. A progressive tariff is in its simplest forma charge per kWh (unit cost) which is increased with increased consumption. If aparticular end-user manages to reduce the energy consumption, the cost will bereduced. Another paradox is that the usage of electrical heat pumps rather than oilfired heating might be penalized as the electrical energy consumption will increaseand thus the unit cost of energy (progressive tariff).
■ Power-based subscription. The highest load a particular end-user of electricityputs on the grid during the particular settlement period, yields a cost (e.g. YEUR/kW/month). This will give the end-user incentives into minimizing themaximal load during each settlement period. Assuming the peak load of a given
48 See footnote 27 on page 47.

20 April 2015 93A report to The European Commission
Study on the effective integration of Distributed EnergyResources for providing flexibility to the electricity system
consumer co-varies with the system (could be local and/or global), this will reducethe system peak load.
■ Time-differentiated power-based subscription. Same as above but with differentrates depending on when the dimensioning load occurs (e.g. during off-peak hoursa high load will not be problematic as the system is “off-peak”). Providesincentives into minimizing the load during certain hours (e.g. peak-load) duringeach settlement period.
■ Dynamic pricing tariff. The dynamic pricing tariff is a tariff that is varied dependingon the state of the system. If the system has abundant supply/capacity, the pricesignal will be to use more electricity (lower, theoretically even negative, cost ofelectricity consumption) and in a constrained supply/load situation the price signalwill be the opposite (expensive to consume). The difference between the time-of-use tariffs and the dynamic tariffs is mainly that the ToU originates in peak/off-peak hours (easy to forecast even with long planning horizon) whereas thedynamic tariffs will consider the current state of the system, not necessarilyfollowing the traditional peak/off-peak pattern.
Worth mentioning is that more customizability is not necessarily the best suited solutionwhen designing the appropriate tariff structure. With complexity (e.g. dynamic pricing) comesa trade-off in transparency and predictability, which have to be balanced with the benefitsattained.
6.2 Existing market places – a brief overview
As described above there are several different ways of acquiring resources, where differentorganised market places are one important way. This section provides a brief overview ofexisting categories of organised market places where flexibility could be acquired.
Depending on the market regime the market products and places varies. The productstypically range from years ahead (financial products and capacity remunerationmechanisms) to close to real-time products (balancing market) before delivery. The gateclosure (ending of the trading period) for different products also varies with the marketregime, even if significant progress have been made in harmonising the markets across theEuropean member states. Until now the most progress of harmonisation has been achievedfor the day-ahead markets across the member states.
Broadly speaking, there are two sectors in the power sector; the regulated and the de-regulated sector. The regulated sector include DSOs and TSOs, due to the factdistribution/transmission of electricity is a natural monopoly. The TSO procures resources forensuring a safe and satisfactory real-time operation of the transmission grid, in order toensure that the demand is met at all times. These resources have traditionally been procuredfrom central producing units, owned by firms operating in the competitive part of the powermarket (deregulated) providing a link between the regulated and the deregulated part of thepower market. The DSO however has historically had less interaction with the deregulatedpart of the sector. Since the distribution grids traditionally are operated passively, it is notcommon in that the DSO procures ancillary services (unlike the TSO). The methodologyapplied has rather been “fit-and-forget”, meaning incentives of “over-investment” in grid

20 April 2015 94A report to The European Commission
Study on the effective integration of Distributed EnergyResources for providing flexibility to the electricity system
capacity is not necessarily avoided. Many DSO regulations also ban the DSO from procuring(“trading”) energy, making it literally illegal for DSOs to procure energy services. Thus theremight be a gap between the DSO and market places in certain regulatory regimes.
6.2.1 Difference between capacity and energy remuneration mechanisms
Although the European market model often has been described as an “energy-only” model,i.e. a market model where remuneration is based on delivered energy, this has never beenthe complete picture. Different types of capacity or availability payments have been adoptedin many markets with different forward looking horizons. An example of capacity payment isprimary reserves auctions (and for several of the other products on balancing markets) are insome cases held daily for the next day (e.g. Denmark, Sweden) and in other cases there is aweekly auction (e.g. Germany). As the primary reserves are “non-energy”, the purchasedproduct is capacity rather than energy. For the balancing products with a longer activationtime (Frequency Restoration Reserve (FRR), Restoration Reserve (RR)) the remuneration isoften by both capacity (MW) and activation (MWh). The purpose of the capacityremuneration would be to ensure that sufficient resources are available.
6.2.2 Capacity remuneration
Different types of capacity remuneration mechanisms are in place in several countries inEurope, and additional capacity markets have been decided on or are under consideration.For example a number of countries, such as Ireland, Italy, Spain, Portugal and Greece havehad different capacity remuneration mechanisms for a number of years. The schemes varysignificantly in design. Currently capacity remuneration mechanisms are discussed oralready introduced in additional countries (Great Britain, France), again with differences inthe market design. In the US capacity markets are common, and demand side participationplays a significant role in many of these markets. However, it is often welcomed that capacitymarkets are also open for demand side resources and for aggregators. In addition thedetailed requirements, e.g. activation rules, may have a significant impact on the possibilityof demand side resources to participate in capacity markets.
In addition to the broader capacity market schemes there are more targeted schemes inplace. Sweden and Finland both have had strategic reserves for a number of years,including both generation and demand side resources (also open for aggregators). Strategicreserves can be problematic for the functionality of the power market, in particular if theactivation rules are not set in a proper way. Originally the purpose of the strategic reserves inSweden and Finland was to ensure that sufficient physical resources were available and itwas bid in as regulating power. Later on it also become possible to use the reserve to ensuremarket clearing in the day-ahead market. The principle is that it is activated after the lastcommercial bid (demand or supply bid). However the reserve is shifted towards introductionof demand side participation and it is required that at least 25% of the reserve shouldoriginate from the demand side. Since 2011 demand side resources in the reserve can alsobid into the day-ahead market. The motivation for this is to have the demand side resourcestaking part in the price formation in the day-ahead market. While this in principle could distortthe market the argument is that while the generation resources would not be available at all

20 April 2015 95A report to The European Commission
Study on the effective integration of Distributed EnergyResources for providing flexibility to the electricity system
without the strategic reserve, the demand side resources would exist as long as the owner isusing electricity in its (industrial) process.
Norway is an energy constrained market. The TSO runs a regulation power options marketto secure sufficient upwards regulation. More interestingly as an example is however theenergy options market (ENOP). The energy options can be used to reduce consumptionduring a period of the winter season if a highly strained power situation arises. If the energyoptions are called the resource owner should down regulate an agreed energy volume (XMWh/week), but is free to determine when of the day or week this down regulation shouldoccur. The down regulation should be in relation to the normal consumption specified in thebid. Due to the specific requirements on the resources (geography, volume, flexibility etc.)this is not a standardised product, but the Norwegian TSO evaluates bids based on thebenefits to the system and the cost elements. While there is no formal lower consumptionlevel to be eligible to bid (apart from hourly metering), in reality it is larger electricitycustomers (power intensive industry) that will be accepted. The remuneration to the resourceowners consist of one options premium corresponding to the annual costs of participationand a strike price corresponding to the costs connecting with the TSO utilizing the options.
The different markets operate on different time horizons, see figure below for an illustrationof the planning horizon and typical chronology.
6.2.3 Future and forwards markets
The future and forwards markets are financial markets, where sellers, buyers and traders ofelectricity can manage their risks by buy/selling/trading financial contracts for electricity forfuture delivery. The financial contracts are varying in length, the most common ones include;yearly, quarterly, monthly and weekly contracts. Often it is also divided into base and peakload, referring to specific hours during the week (peak), or throughout the delivery period(base). The coupling between the financial market and the physical market is done by theday-ahead and intraday markets.
6.2.1 Day-ahead market
The day-ahead market (DAM) is a spot market49 where supply and demand is met for thefollowing day. A spot price is cleared for every single settlement period (often hourly, butdepends on the local market design) for the following day, based on the bids that marketparticipants placed before the clearance of the DAM auction. Significant progress has beenmade in harmonizing and integrating the different DAM regimes throughout Europe duringthe last years, where the successful price coupling in the North-Western Europe (NWE)project, coupling the Nordic, GB and Central Western Europe spot markets in the DAMauction during February 201450. Flexibility could in theory be included on the DAM by anumber of different bid types:
49 Committment for physical delivery.50 http://www.nordpoolspot.com/How-does-it-work/European-Integration/NWE/

20 April 2015 96A report to The European Commission
Study on the effective integration of Distributed EnergyResources for providing flexibility to the electricity system
■ A price sensitive demand/generation bid, which is cleared if below or equal to themarginal price
■ Conditional block bid, e.g. if the price during a number of hours is on averagebelow a certain level, then the consumption(or generation) bid is accepted
■ Flexible bids, meaning that a certain energy volume is requested during one orseveral of the hours within the following day. This energy volume is cleared for thecheapest hours constraint to the bid size and level
The naming and type of bids allowed varies between the different power market exchanges,however with the price coupling of the different European exchange using the EUPHEMIA51
algorithm the support for different bid types is harmonised and each connected powerexchange has support for each bid type.
6.2.2 Intraday market
The intraday market (ID) serves as a complement to the DAM, where the trading horizon isshorter (trade allowed closer to delivery). The market design of the ID differs across theEuropean member states. The level of harmonisation is relatively immature for the intradaycompared to the harmonisation of the DAM, thus limiting the ability for cross-border tradeacross Europe. Both continuous trade and gate closure is applied for various Europeanmarket regimes. Spain and Italy for instance uses an auction based market clearingprocedure, whereas the Nordic region uses continuous trade. Furthermore, hybrid solutions(i.e. both auction and continuous trade) are being discussed and are considered likely to beimplemented for different markets (e.g. EPEX SPOT in Germany).
6.2.3 Balancing markets
As the load and injection into the grid needs to be precisely balanced in every moment intime, any deviation between load and generation is balanced by the TSO. The TSO ensuresthat the grid is balanced by using the procured resources and real-time control (frequencyrestoration reserve) combined with other (slower) products (frequency restoration reserve,restoration reserve). A particular imbalance during a given imbalance settlement period isresolved by the TSO, and the concerned balance responsible parties are either billed orcredited the actual imbalance energy volume and price ex-post. The calculation of theimbalance price differs between different market regimes. Settlement period and imbalancepricing is more elaborated upon in later sections of this report, see below. In theory demandresponse can be used for balancing, and is already today used for balancing in for exampleFinland and Austria.
6.3 Regulated markets
Both the TSO and DSO are regulated monopolies. As such they need to comply with certainregulatory requirements. They should for instance be neutral market facilitators, rather thanactive market participants. This limits the range of actions that TSOs and DSOs can takealso regarding capturing the value streams from flexibility. Today market places exist that are
51 http://www.epexspot.com/en/market-coupling/pcr

20 April 2015 97A report to The European Commission
Study on the effective integration of Distributed EnergyResources for providing flexibility to the electricity system
operated by regulated authorities, and where the entire demand originates from theseauthorities (e.g. balancing markets). Furthermore, in some market regimes the regulatedauthorities are active on the deregulated market as an actor (e.g. TSO and the Germanintraday). The regulated markets are different from the deregulated markets, since one of thetransaction sides are represented by a regulated actor. The regulation needs to balanceincentives carefully, in order to promote both neutrality and efficiency, thus ensuring a well-functioning continuous operation. Related to flexibility and DER, aggregators are likely to beneeded, and one or several of their revenue streams are expected to originate fromregulated markets.
The regulated markets can generally be divided into two blocks; the DSO and the TSO. TheTSO has experience of operating balancing markets, and the traditional suppliers have beenthe centralised generators. In a transition towards flexibility provision from DERs the TSOneeds to handle the change of suppliers, which might push for a change of regulation ofbalancing markets as the traditional rules might be less efficient in the new regime.Additionally to the TSO-operated balancing market there might be need for a similar marketplace with ancillary service transaction, however operated and controlled by the DSO incollaboration with the TSO. Naturally, these two market places will affect the other, andshould thus be coordinated and (probably) jointly operated. In addition to the “real time”balancing market, there are the long-term needs for flexibility (e.g. long-term peak-shaving,generation adequacy via strategic reserves, etc.) which also are operated by the regulatedactors in some market regimes.
The demands for flexibility that are expected to be relevant for the regulated actors can beobserved in Table 9.

20 April 2015 98A report to The European Commission
Study on the effective integration of Distributed EnergyResources for providing flexibility to the electricity system
Table 9. Table of flexibility provision related to the regulated actors
Service Function of service Flexibility offering party Flexibilityuser
Peak shifting (i.e. shiftingthe peak demand)
Long termcongestionmanagementGenerationcapacity adequacy
Aggregated (orindividual) industrial andcommercial usersAggregated domesticcustomers
DSO, TSO
Demand adjustments(manual/automatic)
Short termcongestionmanagementGenerationcapacity adequacy
Aggregated (orindividual) industrial andcommercial usersAggregated domesticcustomers
DSO, TSO
Balancing services Frequency control Aggregated (or industrialand commercial users)Aggregated distributedgeneration
TSO
Generation adjustments Short termcongestionmanagementGrid lossesreduction
(Aggregated) distributedgeneration
DSO, TSO
Curtailment products Short termcongestionmanagement
(Aggregated) distributedgeneration(Aggregated) industrialand commercial usersAggregated domesticcustomers
DSO, TSO
Reactive power(mandatory)
Voltage control (Aggregated) distributedgeneration
DSO, TSO
Source: EG3, Section 1: Flexibility
The following section will describe each value stream presented in Table 9, in the sameorder as presented in the table above. In addition to describing the value streams, we alsooutline a few stylized example business cases.
Peak loads in electricity demand increase total costs of the system. The total peak demanddetermines the necessary grid capacity on TSO as well as on DSO level. Generationcapacity has to be provided to cover every peak in demand, which is costly. DER can reducepeaks in demand on the DSO and TSO level by shifting demand from times of peak demand

20 April 2015 99A report to The European Commission
Study on the effective integration of Distributed EnergyResources for providing flexibility to the electricity system
to times with lower demand or by shedding the load, i.e. cutting demand. The value chain willinclude two or three actors; the provider (industrial or domestic consumers), possibly anaggregator (intermediary), and the TSO/DSO (end-user)). Depending on the number ofproviders, or the capacity of the average provider, the need for an aggregator is varying. Thelevel of sophistication in the communication infrastructure and automation level of activationwill also play an important difference in the need for aggregators. The providers of flexibilityare likely to be remunerated by a capacity payment due to the long planning horizon (long-term), and the risk for local markets (DSO). The alternative measure (reinforcing the grid)has a (very) long planning horizon which further pushes towards capacity remuneration foran adequate planning horizon. These capacity remunerations could potentially be combinedwith an activation fee. Challenges for an efficient implementation are mainly related tofirmness of supply (voluntary or mandatory activation), DSO regulation and the inclusion ofthe flexibility remuneration in the revenue cap (increased OPEX). Other related challengesare conflicting interests with the BRP during activation of the flexibility if successfullydeployed in a large scale. This will yield an imbalance from the scheduled portfolio demand.This indicates the need for coordination between the market participants, or adjustmentsaccordingly ex-post.
Peak-shifting for (generation) capacity adequacy (Security of supply long-term) valuechain is foreseen to include two, or three, participants; the provider (industrial or domesticconsumers, possibly an aggregator (intermediary), and the TSO/DSO (end-user)). Theremuneration is via capacity remuneration, and the trading horizon is foreseen to berelatively long-term (yearly). Another alternative is ToU tariff schemes, which have proven tobe useful in long-term peak-shifting. For the ToU tariff schemes there is no (obvious) needfor an aggregator. One of the challenges might be reduced predictability for exactly when theneed for flexibility (“shifting”) is needed in a system with significant generation from VRES,thus making the “scheduling” of equipment to consume during “off-peak” harder as off-peakis dependent on the weather. A conflict could arise between the grid needs and thebalancing needs, e.g. a BRP could be imbalanced while the grid is under significant load(assuming “opposite balancing directions” demanded), why the signal from these two actorscould be conflicting. The “optimal” hierarchy should be following the law of physics, e.g. thegrid should be superior to market incentives if conflicting (market model fails to adequatelyreflect the needs of the system). The needed equipment for communicatingsignals/activation could be the same as for several other value chains, for example for short-term demand adjustments.

20 April 2015 100A report to The European Commission
Study on the effective integration of Distributed EnergyResources for providing flexibility to the electricity system
Business case A: DSO demanding flexible resources
Motive: DSO require flexible resources in order to reduce (long-term) grid investments
Primary value driver: Reduced CAPEX
Additional value sources: Congestion management, ancillary services to TSO, re-balancing the position of BRPs
Implications: OPEX likely to increase. Full CAPEX reduction likely not to be immediate.
Involved participants: DSO, owners of DER (end-users, distributed generation, storage),aggregators (possible)
Key barriers:
§ Economic regulation of DSOs generally provides weak incentives/possibilities forCAPEX/OPEX optimization, in particular over time. The DSO may not be able to replacereduced CAPEX with increased OPEX in the regulated revenue. In particular this islikely to be the case if OPEX increases precede CAPEX decreases.
§ DSO’s possibilities to trade energy are limited due to vertical unbundling. The DSO maytherefore not be able to capture additional value sources through transactions with TSOand market participants.
DSO
DER owners Aggregators
DER owners
TSO
Market(e.g. BRP)

20 April 2015 101A report to The European Commission
Study on the effective integration of Distributed EnergyResources for providing flexibility to the electricity system
Business case A: DSO demanding flexible resources (cont.)
Key barriers (cont):
§ Aggregators likely to be important. Regulatory environment for aggregators is difficult inmany MS, relating to the legality of aggregators, acceptance of aggregated demand orabsence of a regulatory framework for DER.
§ In order to capture the full value stream DER owners or aggregators need to havemultiple relationships with DSO, TSO and other market participants. Therefore, rolesand responsibilities of the different actors should be clearly defined in a market model.Due to these multiple relationships it may be more difficult to coordinate the needs ofDSO/TSO/market. This is likely to increase the importance ofaggregators/intermediaries. On the other hand using a common platform or marketplace for all DER services could make coordination less complex.
Conflicting interests:
§ DSO/TSO/market needs may not be aligned at all point of time. Priority of flexibilityneeds have to be defined, with possible compensation for parties negatively affected.
§ TSOs have platforms for procuring resources. Depending on setup the liquidity on theseplatforms could either be improved or drained.
§ Imbalances may be created for BRP if flexible resources are activated withoutcoordination with the BRP, unless there is regulation ensuring that imbalances fromactivation are not attributed to BRP or flexibility is measured separately per DER owner.

20 April 2015 102A report to The European Commission
Study on the effective integration of Distributed EnergyResources for providing flexibility to the electricity system
The underlying value of demand adjustment for short-term congestion management isreduced costs for re-dispatch (historically remunerated/activated by TSO on the transmissiongrid; in principal a similar role could be taken by the DSO). Re-dispatch actions are neededwhen the transmission capacity is insufficient for the scheduled/actual requests on the grid.In order to ensure the operation of a grid, the system operator needs to procure and activatecongestion management (traditionally by ramping up/down (central) generation units on eachside of the congestion). Rather than ramping up generation on one side of the congestion,the immediate balance could be satisfied via a reduction of load (short-term demandresponse). A conflict could, again, occur between the system operator activating the demandresponse without notifying the BRP or disregarding the incurred “imbalance” ex-post andcancel the financial impact from the imbalance penalty. A synergy could arise with the long-term congestion management and the dynamic ToU communication infrastructure as theneeded IT-communication and product activation might be similar. A feasible solution couldbe a regulation where the DSO is allowed to adjust demand/generation once or a few timesper year when problems are expected to arise, rather than dimensioning the grid for 100 %(overinvestment into grid capacity), this requires possibly the need for a change of theregulation for the DSO.
Balancing services for the TSO is basically divided into energy and non-energy products.The non-energy products includes the primary regulating power (“FCR”) which is, onaverage, not resulting in any net energy during the activation as it will vary naturally aroundthe set point (set generation or consumption level). Therefore, the FCR is usually notremunerated by energy units, but rather capacity (EUR/MW/Hz). The “energy-products”(“FRR” & “RR”) includes slower products, and can result in energy units during activation.From a traditional perspective the different products have been procured and remuneratedvia both a capacity and an activation component, which is foreseen to be the case for thefuture transactions as well. The value of flexibility is expected to originate from severalstreams:
a. more (central) generator capacity available for the wholesale market as lessgenerator capacity will be reserved for ancillary services
b. Costly ramping of ramping generators will be more expensive compared to the(competitive) demand resources
c. Increasing liquidity and competition on the supply side of the regulating markets,lowering costs for the system
d. Enabling more intermittent power generation to be balanced as the supply ofbalancing power will increase compared to a scenario without DER.
The TSO procures resources (“capacity”) with different time horizons in the various memberstates, ranging from months to days before delivery. The energy products could in theoryinterfere with the BRP if activated volumes are not accounted for in the settlementcalculation ex-post. However this should be a relatively small challenge as the TSO shouldhave the necessary overview in order to include activation in the imbalance settlement
20 April 2015 103A report to The European Commission
Study on the effective integration of Distributed EnergyResources for providing flexibility to the electricity system
calculations ex-post without too much need for coordination. Traditionally the balancingpower has been supplied by central generators, meaning that it has been relatively easy tomeasure activated energy for balancing. This is still the case for consumption which ismetered and balanced explicitly, however for profiled end-users the reference point andactivated energy might be harder to quantify. Statistical measures and methodologies couldbe applied for the ex-post settlement, which details are to be agreed upon.
Balancing products require generation/load increase and reduction. They can be provided bydemand and supply sources as well as storage facilities on DSO level. The value chain forgeneration adjustments for short-term congestion management used by the TSO/DSO isanticipated to have 2 or 3 participants; the distributed generation facilities, an aggregator(intermediary) and then the final user of flexibility (TSO/DSO). As the generation adjustmentfrom VRES is asymmetric, i.e. only curtailment of generation due to non-programmableunits, in the case of wind and solar power the flexibility transaction might be dependent onthe usage and support of such asymmetric products. Assuming a scenario where theflexibility is required to be offered symmetrically (technical requirements), the output ofgeneration facilities will be limited below the maximal available output in order to offer theextra generation which will effectively mean at a close to zero or negative value, assumingremuneration based on dispatched energy. A prerequisite for symmetry drives for anopportunity cost for non-programmable generators if participating on the balancing market.The opportunity costs are likely to be relatively high, however should easily be included inthe bids for short-term congestion management. If the bids (including opportunity costs) arecompetitive, they should be accepted.
Generation adjustments and curtailment products can be used to avoid or decrease theneed for reinforcement and investments into the grid. In this section we assume that theadjustment and curtailment will reduce generation output. In the case of distributedgeneration, which is often non-programmable, the need for generation adjustment andcurtailment products are likely to occur if high generation co-occurs with rare events such assignificantly low load, e.g. during periods when load is low, which then will lead to excesslocal/regional generation which exceeds the grid capacity. Rather than dimensioning the gridfor these (assumed to be) rare occasions, the curtailment/adjustment of generation can beapplied ensuring grid stability. In principle the cost for the producer can be interpret as theopportunity cost, meaning the remuneration the producer would have received for the,theoretically, energy generated. The value of the flexibility is equal to the avoidance ofCAPEX, which should be weighed against the opportunity cost (cost) mentioned above. Thevalue stream of generation adjustment will include two or three participants; the provider(generator), the optional intermediary aggregator, and the DSO/TSO. The opportunity costcan vary; one concrete example is the spot price and feed-in tariffs (FITs). The trueopportunity cost is likely to be closer to the spot price rather than the FITs. The balanceresponsible party will be affected by curtailment or generation adjustment, if theadjustment/curtailment is not included in the generation schedule. In practice, assuming acertain market design, the TSO and DSO publishes the available grid capacity and themarket is cleared based on this capacity. Assuming that the true grid capacity is insufficientin transmitting the scheduled dispatch, there is need for adjustments and possibly re-

20 April 2015 104A report to The European Commission
Study on the effective integration of Distributed EnergyResources for providing flexibility to the electricity system
dispatch. The relevant BRP will then have the production plan adjusted accordingly, possiblyleading to an imbalance and financial consequences.
Reactive power and power quality has historically been “procured” via requirements andgrid codes for generators/consumers. Depending on the actual regime, the differentminimum technical requirements have been prepared and adopted by the relevant parties(TSO, DSO, NRA). This can be translated into that this is not a product that is being“traded”/”procured” as such, but rather forced into the system by setting the minimumconnection criteria.
6.4 Unregulated markets
While all markets have some basic regulatory arrangements we refer to the supply/tradingand generation of electricity as unregulated markets. Market participants need to comply withcertain requirements, but are not subject to sector specific monopoly regulation. Theunregulated procurers of flexibility mainly include traders and BRPs. The value streamsrelated to the unregulated market are presented in Table 10 below.
Table 10. Table of flexibility provision related to the unregulated actors
Service Function of service Flexibility offering party Flexibilityuser
Peak shifting (i.e. shiftingthe peak demand)
Long termcongestionmanagementGenerationcapacity adequacy
Aggregated (orindividual) industrial andcommercial usersAggregated domesticcustomers
BRP
Demand adjustments(manual/automatic)
Short termcongestionmanagementGenerationcapacity adequacy
Aggregated (orindividual) industrial andcommercial usersAggregated domesticcustomers
BRP
Source: EG3, Section 1: Flexibility
Peak-shifting for portfolio optimization (both long- and short-term) is a value chain thatgenerally involves two, or three-four roles; the provider (industrial or domestic consumers(provider), possibly an aggregator (intermediary), the BRP (end-user or trader), and possiblya third party BRP (end-user)). The portfolio optimization could basically originate from twodemands; resolving inevitable forecast errors (both consumption and generation) by revisingconsumption so that the scheduled positions are fulfilled during the imbalance settlementperiod or as a traded product in order to balance other third party BRP portfolios. Theunderlying demand is similar; utilizing consumption flexibility in order to balance portfolios ata (more) efficient cost. There are several challenges that need to be resolved in thesuccessful deployment of this flexibility provision;

20 April 2015 105A report to The European Commission
Study on the effective integration of Distributed EnergyResources for providing flexibility to the electricity system
■ Metering and the measurement of activation in the case of profiling. As there is no“reference consumption” for a single end-user settled under a consumption profileit can be challenging to assess the actual level of activation and distinguishbetween contributors and “free-riders”. Most likely statistical methods will need tobe established and agreed upon, and distributional effects (“free-riders”) are likelyto occur.
■ Remuneration of “participating” end-consumers (e.g. domestic consumers) couldvary significantly. Annual discount on the tariff, remuneration via activation orpossibly via a capacity payment.
■ Controlling (activation) and firmness of appliances/activation.■ The planning horizon for activation. This can relate to both domestic and industrial
end-users of electricity. A concrete example could be certain industrial consumersthat, assuming an adequate planning horizon, can reschedule their processesthus revising their “base-case” consumption schedule. For the long-termconsumption the planning horizon is likely to be adequate, however for short-termit is less likely. The planning horizon is assumed to be highly consumer-specific,meaning it will have to be agreed upon bilaterally.
The remuneration is foreseen to mainly be via capacity payments ahead of delivery, howevertraded relatively short-term continuously. An automatic activation is considered likely (due tolarge number of end-consumers) in the case of an aggregator, thus having relatively smallcapacities of demand adjustment but large number of flexibility-portfolio participants. Thereare expected to be synergies with the other long-term peak-shifting value chains as theneeded equipment for control and activation. Furthermore, the grid needs in terms of long-term peak reduction is likely to co-occur with the portfolio needs for long-term peakreduction, indicating synergies. The long-term peak shifting will vary from the short-term asthis will require a larger degree of planning and partnership between BRP/portfolio managerand the end-user. The need for coordination between BRPs and the TSO/DSO is smaller forlong-term peak shifting compared to short-term since the market is expected to learn andadapt to possible changes in long-term peak shifting. Therefore this is not expected to leadto any systematic imbalances due to a lack of coordination. The short-term peak shifting islikely to lead to a need for coordination, since this is anticipated to be harder to respond andadapt to. The different roles both on the regulated and the deregulated sections of themarket are expected to be effected significantly from demand response, please see section7.2.2 for the role of an aggregator and demand response.

20 April 2015 106A report to The European Commission
Study on the effective integration of Distributed EnergyResources for providing flexibility to the electricity system
Business case B: Demand response in day-ahead market
Motive: Peak shifting, reducing peaks or filling valleys
Primary value driver: Reduced system cost, reduced cost for end-customers
Additional value sources: Possible reduction in grid investments/reduced congestions;reduced market power, synergies with energy efficiency measures
Likely implications: Troublesome including demand response in the price formation in thecase of reactive end-consumers, price spike demand response might yield new price spikesin surrounding hours and incur imbalances. If the global need is not aligned with the localneed for demand response, conflict might arise.
Involved participants: DER owners, aggregators, BRP, other market participants
Key barriers:
§ Small scale of DER limit cost effectiveness of market participation.
§ Market design, product definitions and regulatory barriers creating difficulties for DERand aggregators
§ Limited interest of demand side flexibility from many customers.
§ Low share of end-consumers exposed to spot prices, e.g. no direct incentives forparticipation.
Traders/BRP
DER ownersowners
Aggregators
DER owners
TSO/DSO
DAM
Could be either or,depending on the
market regime

20 April 2015 107A report to The European Commission
Study on the effective integration of Distributed EnergyResources for providing flexibility to the electricity system
Business case B: Demand response in day-ahead market (cont.)
Key barriers (cont):
§ If large scale penetration, the inclusion of demand response in the price formation iscrucial in order to ensure an efficient and successful integration.
§ In order to capture the full value stream the implementation cannot only include DR onthe DAM, but should include energy efficiency, BRP services and ancillary serviceswhich demands coordination (and valuation) of the flexibility between severalmarkets/time horizons. This can be hard and complex in reality, pushing towardscentrally coordinated (control) demand response.
Conflicting interests:
§ DSO/TSO/market needs may not be aligned at all points of time. Priority of flexibilityneeds have to be defined, with possible compensation for parties negatively affected.
§ The need for demand response will vary in time as the load/supply balance is inevitablychanging with the weather (wind and solar irradiation). Furthermore, if the full valuestream is captured, several markets and gate closures will “compete” for the sameresources (demand response), which naturally leads to conflicting interests if notcoordinated. There is a risk of selling the same flexibility with several time horizons andto several market participants, this should be avoided.
§ Imbalances may be created for BRP if flexible resources are activated withoutcoordination with the BRP, unless there is regulation ensuring that imbalances fromactivation are not attributed to BRP or flexibility is measured separately per DER owner

20 April 2015 108A report to The European Commission
Study on the effective integration of Distributed EnergyResources for providing flexibility to the electricity system
Business case C: BRP demanding flexibility for balancing of portfolio
Motive: Reducing deviation between actual position and scheduled plan
Primary value driver: Reduced imbalance costs.
Additional value sources: Possible reduction of TSO procured balancing resources,reduced costs for portfolio managers leading to reduced costs for end-consumers, ability tobalance larger shares of RES.
Likely implications: Difficulties in quantifying theoretical balance and activation withoutmetering, more complex operation with BRP reacting to deviances between scheduled andactual position, speculation in system imbalance (depending on dual/single price).
Involved participants: DER owners, aggregators, BRP, 3rd party BRPs.
Key barriers:
§ Small scale of DER limit cost effectiveness of market participation.
§ Regulatory environment for aggregators is difficult in many MS.
§ Finding the appropriate technology and methodology for remuneration. Finding thecorrect imbalance cost incentives, “not too high nor too low” in order not to create abarrier for new (small) market participants.
Traders/BRP
DER owners
Aggregators
DER owners
TSO
Exchange 3rd partytraders/BRP
Could be either or, dependingon regime
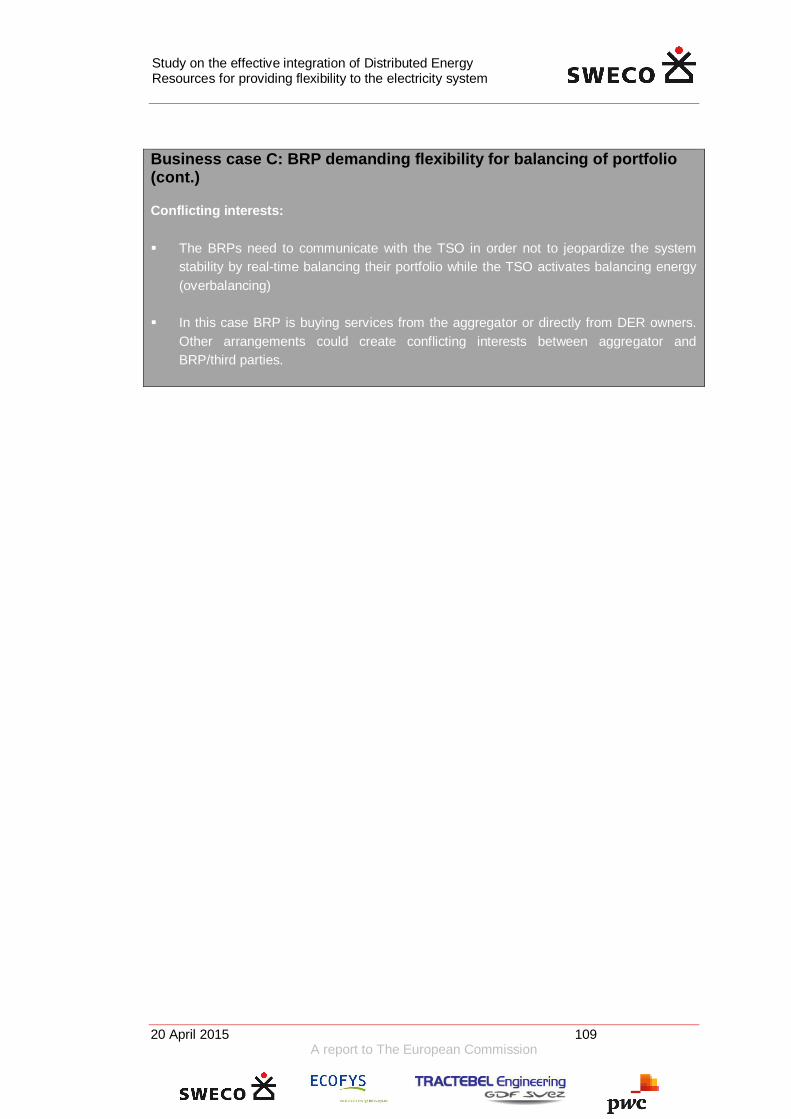
20 April 2015 109A report to The European Commission
Study on the effective integration of Distributed EnergyResources for providing flexibility to the electricity system
Business case C: BRP demanding flexibility for balancing of portfolio(cont.)
Conflicting interests:
§ The BRPs need to communicate with the TSO in order not to jeopardize the systemstability by real-time balancing their portfolio while the TSO activates balancing energy(overbalancing)
§ In this case BRP is buying services from the aggregator or directly from DER owners.Other arrangements could create conflicting interests between aggregator andBRP/third parties.

20 April 2015 110A report to The European Commission
Study on the effective integration of Distributed EnergyResources for providing flexibility to the electricity system
6.5 Imbalance responsibility and imbalance settlement
The outcome of the aforementioned markets is a schedule for both generation andconsumption of electricity. The schedule is with a certain temporal resolution, and each timestep is defined as an imbalance settlement period. Furthermore, each actor on the physicalpower market has a balance responsible party (BRP). In brief the BRP is financially liable forany imbalance between the scheduled consumption/generation and the actual outcome. Theimbalance responsibility and imbalance settlement are two fundamental cornerstones of anyelectricity market. In several market designs the calculation and pricing of imbalances differsbetween conventional generation, consumption and renewable generation.
Simply defined, energy imbalances are the difference between a BRP’s contracted positionsand what is actually delivered or consumed in real time over a given timeframe known as theimbalance settlement period (ISP). To keep and/or restore balance in real-time, TSOspurchase balancing services from pre-qualified market participants referred to as BalanceService Providers (BSP). To hedge the risk that BSPs may not submit enough balancingenergy bids in real-time, TSOs sometimes procure balancing capacities ex-ante.
Imbalance settlement is the process by which a BRPs’ energy imbalances are settled at anadministratively determined price. Ideally – and according to the Network Code on ElectricityBalancing - the general objective these arrangements should be to incentivise marketparticipants to minimise their imbalances in an efficient way, and to allow TSOs to cover theircosts for balancing the system. This means that all market participants should be financiallyresponsible for keeping their contracted positions balanced over the imbalance settlementperiod, and that imbalance charges should capture the costs to the TSO of balancing thesystem. This is not always the case in current national imbalance settlement arrangements.
6.5.1 Imbalance responsibility for RES
Variable RES generation has historically been totally or partially exempted from balanceresponsibility in several European countries, while in others they have balance responsibilityin line with other market participants. The rationale for socializing the costs for RESimbalances is a desire to encourage electricity generation from renewable energy sources,and market arrangements that have not been deemed suitable to generation that cannotaccurately predict its output in the day-ahead timeframe.
Electricity trading takes place in several different timeframes: forward, day-ahead, intradayand balancing or real-time. The target model for the internal European market puts anemphasis on the day-ahead timeframe, when buyers and sellers hedge the price and volumerisk associated with delivery in real-time, and the first binding schedules for delivery everyhour of the following day is determined. Inherent errors in day-ahead forecasts for variableRES generation result in suboptimal day-ahead schedules. Assuming that gate closure forthe day-ahead market is at 12 noon, generation (and consumption) schedules aredetermined 12 to 36 hours before delivery.
The existence of liquid intraday markets where BRPs can adjust their positions (schedules)is therefore paramount if variable RES is to be exposed to its imbalances. The timing of

20 April 2015 111A report to The European Commission
Study on the effective integration of Distributed EnergyResources for providing flexibility to the electricity system
intraday gate closure, i.e. the final chance for BRPs to adjust schedule before the TSO takesover is also important, as the accuracy of forecasts improves closer to real time.
Figure 33. Uncertainty of a wind power forecast as a function of forecast horizon,wind power in Denmark, year 2012. (higher value on the vertical axis means higheruncertainty)
Source: Data from Nord Pool Spot, calculation by Sweco.
Variable RES generators in many countries have therefore argued, often with success, thatvariable RES should be exempt from imbalance charges. Some countries have opted formaking TSOs or independent companies BRPs for small and variable RES generation.However, as shares of variable RES generation increase as a result of generous incentivepolicies, the socialized costs to consumers have increased. In some countries this has led torequirements concerning more accurate forecasting to improve schedule accuracy, whichoften materializes in more cost-reflective imbalance settlement charges for all marketplayers.
6.5.2 Imbalance settlement
The length of the imbalance settlement period and how imbalances are priced differs in thedifferent European countries. Concerning imbalance pricing there are two major approachesto imbalance pricing: single or dual.
Under a single pricing scheme, the price BRPs pay (if short) or receive (if long) will onlydepend on whether the total system imbalance in a given imbalance settlement period ispositive or negative.
In a dual pricing scheme, the imbalance price for BRPs that have imbalances that extend(aggravate) the net imbalance of the transmission system in a given imbalance settlement

20 April 2015 112A report to The European Commission
Study on the effective integration of Distributed EnergyResources for providing flexibility to the electricity system
period is different from the imbalance price applied to BRPs whose imbalance alleviatesystem imbalance.
Depending on which type of pricing scheme is applied the incentives to be in balance willdiffer. If a participant is remunerated for mitigating the system imbalance, incentives will begiven to speculation in the system imbalance. This will help balancing the system, howeveron the other hand this could in theory result in a situation where the TSO has to balance twoimbalance origins (the original imbalance and the speculation imbalance if wrong). On theother hand, providing a regime which does not fully reflect the imbalance costs will dampenthe signal to the market participants, thus reducing the incentives for forecasting correct andaccurate physical positions. Depending on which mechanism applies, the market value offlexibility will vary.
In both single and dual pricing, the cost for procuring balancing capacity ex-ante may beweighted in the imbalance price, but this is the exception rather than the rule. These costsare usually socialised via transmission grid tariffs.
In general, dual pricing is regarded as detrimental to variable RES development due to theinherent uncertainty of weather forecasting:
■ Prices in balancing markets are usually higher than day-ahead price so the pricespread in dual imbalance pricing can be significant. This is further aggravated inmarkets with large shares of variable RES and much price volatility, makingimbalance prices difficult to predict.
■ The spread should provide a signal for participants who can control their positionsto do so. For participants that have difficulties in balancing, large spreads mayplace a significant cost on their businesses. For example, independent windgenerators or small suppliers without the benefits of a diversified portfolio will havea greater proportion of their volumes exposed to imbalance pricing. In general,regulators are concerned that imbalance pricing should accurately reflect the coststhat renewable generators’ variability may impose on the system without undulypenalizing these parties.
■ Imbalance prices based on marginal pricing tend to be more extreme than pricesbased on average prices, and are thus less favourable to RES generation.
■ In some countries there is concern that the whole approach where energy-relatedand systems related balancing actions are financed separately is becomingobsolete with increasing shares of RES generation and increased risk for networkcongestion. In most countries, imbalance pricing schemes encourage participantsto be in balance without taking network constraints into consideration. This maylead to behaviour where efforts by participants to avoid imbalance charges leadsto increased system-balancing costs for TSO’s, and it may also lead to marketpower issues.
For these reasons, some countries have opted for different balances for conventionalgeneration, variable RES generation and consumption, with single pricing applying forvariable RES and consumption, and dual pricing for conventional generation. Also, somecountries (Belgium) apply single pricing which becomes dual pricing if the net system

20 April 2015 113A report to The European Commission
Study on the effective integration of Distributed EnergyResources for providing flexibility to the electricity system
imbalance over a particular imbalance settlement period exceeds a certain amount MW. Thismay also apply to the BRPs imbalance.
In what follows three different market regimes will be described in the pricing of imbalances.The market design varies, and could to some extent be expected to be a function of theenergy mix.

20 April 2015 114A report to The European Commission
Study on the effective integration of Distributed EnergyResources for providing flexibility to the electricity system
7 Roles and relations in the market
7.1 The current model
Today’s market designs are mainly formulated around the concept that electricity is(centrally) generated and consumed in the other (distributed) end. Most system servicesoriginate from central generators, and usage of electricity is considered to be highlystatic/inelastic (“vertical demand curve”).
With the introduction of VRES and the fundamental change of the power sector, theinterdependence between central generation and distributed consumption is changing. Insuch a transition, alternative market design and new business models are important, andnecessary in order to ensure an efficient integration of distributed energy resources. Themarket is anticipated to have more roles and actors, and the relations between marketparticipants will be changed compared to the traditional roles. A concrete example ofchanging roles and responsibilities is the transformation from strict consumers intoprosumers, consumers that produce. Furthermore, the demand side will start to respond tocertain signals, demand response. Additionally, energy storage schemes and small-scalegeneration response will possibly take part of the market. This will have different effects onthe power market mainly depending on the regime and service/product offered by thedistributed energy resources.
This section aims to present a principal relation-scheme between the different actors on themarket and their roles, from both a traditional and a future perspective. The market designsacross Europe vary both due to the actual system requirements but also due to historicalcircumstances and traditions. The details of a certain market regime thus vary, and the rolesand therefore relations for different actors can vary between different regimes. The generalongoing transformation towards the European Target Model aims at harmonizing (or patch)the market design in order to facilitate integration.

20 April 2015 115A report to The European Commission
Study on the effective integration of Distributed EnergyResources for providing flexibility to the electricity system
Figure 34. Market roles and relations - traditional perspective. White filled arrowsindicates a contractual agreement, the transparent arrows indicates a flow of energy(and the direction).
Source: Svensk elmarknadshandbok, modified by Sweco
Figure 34 provides a simplified, high-level overview (focusing on a “distributed level”) of themarket design, showing partly the complexity and interrelations between the different actors.Here follows a description of the roles in a traditional context.
7.1.1 Transmission system operator, TSO
The TSO is responsible for the balance between load and generation on the grid, and iscovered under the regulated section of the power market. The balance is ensured bymaintaining the nominal grid frequency (50 Hz in Europe). The TSO also holds an importantfunction on the deregulated market; reporting the transmission capacity to the marketoperator so that the market auctions and clearance does not violate any of the transmissionconstraints. Furthermore, the TSO is responsible for the physical and financial settlementbetween different market actors, mainly via the balance responsible parties. In order for theTSO to calculate the balance of each BRP, meter values are collected (and profiling valuesare calculated) from the relevant actors. The actual actors’ supplying this data differsdepending on the market regime. The TSO operates the grid in real time, and based on thefrequency deviation balancing power is activated. In theory the balance could be maintainedby either increasing/decreasing load and/or consumption. Load and generation operate inthe opposite direction, e.g. reducing generation will practically have the same effect asincreasing the load (consumption). The frequency relates to the short-term balance betweendemand and supply in the transmission grid, whereas the long-term balancing of demandand supply is materialized by ensuring the adequate generation capacity and transmissioncapacity.

20 April 2015 116A report to The European Commission
Study on the effective integration of Distributed EnergyResources for providing flexibility to the electricity system
7.1.2 Distribution system operator, DSO
The DSO is responsible for the distribution of electricity, and ensuring that the needed gridcapacity is available in order to perform this service adequately with a sufficient level ofquality. The DSO is covered under the regulated section of the market. A “fit and forget”-approach has historically often been applied to the DSO task of ensuring adequatedistribution grid capacity, yielding passive grid operation. The DSO is sometimes responsiblefor metering consumption and/or production within a particular grid, and then reporting themeter values to the relevant actors. Handling and distribution of metering data is howevernot necessarily covered by the DSO.
7.1.3 Central generator
The central generators will likely, in the foreseeable future, still play an (highly) importantrole. The system will not be able to operate without considerable contribution from thesecentral generators who will contribute not only with injection, but also inertia52 that will ensuresufficient frequency quality. The central generators will however compete with the DERs,both on the regulated and on the unregulated markets. The central generators mainlygenerate electrical energy, which they sell. Additionally to the dispatched energy theyprovide system services, which are not necessarily measured in energy units but ratherpower. The central generators are (primarily) operating on the unregulated side of themarket.
7.1.4 Supplier
A supplier basically has one task, providing clients with electricity. In order to fulfil this taskthey procure electricity from traders and/or generators, and they sign wholesale agreementswith their clients. Much simplified the deviance between these two, the procurement costsand the wholesale costs will yield a suppliers margin. The supplier has a number ofobligations when supplying clients with electricity and for each supplier there must be abalance responsible party. The balance responsible party could be the same entity as thesupplier, however not necessarily.
7.1.5 Balance responsible party
The BRP (balance responsible party) is expected to have a more complex role in the futureas the need for balancing, and coordination between other actors/roles on the power marketwill increase with a successful integration of DERs. Historically the BRP would take carefulconsideration of making accurate generation schedule plans, and resolving any imbalanceusing the generation side, while the consumption side has been static (vertical load) andrelatively predictable. Depending on the market regime, the incentives for balancingportfolio(s) varies. The BRP signs an agreement with suppliers, and the suppler and BRPcould in theory be the same entity with both roles. The BRP will charge a supplier a fee for
52 Inertia helps maintaining the nominal frequency since any sudden outages are”dampened” temporarily. A higher inertia will yield a slower frequency change, thusincreasing the technical response time of primary reserves.

20 April 2015 117A report to The European Commission
Study on the effective integration of Distributed EnergyResources for providing flexibility to the electricity system
balancing generation/consumption, which varies depending on the expected predictabilityand variability.
7.1.6 Consumers
The consumers have historically, generally speaking, had a (short-term) inelastic demand ofelectricity. Furthermore, relatively non-existent incentives for helping the system have beenmade available for the end-consumers. The end-consumers have been distributed, thusyielding a distributed, non-informative consumption of electricity. The cost of electricity hastypically been socialised, and focus on tariff composition has rather been simplicity than(more complex) incentivizing rate plans. The end-consumer have not taken an active part inthe operation of the grid. The end-consumers have had electricity readily available toconsume from the grid, and there has been a unidirectional flow of electricity from the gridtowards the end-consumers premises. Many of the operational costs (e.g. ancillary services,variations in the spot price, seasonal variations) have been flattened out and have none orlittle pass-through in the retail and distribution costs of electricity.
The roles will depend on the actual market design and the final flexibility transactions. Thefinal markets and products should be based on what is economically and practically optimal,both from a geographical but also from a technological point of view. E.g. demand responseshould only be promoted and introduced on the market if it can serve needs more efficientlythan the alternative “service”.
7.2 Changes in roles and responsibilities in a future model
7.2.1 Roles and responsibilities
Above we briefly described the traditional key roles in the power market. These traditionalroles will remain, but there will be new and changes of roles.
In order to fully capture the value of flexible DER we foresee that those roles will be adaptedaccordingly and also that new roles will become important. The roles described in thefollowing can be fulfilled by different actors and combined in various ways. However, therewill also be some key relationships that will have to be defined and/or clarified.
With the introduction of DERs and VRES, the energy flow will change and the operation androles will be revised. Originating from the same model as above, new actors, roles andrelations are introduced, and the traditional roles are revised (Figure 35).
The energy flow changes from unidirectional to bidirectional in the distribution grid, as end-consumers are occasionally producers (when generation exceeds load locally) andgeneration facilities are connected at lower voltage levels compared to the traditionalgeneration schemes. With this fundamental change, there will be need for new roles andactors in the system (e.g. energy storages, aggregators). The traditional value chains(transactions) might change, and new value chains are expected to emerge with theintroduction of new demands, provisions and technologies. Different market players will havedifferent roles in the integration of DERs. As there are several different market designs and

20 April 2015 118A report to The European Commission
Study on the effective integration of Distributed EnergyResources for providing flexibility to the electricity system
technological characteristics in Europe, there is no one-model-fits-all for an efficient andsuccessful integration of DERs.
Figure 35. Market participants and relations – DER context. White filled arrowsindicates a contractual agreement, the transparent arrows indicates a flow of energy(and the direction).
Source: Svensk elmarknadshandbok, modified by Sweco
7.2.2 Aggregators
The aggregators will most likely play a (very) significant role for the integration of DER. Asthe large number, small-scale category of DERs are integrated further into the market(possibly transactions with TSO, DSO, BRPs, Suppliers), the need for an aggregator isprobable. The aggregator role could be taken by a number of different actors. It could forinstance be the same entity as the supplier/BRP, in principle even the DSO or TSO, howeverwith a significantly different role. It could also be independent aggregators. In order tostimulate competition and innovation it is important that not only established marketparticipants can take on the role as aggregators.
Both the regulated and unregulated part of the electricity market is potentially of interest foran aggregator, and a particular aggregator could theoretically operate on both the regulatedand de-regulated sections of the power market simultaneously. Concrete examples ofregulated activities are the distribution of electricity (DSO) and flexibilityprovision/procurement, whereas unregulated activities mainly relates to the wholesalemarket. Depending on the service, different challenges arise.
For services procured by regulated entities (DSO, TSO) we expect that the procuring entitywill put up requirements that ensure that the services are actually delivered. For example, if

20 April 2015 119A report to The European Commission
Study on the effective integration of Distributed EnergyResources for providing flexibility to the electricity system
demand reduction is acquired from an aggregator the DSO or TSO would have incentives toput in mechanisms that at least on an aggregated level ensure that the demand reductionsare delivered.
The accessibility and policy on access on metering data and information will be a keyquestion on the importance of the aggregator. Furthermore, depending on the size and theactual value chain of a given transaction, an intermediate party is or is not required in theflexibility provision from DERs. An example of two feasible scenarios is the activation of TSObalancing services e.g. frequency control. Either the TSO communicates directly with theproviders (“DERs”) of frequency control reserves using the appropriate technology, or theTSO communicates with an aggregator that activates the demanded service using theconnected DERs. Depending on which of the above scenarios that are realized, differentdemands and needs are put on IT, regulation and market design. Depending on this, anddepending on the demands, different barriers will result in different uptake and optimality.The minimum requirements needed in order for DER to provide a certain service should beprovided by both the DSO and the TSO in the relevant market, where uptake and efficientintegration should be balanced against the technical requirements. Let’s consider threedifferent time horizons; day-ahead, intraday and the balancing market.
Balancing market
Within the balancing market, which operates within the imbalance settlement period, only theTSO and potentially the DSO is operative. The TSO procures resources and activates thesedepending on the operational state, and ex-post the positions and imbalances aredetermined for the BRPs based on metering and profiling data. In practice this will not affectthe balance of BRPs as the activation can be adjusted for ex-post, and the coordinationcould be kept at a minimum as the actions of the TSO do not affect any of the BRPs(unregulated section of the power market) positions. The regulated side of the market (DSO)will need to ensure that the adequate capacity is available (e.g. up/down regulation can onlygive an effect if there is grid capacity in the “right” direction). Therefore for the products onthe balancing market there is need for coordination between the TSO and the DSO.Likewise, for the products activated by the DSO, there is need for coordination between theTSO and the DSO. Cross-border trade within the ISP will affect TSOs on both sides of theinterconnector, indicating the need for TSO-TSO coordination in the case of DERparticipation cross-border. As there is only “regulated” activity within the ISP (TSO and DSOis active), and the affected parties are limited, DER contribution within the ISP is consideredrelatively simple compared to provision on earlier time horizons/products where moreparticipants are affected.
Day-ahead and intra-day markets
For the products on the day-ahead (DAM) and intraday (ID) markets there is an increasedneed of coordination compared to the provision within the ISP. The underlying logic behindthis is that there are more actors and involved parties as a transaction before delivery (“ISP”)will affect a particular portfolios balance, and therefore the imbalance settlement (see section6.5). There are several challenges related to DER participation before the ISP is entered.

20 April 2015 120A report to The European Commission
Study on the effective integration of Distributed EnergyResources for providing flexibility to the electricity system
The fundamental role of an aggregator is simply coordinating several “DERs”. In particularthere are issues relating to demand side response, and the fact that demand reductionscannot be sold back to the market unless they have been bought in the first place. Forconsumption that is not metered on an hourly level (or ideally with the same frequency as theISP) it may not be possible to link demand side measures to a specific market participant.
Here follows a couple of examples of challenges related to the demand side provision offlexibility via an aggregator.
Assume there are two BRPs; BRP1 and BRP2. For simplicity we assume that each BRP hasa portfolio of both consumption and generation that is balanced as a whole. BRP1 managesto forecast the correct amount of demand for his portfolio, and the scheduled generation thatBRP1 has procured/activated corresponds to this exact amount during the delivery period.BRP2 misses a certain amount of consumption from his portfolios consumption (BRP2 isshort). Assuming all other BRPs on the market are balanced, there will be need for upregulation (market is short). This is the outcome of the day-ahead auction, and thus there willbe a demand for portfolio optimization for BRP2, otherwise the imbalance will be resolved bythe TSO when entering delivery and potential imbalance costs will burden BRP2. Thereexists an aggregator on the market; A1. A1 has technology installed at consumer premises,and can offer a reduction of consumption corresponding to up regulating power. A1 puts hisbid on the market, and the bid is matched by the bid from BRP2.
Assuming the load reducing consumers that are connected to A1 are balanced by BRP1,then BRP1 will be imbalanced since their positions are balanced based on the previous“perfect” forecast. Furthermore, BRP1 will not be able to bill as much energy as they initiallywould which would reduce their revenue, even though their costs (generation level) remainsthe same as before A1 activated any demand response (otherwise the system would beimbalanced again). In practice the generation from BRP1 will be consumed by BRP2’sportfolio. BRP2 will be able to bill the consumers of their portfolio the consumed energyvolume, without having to pay for the generation (paid via the activation of demand reductionfrom A1). It appears that BRP2 will have to remunerate BRP1 for the generation of electricitywhich was sold to the consumers of BRP2. Obviously there is need for coordination betweenBRP1 and A1 in order to register the transaction.
Building on the example above, but assuming that the portfolio of BRP1 is imbalanced andthe portfolio of BRP2 is balanced, thus enabling us to disregard BRP2 the outcome isdifferent. As the portfolio of BRP1 is imbalanced, there is need for portfolio positionoptimization. A1 offers to control the consumption of his perimeter, thus offering theappropriate flexibility and portfolio optimization. BRP1 will weigh the bid of A1 against apossible up regulation bid from generators, and pick whichever bid that is cheaper in order tobalance his portfolio. The bid from A1 is activated, and the portfolio of BRP1 is balanced. A1is remunerated accordingly, and the imbalance penalty cost is avoided. BRP1 will now beable to charge his consumers less as the total consumption is reduced. This reduction of“billable” energy will have to be weighed against the anticipated imbalance cost in the caseof revenue maximization for BRP1.

20 April 2015 121A report to The European Commission
Study on the effective integration of Distributed EnergyResources for providing flexibility to the electricity system
The illustrated challenges in both example scenarios above illustrate the complexity ofdemand contribution to the flexibility market. Generally a distinction can be made betweenenergy and non-energy services. Non-energy services will not systematically affect the ex-post settlement process, which are (today) based on energy volumes. Energy services willhowever affect the settlement between different actors, thus indicating the need forcoordination and communication between different market participants. Depending on theplanning horizon and application, different actors should be informed. Both the TSO andDSO are eligible (neutral) facilitators and should thus be well-suited for a coordination role.In most market regimes they already today hold a coordinating role (settlement and reportingof meter data). The challenges related to conflicting interests between the suppliers, BRPs,consumers and aggregators should be emphasized and minimum requirements are partlypresented above (coordination and settlement routines). The risk if these issues are notproperly resolved in the market design, DER participation and aggregators could be hinderedby traditional actors on the market. On the other hand, the perverse effects such asaggregators selling “unsold” energy should be avoided (see example above). On the otherhand, independent aggregators should be included on a level playing field on the market.Independent aggregators are already witnessed on the market in several market regimestoday (example Austria, Finland, Sweden) and are highly innovative and cost-effective.
The aggregator as an independent trader will only work under certain conditions. Assuming ascenario where there is one supplier (S1), a certain balance responsible party (BRP1) andan aggregator (A1). S1 has a portfolio consisting of end-users (C1). S1 has a physicalcontracted position on the power exchange, A1 does not. A1 has the capability of (partly)controlling the load in C1, thus reducing the consumption during certain periods andconsume more during other periods compared to the “standard” consumption curve. Whenapproaching delivery A1 declares that the there is a certain flexible capacity of consumptionflexibility. However the load reduction belongs to S1, as S1 is the actor who paid for theposition originally. Thus S1 is entitled to remuneration when a part of their position is sold tothird party actors. The aggregator should only be allowed to sell the load reduction to BRP1and/or S1 directly; however the actual controlling will then be sold as a service rather thanphysical “deliveries” since the volume is already owned by the S1/BRP1. This service willthen be remunerated accordingly. A scenario where A1 sells the flexibility to third partyactors will lead to the following: S1 and BRP1 will be imbalanced and the physical positionsthat S1 bought will be useless (the share that is long corresponding to the sold flexibility)unless sold to another party. This is valid for both the case with and without profiling.Therefore we would recommend that the aggregator, on the deregulated markets, willoperate as a service provider for the supplier/BRP and not acting independently. Onefeasible relation scheme between the different relevant roles is illustrated in the figure below.

20 April 2015 122A report to The European Commission
Study on the effective integration of Distributed EnergyResources for providing flexibility to the electricity system
Figure 36. The roles and relations needed for aggregators to operate on thederegulated market.
Source: Sweco
The figure above illustrates the importance of the relation between the supplier and theaggregator. The BRP provides the supplier with balancing energy (in principal one way),however the supplier provides the BRP with physical positions enabling the BRP to balancethe portfolio. The relation between the supplier and aggregator could in theory also be via aneutral facilitator, e.g. the TSO and/or DSO, even though it is not illustrated in the figureabove.
The exchange of information between the supplier and end-user mainly relates to activationand the resulting cash flow from certain actions (i.e. ‘baseline methodology’). It couldpossibly include information regarding volumes/capacities and corresponding price ofactivating those quantities based on the current and future state of an end-consumer.
On the regulated part of the power market (ancillary services) the aggregator can operateindependently, as the physical and financial settlement can be adjusted ex-post accordingly,reducing the need for coordination and financial implications.
In addition to the challenges presented above, there is overlap between the regulated andderegulated activities. A concrete clear example of this would be DSO and TSO activitiesrelated to ancillary services. Some of the flexibility provisions are related to long-termservices (e.g. long-term peak shifting via changes in the consumption seasonality), well-beyond both the day-ahead and intraday market planning horizon.
7.2.3 Prosumers
In a system with significant contribution from distributed small-scale generation a substantialshare of the capacities, thus generation, will be installed at end-user premises. This will thenlead to the introduction of prosumer role, e.g. consumers that produce. The share of annualproduction and consumption will vary between different actors, however during certain hours

20 April 2015 123A report to The European Commission
Study on the effective integration of Distributed EnergyResources for providing flexibility to the electricity system
these prosumers will exceed their local consumption with their local generation, and start tofeed on to the distribution grid. This will change the traditional unidirectional energy flow onthe grid, towards a bidirectional flow. Furthermore, it will change the value stream since theprosumers would expect some sort of remuneration from the electrical energy they “sell” tothe grid. Depending on the regime and legislation, there will be a change of the monetaryexchange. Some regimes opt for net metering, meaning that the sum of energy over arelatively long settlement period (monthly or yearly settlement periods are common) which isa subsidy for prosumers since they will net tax, VAT and potential transmission tariffs fromtheir energy consumption. Furthermore, with net metering the prosumer will not necessarilyface the differences in value of electricity over time (e.g. feeding in during low demand periodand taking out during peak demand period). In such a scenario, where net metering isapplied, the prosumer will be decoupled from the system state and the incentives (e.g.incentives of certain behaviour) for a given point in time (within the net metering settlementperiod). Another aspect of the situations when the prosumers are feeding into the grid is theforecasting of generation. The supplier is in many market regimes “balance responsible” fora consumer via the wholesale agreement, meaning that the supplier is responsible forbalancing his portfolio. In order to balance a portfolio the supplier has a contract with abalance responsible party (who is financially liable to any deviation (“imbalance”) from thephysical positions and the actual outcome. This role could be internalized for a givensupplier, however is not necessarily resolved internally. With the introduction of prosumersand excess generation the supplier is responsible for forecasting the prosumers load andgeneration, and penalized for any imbalance. The incentives for accurately forecasting theprosumers load and generation are strongly dependent on the imbalance cost calculation(see 6.5.2 Single and dual price system). In the case when there is significant in-feed fromthe prosumers in the region the grid might become congested (see explanation under 2.2.3),and generation from one or several of these prosumers will be adjusted or even curtailed.This indicates the need for coordination between the DSO and the supplier/BRP, in order forthem to balance their portfolios in the planning phase. The curtailment/generation adjustmentwill affect other actors, see description of the value stream above. The prosumer might alsopush towards the need for regulation of technical requirements of equipment.
In order for the market to cope with significant supply volatility, changes are needed in howelectricity is consumed. The changes in how electricity is generated is already well-defined,the future is likely to bring distributed (small-scale) generation of electricity. The prosumersboth generate and consume electricity and with a more volatile price pattern, businessopportunities will arise where then prosumers take a natural part in the value chain. Theprosumer is anticipated to have a stronger relation with one or several of; suppliers, BRPs,the DSO/TSO. Furthermore, the prosumers might become complex actors as they willprocure additional flexibility in terms of energy storage schemes, as alternative adjacentmarket such as power-to-gas and power-to-heat technology if terms are (temporarily) morebeneficial on the adjacent markets.
7.2.4 Balance responsible party
The BRP (balance responsible party) is expected to have a more complex role in the futureas the need for balancing, and coordination between other producers/users of flexibility willincrease with a successful integration of DERs. Historically the BRP would take careful

20 April 2015 124A report to The European Commission
Study on the effective integration of Distributed EnergyResources for providing flexibility to the electricity system
consideration of making accurate generation schedule plans, and resolving any imbalanceusing the generation side, while the consumption side was static (vertical load). In the future,where DERs take an active part of the future and the real-time markets, the balance of aportfolio will be dynamic from two sides; both the generation and the load side.
The roles will depend on the actual market design and the final flexibility transactions. Thefinal markets and products should be based on what is economically and practically optimal,both from a geographical but also from a technological point of view. E.g. demand responseshould only be promoted and introduced on the market if it can serve needs more efficientlythan the alternative “service”.
7.2.5 Distribution system operator
The inherent natural monopoly of energy distribution networks will not change whenintegrating the DER solutions; the distribution of electricity will still be a natural monopoly,why it should remain regulated. The unbundling of network from other services will remainhowever in order to achieve and utilize the full value of DERs and flexibility, it is foreseen bymany that the DSO should take a more active role in the operation of the distribution grid.This will affect the operation of the transmission grid as transmission and distribution areclosely coupled. Literature has stressed the importance of the neutrality of DSOs during thistransition of roles and responsibilities.
7.2.6 Transmission System Operator
The TSO is likely to have a similar role as of today, however with the fundamental differencethat distributed energy resources and DSOs will take a natural part of the operation of thetransmission grid. Historically, central generation units have been used for the continuousoperation of the transmission grid, which is expected to be reduced in the future. The TSO is,and will be in the future, responsible for the operation of the transmission grid.
Furthermore, the TSO holds a (very) important role for the market operation as the TSO isthe allocator of interconnector capacity to the markets. The markets are cleared based onthe interconnector capacities, and the price of electricity is calculated taking into account theavailable capacity that the TSO has published. If the TSO forecast of available transmissioncapacity is wrong, or whenever there is a sudden outage, the available transmission capacityis revised. Since this will affect the scheduled generation/load plan, the grid is potentiallycongested and re-dispatch/curtailing is needed in order to ensure the operation of the grid.The actual methodology on how this is done, and market participant’s compensation/penalty,differs depending on the actual regime.
7.2.7 Traditional generators
The central generators will likely, in the foreseeable future, still play an important role. Thetransmission grid will not be able to operate without considerable contribution from these

20 April 2015 125A report to The European Commission
Study on the effective integration of Distributed EnergyResources for providing flexibility to the electricity system
central generators who will contribute not only with injection, but also inertia53 that will ensuresufficient frequency quality. The central generators will however compete with the DERs, andthe optimal generation portfolio will succeed.
7.3 Reactive or Active demand side participation in the day-aheadmarket
The day-ahead market plays a key role in the European market design, and DAM price is thekey reference price for financial contracts and the largest volumes are often traded on theDAM market. With this perspective it seems advantageous that demand flexibility could alsobe taken into account in the day-ahead market, obviously dependent on the service suppliedby the demand response.
If increasing demand flexibility is used to reschedule demand within the day this has to beconsidered when placing the DAM bids, otherwise larger volumes will end up on the intradayor balancing power market. Not only would this constitute credibility problem for the DAM, itcould also cause very high balancing prices and make balancing of the system morechallenging for the TSO. Another challenge is that the participating end-consumers have nodirect incentives to balance consumption against the consumption forecast, as theirconsumption is profiled. Even in the case of smart-meters the balance will not be settledexplicitly, but could remain profiled.
During a learning period the different market participants will probably experience difficultiesin forecasting end-consumer behaviour when the consumption is significantly changed fromthe profiling consumption curves. Any deviation (equivalent to a high degree of penetration ofreactive54 end-consumers) from the forecasted consumption curves is likely to incur animbalance in the portfolio, which needs to be resolved via one of the available institutions(intraday, balancing market(s)). It is not apparent how fast the learning curve is for marketparticipants, and how predictable this reactive demand response will be. A likelydevelopment is a function of the incentives and the adoption pace, e.g. if the incentives aresignificant then the adoption pace will be higher, and vice versa.
Instead increased demand flexibility will require the portfolio manager and the BRP to takedemand flexibility into account when placing bids on the DAM. If balance responsible partiesdo this by using a price forecast to forecast how the demand flexibility will affect the totaldemand for each hour, a reliable price forecast becomes very important. A poor priceforecast can lead to significant errors in the demand forecast, potentially worse than notconsidering demand flexibility in the bids at all. For example, in the extreme case, if allbalance responsible parties predict hour 1 to be more expensive than hour 2, they will
53 Inertia helps maintaining the nominal frequency since any sudden outages are”dampened” temporarily. A higher inertia will yield a slower frequency change, thusincreasing the technical response time of primary reserves.54 Reactive demand response means that the signal is based on the expected state of thesystem. In the case where the signal is from the day-ahead market, that is based on theexpected balance between demand and supply, not necessarily the true balance.Consumers then react to this signal.

20 April 2015 126A report to The European Commission
Study on the effective integration of Distributed EnergyResources for providing flexibility to the electricity system
assume that demand flexibility will decrease demand by 2,000 MW hour 1 and increasedemand by 2,000 MW hour 2. If it then turns out that the price is higher during hour 2 thedemand flexibility will move demand in the opposite direction from what was expected andcreate a forecast error of 4,000 MW during both hour 1 and hour 2.
Figure 37. Forecast errors may increase as a result of reactive demand flexibility.
Source: Sweco
The illustrated example obviously shows an extreme situation, and does not necessarilyillustrate the outcome from demand response. The example rather illustrates a “worst case”scenario when market participants speculate in the future market price and reactive demandresponse.
A possible alternative would be to enable a bid which defines the total amount of energyneeded during the day and the maximal deviation from the “profiling” curve during any singlesettlement period (often hour). The energy can then be bought at the lowest possible price,fulfilling the boundary conditions. This would potentially minimize the volumes that end up onthe balancing market from the reactive demand response.
7.4 Capturing the value streams today – some good examples
Already today demand response and other DER are used. This section provides a fewselected examples. Initially we briefly outline demand response in one part of the USA, thePJM market. We then describe a few European cases focusing either on the regulated orderegulated part of the market.
7.4.1 Demand response and PJM
Demand response is a well-established part of the PJM market (Eastern USA). PJM isoperating in 13 states, linking supply and demand of electricity for more than 51 million end-

20 April 2015 127A report to The European Commission
Study on the effective integration of Distributed EnergyResources for providing flexibility to the electricity system
users. In brief demand response can be distinguished into two different types; economic andemergency demand response. A provider of flexibility could in principle participate in bothmarkets, depending on the circumstances.
The emergency demand response is often referred to as Load Management Resources orInterruptible Load Resources. Once committed the delivery is mandatory and failure todeliver the committed service will be penalized. The activation of the emergency demandresponse is by load reduction or only to consume electricity to a certain level when PJMrequires assistance to ensure the operation of the grid. There are several “products” that canbe signed;
■ Limited DR – allowing activation for 10 weekdays between June and September(peak-load season) where each activation could be up to 6 hours in duration,
■ Extended Summer DR – allowing activation all days between May and October,where each activation could be up to 10 hours in duration,
■ Annual DR – activation between June and May (following year) where eachactivation could be up to 10 hours in duration.
The participants are mainly activated via an aggregator, and the remuneration is mainly donevia the capacity auction prior to delivery. The remuneration is a function of the auctionclearing price and load reduction commitment. In addition to the committed resources underthe capacity auction there is the voluntary participation in the emergency demand response.Under this mechanisms the aggregators have the possibility to participate when anemergency is called and remunerated according to activate energy.
Economic demand response is a voluntary program which basically operates on a monthlybasis. The service is activated by the PJM if the wholesale price is equal to or above the netbenefits price. The net benefits price represents the price at which the benefits (reduction ofwholesale prices) from the economic demand response exceed the cost of activation.
Parallel to the participation in the economic demand response a consumer can participate inthe ancillary services market. The ancillary services market comprises three differentservices;
■ Synchronized Reserves (load reduction within 10 minutes)■ Day-ahead scheduling (load reduction within 30 minutes)■ Regulation (Frequency Containment Reserve)
The participation in the economic demand response is voluntary, however if a bid isaccepted then delivery is mandatory (otherwise financial penalties applies).

20 April 2015 128A report to The European Commission
Study on the effective integration of Distributed EnergyResources for providing flexibility to the electricity system
7.4.2 Aggregator in Austria – frequency control from electrical heaters
Service provided Capacity (and activation) for frequency containment reserve (FCR)
Actors involved ■ TSO (Austrian Power Grid AG) Purchase and activation ofthe reserve.
■ Aggregator: Aggregates and assists end-customers providingcapacity to the reserve.
■ Tele provider (communication)■ End-customers (domestic): Provide capacity to FCR from
electrical heaters.
Value streams ■ TSO remunerates for the capacity.■ Profit sharing between aggregator and end-user.
Business model - description
In Austria the use of electrical heaters for domestic usage of water is common. The businesscase of FCR from electrical heaters uses independent metering and communication, and thecommunication between the aggregator and end-consumers is via SMS and cellulartechnology. The metered value is the temperature of the water in the electrical heater, whichis provided with a certain frequency (minutes). The aggregator can remotely control toactivation (or de-activation) of an electrical heater, and the capacity of an electrical heater isgenerally 2 kW. By activating prematurely or postponing the activation of an electrical heaterthe electricity consumption can be shifted in time, and the thermal inertia in a water tank canbe utilized without the end-consumer experiencing any inconvenience. As thedelay/prematurely activation of a particular electrical heater is relatively short compared tothe TSO’s needs for balancing, the electrical heaters are activated in sequence in order toprovide a service with sufficient duration. The response time is sufficiently short for FCR.

20 April 2015 129A report to The European Commission
Study on the effective integration of Distributed EnergyResources for providing flexibility to the electricity system
Figure 38. Illustration of flexibility provision from demand response
Source: PwC
The FCR from electrical heaters in Austria uses existing cellular infrastructure forcommunication. One of the included partners in the flexibility provision is a local telephoneoperator, which provide the communication infrastructure. A particular boiler can either becomplemented with the appropriate equipment (remotely controlled relay for activation/de-activation, temperature sensor and cellular device), or is bundled with the needed equipmentif sold from the partnered appliance companies.
Before the introduction of the flexibility provision from the electrical boilers pooling ofresources was not allowed in the TSO procurement of FCR. The regulation was changed sothat resources could be pooled, and that the individual resources have a capacity of 2 kW orhigher. Furthermore, in order to not affect third party market participants (e.g. the BRP) theex-post settlement period includes the activated volumes from FCR activation and adjustedaccordingly.

20 April 2015 130A report to The European Commission
Study on the effective integration of Distributed EnergyResources for providing flexibility to the electricity system
7.4.3 Aggregator in Finland – frequency control from demand response55
Service provided Capacity (and activation) for frequency containment reserve (FCR)
Actors involved ■ TSO (Fingrid): Purchase and activation of the reserve.■ Aggregator (SEAM): Aggregates and assists end-customers
providing capacity to the reserve.■ End-customers (commercial): Provide capacity to FCR
mainly from ventilation equipment.
Value streams ■ TSO remunerates for the capacity.■ Profit sharing between aggregator and end-user.
Business model - description
SEAM is an aggregator based in Finland. SEAM has multiple value streams involving day-ahead market, intraday market and the balancing market (frequency containment reserve,FCR). The business model includes the end-consumers (mainly commercial users currently),SEAM and Fingrid (TSO). Traditionally Fingrid has procured FCR from hydropowerproducers, and for the last three years costs have increased with approximately 20 % perannum. Hydropower producers have historically had difficulties with supplying FCR when thespring flood has started, as there is little regulating capacity left (operating at full name platecapacity in order to avoid spillage of water). The procurement procedure for FCR is dividedonto two auctions; yearly and hourly FCR. The yearly auction is remunerated via a flat fee forcapacity, the hourly market is continuous. Historically the hourly market has remuneratedparticipants the highest. Last year the remuneration was on average 400,000 EUR/MW ofFCR capacity for demand response. The pricing mechanism is marginal pricing on the hourlyauctions. The profits attained are shared between the aggregator and the end-user. Atpresent the Finnish TSO subsidizes the end-user in the needed communication and steeringequipment by financing 50 % of the investment needed. The cost for procuring and activatingthese resources is covered by the transmission tariff, i.e. costs are socialised.
The most suitable end-user providing FCR has historically been large real-estate propertiesas the building requirements in Finland demands commercial property to have a relativelylarge name plate capacity for ventilation, which is seldom fully used. This means that there isa regulation possibility. The cycles of activation typically last for around 3 minutes, which canbe rescheduled without noticing any discomfort for the users of the commercial properties(inertia in air quality). Industrial consumers have traditionally not been participating in theFCR, due to uncertainties related to increased wear on machinery and equipment. As theactions of the TSO does not affect any other market participant (within the imbalancesettlement period), and since the activated regulating power is a zero sum energy product (intheory up regulation is equal to down regulation effectively yielding a net energy volume ofzero) the provision of flexibility from end-users does not have any direct conflicting interests.
55 Case description based on interview with SEAM

20 April 2015 131A report to The European Commission
Study on the effective integration of Distributed EnergyResources for providing flexibility to the electricity system
According to SEAM the demand resources are better suited for FCR as they are notdependent on the hydrological regime (e.g. spring flood) and is easier to activate asresponse times are faster.
7.4.4 Aggregator of heat pump control in Sweden56
Service provided Start-up, proof-of-concept. Possible services include:
■ Portfolio management/balancing■ TSO balancing■ DSO congestion management■ Peak forecasting
Actors involved ■ Aggregator (Ngenic): Control of heat pumps■ End-customers: Providing flexibility■ Possible users of flexibility: DSO, TSO, suppliers/BRPs
Value streams Multiple value streams depending on service provided:
■ Energy efficiency■ Arbitrage■ Capacity payments from TSO and/or DSO
Business case - description
The Sweden based (start-up) aggregator Ngenic has a technology that enables them tocontrol heat pumps remotely. Heat pumps are common in Sweden for domestic heating. Inbrief, heat pumps extract energy from an ambient medium (often ground or outside air), and“drops” the extracted heat energy to the indoor area. The efficiency of heat pumps is mainlydepending on the ambient temperature, and at low temperatures the efficiency (“COPfactor”) will be reduced. Due to this change of efficiency dependent on the ambienttemperature the optimal electricity consumption can be (theoretically) scheduled so that itensures the indoor comfort criterion (indoor temperature not exceeding/dropping amaximal/minimal indoor temperature. By scheduling the heat pump consumption ofelectricity according to the current and forecast (expected) ambient temperature of cominghours and using thermal inertia to store heat, the electricity consumption can be minimized.The needed equipment for the control of a specific heat pump is basically a temperaturesensor, communication to the control and a temperature forecast. The algorithm applied is amachine learning algorithm which “learns” the thermal inertia of a given end-consumer andthe actual efficiency curve for a heat pump. In other words, the need for a “smart-meter” isnot needed as the electricity consumption is implicit from the usage of the heat pump (andother electricity usage behind the meter). Currently Ngenic’s business case is primarilybased around energy efficiency (reducing energy consumption by operating at higherefficiencies (temperatures)), and secondly around time-of-usage distribution tariffs. This ismainly due to a) exposure to spot prices for end-consumers yields little arbitrage (spot price
56 Case description based on interview with Ngenic

20 April 2015 132A report to The European Commission
Study on the effective integration of Distributed EnergyResources for providing flexibility to the electricity system
is flat due to hydro domination in Sweden) and b) due to lack of exposure to imbalance costs(costs are socialised) from the BRP.
In the case of a flat tariff (simply a constant unit cost of electricity e.g. cEUR/kWh) the controlalgorithm will strive to minimize the electrical consumption, thus minimizing the cost forheating. Assuming other incentives than simply minimizing electrical consumption, e.g.portfolio management or balancing the controlling of the heat pump can be set to minimizethe costs based on the future expectation of electricity unit cost. By consuming electricitydifferently than the optimal consumption plan the consumption of electricity will increase,however the total costs will decrease (compared to the operation minimizing the electricityconsumption). In the figure below two different price incentives are illustrated schematically.In the top graph the unit price of electricity is illustrated. This could correspond to a dynamictariff (e.g. following the spot price or intraday price), or the net cost after the portfoliomanager has traded on arbitrage (profit sharing), or similar. The cost of electricity (illustratedin the top graph) in the scenario “incentives” is initially low, followed by high prices, followedby lower prices, ending with higher prices again (dashed black). The flat rate is linear, e.g.the unit cost of electricity is constant (solid black). The temperature (red solid), heat pumpefficiency curve (also red solid) and electrical consumption from both scenarios (solid anddashed black) are illustrated in the middle graph. The temperature is initially high (thus highefficiency of the heat pump), followed by lower temperature (lower efficiency), followed byhigh temperature again (high efficiency) (red solid curve). The bottom graph illustrates theindoor temperature, and the comfort zone (temperature should not go outside of the pre-defined comfort criterion). In the middle graph the two different scenarios are both minimizingthe cost based on the incentives provided. The sum of the “incentive” electricity consumptionis larger compared to the “flatrate” curve, however both satisfies the pre-set comfort criterion.The flatrate-curve (solid black) is initially activated at nominal capacity (temperature andefficiency is high), then reduced to minimum load, and later activate again when theefficiency is high. The dashed black curve is initially operating at a high load even if thetemperature drops, and when the prices are the highest the load drops. The price will laterbe reduced, thus activating the heat pump once again. In the end, when the price signal isback at the high level, consumption is reduced even though the efficiency is once again high.

20 April 2015 133A report to The European Commission
Study on the effective integration of Distributed EnergyResources for providing flexibility to the electricity system
Figure 39. Schematic illustration of ambient temperature, heat pump efficiency,electrical consumption for two scenarios (flat and incentive), indoor temperature, andcost of electricity.
Source: Sweco
The illustrated example above illustrates two alternative paths of consumption, which arebased on the provided incentives. In theory, the cost for providing a “bid” to day-ahead,intraday or balancing markets is defined by the increase in electrical consumption comparedto the optimal consumption path (based on the retail tariff). As the current thermal state andthe heat pump efficiency curve of a household is unique, a series of bids could be formulatedand submitted to the market. The bids could be formulated relative to the optimalconsumption path (minimize costs which depend on unit cost of electricity), e.g. if the price ofup/down regulation is cheap enough compared to the base case it is justified to increaseelectricity consumption. As each household is unique, and could in theory generate anumber of alternative consumption paths, the flexibility potential is liquid (e.g. many bids)and could be remotely operated by the operator. The user could be BRP, portfolio manageror the TSO/DSO (regulated market).
7.4.5 Future business cases – using storage as a service
Distribution grids with significant shares of DG might experience congestion and/or badutilization of the existing capacity (nominal capacity only utilized a couple of hours each year,if at all). A measure for relaxing the grid during these (extreme) events could be to install anenergy storage scheme. A central energy storage scheme could in theory charge the storageduring periods with a significant excess generation, which would in the base line scenario becurtailed. During periods with less generation the energy storage could be discharged and

20 April 2015 134A report to The European Commission
Study on the effective integration of Distributed EnergyResources for providing flexibility to the electricity system
providing the local consumers with electrical energy. An alternative to a central storagescheme is distributed (e.g. domestic) storage schemes, which might be problematic due to anumber of reasons:
■ Location inside the house might be challenging as they need to be properlyinstalled,
■ Connection schemes need to be properly setup,■ Needed control equipment to ensure safe and efficient operation.
As an alternative to the domestic energy storage schemes a central storage scheme couldoffer the same services, and with a number of pro’s. The economies of scale is the mostobvious benefit compared to the domestic energy storage schemes, as is the operation ofthe energy storage scheme. The central (however still located at distribution grid level)energy storage scheme will offer grid congestion, minimization of distribution losses, assetmaximisation by selling flexibility and resources to the highest paying buyer. The centralstorage should be exempted system costs since this is paid during injection to the grid by theprosumer. The financial burden the system (including both VRES and energy storage) willreduce the burden on the distribution grid since there is a reduction of grid investments dueto an efficiency increase (nominal capacity is utilized more frequently).
Challenges
There are several challenges related to energy storage schemes as a service. Doubletaxation and fees might form wedges for the business case of using energy storage as aservice. In the case of the energy storage operated by the DSO (or another regulated marketactor) there are several regulatory barriers as the details are yet to be defined for manyEuropean regimes. In addition to above, the regulation is not clear regarding an energystorage which is owned in a consortium between several market participants (could bemultiple prosumers). The energy storage is not physically placed behind the meter (which isoften encouraged) but placed outside of a prosumers perimeter, still principally offering thesame (system) benefits. Related to energy storage owned by a consortium is energytaxation, transmission fees, profit sharing between DSO and prosumer(s), and possibleVRES subsidies (e.g. market premiums, FITs, etc.).

20 April 2015 135A report to The European Commission
Study on the effective integration of Distributed EnergyResources for providing flexibility to the electricity system
8 Current barriers
The examples provided above show that there are ample opportunities already today to takeadvantage of the flexibility that can be provided by DER, provided that the value is there. Thetechnological barriers are typically quite limited, although improved metering can facilitatecapturing more of the value streams. In some cases there is a need for adapting existingregulations to facilitate for DER participation, but generally we do not see a need for amassive regulatory intervention. However, there are some barriers that prevent or make itmore difficult to capture this value. There are for instance some regulatory barriers thatcreate difficulties for aggregators and that in some cases also could undermine the businesscase for an aggregator.
8.1 Lack of markets
The value of flexibility can be revealed in several different ways, e.g. through tendering,bilateral agreements, network tariffs etc. In addition to these, organised market places areimportant for some flexibility services. In order for organised market places to functionproperly, it is necessary that sufficient liquidity can be established. This likely means thatvery local services in many cases will be difficult to supply through organised market places,but other arrangements will be necessary. In particular, DER may provide local serviceswhere national or regional markets are not necessarily relevant.
In cases where DER can supply services to larger markets, e.g. on the system or wholesalelevel, organised market places are more likely to be a suitable mechanism for revealing andremunerating value of flexibility also from DER. However, markets do not currently exist forsome products, for instance voltage control in the distribution grid. The main markets are setup to provide energy, and markets for other services are often not in place.
For instance energy storage could potentially provide several different services to the powersystem. There are several applications such as energy arbitrage, generation capacitydeferral, ancillary services (regulation, contingency reserves), ramping, T&D capacitydeferral, end-user applications (managing energy costs, power quality and service reliability)and renewable curtailment (Sioshansi, et al., 2012). There are thus multiple value streams,and a fundamental problem is an inability both to quantify and to capture those valuestreams. This is partly due to missing or incomplete markets for some of those values, andmany services are thus not priced in markets (voltage support, reactive power, inertia,ramping etc). Both Shishansi et.al (2012) and Bhatnagar, et al. (2013) point at this problem,but from a US context. Similar issues are however present also in Europe. As pointed outabove, it of course needs to be recognized that there are difficulties in arranging suchmarkets, as extreme locational market power could easily arise. This is a problem also for“centralized energy resources”, but can be expected to be even more difficult for distributedenergy resources. In any case this leads to an inability to quantify and capture the multiplevalue streams provided to the grid.
The use of locational pricing is also limited in Europe on the wholesale level (some use ofbidding areas), and absent in distribution networks. Increased use of locational pricing in the

20 April 2015 136A report to The European Commission
Study on the effective integration of Distributed EnergyResources for providing flexibility to the electricity system
wholesale market could provide stronger incentives for flexibility in relation to more localneeds (i.e. bidding zones rather than national markets). However, this may not provide theincentives for flexibility in the local distribution grids. In theory locational marginal pricing inthe distribution grid could provide an opportunity to capture (very) local value of flexibility,although in practice such pricing schemes may be difficult to implement.
Price differences trigger deployment of flexibility options. The fundamental driver for theprofitability of demand response/energy storage is the arbitrage between peak and off-peakprices, i.e. the savings/remuneration will be larger the higher the volatility is. In a (local)system where there are relatively few market participants, the impact from one market actorcould be (very) influential in the price formation meaning the business case will (ifremunerated via the arbitrage and marginal pricing) be less profitable. An example ofalternative, more beneficial, remuneration schemes could be capacity payments, rather thanenergy-only remuneration. The paradox is that local markets are anticipated to generallyhave a larger need for flexibility, simply because of their non-diverse supply curve.

20 April 2015 137A report to The European Commission
Study on the effective integration of Distributed EnergyResources for providing flexibility to the electricity system
Value of flexibility and market concentration
High price volatility means that there is a large variation in the value of power over time. Thisprovides one indicator of the value of a certain type of flexibility, i.e. the ability to adjustdemand or generation in order to match the current demand supply balance.
More isolated markets have less access to different type of generation sources, which easilycould lead to large variations in the cost of supplying power, i.e. high price volatility. Suchmarkets would also typically have a high market concentration. This would generally beassociated with more potential problems of market power. If there are significant marketpower problems the market outcome will not be efficient.
The figure below illustrates the standard deviation of the DAM price (measure of volatility)plotted together with the Herfindahl-Hirschmann index (a measure of competition, lowermeans more competition) for the Italian price zones. It can be seen that there is a positivecorrelation between volatility (the higher the volatility is, the larger the indicator for flexibilityneeds) and the level of competition (the smaller the competition, the smaller the diversity ofthe supply curve is).
Figure 40. Volatility (standard deviation) plotted together with competition (HHI) Italianpower market, 2013.
Source: Gestore Marcati Energetici 2013, calculation by Sweco.
This indicates that flexibility from DER will be more valuable in congested market areaswhich also have a high degree of market concentration. In addition to providing flexibility,DER may also help to mitigate potential problems related to market power. Integration ofDER could therefore be beneficial both from a systems and a market point of view.
0
5
10
15
20
25
30
35
40
45
0 2000 4000 6000 8000 10000
St.d
evEU
R/M
Wh
(vol
atili
ty,h
ighe
rm
eans
mor
evo
latil
ity)
HHI (level of competition, lower means more competition)

20 April 2015 138A report to The European Commission
Study on the effective integration of Distributed EnergyResources for providing flexibility to the electricity system
8.2 Lack of market access
Even if market exists it may be difficult for DER to access the markets for different reasons.This can be due to lack of liquidity in markets which limit the usefulness of the markets,regulatory barriers or technical specifications preventing market access for DER.
Direct participation in organized market places requires exchange membership or e.g. aclient arrangement. The membership fee varies somewhat between exchanges. In Nord PoolSpot the annual fee for participants on Elspot57 and Elbas is €15,000 and on Epex Spot58 theannual fee for participation in one auction (and corresponding intraday market) is €10,000. Ifthere is in addition a need to participate in financial markets there is a separate fee. NasdaqOMX Commodities for instance has an annual trading fee of €13,500 and clearing fee of€25,000.
For it to be worthwhile to be a direct participant the volume obviously needs to be fairly large,i.e. for most DER this is not a relevant alternative. In some markets there are also otheroptions such as participating as a client (through a client representative). The fee to theexchange is then substantially lower, in the case of Nord Pool Spot the annual fee for a clientmember is only €1,500. In addition a commercial agreement with a client representative isneeded.
In addition to the direct fees that have to be paid to the market places there will be additionalcosts for market participation. Markets with continuous trading means that you as a marketparticipant need to devote substantial resources for participating in the markets.Furthermore, minimum bid sizes may prevent smaller actors from being able to participate inmarkets.
This highlights the importance of intermediaries, e.g. the supplier or an aggregator that canfunction as a link between the market and the DER owner.
8.2.1 Market access for aggregators
Aggregators gather flexibility of many (small) consumers and from this build demandresponse services. Through aggregation one pool of aggregated load is created whichfacilitate market participant. The Smart Energy Demand Coalition59 has recently mapped thestatus for demand response across several European countries (SEDC, 2014). SEDC havedeveloped 10 guidelines for enabling demand response participation in wholesale, balancingand other system services markets. The guidelines are categorised into four criteria: 1)involve consumers, 2) create products, 3) develop measurement and verificationrequirements, and 4) ensure fair payment.
57 Elspot is the Nordic exchange day-ahead market, Elbas is the intraday market.58 German exchange59 Smart Energy Demand Coalition (SEDC) is an industry group with focus on promotingdemand side programs.

20 April 2015 139A report to The European Commission
Study on the effective integration of Distributed EnergyResources for providing flexibility to the electricity system
Information on member state level was gathered through desk research and expertinterviews. It is explicitly mentioned that the findings reflect the experience of the players onthe ground. This is important, as in some cases the assessment (grading) differs betweencountries, although the underlying conditions are described in very similar ways in the report.This could of course reflect differences in details which are not fully reflected in the report,but is also likely to at least partially be due to the subjectivity that comes from the chosenmethodology.
According to the SEDC research demand response is not accepted in several nationalmarkets as a resource, or the market roles and responsibilities prevent direct access ofconsumers to service providers. Figure 41 provide an overview of the first criteria, consumeraccess to markets, according to the SEDC analysis.
The actual barriers differ between the countries. In Spain aggregation is not legal, and thereis only one scheme allowing demand response. However, there are proposals to openbalancing services to demand response and changes could come. In several countriesaggregation is legal in theory, but BRP-BSP relationship is unclear or there are other criticalbarriers. In the Nordic countries aggregation is legal and consumers can in theory buy andsell electricity independently, but have to be connected to a BRP. The situation in Finland isassessed to be somewhat better than in the other Nordic countries due to e.g. better accessto the ancillary services markets and that aggregators can register as a BRP and pay a(small) monthly fee to the TSO.
In Germany aggregation is legal, but existing market rules for purchase/sale, transportationand balancing of electricity have to be recognized. That necessitates the conclusion ofdifferent agreements like standardised contracts with the TSO, DSO or BRP and contractswith possible retailers and the consumer. At least for suppliers or independent aggregatorsthat are not accustomed to the standards of the German energy market, this can bedifficult.60 However existing grid tariffs on the consumption of negative balancing energy areassessed to be a market barrier for Demand Response in Germany.
Also in countries in which demand response and aggregation is enabled in a range ofmarkets there is typically need for further development, according to the SEDC analysis. InGreat Britain there is for example a need to further define the roles and responsibilities of theBRP and BSP.
60 In the SEDC analysis the assessment was that independent aggregation is very difficultdue to regulatory barriers. This view is questioned by other stakeholders.

20 April 2015 140A report to The European Commission
Study on the effective integration of Distributed EnergyResources for providing flexibility to the electricity system
Figure 41. Consumer access to markets
Source: SEDC (2014), Mapping demand response in Europe today, April 2014
8.2.2 Market rules and product definition
Market rules and product definition may impact the viability for DER to access differentmarkets. This could for instance relate to minimum bid size and bid increment, which istypically small in well-developed day-ahead markets (0.1 MW) but large in many balancingmarkets (up to 50 MW). A high minimum bid size prevents participation of DER in suchmarkets. Product definition and different technical rules are other important barriers. Whilesome of those rules are justified in order to ensure that the system services that are neededwill actually be delivered, modifications could be made to facilitate participation of DER. Forinstance the viability of demand response is significantly affected by issues such as therequired delivery period (demand response could typically deliver for a few hours but not fora full day) and the frequency of required delivery (may need sufficient time betweenactivation). Both product definition and market rules have typically been set-up with based onthe needs of conventional (centralized) generation resources, and alternative arrangementsare in many cases possible. Other potential barriers could be activation rules such asactivation time as well as duration and frequency of activation.
SEDC (2014) studied the impact on program requirements on aggregators, creating productssuitable for aggregation and demand response. This relates to issues such as activationtime, minimum and maximum quantity, pay-as-cleared vs. pay-as-bid, penalty requirementsand several other market design characteristics. Balancing markets have traditionally beendesigned on the basis of the needs of larger generators.
N/A
Legal in theory in one or two markets, but notcommercially viable, critical barriers remain such asBRP-BSP relationship unclearDR & Aggregation legal in selected market -BRP-BSP relationship unclear, but marketviableDR & Aggregation enabled in a range ofmarkts
DR or aggregation illegal or aggregated demand notaccepted as a resource

20 April 2015 141A report to The European Commission
Study on the effective integration of Distributed EnergyResources for providing flexibility to the electricity system
In day-ahead markets the minimum volume increment is 0.1 MW, while in balancing marketsthe minimum bid size could be as high as 50 MW, with increments of 10 MW. The highminimum bid size and volume increment is due to manually operated markets (i.e. telephonecall to activate the resources). Some markets have reduced the minimum bid size in therange 1-5 MW, or in some cases even below that, in the balancing market. For DERparticipation the general rule would be that the smaller minimum bid size/bid increment thebetter (also in the case of an intermediary).
For demand response it is also important that the activation time is not too long, or that theduration between of activations is not too short, as it would exclude many demand sideresources.
Pricing models differ between markets. In day-ahead-markets, pay-as-cleared is thecommonly used model. In reserve markets pay-as-bid is however often used. With pay-as-bid regimes low cost resources typically receive a lower compensation than higher costresources. Demand side resources can often be activated at a low variable cost and thoseresources would then receive a lower payment under a pay-as-bid regime. This is of coursein particular the case if there are requirements to submit cost-based bids.
Figure 42. Program requirements
Source: SEDC (2014), Mapping demand response in Europe today, April 2014
N/A
Significant barriers remain, creating majorcompetition issues for demad side resourceparticipationMinor barriers to demand side partcipationin market remain, however participation ispossibleProgram requirements adjusted toenable a range of resources toparticipate in multiple markets
Program requirements block demand sideparticipation
20 April 2015 142A report to The European Commission
Study on the effective integration of Distributed EnergyResources for providing flexibility to the electricity system
8.3 Lack of price pass-through
Even if markets do exist, prices are in many cases not properly passed-through to distributedenergy resources, and in particular the demand side resources. This is due to several factorsincluding regulatory and technical barriers, but customer preferences are likely to also play arole. In addition pricing of different products may be such that the full value of flexibility is notpassed through in prices.
8.3.1 Regulated end-user prices
Regulated end-user prices (retail prices) are present in several European countries. Inparticular this is the case for household customers (see Figure 43 and Figure 44), whereregulated prices are more common than unregulated prices. Also for SMEs regulated pricesare common across Europe (see Figure 45), and regulated prices for industrial customersare also present in some European countries (see Figure 46).61
Among the European countries with regulated end-user prices, rate of return or cost-plusregulation is the most common. There is however also examples of price cap or revenue capregulations.62 Regulated end-user prices do not necessarily prevent all type of pricedifferentiation, but in general it cannot be expected that market prices will be passed-throughto end-customers. In principle it could be done basing the regulated price on a spot price(+mark-up), if the regulation permits such models. This would of course require technicalsystems supporting such pricing (hourly metering), and for it to be acceptable hedgingopportunities also for small customers. A regulated entity’s incentives to provide such pricingschemes are however limited, in particular under a cost-plus regime.
The extent of regulation of end-user prices for household differs. In some cases it mainlyrefers to households with special needs, and the impact on the provision of flexibility fromDER would then most likely be limited, but if a large share of household customers aresubject to regulated prices it would imply a significant barrier to demand response providedby this customer segment (e.g. electricity demand for heating or air-conditioning).
Regulated prices for SMEs and industries could have significant impact on the availability ofdemand response from those customer categories. 12 member states had regulated end-user prices for SMEs in 2012 and a five member states also had regulated prices forindustries. In these segments it is likely that there is potential for demand response, and theexistence of regulated prices would provide a barrier for activating the underlying flexibilityamong those customers. Active customers could generally opt-out of regulated prices, but itis then important that the regulated prices are not below cost as few would otherwise opt out.
61 Data in the figures are for 2012. Estonia abolished price regulation for all segments inJanuary 2013. There are also different arrangements with ex-post price assessment, pricefreezes etc which is not included in the data presented here. For more detailed informationwe refer to the ACER/CEER Annual Report on the Results of Monitoring the InternalElectricity and Natural Gas Markets in 2012.62 See for example Energy prices and costs report SWD(2014) 20 final/2, page 31, map 3.

20 April 2015 143A report to The European Commission
Study on the effective integration of Distributed EnergyResources for providing flexibility to the electricity system
Figure 43. Household customers supplied under regulatedprices, 2012
Source: Annual Report on the Results of Monitoring the InternalElectricity and Natural gas Markets in 2012, (ACER/CEER, November2013)
Figure 44. Share of household customers supplied underregulated prices, 2012
Source: Annual Report on the Results of Monitoring the InternalElectricity and Natural gas Markets in 2012, (ACER/CEER, November2013)
Regulated prices presentNon-regulated pricesN/A
10090 %80 %70 %60 %50 %40 %30 %20 %10 %0 %
N/A

20 April 2015 144A report to The European Commission
Study on the effective integration of Distributed EnergyResources for providing flexibility to the electricity system
Figure 45. SMEs supplied under regulated prices, 2012
Source: Annual Report on the Results of Monitoring the InternalElectricity and Natural gas Markets in 2012, (ACER/CEER, November2013)
Figure 46. Industry supplied under regulated prices, 2012
Source: Annual Report on the Results of Monitoring the InternalElectricity and Natural gas Markets in 2012, (ACER/CEER, November2013)
Regulated pricesNon-regulated pricesN/A
Regulated pricesNon-regulated pricesN/A

20 April 2015 145A report to The European Commission
Study on the effective integration of Distributed EnergyResources for providing flexibility to the electricity system
8.3.2 Feed-in tariffs
Feed-in tariffs are being used for renewable generation in many member states. This couldalso include distributed generation. Feed-in-tariffs, at least in its simplest form, remove allincentives to adapt generation depending on the supply-demand situation, and thus theincentives to be flexible. For low marginal cost technologies (e.g. wind and solar) incentivesto produce would however remain until the price is close to zero. For those technologies thekey barrier for flexibility is thus that feed-in tariffs are paid even during hours with negativemarket prices.
8.3.3 Net metering
Net metering is applied in some member states (e.g. Denmark, Belgium, Netherlands). Thispractice implies that electricity generated by an electricity consumer from an eligible on-sitegenerating facility (e.g. PV system) and delivered to the grid, could be used to offsetelectricity purchased from the grid. The consumer would then only pay for the netconsumption during the applicable billing period.
Net metering can be applied for different billing periods and also related to different parts ofthe total electricity bill (network charges, taxes, purchase of electricity). A far reachingalternative is net metering over a longer time period, e.g. a year and where the self-producers net purchase is regarded as its total purchase. In this case the self-producer isusing the grid to artificially store electricity produced at one point of time to consume it atanother point of time, without taking into regard that the value of the electricity may varysubstantially between the time periods. This artificial storage reduces the value of flexibilityas the self-producer will not face the true value of the electricity and thus not have incentivesto be flexible.
8.3.4 Fixed prices are dominating
End-user price structure varies significantly between member states, and of course alsodepends on consumer preferences (in a liberalised market). Fixed price contracts limit, orremove, the incentives for flexibility. 63 However, provided that there are no legal restrictionscontracts are likely to develop if flexibility is of sufficient value. This may be a lengthyprocess, in particular since consumer preferences may have to adopt. The existence of priceregulation is likely to hamper a development towards customers accepting contracts with ahigher pass-through.
In some markets the situation is very different. In Sweden, for example, the share of variableprice contract is close to 40%, and different fixed price contracts have a similar share. Forthe majority of the customers, the contracts will not provide incentives for short termflexibility.
63 With fixed price contract we refer to contracts with a fixed energy price (per kWh) over alonger time period, which implies that spot prices are not directly passed-through into end-user prices. Contracts may also include a non-energy dependent price component, which isnot specifically addressed here.

20 April 2015 146A report to The European Commission
Study on the effective integration of Distributed EnergyResources for providing flexibility to the electricity system
For smaller (domestic) customers profiling is typically used and the variable price is basedon the monthly average spot price. Although all customers have the right to hourly meteringand billing at no extra cost for the customer very few smaller customers have so far opted forthis. One reason of this could be the lack of volatility and market value of flexibility, due tothe vast amount of flexibility from hydro power.
Figure 47. Share of different contracts, Sweden (March, 2014)
Source: Statistics Sweden, Swedish Energy Agency
It is of course important to recognize that variable price contracts expose end-consumers toa price risk, which not all customers are willing (or should) carry. It is however possible touse hybrid contracts in which hedges a fixed volume while using variable price for themarginal consumption (above or below the fixed volume). The design of contracts/pricemodel is primarily an issue for the market participants, subject of course to general legalrequirements. Regulation of contracts would imply a significant risk to decrease innovation incommercial arrangements. A shift towards more use of variable price contracts wouldhowever be beneficial for the introduction of e.g. demand side response.
39%
38%
16%7%
Variable price contract Fixed price contract (< 3 years)
Default contract Other contracts

20 April 2015 147A report to The European Commission
Study on the effective integration of Distributed EnergyResources for providing flexibility to the electricity system
Figure 48. Measurement and verification
Source: SEDC (2014), Mapping demand response in Europe today,April 2014
Figure 49. Finance and risk
Source: SEDC (2014), Mapping demand response in Europe today,April 2014
N/A
Requirements act as a significant barrier toaggregated consumer participation
Requirements are under development orhave limited negative impact, but do not actas a significant barrierRequirements are well defined andenable aggregated consumers toparticipate in demand reponse
Requirments are non-existent or do not enabledemand side participation
N/A
Payment structures seem inadequate, penaltystructures create high risk issues
Payment structures are weak or result inunequal pay per MW between supply anddemand, penalty structures create risk issuesfor service providers but participation is still
Payment and penalties are fair andadequate
Payment structure inadequate, penalty structure is acritical barrier

8.4 Economic regulation of DSOs
The economic regulation of the DSOs is important as it provides the basic economic incentives for theDSOs. The regulation could therefore affect the decisions of DSOs of whether they should invest inmore grids and physical infrastructure or solve (some) network problems by using DER and changingthe operation of the grid. The first alternative would imply an increased CAPEX, while the secondalternative would keep CAPEX lower but likely result in an increased OPEX. Generally speaking themonopoly regulation of the DSOs typically does not provide good incentives for CAPEX-OPEXoptimization, and this is in particular the case if the CAPEX-OPEX optimization occurs over time, i.e.not within one regulatory period.
The economic regulation of distribution networks should broadly speaking both provide incentives forefficiency and be cost-reflective. However, it is not easy to achieve both these aims simultaneously.Regulatory models with a high focus on cost-reflectiveness for the individual DSO typically providerelative weak incentives for efficiency as the actual cost of the individual DSO to a high degree will bepass-through into the regulated tariff or revenue cap. Models with a strong emphasis on efficiencycannot allow for a high degree of cost pass-through and will therefore not be cost reflective to thesame extent. Regulatory models with strong emphasis on efficiency will therefore also allow forinformational rents to the DSOs that are relatively more efficient. In reality, all regulatory models arecompromises with varying emphasis on cost-reflectiveness and efficiency incentives.
Monopoly regulation also has the more general underlying purpose of customer protection, i.e.preventing the regulated monopolies from overcharging its customers, and from this follows that itwould be natural to focus on keeping the costs for the services low. At the same time the customershave a long term interested in maintaining a stable grid and that the necessary investments areundertaken. The regulation therefore should also provide appropriate incentives for investments.
Depending on the details of each national regulation there could be specific incentives for stimulatinginvestments, increasing quality, reducing operating costs etc. This is not necessarily sufficient for thefuture regulation that needs to accommodate for a high share of distributed energy resources,provision of new services and management of more complex flows.
Network regulations typically remunerate CAPEX, subject to some used-and-useful provision, at aregulated cost of capital. That means that investments in new physical network assets will beremunerated, but solutions increasing OPEX may not be remunerated. OPEX are remunerated usingdifferent approaches. In some cases it is mainly backward looking on a company level with anefficiency requirement and in other cases more sophisticated benchmarking methodologies areapplied.
In the first case increased OPEX, that decrease CAPEX today or CAPEX and/or OPEX in the future, isnot rewarded at all or in the best case with a lag. This creates an incentive to use CAPEX intensivesolutions and distort the trade-off between CAPEX and OPEX.
In the second case, sophisticated benchmarking methodologies could in principle handle this andprovide incentives for a trade-off between CAPEX and OPEX. However, in practice it is likely to bedifficult. First of all, the value of the services provided by the DSO needs to be measured. The output

20 April 2015 149A report to The European Commission
Study on the effective integration of Distributed EnergyResources for providing flexibility to the electricity system
measures used are typically simple output measures such as delivered energy or essentially inputoriented measures relating to the size of the network, number of connection points etc.
There is generally a need to develop the economic regulation of DSOs to allow DSOs to efficientlydeal with potential trade-offs between CAPEX and OPEX. This could potentially include the possibilityto use distributed energy resources, rather than investing in grid assets.
Regulators are however facing a very difficult task here, and there are no apparent or simple solutions.To the extent that the CAPEX-OPEX trade-off occur in the same period a regulatory model focusingmore on total costs rather than CAPEX and OPEX separately could facilitate the optimization.Regulators could for instance allow an increase in the OPEX allowance, if the DSO can demonstratethe CAPEX saving. This easily could be burdensome both for the DSO and the regulator, and theregulator will also have difficulties verifying the claims of the DSO. Still, the approach would inprinciple be rather simple.
However, we would expect that in many cases it may be necessary for the DSOs to invest in bothphysical equipment (e.g. metering, sensors, control equipment) and analytical and operationalcapabilities in order to avoid future investments. This would imply that the CAPEX-OPEX optimizationoccurs over several regulatory periods and a total cost methodology would then not be sufficient.Allowing increased OPEX against a possible but uncertain CAPEX saving in the future is significantlymore difficult as it will automatically involve many assessments around the future development.
One possibility, although far from perfect, would be to allow a certain OPEX add-on to investments incertain equipment in the grid to allow for needed analysis and operation. In order for this not to be onlya wind-fall profit for the DSOs that make such investments, it would have to be surrounded by certainrequirements and control mechanisms. The need to demonstrate a link to future CAPEX savingswould however be limited or could be excluded entirely. It is outside the scope of this report to developthe regulatory models that better could meet the future needs, but we point at the need for suchdevelopment.
8.4.1 Classification of storage and unbundling of distribution
Energy storage can be used to supply several different services. It can be used to supply energyduring high demand periods and e.g. solve transmission congestion problems. This would requireparticipation in (wholesale) power markets. However, an energy storage located in a distribution gridcould also provide e.g. distribution congestion services. It could then be regarded as a networkcomponent, which is included in the regulated business. For the latter it could be natural for a DSO toown and operate energy storage facilities with this purpose and it could also be an efficient solution.The DSO would then buy and sell energy to operate the storage scheme. Given the importance thatthe DSO is a neutral market facilitator such market participation could however become problematic.With a more active operation of the distribution grids, the unbundling might become more challenging.
However, the capacity the energy storage may not at all time be needed to supply distributionservices, and would then in principle be available for supplying other services to the market. The DSOis not allowed to be a market participant, restricting the possibilities for using a DSO owned energystorage in a way that provides most value. In many cases there are also significant uncertainties onwhether, and to what extent, DSOs can invest in storage.
20 April 2015 150A report to The European Commission
Study on the effective integration of Distributed EnergyResources for providing flexibility to the electricity system
One possibility would be for an independent party to own and operate the energy storage and selldistribution services to the DSO, and other services to other market participants. Whether this option iseconomically feasible partly depends on the economic regulation of electricity distribution networks, asdiscussed above. Independent ownership and operation of storage also has its pros and cons. Oneclear advantage is that an independent party could operate more freely, without the restrictionsnecessarily put on a regulated entity and thus be able to capture value streams from more sources.On the other hand, it may be more efficient to have storage and distribution under the same control ifthe storage to a large extent is used to serve the distribution network.
The network regulation may also prevent or restrict the ability of a DSO to compensate certainservices provided ‘behind the meter’. Storage located ‘behind the meter’ can often not be included inthe regulated asset base. While there are many good reasons for this it could also distort theincentives, e.g. towards network reinforcements rather than use of energy storage. While it is likely tobe difficult, and from many perspectives questionable, to include such storage in the regulated assetbase of the DSO, the approach should rather be that the DSO buy services directly from the storageowners or from aggregators.
In order to avoid market distortions the unbundling between monopoly and competitive parts of themarket is crucial. While this may create barriers in some areas, it is also important that the regulationhas clear unbundling rules.
8.4.2 Network tariffs
The distribution tariffs are subject to monopoly regulation, although there are significant differences inthe details of the regulation. While the regulation applies to both tariffs for consumers and producers,the tariffs for these groups are typically designed differently. There is also a wide range of differenttariff types (power tariff, ToU power tariff, Progressive tariffs, etc.). In principal, the tariffs should bedesigned so that they put the cost of operating and offering the sufficient grid capacity to end-users(and producers) in a non-discriminatory fashion. For energy storage, where the main purpose notnecessarily fits in under production nor consumption, but rather providing system services for one orseveral actors (DSO, TSO, BRP, etc.), the historical tariff design is perhaps not suitable with the cleardistinguishing between producer or consumer tariffs. Assuming a properly functioning market, thateffectively remunerates a certain provision with the true value of a particular product, the energystorage will ease the operation of the system (hence the (positive) value of the product), thus shouldnot be penalized with a cost burden. Assuming a flat tariff, where the energy storage owner is facedwith a cost per unit of energy transmitted (actually twice the cost, since there will be a cost forcharging and discharging of the energy storage), this will put a wedge between the true value ofproviding a particular service (reducing, for example, the grid load, thus reducing the distributionlosses) and the marginal value (total income – total costs = marginal value). Progressive tariffs mightlead to even more perverse effects.
This is however not new, as the same issues also relate to large scale pumped storage. Pumpedstorage has in some countries not been charged for the transmission of pumping electricity. This waspreviously the case in Germany, but in 2008 the regulator decided to charge grid fees for pumpingelectricity in the same way as for other consumption (Steffen, 2011).

20 April 2015 151A report to The European Commission
Study on the effective integration of Distributed EnergyResources for providing flexibility to the electricity system
8.4.3 Taxation and surcharges
Energy taxes are typically paid based on consumptions. It is common with different exemptions from,or reduction of, energy taxes. For example, electricity consumed for power production could beexempted which may then apply to e.g. large scale hydro pumped storage.
Distributed storage technologies may not always have the same exemptions. If storage in the taxlegislation is considered as end-consumption and subject to electricity tax it will create a wedgebetween the price paid for the electricity when charging the storage and the price received whendischarging. If the main value driver for the storage is this arbitrage, the price differences needed tofinance the storage would have to go up. The business case and profitability of energy storageschemes are directly affected by the taxation regime, as the electricity tax will be applied as an uplift tothe energy storage, providing an effective barrier to the provision of flexibility from grid connectedenergy storage schemes.
In addition the storage is not end-consumption as such, but the electricity will rather be taxed twice –first when it is used to charge to storage and secondly when it is used for the final consumption.
8.5 Technical barriers
In general, installations connected to the distribution grids are smaller than (aggregated) demand,storages and supply connected to the transmission grid. The size of the installations is one maintechnical barrier to exploit the flexibility potential from DER, as it will require coordination andcommunication with many small resource providers.
Aggregation of single installations is key prerequisite for participation in existing electricity markets.Aggregation requires communication infrastructure. Smart meters are one step forward to facilitateDER flexibility. Only if information is available, consumers and small generators can decide if theywant to react to incentives that require change of demand or generation. The potential for demandresponse or flexibility utilization of small generation facilities grows exponentially, if the communicationinfrastructure is bidirectional. Remote control offers the possibility to automatic response to incentivesfrom markets, transmission grid operators or distribution grid operators.
The second key technical barrier is time dependence of demand and supply. Electricity demand is noend in itself. Electricity is needed in production processes, for lighting or leisure activities. Only smallparts of the consumption can be shifted to other points in time. Generation technologies at distributiongrid levels are often cogeneration plants that are run according to heat demand. In this case, heatstorage technologies can shift parts of the heat demand and therefore the according electricitygeneration in time. Generation from VRES are depending on weather, their generation cannot beshifted in time. Also storage facilities have time limit on their demand and generation. They can onlyprovide electricity if they have been charged before and their storage capacity is in general limited.Additionally, specific storage technologies deplete electricity in time, especially flywheels.
Flexibility potential from DER has a geographical component. Distribution grids are small subsystemswith limited geographical scope, especially compared to transmission grids. If there are few flexibleDER in the region of one distribution grid, options for flexibility services to the according DSO or to thesystem level are limited.

20 April 2015 152A report to The European Commission
Study on the effective integration of Distributed EnergyResources for providing flexibility to the electricity system
Other technical barriers are low full cycle efficiency of storage facilities and increased wear off atinstallations that provide flexibility services. Power to gas has especially low full cycle efficiencies ofless than 40%. 60% of the electricity is lost if the stored methane is used in gas fired power stations togenerate electricity at a later point in time. Increased wear off is mainly the case for generationtechnologies that change their generation level and for storage technologies that have a limitednumber of cycles like batteries.

20 April 2015 153A report to The European Commission
Study on the effective integration of Distributed EnergyResources for providing flexibility to the electricity system
9 Key findings
The European Commission’s 2030 policy framework for climate and energy aims towardsdecarbonising the European energy system, and promotes increased shares of renewable energy.Furthermore, renewables are becoming increasingly competitive. In total, the share of variablerenewable energy is expected to rise leading to an increasing need for system flexibility. The effectiveintegration of DER for providing flexibility to the electricity system is important for the realisation of thisgoal.
Flexibility should be sought at all system voltage levels. However, the increased penetration levels ofDER expected in future systems necessitate the incorporation of flexibility from supply and demand aswell as energy storage connected to the distribution grid level. Physical and/or institutional extensionsof market areas and changes in market regulation are needed to open access to flexible distributedresources in both time and geography.
9.1 The power system changes
Demand for flexibility is strongly increasing at system and local level. On a system level (i.e.transmission), the residual demand analysis of the power systems of different European countriesunder scenarios of increasing VRES (Variable Renewable Energy Sources) shares highlights thegrowing global flexibility gap. Generation from VRES increases the residual demand variability andresults to steeper ramp rates on different timeframes. On a local level (i.e. distribution), rising sharesof DER connected to distribution grids lead to a transformation of distribution networks from passive toactive systems. DSOs have to handle a series of operational issues (voltage problems, reverse powerflows, congestions and increased losses) arising from the shift towards a decentralised power supplyand a shift from a passive operation of distribution networks to a more active operation.
Supply of flexibility via centralised power plants is becoming more complex and uncertain.VRES, with close to zero operational costs, replace generation from conventional power plants. Thistransformation of the generation structure depresses market prices due to oversupply. Central powerplants with high variable costs (e.g. gas power plants) leave the market. In the long run, the number ofprogrammable power generation units in the market decreases, in particular peaking plants thattraditionally have provided a large part of the flexibility in the system. One solution to finance flexiblecentral capacity is capacity payments, allowing financing additional investments and at the same timepreventing price peaks. However, depending on their regulation, they could add distortions to themarket. If the capacity payments lead to overcapacity, market price volatility is reduced. Therefore, theincentives for storage and demand flexibility are reduced. Making future markets provide sufficientincentives for peaking capacity and flexibility is a key challenge towards systems with higher VRESshares.
Flexibility options should be considered in system planning as alternative of gridreinforcements. Grid reinforcements need time and cannot take the same pace as installation of newDER. Planning of necessary grid extensions requires forecasts of demand and supply. Especially indistribution grids, local developments of DER are hard to predict. In particular, planning reinforcementssimply to meet peak demand is in many cases not the most cost-effective option, as the nominalcapacity of the new grid assets is used only a few hours per year. Moreover, while the installation ofadditional generation capacity is a question of months, it can take several years to install additional

20 April 2015 154A report to The European Commission
Study on the effective integration of Distributed EnergyResources for providing flexibility to the electricity system
grid lines. Contracting DER flexibility should be included among DSOs’ options in the planning phaseas an alternative to grid reinforcements.
9.2 Distributed Energy Resources can provide flexibility
DER flexibility options are already available. Plenty of (theoretically) controllable demand, storageand generation units are connected to distribution grids. A key precondition for uncapping theirflexibility potential is appropriate communication infrastructure, which in many cases is becomingavailable due to parallel developments (e.g. roll-out of smart meters). Numerous pilot projects are on-going and their return of experience is expected to further reduce the implementation costs of DERflexibility.
Technological evolutions are reducing the cost of DER flexibility. The Levelised Cost ofElectricity (LCOE) from VRES and of distributed storage decreases constantly. Manufacturersincreasingly provide built-in smart functionalities into power assets. Economies of scale are expectedto drive down device costs (e.g. costs of electric vehicles; batteries etc.) and the on-goingstandardisation in Europe is expected to reduce transaction costs due to lack of interoperability.
Cost-effectiveness of DER flexibility is on the rise overall. On-going evolutions in the electricity,transport and heat sectors are leading to the deployment of infrastructures which enable DERflexibility and reduce implementation costs:
■ The deployment of EVs and charging infrastructure (driven by transport policy incentives)provides part of the enabling infrastructure for activation of EV flexibility.
■ The deployment of smart meters (driven by policy decisions), is laying the foundations ofthe enabling infrastructure for activation of demand flexibility.64
■ The deployment of smart home devices, mainly driven by domotics market developmentsand the internet of things (IOT) is supporting the activation of demand flexibility, particularlyat residential level (e.g. via smart thermostats).65
The potential value of DER flexibility is expected to increase as VRES penetration increases.The supply will become more volatile as VRES shares are increasing and conventional powergeneration is replaced. The more volatile supply will lead to larger price volatility strengthening thebusiness case for provision of flexibility.
The value of flexibility will vary both across time and space. In many markets the marginal valueof flexibility is low since there are still significant amounts of relatively cheap central flexible resourcesavailable. In those markets it will be more difficult for flexible DER to be competitive. The value offlexibility changes for the different operational instances, depending on the instantaneous penetrationlevels of VRES. High instantaneous VRES levels often relate to a higher instantaneous value offlexibility. Further, the grid is a key enabler for the access to cheap flexibility. In case of gridbottlenecks, the value of flexibility is expected to variy geographically in each node.
64 It should also be recognized that not all types of demand flexibility will require smart meters.65 Some business models for flexibility are expected to build on appliances and equipmentcommunicating via IOT communication infrastructure, even before the implementation of dedicatedsmart metering infrastructure.

20 April 2015 155A report to The European Commission
Study on the effective integration of Distributed EnergyResources for providing flexibility to the electricity system
Electricity customers will be central for realizing DER flexibility. The electricity customers are incontrol over demand response, and by turning into prosumers they will also have access togeneration. The institutional framework should set adequate incentives to activate their provision offlexibility.
The aggregator role is crucial for enabling DER flexibility. Aggregators already play a key role tofacilitate market integration of DER flexibility in aggregated portfolios. This allows creating economiesof scale which reduce the costs of marketing DER. Moreover, aggregators are expected to play anincreasingly important role in marketing distributed generation, especially as feed-in tariffs start fadingaway. A competitive regime and a place for independent aggregators in organized markets is needed.The market places and design should resolve solution of conflicts that may arise with other marketparticipants (e.g. actions incurring imbalances on third party market participants, etc.).
9.3 There are still barriers for Distributed Energy Resources
The full potential of demand response will not be realized without further action from national policy-makers, regulators and energy companies. The existing EU policy and regulatory framework makesflexibility from DER possible, but several barriers remain.
The market value for flexibility (at system level) is currently low. The market value of flexibility isat present not always sufficient to cover needed investment and operational costs. However, the valueat system level is expected to grow with the growth of VRES. Therefore, provided that there is anappropriate market design, a current low market value is not a reason to give DER specific support.
Inadequate market design and price regulations distort price signals for the value of flexibility.A market model will always be a simplification of the real system. It is therefore necessary to strike abalance between an accurate representation of the system and a transparent market model.Examples for the geographical representation are the size of bid zones or use of nodal pricing. Thetemporal resolution comprises the length of imbalance settlement period. Changes in the marketdesign could contribute to revealing the value of flexibility.
The current market design has been built up based on the needs of central generators. Centralgenerators have been, and still are, vital to the power system and markets have to a large extent beenadapted to their needs. Examples include bid size, gate closure times and other product definitions.Regulatory changes to facilitate market inclusion of DER are however being pursued, for examplethrough decreases in minimum bid sizes and bid increments and active measures from some TSOs toinclude DER in providing balancing services.
Local needs for flexibility can only be resolved by local provision of flexibility. This indicates aneed for local markets, or other local procurement mechanisms. Local markets may easily becomehighly concentrated creating challenges related to liquidity and market power. Individual resourceproviders could have a significant impact on the (shadow) value of flexibility, leading to situationswhere the market price ex-post is not sufficiently high. Energy storage schemes can be used toalleviate local grid congestions, and is already deployed in some regions (example with Italy and Enelcan be found on page 40).

20 April 2015 156A report to The European Commission
Study on the effective integration of Distributed EnergyResources for providing flexibility to the electricity system
Taxes and tariffs may constitute a barrier for DER flexibility. If charging of storage is regarded asconsumption, energy taxes may be levied upon the charging, potentially undermining the businesscase. Storage may also need both a consumption and generation agreement with the network owner,again increasing the costs for storage. Where net metering is applied over a longer time period, e.g. ayear, the prosumer’s net purchase is regarded as its total purchase. In this case, price signals are nottaken into account which might hinder provision of flexibility. A balance should be achieved betweendeployment of net metering for the promotion of small-scale generation, and appropriate incentives forflexibility provision by market signals.
The economic regulation of grid operators often lacks appropriate incentives for the use ofDER flexibility, in particular an optimal choice between OPEX and CAPEX. DER flexibility can beused to replace current or future grid reinforcements (driving CAPEX), but may increase OPEX. This isparticularly difficult to address when current OPEX increases in order to reduce future CAPEX.
The value chains interact with each other and give rise to conflicting interests. Conflicts areanticipated in both the deregulated and regulated sectors of the power market. The conflictinginterests relate sometimes to financial conflicts, but also to the need for coordination in order to avoidaggravated actions, for example in DSO and TSO real-time operation.66
The procurement of flexibility will vary in both planning horizon, and procurement mechanism.As different provisions of flexibility will be activated with different frequencies, and thus remunerateddifferently, the need for different trading horizons and products is needed. The same underlyingflexibility provision could (theoretically) be procured for several different services, indicating the needfor procurement coordination.
66 For example, in situations when the needs for flexibility at system and at local level are in oppositedirection: e.g. downward regulation need at system level and upward regulation at local level. in thiscase an activation of local DER flexibility would serve conflicting needs of TSOs and DSOs

20 April 2015 157A report to The European Commission
Study on the effective integration of Distributed EnergyResources for providing flexibility to the electricity system
10 Recommendations
10.1 Flexibility needs adequate markets and remunerations
The market model needs to adequately represent the system in geography. Market areas shouldbe defined according to the physical operation of the grid and the available grid capacity. This is notnecessarily congruent with national borders. In the future, local markets might be needed to uncapflexibility at distribution level.
The market model needs to adequately represent the system in time. Many European marketshave imbalance settlement periods of one hour. This might not be enough to reveal the value offlexibility services. The market model should capture all relevant flexibility products, and trade with anappropriate delivery (and planning) horizon.
Markets need to be liquid. With smaller bidding zones (related to geographical aggregation ofdemand and supply) the risk for illiquid markets increases. Such a geographic partitioncombined to shortening of imbalance settlement periods may lead to increased administrativeand computational burden on market participants and stakeholders, thus reducing the liquidityof certain products. For very local services it is unlikely that liquid markets can be developed, e.g. tosolve network problems in a DSO network. In those cases it will rather be the DSO using directprocurement of certain services under regulatory oversight. Options include tendering and bilateralagreements, as well as technological requirements on equipment. These options do not reveal themarket value for the services provided, and should not be used more than necessary. The actualmarket design will need to be carefully balanced between representation and complexity, andthere is no one-fits-all model.
Regulation based on TOTEX is recommended to provide appropriate incentives for the use of“smarter” solutions. The regulation should focus on total costs (TOTEX) rather than capital cost(CAPEX) and operational costs (OPEX) separately. The DSO would then be free to decide onapproaches that could either affect CAPEX or OPEX, such as to use DER to solve network relatedproblems rather than investing in additional network infrastructure.
Capacity payments might be needed in some cases. If services are needed with relatively lowfrequency or that cannot be supplied by a liquid supply side, capacity payments might be needed. Thisis in particular likely to be the case when a service is indispensable and there are severeconsequences if the service is not provided. DER should have access to those services on equalterms as other resources, without unjustified limitations. To solve problems that occur frequently andfor which there is a liquid supply side, the need for holding reserves is limited and continuous energypayments should be sufficient.
Regulators have to ensure neutrality and transparency. DSOs should be motivated to use moretargeted approaches, e.g. different bilateral arrangements. DSOs should analyse the specific needsand conditions for different services in order to apply the appropriate procurement mechanism as wellas to provide justification to regulators. One of the challenges is to formulate the DSO regulation suchas to ensure that the profit from avoided costs is shared between DSOs and flexibility providers, whileensuring DSO neutrality.

20 April 2015 158A report to The European Commission
Study on the effective integration of Distributed EnergyResources for providing flexibility to the electricity system
Network tariffs need to reflect the needs of the specific grid. The DSOs should be allowedflexibility in designing the tariffs in order to find the solutions that best meet the local needs andprovide the proper incentives, subject to non-discriminatory rules. DSOs are likely to have betterinformation than regulators on how tariffs can be optimally designed in individual networks. Optimalregulation would therefore imply that the regulation focuses on the overall revenue cap rather thanindividual prices/tariffs. We recommend regulators and policy makers not to regulate detailed tariffs,but limit this to a possibility of reviewing whether tariffs are non-discriminatory.
Price pass-through is needed. Regulators and policy makers are recommended to avoid regulatorymodels that prevent price pass-through to market participants. A concrete example would be feed-intariffs when the true marginal cost exceeds market prices, leading to a suboptimal operation of thesystem. Feed-in tariffs hide this negative margin as producers are not exposed to the true marketprices but rather only to the feed-in tariff.
In order to facilitate for flexibility provisions from prosumers it is recommended to includeprice signals in net metering. Net metering without flexibility price signals hide the value of flexibility,since the temporal variation in prices within the net metering period effectively is removed. While netmetering may be an effective measure to support the deployment of distributed generation, it may atthe same time remove incentives to provide flexibility. Net metering could be applied in different ways,e.g. over different time frames and covering different parts of the overall energy cost (grid, energysupply, taxes). In order to support provision of flexibility from distributed generation, regulators andpolicy makers should avoid regulatory models that prevent price pass-through to market participants.For instance, including price signals in the net summation could allow for activation of flexibility.
The TSO should ensure that imbalance price signals are not distorted and market designallows all different kinds of providers to participate on the balancing market. For example,capacity payments for balancing resources should be reflected in the price of balancing energy (i.e.cost for imbalances) rather than socialized via the transmission tariff. TSOs should design costallocation mechanisms in a way that ensures that capacity payments are reflected in the price ofbalancing energy. The cost allocation should be harmonized with the relevant imbalance settlementperiod to the largest extent possible. Market rules and product definitions are in many cases reflectingthe needs and requirements of traditional centralized flexible resources, hindering the participation ofDER. Some important examples are:
■ Minimum bid size and bid increments should facilitate balancing market access forDER. The recommendation towards TSOs is to work towards a goal of lowering minimumbid sizes and bid increments. Furthermore, we recommend that regulators should considerintroducing regulatory requirements on the TSOs, in particular if this process is slow.
■ Activation rules should facilitate demand side participation. Demand side participationis sensitive to activation rules such as activation time, duration and frequency. While suchrules naturally need to reflect the system requirements, the rules could in many cases beadapted to facilitate market access for demand side resources. If longer activation periods(duration) or a higher frequency is needed than what might be suitable to demand sideresources, the demand side resources could be divided in groups so that only a part of theavailable resources are activated each time. The unused resources could then be used tostretch the activation periods or increase activation frequency. The recommendation is that

20 April 2015 159A report to The European Commission
Study on the effective integration of Distributed EnergyResources for providing flexibility to the electricity system
the TSOs should design activation rules in ways that facilitate demand side participation,e.g. avoid too long activation periods for individual demand side resources. The TSOsshould be required to analyse the impact on demand side participation of participation rulesin different markets, and ensure a level playing field.
10.2 Regulators have to establish a level playing field for all actors
In the transformation of the traditional power market the regulator needs to ensure a levelplaying field for both the existing and new market participants. The biggest changes compared tothe traditional model are anticipated to be for aggregators, TSOs and DSOs. A level playing fieldensures that the most competitive resource has access to relevant markets and products.
Aggregators
The aggregator role and responsibilities in many cases need to be further clarified. Aggregatorsare important in order to activate the full potential of DER, both on the demand side and for distributedgeneration. While facilitating market access for aggregators is important, all market participants needto be responsible for the consequences they have on the system. Any actions or transactions done byaggregators should not affect third party, both in terms of volumes and monetary terms. If a certainprovision affects a third party it should be ensured that the affected party is informed, and if applicableany effect should be corrected for ex-post. The need for coordination between different marketparticipants will differ depending on whether it relates to non-energy or energy resources supplied, aswell as to whether it delivers services to the regulated or unregulated market.
The TSO (or possibly DSO) should open for possibilities to revise the ex-post settlementprocess. In order to provide ancillary services (balancing or congestion management), the TSO/DSOneeds to revise ex-post settlement processes in order not to financially penalize (or remunerate) thirdparty market participants. This flexibility from end-consumers has already been deployed (Austrianfrequency containment reserve and water heaters), indicating that balancing resources is in generalsimpler since they don’t affect third party market participants.
Aggregators need balance responsibility for market participation. They can either be a BRPthemselves or have an agreement with a BRP. This implies that if an aggregator is working with anend-user that has a third party supplier, it is necessary to either be able to separate the balances orthat the aggregator obtains an agreement with the supplier/BRP of the customer.
We recommend licensing of aggregators, similar to today’s licensing of balance responsibleparties. It is important that the licensing or certification requirements of aggregators are kept at theminimum level, in order not to create unnecessary entry barriers.
DSO & TSO
It is necessary to develop an institutional arrangement that facilitates coordination between theDSO and TSO. This could possibly be a platform for bid exchange and activation. DSO grid operationis expected to become more complex, increasing the need for active operation similar to thetransmission grid operation as per today. The DSO’s actions might affect the TSO’s operations, thus

20 April 2015 160A report to The European Commission
Study on the effective integration of Distributed EnergyResources for providing flexibility to the electricity system
indicating the need for coordination between the DSO and TSO. Some services require actions fromboth TSO and DSO simultaneously.
A potential conflict between the DSO and TSO will need to be resolved subject to physicalconstraints. To this end a clear regulatory framework should be designed to handle conflictingphysical needs. It is important to distinguish between competition for the same flexibility provision,which should be resolved based on the willingness to pay (market-driven resolution of the conflict),and contradicting physical needs (resolution of the conflict according to what is optimal from atechnical point of view).
Energy storage schemes
Tax exemptions should be extended to all energy storage consumption. Tax exemptions, similaras for e.g. large scale hydro pumped storage, would reduce the wedge and facilitate for distributedstorage. We recommend policy makers/regulators to exempt distributed storage facilities fromconsumption tax on electricity, in order to avoid creating wedges undermining the profitability ofstorage solutions and ensuring a level playing field.
Storage should not be double charged for consumption and generation subscription fees.Storage may also face barriers created by the design of network tariffs, by having to pay subscriptionfees both for consumption and generation. This could be the case both for large scale storage anddistributed storage. While storage naturally should pay for the costs it causes to the network, it iscounter-productive to charge double network fees. We recommend network operators (DSOs andTSOs) as well as regulators to avoid charging both consumption and generation subscription fees tostorage, unless it can be clearly motivated what costs that the storage causes in the network. In thecase where the DSO is using energy storage schemes for alleviating grid congestion there is need fora further development of the regulation, in order to ensure that a level playing field is maintained andto avoid any competition distortion.
10.3 The future is consumer centric
Traditional power markets are expected to be transformed into more consumer centric markets. Theneed for and willingness to pay for electricity originates from the consumers of electricity, thus theemphasis should be on consumers rather than central suppliers. The central suppliers of electricity willneed to adapt to the needs and terms of the consumers. This will be further accelerated in a systemwhere distributed energy resources are well-established participants, and the consumer’s role willgrow stronger with the introduction of e.g. demand response.
The customer must be in control of its metering data. Third party solution providers should havepermission from the customer to access the data. There are different approaches to data handling(e.g. central data and service hubs, peer-to-peer etc.), which have their pros and cons. Whateversolution is chosen it is important that data access is easy for third party providers and that potentiallydiscriminatory behaviours from incumbents are prevented.
Grid operators should use existing communication infrastructure whenever possible. Whileadvanced metering in general is important for settlements, there are other opportunities than using theofficial meters. Sensors, control and communication equipment e.g. using internet infrastructure can

20 April 2015 161A report to The European Commission
Study on the effective integration of Distributed EnergyResources for providing flexibility to the electricity system
often be cost efficient, as long as they do not pose a threat to the system security. Therecommendation to DSOs, TSOs and regulators is to use existing communication infrastructure andprocedures whenever possible, and to be open to adapt processes in order to harvest the full potentialfrom all providers of flexibility. Specific recommendations on which actor should decide whether acertain metering technique is eligible cannot be made, but depends on which flexibility provision andproduct that is delivered. The user of the flexibility provision is to determine whether the specificmetering technology is sufficient and most efficient. The Austrian Frequency Containment Reserveexample with the water heaters once again can be used as an example where cellular SMS-technology for communication and activation is used.
Requirements on data handling have to be non-discriminatory. This implies that regulators mustput up sufficiently stringent requirements ensuring that actors responsible for data management (e.g.DSOs, central data hubs, etc.) make necessary data available with high reliability. For instance, itshould be possible to access data without delays, i.e. due to manual handling of requests, downtimeof IT-systems or similar barriers.

20 April 2015 162A report to The European Commission
Study on the effective integration of Distributed EnergyResources for providing flexibility to the electricity system
11 References
ACER/CEER (2013). Annual Report on the Results of Monitoring the Internal Electricity and NaturalGas Markets in 2012, Joint publication of ACER and CEER, November 2013
Ackerman, T., & Knyazkin, V. (2009). Interaction between distributed generation and the distributionnetwork: Operation aspects. Yokohoma,Japan: IEEE Transmission and distribution conference andexhibition , Asian Pacific.
Ackermann, T., Andersson, G., & Soeder, L. (2001). Distributed generation: a definition. Electric powersystems research, 195-204.
BDEW. (2013). Einschätzungen und Empfehlungen zu zukünftigen strommarktrelevantenAnforderungen an Flexibilität. Berlin: Bundesverband der Energie- und Wasserwirtschaft e.V.
BET. (2013). Möglichkeiten zum Ausgleich fluktuierender Einspeisungen aus erneuerbaren Energien.Study for the German association for renewable energies (BEE).
Bhatnagar, D., A. Currier, J. Hernandez, O. Ma and B. Kirby (2013), Market and Policy Barriers toEnergy Storage Deployment, Sandia Report, Sandia National Laboratories, September 2013
Bundesministeriums der Justiz und für Verbraucherschutz und Juris GmbH. (2012, 12 28).Verordnung über Vereinbarungen zu abschaltbaren Lasten. Retrieved 7 10, 2014, fromhttp://www.gesetze-im-internet.de: http://www.gesetze-im-internet.de/bundesrecht/ablav/gesamt.pdf
Bundesverband Erneuerbare Energien, Arbeitsgemeinschaft Fernwärme. (2013). Flexibilitätsreservenaus dem Wärmemarkt.
Coster, E. J. (2010). Distribution grid operation including distributed generation. Eindhoven: EindhovenUniversity of Technology.
Damsgaard, N., M. Lindén, K. Yuen, J. Helbrink, M. Andersson, M. Einarsson, J. Munkhammar, P.Grahn (2014). Framtida krav på elnäten. Elforsk report 14:26
Deutsche Energie Agentur. (2012). Ausbau- und innovationsbedarf der Stromverteilnetze inDeutschland bis 2030. Berlin: DENA.
ECOFYS. (2008). Study on the comparative merits of overhead electricity transmission lines versusunderground cables. Study commissioned by the Department of Communications, Energy and NaturalResources of Ireland. Retrieved September 2011, fromhttp://www.dcenr.gov.ie/NR/rdonlyres/89F75A41-0E32-4F70-B34E-5477E936B4D2/0/Independentstudytransmissioninfrastructure.pdf
ECOFYS. (2011). Lastfolgefähigkeit deutscher Kernkraftwerke, im Auftrag des DeutschenBundestages. vorgelegt dem Büro für Technikfolgen-Abschätzung beim Deutschen Bundestag (TAB),nicht veröffentlicht.
ECOFYS. (2012). Einspeisemanagement in Schleswig - Holstein. Retrieved 7 04, 2014, fromhttp://www.schleswig-holstein.de/Energie/DE/Energiewende/Kosten_Energiewende/einspeisemanagement_endbericht_pdf__blob=publicationFile.pdf
ECOFYS. (2013). Heat pump implementation scenarios until 2030. Study for the European HeatPump Association.
ECOFYS. (2013). Incentives to improve energy efficiency in EU grids. Berlin: Ecofys.

20 April 2015 163A report to The European Commission
Study on the effective integration of Distributed EnergyResources for providing flexibility to the electricity system
ECOFYS CPI Berlin, TU Wien. (2011). Network extension requirements for an enhanced RESdeployment. RE-Shaping: Shaping an effective and efficient European renewable energy market.Authors Nabe, Christian; Neuhoff, Karsten; Boyd, Rodney; Papefthymiou, Georgios; Ortner, Andre,Kar. Retrieved from http://www.reshaping-res-policy.eu/downloads/Re-Shaping_D13_Network_extension_requirements_final.pdf
ECOFYS; TU Dresden; Energy Brainpool. (2012). Preisauswirkungen der Erneuerbaren Energien aufden deutschen Strommarkt. Endbericht Konsortium 2.
ECORYS. (2014). The roles of DSOs in a smart Grid enviroment. Amsterdam/Rotterdam: ECORYS.
Ernst & Young. (2013). Kosten-Nutzen-Analyse für einen flächendeckenden Einsatz intelligenterZähler. Study for the German Federal Ministry of Economic Affairs.
Eurelectric. (2013). Active distribution system management : A key tool for the smooth integration ofdistributed generation. Retrieved 6 2, 2014, fromhttp://www.eurelectric.org/media/74356/asm_full_report_discussion_paper_final-2013-030-0117-01-e.pdf
Eurelectric. (2014). Flexibility and aggregation. Retrieved 6 1, 2014, fromhttp://www.eurelectric.org/media/115877/tf_bal-agr_report_final_je_as-2014-030-0026-01-e.pdf
Eurostat (2014). Supply, transformation, consumption - electricity - annual data (nrg_105a)
European Commission. (2013). Incorporing demand side flexibility, in particular demand response, inelectricity markets. Commision staff working document, Brussels.
European Commission (2014). Energy prices and costs report, Commission Staff Working DocumentSWD(2014) 20 final/2, 17 March 2014
Fraunhofer ISI. (2011). Energietechnologien 2050 - Schwerpunkte für Forschung und Entwicklung.Stuttgart: BMWi.
Fraunhofer UMSICHT. (2009). Technologien und Kosten der Biogasaufbereitung und Einspeisung indas Erdgasnetz -Ergebnisse der Markterhebung 2007 – 2008. Fraunhofer-Institut für Umwelt-,Sicherheits- und Energietechnik UMSICHT Ergebnisse der Markterhebung 2007 – 2008.
Fuchs, G., Lunz, B., Leuthold, M., & Sauer, D. (2012). Technology Overview on Electricity Storage:Overview on the potential and on the deployment perspectives of electricity storage technologies. Onbehalf of Smart Energy for Europe Platform GmbH (SEFEP). ISEA RWTH Aachen.
Gerwent, R. v. (2006). Distribution generation and renewables : introduction. Leonardo Energy.
Hirth, L., & Ziegenhagen, I. (2013). Control Power and Variable Renewables. FEEM Working paper.
Holttinen, H., Tuohy, A., Milligan, M., Lannoye, E., Silva, V., Muller, S., & Soder, L. (2013,November/December ). The flexibility workout: Managing variable resources and assessing the needfor power system modification. IEEE Power & Energy Magazine.
Hundt, M., Barth, R., Sun, N., Wissel, S., & Alfred, V. (2009). Verträglichkeit von erneuerbarenEnergien und Kernenergie im Erzeugungsportoflio, Technische und ökonomische Aspekte. Studie desIER im Auftrag von E.On.
IEA. (2008). Empowering variable renewables - options for flexible electricity systems. InternationalEnergy Agency. Retrieved fromhttp://www.iea.org/publications/freepublications/publication/name,3779,en.html

20 April 2015 164A report to The European Commission
Study on the effective integration of Distributed EnergyResources for providing flexibility to the electricity system
IEC. (2011). Electrical Energy Storage. Fraunhofer ISE. Annex A features Overview technical data forEES.
IRENA. (2012). Electricity Storage and Renewables for Island Power: A Guide for Decision Makers.s.l. : IRENA.
Lannoye, Flynn and O'Malley. (2012). Evaluation of Power System Flexibility. IEEE Transactions onPower Systems, 27 (2):922-931.
North American Electric Reliability Corporation. (2010). Flexibility requiements and potential metricsfor variable: implications for system planning studies. NERC.
Rocky Mountain Institute. (2014). The economics of grid defection when and where distributed solargeneration plus storage competes with traditional utility service. Rocky Mountain Institute.
Schill, W.-P. (2013). Systemintegration erneuerbarer Energien: Die Rolle von Speichern für dieEnergiewende. Vierteljahreshefte zur Wirtschaftsforschung DIW Berlin.
SEDC (2014), Mapping Demand Response in Europe Today. Smart Energy Demand Coalition, April2014
Seebach, D., Timpe, C., & Bauknecht, D. (2009). Cost and benefits of smart appliances in Europe.Öko-Institut e.V.
Sioshansi, R., P. Denholm and T. Jenkin (2012). Market and Policy Barriers to Deployment of EnergyStorage, Economics of Energy & Environmental Policy, Vol. 1, No. 2
Steffen, B. (2011). Prospects for Pumped-Hydro Storage in Germany, EWL Working Paper No.07/2011, Universität Duisburg Essen
SUFG. (2013). Utility Scale Energy Storage Systems. Benefits, applications and technologies. StateUtility Forecasting Group.
Troy, N., Flynn, D., Milligan, M., & O'Μalley, M. (2012). Unit commitment with dynamic cycling costs.IEEE Transactions on power systems, 2196-2205.
WECC. (2011). Electricity Markets and Variable Generation Integration. Western ElectricityCoordinating Council.
Wieben, E., Kumm, T., Hohn, E., Rohr, M. Stadler, M. (2014). The 5% Approach as Building Block ofan Energy System dominated by Renewables. Proceedings of the 28th EnviroInfo 2014 Conference,Oldenburg, Germany.
Zhou, C., Qian, K., Allan, M., & Zhou, W. (2011). Modelling of the cost of EV battery wear due to V2Gapplication in power systems. IEEE Transactions on Energy Conversion, 26(4), 1041-1050.

20 April 2015 165A report to The European Commission
Study on the effective integration of Distributed EnergyResources for providing flexibility to the electricity system
APPENDIX

20 April 2015 166A report to The European Commission
Study on the effective integration of Distributed EnergyResources for providing flexibility to the electricity system
Technological fact sheets
DERs can provide different services to mitigate the local and the global flexibility gap depending ontheir specific techno-economic characteristics. The following factsheets allow a comprehensiveoverview and comparison of such key characteristics:
■ Reaction time: Flexibility is needed on different timescales. While frequency controlrequires immediate reaction in milliseconds, adjustments on planning stage only requirechanges after several hours or even days. Reaction time describes how fast a technologycan react to flexibility needs.
■ Efficiency: is especially important in order to compare the cost-effectiveness of differentflexibility options. The number describes the ratio between energy input and output of aflexibility source.
■ Investment costs: All sources of flexibility require initial investments. The given numbersdescribe the investments that are needed to upgrade existing technologies so they canprovide flexibility to the system. If the technology’s only purpose is the provision of flexibility,the full investment costs are taken into account.
■ Variable costs: Variable costs give information about the costs of energy that can beprovided to the system. In the case of demand technologies, these costs represent theopportunity costs of consumption.
■ Installed capacity: Some of the flexibility options have already proven their services. Theinstalled capacity gives an estimation of existing flexibility capacity in the EU-28.
■ Lifetime: Most flexibility options require technical equipment which wears off. Lifetimedescribes the average lifetime under “normal” usage.
■ Flexibility constraints: The maximum energy content, the maximum period of shifting andpotential recreation times provides information about technical flexibility constraints.
■ Maturity of technology: Many technical options have proven their flexibility, others are onlyused in pilot projects. Information about the maturity of the technology is given in thiscategory.
■ Environmental impacts: gives information about environmental issues that mightaccompany the usage of the flexibility option under consideration.

20 April 2015 167A report to The European Commission
Study on the effective integration of Distributed EnergyResources for providing flexibility to the electricity system
Biogas power plants
Efficiency Electrical efficiency of motors:33% to 40%
Reactiontime
On-off withinseconds.
Investmentcosts
Investment costs range from3000 €/kW (big installations) toabove 6000 €/kW for smallinstallationsLevelised costs of flexibility(investment in storage andextension of CHP engine andgenerator): 1.5 – 2.5 ct/kWhel,
Variablecosts
Production costbiogas: 12 – 25ct/kWhel
Cost for biogasupgrading to naturalgas quality and bio-methane injection: 1.5– 2.5 ct/kWhel
Installedcapacity EU-27: ~ 22 GW in 2011 Lifetime
Installations: 20years, Generator andengine are usuallyretrofitted after 12years
Flexibilityconstraints
Typical storage capacities of produced biogas are 3-6 hours. Storagecan be enlarged to 12 hours. Additional capacity is possible but limitedby volume and technology (low pressure storage). Biogas injection intothe natural gas grid offers huge storage capacities.
Maturity oftechnology
The technology is well developed. About ten thousand biogas plantsare in commercial operation in Europe. Biogas upgrading and gridinjection is well developed with about 100 commercial plants inoperation.
Environmentaleffects
Very limited: methane is a potent greenhouse gas, H2S emissions canbe toxic, accidents from digester leaks are very rare.Ramps and part load operation might lead to higher emissions.An environmental advantage is avoided emission by manure treatment(manure emits methane during storage)
Barriers
Economic barriers: Biogas production is expensive compared to otherelectricity generation.Technical barriers: For flexible operation, additional storage capacityhas to be installedPolitical barriers: Biogas needs governmental support systemsbecause electricity production for some options is too expensive forcompetitive electricity wholesale markets. Also use of bio energy meetspublic opposition due to possible impacts to food prices.
Potential role Biogas offers a renewable energy option with promising flexibilityoptions for application on local and global level.

20 April 2015 168A report to The European Commission
Study on the effective integration of Distributed EnergyResources for providing flexibility to the electricity system
Combined Heat and Power
Efficiency
Electric: 15% (micro CHP) –46% (CCGT-CHP)Thermal: 81% (micro CHP) –42% (CCGT-CHP)Total: 96% (micro CHP) –88.4% (CCGT-CHP)
Reaction time
Warm start:5 min (smallinstallations) to 3hours (CCGT)Cold start: 5 hours(CCGT)Hot start: 50 – 85min (CCGT)
Investmentcosts
Approximate investmentcosts for heat storage: 9,5 –24 €/kWel per year
Variable costs
Ramping costs:Micro CHP: 20€/MWhMini CHP: 28€/MWhCCGT CHP: 3€/MWh
Installedcapacity EU-27: 134 GW CHP Lifetime 20 – 40 years
Flexibilityconstraints Maximum period of shifting: 4 – 12 hours
Maturity oftechnology Established technology in most European markets
Environmental effects No additional effects of flexibility provision
Barriers
Economic barriers: Reduced efficiency compared to electricity onlyplants, additional investment in heat storage, fluctuations in heat supplyTechnical barriers: higher abrasion due to ramps, electrical operationhighly constraint because of thermal duties
Potential roleCHP is politically supported because of its high energy efficiency.Equipped with heat storage and the necessary control infrastructure,distributed CHP can provide the same services as central thermal powerplants.

20 April 2015 169A report to The European Commission
Study on the effective integration of Distributed EnergyResources for providing flexibility to the electricity system
Variable renewable energy sources
Efficiency N/A Reaction time 100%/min
Investment costsNo technical upgradeneeded, only controlinfrastructure
Variable costsOpportunity costsfor selling electricityon wholesalemarkets
Installed capacityEU-28: ~ 106 GW wind,~ 69 GW solar PV in2012 (Eurostat)
LifetimeWind turbines: 20 –25 years (EWEA),PV: 30 – 40 years(BSW Solar)
Flexibilityconstraints
Up-regulation only to the potential generation capability at thegiven time.
Maturity oftechnology Established technology, further improvement expected
Environmentaleffects
“Wasted” energy might be replaced by other moreenvironmentally harmful generation (e.g. thermal generation)
Barriers
Economic barriers: opportunity costs due to lost production,depending on the payment for generation, curtailed installationshave to be compensated, high technical and administrative effortfor pooling small unitsTechnical barriers: Specific technical equipment is needed tocontrol installations remotelyPolitical challenges: Lack of public acceptance (wasting “free”electricity)
Potential role
Due to marginal cost of zero, active power control can be used asa cost effective ancillary service like providing negative reservecontrolReduction of peaks in production due to a small level ofcurtailment can decrease the need of additional grid capacityWith high penetration levels, active power control can solve theproblems in balancing the power system due to high feed in ofVRES .
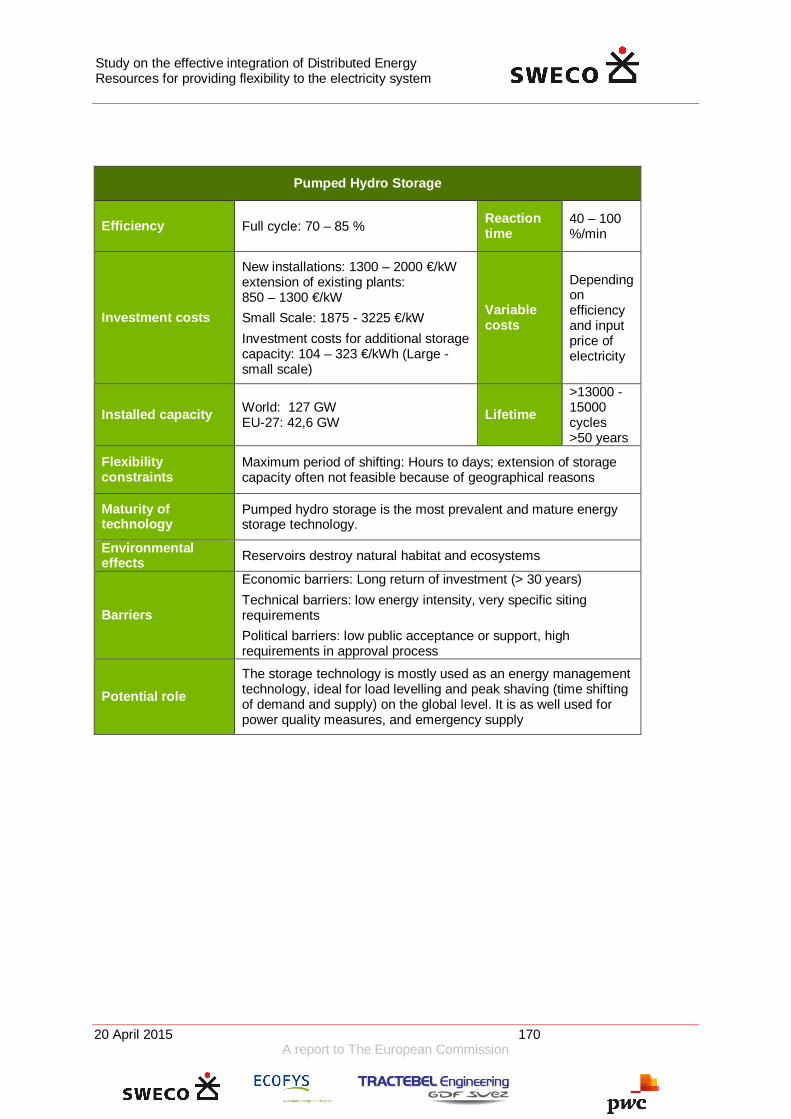
20 April 2015 170A report to The European Commission
Study on the effective integration of Distributed EnergyResources for providing flexibility to the electricity system
Pumped Hydro Storage
Efficiency Full cycle: 70 – 85 % Reactiontime
40 – 100%/min
Investment costs
New installations: 1300 – 2000 €/kWextension of existing plants:850 – 1300 €/kWSmall Scale: 1875 - 3225 €/kWInvestment costs for additional storagecapacity: 104 – 323 €/kWh (Large -small scale)
Variablecosts
Dependingonefficiencyand inputprice ofelectricity
Installed capacity World: 127 GWEU-27: 42,6 GW Lifetime
>13000 -15000cycles>50 years
Flexibilityconstraints
Maximum period of shifting: Hours to days; extension of storagecapacity often not feasible because of geographical reasons
Maturity oftechnology
Pumped hydro storage is the most prevalent and mature energystorage technology.
Environmentaleffects Reservoirs destroy natural habitat and ecosystems
Barriers
Economic barriers: Long return of investment (> 30 years)Technical barriers: low energy intensity, very specific sitingrequirementsPolitical barriers: low public acceptance or support, highrequirements in approval process
Potential roleThe storage technology is mostly used as an energy managementtechnology, ideal for load levelling and peak shaving (time shiftingof demand and supply) on the global level. It is as well used forpower quality measures, and emergency supply

20 April 2015 171A report to The European Commission
Study on the effective integration of Distributed EnergyResources for providing flexibility to the electricity system
Compressed Air Energy Storage
EfficiencyFull cycle:CAES: 40 - 50%AA-CAES: 60-75%
Reactiontime
Cold start: 5-15 minutesDischarging mode:10% / 3 secondsCharging mode:20% / min
Investmentcosts 720 – 1000 €/kW Variable
costsDepending on efficiencyand input price ofelectricity
Installedcapacity
Currently only 2installations 321 MW inGermany110 MW in US
Lifetime >10000 - 13000 cycles20 – 40 years)
Flexibilityconstraints
Maximum energy content: 8 – 20 hours, maximum period of shifting:hours to days
Maturity oftechnology
Low - Only two CAES systems exist in commercial operation, secondgeneration systems (advanced adiabatic) are under development.Smaller scale systems are also possible.
Environmentaleffects Cavern must be pressure tight to prevent leakage.
Barriers
Technical barriers: Geographical barriers: salt caverns and aquifersare less capital intensive than aboveground solutions (e.g. tanks), butthey require suitable sites.Economic barriers: High capital costs and long return on investment.
Potential role So far a large-scale application for medium-term energy storage, timeshifting, potential on distribution level not clear.

20 April 2015 172A report to The European Commission
Study on the effective integration of Distributed EnergyResources for providing flexibility to the electricity system
Flywheels
Efficiency 70-95% Reaction time Milliseconds
Investment costs 1500 – 1650 €/kW Variable costsDepending onefficiency andinput price ofelectricity
Installed capacity 0.002- 340 MW/unit Lifetime15 – 20 years20 000 – 70 000000 cycles
Flexibility constraints Maximum period of shifting: 0.25 hours
Maturity oftechnology Low
Environmental effects “Waste” of energy by efficiency losses
Barriers
Economic barriers: High investment costTechnical barriers: relatively high permanent ‘self-discharge’losses, safety concerns (cracks occur due to dynamic loads,bearing failure on the supports), cooling system forsuperconducting bearings
Potential roleFlywheels are often used to provide inertia in island systems.Applied as short term storage with frequent and intensivecycling, often used for stabilisation for weak grids, i.e. inertiaand frequency control, power quality

20 April 2015 173A report to The European Commission
Study on the effective integration of Distributed EnergyResources for providing flexibility to the electricity system
Batteries
Efficiency
Full cycle:Li-ion: 85 – 98 %Redox flow: 60 – 75 %Lead Acid: 75 – 90%NaS: 70 – 85%
Reactiontime < seconds
Investmentcosts
Li-ion:815 – 1165 €/kW(LCOE: 515-590 €/kWh)Lead Acid:1275 – 3675 €/kWRedox flow:1080 – 2775 €/kW
Variablecosts
Depending on efficiency andinput price of electricity
Installedcapacity Globally about 400 MW Lifetime
Lead Acid:< 3 – 15 years, 250 - 1500cyclesAdvanced lead acid:2200 – 4500 cyclesLi-ion:5 – 15 years, 500 – 10000cyclesNaS:10 – 15 years, 2500 – 4500cyclesRedox flow:5 – 20 years, 1000 - >10000cycles
Flexibilityconstraints
Maximum energy content: Lead acid: 4 – 5 hours, Redox flow: 5 hours;Maximum period of shifting: Minutes to weeks
Maturity oftechnology
NaS, and Ni-Cd batteries are all mature technologies with exampleapplications for energy storage for grids. Li-ion is often used inportable applications, but on utility scale level, it is still in development
Environmentalrisks
Recycling of chemical components after decommissioning, thermallyunstable metal oxide electrodes (Li-ion), acid could get out (Lead acid),explosion of hydrogen, poisonous lead
BarriersEconomic barriers: High investment costs with short lifetimes, someresources have been scarce, e.g. LithiumTechnical barriers: Stability of some batteries are a concern, NaS: hightemperature needed to keep salt molten (>300°C)
Potential role
Mainly small scale application at moderate level of VRES penetration.High potential for technical development and cost-reductionCould be used on distribution grid level, while pump storage and other“large scale” technologies work on the transportation grid levelLi-ion: High energy density, Power quality, Network efficiency, Off-Grid, time shifting, electric vehicleLead Acid: Off-Grid, Emergency supply, time shifting, power quality

20 April 2015 174A report to The European Commission
Study on the effective integration of Distributed EnergyResources for providing flexibility to the electricity system
Power to Gas
Efficiency
electricity to hydrogen:~60%hydrogen to methane: ~83%methane to electricity: ~60%Full cycle: 30-40%
Reactiontime Seconds to minutes
Investmentcosts
Currently at 3600 €/kW,1000 €/kW envisaged in2022; no additional cost forstorage in gas grid
Variablecosts
Depending onefficiency and inputprice of electricity
Installedcapacity Few MW Lifetime 10 – 30 years,
1000 – 10000 cycles
Flexibilityconstraints
Maximum period of shifting depends on the existing gas gridinfrastructure, weeks to months
Maturity oftechnology
A first MW-scale plant is currently running in Werlte in NorthernGermany.
Environmentalrisks
Direct incorporation of hydrogen into the gas grid can causeproblems
Barriers
Economic barriers: still high costs, technological innovationnecessaryTechnical barriers: low efficiency, external source of CO2 necessaryor extraction from the air (further reduction in efficiency)
Potential role
Seasonal storage, likely to be used in the transportation sector first.The technology raises the prospect of relying on 100% renewableresources by storing surplus electric power in the gas infrastructureand relying on natural gas power plants when VRES generation islow.

20 April 2015 175A report to The European Commission
Study on the effective integration of Distributed EnergyResources for providing flexibility to the electricity system
Electric Vehicles
Efficiency 93% Reaction time 100 %/min
Investment costs N/A Variable costsDepending onefficiency andinput price ofelectricity
Installed capacity 6.5 kW/vehicle (NissanAaltra) Lifetime
5-15 (dependingon the technicalprogress ofbatteries)
Flexibility constraintsMaximum energy content: 29 kWh/vehicle (Nissan Aaltra,depending on temperature), maximum shifting period: hours;flexibility depends on the behaviour and requirements of thecar’s driver
Maturity oftechnology
The maturity of batteries used in EVs is high. However, there islow experience with using fleets of EVs for flexibility provision.
Environmental effects The risks are related to the risks from the specific batteries usedin EVs
Barriers
Economic barriers: no business model (yet)Technical barriers: very few electric vehicles. Existence ofsufficient charging infrastructure. Communication and controlinfrastructure. Battery technology (low driving ranges, highbattery costs)Political barriers: low public acceptance for system use of EVs
Potential role Provision of balancing and reserve power. Also for solution ofmore localised problems.

20 April 2015 176A report to The European Commission
Study on the effective integration of Distributed EnergyResources for providing flexibility to the electricity system
Demand Response in industrial installations
Efficiency 95 - 100% Reactiontime 20 – 100%/min
Investmentcosts
No additional investment costs –communication infrastructure isgenerally installed.
Variablecosts
Depending onprocess, high valueof lost load ifproduction cannotbe shifted, but isonly reduced
Installedcapacity
On average, nearly 120 GW ofindustrial consumption in EU-27 Lifetime N/A
Flexibilityconstraints Maximum period of shifting without losing production: 1 – 24 hours
Maturity oftechnology
High, some industrial customers already provide interruptible loadson balancing markets
Environmentaleffects N/A
Barriers
Economic barriers: development of potential relies on electricity costsensitivity and on price spreads in the electricity market. In most ofthe European markets, overcapacity prevents price peaks. In most ofthe industrial entities, the high organisational effort is not worth thecost savings by shifting demand to low price hours.Technical barriers: potential barriers for specific implementations canbe uncertain potential, quality losses in products, short period ofshifting, structure of demand (efficient usage of production capacity).Political barriers: contradicting market incentives for constantdemand, e.g. grid fees.
Potential roleShort-term and cost-efficient solution, additional potential forcomplete shut-down in minutes, but at much higher costs (value oflost load)

20 April 2015 177A report to The European Commission
Study on the effective integration of Distributed EnergyResources for providing flexibility to the electricity system
Demand Response in commercial and domestic sector
Efficiency 95 – 100% Reactiontime 100%/min
Investmentcosts
Costs for controlinfrastructure
Variablecosts
Depending on processand customer
Installedcapacity
On average about 92 GWresidential demand, andadditionally about 92 GWfrom the service sector
Lifetime N/A
Flexibilityconstraints
Maximum period of shifting: 1 -24 hours, depending on process andcustomer
Maturity oftechnology Low, major loads have not yet been equipped with IT-infrastructure
Environmentaleffects N/A
Barriers
Economic barriers: Necessary investments in IT infrastructure and dataprocessing, few real time pricing tariffs available and market prices notvisible to retail level. Accessing kilowatt-level for pooling loads can bevery labour intensive, may have relatively high initial costs, and can takesubstantial resources to maintain, depends on the primary use of theequipment, which is not designed for flexible operationTechnical barriers: uncertain potential, missing communicationinfrastructurePolitical barriers: Lack of acceptance or support, data security issues,coordinating utility interests and consumer interests can be achallenging paradigm shift.
Potential roleDemand management might turn out to be the game changer inelectricity markets, when flexible demand sets the marginal price inwholesale markets.

20 April 2015 178A report to The European Commission
Study on the effective integration of Distributed EnergyResources for providing flexibility to the electricity system
Power to Heat
EfficiencyResistance Heating transfers 1 kWh ofelectricity to 1 kWh of heat. Efficient heatpumps with ground storage are up to 5times more efficient.
Reactiontime
100%/min
Investment costs Costs for control infrastructure Variablecosts very low
Installed capacity N/A Lifetime 15 – 20years
Flexibilityconstraints
Maximum period of shifting depends on the isolation of the building.It can be up to 24 hours. In general storage facilities are designedfor about two hours.
Maturity oftechnology High
Environmentaleffects
Barriers
Economic barriers: high costs for electricity if extracted from grid,especially for resistance heating (taxes and levies, grid fees).Efficiency of heat pumps a driver for their implementationTechnical barriers: constrained due to primary operation(temperature limits), efficiency dependent on ambient airtemperatures, use limited to specific period of the yearPolitical barriers: fees, taxes, levies
Potential role
The electrification of the heat sector shifts demand from the heat tothe power sector, and can simultaneously add significant flexibilityto the system. Combining thermal storage with electric heat has thepotential to vastly increase the flexibility of the power grid, builds anoptional place to put temporary surpluses of power from VRES, andreduce carbon by displacing fossil-fuel heat sources.

20 April 2015 179A report to The European Commission
Study on the effective integration of Distributed EnergyResources for providing flexibility to the electricity system
About Sweco
Sweco’s experts are working together to develop total solutions that contribute
to the creation of a sustainable society. We call it sustainable engineering and
design. We make it possible for our clients to carry out their projects not only
with high quality and good economy but also with the best possible conditions
for sustainable development.
With around 9,000 employees, Sweco is among the largest players in Europe
and a leader in several market segments in the Nordic region and Central and
Eastern Europe.
Sweco Energy Markets delivers value to our clients through deep insights on
energy markets. We work with market design, regulation and market analysis.
We support a continuous development of the market and help our clients to
effectively participate on the energy markets.
SwecoGjörwellsgatan 22P.O. Box 34044SE-100 26 Stockholm, SwedenTelephone +46 8 695 60 00Fax +46 8 695 60 90www.sweco.se
Sweco Energuide ABReg. No. 556007-5573StockholmMember of the Sweco group
Insights. Delivered.