study of transport phenomena in carbon-based materials
TRANSCRIPT
University of Central Florida University of Central Florida
STARS STARS
Electronic Theses and Dissertations, 2004-2019
2013
Study Of Transport Phenomena In Carbon-based Materials Study Of Transport Phenomena In Carbon-based Materials
Walid Aboelsoud University of Central Florida
Part of the Mechanical Engineering Commons
Find similar works at: https://stars.library.ucf.edu/etd
University of Central Florida Libraries http://library.ucf.edu
This Doctoral Dissertation (Open Access) is brought to you for free and open access by STARS. It has been accepted
for inclusion in Electronic Theses and Dissertations, 2004-2019 by an authorized administrator of STARS. For more
information, please contact [email protected].
STARS Citation STARS Citation Aboelsoud, Walid, "Study Of Transport Phenomena In Carbon-based Materials" (2013). Electronic Theses and Dissertations, 2004-2019. 2707. https://stars.library.ucf.edu/etd/2707
STUDY OF TRANSPORT PHENOMENA IN CARBON-BASED MATERIALS
by
WALID ABOELSOUD ABDELHAADY ABOELSOUD
M.Sc. Ain Shams University, 2005
A dissertation submitted in partial fulfillment of the requirements
for the degree of Doctor of Philosophy
in the Department of Mechanical and Aerospace Engineering
in the College of Engineering and Computer Science
at the University of Central Florida
Orlando, Florida
Spring Term
2013
Major Professor: Louis C. Chow

ii
© 2013 Walid Aboelsoud Abdelhaady Aboelsoud

iii
ABSTRACT
In air-cooled heat exchangers, air-side thermal resistance is usually the largest compared to
conduction and liquid-side thermal resistances. Thus, reducing the air-side thermal resistance
with fin-like structures can greatly improve overall cooling performance. The performance of
these structures is usually characterized by the rate of heat which can be transferred and the
pumping power required. One promising solution is to use a high-thermal-conductivity material
with a large surface per unit volume such as carbon foam. This study presents a method of
utilizing V-shape corrugated carbon foam. The air-side heat transfer coefficient and the pressure
drop across the foam have been investigated using different V-shape foam geometrical
configurations obtained by varying its length and height. Based on design considerations and
availability, the foam length has been chosen to be 25.4, 38.1 and 52.1 mm while its height is
4.4, 6.8 and 11.7 mm, resulting in nine different test pieces of foam with different heights and
lengths.
A total number of 81 experiments were carried out and results show that of the nine V-shape
configurations, the foam with the shortest length and tallest height gives the best performance.
Experimental results are also compared with the results of prior work using different carbon
foam geometries. It is shown that V-shape corrugated carbon foam provides higher heat transfer
coefficient and better overall performance.
Numerical method is performed next. The effect of the foam length and height on thermal and
hydraulic performance is demonstrated and discussed. There is excellent agreement between
numerical and experimental results. An analysis is also made to better understand the transport
iv
phenomena that occur within the porous matrix. For laminar flow of air, one of the findings is
the high heat transfer effectiveness of the foam which means a foam thickness of 1 mm or less is
sufficient for heat transfer enhancement for air speed of up to 4 m/s.
To demonstrate the feasibility of using carbon foam, an analytical case study of carbon foam heat
exchanger was performed and compared to traditional heat exchanger with the same heat load.
Results show that a volume saving of up to 55% can be obtained by using carbon foam instead of
traditional aluminum fins.
Another attractive carbon-based material is the highly oriented pyrolytic graphite (HOPG) which
has an in-plane thermal conductivity of about 1700 W/m.K and an out-of-plane k of about 8
W/m.K at room temperature. HOPG is a graphite material with a high degree of preferred
crystallographic orientation. HOPG can be very useful in thermal applications when axial
conduction is critical and needed to be minimized as in recuperators used in cryocoolers and
compact power generation. Also, an analysis of HOPG for micro-channel applications shows
that the high in-plane thermal conductivity of HOPG, which is far greater than that of copper and
aluminum, allows a taller height for the micro-channel. This translates to an increase in the heat
flux removal rate by two to three times.

v
ACKNOWLEDGMENTS
This dissertation holds far more than the culmination of years of study. It also reflects the
relationships with many generous and inspiring people I have met since the beginning of my
graduate work. I would like to express the deepest appreciation to my advisor, professor Louis
C. Chow, who continually and convincingly conveyed a spirit of adventure in regards to
research, and an excitement in regards to teaching. Without his guidance and persistent help this
dissertation would not have been completed. Thanks to Dr. Wei. Wu and Mr. Y. R. Lin who
guided me in the past several years and helped me to perform the experiment. Special thanks to
RINI Technologies Inc. for their financial and technical support. Thanks to my committee
members, professor Ranganathan Kumar, professor Weiwei Deng and professor Aravinda
Kar for their input, valuable discussions and accessibility. I would also like to thank my parents,
two sisters, younger brother and my fiancée and her family. They were always supporting me
and encouraging me with their best wishes.
vi
TABLE OF CONTENTS
LIST OF FIGURES ....................................................................................................................... ix
LIST OF TABLES ......................................................................................................................... xi
NOMENCLAUTURE................................................................................................................... xii
CHAPTER ONE: INTRODUCTION ............................................................................................. 1
CHAPTER TWO: CARBON FOAM EXPERIMENT................................................................. 11
Experimental Set-up and Procedure .......................................................................................... 11
Results and Discussion ............................................................................................................. 20
Conclusion ................................................................................................................................ 33
CHAPTER THREE: CARBON FOAM SIMULATION AND ANALYSIS ............................... 34
Numerical Method .................................................................................................................... 34
Free Air Flow ........................................................................................................................ 36
Porous Matrix........................................................................................................................ 37
Boundary Conditions ............................................................................................................ 38
Problem Setup and Solution Procedure ................................................................................ 40
Numerical Results and Discussion............................................................................................ 41
Analytical Method .................................................................................................................... 48

vii
Analytical Results and Discussion ............................................................................................ 51
Conclusion ................................................................................................................................ 56
CHAPTER FOUR: CARBON FOAM APPLICATIONS ............................................................ 57
Case Study ................................................................................................................................ 58
Condenser Analysis and Design ............................................................................................... 61
Results and Conclusion ............................................................................................................. 63
CHAPTER FIVE: HIGHLY ORIENTED PYROLYTIC GRAPHITE (HOPG) ......................... 64
Introduction ............................................................................................................................... 64
HOPG Micro-Channel .............................................................................................................. 67
APPENDIX A: UNCERTAINTY ANALYSIS............................................................................ 70
Design Stage Uncertainty ......................................................................................................... 71
Error Propagation ...................................................................................................................... 72
APPENDIX B: CALIBRATION OF MEASUREMENT INSTRUMENTS ............................... 77
Differential Pressure Gage ........................................................................................................ 78
Rotameters ................................................................................................................................ 79
Thermocouples .......................................................................................................................... 81
APPENDIX C: CONDENSER DESIGN ..................................................................................... 84

viii
Case (1): Superheat, Condensation and Subcooling ............................................................. 86
Case (2): Superheat and Condensation ................................................................................. 92
Case (3): Condensation and Subcooling ............................................................................... 95
Case (4): Condensation ......................................................................................................... 98
LIST OF REFERENCES ............................................................................................................ 102

ix
LIST OF FIGURES
Figure 1. Schematic of Test Apparatus ......................................................................................... 11
Figure 2. Air volume flow rate measurements a. Frontal view b. Top view ................................ 12
Figure 3. V-shape carbon foam geometries and test section ........................................................ 14
Figure 4. Temperature measurements ........................................................................................... 17
Figure 5. Effect of foam height on thermal performance ............................................................. 21
Figure 6. Effect of foam length on thermal performance ............................................................. 22
Figure 7. Effect of foam height on hydraulic performance .......................................................... 24
Figure 8. Effect of foam length on hydraulic performance .......................................................... 25
Figure 9. Foam configurations used for comparison with V-shape corrugated carbon foam ....... 26
Figure 10. Comparison between V-shape corrugated foam and other foam geometries .............. 28
Figure 11. Volumetric HTC vs fluid power per unit volume ....................................................... 30
Figure 12. NTU per unit fluid power at different average air velocities ...................................... 32
Figure 13. Geometry under study ................................................................................................. 34
Figure 14. Computational domain ................................................................................................ 35
Figure 15. Boundary conditions .................................................................................................... 39
x
Figure 16. Effect of foam length on hydraulic performance ........................................................ 42
Figure 17. Effect of foam height on the hydraulic performance ................................................... 43
Figure 18. Effect of foam length on thermal performance ........................................................... 46
Figure 19. Effect of foam height on thermal performance ........................................................... 47
Figure 20. HTC analytical and numerical results ......................................................................... 53
Figure 21. Variation of effectiveness along one minichannel ...................................................... 55
Figure 22. Picture of the traditional air-cooled condenser ............................................................ 58
Figure 23. Attainable region of the fan curve ............................................................................... 59
Figure 24. Fan and foam coupling ................................................................................................ 60
Figure 25. New condenser with carbon foam inserts .................................................................... 62
Figure 26. Crystal structure of HOPG .......................................................................................... 65
Figure 27. In-plane thermal conductivity kxy, out-of-plane thermal conductivity kz and anisotropy
ratio as a function of temperature ................................................................................................. 66
Figure 28. Micro-channel model ................................................................................................... 67

xi
LIST OF TABLES
Table 1. Measurements and Instrumentation ................................................................................ 13
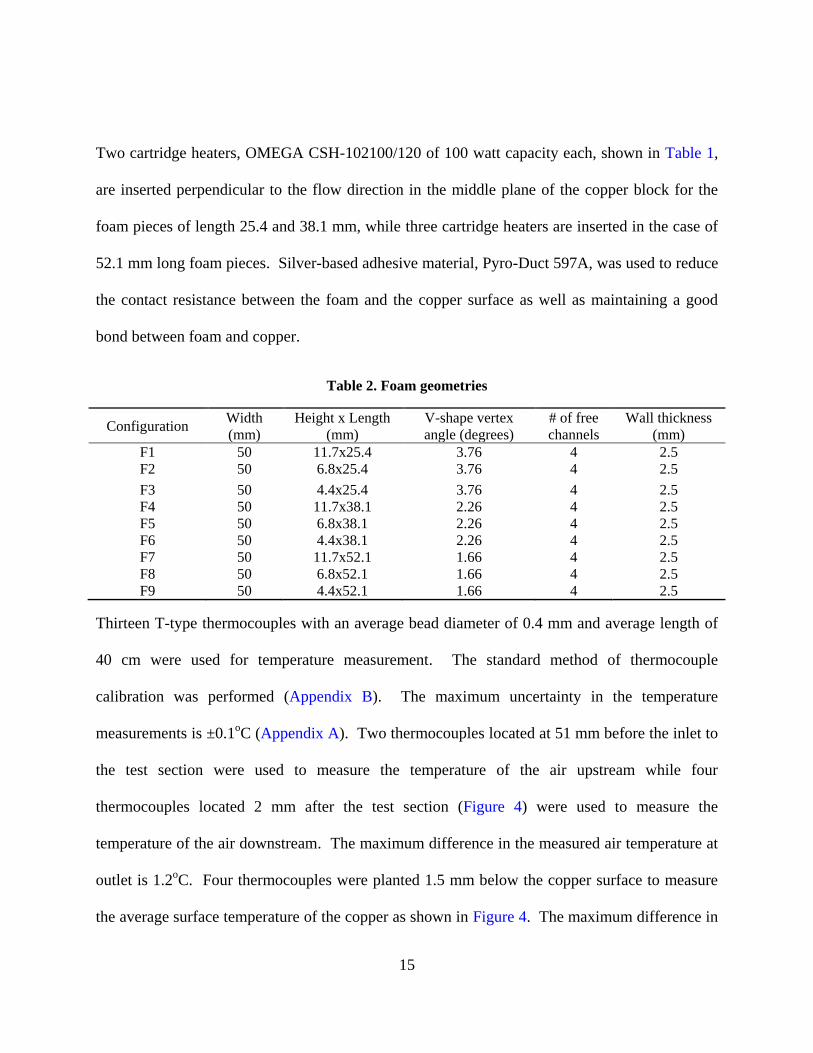
Table 2. Foam geometries ............................................................................................................. 15
Table 3. Representation of test matrix and uncertainty analysis for (F6) ..................................... 18
Table 4. Foam geometries ............................................................................................................. 35
Table 5. Boundary conditions ....................................................................................................... 38
Table 6. Numerical results ............................................................................................................ 44
Table 7. Analytical and numerical results ..................................................................................... 52
Table 8. New condenser design parameters .................................................................................. 63
xii
NOMENCLAUTURE
Ab Base area, foot-print (m2)
Ac Cross sectional area (m2)
Ao Total outside surface area of the condenser (m2)
Af Refrigerant flow area (m2)
ac Cross sectional area of the minichannel (m2)
as Surface area of the minichannel (m2)
cf Inertia coefficient
cp Average specific heat of air at constant pressure
(J/kg.K)
dh Hydraulic diameter (m)
dm minichannel diameter (m)
dp pore diameter (m)
D Minichannel length
H Foam height (m)
H* Micro-channel height
HTC Overall heat transfer coefficient (W/m2.K)
hv Volumetric heat transfer coefficient (W/m3.K)
Average interfacial heat transfer coefficient
based on LMTD (W/m2.K)
Average interfacial heat transfer coefficient
based on (Tfs - Tbi) (W/m2.K)
Average heat transfer coefficient of the
refrigerant gas (W/m2.K)
Average heat transfer coefficient of the
refrigerant liquid (W/m2.K)
K Foam permeability with air (m2)
k Thermal conductivity
keff Effective thermal conductivity (W/m.K)
kf Fluid thermal conductivity (W/m.K)
ks Solid thermal conductivity (W/m.K)
L Foam length (m)
L* Micro-channel passage length
Lf Total length of the corrugated foam wall (m)
L1 Condensation length of the condenser (m)
L2 Superheat length of the condenser (m)
L3 Subcooling length of the condenser (m)
Total mass flow rate of air through foam (kg/s)
Mass flow rate of air through the condenser
(kg/s)
Mass flow rate of air through the minichannel
(kg/s)
Mass flow rate of Refrigerant through the
condenser (kg/s)
Average Nusselt number
NTU Number of Transfer Units
n Total number of minichannels
Normal unit vector perpendicular to surface area
P Fluid Power = . Δp (W)
Pr Prandtl number
Pw Wetted perimeter (m)
psat Saturation pressure
p Pressure field
Q Total rate of heat transferred (W)
Qin input power (W)
Qloss = Qin - Q (W)
qx Rate of heat transferred to air up to distance x
within one minichannel (W)
ii
q Total rate of heat transferred to air within one
minichannel (W)
RAV Surface area to volume ratio of the foam
(m2/m3)
Re Reynolds number
T Temperature field
Tf Fluid temperature
Ts Solid temperature
Tb Bulk air temperature (oC)
Tb* Minichannel base temperature (o
C)
Tbi Bulk inlet air temperature (oC)
Tbo Bulk outlet air temperature (oC)
Tbx Bulk air temperature after distance x from the
entrance to the minichannel (oC)
Tfb Foam base temperature (oC)
Tfs Minichannel surface temperature (oC)
Tsat Condensation temperature (oC)
Mean bulk temperature (oC)
t Foam wall thickness (2.5 mm)
t* Micro-channel wall thickness
U Average inlet air velocity (m/s)
Uc Instrument uncertainty
Ud Design-stage uncertainty
Uz Zero-order uncertainty
UΔp Uncertainty in differential pressure
measurement
Uncertainty in volume flow rate measurement
UU Uncertainty in velocity calculation
Uh Uncertainty in heat transfer coefficient
calculation
Uo Overall heat transfer coefficient of the
condenser (W/m2.K)
V Gross volume of the protruding surface =
(W.H.L) (m3)
V* Net volume of foam = (H.Lf.t) (m3)
Air volume flow rate (l/s)
v velocity field (m/s)
vf Filtration velocity (Darcy velocity) (m/s)
W Foam width (m)
W* Condenser width (m)
x Distance measured from the inlet to the
minichannel (m)
βF Forchheimer Coefficient (kg/m4)
Δp pressure drop (Pa)
hfg Latent heat of the refrigerant (kJ/kg)
h Enthalpy change (kJ/kg)
ε Foam porosity
ϵm Minichannel effectiveness
ϵf Foam effectiveness
ηf Fin efficiency
Dynamic viscosity of air at (N.s/m2)
Dynamic viscosity of air at Tfs (N.s/m2)
ρ Average air density (kg/m3)
θb (Tb* - Tb)
Subscripts
G Superheated gas
g Saturated gas
L Subcooled liquid
l Saturated liquid
1
CHAPTER ONE: INTRODUCTION
Air as a cooling medium is preferred in electronics cooling because it is convenient and readily
available. However, since air has a low thermal conductivity and therefore a low heat transfer
coefficient (HTC), it can be very challenging for researchers and designers to reduce air-side
thermal resistance of heat exchangers and improve their thermal performance in many practical
applications. Reducing the air-side thermal resistance can be achieved by increasing the heat
transfer effectiveness with a fin structure made of a highly conductive material protruding from
the air-side surface. Recently, carbon foam has gained great interest due to its excellent thermal
characteristics.
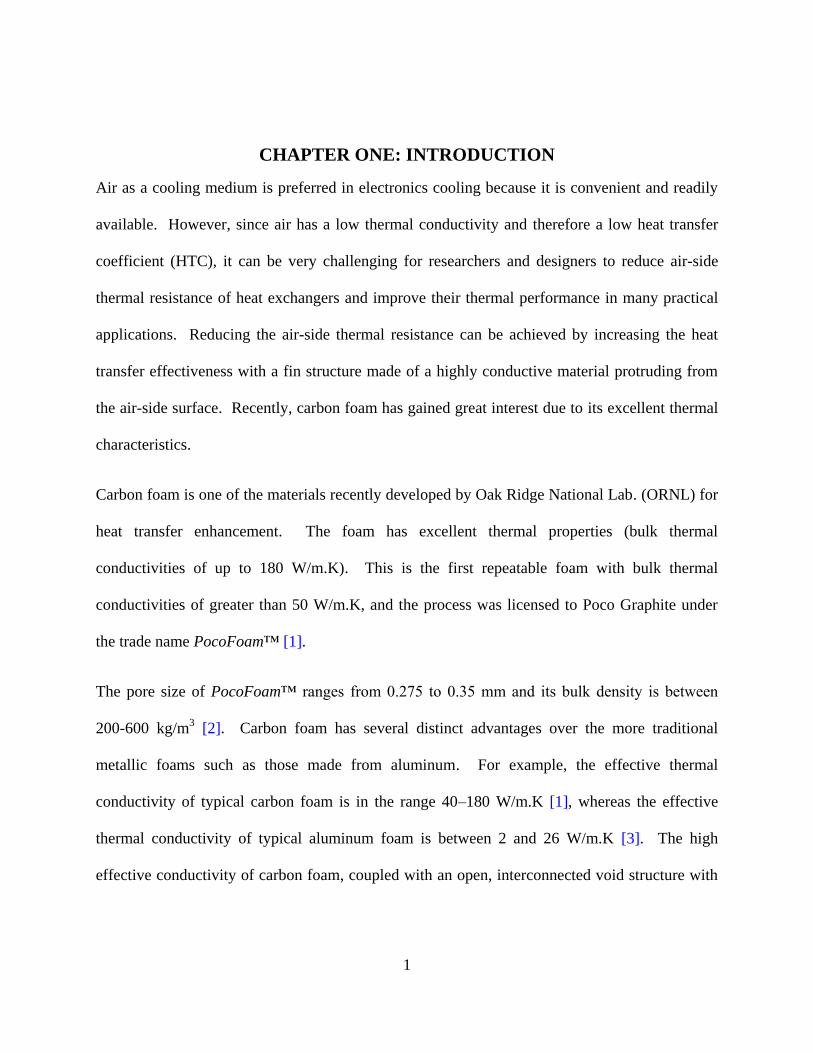
Carbon foam is one of the materials recently developed by Oak Ridge National Lab. (ORNL) for
heat transfer enhancement. The foam has excellent thermal properties (bulk thermal
conductivities of up to 180 W/m.K). This is the first repeatable foam with bulk thermal
conductivities of greater than 50 W/m.K, and the process was licensed to Poco Graphite under
the trade name PocoFoam™ [1].
The pore size of PocoFoam™ ranges from 0.275 to 0.35 mm and its bulk density is between
200-600 kg/m3 [2]. Carbon foam has several distinct advantages over the more traditional
metallic foams such as those made from aluminum. For example, the effective thermal
conductivity of typical carbon foam is in the range 40–180 W/m.K [1], whereas the effective
thermal conductivity of typical aluminum foam is between 2 and 26 W/m.K [3]. The high
effective conductivity of carbon foam, coupled with an open, interconnected void structure with
2
porosity (75-90%) that yields a large internal surface area per unit volume (5000–50,000 m2/m
3),
makes carbon foam an attractive material for air cooling [3].
The effect of metal foams in heat exchangers has been studied in significant details. Mancin et
al. [4] studied thermal and hydraulic performance of five copper foam specimens with different
pore size and porosities. A comparison study based on global and interstitial heat transfer
coefficient was conducted to identify the best foam specimen among the tested group. Chein et
al. [5] studied copper foam heat sinks coated with silver using electroforming with different
porosity, pore density, permeability, and inertial coefficient and compared their thermal and
hydraulic performance with plate-fin and pin-fin heat sinks. As a result, copper foam shows
better performance as compared to standard plate-fin and pin-fin heat sinks.
Aluminum is preferred in electronics cooling because it is light and has relatively high thermal
conductivity. Similar to copper foam, Kim et al. [6] studied heat transfer characteristics of
aluminum foam heat sink and compared their results with a conventional parallel-plate heat sink
with the same size. Results showed that the heat transfer enhancement of aluminum foam heat
sink is 28% or higher than the conventional heat sink. Another comparison between a porous fin
made of 6101 aluminum-alloy and a conventional louvered fin was done by Kim et al. [7]. Their
results showed that the two types of fins have similar thermal performance with the louvered fin
showing a little better performance.
Sertkaya et al. [8] compared thermal and hydraulic performance of aluminum foam (three
different pore sizes) with aluminum fin (three different spacing) using a cross flow heat
exchanger. They concluded that aluminum fin has better heat transfer characteristics as well as

3
lower pressure drop. They claimed that the heat transfer performance is better for the fin than
the foam due to the poor thermal contact between the foam and its substrate.
The air-side heat transfer performance and the pressure drop was investigated by Garrity et al.
[9] for three carbon foam samples. The performance of the three foam samples was compared
with conventional multi-louvered fins. They assumed that the air-side thermal resistance is the
dominant thermal resistance. Performance of samples were evaluated based on the coefficient of
performance (COP, defined as the ratio of the total heat rate removed to the electrical input of the
air blower), compactness factor (CF, defined as the total heat rate removed per unit volume), and
power density (PD, defined as the total heat rate removed per unit mass). Their results showed
that carbon foam samples provide a significant improvement in CF but the COP and PD are
considerably lower than those for conventional multi-louvered fin heat exchangers.
Convective heat transfer coefficient in a channel with different geometries of carbon foam was
experimentally and numerically studied by Leong et al. [10]. Foam geometries tested are block
solid foam (BLK), zigzag foam (ZZG), and baffle foam (BAF). Their results showed that the
solid block foam has the best heat transfer performance at the expense of high pressure drop.
However, they claimed that their proposed configurations could achieve relatively good
enhancement of heat transfer at moderate pressure drop.
Williams and Roux [11] investigated various air cooled base plate channel designs for an array
of generic power amplifier modules. In their study, graphite foam and a micro-fibrous material
were used as mini-heat exchangers to cool the power amplifier modules. Different foam
geometries were tested such as zigzag, U-shape corrugation, and inline PocoFoam. All
4
geometries showed an improvement over the empty channel cooling. They concluded that the
zigzag PocoFoam provides the most improvement in heat transfer coefficient among all other
configurations.
Wu et al. [12] compared thermal and hydraulic performance of a V-shape corrugated carbon
foam, of dimensions of 51x51x19 mm, with the U-shape corrugated carbon foam, pin finned, and
solid carbon foam geometries reported in [1]. PocoFoam with porosity of 75% was used. They
demonstrated that the V-shape geometry is an attractive heat sink for electronics and aerospace
applications. Lin et al. [13] studied the U-shape corrugated carbon foam with wall thickness of
2.5 and 3 mm, they found that about 95% of the heat can be transferred to the fluid (air) within 4
mm of the foam thickness when the average air speed is 4 m/s.
Assessment of the heat sink performance based on thermal characteristics alone is not desirable
because pumping power is also crucial in the selection of heat sink. It is important to keep the
ratio of the heat transfer rate from the heat sink to the pumping power near a maximum while
taking into account other design and selection considerations.
Vanka and Stone [14] discussed different methods to evaluate the improvement in the
performance of several configurations of plate-fin heat exchangers. They provided a
comprehensive review of how to judge and compare the effectiveness of these geometries. One
of these methods was established by Soland et al. [15]. They chose the volumetric heat transfer
coefficient (hv) as a performance parameter to assess the heat transfer process. Pumping power
per unit volume (P/V) was chosen as a pumping power performance parameter.

5
Due to its high thermal conductivity [1] and high surface area to volume ratio [3], carbon foam is
an attractive material for air-side thermal resistance reduction consideration. V-shape corrugated
carbon foam appears to be a very attractive solution for thermal management [12]. Therefore,
there is a need for more studies to investigate the effect of geometrical parameters on thermal
and hydraulic performance and to exploit this geometry in thermal applications.
In this study, thermal and hydraulic performance assessment of nine V-shape corrugated carbon
foam pieces is introduced. Comparison of performance of the nine V-shape corrugated carbon
foam geometries and the six foam geometries described in [9, 10] will be established. We will
show that the V-shape corrugated carbon foam is a promising geometry which can achieve high
heat transfer coefficient with minimal pressure drop.
Many numerical studies were carried out in order to gain better understanding of the transport
phenomena in porous media. Vafai and Kim [16] mentioned that numerical results based on
Brinkman-Forchheimer extended Darcy equation have been shown to agree well with
experimental results. The equation accounts for boundary layer growth and macroscopic shear
stress, as well as microscopic shear stress and microscopic inertial force. it is also very effective
for studying the motion of the fluid in the region, which is partially filled with porous medium
and partially filled with a regular fluid. This implies that this equation well describes the relation
between parameters of momentum transport through porous media when a free fluid flow is in
the neighborhood.
There are two energy transport models proposed in the literature. The first model is the local
thermal equilibrium (LTE) model where the fluid temperature (Tf) and the solid temperature (Ts)
6
are assumed to be equal and there is only one energy equation. The second model is the local
thermal nonequilibrium (LTNE) model where two distinct temperature fields within the porous
matrix exist. The fluid temperature and the solid temperature are solved by using two distinct
energy equations. The validity of LTE model was discussed in [17-20].
The assumption of LTE may not be valid for high speed flows or high permeability porous media
in which the fluid to solid interaction time or surface area, respectively may not be large enough
to bring the temperature of the fluid and solid phases close enough for LTE to be a reasonable
assumption [17]. Experimental validation of numerical models requires measurement of the
porous matrix temperature. Thermocouple is used to measure only one temperature which is a
temperature between the fluid and solid temperatures. From that prospective, it is more
appropriate to use the LTE model to describe the temperatures field rather than solve for the
solid and fluid temperatures separately and then average them [18].
Kaviany [19] and Mohamad and Karim [20] mentioned that if there is a significant heat
generation occurring in the solid or fluid phase and when the temperature at the interfacial
surface changes significantly with respect to time, then the solid and fluid phases could be far
from the local thermal equilibrium (LTE).
Fluid flow and heat transfer interfacial boundary conditions between the free fluid and the porous
matrix were studied by Alazmi and Vafai [21]. The configuration used in their study is fluid
flow between a porous medium and solid boundary kept at constant temperature. LTE condition
is assumed. Five fluid flow boundary conditions and four heat transfer boundary conditions,
from literature, are summarized and discussed. The effects of Reynolds number and porosity on

7
different types of interface conditions are analyzed. They concluded that results of velocity field,
temperature field and Nusselt number are quite close for all of the fluid flow and heat transfer
models however, small discrepancies could appear for cases where Reynolds number is small.
Numerical study of pressure driven laminar flow of air of uniform inlet velocity and uniform
inlet temperature inside a pipe or channel was established by Mohamad [22]. The conduit is
subjected to constant wall temperature and fully or partially filled with porous medium. The
effects of porous layer thickness on the rate of heat transfer enhancement and pressure drop are
investigated. In his study of energy transport, LTE is assumed based on a previous study of the
author [20] which revealed that the thermal equilibrium assumption is valid as long as there is no
heat generation in the fluid phase or in the solid phase. Moreover, a few tests done using LTNE
assumption and results are not that sensitive to the nonequilibrium condition. Results showed
that the inertia term of the momentum equation, has a significant effect on Nusselt number, but it
is not clear that the correlation of the inertia term is valid for a highly porous. Results also
showed that the heat transfer rate increases by increasing the thickness of the porous material
inside the conduit on the expenses of having higher pressure drop. The optimum thickness of the
porous material or radius ratio is found to be 0.6, where the heat transfer can be enhanced with a
reasonable pressure drop. LTE will be assumed in the numerical part of this study.
Pavel and Mohamad [23] experimentally and numerically investigated the effect of aluminum
porous media inserted in a pipe on the rate of heat transfer and the pressure drop where LTE
model is assumed. The porous media consists of commercial aluminum screens of wire diameter
0.8 mm, density 2770 kg/m3 and thermal conductivity 177 W/m
2K, with different outer
8
diameters and then inserted on steel rods. Twelve different configurations are obtained by
varying the screen diameter and the distance between two adjacent screens. Pressure driven air
flow is allowed into a pipe partially or fully filled with this porous media. The pipe is subjected
to constant uniform heat flux. They studied the effect of porosity, diameter of the porous
diameter, thermal conductivity and Reynolds number (1000 – 4500), on Nusselt number and the
pressure drop. The conclusion is that the heat transfer enhancement can be achieved with larger
diameter screens whose diameters approach the diameter of the pipe. For a constant diameter of
the porous medium, further improvement can be achieved using a porous insert with a smaller
porosity and higher thermal conductivity.
Alazmi and Vafai [24] investigated the effect of variances from literature on constant porosity,
variable porosity, thermal dispersion, and local thermal nonequilibrium (LTNE) models on the
transport process in porous media contained within parallel plate channel. The channel is
subjected to constant heat flux or constant wall temperature boundary conditions. They showed
that the effect of these variances on the presented models is significant on the velocity field and
negligible on the temperature field and Nusselt number.
Alazmi and Vafai [25] studied the effect of variable porosity, thermal dispersion and LTNE on
the characteristics of transport process for free surface flow through porous media. Parameters
such as Reynolds number and the pore diameter are also used to quantify the significance of
these effects. Results show that variable porosity has a significant effect only in the
neighborhood of the solid boundary where no slip condition occurs.
9
Betchen and Straatman [26] studied the fluid flow and the heat transfer in a block of carbon foam
with variable porosity in the transverse direction to the primary direction of water flow. The
foam base is maintained at constant temperature. LTNE energy equations are used in their
analysis. Results showed that only foam pieces with large porosity variation significantly affects
the heat transfer for flow at relatively high Reynolds number. They found that superior thermal
performance can be achieved by locating the more porous side of the foam adjacent to the heated
surface, resulting in a significant increase in the rate of heat transfer.
Analysis of transport phenomena in porous media is introduced in literature. The analytical
solution is compared to numerical result and closed form solution if any. Analytical
investigation of forced convection flow through a channel subjected to constant uniform heat
flux and filled with a porous media was performed by Marafie and Vafai [27]. Analytical
solutions are obtained for both fluid and solid temperature fields including the effect of various
parameters such as thermal conductivity ratio of fluid to solid, and inertia coefficient (cf). The
analytical solution is compared to the exact solution of LTE model available in the literature as
well as the analytical solution for the LTNE model based on Darcian flow field (no inertia term).
It is demonstrated that the inertia coefficient (Cf) have a small role in determining the validity of
LTE model.
Haji-Sheikh and Vafai [28] analyzed the problem of fluid flow and heat transfer through
channels of different geometries, subjected to constant uniform wall temperature, filled with
porous material. The geometries used in their analysis are parallel plate channels, circular tubes
and elliptical passages with different aspect ratios. Modified Graetz problem based on
10
Brinkman’s model is introduced. Results are compared to results from another numerical study
based on the method of weighted residuals.
Solid carbon foam has excellent thermal characteristics at the expense of poor hydraulic
performance, namely high pressure drop. Recently, there have been great interests of how to
take advantage of thermal benefits of carbon foam while overcome its drawbacks. One of the
ideas is to change the foam geometry in such way it will keep the same thermal performance and
reduce the pressure drop. Experimental and numerical investigation of fluid flow and heat
transfer in a channel filled with different configurations of graphite foams were carried out by
Leong et al. [10]. Foam geometries tested are block solid foam (BLK), zigzag foam (ZZG), and
baffle foam (BAF). LTNE was assumed and the numerical code is validated by results obtained
from [21].
DeGroot and Straatman [29] proposed a numerical LTNE model for computing fluid flow and
heat transfer with general unstructured, nonorthogonal grids. The major contribution of their
model is its ability to use nonorthogonal grids to discretize complex geometries without affecting
the robustness of the model and having any significant increase on the computational time. They
demonstrated the efficiency of their model on a V-shaped corrugated carbon foam which is
presented by [12].
Due to its high effective thermal conductivity, solid carbon foam has the potential to achieve
excellent heat transfer performance however, the high pressure drop performance is a restriction
on the way of achieving an ideal heat sink. The V-shape corrugated carbon foam can achieve
even better thermal performance with less pressure drop [1].
11
CHAPTER TWO: CARBON FOAM EXPERIMENT
Experimental Set-up and Procedure
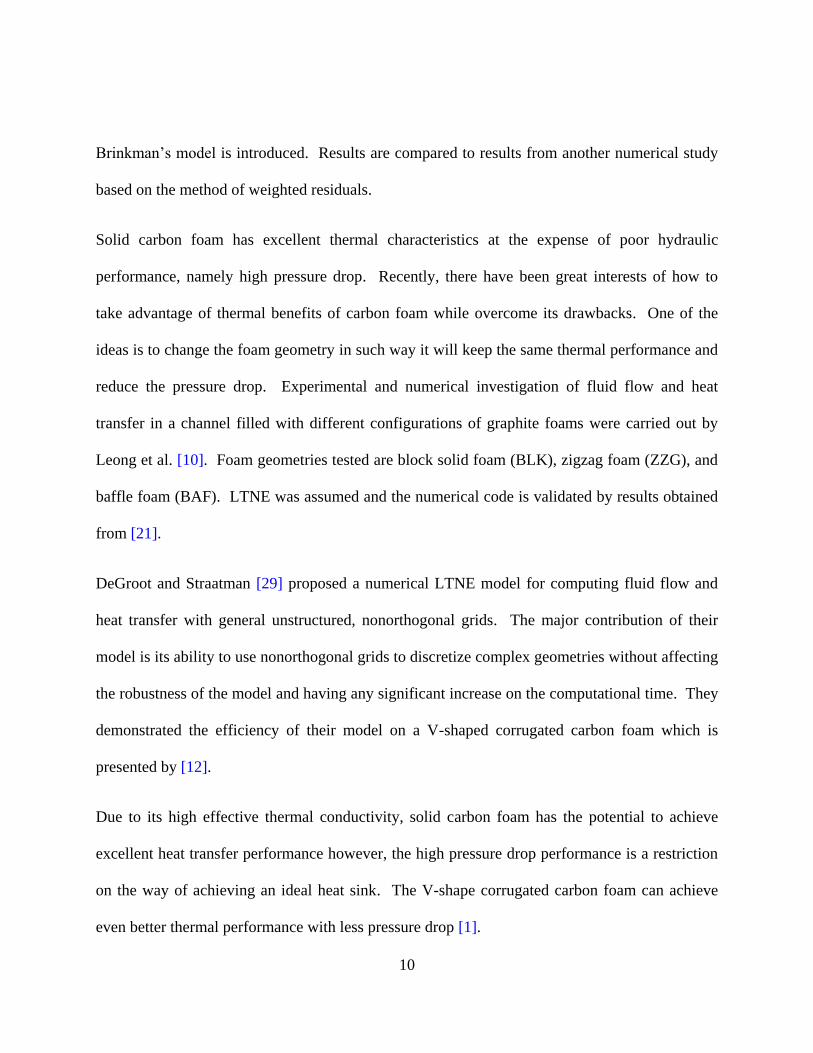
The experimental setup is shown in Figure 1. Air flows from the reservoir of a reciprocating
compressor through an air hose to a set of four rotameters, OMEGA FL series 2035, 2060, 2061
and 2071, which are connected in parallel to air flow channel. As shown in Table 1, the
rotameters have different full scale values. The maximum accuracy of the air flow measurement
can be achieved by choosing the appropriate rotameter for each run. A single rotameter can be
isolated using manual control valves attached in series to each rotameter as shown in Figure 2.
Figure 1. Schematic of Test Apparatus

12
Figure 2. Air volume flow rate measurements a. Frontal view b. Top view
Air enters the air channel from an air hose attached to the side of the channel. It then passes
through two mesh screens (100x100 openings per linear inch, 38.1 mm apart) to ensure a good
distribution of air in all directions. Three sets of the screens with three different heights were
used based on channel and foam heights (4.4, 6.8 and 11.7 mm). A DWYER 167-6 pitot tube,
described in Table 1, was used to verify a good air distribution. Air then flows through a channel
50 mm wide and 38 cm long with three different heights as mentioned before. The 38-cm entry

13
length prior to the test section is provided to ensure a fully developed flow before the test
section. Finally, the air exits from the test section to the atmosphere (patm.). The maximum
uncertainty in the volume flow rate measurements is ±10.3% and the average uncertainty is
±5.1% (Appendix A).
Table 1. Measurements and Instrumentation
Experiment
parameter Instrument Model #
Flow range
(SCFM) Accuracy
Flow
Rotameter (R1) OMEGA FL-2035 0.15-1.5 ±3% of F.S
Rotameter (R2) OMEGA FL-2060 0.5-5 ±3% of F.S
Rotameter (R3) OMEGA FL-2061 1-10 ±3% of F.S
Rotameter (R4) OMEGA FL-2071 3-25 ±2% of F.S
Model # Size (mm) Insertion Length
(mm)
Velocity Pitot tube Dwyer 167-6 3.2 152
Model # Rated capacity
(W) Length (mm)
Power Cartridge heater CSH102100/120 100 51
Model # Range (Pa) Accuracy
Differential
pressure Gage (digital display) Dwyer DM-1108 2491 ±1% of F.S
Nine different foam geometries with different lengths and heights were tested for their heat
transfer and pressure drop characteristics. Foam lengths were chosen to be 25.4, 38.1 and 52.1
mm and heights to be 4.4, 6.8 and 11.7 mm. These nine foam geometries are listed in Table 2.
Foam wall thickness of 2.5 mm was chosen based on previous work done by Wu et al. [12] and
Lin et al. [13]. The test section consists of the V-shape corrugated carbon foam attached on the
surface of copper block with the same foot print. The different foam geometries and test sections
are shown in Figure 3.
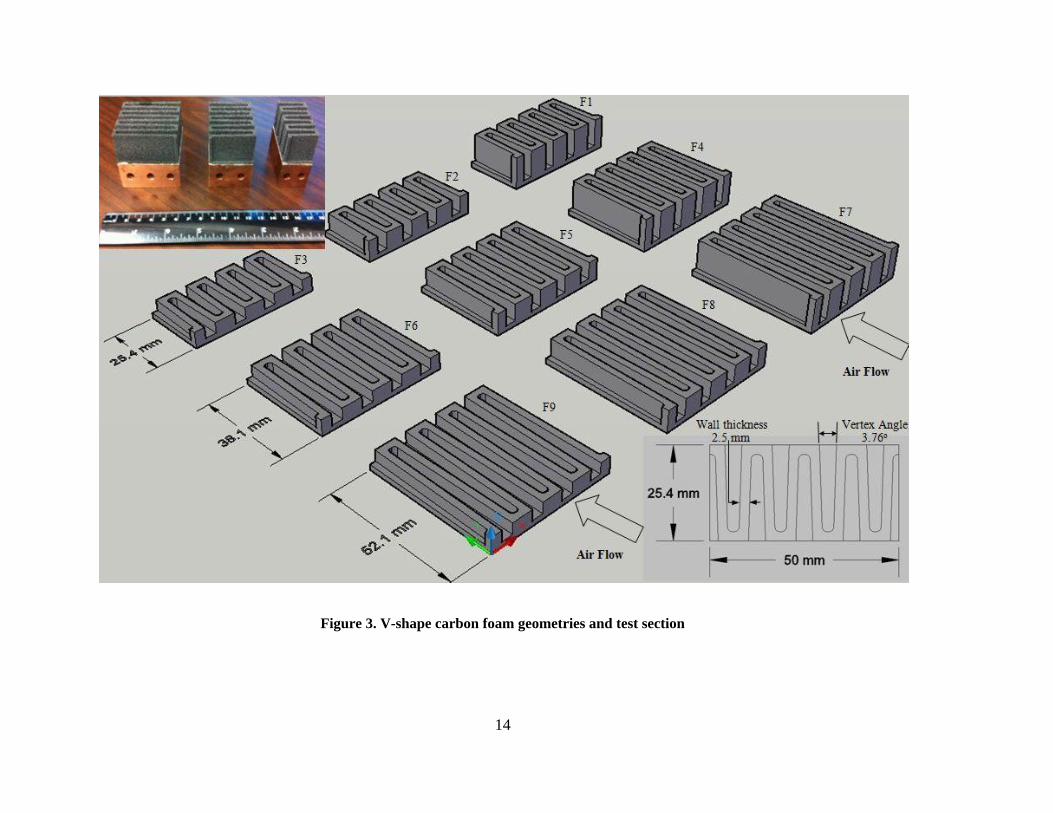
14
Figure 3. V-shape carbon foam geometries and test section
15
Two cartridge heaters, OMEGA CSH-102100/120 of 100 watt capacity each, shown in Table 1,
are inserted perpendicular to the flow direction in the middle plane of the copper block for the
foam pieces of length 25.4 and 38.1 mm, while three cartridge heaters are inserted in the case of
52.1 mm long foam pieces. Silver-based adhesive material, Pyro-Duct 597A, was used to reduce
the contact resistance between the foam and the copper surface as well as maintaining a good
bond between foam and copper.
Table 2. Foam geometries
Configuration Width
(mm)
Height x Length
(mm)
V-shape vertex
angle (degrees)
# of free
channels
Wall thickness
(mm)
F1 50 11.7x25.4 3.76 4 2.5
F2 50 6.8x25.4 3.76 4 2.5
F3 50 4.4x25.4 3.76 4 2.5
F4 50 11.7x38.1 2.26 4 2.5
F5 50 6.8x38.1 2.26 4 2.5
F6 50 4.4x38.1 2.26 4 2.5
F7 50 11.7x52.1 1.66 4 2.5
F8 50 6.8x52.1 1.66 4 2.5
F9 50 4.4x52.1 1.66 4 2.5
Thirteen T-type thermocouples with an average bead diameter of 0.4 mm and average length of
40 cm were used for temperature measurement. The standard method of thermocouple
calibration was performed (Appendix B). The maximum uncertainty in the temperature
measurements is ±0.1oC (Appendix A). Two thermocouples located at 51 mm before the inlet to
the test section were used to measure the temperature of the air upstream while four
thermocouples located 2 mm after the test section (Figure 4) were used to measure the
temperature of the air downstream. The maximum difference in the measured air temperature at
outlet is 1.2oC. Four thermocouples were planted 1.5 mm below the copper surface to measure
the average surface temperature of the copper as shown in Figure 4. The maximum difference in
16
the measured temperature of the copper surface is 0.2oC. Two thermocouples were inserted 0.5
mm above the thermal adhesive layer to measure the foam base temperature (Tfb). The
maximum difference in temperature measurement between them is 1.4oC.
The average inlet air temperature (Tbi) is the room temperature which ranges from 20.8 to
22.8oC. The Inlet pressure to the test section is the sum of the atmospheric air plus the pressure
drop across the foam (p). The average temperature of the inlet air, outlet air and foam base for
a representation of test matrix (F6, 4.4x38.1 mm) is shown in Table 3.
Two pressure taps 10.2 cm apart were installed at 25.4 mm before the inlet to test section. A
DWYER DM-1108 differential pressure gage, described in Table 1, was used to measure the
pressure difference between upstream and downstream. The calibration of the differential
pressure gage is shown in Appendix B. The maximum uncertainty in differential pressure
measurements is ±17.2% and the average uncertainty is ±10.7% (Appendix A).

17
Figure 4. Temperature measurements
A Keithley multimeter/data acquisition system (integra series, model 2700) was used to acquire
data from thermocouples from all measurements points. Cold junction compensation was done
by simulating the cold junction electronically which was stored in the DAQ for T-type
thermocouple. The Model 2700 uses the ITS-90 inverse function coefficients for the polynomial
to calculate thermocouple temperature. The heaters were powered by a variable AC power
supply which enables the control of the voltage input to the heaters and consequently the power
input.
18
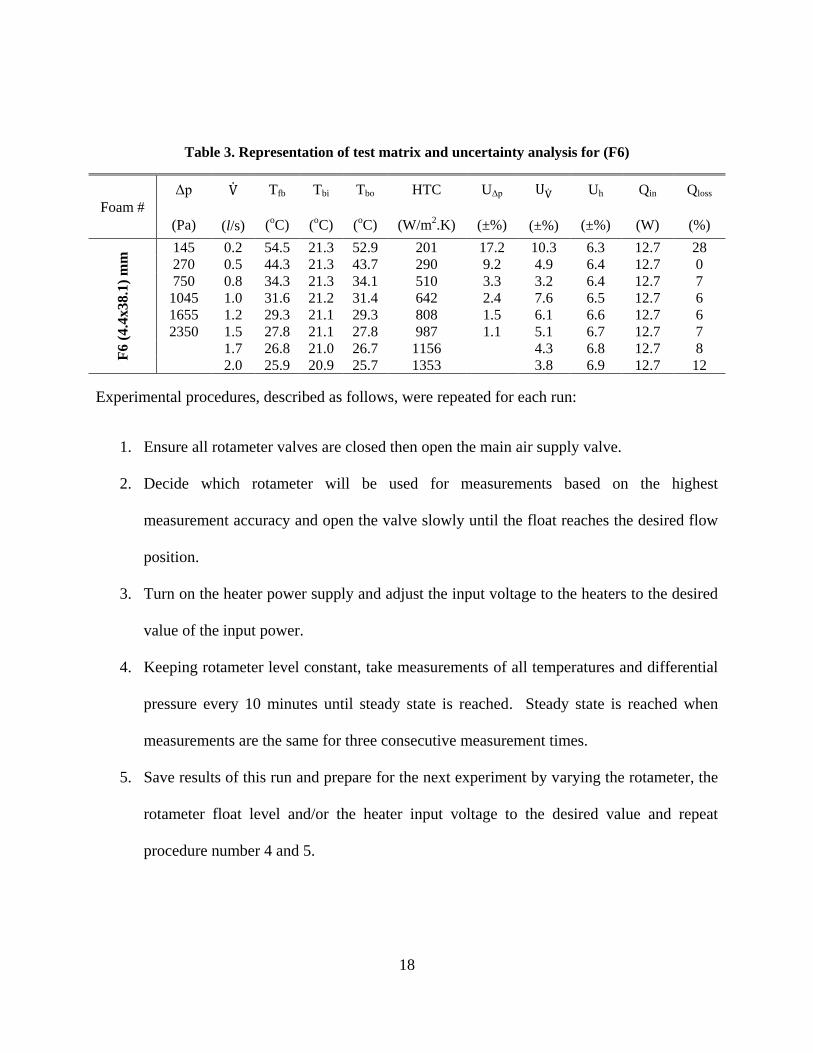
Table 3. Representation of test matrix and uncertainty analysis for (F6)
Experimental procedures, described as follows, were repeated for each run:
1. Ensure all rotameter valves are closed then open the main air supply valve.
2. Decide which rotameter will be used for measurements based on the highest
measurement accuracy and open the valve slowly until the float reaches the desired flow
position.
3. Turn on the heater power supply and adjust the input voltage to the heaters to the desired
value of the input power.
4. Keeping rotameter level constant, take measurements of all temperatures and differential
pressure every 10 minutes until steady state is reached. Steady state is reached when
measurements are the same for three consecutive measurement times.
5. Save results of this run and prepare for the next experiment by varying the rotameter, the
rotameter float level and/or the heater input voltage to the desired value and repeat
procedure number 4 and 5.
Foam #
Δp
(Pa)
(l/s)
Tfb
(oC)
Tbi
(oC)
Tbo
(oC)
HTC
(W/m2.K)
UΔp
(±%)
(±%)
Uh
(±%)
Qin
(W)
Qloss
(%)
F6
(4
.4x3
8.1
) m
m 145 0.2 54.5 21.3 52.9 201 17.2 10.3 6.3 12.7 28
270 0.5 44.3 21.3 43.7 290 9.2 4.9 6.4 12.7 0
750 0.8 34.3 21.3 34.1 510 3.3 3.2 6.4 12.7 7
1045 1.0 31.6 21.2 31.4 642 2.4 7.6 6.5 12.7 6
1655 1.2 29.3 21.1 29.3 808 1.5 6.1 6.6 12.7 6
2350 1.5 27.8 21.1 27.8 987 1.1 5.1 6.7 12.7 7
1.7 26.8 21.0 26.7 1156 4.3 6.8 12.7 8
2.0 25.9 20.9 25.7 1353 3.8 6.9 12.7 12
19
Calibration of flow meters and differential pressure gage were conducted before starting the
experiments (Appendix B). Rotameters were calibrated using McMillan mass flow sensor
(model 50s, 0-50 l/min) and differential pressure gage was calibrated using a U-tube manometer.
The heat transfer coefficient is defined in Equation 1 based on the difference between the
average foam base temperature and the average inlet air temperature.
1
Uncertainty propagation analysis was conducted as described in [30]. Table 3 shows a sample of
the test matrix with corresponding measurements, calculations, and uncertainty analysis. The
maximum uncertainty in the heat transfer coefficient was found to be ±7% and the average
uncertainty is ±6.5%. All uncertainty calculations are based on the 95% confidence level.
20
Results and Discussion
A total number of 81 experiments were carried out with different air face velocities
and heat fluxes of . Table 2 shows the nine V-shape corrugated
carbon foam pieces which were tested using different heat fluxes applied to the bottom of the
foam and different upstream air velocities. A sample test result for F6 and the uncertainty of the
measurements are given in Table 3. We aim to show thermal and hydraulic performance of the
V-shape corrugated carbon foam. Thermal performance of the foam is assessed by the heat
transfer coefficient. Hydraulic performance is assessed by the pressure drop (Δp).
The performance of turbomachines is usually provided as the relation of the pressure drop, input
power and efficiency as function of the volume flow rate. Thus we found it more useful to plot
the performance parameters of the foam (pressure drop and the heat transfer coefficient) as a
function of the air volume flow rate rather than the average air velocity. This enables the reader
to estimate what the performance of the foam would be when coupled with a given fan or
blower.
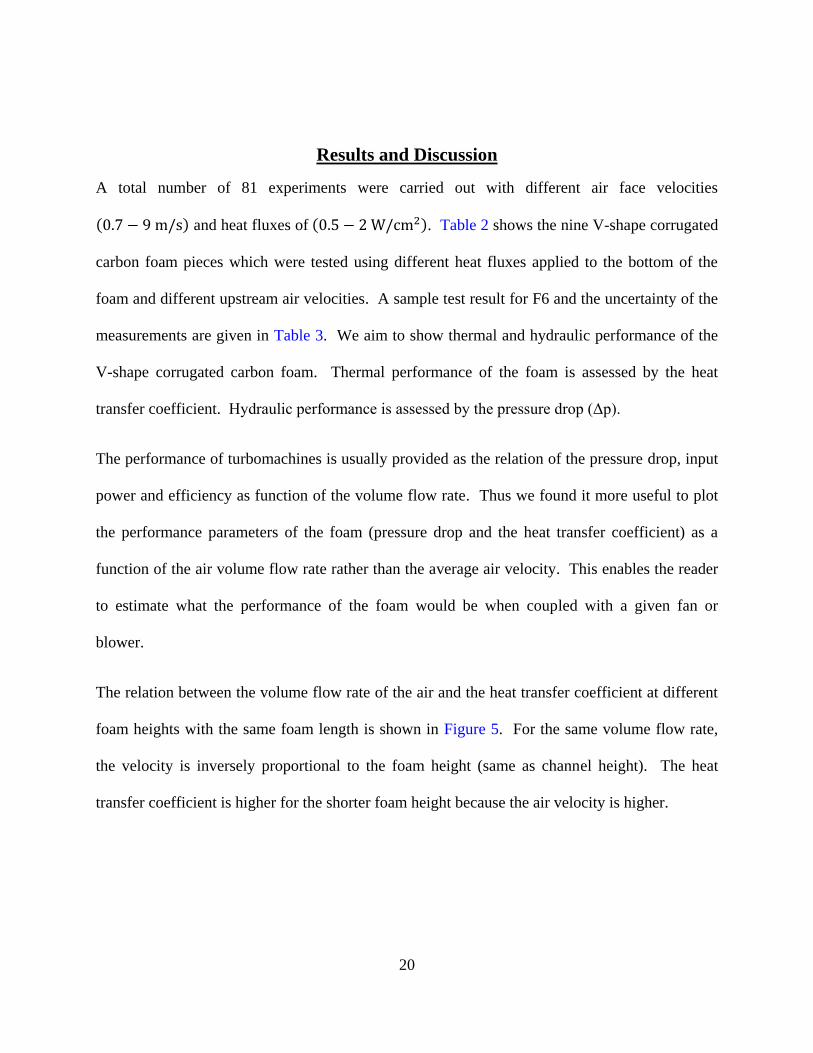
The relation between the volume flow rate of the air and the heat transfer coefficient at different
foam heights with the same foam length is shown in Figure 5. For the same volume flow rate,
the velocity is inversely proportional to the foam height (same as channel height). The heat
transfer coefficient is higher for the shorter foam height because the air velocity is higher.
21
Figure 5. Effect of foam height on thermal performance
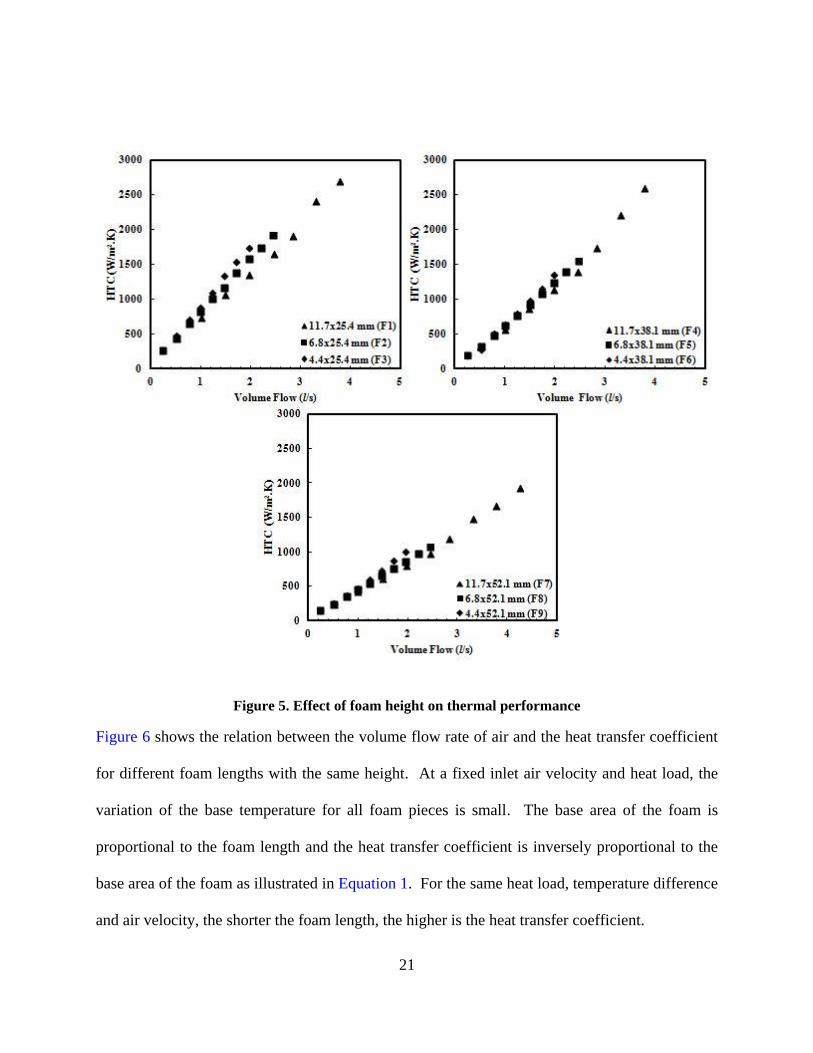
Figure 6 shows the relation between the volume flow rate of air and the heat transfer coefficient
for different foam lengths with the same height. At a fixed inlet air velocity and heat load, the
variation of the base temperature for all foam pieces is small. The base area of the foam is
proportional to the foam length and the heat transfer coefficient is inversely proportional to the
base area of the foam as illustrated in Equation 1. For the same heat load, temperature difference
and air velocity, the shorter the foam length, the higher is the heat transfer coefficient.
22
Figure 6. Effect of foam length on thermal performance
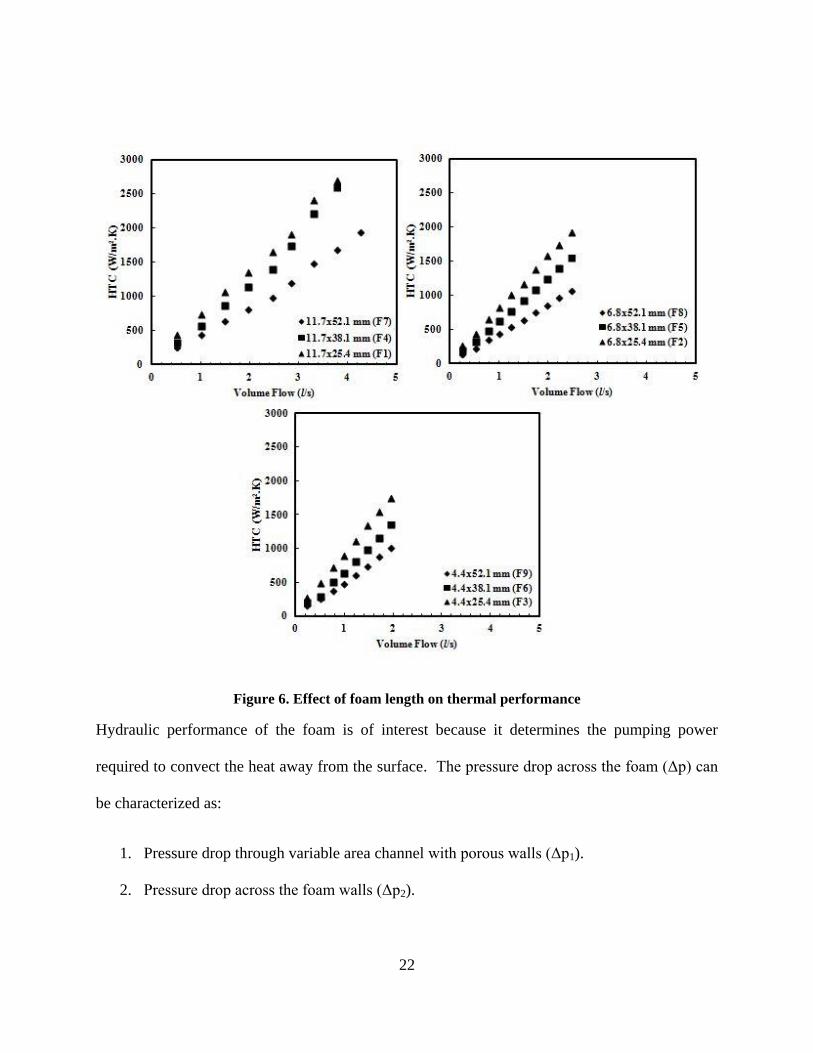
Hydraulic performance of the foam is of interest because it determines the pumping power
required to convect the heat away from the surface. The pressure drop across the foam (Δp) can
be characterized as:
1. Pressure drop through variable area channel with porous walls (Δp1).
2. Pressure drop across the foam walls (Δp2).

23
Air flowing across the V-shape corrugated carbon foam experiences the two pressure drops (Δp1
& Δp2). The total pressure drop (Δp) along a streamline is the sum of the two components since
they can be considered as two flow resistances connected in series. Since the mass flow rate of
air in one flow passage varies due to the mass transfer through the porous walls, air flow through
the variable area channel could encounter different flow regimes: laminar, transition, and
turbulent.
Figure 7 shows the relation between the volume flow rate of air and the pressure drop across the
foam for different foam heights with the same foam length. For the same volume flow rate of
air, the shorter the foam height the higher the pressure drop which is attributed to higher air flow
velocity.
Figure 8 illustrates the relation between the volume flow rate of air and the pressure drop across
the foam for different foam lengths with the same foam height. It is somewhat surprising that the
total pressure drop across the foam decreases slightly with increasing the foam length. As air is
forced to penetrate the foam wall of thickness of 2.5 mm, the local filtration velocity (vf)
crossing the foam wall decreases with increasing foam length since longer foam length means
that the wall has larger overall surface area for the air to penetrate the foam. At a given air
volume flow rate, as the foam length increases, the air filtration speed decreases. It appears that
(Δp2) drops more than the increase in (Δp1) resulting in the total pressure drop characteristics
shown in Figure 8. There is a competing action between the two pressure components Δp1 and
Δp2.
24
Figure 7. Effect of foam height on hydraulic performance

25
Figure 8. Effect of foam length on hydraulic performance
Garrity et al. [9] examined air-side heat transfer performance and pressure drop three carbon
foam samples L1A, L1 and D1, manufactured by Kopper Inc., with pore sizes of 0.5, 0.6 and
0.65 mm, respectively. The three carbon foam samples were modified by machining 80
cylindrical holes, 6.7 mm apart with diameter of 3.2 mm in the flow direction, as shown in
Figure 9. The bulk densities of the modified carbon foam samples are 284, 317, and 400 kg/m3

26
respectively with porosity based on the flow passage of 0.166. The overall dimension for each of
the three foam samples is 15.24x15.24x2.54 cm.
Figure 9. Foam configurations used for comparison with V-shape corrugated carbon foam
(Redrawn from references)
Leong et al. [10] studied the thermal and hydraulic performance of three geometries of
PocoFoam with porosity of 72.8%. The three geometries are block foam (BLK), zigzag foam
(ZZG) and baffle foam (BAF), as shown in Figure 9. All foam configurations have the same
external dimensions of 50 x 50 x 25 mm.
Williams and Roux [11] tested three foam configurations for thermal management of power
amplifiers. The tested geometries are inline, U-shape corrugated, and zigzag. All samples are
27
made of PocoFoam with porosity of 75%. The cooling channel was 65.3 mm wide and 3 mm
height. Their measured pressure drop is very high (order of magnitude of 20 kPa).
Different criteria of choosing the appropriate length scale have been selected in [9-11]. In this
study, the length scale used is the hydraulic diameter of the test channel as defined in Equation 2
therefore; recalculation is necessary for comparison. The width of the flow channel is W, its
length is L and with height H.
2
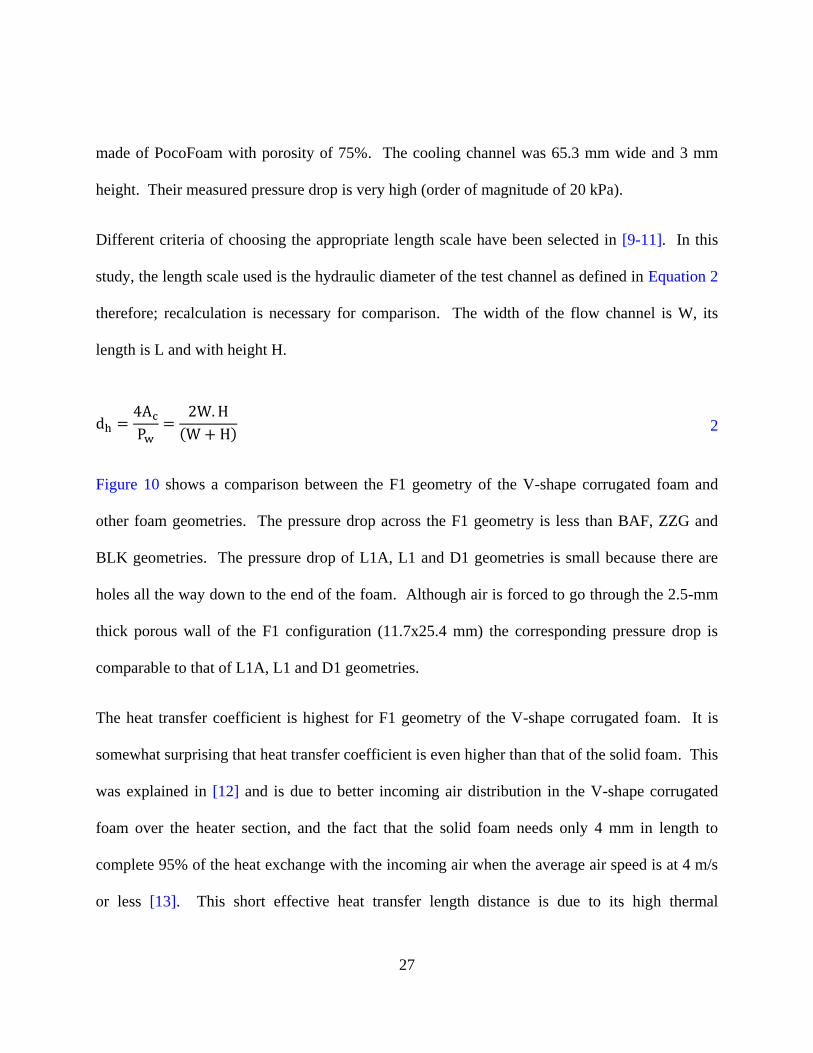
Figure 10 shows a comparison between the F1 geometry of the V-shape corrugated foam and
other foam geometries. The pressure drop across the F1 geometry is less than BAF, ZZG and
BLK geometries. The pressure drop of L1A, L1 and D1 geometries is small because there are
holes all the way down to the end of the foam. Although air is forced to go through the 2.5-mm
thick porous wall of the F1 configuration (11.7x25.4 mm) the corresponding pressure drop is
comparable to that of L1A, L1 and D1 geometries.
The heat transfer coefficient is highest for F1 geometry of the V-shape corrugated foam. It is
somewhat surprising that heat transfer coefficient is even higher than that of the solid foam. This
was explained in [12] and is due to better incoming air distribution in the V-shape corrugated
foam over the heater section, and the fact that the solid foam needs only 4 mm in length to
complete 95% of the heat exchange with the incoming air when the average air speed is at 4 m/s
or less [13]. This short effective heat transfer length distance is due to its high thermal
28
conductivity and the small pore size (0.3 mm). Therefore, the longer the solid foam length, the
worse is the average heat transfer coefficient.
Figure 10. Comparison between V-shape corrugated foam and other foam geometries
The performance of carbon foam geometries can be assessed by the rate of heat transfer from the
heated surface per unit temperature difference (HTC.Ab) with a specified fluid power. The
29
greater the ratio of the amount of the heat transfer rate per unit temperature difference that can be
rejected to the fluid power is, the better is the foam performance.
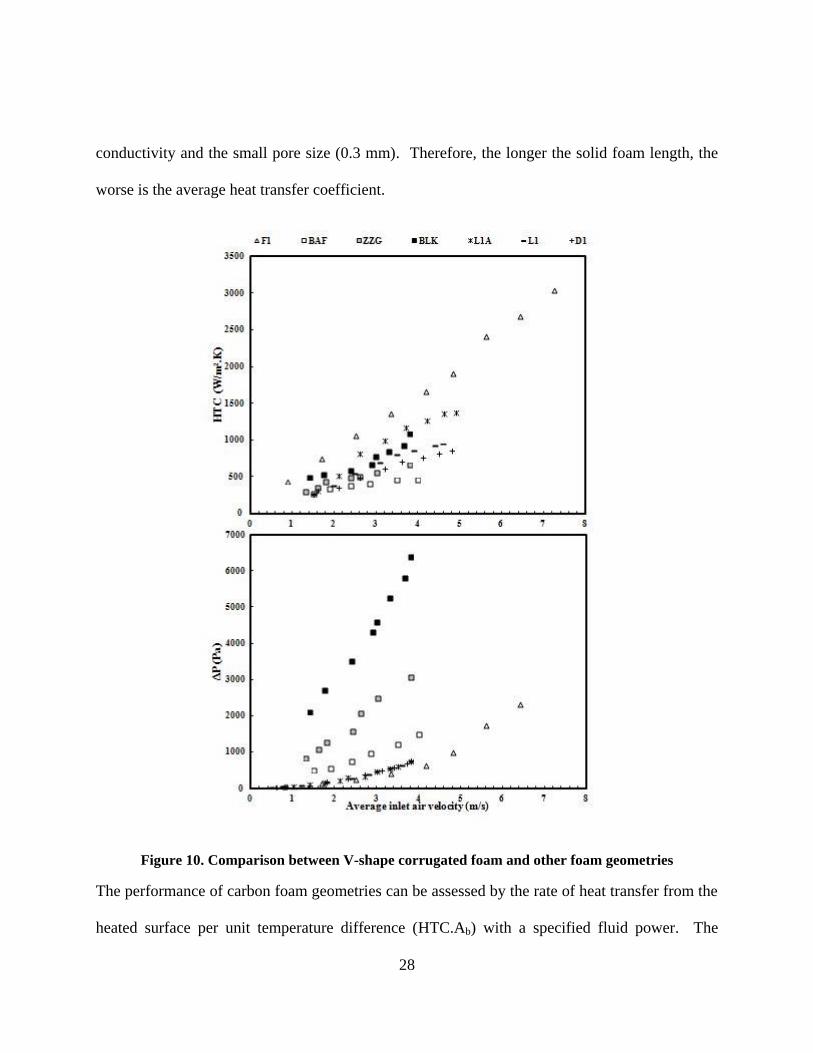
To compare and judge the fifteen different foam geometries, we need to eliminate any
geometrical dependency from the pressure drop and the heat transfer coefficient. Soland et al.
[15] introduced the volumetric heat transfer coefficient and fluid power per unit volume as
performance parameters which are defined in Equations 3 and 4. This volume V is defined as
the gross volume of the protruding surface (V=W.H.L).
3
4
Figure 11 shows the relation between the volumetric heat transfer coefficient and the fluid power
per unit volume for the nine foam geometries (F1 to F9) as well as the other foam geometries
(BAF, ZZG, BLK, L1A, L1 and D1). In general, the V-shape corrugated carbon foam shows the
best volumetric heat transfer coefficient for the same fluid power per unit volume. This is
because of the small values of pressure drop across the foam which is attributed to its small wall
thickness (2.5 mm). This small wall thickness of the foam is sufficient to provide an efficient
heat transfer process which leads to high heat transfer coefficient.
There is more than 220% enhancement in the volumetric heat transfer coefficient of the V-shape
corrugated carbon foam when compared to BAF, ZZG and BLK geometries. The enhancement
is 40% compared to L1A, L1 and D1 geometries.
30
Figure 11. Volumetric HTC vs fluid power per unit volume
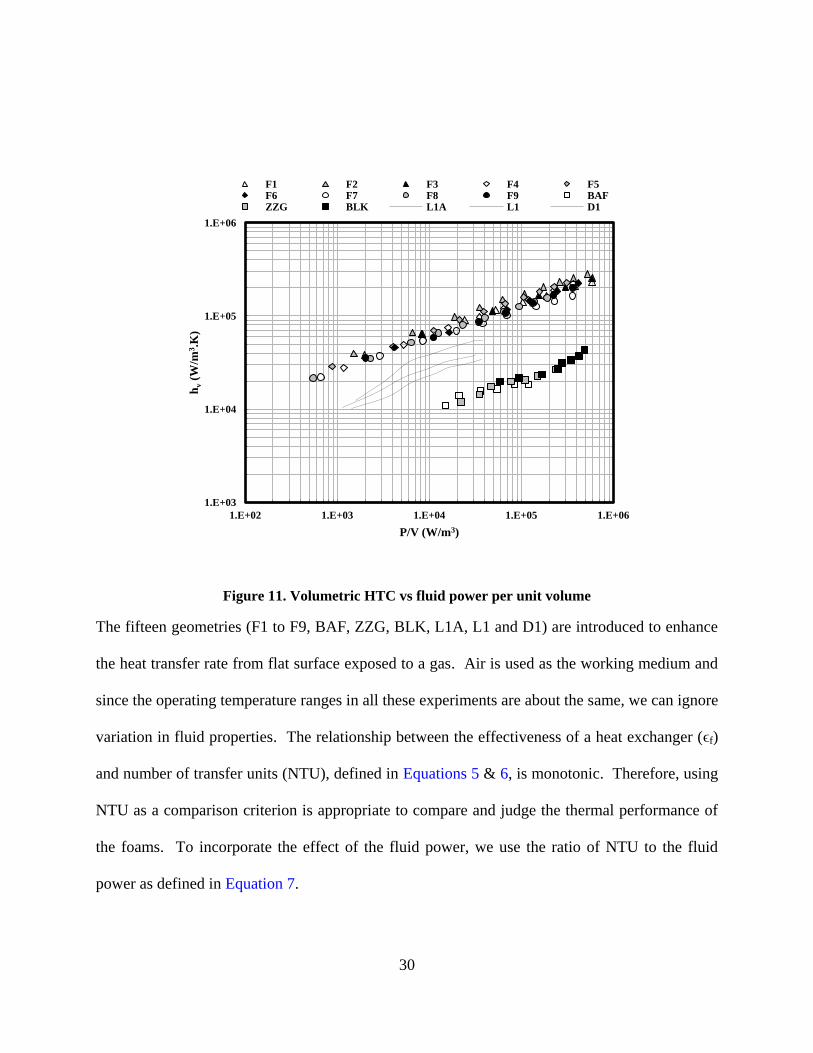
The fifteen geometries (F1 to F9, BAF, ZZG, BLK, L1A, L1 and D1) are introduced to enhance
the heat transfer rate from flat surface exposed to a gas. Air is used as the working medium and
since the operating temperature ranges in all these experiments are about the same, we can ignore
variation in fluid properties. The relationship between the effectiveness of a heat exchanger (ϵf)
and number of transfer units (NTU), defined in Equations 5 & 6, is monotonic. Therefore, using
NTU as a comparison criterion is appropriate to compare and judge the thermal performance of
the foams. To incorporate the effect of the fluid power, we use the ratio of NTU to the fluid
power as defined in Equation 7.
1.E+03
1.E+04
1.E+05
1.E+06
1.E+02 1.E+03 1.E+04 1.E+05 1.E+06
hv (
W/m
3.K
)
P/V (W/m3)
F1 F2 F3 F4 F5 F6 F7 F8 F9 BAF ZZG BLK L1A L1 D1

31
5
6
7
The relation between the ratio of NTU to the fluid power with the average air velocity (U) for all
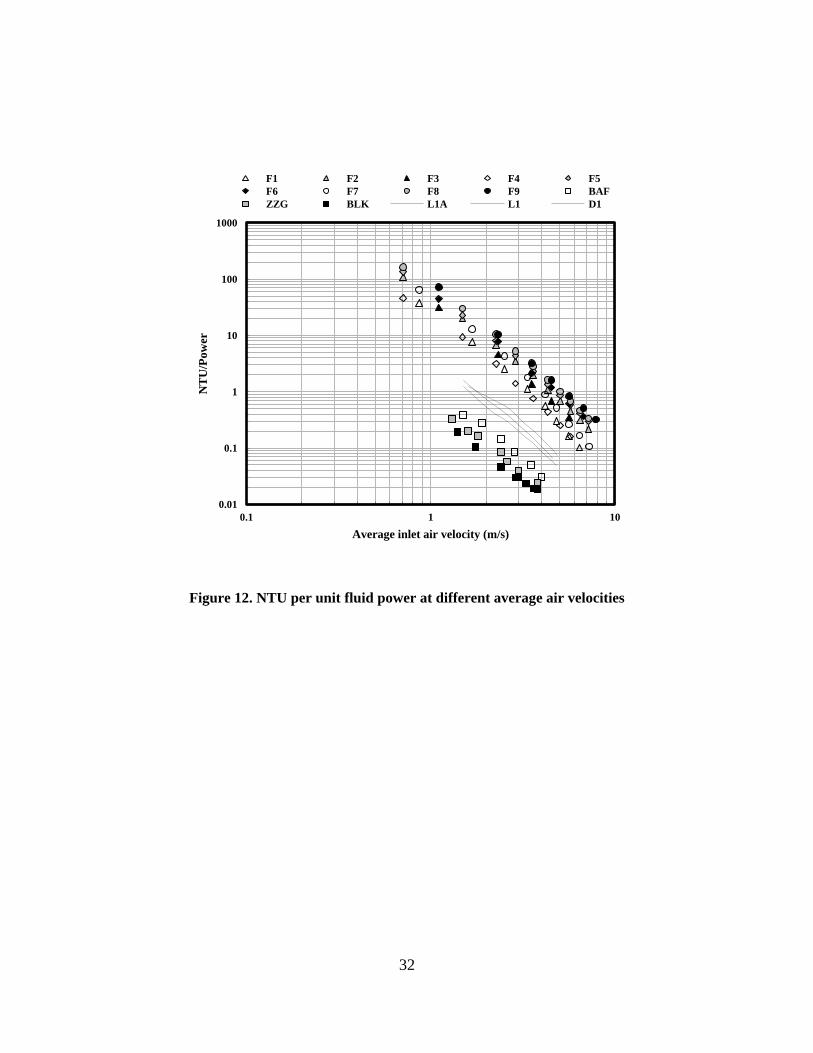
foam geometries is shown in Figure 12 At the same air velocity, all nine V-shape corrugated
carbon foam geometries show a higher NTU per unit fluid power when compared to BAF, ZZG,
BLK, L1A, L1 and D1 geometries.
There is at least 600% enhancement of the ratio of NTU to the fluid power of the V-shape
corrugated carbon foam when compared to BAF, ZZG and BLK geometries. The enhancement
is 200% when compared to L1A, L1 and D1 geometries.
32
Figure 12. NTU per unit fluid power at different average air velocities
0.01
0.1
1
10
100
1000
0.1 1 10
NT
U/P
ow
er
Average inlet air velocity (m/s)
F1 F2 F3 F4 F5
F6 F7 F8 F9 BAF
ZZG BLK L1A L1 D1

33
Conclusion
Thermal and hydraulic performance of the V-shape corrugated carbon foam was investigated.
Nine different configurations of the foam were tested with respect to their height and length. A
total of 81 test conditions were reported.
It was demonstrated that carbon foam is a very effective heat transfer medium because the heat
exchange with air flowing through the foam can be accomplished within a small distance. From
the performance point of view, a V-shape corrugated carbon foam of shortest length and tallest
height gives the best combination.
V-shape corrugated carbon foam shows better performance when compared with other foam
configurations. The benefit of using the V-shape corrugated carbon foam is the ability to obtain
high ratio of the heat transfer rate to the fluid power required to remove the heat. In general, V-
shape corrugated carbon foam shows at least a 40% increase in the volumetric heat transfer
coefficient at the constant fluid power per unit volume. The foam also can achieve at least 200%
increase in the ratio of NTU to the fluid power when compared to other foam geometries at the
same air velocity.
34
CHAPTER THREE: CARBON FOAM SIMULATION AND ANALYSIS
Numerical Method
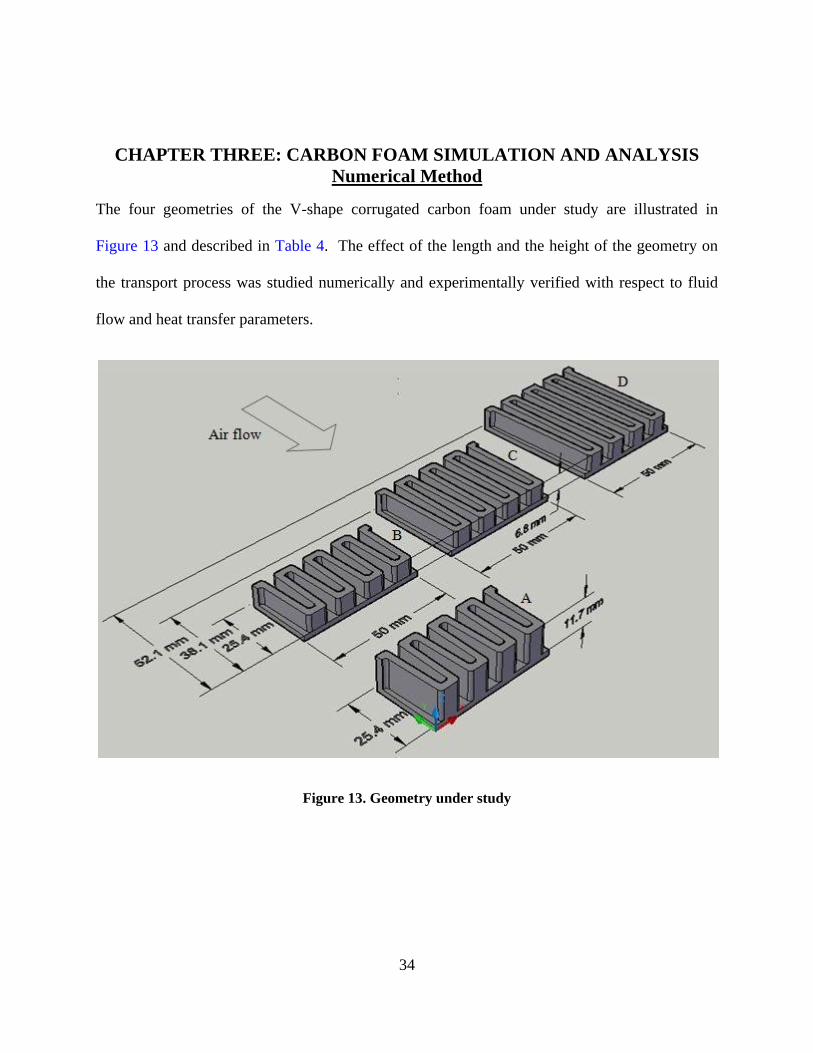
The four geometries of the V-shape corrugated carbon foam under study are illustrated in
Figure 13 and described in Table 4. The effect of the length and the height of the geometry on
the transport process was studied numerically and experimentally verified with respect to fluid
flow and heat transfer parameters.
Figure 13. Geometry under study

35
Table 4. Foam geometries
Configuration Width
(mm)
Height x Length
(mm)
V-shape vertex
angle (degrees)
# of free
channels
Wall thickness
(mm)
A 50 11.7x25.4 3.76 4 2.5
B 50 6.8x25.4 3.76 4 2.5
C 50 6.8x38.1 2.26 4 2.5
D 50 6.8x52.1 1.66 4 2.5
The computational domain of any of these geometries can be divided into two domains, as
shown in Figure 14: The free air flow domain, which consists of an empty channel occupied by
air and the porous matrix domain, which consists of carbon foam and air.
Figure 14. Computational domain
36
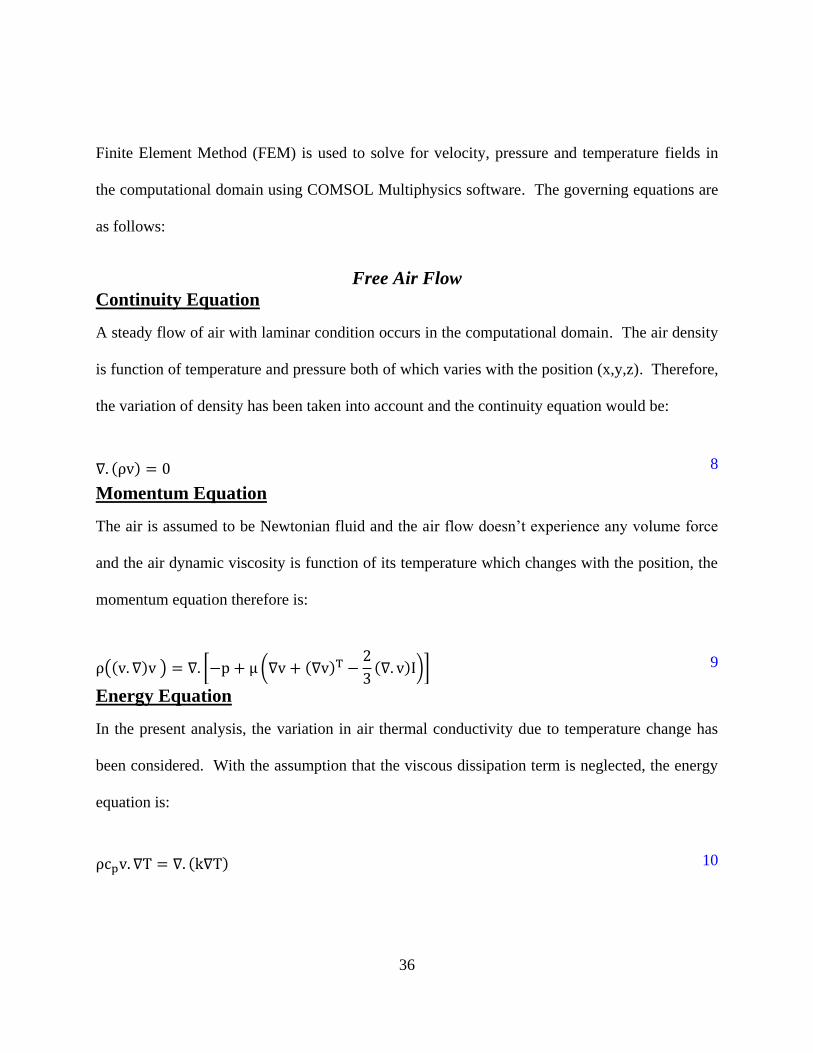
Finite Element Method (FEM) is used to solve for velocity, pressure and temperature fields in
the computational domain using COMSOL Multiphysics software. The governing equations are
as follows:
Free Air Flow
Continuity Equation
A steady flow of air with laminar condition occurs in the computational domain. The air density
is function of temperature and pressure both of which varies with the position (x,y,z). Therefore,
the variation of density has been taken into account and the continuity equation would be:
8
Momentum Equation
The air is assumed to be Newtonian fluid and the air flow doesn’t experience any volume force
and the air dynamic viscosity is function of its temperature which changes with the position, the
momentum equation therefore is:
9
Energy Equation
In the present analysis, the variation in air thermal conductivity due to temperature change has
been considered. With the assumption that the viscous dissipation term is neglected, the energy
equation is:
10

37
Porous Matrix
Continuity Equation
Through the porous matrix, the air velocity is called Darcy velocity or the filtration velocity (vf)
and the air density is affected by the change in pressure and temperature. Therefore, the
continuity equation is:
11
Momentum Equation
The flow in porous media is governed by Brinkman-Forchheimer-extended Darcy equation [16]
in which, the porosity appears in the convective acceleration term, the momentum diffusion term
and the component of the normal stress. Adding the pressure drop from Darcy law and
Forchheimer drag, the momentum equation is:
12
Energy Equation
The air flow is laminar and the filtration velocities as well as the average inlet air velocities are
limited to 4 m/s. The permeability of the porous matrix (K) is 1.5x10⁻¹⁰
m2. The air flow is
steady and no heat generation occurs in the solid or fluid phase. Under these conditions, the LTE
model is valid [17, 19, 20]. In this study, LTE condition is assumed and the temperature field in
the energy equation describes the temperature of the porous matrix. Viscous dissipation term is
neglected and the energy equation is:

38
13
where the effective thermal conductivity is defined as:
14
Boundary Conditions
The symmetry of the geometry allows reducing the size of the computational domain eight times,
as shown in Figure 14, which allows reducing the computational time. Laminar flow of air
enters the computational domain with an average of velocity (U) and the bottom is maintained at
constant temperature (Tfb) as shown in Figure 15. The boundary conditions used to solve this
problem is tabulated in Table 5 and shown in Figure 15. At the interface between the two
domains, continuity equation must be maintained along the interface, in other words, the mass
flow rate of air enters the interface must be equal to the mass flow rate of air that leaves the
interface. The air temperature and the shear stress are chosen to be continuous at the interface
for both domains [16, 21].
Table 5. Boundary conditions
Symbol Definition Parameter Value
a Inlet Average velocity (U) 0.71 up to 4 m/s
b Outlet Pressure 0
c Wall Velocity 0
d Symmetry .T & .v 0
e Temperature Temperature (Tbi, Tfb) 295 up to 334.4K
f Outflow .T 0
g Thermal Insulation .T 0
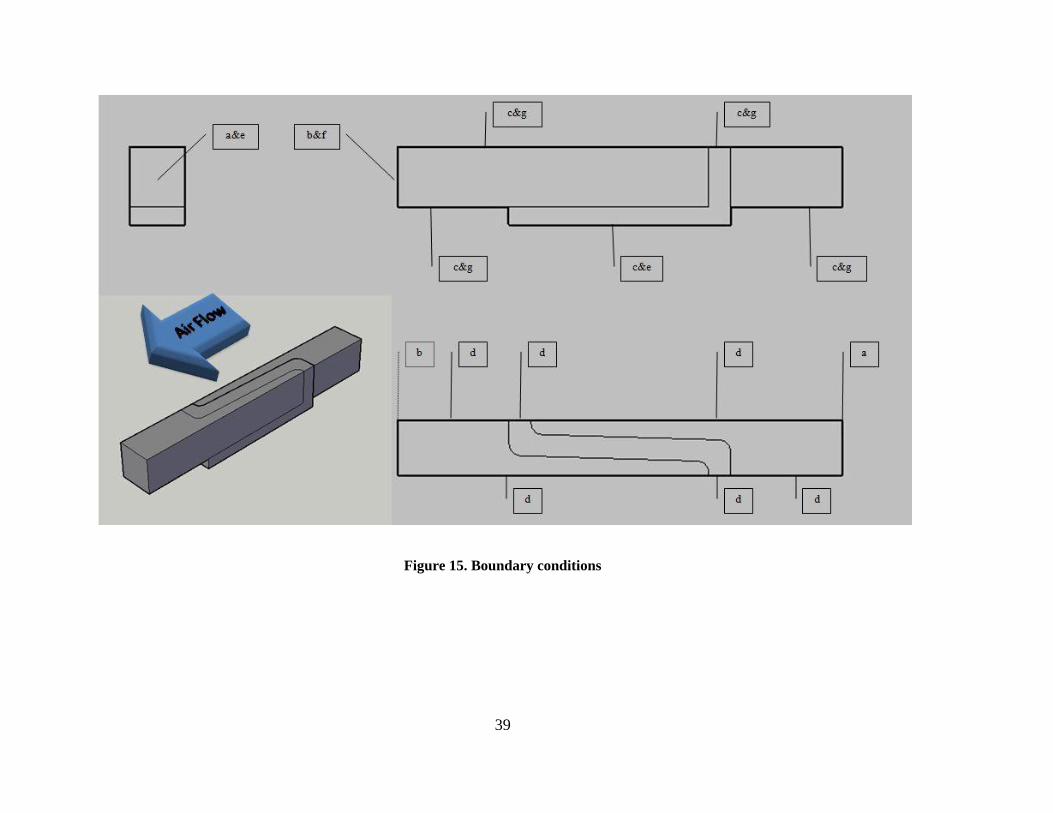
39
Figure 15. Boundary conditions

40
Problem Setup and Solution Procedure
Mesh independent solution has been verified for each of the four geometries, A, B, C and D
where the number of mesh elements is 736K, 832K, 880K and 921K. The mesh of any of these
geometries consists of tetrahedral, triangular, edge and vertex elements. The quality of an
element is a value between 0 and 1, where 0 represents a degenerated element and 1 represents a
completely symmetric element. The higher the quality of the mesh element the faster the
convergence is. The average element quality for all geometries is 0.77.
The solution of the equations that governs the transport process of air was started by solving the
continuity and momentum equations with coarse mesh to use the results of velocity and pressure
fields as an initial guess. The next step is to solve for velocity and pressure fields with refined
mesh. The process of mesh refinement was repeated until a mesh independent solution is
reached. Then solving the energy equation coupled with the continuity and momentum
equations to reach the final result of velocity, pressure and temperature fields. Convergence was
considered to be achieved when the solver iterates until a relative tolerance of 10-6
is fulfilled.
41
Numerical Results and Discussion
The post-processing of the numerical data for the foam pieces A, B, C and D focuses on two
parameters. First, the pressure drop across the foam which varies with the foam length and
height. The pressure drop is of interest since it determines the pumping power required to flow
the air through the foam therefore, it is desirable to have the least pressure drop though the foam
to maintain the minimum pumping power. The pressure drop across the foam (Δp) can be
characterized as:
a. Pressure drop through variable area channel with porous walls (Δp1).
b. Pressure drop across the foam walls (Δp2).
Air flowing across the V-shape corrugated carbon foam experiences the two pressure drops (Δp1
& Δp2). The total pressure drop (Δp) along a streamline is the sum of the two components since
they can be considered as two flow resistances connected in series. If laminar air enters the
computational domain, it was found that the air flow in the converging part of the free air flow
domain has to be laminar too.
Second, the heat transfer coefficient which determines the heat rate that can be rejected from unit
base area (Ab) with unit temperature difference between the base and the air inlet.
Carbon foam has anisotropic physical and thermal properties. Since the maximum height of the
foam pieces under study is 11.7 mm therefore, it is reasonable to assume that the foam has
constant porosity of 0.75, which is given by [10, 11, 31]. Thermal conductivity of carbon foam
is a distinct anisotropic thermal property. The effective thermal conductivity of the foam in the
growth direction of the graphite (keff) is 180 W/m.K while it is 40 W/m.K in the plane

42
perpendicular to the growth direction [1]. The permeability of the foam with air (K) is 1.5e-10
m2
while as the inertia coefficient (cf) is 0.44 [32].
Figure 16 shows the numerical results and experimental data for the relation between the average
inlet air velocity and the pressure drop for different foam lengths with the same foam height (B,
C and D). There is a good agreement between numerical results and experimental data. It is
somewhat surprising that the total pressure drop across the foam decreases slightly with
increasing the foam length. As air is forced to penetrate the foam wall of thickness of 2.5 mm,
the local filtration velocity (vf) crossing the foam wall decreases by increasing foam length since
longer foam length means that the wall has larger overall surface area for the air to penetrate the
foam. The uncertainty in pressure measurement equals to ±1% of the full scale value (± 25 Pa).
Figure 16. Effect of foam length on hydraulic performance
0
100
200
300
400
500
600
0 1 2 3 4 5
Pre
ssu
re D
rop
(P
a)
Average inlet air velocity (m/s)
Experiment 6.8x52.1 mm (D)
Experiment 6.8x38.1 mm (C)
Experiment 6.8x25.4 mm (B)
Numerical 6.8x52.1 mm (D)
Numerical 6.8x38.1 mm (C)
Numerical 6.8x25.4 mm (B)

43
Figure 17 shows the relation between the average inlet air velocity and the pressure drop for
different foam heights with the same foam length (A and B). As expected, changing the height
of the foam does not affect the pressure drop. The uncertainty in pressure measurement equals to
±1% of the full scale value (± 25 Pa).
Figure 17. Effect of foam height on the hydraulic performance
It is reasonable to say that the base temperature of a heat sink reflects its efficiency of removing
the heat at a same working conditions such as geometry, air velocity and heat load, so the closer
the difference between the base temperature of the heat sink and the air inlet temperature, the
higher the heat transfer coefficient is. From this prospective, the overall heat transfer coefficient
(HTC) is defined based on the difference between the foam base temperature (Tfb) and the inlet
air temperature (Tbi) as follows:
0
100
200
300
400
500
600
0 1 2 3 4 5
Pre
ssu
re D
rop
(P
a)
Average inlet air velocity (m/s)
Experiment 11.7x25.4 mm (A)
Experiment 6.8x25.4 mm (B)
Numerical 11.7x25.4 mm (A)
Numerical 6.8x25.4 mm (B)

44
15
In some cases under study (B, C and D) where the foam height is 6.8 mm, the air temperature
approaches the foam base temperature at the exit section of the porous matrix, which means that
the air picked up all the heat that it can to and the effectiveness (ϵf) in such cases is at least
98.8% as shown in Table 6.
Table 6. Numerical results
Geometry
U
(m/s)
Tbo
(K)
Tfb
(K)
ϵf
%
B (6.8x25.4 mm)
0.71 339.4 339.6 99.6
1.49 324.9 325.0 99.4
2.26 316.9 317.1 99.2
2.89 312.4 312.5 99.0
3.60 308.3 308.5 98.8
C (6.8x38.1 mm)
0.71 336.7 336.8 99.7
1.49 322.8 322.9 99.6
2.26 315.1 315.3 99.4
2.89 310.8 310.9 99.3
3.60 306.9 307.0 99.1
D (6.8x52.1 mm)
0.71 335.6 335.7 99.7
1.49 322.5 322.6 99.6
2.26 315.2 315.3 99.5
2.89 311.1 311.2 99.4
3.60 307.4 307.5 99.3
A (11.7x25.4 mm)
0.87 336.5 337.3 98.2
1.68 321.9 322.8 96.6
2.51 313.3 314.4 94.5
4 306.5 307.5 92.0
The boundary condition at the foam base is constant temperature which is measured in the
experiment. The validation of the constant foam base temperature model is done by comparing
the total heat rate transferred to the air from experiment and that from numerical results using the
following equation:
45
16
The relation between the average inlet air velocity and the overall heat transfer coefficient for
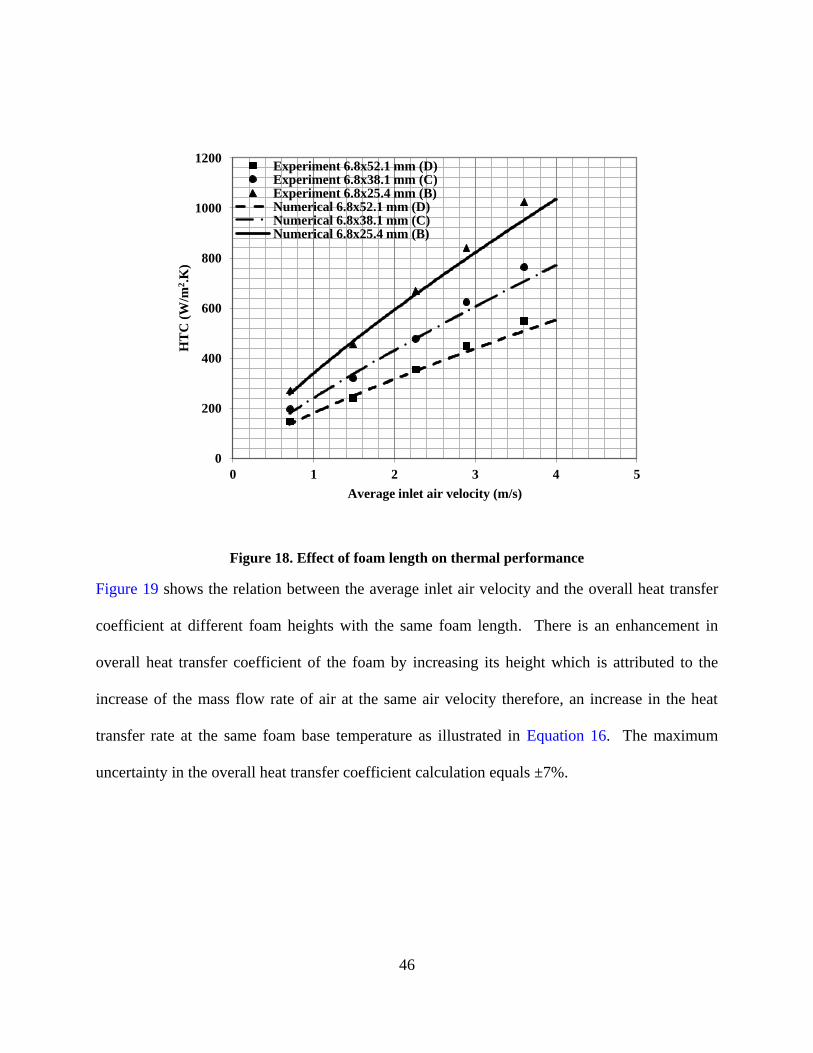
different foam lengths with the same foam height is illustrated in Figure 18. At a fixed inlet air
velocity and heat load, the variation of the base temperature for all foam pieces is a little, as
illustrated in Table 6. The base area of the foam is proportional to the foam length therefore; the
base area ratio of the foams B, C and D is 1:1.5:2.05. The overall heat transfer coefficient is
inversely proportional to the base area of the foam. For the same heat load, temperature
difference and air velocity, the shorter the foam length, the higher is the overall heat transfer
coefficient. The maximum uncertainty in the overall heat transfer coefficient calculation equals
±7%.
46
Figure 18. Effect of foam length on thermal performance
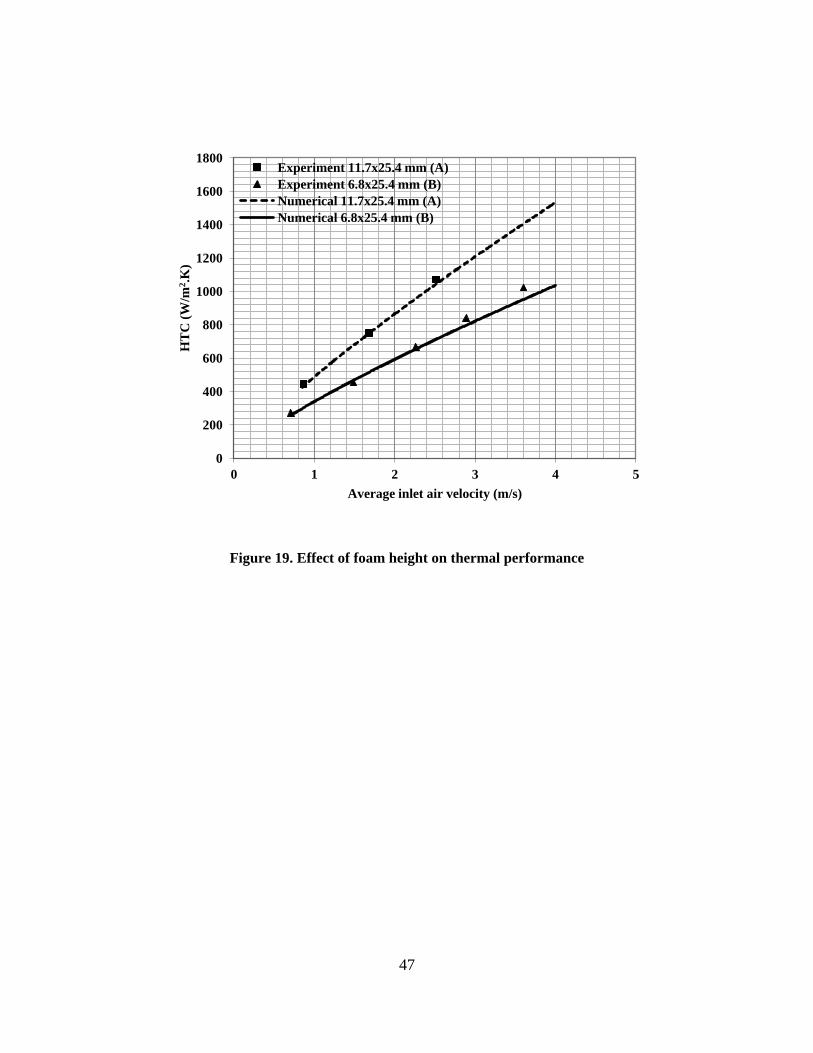
Figure 19 shows the relation between the average inlet air velocity and the overall heat transfer
coefficient at different foam heights with the same foam length. There is an enhancement in
overall heat transfer coefficient of the foam by increasing its height which is attributed to the
increase of the mass flow rate of air at the same air velocity therefore, an increase in the heat
transfer rate at the same foam base temperature as illustrated in Equation 16. The maximum
uncertainty in the overall heat transfer coefficient calculation equals ±7%.
0
200
400
600
800
1000
1200
0 1 2 3 4 5
HT
C (
W/m
2.K
)
Average inlet air velocity (m/s)
Experiment 6.8x52.1 mm (D) Experiment 6.8x38.1 mm (C) Experiment 6.8x25.4 mm (B) Numerical 6.8x52.1 mm (D) Numerical 6.8x38.1 mm (C) Numerical 6.8x25.4 mm (B)
47
Figure 19. Effect of foam height on thermal performance
0
200
400
600
800
1000
1200
1400
1600
1800
0 1 2 3 4 5
HT
C (
W/m
2.K
)
Average inlet air velocity (m/s)
Experiment 11.7x25.4 mm (A)
Experiment 6.8x25.4 mm (B)
Numerical 11.7x25.4 mm (A)
Numerical 6.8x25.4 mm (B)
48
Analytical Method
Due to the open, interconnected void structure of the carbon foam, the flow through it can be
considered as flow in minichannels connected in parallel. The minichannels have variable cross-
section area therefore, the air velocity changes. Although the velocity changes along the flow
path of air but the mass conservation has to be maintained. As a result, the average flow velocity
through the foam can be defined as the filtration velocity (vf) that satisfies the conservation of
mass for a predefined area and fluid condition.
As air flows inside the minichannel, it picks up heat from the surface. After traveling a distance
(x) on the order of several foam pore size (dp ≈ 300 µm), the air is able to pick more than 99% of
the heat from the surface. This allows the air temperature to approach the surface temperature of
the foam.
For the foam pieces B, C and D, the effectiveness of the minichannel and the foam (ϵm and ϵf
respectively) are more than 98.8% as proven by numerical analysis and experiment, it is
reasonable to assume that the foam base temperature (Tfb) equals to the minichannel surface
temperature at a given height (Tfs) and equals to that of exit air from the minichannel. From the
energy balance applied to the air inside the minichannel at a given air flow rate; the average
overall heat transfer coefficient (HTC) can be calculated as follows:
17
We assume that the minichannels have a constant diameter (dm) equals to half the pore size of the
carbon foam (dp ≈ 300 µm). The effectiveness of the minichannel is
. Control
49
volume analysis on the air inside the minichannel defines the bulk air temperature distribution
inside the channel as follows:
18
where is the average interfacial heat transfer coefficient, based on the logarithmic mean
temperature difference after distance (x) from the inlet, for the entrance and the fully developed
regions combined [33] (Equation 19), P is the wetted perimeter, x is the distance measured from
the inlet section to the minichannels and is the mass flow rate of air through one
minichannel. The temperature dependency of Nusselt number which appears in the
theromphysical properties of air (ρ, Pr, µ and µs), can be taking into account by referring to
numerical and experimental results.
19
Conservation of mass on the air provides the filtration velocity (vf) in terms of the average inlet
air velocity (U) as illustrated in Equation 20.
20
50
where W and H are the foam width and height respectively, ac is the cross-sectional area of one
minichannel, as is the surface area of one minichannel, n is the total number of minichannels, t is
the foam thickness, RAV is the surface area to volume ratio of carbon foam, Lf is the total length
of the corrugated foam wall and V is the volume of the foam.
The air volume in the porous matrix is the same as in the minichannels therefore, the
minichannel diameter (dm) is related to the surface area to volume ratio of carbon foam (RAV) by:
21
The average interfacial heat transfer coefficient based on the logarithmic mean temperature
difference and the average interfacial heat transfer coefficient based on are
related by:
22
51
Analytical Results and Discussion
Air flows inside the interconnected void structure of the foam which can be considered as a flow
inside conduits with variable cross-sectional area. The principle of hydraulic diameter allows
simplifying this case into a constant diameter pipe (dm). This simplification allows us to have
better understanding of transport phenomena in carbon foam.
A comparison between analytical and numerical results is presented in Table 7. The volume of
the foam (V) is the volume that contributes in the heat transfer process between the air and the
surface. Such volume can be calculated based on the length of the minichannel required to
achieve 99.9% of the total heat transfer rate from the inlet (t99.9%) and this length is not the actual
foam thickness (2.5 mm). It turns out that the surface area to volume ratio of the foam is 20000
(m2/m
3) for the foam pieces B, C and D. This value agrees with the value range reported in
literature [10, 31]. The corresponding minichannel diameter (dm) can be calculated from
Equation 21, which is found to be 0.15 mm.
It is reasonable to assume that the foam base temperature is the same as the foam surface
temperature at any height of the foam since the effectiveness of the foam is greater than
98.8% for the foam pieces B, C and D as shown in Table 6. The effectiveness of the foam piece
(A) ranges between 92% and 98.2%, which means that the variation in the foam temperature
along its height is somewhat significant and therefore, the assumption is not as valid.
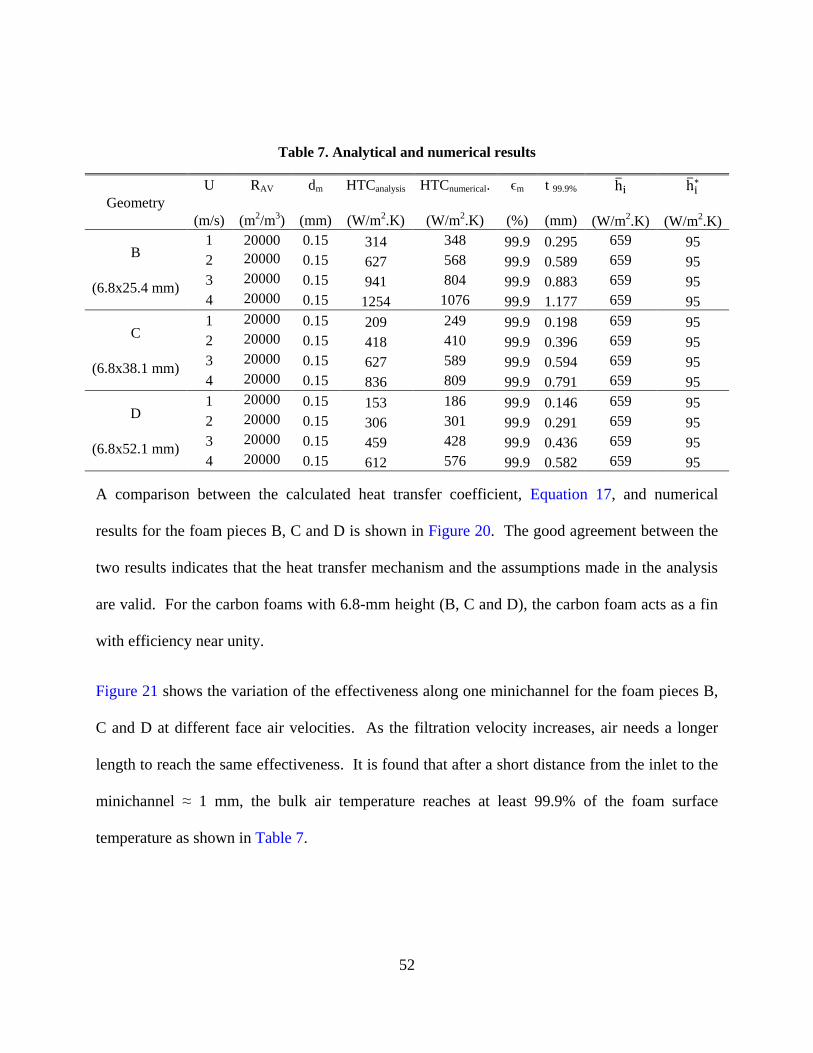
52
Table 7. Analytical and numerical results
Geometry
U
(m/s)
RAV
(m2/m3)
dm
(mm)
HTCanalysis
(W/m2.K)
HTCnumerical.
(W/m2.K)
ϵm
(%)
t 99.9%
(mm)
(W/m2.K)
(W/m2.K)
B
(6.8x25.4 mm)
1 20000 0.15 314 348 99.9 0.295 659 95
2 20000 0.15 627 568 99.9 0.589 659 95
3 20000 0.15 941 804 99.9 0.883 659 95
4 20000 0.15 1254 1076 99.9 1.177 659 95
C
(6.8x38.1 mm)
1 20000 0.15 209 249 99.9 0.198 659 95
2 20000 0.15 418 410 99.9 0.396 659 95
3 20000 0.15 627 589 99.9 0.594 659 95
4 20000 0.15 836 809 99.9 0.791 659 95
D
(6.8x52.1 mm)
1 20000 0.15 153 186 99.9 0.146 659 95
2 20000 0.15 306 301 99.9 0.291 659 95
3 20000 0.15 459 428 99.9 0.436 659 95
4 20000 0.15 612 576 99.9 0.582 659 95
A comparison between the calculated heat transfer coefficient, Equation 17, and numerical
results for the foam pieces B, C and D is shown in Figure 20. The good agreement between the
two results indicates that the heat transfer mechanism and the assumptions made in the analysis
are valid. For the carbon foams with 6.8-mm height (B, C and D), the carbon foam acts as a fin
with efficiency near unity.
Figure 21 shows the variation of the effectiveness along one minichannel for the foam pieces B,
C and D at different face air velocities. As the filtration velocity increases, air needs a longer
length to reach the same effectiveness. It is found that after a short distance from the inlet to the
minichannel ≈ 1 mm, the bulk air temperature reaches at least 99.9% of the foam surface
temperature as shown in Table 7.

53
Figure 20. HTC analytical and numerical results
As the average inlet air velocity increases, the filtration velocity increases (Equation 20) and the
average overall heat transfer coefficient increases (Equation 17). The position inside the
minichannel at which 99.9% of the heat rate is transferred to the air varies with the average inlet
air velocity. The variation of this position with the average inlet air velocity is illustrated in
Table 7.
The temperature difference between the foam surface and air is the driving potential of the heat
transfer process. This temperature difference decreases as air marches inside the minichannel.

54
Eventually after distance x from the inlet of the minichannel, the effectiveness of the
minichannel approaches unity, therefore this temperature difference approaches zero leaving no
potential for the heat to transfer as illustrated in Equation 16. The relation between the average
interfacial heat transfer coefficient based on (Tfs-Tbi) and the logarithmic mean temperature
difference along one minichannel is illustrated in Equation 22 and both values are given in
Table 7.
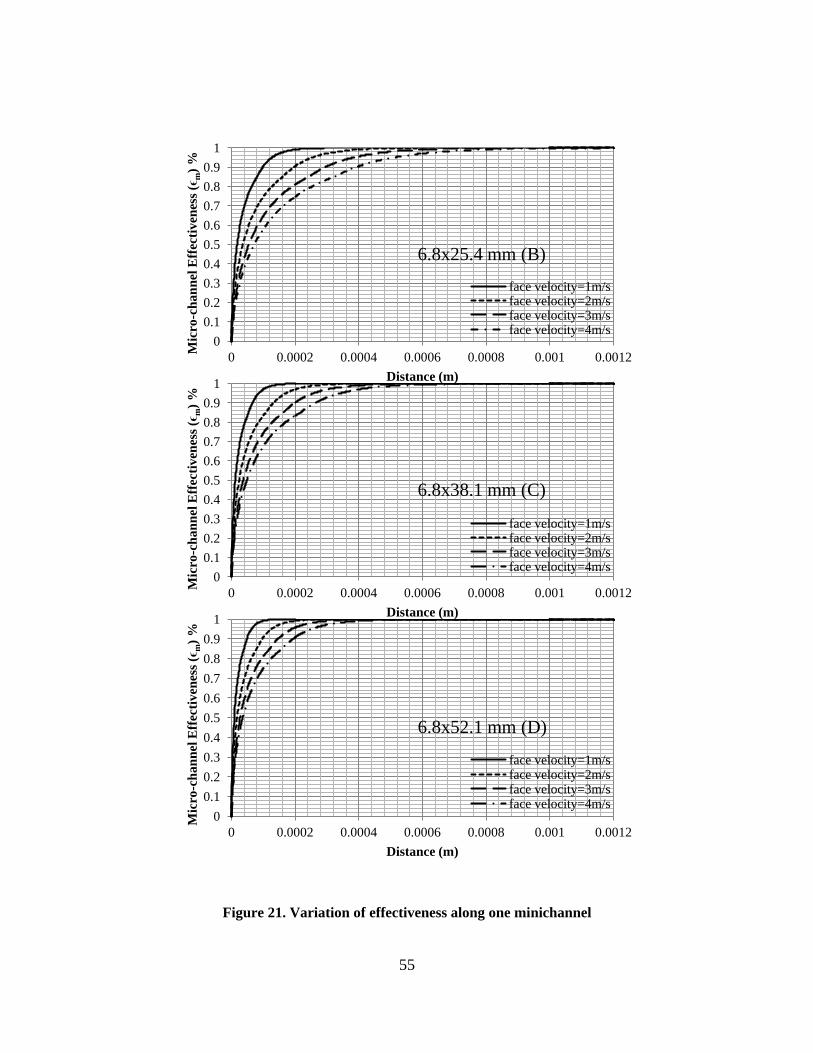
55
Figure 21. Variation of effectiveness along one minichannel
0
0.1
0.2
0.3
0.4
0.5
0.6
0.7
0.8
0.9
1
0 0.0002 0.0004 0.0006 0.0008 0.001 0.0012
Mic
ro-c
ha
nn
el E
ffec
tiv
enes
s (ϵ
m)
%
Distance (m)
6.8x25.4 mm (B)
face velocity=1m/s face velocity=2m/s face velocity=3m/s face velocity=4m/s
0
0.1
0.2
0.3
0.4
0.5
0.6
0.7
0.8
0.9
1
0 0.0002 0.0004 0.0006 0.0008 0.001 0.0012
Mic
ro-c
ha
nn
el E
ffec
tiv
enes
s (ϵ
m)
%
Distance (m)
6.8x38.1 mm (C)
face velocity=1m/s face velocity=2m/s face velocity=3m/s face velocity=4m/s
0
0.1
0.2
0.3
0.4
0.5
0.6
0.7
0.8
0.9
1
0 0.0002 0.0004 0.0006 0.0008 0.001 0.0012
Mic
ro-c
han
nel
Eff
ecti
ven
ess
(ϵm
) %
Distance (m)
6.8x52.1 mm (D)
face velocity=1m/s face velocity=2m/s face velocity=3m/s face velocity=4m/s
56
Conclusion
Numerical analysis of thermal and hydraulic characteristics of four V-shape corrugated carbon
foam geometries was carried out. The pressure drop and the overall heat transfer coefficient for
the four geometries were calculated. Numerical results were validated by experimental data with
respect to the pressure drop, the heat transfer coefficient and the overall heat balance. For the
given inlet air velocity range (0.71 - 4 m/s), the pressure drop ranges from 53 to 531 Pa and the
heat transfer coefficient ranges from 186 to 1602 W/m2.K. There is a good agreement between
numerical and experimental results.
An analytical method is introduced by simplifying the flow in porous media into flow in
minichannels connected in parallel. The minichannel diameter is assumed to be 0.15 mm while
the surface area to volume ratio is 20000 m2/m
3. The conservation of transport parameters was
maintained in the analysis. Analytical results show that mass conservation requires the total
length of the corrugated foam wall (Lf), the foam width (W) and foam porosity (ε) to be known.
Numerical results revealed an important finding about the foam wall thickness required to
achieve 99.9% of the heat transfer process. For the given air velocity range (0.711-4 m/s), It is
found that ≈ 1 mm foam wall thickness is enough to complete the heat transfer process between
the air and the foam.
57
CHAPTER FOUR: CARBON FOAM APPLICATIONS
Compact air-cooled heat sink is an essential component for electronics and aerospace
applications. Compared to vapor-compression refrigeration, spray-cooled enclosures, and liquid-
cooled manifolds, air-cooled heat sinks do not rely on the operation of the active pumps and
compressors. Additionally, air-cooled heat sinks are worry-free of coolant leakage and many
other related factors that increase the cost of the systems. In many electronics and aerospace
applications, it is more practical to supply forced air flow to the components directly. Designers,
therefore, would prefer implementing air cooling if its thermal performance could meet their
requirements. For that reason, investigation of forced air convective heat transfer and pressure
drop in a channel filled with V-shape corrugated carbon foams is of particular interest.
In chapter 2 and 3, experiment, simulation and analysis of the V-shape carbon foam demonstrate
that the V-shape corrugated carbon foam is a very promising material for use in air cooling
applications where high heat transfer coefficient with minimal pressure drop is required. In this
chapter we introduce a practical evidence of the feasibility of the V-shape corrugated carbon
foam of reducing the size of a traditional air-cooled condenser at the same heat load.
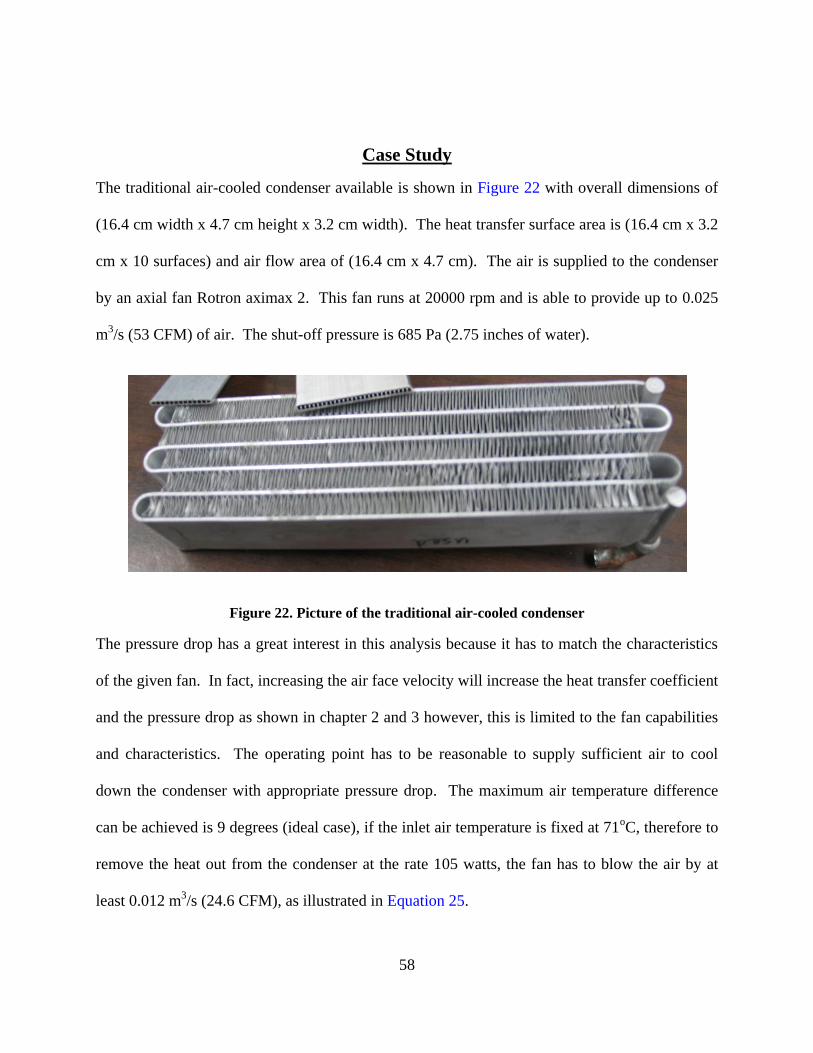
58
Case Study
The traditional air-cooled condenser available is shown in Figure 22 with overall dimensions of
(16.4 cm width x 4.7 cm height x 3.2 cm width). The heat transfer surface area is (16.4 cm x 3.2
cm x 10 surfaces) and air flow area of (16.4 cm x 4.7 cm). The air is supplied to the condenser
by an axial fan Rotron aximax 2. This fan runs at 20000 rpm and is able to provide up to 0.025
m3/s (53 CFM) of air. The shut-off pressure is 685 Pa (2.75 inches of water).
Figure 22. Picture of the traditional air-cooled condenser
The pressure drop has a great interest in this analysis because it has to match the characteristics
of the given fan. In fact, increasing the air face velocity will increase the heat transfer coefficient
and the pressure drop as shown in chapter 2 and 3 however, this is limited to the fan capabilities
and characteristics. The operating point has to be reasonable to supply sufficient air to cool
down the condenser with appropriate pressure drop. The maximum air temperature difference
can be achieved is 9 degrees (ideal case), if the inlet air temperature is fixed at 71oC, therefore to
remove the heat out from the condenser at the rate 105 watts, the fan has to blow the air by at
least 0.012 m3/s (24.6 CFM), as illustrated in Equation 25.
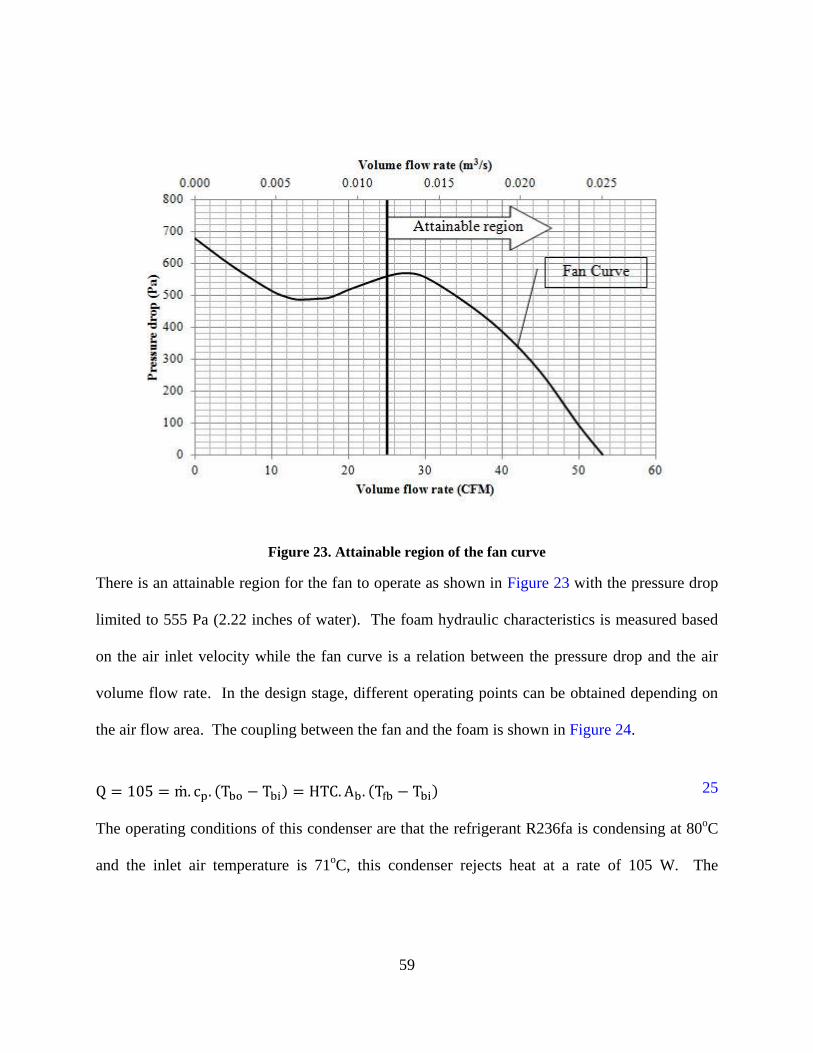
59
Figure 23. Attainable region of the fan curve
There is an attainable region for the fan to operate as shown in Figure 23 with the pressure drop
limited to 555 Pa (2.22 inches of water). The foam hydraulic characteristics is measured based
on the air inlet velocity while the fan curve is a relation between the pressure drop and the air
volume flow rate. In the design stage, different operating points can be obtained depending on
the air flow area. The coupling between the fan and the foam is shown in Figure 24.
25
The operating conditions of this condenser are that the refrigerant R236fa is condensing at 80oC
and the inlet air temperature is 71oC, this condenser rejects heat at a rate of 105 W. The
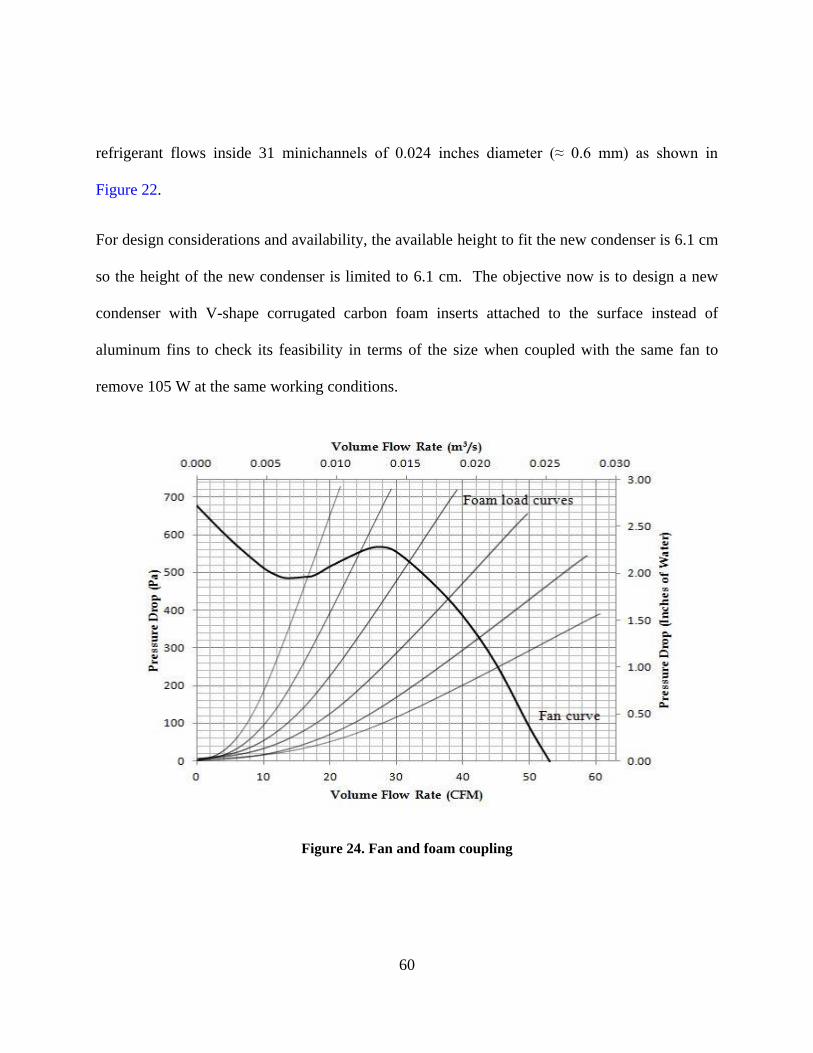
60
refrigerant flows inside 31 minichannels of 0.024 inches diameter (≈ 0.6 mm) as shown in
Figure 22.
For design considerations and availability, the available height to fit the new condenser is 6.1 cm
so the height of the new condenser is limited to 6.1 cm. The objective now is to design a new
condenser with V-shape corrugated carbon foam inserts attached to the surface instead of
aluminum fins to check its feasibility in terms of the size when coupled with the same fan to
remove 105 W at the same working conditions.
Figure 24. Fan and foam coupling

61
Condenser Analysis and Design
Based on design considerations and performance, the V-shape corrugated carbon foam piece of
6.8 mm height and 25.4 mm length is selected to replace aluminum fins. The height of the
condenser will be fixed at 6.1 cm (2.4 inches) while its width (W*) will be determined based on
the criterion of removing 105 W from the condenser surface. The new condenser with the foam
inserts is illustrated in Figure 25. Air at 71oC flows inside a square duct of 6.1 cm height.
Impermeable packing material is attached to the side bends of the condenser to prevent air
leakage as shown in Figure 25. The refrigerant gas comes from the gas inlet header which is
located at the top of the condenser then through 25 minichannels of 0.024 inches diameter
(≈ 0.06 mm). Number of minichannels is reduced from 31 to 25 because the width of the
condenser decreased from 32 mm to 25.4 mm. The condensate liquid exits the condenser from
the liquid header at the bottom of the condenser.
HTC is defined based on the difference in temperature between the foam base and the inlet air
(Tfb-Tbi). This definition of the HTC allows simplifying the problem to one-dimensional heat
transfer problem since the temperature potential is constant along thermal resistances everywhere
within the condenser. Four cases are studied based on the condition of the refrigerant gas at inlet
and the condition of the refrigerant liquid at exit. The calculation detail is shown in Appendix C.
These cases are:
Case 1: Inlet gas at 40o superheat, condensation at 80
oC and liquid exits at 4
oC subcooling.
Case 2: Inlet gas at 40o superheat, condensation at 80
oC and no subcooling.
Case 3: No superheat, condensation at 80oC and liquid exits at 4
oC subcooling.

62
Case 4: No superheat, condensation at 80oC and No subcooling.
Assumptions:
1. One – dimensional heat transfer model.
2. Axial conduction is neglected (aluminum channel thickness < 0.5 mm).
3. Conduction resistance is neglected compared to the air side, refrigerant gas,
refrigerant liquid and condensation resistances.
4. The variation of air properties is neglected (Tmax = 9o).
5. The average temperature of the refrigerant gas and the refrigerant liquid will be used
in calculation.
6. Contact resistance is neglected.
Figure 25. New condenser with carbon foam inserts
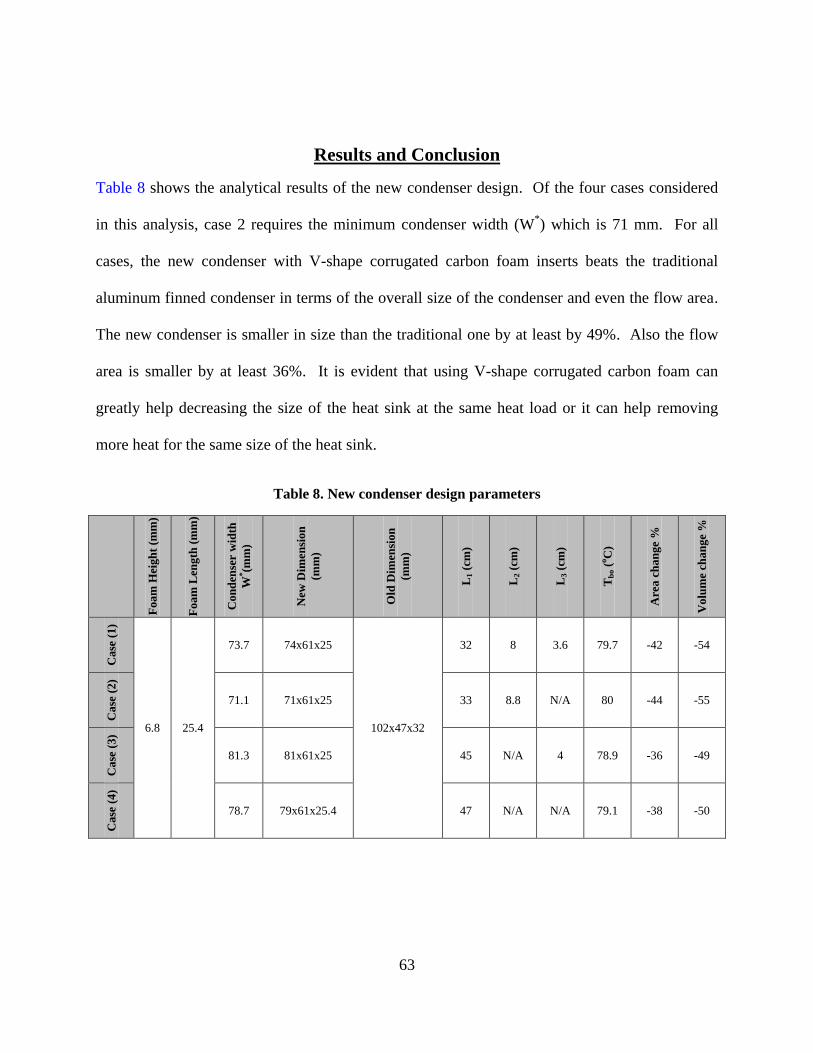
63
Results and Conclusion
Table 8 shows the analytical results of the new condenser design. Of the four cases considered
in this analysis, case 2 requires the minimum condenser width (W*) which is 71 mm. For all
cases, the new condenser with V-shape corrugated carbon foam inserts beats the traditional
aluminum finned condenser in terms of the overall size of the condenser and even the flow area.
The new condenser is smaller in size than the traditional one by at least by 49%. Also the flow
area is smaller by at least 36%. It is evident that using V-shape corrugated carbon foam can
greatly help decreasing the size of the heat sink at the same heat load or it can help removing
more heat for the same size of the heat sink.
Table 8. New condenser design parameters
Foam
Hei
gh
t (m
m)
Foam
Len
gth
(m
m)
Con
den
ser w
idth
W*(m
m)
New
Dim
en
sion
(mm
)
Old
Dim
en
sion
(mm
)
L1 (
cm)
L2 (
cm)
L3 (
cm)
Tb
o (
oC
)
Are
a c
han
ge
%
Volu
me
chan
ge
%
Case
(1)
6.8 25.4
73.7 74x61x25
102x47x32
32 8 3.6 79.7 -42 -54
Case
(2)
71.1 71x61x25 33 8.8 N/A 80 -44 -55
Case
(3)
81.3 81x61x25 45 N/A 4 78.9 -36 -49
Case
(4)
78.7 79x61x25.4 47 N/A N/A 79.1 -38 -50
64
CHAPTER FIVE: HIGHLY ORIENTED PYROLYTIC GRAPHITE
(HOPG)
Introduction
Natural graphite structure is usually amorphous because of defects and impurities contained
within the structure. Many technologies are developed to prepare perfect graphite samples. Of
these, pyrolysis is the most common and effective technique. Pyrolysis is a thermochemical
decomposition of organic material at high temperatures with the absence of oxygen, water or any
other reagents. It involves the simultaneous change of chemical composition and physical phase.
Highly oriented pyrolytic graphite (HOPG) is a graphite material with a high degree of preferred
crystallographic orientation in the plane perpendicular to the surface of the substrate (z-plane or
out-of-plane). HOPG is obtained by graphitization heat treatment of carbon or by chemical
vapor deposition at temperatures above 2500K then annealed under pressure at approximately
3300K.
The density, parameters of the crystal lattice, preferable orientation in the plane of the surface of
the substrate and anisotropy of thermal and physical properties of the HOPG are close to those of
natural graphite. The crystal structure of HOPG is uniquely characterized by the arrangement of
carbon atoms which are stacked in parallel layers. In each layer, atoms form a grid of exact
hexagons with distance between two adjacent atoms in xy plane (in-plane) equals 0.1415 nm.
The distance between two adjacent atoms in two different layers equals 0.335 nm. [34, 35] as
shown in Figure 26.
Graphite structure by itself is anisotropic, because coupling in xy planes is due to the mutual
strong bonds, whereas in z-planes, coupling is weak. The structural anisotropy results in
65
anisotropy of thermal properties like thermal conductivity [36]. HOPG is graphite with more
crystalline perfection due to high temperature and pressure treatment.
Figure 26. Crystal structure of HOPG
The in-plane thermal conductivity kxy of HOPG is about 1700 W/m.K which is four to five times
that of copper and the out-of-plane thermal conductivity kz of about 8 W/m.K at room
temperature. Figure 27 shows HOPG material’s thermal conductivities kxy and kz as function of
temperature and the anisotropy ratio (kxy/kz) [37, 38].
Therefore, HOPG is a highly anisotropic material with distinct thermal properties which can be
useful in thermal applications in which axial conduction is crucial and needed to be minimized
such as cryocoolers and recuperators. Due to it high thermal conductivity in xy plane, HOPG
can also be very useful to produce effective micro-channels for high heat flux applications.
66
Figure 27. In-plane thermal conductivity kxy, out-of-plane thermal conductivity kz and anisotropy
ratio as a function of temperature
To implement HOPG in thermal management application, machining of the HOPG is required.
Different machining techniques are introduced in literature [39-41]. Park et al. [39] made 100
nm holes on HOPG surface using a metal-coated atomic force microscope (AFM). Song et al.
[40] fabricated various nanostructures on HOPG based on mechanical machining and field
evaporation. The basic idea is to transfer a known pattern into an encoded voltage pulse series
and synchronize it with scanning probe microscopy (SPM). Hole drilling and polishing of
HOPG was performed by Windholz and Molian [41] by a laser beam of a 248 nm wavelength,
23 ns pulse. The depth removed per pulse is 0.3 µm.
0.01
0.1
1
10
100
1000
10000
1 10 100 1000
Th
erm
al
con
du
ctiv
ity (
W/m
.K)
&
An
isotr
op
y r
ati
o (
kx
y/k
z)
Temperature (K)
In-Plane thermal conductivity out-of-Plane thermal conductivity Anisotropy ratio
67
HOPG Micro-Channel
Thermal performance of a micro-channel made of thermal conductors like copper and aluminum
will be compared to that made of HOPG at the same working conditions. Fluid flow is allowed
to enter a micro-channel of height H* and spacing L
* between two adjacent walls of thickness t
*
and the micro-channel base is subjected to a heat source supplying heat at a rate of Q, as shown
in Figure 28. A key thermal performance factor of micro-channel is the heat transfer rate that
can be removed from the base. Hence we want to put as many fins as possible (meaning we
want to keep t* and L
* to a minimum, resulting in the maximum number of fins). The number of
fins is usually limited by the pressure drop. At the same time, we like to have the fins as tall as
possible (meaning high H*). However, we need to keep high fin efficiency. Typical high-
performance micro-channels are made of copper, with L*~25 microns, t
* and H
* are designed to
have high fin efficiency. t*~ L
*, and H
*~ 500 microns or less. HOPG allow H
* to be larger,
while keeping t* and L
* the same.
Figure 28. Micro-channel model
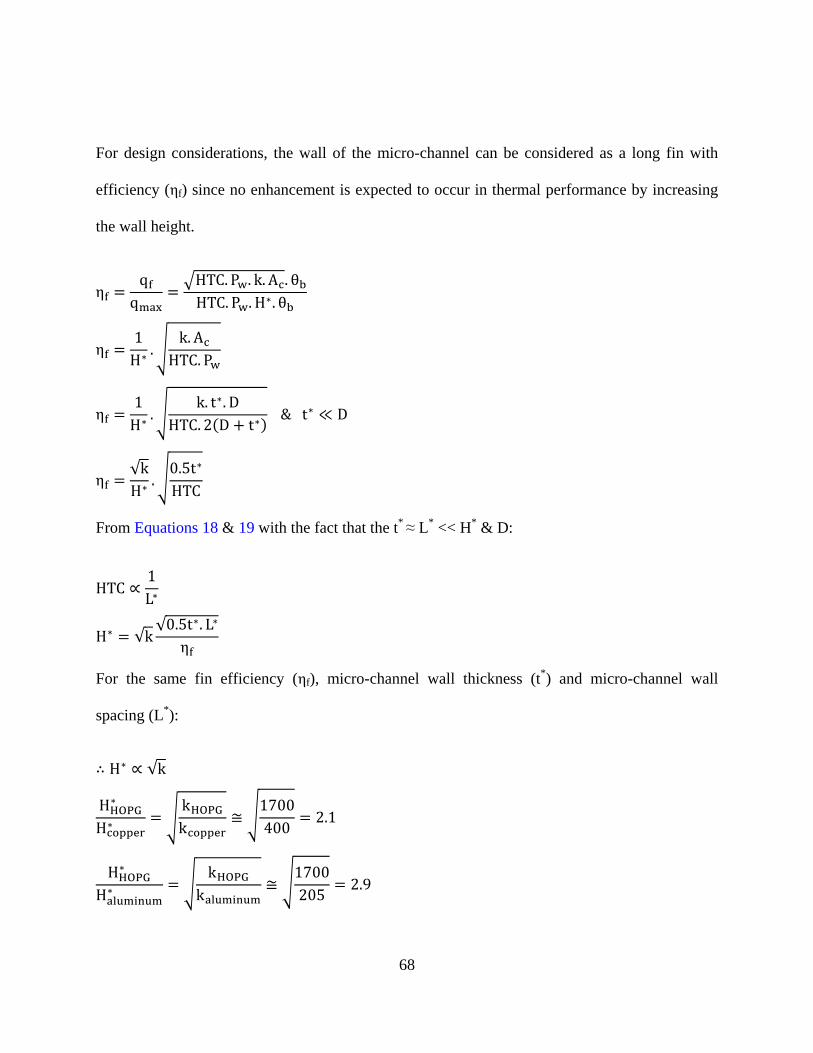
68
For design considerations, the wall of the micro-channel can be considered as a long fin with
efficiency (ηf) since no enhancement is expected to occur in thermal performance by increasing
the wall height.
From Equations 18 & 19 with the fact that the t* ≈ L
* << H
* & D:
For the same fin efficiency (ηf), micro-channel wall thickness (t*) and micro-channel wall
spacing (L*):
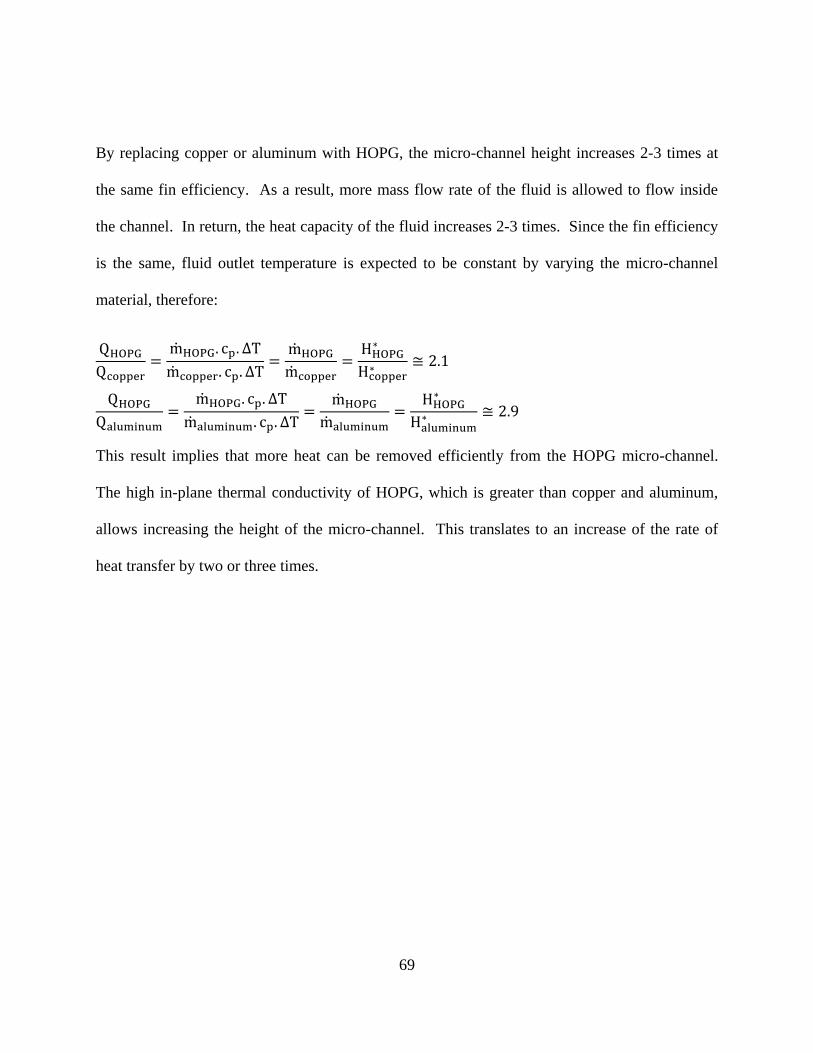
69
By replacing copper or aluminum with HOPG, the micro-channel height increases 2-3 times at
the same fin efficiency. As a result, more mass flow rate of the fluid is allowed to flow inside
the channel. In return, the heat capacity of the fluid increases 2-3 times. Since the fin efficiency
is the same, fluid outlet temperature is expected to be constant by varying the micro-channel
material, therefore:
This result implies that more heat can be removed efficiently from the HOPG micro-channel.
The high in-plane thermal conductivity of HOPG, which is greater than copper and aluminum,
allows increasing the height of the micro-channel. This translates to an increase of the rate of
heat transfer by two or three times.

70
APPENDIX A: UNCERTAINTY ANALYSIS

71
Design Stage Uncertainty
Differential Pressure Measurement
Volume Flow Measurement
OMEGA FL-2035
OMEGA FL-2060
OMEGA FL-2060
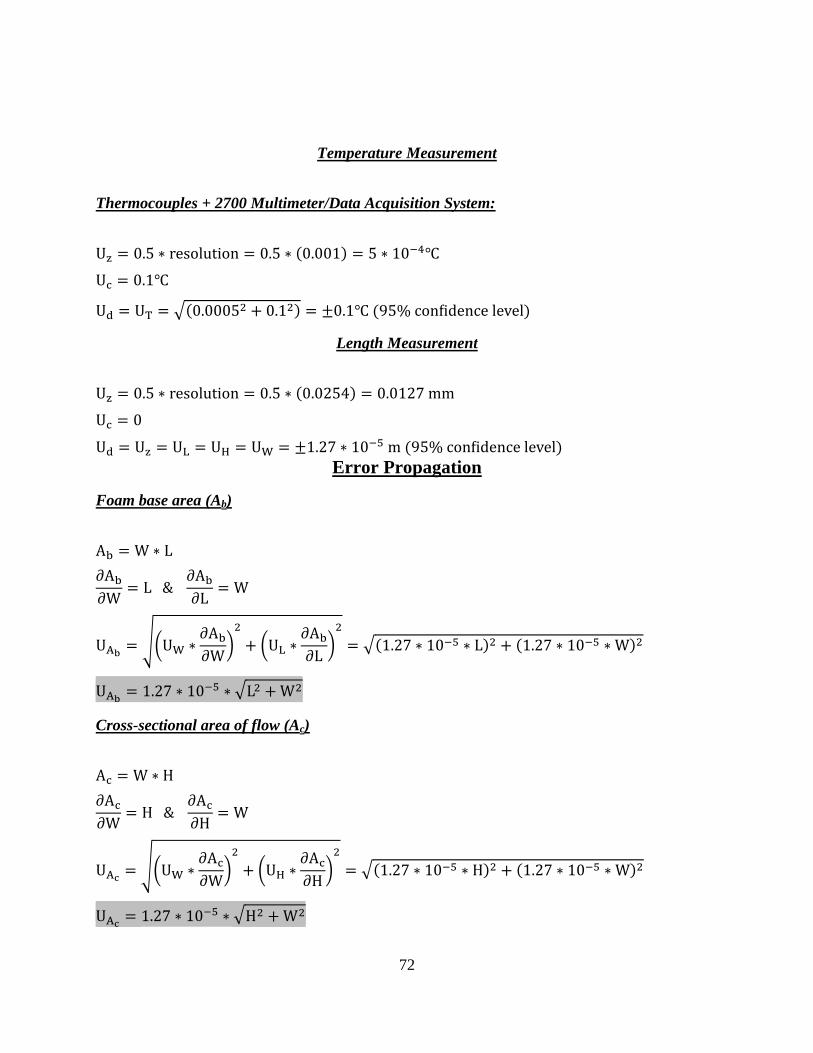
72
Temperature Measurement
Thermocouples + 2700 Multimeter/Data Acquisition System:
Length Measurement
Error Propagation
Foam base area (Ab)
Cross-sectional area of flow (Ac)

73
Average inlet air velocity (U)
Heat transfer coefficient (HTC)
α is the Wattage tolerance in percent which is determined by the manufacturer 5 to -10%.
Measurements and uncertainties of experimental parameters are shown in the following table:
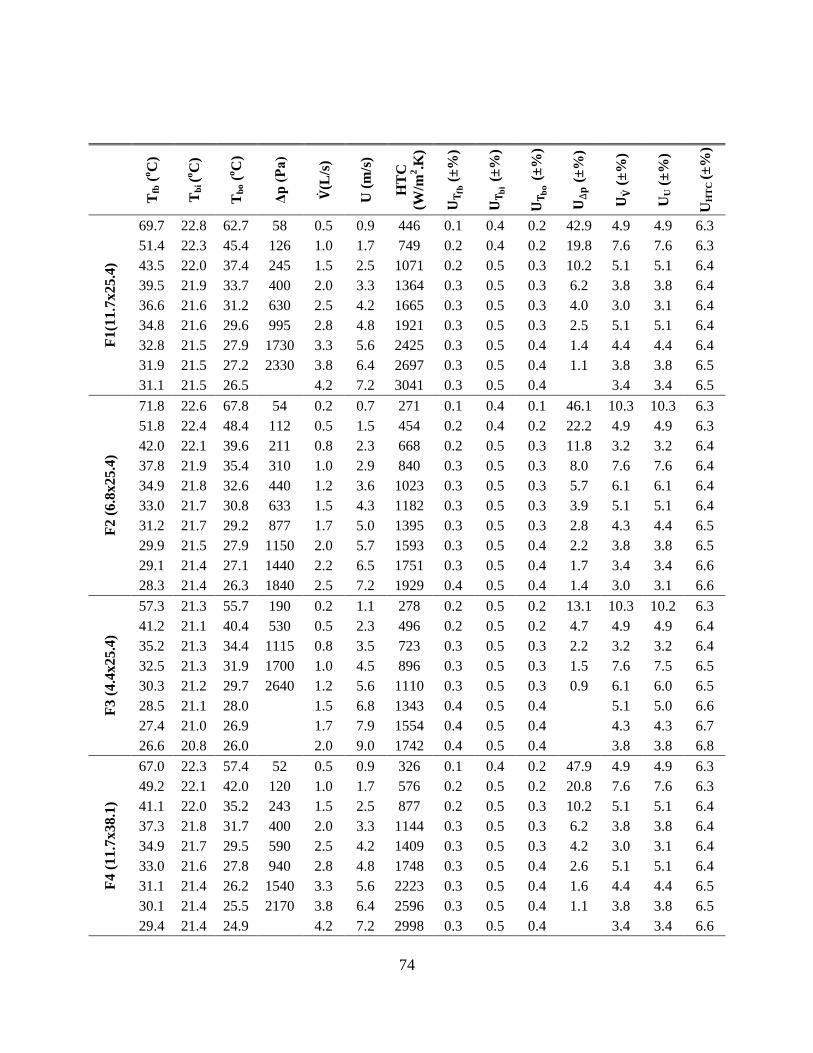
74
Tfb
(oC
)
Tb
i (o
C)
Tb
o (
oC
)
Δp
(P
a)
(L
/s)
U (
m/s
)
HT
C
(W/m
2.K
)
(±
%)
(±%
)
(
±%
)
(
±%
)
(±
%)
UU (
±%
)
UH
TC
(±
%)
F1
(11.7
x25.4
)
69.7 22.8 62.7 58 0.5 0.9 446 0.1 0.4 0.2 42.9 4.9 4.9 6.3
51.4 22.3 45.4 126 1.0 1.7 749 0.2 0.4 0.2 19.8 7.6 7.6 6.3
43.5 22.0 37.4 245 1.5 2.5 1071 0.2 0.5 0.3 10.2 5.1 5.1 6.4
39.5 21.9 33.7 400 2.0 3.3 1364 0.3 0.5 0.3 6.2 3.8 3.8 6.4
36.6 21.6 31.2 630 2.5 4.2 1665 0.3 0.5 0.3 4.0 3.0 3.1 6.4
34.8 21.6 29.6 995 2.8 4.8 1921 0.3 0.5 0.3 2.5 5.1 5.1 6.4
32.8 21.5 27.9 1730 3.3 5.6 2425 0.3 0.5 0.4 1.4 4.4 4.4 6.4
31.9 21.5 27.2 2330 3.8 6.4 2697 0.3 0.5 0.4 1.1 3.8 3.8 6.5
31.1 21.5 26.5 4.2 7.2 3041 0.3 0.5 0.4 3.4 3.4 6.5
F2
(6
.8x2
5.4
)
71.8 22.6 67.8 54 0.2 0.7 271 0.1 0.4 0.1 46.1 10.3 10.3 6.3
51.8 22.4 48.4 112 0.5 1.5 454 0.2 0.4 0.2 22.2 4.9 4.9 6.3
42.0 22.1 39.6 211 0.8 2.3 668 0.2 0.5 0.3 11.8 3.2 3.2 6.4
37.8 21.9 35.4 310 1.0 2.9 840 0.3 0.5 0.3 8.0 7.6 7.6 6.4
34.9 21.8 32.6 440 1.2 3.6 1023 0.3 0.5 0.3 5.7 6.1 6.1 6.4
33.0 21.7 30.8 633 1.5 4.3 1182 0.3 0.5 0.3 3.9 5.1 5.1 6.4
31.2 21.7 29.2 877 1.7 5.0 1395 0.3 0.5 0.3 2.8 4.3 4.4 6.5
29.9 21.5 27.9 1150 2.0 5.7 1593 0.3 0.5 0.4 2.2 3.8 3.8 6.5
29.1 21.4 27.1 1440 2.2 6.5 1751 0.3 0.5 0.4 1.7 3.4 3.4 6.6
28.3 21.4 26.3 1840 2.5 7.2 1929 0.4 0.5 0.4 1.4 3.0 3.1 6.6
F3
(4
.4x2
5.4
)
57.3 21.3 55.7 190 0.2 1.1 278 0.2 0.5 0.2 13.1 10.3 10.2 6.3
41.2 21.1 40.4 530 0.5 2.3 496 0.2 0.5 0.2 4.7 4.9 4.9 6.4
35.2 21.3 34.4 1115 0.8 3.5 723 0.3 0.5 0.3 2.2 3.2 3.2 6.4
32.5 21.3 31.9 1700 1.0 4.5 896 0.3 0.5 0.3 1.5 7.6 7.5 6.5
30.3 21.2 29.7 2640 1.2 5.6 1110 0.3 0.5 0.3 0.9 6.1 6.0 6.5
28.5 21.1 28.0 1.5 6.8 1343 0.4 0.5 0.4 5.1 5.0 6.6
27.4 21.0 26.9 1.7 7.9 1554 0.4 0.5 0.4 4.3 4.3 6.7
26.6 20.8 26.0 2.0 9.0 1742 0.4 0.5 0.4 3.8 3.8 6.8
F4
(1
1.7
x3
8.1
)
67.0 22.3 57.4 52 0.5 0.9 326 0.1 0.4 0.2 47.9 4.9 4.9 6.3
49.2 22.1 42.0 120 1.0 1.7 576 0.2 0.5 0.2 20.8 7.6 7.6 6.3
41.1 22.0 35.2 243 1.5 2.5 877 0.2 0.5 0.3 10.2 5.1 5.1 6.4
37.3 21.8 31.7 400 2.0 3.3 1144 0.3 0.5 0.3 6.2 3.8 3.8 6.4
34.9 21.7 29.5 590 2.5 4.2 1409 0.3 0.5 0.3 4.2 3.0 3.1 6.4
33.0 21.6 27.8 940 2.8 4.8 1748 0.3 0.5 0.4 2.6 5.1 5.1 6.4
31.1 21.4 26.2 1540 3.3 5.6 2223 0.3 0.5 0.4 1.6 4.4 4.4 6.5
30.1 21.4 25.5 2170 3.8 6.4 2596 0.3 0.5 0.4 1.1 3.8 3.8 6.5
29.4 21.4 24.9 4.2 7.2 2998 0.3 0.5 0.4 3.4 3.4 6.6
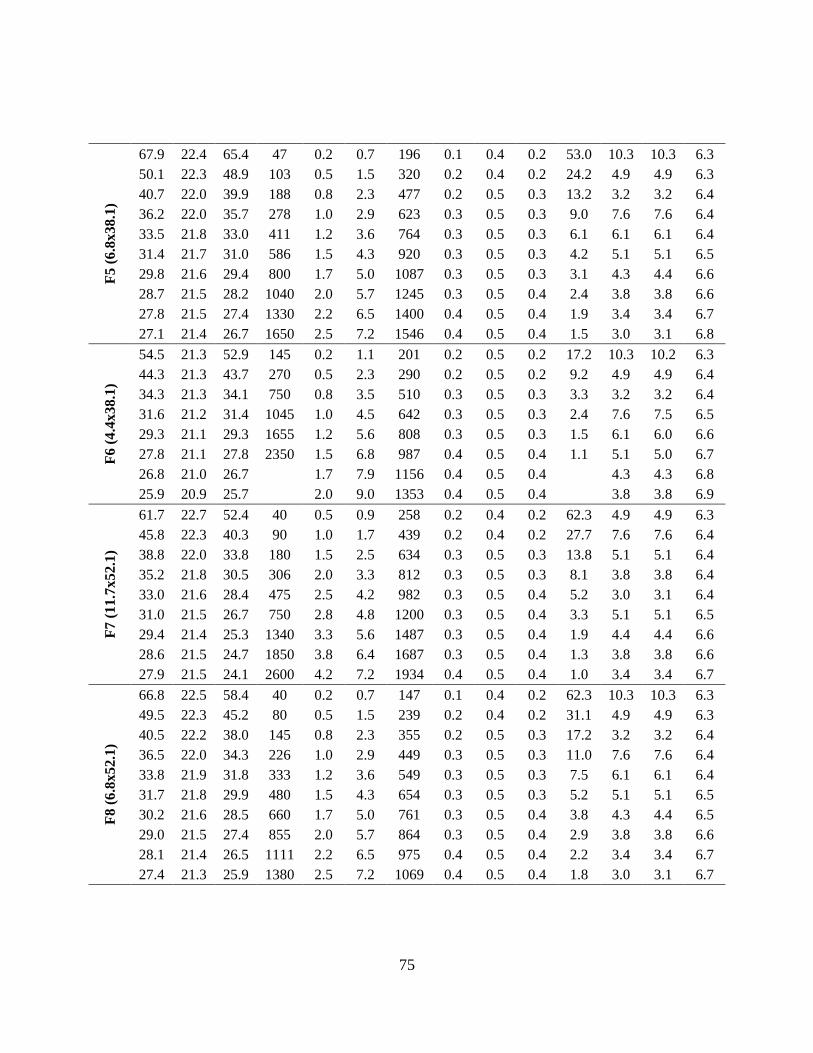
75
F5
(6
.8x3
8.1
)
67.9 22.4 65.4 47 0.2 0.7 196 0.1 0.4 0.2 53.0 10.3 10.3 6.3
50.1 22.3 48.9 103 0.5 1.5 320 0.2 0.4 0.2 24.2 4.9 4.9 6.3
40.7 22.0 39.9 188 0.8 2.3 477 0.2 0.5 0.3 13.2 3.2 3.2 6.4
36.2 22.0 35.7 278 1.0 2.9 623 0.3 0.5 0.3 9.0 7.6 7.6 6.4
33.5 21.8 33.0 411 1.2 3.6 764 0.3 0.5 0.3 6.1 6.1 6.1 6.4
31.4 21.7 31.0 586 1.5 4.3 920 0.3 0.5 0.3 4.2 5.1 5.1 6.5
29.8 21.6 29.4 800 1.7 5.0 1087 0.3 0.5 0.3 3.1 4.3 4.4 6.6
28.7 21.5 28.2 1040 2.0 5.7 1245 0.3 0.5 0.4 2.4 3.8 3.8 6.6
27.8 21.5 27.4 1330 2.2 6.5 1400 0.4 0.5 0.4 1.9 3.4 3.4 6.7
27.1 21.4 26.7 1650 2.5 7.2 1546 0.4 0.5 0.4 1.5 3.0 3.1 6.8
F6
(4
.4x3
8.1
)
54.5 21.3 52.9 145 0.2 1.1 201 0.2 0.5 0.2 17.2 10.3 10.2 6.3
44.3 21.3 43.7 270 0.5 2.3 290 0.2 0.5 0.2 9.2 4.9 4.9 6.4
34.3 21.3 34.1 750 0.8 3.5 510 0.3 0.5 0.3 3.3 3.2 3.2 6.4
31.6 21.2 31.4 1045 1.0 4.5 642 0.3 0.5 0.3 2.4 7.6 7.5 6.5
29.3 21.1 29.3 1655 1.2 5.6 808 0.3 0.5 0.3 1.5 6.1 6.0 6.6
27.8 21.1 27.8 2350 1.5 6.8 987 0.4 0.5 0.4 1.1 5.1 5.0 6.7
26.8 21.0 26.7 1.7 7.9 1156 0.4 0.5 0.4 4.3 4.3 6.8
25.9 20.9 25.7 2.0 9.0 1353 0.4 0.5 0.4 3.8 3.8 6.9
F7
(1
1.7
x52.1
)
61.7 22.7 52.4 40 0.5 0.9 258 0.2 0.4 0.2 62.3 4.9 4.9 6.3
45.8 22.3 40.3 90 1.0 1.7 439 0.2 0.4 0.2 27.7 7.6 7.6 6.4
38.8 22.0 33.8 180 1.5 2.5 634 0.3 0.5 0.3 13.8 5.1 5.1 6.4
35.2 21.8 30.5 306 2.0 3.3 812 0.3 0.5 0.3 8.1 3.8 3.8 6.4
33.0 21.6 28.4 475 2.5 4.2 982 0.3 0.5 0.4 5.2 3.0 3.1 6.4
31.0 21.5 26.7 750 2.8 4.8 1200 0.3 0.5 0.4 3.3 5.1 5.1 6.5
29.4 21.4 25.3 1340 3.3 5.6 1487 0.3 0.5 0.4 1.9 4.4 4.4 6.6
28.6 21.5 24.7 1850 3.8 6.4 1687 0.3 0.5 0.4 1.3 3.8 3.8 6.6
27.9 21.5 24.1 2600 4.2 7.2 1934 0.4 0.5 0.4 1.0 3.4 3.4 6.7
F8
(6
.8x
52
.1)
66.8 22.5 58.4 40 0.2 0.7 147 0.1 0.4 0.2 62.3 10.3 10.3 6.3
49.5 22.3 45.2 80 0.5 1.5 239 0.2 0.4 0.2 31.1 4.9 4.9 6.3
40.5 22.2 38.0 145 0.8 2.3 355 0.2 0.5 0.3 17.2 3.2 3.2 6.4
36.5 22.0 34.3 226 1.0 2.9 449 0.3 0.5 0.3 11.0 7.6 7.6 6.4
33.8 21.9 31.8 333 1.2 3.6 549 0.3 0.5 0.3 7.5 6.1 6.1 6.4
31.7 21.8 29.9 480 1.5 4.3 654 0.3 0.5 0.3 5.2 5.1 5.1 6.5
30.2 21.6 28.5 660 1.7 5.0 761 0.3 0.5 0.4 3.8 4.3 4.4 6.5
29.0 21.5 27.4 855 2.0 5.7 864 0.3 0.5 0.4 2.9 3.8 3.8 6.6
28.1 21.4 26.5 1111 2.2 6.5 975 0.4 0.5 0.4 2.2 3.4 3.4 6.7
27.4 21.3 25.9 1380 2.5 7.2 1069 0.4 0.5 0.4 1.8 3.0 3.1 6.7

76
F9
(4
.4x5
2.1
)
53.3 21.9 49.0 95 0.2 1.1 155 0.2 0.5 0.2 26.2 10.3 10.2 6.3
40.9 21.8 39.4 248 0.5 2.3 256 0.2 0.5 0.3 10.0 4.9 4.9 6.4
34.8 21.9 34.1 510 0.8 3.5 377 0.3 0.5 0.3 4.9 3.2 3.2 6.4
32.1 21.7 31.5 780 1.0 4.5 472 0.3 0.5 0.3 3.2 7.6 7.5 6.5
29.7 21.6 29.4 1230 1.2 5.6 602 0.3 0.5 0.3 2.0 6.1 6.0 6.6
28.1 21.4 27.8 1720 1.5 6.8 733 0.4 0.5 0.4 1.4 5.1 5.0 6.7
26.9 21.3 26.6 2400 1.7 7.9 877 0.4 0.5 0.4 1.0 4.3 4.3 6.8
26.1 21.2 25.8 2.0 9.0 1002 0.4 0.5 0.4 3.8 3.8 7.0

77
APPENDIX B: CALIBRATION OF MEASUREMENT INSTRUMENTS
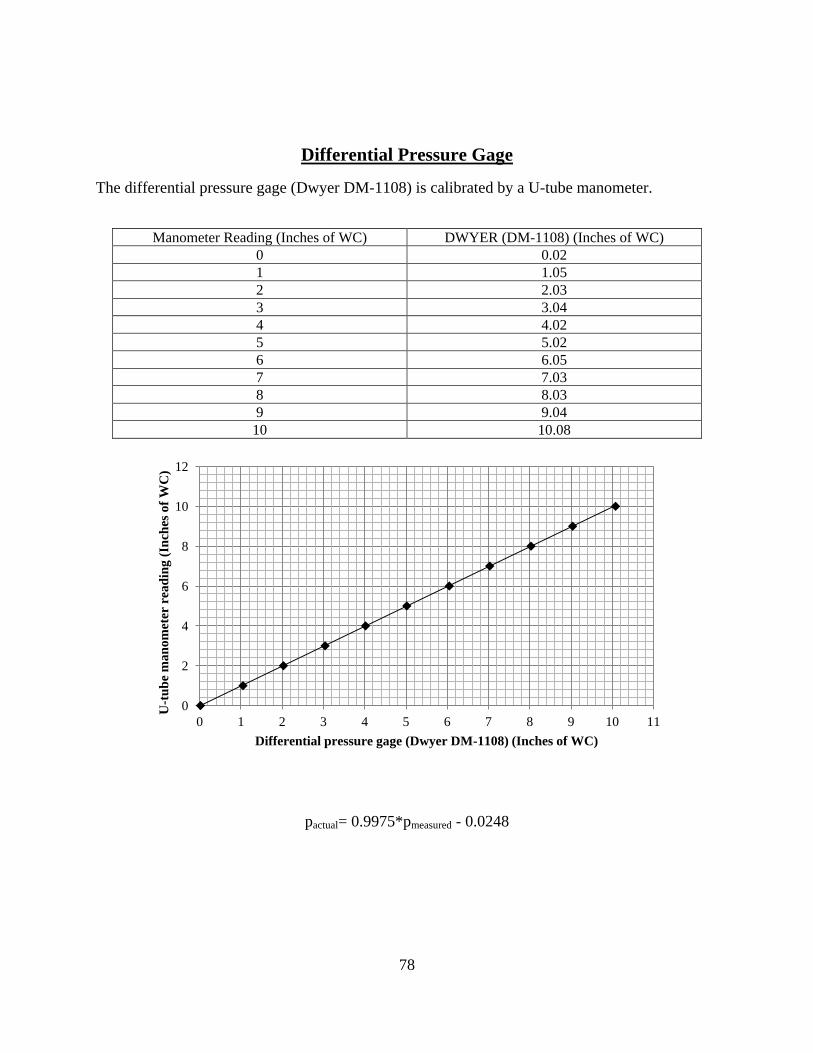
78
Differential Pressure Gage
The differential pressure gage (Dwyer DM-1108) is calibrated by a U-tube manometer.
Manometer Reading (Inches of WC) DWYER (DM-1108) (Inches of WC)
0 0.02
1 1.05
2 2.03
3 3.04
4 4.02
5 5.02
6 6.05
7 7.03
8 8.03
9 9.04
10 10.08
pactual= 0.9975*pmeasured - 0.0248
0
2
4
6
8
10
12
0 1 2 3 4 5 6 7 8 9 10 11
U-t
ub
e m
an
om
eter
rea
din
g (
Inch
es o
f W
C)
Differential pressure gage (Dwyer DM-1108) (Inches of WC)
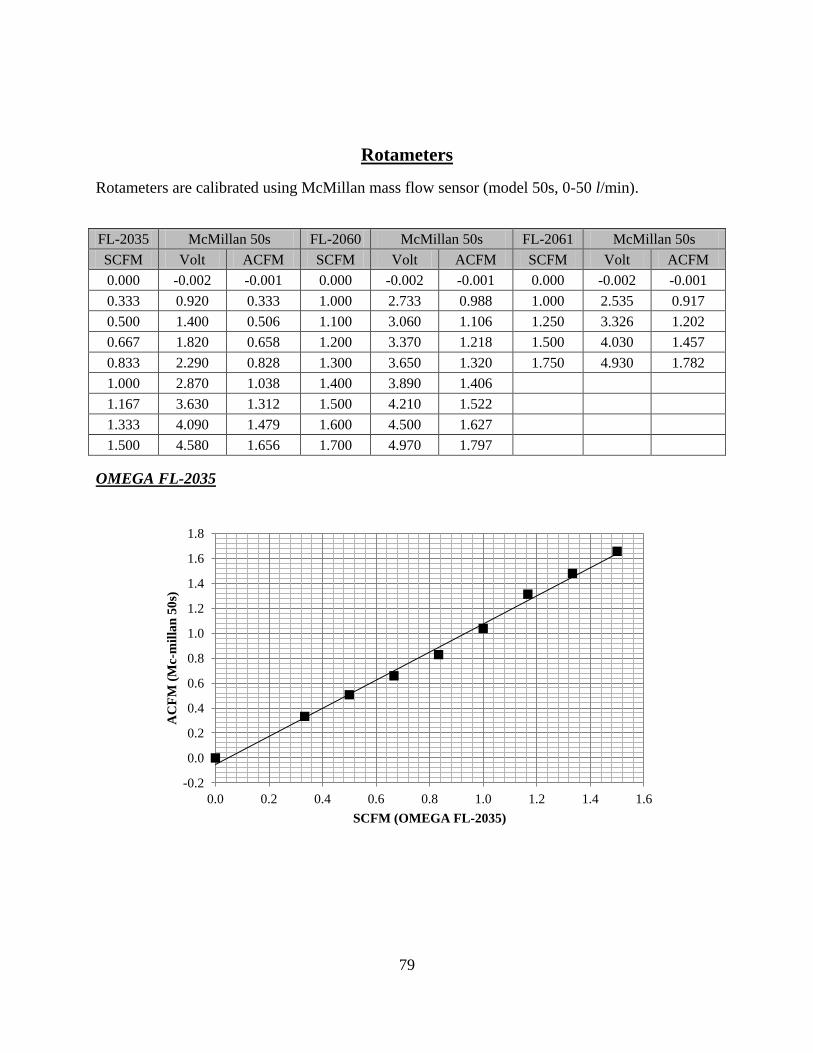
79
Rotameters
Rotameters are calibrated using McMillan mass flow sensor (model 50s, 0-50 l/min).
FL-2035 McMillan 50s FL-2060 McMillan 50s FL-2061 McMillan 50s
SCFM Volt ACFM SCFM Volt ACFM SCFM Volt ACFM
0.000 -0.002 -0.001 0.000 -0.002 -0.001 0.000 -0.002 -0.001
0.333 0.920 0.333 1.000 2.733 0.988 1.000 2.535 0.917
0.500 1.400 0.506 1.100 3.060 1.106 1.250 3.326 1.202
0.667 1.820 0.658 1.200 3.370 1.218 1.500 4.030 1.457
0.833 2.290 0.828 1.300 3.650 1.320 1.750 4.930 1.782
1.000 2.870 1.038 1.400 3.890 1.406
1.167 3.630 1.312 1.500 4.210 1.522
1.333 4.090 1.479 1.600 4.500 1.627
1.500 4.580 1.656 1.700 4.970 1.797
OMEGA FL-2035
-0.2
0.0
0.2
0.4
0.6
0.8
1.0
1.2
1.4
1.6
1.8
0.0 0.2 0.4 0.6 0.8 1.0 1.2 1.4 1.6
AC
FM
(M
c-m
illa
n 5
0s)
SCFM (OMEGA FL-2035)
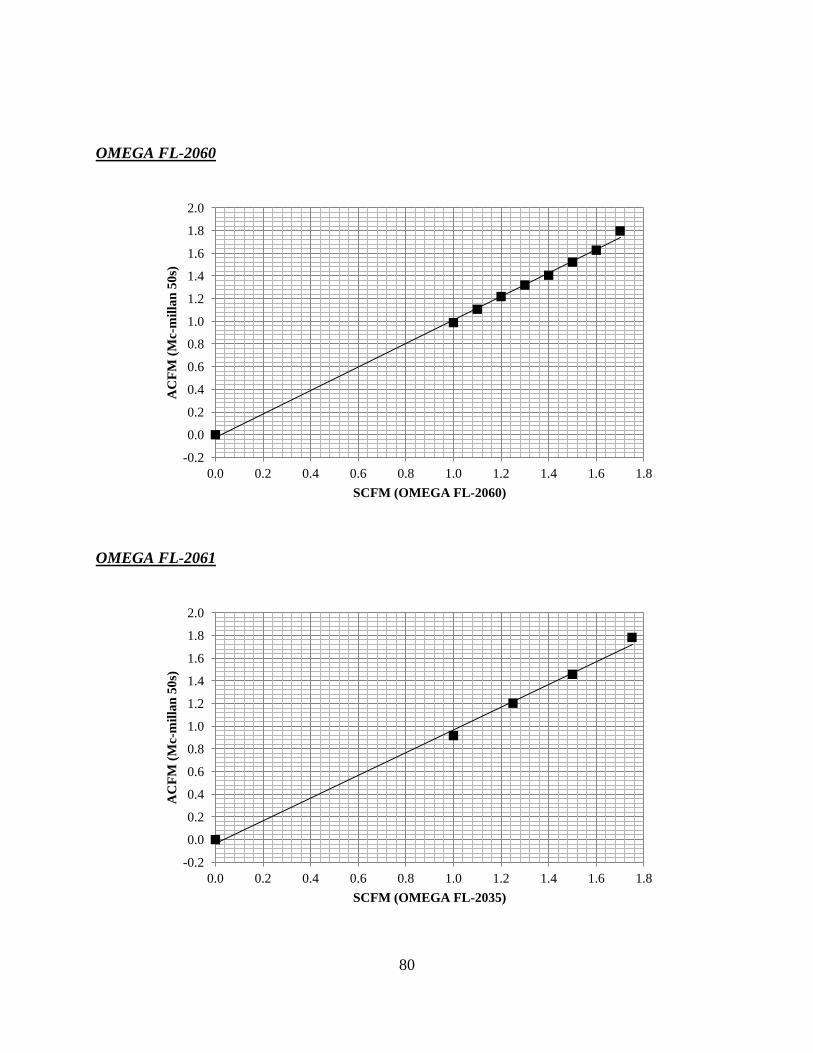
80
OMEGA FL-2060
OMEGA FL-2061
-0.2
0.0
0.2
0.4
0.6
0.8
1.0
1.2
1.4
1.6
1.8
2.0
0.0 0.2 0.4 0.6 0.8 1.0 1.2 1.4 1.6 1.8
AC
FM
(M
c-m
illa
n 5
0s)
SCFM (OMEGA FL-2060)
-0.2
0.0
0.2
0.4
0.6
0.8
1.0
1.2
1.4
1.6
1.8
2.0
0.0 0.2 0.4 0.6 0.8 1.0 1.2 1.4 1.6 1.8
AC
FM
(M
c-m
illa
n 5
0s)
SCFM (OMEGA FL-2035)

81
OMEGA FL-2035 ACFM = 1.1257*SCFM - 0.0496
OMEGA FL-2060 ACFM = 1.0351*SCFM - 0.0217
OMEGA FL-2061 ACFM = 1.0032*SCFM - 0.032
Thermocouples
Thermocouples are calibrated in boiling water and ice/water bath.
-10
0
10
20
30
40
50
60
70
80
90
100
0 10 20 30 40 50 60 70 80 90 100
Ta
ctu
al (o
C)
Tmeasured (oC)
TC#1
-10
0
10
20
30
40
50
60
70
80
90
100
0 10 20 30 40 50 60 70 80 90 100
Ta
ctu
al (o
C)
Tmeasured (oC)
TC#2

82
-10
0
10
20
30
40
50
60
70
80
90
100
0 10 20 30 40 50 60 70 80 90 100
Ta
ctu
al (o
C)
Tmeasured (oC)
TC#3
-10
0
10
20
30
40
50
60
70
80
90
100
0 10 20 30 40 50 60 70 80 90 100
Ta
ctu
al (o
C)
Tmeasured (oC)
TC#4
-10
0
10
20
30
40
50
60
70
80
90
100
0 10 20 30 40 50 60 70 80 90 100
Ta
ctu
al (o
C)
Tmeasured (oC)
TC#5

83
TC#1 Tactual= 0.9995*Tmeasured - 0.2267
TC#2 Tactual= 0.9973*Tmeasured -0.12
TC#3 Tactual= 0.9994*Tmeasured -0.09
TC#4 Tactual= 0.9984*Tmeasured -0.0033
TC#5 Tactual= 0.9984*Tmeasured + 0.0233
TC#6 Tactual= 0.9972*Tmeasured + 0.0333
TC#7 Tactual= 0.9967*Tmeasured + 0.13
-10
0
10
20
30
40
50
60
70
80
90
100
0 10 20 30 40 50 60 70 80 90 100
Ta
ctu
al (o
C)
Tmeasured (oC)
TC#6
-10
0
10
20
30
40
50
60
70
80
90
100
0 10 20 30 40 50 60 70 80 90 100
Ta
ctu
al (o
C)
Tmeasured (oC)
TC#7

84
APPENDIX C: CONDENSER DESIGN
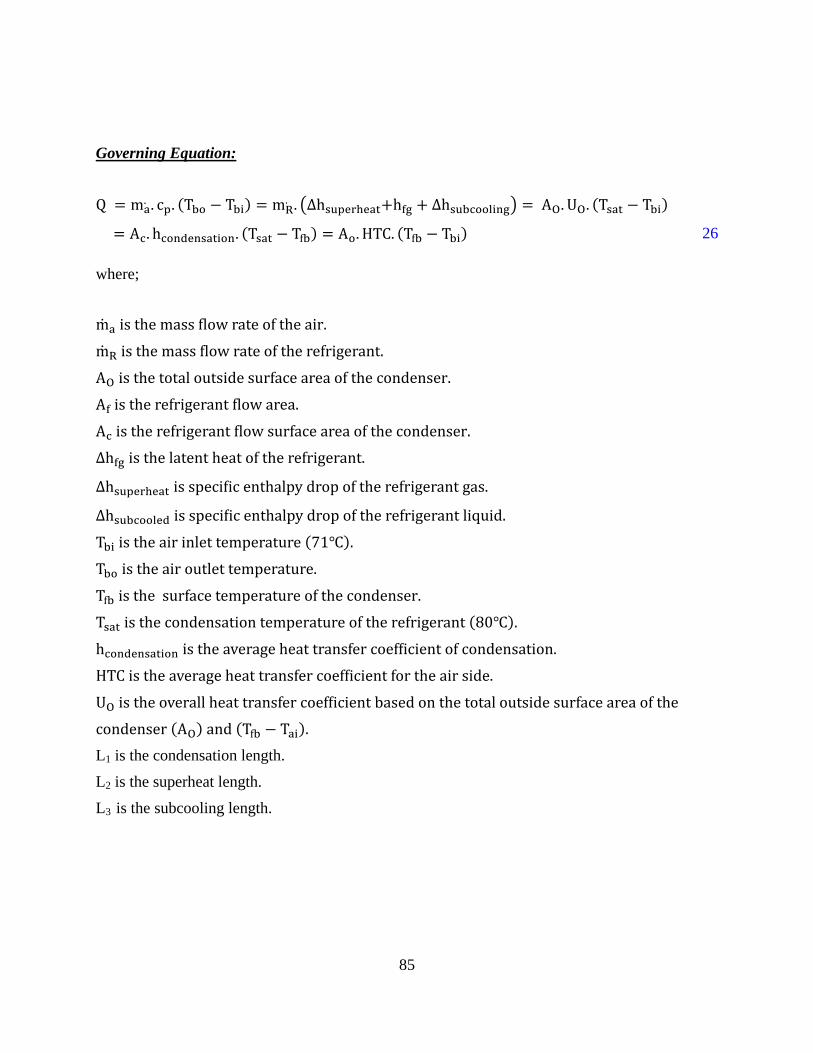
85
Governing Equation:
26
where;
L1 is the condensation length.
L2 is the superheat length.
L3 is the subcooling length.

86
Case (1): Superheat, Condensation and Subcooling
Allowing the refrigerant gas to enter the condenser at 120 ,
.
Therefore
Assuming the total number of minichannels (n*) is proportional to the width of the condenser and
the old condenser has 31 minichannels:
Condensation region:
Tfb
Tbi
Tsat
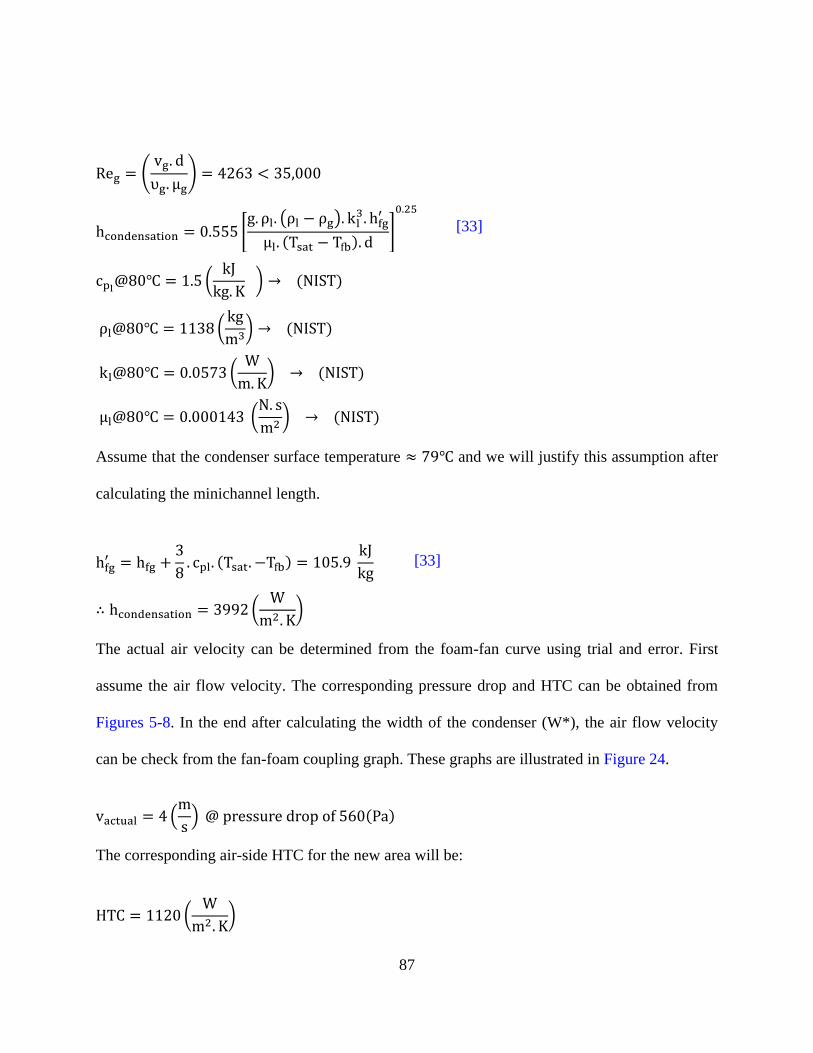
87
[33]
Assume that the condenser surface temperature and we will justify this assumption after
calculating the minichannel length.
[33]
The actual air velocity can be determined from the foam-fan curve using trial and error. First
assume the air flow velocity. The corresponding pressure drop and HTC can be obtained from
Figures 5-8. In the end after calculating the width of the condenser (W*), the air flow velocity
can be check from the fan-foam coupling graph. These graphs are illustrated in Figure 24.
The corresponding air-side HTC for the new area will be:
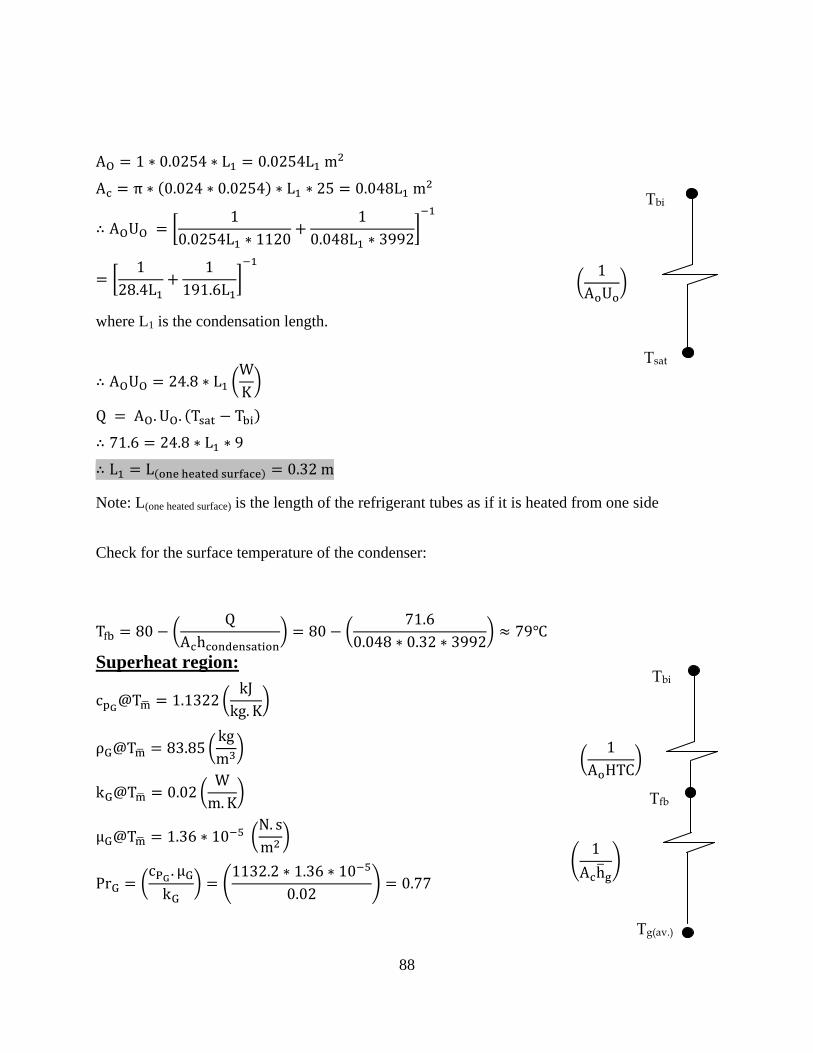
88
where L1 is the condensation length.
Note: L(one heated surface) is the length of the refrigerant tubes as if it is heated from one side
Check for the surface temperature of the condenser:
Superheat region:
Tfb
Tbi
Tg(av.)
Tbi
Tsat

89
Since (L/d) is greater than 60 therefore:
where is the heat transfer coefficient of the refrigerant superheated gas
where L2 is the superheat length.
Tbi
Tg(av.)
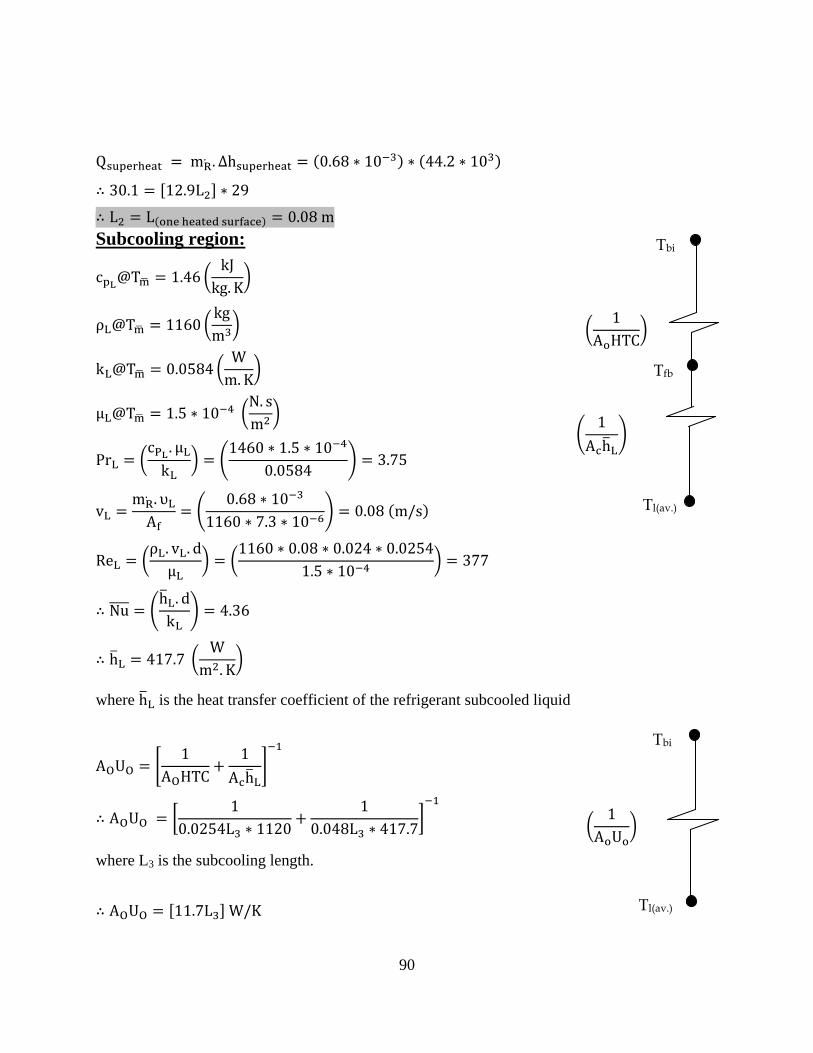
90
Subcooling region:
where is the heat transfer coefficient of the refrigerant subcooled liquid
where L3 is the subcooling length.
Tbi
Tl(av.)
Tfb
Tbi
Tl(av.)
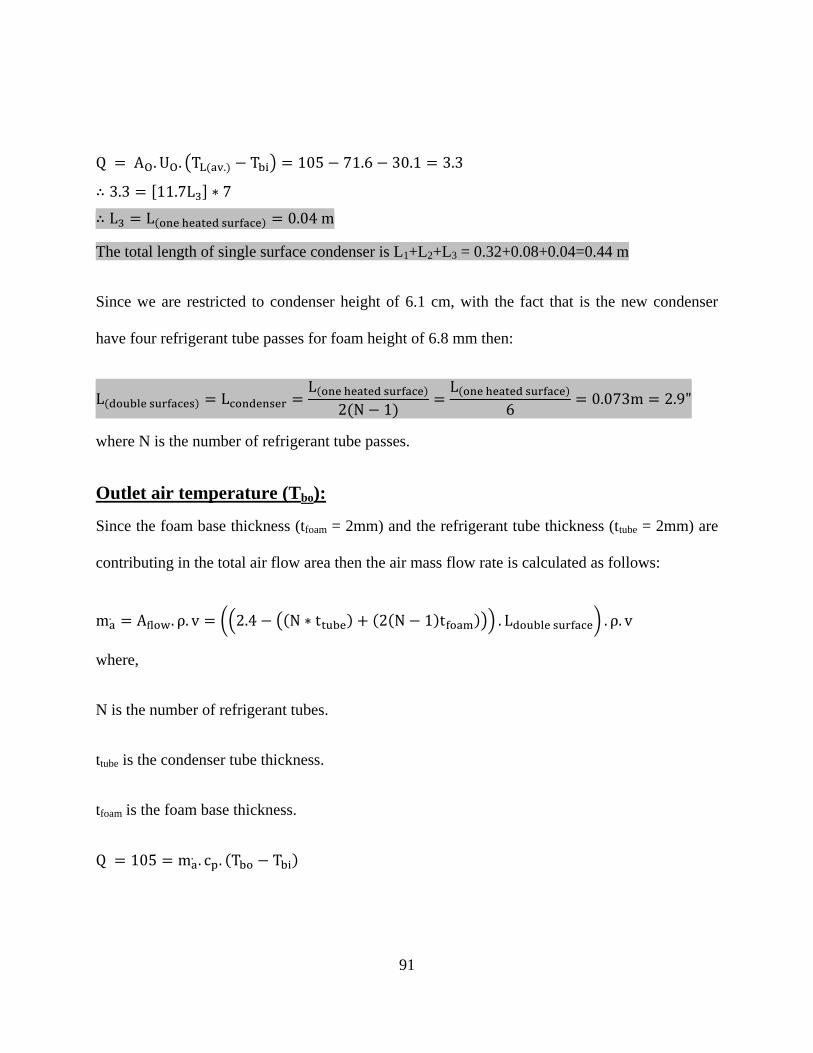
91
The total length of single surface condenser is L1+L2+L3 = 0.32+0.08+0.04=0.44 m
Since we are restricted to condenser height of 6.1 cm, with the fact that is the new condenser
have four refrigerant tube passes for foam height of 6.8 mm then:
where N is the number of refrigerant tube passes.
Outlet air temperature (Tbo):
Since the foam base thickness (tfoam = 2mm) and the refrigerant tube thickness (ttube = 2mm) are
contributing in the total air flow area then the air mass flow rate is calculated as follows:
where,
N is the number of refrigerant tubes.
ttube is the condenser tube thickness.
tfoam is the foam base thickness.

92
Case (2): Superheat and Condensation
Condensation region:
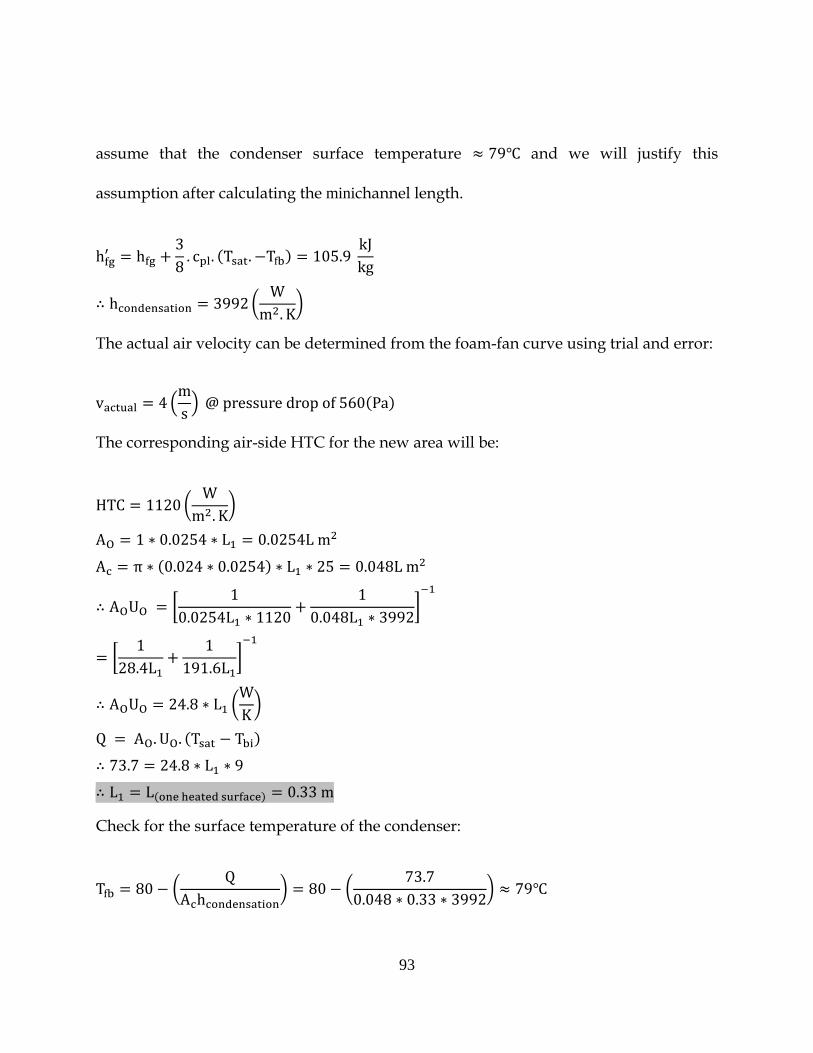
93
assume that the condenser surface temperature and we will justify this
assumption after calculating the minichannel length.
The actual air velocity can be determined from the foam-fan curve using trial and error:
The corresponding air-side HTC for the new area will be:
Check for the surface temperature of the condenser:

94
Superheat region:
Since (L/d) is greater than 60 therefore:
where is the heat transfer coefficient of the refrigerant superheated gas

95
where L2 is the superheat length.
The total length of single surface condenser is L1+L2 = 0.33+0.088=0.42 m
Outlet air temperature (Tbo):
Case (3): Condensation and Subcooling
Allowing the refrigerant liquid to exit the condenser at 76 ,
.

96
Condensation region:
assume that the condenser surface temperature and we will justify this
assumption after calculating the minichannel length.
The actual air velocity can be determined from the foam-fan curve using trial and error:
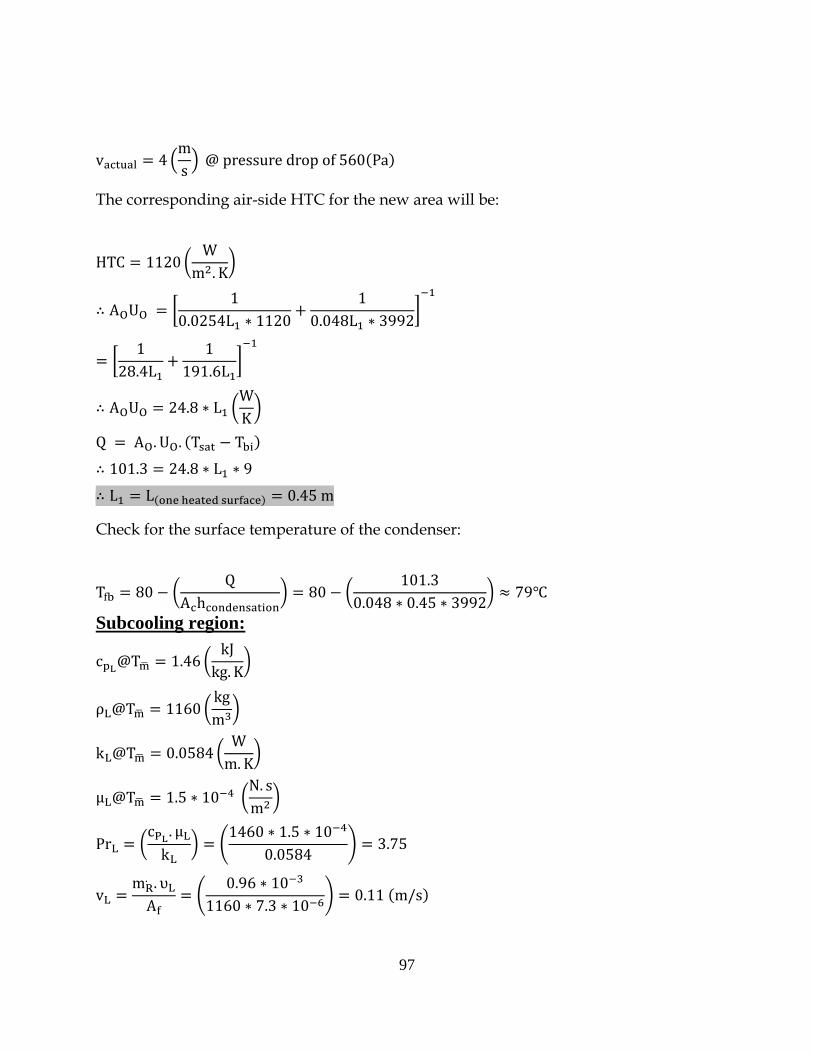
97
The corresponding air-side HTC for the new area will be:
Check for the surface temperature of the condenser:
Subcooling region:
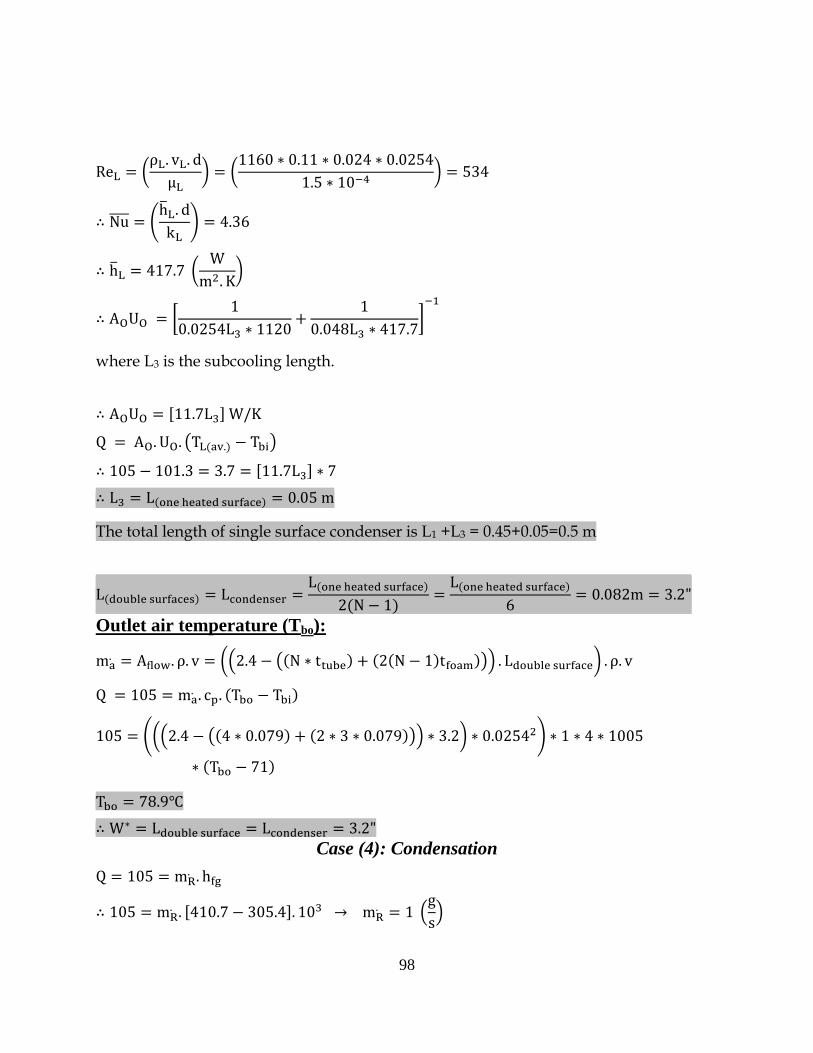
98
where L3 is the subcooling length.
The total length of single surface condenser is L1 +L3 = 0.45+0.05=0.5 m
Outlet air temperature (Tbo):
Case (4): Condensation

99
Condensation region:
assume that the condenser surface temperature and we will justify this
assumption after calculating the minichannel length.
The actual air velocity can be determined from the foam-fan curve using trial and error:
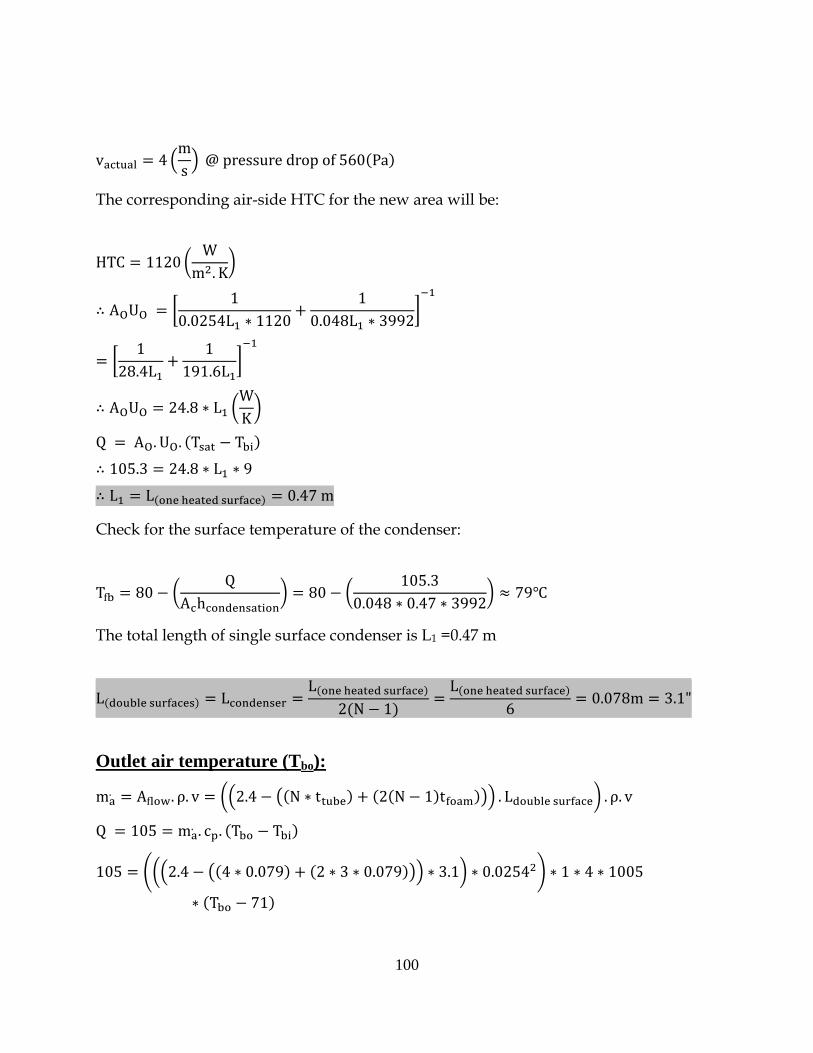
100
The corresponding air-side HTC for the new area will be:
Check for the surface temperature of the condenser:
The total length of single surface condenser is L1 =0.47 m
Outlet air temperature (Tbo):

101
102
LIST OF REFERENCES
[1] N. C. Gallego and J. W. Klett, "Carbon foams for thermal management," Carbon, vol. 41,
pp. 1461-1466, 2003.
[2] J. Klett, R. Hardy, E. Romine, C. Walls, and T. Burchell, "High-thermal-conductivity,
mesophase-pitch-derived carbon foams: effect of precursor on structure and properties,"
Carbon, vol. 38, pp. 953-973, 2000.
[3] A. G. Straatman, N. C. Gallego, Q. Yu, L. Betchen, and B. E. Thompson, "Forced
convection heat transfer and hydraulic losses in graphitic foam," Journal of Heat
Transfer, vol. 129, pp. 1237-1245, 2007.
[4] S. Mancin, C. Zilio, A. Diani, and L. Rossetto, "Experimental air heat transfer and
pressure drop through copper foams," Experimental Thermal and Fluid Science, vol. 36,
pp. 224-232, 2012.
[5] R. Y. Chein, H. H. Yang, T. H. Tsai, and C. J. Lu, "Experimental study of heat sink
performance using copper foams fabricated by electroforming," Microsystem
Technologies-Micro-and Nanosystems-Information Storage and Processing Systems, vol.
16, pp. 1157-1164, 2010.
[6] S. Y. Kim, J. W. Paek, and B. H. Kang, "Thermal performance of aluminum-foam heat
sinks by forced air cooling," IEEE Transactions on Components and Packaging
Technologies, vol. 26, pp. 262-267, 2003.
[7] S. Y. Kim, J. W. Paek, and B. H. Kang, "Flow and heat transfer correlations for porous
fin in a plate-fin heat exchanger," Journal of Heat Transfer, vol. 122, pp. 572-578, 2000.
[8] A. A. Sertkaya, K. Altinisik, and K. Dincer, "Experimental investigation of thermal
performance of aluminum finned heat exchangers and open-cell aluminum foam heat
exchangers," Experimental Thermal and Fluid Science, vol. 36, pp. 86-92, 2012.
[9] P. T. Garrity, J. F. Klausner, and R. W. Mei, "Performance of aluminum and carbon
foams for air side heat transfer augmentation," Journal of Heat Transfer, vol. 132, p.
121901 (9 pp.), 2010.
[10] K. C. Leong, H. Y. Li, L. W. Jin, and J. C. Chai, "Numerical and experimental study of
forced convection in graphite foams of different configurations," Applied Thermal
Engineering, vol. 30, pp. 520-532, 2010.

103
[11] Z. A. Williams and J. A. Roux, "Graphite foam thermal management of a high packing
density array of power amplifiers," Journal of Electronic Packaging, vol. 128, pp. 456-
465, 2006.
[12] W. Wu, J. H. Du, Y. R. Lin, L. C. Chow, H. Bostanci, B. A. Saarloos, and D. P. Rini,
"Evaluation of compact and effective air-cooled carbon foam heat sink," Journal of Heat
Transfer, vol. 133, p. 054504 (5 pp.), 2011.
[13] Y. R. Lin, J. H. Du, W. Wu, L. C. Chow, and W. Notardonato, "Experimental study on
heat transfer and pressure drop of recuperative heat exchangers using carbon foam,"
Journal of Heat Transfer, vol. 132, p. 091902 (10 pp.), 2010.
[14] S. P. Vanka and K. M. Stone, "Review of literature on heat transfer enhancement in
compact heat exchangers," ed: Air Conditioning and Refrigeration Center, College of
Engineering, University of Illinois at Urbana-Champaign, 1996.
[15] J. G. Soland, J. W. M. Mack, and W. M. Rohsenow, "Performance ranking of plate-fin
heat exchanger surfaces," Journal of Heat Transfer, vol. 100, pp. 514-519, 1978.
[16] K. Vafai and S. Kim, "On the limitations of the Brinkman-Forchheimer-extended Darcy
equation," International Journal of Heat and Fluid flow, vol. 16, pp. 11-15, 1995.
[17] M. Sözen and K. Vafai, "Analysis of the non-thermal equilibrium condensing flow of a
gas through a packed bed," International Journal of Heat and Mass Transfer, vol. 33, pp.
1247-1261, 1990.
[18] K. Vafai, Handbook of Porous Media: CRC Press, 2009.
[19] M. Kaviany, Principles of Heat Transfer in Porous Media: New York, Springer-Verlag,
1995.
[20] A. A. Mohamad and G. Karim, "Flow and heat transfer within segregated beds of solid
particles," Journal of Porous Media, vol. 4, pp. 215–224, 2001.
[21] B. Alazmi and K. Vafai, "Analysis of fluid flow and heat transfer interfacial conditions
between a porous medium and a fluid layer," International Journal of Heat and Mass
Transfer, vol. 44, pp. 1735-1749, 2001.
104
[22] A. Mohamad, "Heat transfer enhancements in heat exchangers fitted with porous media
Part I: constant wall temperature," International journal of thermal sciences, vol. 42, pp.
385-395, 2003.
[23] B. I. Pavel and A. A. Mohamad, "An experimental and numerical study on heat transfer
enhancement for gas heat exchangers fitted with porous media," International Journal of
Heat and Mass Transfer, vol. 47, pp. 4939-4952, 2004.
[24] B. Alazmi and K. Vafai, "Analysis of variants within the porous media transport models,"
Journal of Heat Transfer, vol. 122, pp. 303-26, 2000.
[25] B. Alazmi and K. Vafai, "Analysis of variable porosity, thermal dispersion, and local
thermal nonequilibrium on free surface flows through porous media," Journal of Heat
Transfer, vol. 126, pp. 389-99, 2004.
[26] L. J. Betchen and A. G. Straatman, "An investigation of the effects of a linear porosity
distribution on non-equilibrium heat transfer in high-conductivity graphitic foam,"
Numerical Heat Transfer, Part A: Applications, vol. 58, pp. 605-624, 2010.
[27] A. Marafie and K. Vafai, "Analysis of non-Darcian effects on temperature differentials in
porous media," International Journal of Heat and Mass Transfer, vol. 44, pp. 4401-4411,
2001.
[28] A. Haji-Sheikh and K. Vafai, "Analysis of flow and heat transfer in porous media
imbedded inside various-shaped ducts," International Journal of Heat and Mass Transfer,
vol. 47, pp. 1889-1905, 2004.
[29] C. T. DeGroot and A. G. Straatman, "A finite-volume model for fluid flow and
nonequilibrium heat transfer in conjugate fluid-porous domains using general
unstructured grids," Numerical Heat Transfer, Part B: Fundamentals, vol. 60, pp. 252-
277, 2011.
[30] R. S. Figliola and D. E. Beasley, Theory and Design for Mechanical Measurements, 4th
ed. Hoboken, N.J: John Wiley, 2006.
[31] A. G. Straatman, N. C. Gallego, Q. Yu, L. Betchen, and B. Thompson, "Forced
convection heat transfer and hydraulic losses in graphitic foam," Journal of heat transfer,
vol. 129, pp. 1237-1245, 2007.
105
[32] J. H. Du, L. C. Chow, Y. R. Lin, W. Wu, J. Kapat, and W. U. Notardonato, Thermally
Conductive Porous Element-Based Recuperators, US Patent 8,322,406, 2012.
[33] D. P. Dewitt and F. P. Incropera, Fundamentals of Heat and Mass Transfer: Wiley, 2002.
[34] G. A. Slack, "Anisotropic thermal conductivity of pyrolytic graphite," Physical Review,
vol. 127, p. 694, 1962.
[35] P. Klemens, "The specific heat and thermal conductivity of graphite," Australian Journal
of Physics, vol. 6, pp. 405-409, 1953.
[36] B. T. Kelly, "Physics of graphite," 1981.
[37] C. Uher and D. Morelli, "Thermal transport properties of SbCl5-graphite and of HOPG in
the c-direction," Synthetic Metals, vol. 12, pp. 91-96, 1985.
[38] D. Morelli and C. Uher, "Thermal conductivity and thermopower of graphite at very low
temperatures," Physical Review B, vol. 31, p. 6721, 1985.
[39] J. G. Park, C. Zhang, R. Liang, and B. Wang, "Nano-machining of highly oriented
pyrolytic graphite using conductive atomic force microscope tips and carbon nanotubes,"
Nanotechnology, vol. 18, p. 405306, 2007.
[40] J. Song, Z. Liu, C. Li, H. Chen, and H. He, "SPM-based nanofabrication using a
synchronization technique," Applied Physics A: Materials Science & Processing, vol. 66,
pp. S715-S717, 1998.
[41] R. Windholz and P. Molian, "Nanosecond pulsed excimer laser machining of chemical
vapour deposited diamond and highly oriented pyrolytic graphite: Part I An experimental
investigation," Journal of materials science, vol. 32, pp. 4295-4301, 1997.