study of the icing growth characteristic and its in
TRANSCRIPT
Turk J Elec Eng & Comp Sci
(2016) 24: 1571 – 1585
c⃝ TUBITAK
doi:10.3906/elk-1312-35
Turkish Journal of Electrical Engineering & Computer Sciences
http :// journa l s . tub i tak .gov . t r/e lektr ik/
Research Article
Study of the icing growth characteristic and its influencing factors for different
types of insulators
Zhijin ZHANG1, Dongdong ZHANG1,∗, Xingliang JIANG1, Haizhou HUANG1,David Wenzhong GAO2
1State Key Laboratory of Power Transmission Equipment & System Security and New Technology,Chongqing University, P.R. China
2Department of Electrical and Computer Engineering, Faculty of Engineering, University of Denver,Denver, Colorado, USA
Received: 04.12.2013 • Accepted/Published Online: 03.04.2014 • Final Version: 23.03.2016
Abstract: Icing poses a serious threat to power transmission in many countries. Various studies on the icing mechanism
and icing growth process of transmission lines have been carried out all over the world, whereas there are few reports
about the icing growth mechanism and its influencing factors on insulators to date. In this paper, artificial tests of
insulator icing were carried out; the influences of temperature, median volumetric diameter (MVD), and wind velocity
on the icing accretion process, ice shape, and ice type on the surface of insulators were analyzed systematically; and
the icing growth performance of different types of insulators were also analyzed. Test results show that under different
icing environments, the icing growth of insulators is always nonlinear; the growth rates of icicles and ice layers increase
with the decrease of temperature; with the increase of wind speed, all of the ice thicknesses and the length and diameter
of icicles increase significantly; for wet growth, the impact of MVD on icing growth of insulators is not significant; the
structure of the insulator has some influence on the icing growth process; and with the increase of length and diameter
of icicles, the growth rate of the ice layer on the insulator surface decreases significantly.
Key words: Insulator, environmental parameters, icing growth, ice thickness, icicle
1. Introduction
In cold regions, ice accretion on transmission lines presents a serious threat to the safety of grid operation. When
conductors and insulators are covered with ice, the increasing weight will cause serious mechanical damage to
towers, insulators, and conductors. The icing will particularly weaken the insulation strength of insulators. In
certain conditions, flashover may occur on energized insulators with rated voltage and cause transmission lines
to go out of service. A severe ice storm would tend to damage the power grid structure and cause widespread
power outages. In China, the two severe ice disasters that happened in 2005 [1] and 2008 [2] caused huge losses
to grids and the national economy. Many ice disasters of grids also have been reported in other cold-climate
countries [3–8].
In order to reduce the harm of flashover on covered insulators to power systems, many research institutions
have carried out large numbers of studies on insulator icing test methods, icing flashover performance and models,
icing mechanisms, and so on.
The test methods and procedures are important for the research on flashover performance and the
∗Correspondence: [email protected]
1571
ZHANG et al./Turk J Elec Eng & Comp Sci
mechanism of covered insulators. For artificial insulator icing tests carried out by different researchers, not only
are the spray devices, wind speed regulating devices, and environmental parameter measuring devices different,
but also the simulation methods of pollution and evaluation approaches of electrical performance tend to be
different. Insulators in service may be contaminated before or during the icing process. The solid-layer method
is widely used to simulate the prepollution process in artificial insulator icing tests [9–13]. By adding sodium
chloride to deionized water, the conductivity of icing water was changed to simulate the contamination accreted
during the icing process [14–16]. Through comparative studies on the DC flashover performance of ice-covered
insulators contaminated by solid-layer method and icing-water-conductivity method, it was found that the
influence of these two methods on flashover stress of ice-covered insulators was equivalent [17]. During the icing
process, Cherney [18] applied a constant voltage to insulator string. The test was terminated after a duration of
3 h or after flashover happened. If no flashover occurred after 3 h, the test was considered a ‘withstand’. After
insulator strings were deposited in a predetermined amount of ice, researchers of the University of Quebec [19]
applied a method based on and developed from standard IEC 507 [20] to determine the maximum withstand
voltage. For the icing flashover tests carried out at Chongqing University [11], the improved U-shaped curve
method was used to obtain 50% flashover voltage of iced insulator strings. By summarizing and comparing
the different test methods used by different research institutions, the IEEE recommended the laboratory test
methods and procedures for artificial icing and snow testing of insulators [21,22].
The flashover process of ice-covered insulators is very complicated; many research results [9,23–26] show
that it is subject to the influence of prepollution severity of the insulator, conductivity of freezing water, ambient
temperature, atmospheric pressure, type and thickness of ice, ice uniformity, and so on. It is generally thought
that the minimum flashover voltage VMF or maximum withstand voltage VWS of iced insulator string decreases
with increasing value of ice thickness first and then remains constant [19]. Thus, it is important to study the
growth process and its influencing factors of ice accumulating in a power network.
Existing research results show that the atmospheric icing of a power network is subject to the influence
of icing time, wind velocity, temperature, liquid water content (LWC), and so on. Lu et al. [27] reported that
the thickness of ice on conductors increased linearly with icing time. This result was based on artificial icing
tests for conductors. Simulation results of the icing model in [28] indicated that the growth rate increased at
the beginning of icing and then decreased in the dry growth case, but in the wet growth case, the growth rate of
ice increased with icing time. The ambient temperature has significant influence on ice density and growth rate.
Test results of [29] showed that for the same water mass flux impinging on the wire, the lower the temperature
was, the smaller the ice density and the larger the ice thickness. Farzaneh et al. [30] analyzed the field icing
data collected by an ice rate meter and found that precipitation icing accretion was observed in the temperature
interval between –10 ◦C and 0 ◦C. The maximum ice occurred around –5 ◦C and positive icing rates were
rarely observed below –10 ◦C because of the rapidly decreasing water content of air. Based on the vast amount
of research on atmospheric icing of power networks, Makkonen proposed a model for predicting ice accretion
on transmission lines [31]. Through calculating the efficiency of particle collision, sticking, and accretion, this
model obtained the icing rate of transmission lines.
For iced insulators, almost all the research focused on the breakdown voltage, leakage current, and
electrical model. Few studies focused on the icing growth characteristic, which is important to research the
icing mechanism of insulators and then improve the performance of antiicing. Furthermore, all of the existing
research on growth characteristics and theoretical models of icing was done with respect to conductors, but
studies of insulator icing growth models or relevant test results have not been reported yet. Thus, tests about
1572
ZHANG et al./Turk J Elec Eng & Comp Sci
the icing process and the influences of temperature, wind velocity, and median volume diameter (MVD) of
droplets on icing growth of insulator string were carried out in this paper. The differences of icing growth in
different types of insulators were analyzed, too. The main purpose of this paper is to provide some references for
further studies on the icing mechanism and theoretical icing models of insulator. Therefore, this paper focuses
on the icing growth process of insulators and the electrical performance of iced insulators is not studied in this
paper. The results have some scientific significance and practical engineering value to reveal the insulator icing
mechanism and promote the realization of an ice storm warning system for insulators.
2. Test facilities, specimens, and test operating procedure
2.1. Test specimens
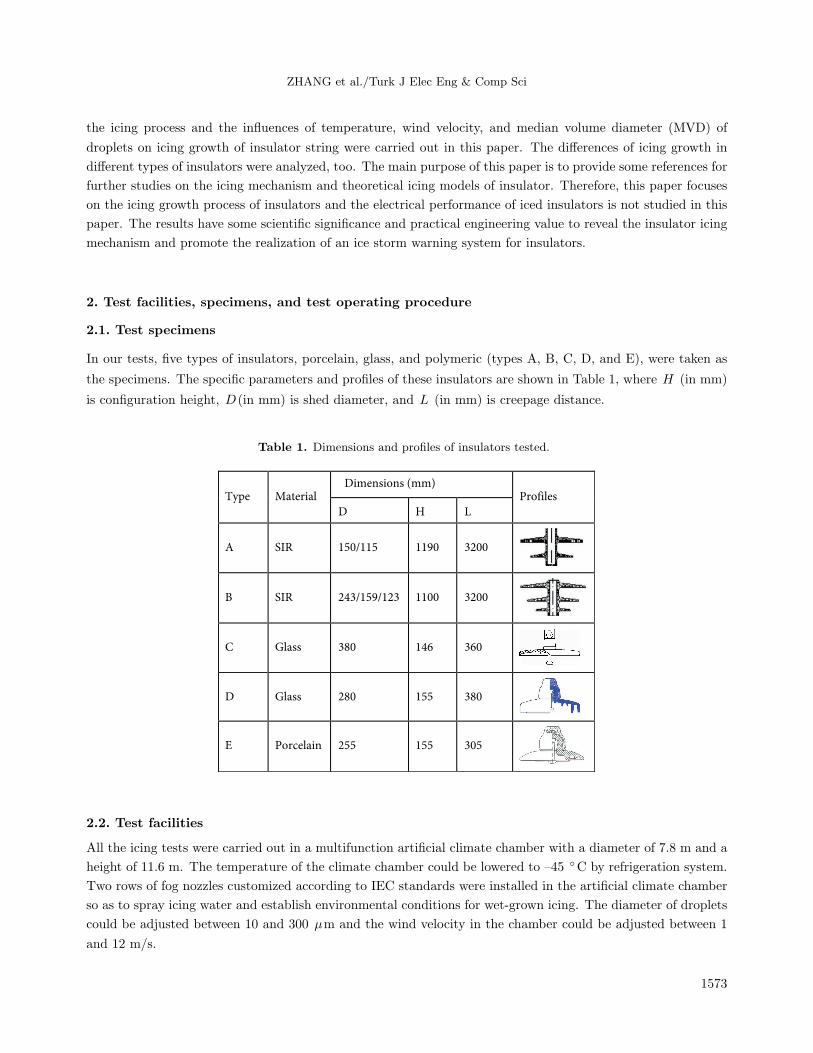
In our tests, five types of insulators, porcelain, glass, and polymeric (types A, B, C, D, and E), were taken as
the specimens. The specific parameters and profiles of these insulators are shown in Table 1, where H (in mm)
is configuration height, D (in mm) is shed diameter, and L (in mm) is creepage distance.
Table 1. Dimensions and profiles of insulators tested.
Type Material Dimensions (mm)
Profiles
D H L
A SIR 150/115 1190 3200
B SIR 243/159/123 1100 3200
C Glass 380 146 360
D Glass 280 155 380
E Porcelain 255 155 305
2.2. Test facilities
All the icing tests were carried out in a multifunction artificial climate chamber with a diameter of 7.8 m and a
height of 11.6 m. The temperature of the climate chamber could be lowered to –45 ◦C by refrigeration system.
Two rows of fog nozzles customized according to IEC standards were installed in the artificial climate chamber
so as to spray icing water and establish environmental conditions for wet-grown icing. The diameter of droplets
could be adjusted between 10 and 300 µm and the wind velocity in the chamber could be adjusted between 1
and 12 m/s.
1573
ZHANG et al./Turk J Elec Eng & Comp Sci
2.3. Test procedures
2.3.1. Ice depositing
Before the beginning of the icing process, the spraying water was precooled to 4 ◦C and the specimens were
suspended vertically in the climate chamber. After the temperature of the chamber had been adjusted to the
planned value, the wind speed adjustment system was started to make the ambient wind velocity reach the
preset value. The water droplets with a planned value of diameter were then sprayed out through fog nozzles.
In the process of icing, the water droplets sprayed through fog nozzles were supercooled (<0 ◦C) again by the
low-temperature air before hitting the insulator surface in the climate chamber.
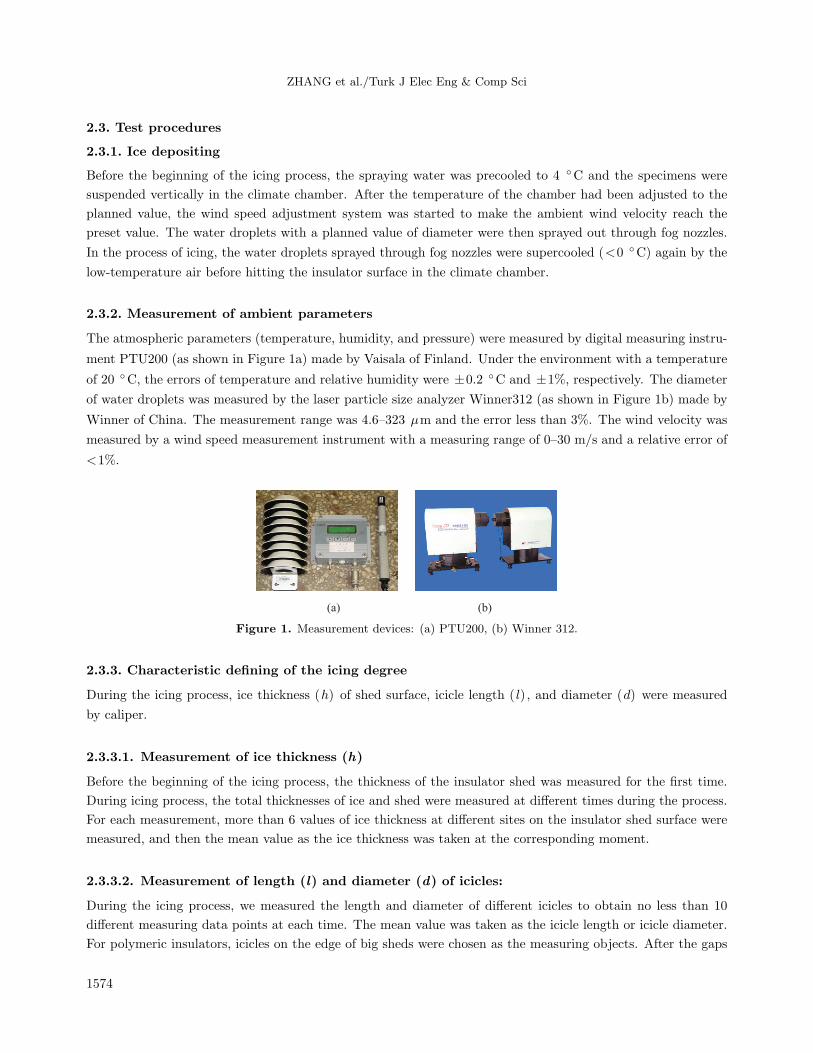
2.3.2. Measurement of ambient parameters
The atmospheric parameters (temperature, humidity, and pressure) were measured by digital measuring instru-
ment PTU200 (as shown in Figure 1a) made by Vaisala of Finland. Under the environment with a temperature
of 20 ◦C, the errors of temperature and relative humidity were ±0.2 ◦C and ±1%, respectively. The diameter
of water droplets was measured by the laser particle size analyzer Winner312 (as shown in Figure 1b) made by
Winner of China. The measurement range was 4.6–323 µm and the error less than 3%. The wind velocity was
measured by a wind speed measurement instrument with a measuring range of 0–30 m/s and a relative error of
<1%.
(a) (b)
Figure 1. Measurement devices: (a) PTU200, (b) Winner 312.
2.3.3. Characteristic defining of the icing degree
During the icing process, ice thickness (h) of shed surface, icicle length ( l), and diameter (d) were measured
by caliper.
2.3.3.1. Measurement of ice thickness (h)
Before the beginning of the icing process, the thickness of the insulator shed was measured for the first time.
During icing process, the total thicknesses of ice and shed were measured at different times during the process.
For each measurement, more than 6 values of ice thickness at different sites on the insulator shed surface were
measured, and then the mean value as the ice thickness was taken at the corresponding moment.
2.3.3.2. Measurement of length (l) and diameter (d) of icicles:
During the icing process, we measured the length and diameter of different icicles to obtain no less than 10
different measuring data points at each time. The mean value was taken as the icicle length or icicle diameter.
For polymeric insulators, icicles on the edge of big sheds were chosen as the measuring objects. After the gaps
1574

ZHANG et al./Turk J Elec Eng & Comp Sci
between sheds were bridged by icicles, the icicle length was equal to the distance between two adjacent sheds
and did not change.
3. The influence of ambient parameters on ice growth of insulator string
3.1. The influence of ambient temperature on ice growth
The comparative tests of icing growth characteristics of type A, C, and E insulators were carried out at different
temperatures. In the tests, the wind velocity was 1 ± 0.2 m/s, the MVD of droplets was in the range of 110–130
µm, and the LWC was about 110 g m−3 . After 3 h of icing, the ice shapes of different types of insulators at
different temperatures are shown in Figure 2.
(a)
(-2±0.5) (-5±0.5) (-8±0.5) (-11±0.5)
(b)
(-2±0.5) (-5±0.5) (-8±0.5) (-11±0.5)
(c)
(-2±0.5) (-5±0.5) (-8±0.5) (-11±0.5)
Figure 2. Ice shapes of different insulators at different temperatures: (a) type A, (b) type C, (c) type E.
At different times of the icing process, ice thickness (h) and icicle length ( l) at the windward side of
type A, C, and E insulators at different temperatures were measured. Take the type A insulator for example;
its measurement results are shown in Table 2.
From the total results, the following observations can be made:
1) The temperature has an influence on the icing growth process. The growth rate of icicles increases with
the decrease of temperature while the icicles become longer and thicker. Taking the type E insulator for
instance, after 1 h of icing, the icicle length at the temperature of –2 ◦C, –5 ◦C, –8 ◦C, and –11 ◦C is
28.52 mm, 35.25 mm, 50.36 mm, and 71.25 mm, respectively. At the temperature of –5 ◦C, –8 ◦C, and
1575

ZHANG et al./Turk J Elec Eng & Comp Sci
–11 ◦C, the required time for icicles to bridge the insulator sheds completely is 3 h, 2.5 h, and 1.5 h,
respectively. When the temperature is –2 ◦C, the sheds of the type E insulator have not been completely
bridged by icicles after 3 h of icing. The reason is that in the wet growth case, the droplets that collide on
the ice surface form a water film and then move along the icicle to its tip. According to the heat balance
for icicle growth proposed by Makkonen [32], the freezing rate of water on the tip of icicles increases with
the decrease of temperature. This means that the lower the temperature is, the longer the icicle is in the
wet growth case. Furthermore, in the process of a water film moving on the icicle wall, the freezing rate
of the water film will increase with the decrease of temperature. Thus, at a lower temperature, the icicles
get a bigger diameter. The impact of temperature on the growth of icicles is basically consistent with the
research results of previous studies [32–34].
Table 2. Icing growth results of type A insulator at different temperatures.
TypeIcing Temperature Icing time, hresults ◦C 0.5 1 1.5 2 2.5 3
A
l
–2 8.31 20.87 33.32 48.65 57.34 68.13–5 10.35 25.87 39.24 55.65 68.24 77.42–8 18.68 33.21 50.36 67.15 75.68 78.00–11 31.35 58.28 72.58 78.00 78.00 78.00
h
–2 1.07 3.75 6.32 7.67 8.85 9.87–5 2.14 4.08 6.87 8.14 9.44 10.24–8 4.56 7.08 10.34 12.68 14.35 15.04
2) It is found that the lower the temperature is, the thicker the ice on the insulator surface is, and the faster
the increase of ice thickness. After 3 h of icing, at the temperature of –2 ◦C, –5 ◦C, –8 ◦C, and –11 ◦C,
the h of the type A insulator is 9.87 mm, 10.24 mm, 15.04 mm, and 20.57 mm, respectively; the h of the
type C insulator is 11.86 mm, 13.11 mm, 17.58 mm, and 21.43 mm, respectively; and the h of the type
E insulator is 12.37 mm, 13.68 mm, 16.14 mm, and 18.89 mm, respectively. The reason is that with the
decrease of temperature, the supercooled droplets that collide on the insulator have a lower temperature
and the freezing rate of the water film will increase [34].
3) When the temperature is reduced from –2 ◦C to –5 ◦C, the increases of ice amount and growth rate
are not significant. However, if the temperature continues to drop to –8 ◦C or –11 ◦C, the icing growth
rate of each insulator string will increase significantly. For the type E insulator, after 1 h of icing, the ice
thickness at a temperature of –2 ◦C, –5 ◦C, –8 ◦C, and –11 ◦C is 4.55 mm, 5.68 mm, 8.69 mm, and
13.04 mm, respectively.
3.2. The influence of wind velocity on icing growth
Tests on icing growth characteristics of type A, C, and E insulators at different wind velocities were carried out.
In the tests, the ambient temperature was –8 ± 0.5 ◦C, the MVD was in the range of 110–130 µm, and the
LWC was about 110 g m−3 . After 3 h of icing, the ice shapes of different types of insulators under different
wind velocities are shown in Figure 3.
1576

ZHANG et al./Turk J Elec Eng & Comp Sci
(1±0.2) m/s (3±0.2) m/s (5±0.2) m/s
(b)
(1±0.2) m/s (3±0.2) m/s (5±0.2) m/s
(c)
(1±0.2) m/s (3±0.2) m/s (5±0.2) m/s
(a)
Figure 3. Ice shapes of different insulators at different wind velocities: (a) type A, (b) type C, (c) type E.
Figure 3 indicates that the wind velocity has a significant impact on the icing growth process. With the
increase of wind speed, all of the ice thicknesses and the length and diameter of icicles increase significantly.
This is mainly due to the fact that the high wind speed accelerates the heat exchange of the water film on ice
surfaces and icicle walls.
At different times of the icing process, the thickness (h) of ice and the length ( l) of icicles on the windward
side of type A, C, and E insulators at different wind speeds were measured. For example, the measurement
results of the type C insulator are shown in Table 3.
Table 3. Icing growth results of type C insulator at different wind speeds.
TypeIcing Wind, Icing time, hresults m/s 0.5 1.0 1.5 2.0 2.5 3.0
C
l
1 24.68 41.26 65.68 84.36 112.65 138.793 40.25 83.65 125.68 146.53 146.53 146.535 62.53 131.58 146.53 146.53 146.53 146.53
h
1 4.89 8.11 11.58 14.56 16.27 17.583 5.14 12.01 19.81 21.21 22.35 22.585 9.97 18.87 23.41 24.46 24.75 24.84
1577

ZHANG et al./Turk J Elec Eng & Comp Sci
The observations according to the total results are as follows:
1) The influence of wind speed on icing growth of insulators is significant. It was found that when other
ambient parameters remain unchanged, the higher the wind speed was, the longer and thicker the icicles
were. The growth rate of icicles increased with the increase of wind velocity. When the wind speed was
1 m/s, 3 m/s, and 5 m/s, after 1 h of icing, the length was 33.21 mm, 68.79 mm, 78.01 mm, respectively,
for the type A insulator; 41.26 mm, 83.65 mm, and 131.58 mm, respectively, for the type C insulator; and
50.36 mm, 82.84 mm, and 109.43 mm, respectively, for the type E insulator.
2) The required time for icicles to completely bridge the insulator sheds decreases with the increase of wind
velocity. Under the condition of wind speed of 1 m/s, the sheds of the three types of insulator have not
yet been bridged by icicles after 1 h of icing. However, when the wind speed increases to 5 m/s, most of
the icicles have bridged the sheds of each insulator after 1 h of icing.
3) Within the same icing time, the thickness of ice that accretes on the insulator surface increases with the
increase of wind speed. After 3 h of icing, when the wind speed is 1 m/s, 3 m/s, and 5 m/s, the h of the
type A insulator is 15.04 mm, 17.24 mm, and 19.15 mm, respectively; the h of the type C insulator is
17.58 mm, 22.58 mm, and 24.84 mm, respectively; and the h of the type E insulator is 16.14 mm, 23.44
mm, and 26.38 mm, respectively.
The impact of wind speed on icing growth is probably due to the following reasons: with the increase of
wind speed, both the drag force of airflow on droplets and the number of droplets deviating from the airflow
line will increase. Thus, there will be more droplets colliding with the insulator. This means that the amount
of liquid water on the insulator for freezing will increase [35]. Meanwhile, a higher wind speed will accelerate
the heat exchange of the water film on ice surfaces and icicle walls. This makes the freezing of water easier and
thus accelerates the growth of the ice layer and icicles [32–35].
3.3. The influence of MVD on icing growth
Test researches on icing growth characteristics of type A, C, and E insulators were carried out under conditions
of different MVDs. In the tests, the ambient temperature was –5 ± 0.5 ◦C, the wind velocity was 3 ± 0.2 m/s,
and the LWC was about 110 g m−3 . After 3 h of icing, the ice shapes of different insulators at different MVDs
are shown in Figure 4.
As is shown in Figure 4, when the MVD is 100 µm, 130 µm, and 201 µm, the icing growth is wet and
each insulator is covered with glaze. The impact of MVD on icing severity of the insulator is not significant.
This is consistent with the results of [36].
At different times of the icing process, the thickness (h) of ice and the length ( l) of icicles at the windward
side of type A, C, and E insulators under the condition of different MVDs were measured. For example, the
results of the type E insulator are given in Table 4.
1578

ZHANG et al./Turk J Elec Eng & Comp Sci
(100±10) μm (130±10) μm (201±10) μm
(b)
(100±10) μm (130±10) μm (201±10) μm
(c)
(100±10) μm (130±10) μm (201±10) μm
(a)
Figure 4. Ice shapes of insulators under conditions with different MVDs: (a) type A, (b) type B, (c) type C.
Table 4. Icing growth results of type E insulator at different MVDs.
TypeIcing MVD Icing time, hresults (µm) 0.5 1.0 1.5 2.0 2.5 3.0
E
l
100 15.56 35.25 54.78 70.14 89.87 108.54130 24.16 43.92 64.17 79.01 92.35 109.43201 33.36 53.58 74.16 88.76 101.34 109.43
h
100 3.16 5.68 8.67 9.89 11.74 13.68130 4.71 6.75 10.14 11.13 13.62 14.24201 6.51 7.85 10.85 11.91 14.35 14.89
The observations according to the results are as follows:
1) In the early stage of the icing process, with the increase of MVD, the growth rate of icicles is increased to
some extent. When the MVD is 100 µm, 130 µm, and 201 µm, after 1 h of icing, the length of icicles of
the type E insulator is 35.25 mm, 43.92 mm, and 53.58 mm, respectively, and the ice thickness of the type
E insulator is 5.68 mm, 6.75 mm, and 7.85 mm, respectively. The main reason may be that the bigger the
MVD is, the smaller the air drag and the bigger the droplets’ inertia. The impact of airflow field on the
movement of droplets will be weakened with the increase of MVD. Thus, with the increase of MVD, there
will be more droplets directly colliding with the insulator and then freezing into ice [37,38]. Meanwhile,
1579

ZHANG et al./Turk J Elec Eng & Comp Sci
because of the supercooling effect of the low-temperature air before droplets hit the insulator surface, the
bigger the MVD is, the smaller the reduced temperature of droplets. Therefore, for the droplets with a
bigger MVD, the required time to form ice will increase. The unfrozen liquid water moves to the edge of
insulator sheds and then forms long and thick icicles.
2) After a long time of icing, the icicles will influence the droplets’ movement trajectory. There will be a large
number of droplets colliding with the icicle walls and then forming supersaturated water film. However,
under certain icing conditions, the amount of water that could be frozen is limited. Too much water will
move downward along the icicles and flow away at last. After a long time of icing, the difference in icing
degree of the insulator at different MVDs is therefore not significant. Under the condition with MVD of
100 µm, 130 µm, and 201 µm, after 3 h of icing, h is 10.24 mm, 11.58 mm, and 12.57 mm, respectively,
for the type A insulator; 13.11 mm, 13.89 mm, and 14.16 mm, respectively, for the type C insulator; and
13.68 mm, 14.24 mm, and 14.89 mm, respectively, for the type E insulator.
4. The difference of icing growth among different types of insulators
4.1. The difference of ice shape among different insulators
Experimental investigations of icing growth of five types of insulators were carried out in a climate chamber.
In the tests, the temperature was –5 ± 0.5 ◦C, the wind velocity was 3 ± 0.2 m/s, the MVD was in the range
of 110–130 µm, and the LWC was about 110 g m−3 . After 3 h of icing, the ice at the windward and leeward
sides of the five types of insulators is shown in Figure 5 (the left figure represents the windward side, while the
right one represents the leeward side)
(a) (b)
(c) (d)
(e)
Figure 5. Ice on windward and leeward sides of different insulators after 3 h of icing: (a) type A, (b) type B, (c) type
C, (d) type D, (e) type E.
As shown in Figure 5, under such icing conditions, each insulator string has been covered with glaze and
the icing at the windward side is more serious than that at the leeward side. For the ice shape, there are some
1580

ZHANG et al./Turk J Elec Eng & Comp Sci
differences among different insulator strings. For type A, D, and E insulators, most of ice has been deposited at
the windward side, and the shed surface of the leeward side is only covered with some ice particles and there is
no icicle at the leeward side. For the type B insulator, ice is mainly deposited at the windward side and there
are only a few short and thin icicles on the edge of big sheds. For the type C insulator, the ice that is deposited
at leeside is not significantly different from that at the windward side. The icicle diameter at the windward side
is a little bigger than that at the leeward side. The ice at the windward surface is just a little thicker than that
at the leeward surface. The main reason is that the inclination and diameter of sheds and the gaps between
sheds have some influence on the flow field around the insulator during the icing process [36,37].
5. The difference of ice growth process among different types of insulators
The ice at the windward and leeward sides of different insulator strings after 3 h of icing is shown in Figure
5. According to Figure 5, there are almost no icicles at the leeward side of type A, B, D, and E insulators.
Therefore, only the length and diameter of icicles at the leeward side of the type C insulator were measured
during the icing process, and the test results are shown in Figure 6.
0
40
80
120
160
0 0.5 1 1.5 2 2.5 3 3.5
T /h
l,d,h/mm
l
d
h
Figure 6. Icing growth of type C insulator, leeward side.
During the icing process, ice thickness (h), icicle length ( l), and diameter (d) at the windward side of
the five types of insulators were measured. The results are shown in Figure 7. According to Figure 7, the
following observations can be obtained:
1) With the increase of icing time, the icicle length of the windward side for different insulator strings
increases constantly and nonlinearly. In the earlier stage, the length l of type A, B, C, D, and E insulator
string increases by 24.35 mm, 27.35 mm, 34.52 mm, 37.62 mm, and 37.25 mm, respectively. The growth
rates of icicle length of type C, D, and E insulators are faster than that of type A and B insulators in
this stage. In the middle stage, the icicle length of each insulator increases with a faster rate, and the
growth rates of type C, D, and E insulators are also faster than that of type A and B insulators. In the
middle stage, the length ( l) of type A, B, C, D, and E insulators has increased by 49.89 mm, 59.28 mm,
63.94 mm, 64.72 mm, and 64.62 mm, respectively. This is because the shed surfaces of type C, D, and E
insulators have a bigger inclination. This leads the number of supercooled water droplets captured by the
windward surface of type C, D, and E insulator to be more than that captured by the windward surface
of the other two types of insulator string. Furthermore, in the middle stage, icicles block the inflow and
1581

ZHANG et al./Turk J Elec Eng & Comp Sci
some water droplets directly collide on the icicle walls. In such a situation, many supercooled droplets
move downward to the icicle tip and then accelerate the growth of the icicle length. In the later stage,
for the type A insulator, icicles have bridged its sheds and the icicle length is as the same as the distance
between two sheds. For type D and E insulators, icicles grow slowly until their sheds are bridged. The
icicle length of these two type insulators has increased by 13.82 mm and 7.56 mm, respectively. The icicle
length of type B and C insulators continues to grow until their sheds are bridged and then increases by
60.61 mm and 48.07 mm respectively in the later stage.
0
40
80
120
160
0 0.5 1 1.5 2 2.5 3 3.5
T /h
l/m
m
Type A
Type B
Type C
Type D
Type E
0
5
10
15
20
25
30
0 0.5 1 1.5 2 2.5 3 3.5
T /h
d/m
m
Type A
Type B
Type C
Type D
Type E
(a) (b)
0
5
10
15
20
0 0.5 1 1.5 2 2.5 3 3.5
T /h
h/m
m
Type A
Type B
Type C
Type D
Type E
(c)
Figure 7. Icing growth on windward side of different type insulator: (a) l vs. T, (b) d vs. T, (c) h vs. T.
2) With the increase of icing time, the icicle diameter of the windward side for different types of insulators
increases constantly and nonlinearly as well. In the earlier stage, the icicle diameter of each insulator
string increases rapidly, and the increasing rates are not very different from each other. In this stage,
the diameter d of type A, B, C, D, and E insulators has increased by 12.21 mm, 13.54 mm, 12.31 mm,
12.36 mm, and 12.05 mm, respectively. In the middle stage, the icicle diameter of each insulator string
slowly increases by 7.57 mm, 10.14 mm, 5.01 mm, 8.40 mm, and 6.74 mm, respectively. This may be
because many water droplets directly collide on the icicle wall and form a supersaturated water film, and
1582

ZHANG et al./Turk J Elec Eng & Comp Sci
the excessive liquid water weakens the freezing ability of the icicle wall and then slows down the growth of
the icicle diameter. In the later stage, the icicle diameter of each type of insulator increases more slowly
by only 2.84 mm, 3.19 mm, 2.80 mm, 3.38 mm, and 4.62 mm, respectively. This may be due to the fact
that the gap between the icicles has become very small, and icicles at the windward side almost form a
closed semicircular cylinder, so there is no room for further growth of icicle diameter.
3) The thickness of ice at the windward side of each type of insulator is also a nonlinear function of the icing
time. In the earlier stage, the ice layer on the windward surface of each insulator has rapid growth. In this
stage, the thickness h of type A, B, C, D, and E insulators increases by 5.95 mm, 6.54 mm, 4.75 mm, 7.61
mm, and 8.46 mm, respectively. In the middle stage, the growth rate of icing thickness slows down, and
the h of each specimen increases by 2.32 mm, 3.10 mm, 4.23 mm, 4.18 mm, and 3.61 mm, respectively.
This may be mainly because with the growth of icicles at the windward side, there is a greater blocking
effect of icicles on the inflow. This reduces the amount of supercooled water droplets captured by the
windward surface of the insulator and thus decreases the growth rate of the ice layer. In the later stage,
inflow was further blocked by intensive icicles at the windward side, and the growth of icing thickness
becomes slower. In this stage, the thickness of the ice layer on the windward side of type A, B, C, D, and
E insulators only increases by 0.60 mm, 1.22 mm, 1.39 mm, 2.62 mm, and 2.91 mm, respectively.
6. Conclusions
1) Ambient temperature affects the icing growth process and the type of ice deposited on insulators. With
the decrease of temperature, the amount of ice deposited on insulators will increase, and the icicles will
become longer and thicker. Under certain icing conditions, the growth rate of ice layer and icicles will
increase with the decrease of temperature. When the wind velocity is 1 m/s, the MVD is in the range of
110–130 µm and the LWC is 110g m−3 . Test insulators will be covered with a glaze in the interval of
temperature between –8 ◦C and 0 ◦C, and with hard rime around –11 ◦C.
2) Wind velocity has a significant influence on the icing growth of insulators. When other ambient parameters
remain unchanged, the growth rate of ice layers and icicles will increase with the increase of wind speed.
3) The MVD of droplets has some influence on icing growth of insulators. Under the icing condition with a
wind velocity of 3 m/s, a temperature of –5 ◦C, and a LWC of 110 g m−3 , when the MVD is in the range
of 100–201 µm, test insulators are covered with glaze through a wet growth process. With the increase of
MVD, the growth rate of icicles has some increase in the early period of the icing process. However, with
the increase of amount of icicles on the insulator, the difference of icing on the insulator under different
MVD becomes nonsignificant.
4) Under any icing conditions, the icing growth of insulators is nonlinear and the structure of the insulator
has some influence on the ice shape. For type A, D, and E insulators, the ice accretes almost only on the
windward side, and the shed surface of the leeward side is only covered with some ice particles and there
are no icicles on the leeward side. For the type B insulator, ice mainly accretes on the windward side and
there are only a few short and thin icicles on the edge of big sheds. For the type C insulator, the ice on
the leeward side is not significantly different from that on the windward side. The diameter of icicles on
the windward side is a little bigger than that on the leeward side. The ice on the windward surface is just
a little thicker than that on the leeward surface.
1583

ZHANG et al./Turk J Elec Eng & Comp Sci
Acknowledgments
This work was supported by the National Natural Science Foundation of China (No. 50807056, 5021005) and
the National Basic Research Program of China (973 Program) (No. 2009CB724502). The authors thank all
members of the external insulation research team of Chongqing University for their hard work in obtaining the
experimental data for this paper.
References
[1] Jiang X, Wang S, Zhang Z, Xie S, Wang Y. Study on AC flashover performance and discharge process of polluted
and iced IEC standard suspension insulator string. IEEE T Power Deliver 2007; 22: 472–480.
[2] Jiang X, Ma J, Zhang Z, Hu J. Effect of hydrophobicity coating on insulator icing and DC flashover performance
of iced insulators. IEEE T Dielect El In 2010; 17: 351–359.
[3] CIGRE Task Force 33.04.09. Influence of ice and snow on the flashover performance of outdoor insulators part I:
effects of ice. Electra 1999; 187: 90–111.
[4] CIGRE Task Force 33.04.09. Influence of ice and snow on the flashover performance of outdoor insulators part II:
effects of snow. Electra, 2000; 188: 55–69.
[5] Hydro Quebec Committee of Experts. January 1998 Ice Storm, Report for Hydro Quebec. Montreal, Canada: Hydro
Quebec, 1998.
[6] Yoshida S, Naito K. Survey of electrical and mechanical failures of insulators caused by ice and/or snow, CIGRE
WG B2.03. Electra 2005; 222: 22–26.
[7] Matsuda H, Komuro H, Takasu K. Withstand voltage characteristics of insulator strings covered with snow or ice.
IEEE T Power Deliver 1991; 6: 1243–1250.
[8] Li Z, Zhang Q, Liu F, Jia H, Cheng L, Xi H. Discharge propagation along the air gap on an ice-covered insulator
string. IEEE T Plasma Sci 2011; 39: 2238–2239.
[9] Farzaneh M, Li Y, Zhang J, Shu L, Jiang X, Sima W, Sun C. Electrical performance of ice-covered insulators at
high altitudes. IEEE T Dielect El In 2004; 11: 870–880.
[10] Hu J, Sun C, Jiang X, Zhang Z, Shu L. Flashover performance of pre-contaminated and ice-covered composite
insulators to be used in 1000 kV UHV AC transmission lines. IEEE T Dielect El In 2007; 14: 1347–1356.
[11] Jiang X, Chao Y, Z. Zhang, Hu J, Shu L. DC flashover performance and effect of sheds configuration on polluted
and ice–covered composite insulators at low atmospheric pressure. IEEE T Dielect El In 2011; 18: 97–105.
[12] Liu Y, Gao S, Huang D, Yao T, Wu X, Hu Y, Cai W. Icing flashover characteristics and discharge process of 500
kV AC transmission line suspension insulator strings. IEEE T Dielect El In 2010; 17: 434–442.
[13] IEC. Artificial Pollution Tests on High-Voltage Insulators to be Used on A.C. Systems. IEC 60507. Geneva,
Switzerland: IEC, 1991.
[14] Farzaneh M, Kiernicki J. Flashover performance of IEEE standard insulators under ice conditions. IEEE T Power
Deliver 1997; 12: 1602–1613.
[15] Kannus K, Lahti K. Laboratory investigations of the electrical performance of ice-covered insulators and a metal
oxide surge arrester. IEEE T Dielect El In 2007; 14: 1357–1372.
[16] Farzaneh M, Kiernicki J. Flashover problems caused by ice build-up on insulators. IEEE Electr Insul M 1995; 11:
5–17.
[17] Jiang X, Chen L, Zhang Z, Sun C, Hu J. Equivalence of influence of pollution simulating methods on DC flashover
stress of ice-covered insulators. IEEE T Power Deliver 2010; 25: 2113–2120.
[18] Cherney EA. Flashover performance of artificially contaminated and iced long-rod transmission line insulators.
IEEE T Power Ap Syst 1980; 99: 46–52.
1584

ZHANG et al./Turk J Elec Eng & Comp Sci
[19] Farzaneh M, Drapearu JF. AC flashover performance of insulators covered with artificial ice. IEEE T Power Deliver
1995; 10: 1038–1051.
[20] International Electrotechnical Commission. Artificial Pollution Tests on High Voltage Insulators to Be Used on AC
Systems. International Standard IEC 507. Geneva, Switzerland: IEC, 1991.
[21] Farzaneh M, Baker T, Bernstorf A, Brown K, Chisholm WA, de Tourreil C, Drapeau JF, Fikke S, George JM,
Gnandt E et al. Insulator icing test methods and procedures: a position paper prepared by the IEEE Task Force
on Insulator Icing Test Methods. IEEE T Power Deliver 2003; 18: 1503–1515.
[22] IEEE. Guide for Test Methods and Procedures to Evaluate the Electrical Performance of Insulators in Freezing
Conditions. IEEE Standard 1783-2009. New York, NY, USA: IEEE, 2009.
[23] Farzaneh M, Chen X, Zhang J. A study of surface conductivity and flashover voltage of ice samples formed under
various freezing conditions. Int J Offshore Polar 1996; 6: 298–303.
[24] Fikke SM, Hanssen JE, Rolfseng L. Long range transported pollution and conductivity on atmospheric ice on
insulators. IEEE T Power Deliver 1993; 8: 13411–1321.
[25] Farzaneh M, Baker A, Allen Bernstorf R, Burnhan JT, Cherney EA, Chisholm WA, Fofana I, Gorur RS, Grisham T,
Gutman I et al. Selection of line insulators with respect to ice and snow –Part II: Selection methods and mitigation
options. IEEE T Power Deliver 2007; 22: 2297–2304.
[26] Farzaneh M, Zhang J, Li Y. Effects of low air pressure on AC and DC arc propagation on ice surface. IEEE T
Dielect El In 2005; 12: 60–71.
[27] Lu ML, Popplewell N, Shah AH. Freezing rain simulations for fixed, unheated conductor samples. J App Meteorol
2000; 39: 2385–2486.
[28] Makkonen L. Modeling of ice accretion on wires. J Am Meteorol Soc 1984; 23: 929–939.
[29] Personne P, Gayet JF. Ice accretion on wires and anti-icing induced by Joule effect. J App Meteorol 1998; 27:
101–114.
[30] Farzaneh M, Savadjiev K. Statistical analysis of field data for precipitation icing accretion on overhead power lines.
IEEE T Power Deliver 2005; 20: 1080–1087.
[31] Makkonen L. Modeling power line icing in freezing precipitation. In: 7th International Workshop on Atmospheric
Icing of Structures; 1998; Canada. pp. 195–200.
[32] Makkonen L. A model of icicle growth. J Glaciol 1998; 34: 64–70.
[33] Maeno N, Makkonen L, Nishimura K, Kosugi K, Takahashi T. Growth rates of icicles. J Glaciol 1994; 40: 319–326.
[34] Maeno N, Takahashi T. Studies on icicles. I: General aspects of the structure and growth of an icicle. Low Temp
Sci Ser A 1984; 43: 125–138.
[35] Myers TG, Charpin JPF, Thompson CP. Slowly accreting ice due to supercooled water impacting on a cold surface.
Phys Fluids 2002; 14: 240–256.
[36] Jiang X, Shen Q. Experimental research on influence of environmental parameters on the conductor icing thickness.
High Volt Eng 2010; 36: 1096–1100.
[37] Jiang X, Wen Z. Numerical simulation of super cooled water droplet impingement on composite insulator surface.
High Volt Eng 2008; 34: 888–892.
[38] Jiang X, Wen Z, Sun C. Numerical simulation of water droplet impingement on composite insulator surface and
analysis of shed configuration. P CSEE 2008; 28: 7–12.
1585