study of starch metabolism in tomato fruit by using
TRANSCRIPT

HAL Id: tel-03275318https://tel.archives-ouvertes.fr/tel-03275318
Submitted on 1 Jul 2021
HAL is a multi-disciplinary open accessarchive for the deposit and dissemination of sci-entific research documents, whether they are pub-lished or not. The documents may come fromteaching and research institutions in France orabroad, or from public or private research centers.
L’archive ouverte pluridisciplinaire HAL, estdestinée au dépôt et à la diffusion de documentsscientifiques de niveau recherche, publiés ou non,émanant des établissements d’enseignement et derecherche français ou étrangers, des laboratoirespublics ou privés.
Study of starch metabolism in tomato fruit by usingforward and reverse genetic approaches
Jiaojiao Wang
To cite this version:Jiaojiao Wang. Study of starch metabolism in tomato fruit by using forward and reverse geneticapproaches. Vegetal Biology. Université de Bordeaux, 2020. English. �NNT : 2020BORD0213�. �tel-03275318�

Part I- Introduction
THÈSE PRÉSENTÉE
POUR OBTENIR LE GRADE DE
DOCTEUR DE
L’UNIVERSITÉ DE BORDEAUX
ÉCOLE DOCTORALE
Science de la Vie et de la Santé
SPÉCIALITÉ
Biologie Végétale
Par Jiaojiao WANG
Study of Starch Metabolism in Tomato Fruit by Using
Forward and Reverse Genetic Approaches
Sous la direction de : Yves GIBON
(co-directeur : Pierre BALDET)
Soutenue le 27th, Novembre, 2020
Membres du jury :
M. HERNOULD Michel PR Université de Bordeaux Président du jury Mme. DINANT Sylvie DR INRAE Versailles Rapporteur M. ZOUINE Mohamed DR GBF Toulouse Rapporteur Mme. COOKSON-WODRICH Sarah Jane CR INRAE Bordeaux Examinateur Mme. ISSAKIDIS-BOURGUET Emmanuelle CR CNRS Paris-Saclay Examinateur M. GIBON Yves DR INRAE Bordeaux Directeur de thèse M. BALDET Pierre CR INRAE Bordeaux Invité


I
Acknowledgement
In Chinese, we would use the phrase "white horse crossing the gap" (白驹过隙) to describe the rapid passing of time.
This idiom comes from Zhuangzi, one of my favorite Chinese philosophers. "The life span of a human being is
extremely short, like a white horse galloping through a narrow gap, passing away in a flash. However, the Tao (or
spirit) can stay in the world forever." These four years are like a white horse crossing a gap, but plant science for me,
it may be a kind of way to pursue Tao in a short life. In those four years, I was lucky to meet great supervisors,
colleagues and friends in France. When the thesis is completed, I hope to express my deep and sincere gratitude to
them.
First of all, I would like to thank my two supervisors GIBON Yves and BALDET Pierre. When I arrived in Bordeaux,
they gave me the timely help in experiment and life. At the very beginning, Pierre helped me a lot with the most
urgent things such as accommodation, bank card and registration. In the second week after I arrived, there was a
large number of samples in the greenhouse. Yves and Pierre mobilized many people from the G2 and G3 groups to
help with the sampling, which made me feel a sincere welcome. With Yves, we had weekly doctoral group meetings,
lot of discussions after obtaining every result, and regular supervisor meetings. Yves tracked the progress of my
experiment and asked me a lot of questions, urged me to find the answer and explain it to him after understanding.
In this question-answer-question-answer process, with specific questions, I actively or passively absorbed a lot of
topic-related knowledge. But beyond this, they gave me the fullest freedom and trust. I really appreciate the
autonomy and freedom they gave to me. Their offices are always open to me, but they rarely come to the office or
laboratory to “check” my attendance. In addition to the guidance and interaction on the project, they also discussed
many broader scientific, social and cultural issues with me. They are talkative persons and also good listeners. I
gradually got a lot of inspirations from them. I will always remember that Yves said, “Science is a culture”. I even
made a series of records of our seminars, which is another fortune for me.
Secondly, I would like to thank the two most important collaborators on this project, BRES Cécile and MAUXION
Jean-Philippe. As this project is a collaboration of two research groups, Cecile and JP provided me with the most
important technical supports. At the beginning of our cooperation, because the subject and the technology
themselves, we had small frictions. However, through communication and discussions, these frictions have actually
enhanced our mutual understanding.
Thirdly, I want to thank the people who helped me in different experiments. FERNANDEZ Lucie gave me a lot of good
suggestions on bulk construction and sequencing results analysis; JUST Daniel gave me very important help in the
use and storage of EMS mutant seeds, and provided me part of screening materials; ROTHAN Christophe gave me
very important suggestions for the F2 population culture and bulk construction; BALLIAS Particia and CASSAN Cédric
provided me with a lot of help for my work on the HiTMe platform; CABASSON Cécile and her interns helped me
measure the chlorophyll and photosynthetic indicators of the mutants; ANDRIEU Marie-Hélène helped me take

II
samples during the COVID-19 lockdown period to keep the most important materials. ROCH Léa helped me measure
the cell wall composition of some samples; COLOMBIE Sophie helped me construct a model of Micro-Tom's primary
metabolites. ATIENZA Isabelle and HONORE Aurélie helped me take care of the plants in the two greenhouses S2
and HPE. SHENG Edith and BASTIDE Charles were two internship students who worked with me for one and two
months, respectively. Thank them for the help and convenience they provided in the laboratory with their knowledge
and skills.
In addition, I would like to thank other G3 members who are not mentioned, including BEAUVOIT Bertrand, MOING
Annick, PETRIACQ Pierre, MORI Kentaro, et al. Thank them for accepting me as a part of G3. Although my subject is
not so closely related to their projects and fields of expertise, they still gave me comments or suggestions every time
when I presented in the group. Also, many thanks for the good time we spent in the two retraits. I also would like to
thank the members of G1, because I spent about half of my time doing experiments on molecular biology and tissue
culture, all on the first floor. Thank them for their daily help, and their well-organized experiment environment. In
addition, I would also like to thank the people who provided me with help beside the experiments. LOMBARD Marie-
Louise and LARTIGAUT Florence helped me a lot in the administrative procedures.
I cannot wait to give thanks to my officemates! They are Isma, Constance, Paul, Alice, Guillaume, Thomas, Gabriel,
and Amelie. They all make my daily academic life vivid and colorful. I like to teach them Chinese and also like them
to teach me French, although my French is still poor. Additionally, I would also like to thank the other PhD students,
Edouard, Arthur, Norbert, etc., for their daily discussions with me and their daily help.
I want to thank the Chinese researchers and friends I met in Bordeaux in these four years. They are Zhanwu (占武),
Junhua (俊花), Guotian (国甜), Jinliang (金良), Weiwei (伟伟), Ziqiang (自强), Yuxin (宇欣), et al.. We work together
in INRA, often have lunch together, exchange experiments and scientific research news. I also would like to give
thanks to the students who got the same scholarship and enrolled in Bordeaux University in the same year, they are
Lina (莉娜), Zhenhui (珍慧), Zhenyan (正焱), Zaichen (在成), Wencan (文灿), Yulin (毓麟), et al. We formed a small
community, exchanged various information in life, helped each other, and witnessed each other's growth. Many
thanks to my friends, Hitomi, Masaru, Jinan, Yiming (一明), Haiyan (海燕), Yinyi (尹伊), Xiaohan (晓涵), Yiping (易
萍), Minmin (敏敏), Junmei (俊美), Sun Yan (孙燕), too! Thanks for the happy time we have spent together.
I gave my great thanks to my families and friends in China. Thanks to my mom (Wang Xiaofen, 王晓芬), dad (Wang
Dexian, 王德先), grandpa (Wang Yuanlin, 王元林), for supporting me until I am 30 years old without urging me to
be like many other Chinese girls to get married early and have children. Thanks to my friends Wang Dan (王丹),
Xiaofang (晓芳), Hu Die (胡蝶), Shashan (莎珊), for our continuous efforts to maintain our friendship since childhood,
university or graduate school! Thank you for being by my side.
At last, I would like to thank the China Scholarship Council for providing me with a four-year scholarship, so that I
can focus on PhD studies without financial worries.

III

IV
Titre : Étude du métabolisme de l'amidon chez les tomates à l'aide d'approches génétiques directes et inverses
Résumé : [4000 caractères maximum, espaces compris]
L’amidon joue un rôle central pendant le développement et la maturation des fruits. Sa dégradation
fournit de l’énergie et des sucres aux fruits en maturation tandis que son accumulation répond aux
stress environnementaux. La connaissance du métabolisme de l’amidon dans les feuilles s’est
considérablement améliorée, principalement grâce à la caractérisation des mutants d’Arabidopsis
(sans amidon ou excédentaire), mais on en sait très peu sur les fruits. Dans cette étude, nous avons
utilisé des approches de génétique directe et inverse pour obtenir des mutants de tomate produisant
des fruits avec un excès d’amidon.
Pour mener la démarche de génétique directe, nous avons combiné l’utilisation d’une plateforme
robotisée permettant le dosage d’amidon à haut-débit avec celle d’une importante population de
mutants EMS, et réalisé un criblage en utilisant des fruits rouges de près de 3000 individus. Trois
candidats avec un excès d’amidon ont été trouvés, dont un (P17C12) a ensuite été confirmé avec
une mutation récessive. Une grande population BC1F2 a été phénotypée puis utilisée pour localiser
la mutation en utilisant une approche de cartographie par séquençage. Les résultats de l’analyse
ont montré que la localisation la plus probable de la mutation est à l’extrémité du chromosome 1,
avec 1 mutation KO, 2 mutations « faux-sens » et de nombreuses mutations dans des régions non
codantes. Nous avons décidé de tester la RecQ hélicase 4 (RECQ4, Solyc01g103960, KO), un
membre de la famille des protéines de transport mitochondrial (MCF, Solyc01g095510, « faux-
sens »), un transporteur de phospholipides à ATPase (PTA, Solyc01g096930, « faux-sens »), un
ORF situé en 5’ d’une protéine de fonction inconnue (CPuORF, Solyc01g105700, 5’ UTR) et la
Rubrédoxine (Solyc01g097910, 3’ UTR).
Nous avons créé des mutants homozygotes KO ou faux-sens en utilisant CRISPR/Cas9 pour les
gènes candidats RECQ4, MCF et PTA, et des mutants homozygotes avec mutations d’insertion /
suppression dans le 5’ UTR pour CPuORF, mais aucun n’a montré de phénotype avec excès
d’amidon. Pour la Rubrédoxine, en plus de créer des mutants KO et des mutants avec des mutations
similaires dans 3’ UTR avec CRISPR/Cas9, nous avons également produit des plantes
surexprimant la Rubrédoxine car chez mutant P17C12, l’ARNm de la Rubrédoxine était fortement
V
exprimé dans le fruit vert des lignées BC1F1 et S2. Le développement du mutant KO pour la
Rubrédoxine (homozygotes) ne va pas au-delà du stade cotylédon. Les mutants avec des mutations
dans 3’ UTR, qui n’ont montré aucun changement dans la quantité d’amidon ou les niveaux
d'ARNm de Rubrédoxine. Certaines plantes ont montré des expressions 100 fois plus élevées de
Rubrédoxine dans les feuilles, mais aucune n’a montré d’augmentation significative de la quantité
d'amidon dans les fruits. Finalement, nous n’avons trouvé le phénotype avec excès d’amidon dans
les fruits pour aucun des cinq gènes candidats testés, ce qui implique que davantage
d'investigations seront nécessaires pour affiner la cartographie et identifier la mutation responsable
de ce phénotype.
En utilisant une approche de génétique inverse, nous avons sélectionné une α-amylase (AMY3.2)
et trois β-amylases (BAM1.2, BAM3.2 et BAM9), pour lesquelles nous avons créé des mutants
KO par CRISPR/Cas9. Nous avons obtenu des mutants KO homozygotes pour AMY3.2 et BAM9,
et des mutants KO hétérozygotes pour BAM1.2 et BAM3.2 dans la génération T1. Les mutants de
deux lignées transgéniques dépourvues d’AMY3.2 ont montré une teneur en amidon inférieure
dans fruits de 20 DAP. L’absence de BAM9 a conduit à une mauvaise fertilisation chez quelques
mutants. La quantité d'amidon était remarquablement élevée dans les fruits âgés de 35 DAP dans
la plupart des mutants, accompagnés d'un niveau élevé significatif de glucose dans les fruits rouges
mûrs. Ces résultats préliminaires suggèrent que BAM9 pourrait jouer un rôle important dans la
viabilité du pollen et dans la dégradation de l’amidon des fruits pendant le mûrissement.
Mots clés : [3 minimum]
Amidon; fruit; tomate; mutant EMS; cartographie-par-séquençage; amylase

VI
Title: Study of starch metabolism in tomato fruit by using forward and reverse genetic approaches
Abstract: [4000 characters maximum]
Starch plays a central role during fruit development and ripening. Its degradation provides energy
and sugars in ripening fruits whereas its accumulation responds to environmental stresses, which
suggests a buffering role. Knowledge of starch metabolism in leaves has dramatically improved,
mostly through the characterization of Arabidopsis mutants (starch-less or -excessive), but only
very little is known in fruits. In this study, we used both forward and reverse genetic approaches
to obtain tomato mutants with starch-excess fruits.
For applying forward genetics, we took advantages of the robotic platform and the large EMS
mutant population of tomato (Micro-Tom, an ideal model for starch research), and performed a
screen by using red fruits of nearly 3,000 individuals. Three starch-excess candidates were found
and one (P17C12) could be confirmed as a homozygous mutant with a recessive starch-excess
phenotype with Mendelian inheritance analysis. A large BC1F2 population was phenotyped and
then used to localize the mutation using the mapped-by-sequencing approach. The sequence data
obtained from the two bulks revealed that the mutation was likely located at the end of
chromosome 1, a region that harbours 1 KO and 2 missense mutations as well as numerous
mutations in non-coding regions. We decided to work with the KO, missense mutations and
mutations in 5’ UTR and 3’ UTR first, which were a RecQ helicase 4 gene (RECQ4,
Solyc01g103960), a mitochondrial carrier protein family gene (MCF, Solyc01g095510), a
phospholipid-transporting ATPase gene (PTA, Solyc01g096930), a conserved peptide upstream
open reading frame (CPuORF, Solyc01g105700), and Rubredoxin (Solyc01g097910),
respectively.
To evaluate those mutations, we utilised different bioengineering techniques adapted to each case.
We created KO or missense homozygous mutants by using CRISPR/Cas9 for RECQ4, MCF and
PTA candidate genes, and homozygous mutants with insertion/deletion mutations in the 5’ UTR
for CPuORF, but none of them showed a starch-excess phenotype. For Rubredoxin, besides
creating KO mutants and mutants with similar mutations in 3’ UTR with CRISPR/Cas9, we also
overexpressed Rubredoxin under the control of the CMV-35S promoter as we found a significant

VII
increase of Rubredoxin mRNA in the 12 DAP (days after pollination) fruit of BC1F1 and S2
(P17C12), compared to the WT. The homozygous KO mutants could not grow through cotyledon
stage, indicating that the lack of Rubredoxin is lethal for phototrophic plants. The mutants with
mutations in 3’ UTR showed no changes in starch amount or mRNA levels of Rubredoxin. Then,
among the transformants overexpressing Rubredoxin, some showed 100 times higher expressions
levels of Rubredoxin in leaves, but showed no significant starch increase in 20 DAP fruit. Finally,
none of the five candidate genes checked here led to a starch-excess phenotype in fruits, implying
that more investigations are required regarding fine-mapping and mining the possible candidate
genes.
We also attempted to obtain starch-excess mutants via reverse genetics. We selected one α-amylase
(AMY3.2) and three β-amylases (BAM1.2, BAM3.2 and BAM9) to create the corresponding KO
mutants by CRISPR/Cas9 techniques. We obtained homozygous KO mutants of AMY3.2 and
BAM9, and heterozygous KO mutants of BAM1.2 and BAM3.2 in T1 generation. The mutants of
two transgenic lines lacking AMY3.2 showed lower starch content in 20 DAP fruits. While the
loss of BAM9 led to poor fertilization in some mutants. Furthermore, in most of mutants, starch
levels were remarkably high in the ripening 35 DAP fruit, accompanied with a significant high
level of glucose in red ripe fruits. Those results lead us to speculate that BAM9 may play important
roles both in pollen viability and starch degradation during fruit ripening.
Keywords : [3 minimum]
Starch; fruits; tomato; mapping-by-sequencing; amylase
Biologie du Fruit et Pathologie
[UMR 1332 BFP - INRAE Bordeaux-Aquitaine Bât. IBVM
71, av. Edouard Bourlaux - CS 20032 - 33882 Villenave d'Ornon Cedex]

VIII
Table of Contents
Acknowledgement ......................................................................................................................... I
Résumé ......................................................................................................................................... IV
Abstract ......................................................................................................................................... VI
List of Tables ................................................................................................................................ XI
List of Figures ............................................................................................................................. XII
Abbreviations ............................................................................................................................ XIV
Chapter1.1 Starch Structure, Synthesis and Degradation....................................................... 3
1.1.1 Starch Structure.....................................................................................................................3
Higher Order of Starch Structure ......................................................................................................................... 5
Starch Structure in Tomato Fruit .......................................................................................................................... 5
1.1.2 Starch Synthesis ....................................................................................................................6
Precursors of Starch Synthesis ............................................................................................................................. 7
Enzymes Involved in Starch Synthesis (SSs, SBEs and DBEs) .............................................................................. 11
1.1.3 Starch Degradation .............................................................................................................. 12
Hydrolysis of Glucan ........................................................................................................................................... 12
Phosphorylation and Dephosphorylation of the Starch Granule ....................................................................... 14
Other Enzymes or Proteins Involved in Starch Degradation .............................................................................. 15
Products and Connection with Cytosol Carbohydrate Metabolism ................................................................... 19
Starch Degradation in Other Plant Species or Tissues ....................................................................................... 20
Starch Degradation in Fruit ................................................................................................................................ 21
Chapter1.2 Regulation of Transient Starch ............................................................................. 23
1.2.1 Starch Turnover in Leaves and Fruits .................................................................................... 23
Starch Turnover in Leaves .................................................................................................................................. 23
Starch Accumulation in Fruits............................................................................................................................. 25
Starch Remobilization in Fruits ........................................................................................................................... 27
1.2.2 Regulation of Starch Accumulation ...................................................................................... 28
Sugar Signaling and Carbon Partitioning ............................................................................................................ 29
ADP-glucose Pyrophosphorylase Plays a Central Role in the Regulation of Starch Synthesis ........................... 31

IX
Regulation of Starch Degradation ...................................................................................................................... 35
1.2.3 Physiological Roles of Transient Starch ................................................................................. 38
Chapter1.3 Strategies for Studying Starch Metabolism in Fleshy Fruits: Forward and
Reverse Genetics ........................................................................................................................ 41
1.3.1 Tomato (var. Micro-Tom) as the Model for Studying Starch Metabolism in Fleshy Fruit ......... 41
1.3.2 Forward Genetics ................................................................................................................ 43
EMS Mutant Population of Micro-Tom .............................................................................................................. 43
High Throughput Phenotyping ........................................................................................................................... 44
Mapping-by-sequencing ..................................................................................................................................... 44
Identification of the Causal Mutation ................................................................................................................ 45
1.3.3 Reverse Genetics ................................................................................................................. 48
1.3.4 Aims and Strategies for the Thesis........................................................................................ 49
Chapter2 Screen for Novel Starch Mutants in Tomato (var. Micro-Tom) Fruits.................. 53
2.1 Introduction ........................................................................................................................... 53
2.2 Materials and Methods .......................................................................................................... 54
Plant Material ..................................................................................................................................................... 54
Methods.............................................................................................................................................................. 55
2.3 Results ................................................................................................................................... 61
First Screening for Mutants with Starch- and Hexose-excess Fruits .................................................................. 61
Second Screening for Confirmation of Three Mutant Families .......................................................................... 63
Mendelian Inheritance of the Mutations Affecting Starch ................................................................................ 64
Starch Accumulation in WT Fruits during Development .................................................................................... 68
Culture of the BC1F2 Population of P17C12 for Performing the Mapping-by-sequencing ............................... 70
Analysis of Mapping-by-sequencing and Fine-mapping for P17C12 Mutant .................................................... 76
2.4 Discussion .............................................................................................................................. 80
Phenotyping Starch-related Traits in Micro-Tom Fruit ...................................................................................... 80
Putative Causal Mutations for P17C12 Mutant.................................................................................................. 81
Chapter3 Evaluation of Candidate Genes ................................................................................ 89
3.1 Introduction ........................................................................................................................... 89

X
3.2 Materials and Methods .......................................................................................................... 90
RNA Extraction and qRT-PCR Analysis ................................................................................................................ 90
Construction of Plasmids for the CRISPR/Cas9 Approaches and Overexpression under CMV-35S and PEPC
Promoters ........................................................................................................................................................... 91
Transformation of Tomato ................................................................................................................................. 94
Identification and Selection of Transformants ................................................................................................... 94
Phenotyping of Mutants ..................................................................................................................................... 96
3.3 Results ................................................................................................................................... 97
Evaluation of the Candidates with KO/Missense Mutations: REQC4, MCF and PTA ......................................... 97
Evaluation of Candidates with Mutations in Non-coding-sequence Regions .................................................. 103
3.4 Discussion ............................................................................................................................ 113
Chapter4 Generating Starch-related Mutant by Knocking out Alpha- and Beta-amylase 117
4.1 Introduction ......................................................................................................................... 117
4.2 Materials and Methods ........................................................................................................ 118
Phylogenetic Analysis of BAM and AMY Family Members .............................................................................. 118
Plasmid Constructions and Tomato Transformation ....................................................................................... 119
Genotyping and Phenotyping of Mutants ........................................................................................................ 119
4.3 Results ................................................................................................................................. 121
Identification of AMY and BAM Orthologues in Tomato ................................................................................. 121
Generation of Mutants for Putative Fruit-specific Amylases (AMY3.2, BAM1.2, BAM3.2 and BAM9) ........... 125
Phenotyping of AMY3.2 and BAM9 Homozygous Mutants ............................................................................. 130
4.4 Discussion ............................................................................................................................ 135
Chapter5 Summary and Outlook............................................................................................. 141
References ................................................................................................................................. 147

XI
List of Tables Table 1 Components and structures of starch in different tissues and species ............................................................. 6
Table 2 Genes encoding proteins involved in starch synthesis in Arabidopsis and tomato ........................................... 9
Table 3 Genes encoding proteins involved in starch breakdown in Arabidopsis and tomato ..................................... 16
Table 4 Primers used for the fine-mapping of P17C12 mutant.................................................................................... 60
Table 5 The plants selected for constructing 2 bulks ................................................................................................... 73
Table 6 Selected candidate mutations of P17C12 starch-excess mutant .................................................................... 78
Table 7 List of primers for qRT-PCR .............................................................................................................................. 90
Table 8 Sequences of the guides or primers used in Golden Gate cloning for CRISPR/Cas9 mutagenesis or
overexpression.............................................................................................................................................................. 92
Table 9 Plasmids used for Golden Gate cloning ........................................................................................................... 93
Table 10 Primers for selecting transformants .............................................................................................................. 95
Table 11 The guide sequences selected for CRISPR/Cas9 mutagenesis of AMY/BAMs ............................................. 119
Table 12 The primers for PCR ..................................................................................................................................... 120
Table 13 Pollen germination solution ........................................................................................................................ 120
Table 14 transcript levels of AMY and BAM family in different tissues of tomato .................................................... 124

XII
List of Figures Fig 1 The composition and structure of starch ............................................................................................................... 4
Fig 2 Schematic representation of the pathway of starch biosynthesis in (A) photosynthetic leaves and (B)
heterotrophic tissues. ..................................................................................................................................................... 8
Fig 3 The pathway of starch degradation in chloroplast ............................................................................................. 13
Fig 4 Starch net accumulation rates in 12 fleshy fruit species. .................................................................................... 26
Fig 5 Post-transcriptional regulation of AGPase .......................................................................................................... 34
Fig 6 A general workflow for forward genetic approaches.......................................................................................... 47
Fig 7 The schematic presentation of the strategies and aims of the thesis ................................................................. 50
Fig 8 Principle of the determination of hexoses ........................................................................................................... 57
Fig 9 Concentrations of starch (A), glucose (B) and fructose (C) in screened tomato fruits ........................................ 62
Fig 10 Concentrations of starch (A) and hexoses (B) during fruit ripening of mutants and WT .................................. 63
Fig 11 Concentrations of starch and hexoses in immature green and red ripe fruits of S1, F1 plants of P17C12 and
WT plants ..................................................................................................................................................................... 66
Fig 12 Concentrations of starch and hexoses in immature green and red ripe fruits of S1, F1 plants of P21C7 and WT
plants ............................................................................................................................................................................ 67
Fig 13 Concentrations of starch and hexoses in immature green and red ripe fruits of S1, F1 plants of P21H6 and WT
plants ............................................................................................................................................................................ 68
Fig 14 Starch and hexose contents in development fruits of Micro-Tom WT plants ................................................... 70
Fig 15 Starch levels in mature green fruits of a population of 200 individuals of P17C12 BC1F2 and in controls ...... 72
Fig 16 Frequency analysis of SNP mutations for WT- and mutant-like bulks of the P17C12 BC1F2 culture. .............. 77
Fig 17 QTL mapping of the starch variation in the P17C12 mutant............................................................................. 79
Fig 18 Mutagenesis of RECQ4 by CRISPR/Cas9 and EMS (A, B), and starch content (C) in 18 DAP fruits of KO mutants
and WT ......................................................................................................................................................................... 98
Fig 19 Mutagenesis of MCF by CRISPR/Cas9 (A, B) and starch amount (C) in fruits at 18 DAP in the mutants and WT
.................................................................................................................................................................................... 100
Fig 20 Mutagenesis of PTA by CRISPR/Cas9 (A, B) and starch amount (C) in fruits at 18 DAP in the mutants and WT
.................................................................................................................................................................................... 102
Fig 21 CPuORF transcript levels and mutations, and starch contents of CPuORF 5’ UTR mutants via CRISPR/Cas9
mutagenesis ............................................................................................................................................................... 104
Fig 22 Rubredoxin transcript levels in different tomato organs and subcellular localisations in S. lycopersicum var.
Heinz and S. pimpinellifolium, and in leaves and fruits of WT and S2 mutants of P17C12 in S. lycopersicum var.
Micro-Tom .................................................................................................................................................................. 106

XIII
Fig 23 Mutagenesis of 3’ UTR of Rubredoxin by CRISPR/Cas9, and transcript level of Rubredoxin and starch amount
in fruits at 14 DAP and 24 DAP in the mutants and WT............................................................................................. 108
Fig 24 Phenotyping of Rub-KO mutants via measuring chlorophyll, photosynthesis abilities and starch content ... 110
Fig 25 Fruit starch content and leaf Rubredoxin transcript levels in tomato cv. Micro-Tom plants transformed with
Rubredoxin under the control of the 35S promoter ................................................................................................... 112
Fig 26 Evolutionary relationships of α-amylase and β-amylase in Arabidopsis and tomato..................................... 122
Fig 27 Mutations in T1 generation of CRISPR/Cas9 mutants for AMY3.2.................................................................. 126
Fig 28 Mutations in T1 generation of CRISPR/Cas9 mutants for BAM1.2 ................................................................. 127
Fig 29 Mutations in T1 generation of CRISPR/Cas9 mutants for BAM3.2 ................................................................. 128
Fig 30 Mutations in T1 generation of CRISPR/Cas9 mutants for BAM9 .................................................................... 129
Fig 31 Starch and hexoses contents in AMY3.2 homozygous mutants ...................................................................... 131
Fig 32 Rate of pollen germination in two BAM9 KO individual plants ....................................................................... 132
Fig 33 Starch and hexoses contents in BAM9 homozygous KO mutants ................................................................... 134
Fig 34 Summary of results we obtained by using forward and reverse genetics to study starch metabolism .......... 142

XIV
Abbreviations
3’ UTR three prime untranslated region
5’ UTR five prime untranslated region
AMY α-amylase
BAM β-amylase
CPuORF Conserved peptide upstream open reading frame
CRISPR/Cas9 Clustered Regularly Interspaced Short Palindromic
Repeats (CRISPR)/CRISPR-associated protein 9 (Cas9)
DAP days after pollination
EMS Ethyl methanesulfonate
IMG immature green
InDel insertion/deletion
KO knock-out
MCF Mitochondrial carrier protein family
MG mature green
PTA Phospholipid-transporting ATPase
qPCR quantitative polymerase chain reaction
RECQ4 RecQ helicase 4
SNP single nucleotide polymorphism
WT wild type

Introduction

Part I-Introduction
2

Part I-Introduction
3
Chapter1.1 Starch Structure, Synthesis and
Degradation
1.1.1 Starch Structure
In plant, starch can be transiently stored in organs like leaf, pollen, fruit and root, in which it turns
over within a day or during development, and can be long-stored in some seeds (e.g., rice, maize,
wheat…), tubers (e.g., potato) or roots (e.g., cassava) to provide carbon and energy for next
generation growth, which are well-known as the main components of staple food for humans and
livestock. Thus, according to the storage time, starch is generally categorized as transient and
stored. In this part, I am going to introduce starch components, structures, and related properties,
emphasize on the differences between transient and storage starch, and also highlight the
investigations of starch structure in fruit.
Starch exists as semi-crystalline, insoluble granules composed of two glucan polymers, amylose
and amylopectin. Amylose is a less abundant component in starch (10% for leaf and 20–30% for
storage organs), whose glucan chains are formed with α-1,4-bonds, and lightly branched with α-
1,6-bonds. Amylose exists largely as single helices in the amorphous regions of starch matrix but
plays no role in the organization of the matrix, as amylose-free mutants have normal starch
contents, granule sizes, and shapes (Jacobsen et al., 1989; Ceballos et al., 2007). Compared to
amylose, amylopectin, the other glucan polymer in starch, is more abundant, longer, more
branched, and responsible for starch structure.
Amylopectin structure is characterized by several levels that are the basis of the higher order of
starch structure. Thus amylopectin is composed of glucan chains linked by α-1,4-bonds, like
amylose but with different length, and also branched by α-1,6-bonds but with different frequency
and pattern than in amylose (Fig 1). According to length and degree of branching, amylopectin
chains can be categorized as 3 kinds of chains: unbranched A-chains, branched B-chains assigned
as B1-, B2-, B3-, B4-chains for chains spanning one, two, three or four clusters, respectively, and

Part I-Introduction
4
the only one C-chain containing the single reducing group, which results in a treelike structure. In
the region rich in branch points, the linear chains extend to form clusters. Within clusters, adjacent
chains form double helices, giving rise to crystalline layers (lamellae, ~6 nm). While between the
clusters, as the region containing branch points is less ordered, this results in amorphous lamellae
(~3 nm). This 9 to 10 nm periodicity makes up the semi-crystalline structure of starch which is
highly conserved in higher plants (Jenkins et al., 1993; Zeeman et al., 2002). There are 3 types (A,
B, C) of polymorph depending on the alignment of double helices in crystalline lamellae. A-type
polymorph is more dense, generally found in cereal endosperm, and B-type polymorph is less
dense thus more hydrated, often found in leaves (Fig 1), while the C-type polymorph is the mixture
of both A- and B-type, which is found in some legume species and fruits (MacNeill et al., 2017).
Fig 1 The composition and structure of starch
The structure of two compositions of starch (amylopectin and amylose) and the higher structure of
starch granules are showed in Fig 1. The figure is cited from Zeeman et al. (2010).

Part I-Introduction
5
Higher Order of Starch Structure
The final size and shape of starch granules vary greatly in different tissues and species, ranging
from small flat disks of 0.5–2 µm in diameter in Arabidopsis leaves to smooth spheres of up to
100 µm in tuberous roots (Streb and Zeeman, 2012). Unlike the starch nanometer-scale granules
found in leaves, as related to diel turnover, many starch granules found in cereal grains and in sieve
tubes show a higher order of structures and reach hundred-nanometer scales. After removing the
less crystalline regions of cracked starch granules with α-amylase or acid, scanning electron
microscopy analysis revealed a repeated layered structure similar to the growth rings of trees.
Those so-called growth rings of starch contain spherical blockets (20–500 nm) in the semi-
crystalline regions (Gallant et al., 1997) that may be formed by left-handed amylopectin super-
helix (Oostergetel and van Bruggen, 1993).
The semi-crystalline structure of starch granules makes them water insoluble and osmotically
inactive. Differences in composition, structure, and size of starch granules influence the rate of
starch remobilization in vivo but also their physical properties in vitro, such as gelatinization onset
temperature, final viscosity or stickiness, which define their final uses by humans. Thus, there are
specific interests in manipulating starch physical properties in crops, through altering the structure
of starch, based on better understanding of the relationships between structure and biosynthesis.
Starch Structure in Tomato Fruit
Luengwilai and Beckles (2009) investigated starch granules in pericarp and columella of tomato
fruit at different stages. They found that starch in tomato pericarp was mainly polygonal, ranged
from 10 to 25 µm, and the size increased through development, being largest in ripening fruit.
Amylopectin content was ranging from 70 to 83%, showed a C-type pattern. Besides, they also
compared a high-sugar tomato cultivar with a regular one, to see if carbohydrate metabolism
influences starch structure and composition. There was no difference in starch granule structure
and composition between those two cultivars, indicating that starch structure and composition are
relatively stable traits in tomato fruit. Starch characteristics were similar in the columella except
that the granules were bigger in size. In the columella, the largest modal granule size recorded

Part I-Introduction
6
was >25 µm, which is approximately the same modal size as found for large A type granules in
wheat endosperm starch at grain maturity (Jane et al., 1994).
Table 1 Components and structures of starch in different tissues and species
Species Tissues Allom-
orph
Amylose
content (%)
Size (average
diameter, μm)
Shape Refer-
ences
Maize endosperm A 23–28 ~15 Round, polygonal 1
Rice endosperm A 14–29 ~6 Polygonal 1
Wheat endosperm A 25–26 21–23 Round, lenticular 1
Potato sieve tube B 17–27 48–60 Round, oval 1
Arabidopsis leaf B ~4 1–2 Irregular discoid 2
Apple fruit C 26–2 6–10 Spherical, dome shape 3
Banana fruit B/C 16–19.5 20–60 Irregular, elongated oval 4
Kiwifruit fruit B 10–19 4–10 Spheroidal 5
Tomato fruit C 17–19 13.5–14.3 Polygonal 6
References: 1, Waterschoot et al., 2015; 2, Zeeman et al., 2002 ;3, Stevenson et al., 2006 ;4, Zhang
et al., 2005; 5, Li and Zhu, 2018; 6, Luengwilai and Beckles, 2009.
1.1.2 Starch Synthesis
In higher plant, starch is synthesized in the plastids — chloroplasts in leaves and some fruits, or
amyloplasts in the starch-storing tissues, like endosperm, tuber and root. Enzymes involved in
starch synthesis and degradation have been identified through studies of crops and model species
like Arabidopsis. These enzymes are well conserved between different plant species, giving us
useful references for understanding starch synthesis in fruits. However, as mentioned above, starch
displays a well-constructed structure, with big variations in shape, size and granule-number found
between tissues and species. This is reflected by the duplication and specialization of starch
enzymes, which may display distinct or partially overlapping functions. Starch degradation is also
more diverse than starch synthesis, with relatively more steps from starch to the final products
maltose and glucose, and thus more enzymes involved, which are also fine-tuned at different levels
(regulations will be discussed in Chapter 1.2). I focus more on results obtained in Arabidopsis, as
starch metabolism has been intensively studied in this species (Smith and Zeeman, 2020). I
therefore assume that because leaf- and fruit-starch are both transiently stored, and because fruit

Part I-Introduction
7
structures accumulating starch were originally leaf tissues, these two forms have more in common
than with that found in the endosperm. Besides, the main differences between leaf and endosperm
starch will be discussed briefly to indicate how different it could be for starch degradation in
different tissues.
In brief, starch synthesis involves 3 main steps, (1) elongation, (2) branching and (3) debranching
of glucan chains. The elongation is catalyzed by starch synthase (SSs) enzymes that use ADP-
glucose as substrate and add its glucosyl moiety to existing glucose chains with α-1,4-linkage. The
enzymes responsible for glucan chain branching are called starch branching enzymes (SBEs); they
transfer the terminal part of a chain onto the side of an adjacent chain with α-1,6-linkage. The
wrong placed glucosyl chains are removed by starch debranching enzymes (DBEs) via
hydrolyzing α-1,6 linkages to allow the rise of a structure. SSs, SBEs and DBEs have multiple
isoforms playing distinct roles during the synthesis, which are important for the periodic branching
pattern of amylopectin and hence the structure of the granule matrix.
Precursors of Starch Synthesis
The substrate of starch synthesis is ADP-glucose, whose precursors may differ depending on the
tissue. Thus, in photosynthetically active leaf chloroplasts, ADP-glucose generation is directly
linked to the Calvin–Benson cycle through conversion of fructose-6-phosphate into glucose-6-
phosphate (Glc-6-P), a step catalyzed by phosphoglucose isomerase (PGI), then to glucose-1-
phosphate (Glc-1-P), a step catalyzed by phosphoglucomutase (PGM) (Fig 2). Glc-1-P and ATP
are then converted into ADP-glucose and pyrophosphate (PPi) by ADP-glucose
pyrophosphorylase (AGPase). Through those conversions, approximately 30%–50% of
photoassimilates of Arabidopsis leaves are partitioned into starch (Stitt and Zeeman, 2012). In
heterotrophic tissues, sucrose is transported from source tissues and catalyzed to produce hexose-
phosphates in the cytosol. Both glucose-phosphates (typically Glc-6-P, although Glc-1-P transport
has also been reported) and ATP are transported into the plastid to serve as substrates for the
synthesis of ADP-glucose (reviewed by Geigenberger, 2011). In the cereal endosperm, the
pathway differs, as most of AGPase activity (typically 80% or more) is found in the cytosol and
ADP-glucose is imported directly into the plastid via a cereal-specific adenine nucleotide
transporter BRITTLE1 (Bt1) (James et al., 2003).

Part I-Introduction
8
Fig 2 Schematic representation of the pathway of starch biosynthesis in (A) photosynthetic
leaves and (B) heterotrophic tissues.
The abbreviations are listed as below. (1) Metabolites: G1P, Glucose-1-Phosphate; G6P, Glucose-
6-Phosphate; ADPglc, ADP-glucose. (2) Enzymes: PGI, phosphoglucoisomerase; PGM,
phosphoglucomutase; AGPase, ADP-Glc pyrophosphorylase; SS, starch synthase; SBE, starch
branching enzyme; DBE, starch-debranching enzyme; PPase, inorganic pyrophosphatase; SuSy,
sucrose synthase; FK, fructokinase; UGPase, UDP-Glc pyrophosphorylase. The circles in blue, orange and green represent the ADP-Glc/ADP translocator, the Glc-6-P/Pi translocator, and the
ATP/ADP translocator, respectively. The steps in blue are specific for cereal endosperm. This is
adapted from Geigenberger (2011).
A Leaves
z
Calvin cycleTriose-P
G6P
G1P
ADPglc
ADPStarch
PPi 2Pi
ATP
Chloroplast
Hexose-P
Sucrose
Triose-P
Pi
PGI
PGM
AGPase
SSs, SBEs, DBEs
PPase
Cytosol
CO2
B Heterotrophic Tissues
Cytosol Plastid
F6P G6P
NTP
NDP
Fructose
Sucrose
UDP
UDPglc
G1P
PPi
ATP
ADPglc
ADP
Starch
ADPglc
G1P
G6P
ATP
PPi 2Pi
Pi
ADP
ATPRespiration(Mitochondria)
UTP
ADP
SuSy
FK
PGIPGM
SSs, SBEs, DBEs
AGPase
PGM
AGPase
PPase
UGPase

Table 2 Genes encoding proteins involved in starch synthesis in Arabidopsis and tomato
Protein abbreviation
(alternative name)
Locus in
Arabidopsis
Locus in
tomato
Reaction catalysed / Role attributed
Phosphoglucose isomerase (PGI) Fru6P <=> Glc6P (reversible)
PGI (PGI1) At4g24620 Solyc04g076090 catalytic, plastidial, mutant has low starch phenotype
Phosphoglucomutase (PGM) Glc6P <=> Glc1P (reversible)
PGM1 (PGM) At5g51820 Solyc03g006870 catalytic, plastidial, mutant has low starch phenotype
ADP-glucose pyrophosphorylase
(AGPase)
Tetrameric enzyme composed of two small and two large
subunits.
Glc1P + ATP <=> ADPGlc + PPi (reversible reaction)
AGPase small subunit 1
(APS1, ADG1)
At5g48300 Solyc12g011120/
Solyc07g056140
major catalytic subunit, plastidial, mutant has low starch phenotype
AGPase small subunit-like 2 (APS2) At1g05610 Solyc08g015670 likely non-functional, plastidial
AGPase large subunit 1
(APL1, ADG2)
At5g19220 Solyc01g079790 major regulatory subunit in leaf, catalytic, plastidial, mutant has low
starch phenotype
AGPase large subunit 2
(APL2)
At1g27680 Solyc07g019440 minor regulatory subunit in leaf, catalytic, plastidial
AGPase large subunit 3
(APL3)
At4g39210 Solyc01g109790 regulatory subunit in root, plastidial
AGPase large subunit 4
(APL4)
At2g21590 regulatory subunit in root, plastidial
Starch synthase (SS)
Elongates α-1,4-linked glucose chains at the non-reducing end.
(1,4-α-D-Glc)(n) + ADPGlc => (1,4-α-D-Glc)(n+1) + ADP
Granule-bound starch synthase 1
(GBSS)
At1g32900 Solyc08g083320 catalytic, plastidial, amylose synthesis, mutant has no amylose
Soluble starch synthase 1
(SS1, SSI)
At5g24300 Solyc03g083090 catalytic, plastidial, amylopectin synthesis, preferentially elongates
chains with 9-10 glucose units
Soluble starch synthase 2
(SS2, SSII)
At3g01180 Solyc02g088000 catalytic, plastidial, amylopectin synthesis, preferentially elongates
chains with 13-22 glucose units

Part I-Introduction
Soluble starch synthase 3
(SS3, SSIII)
At1g11720 Solyc02g080570 catalytic, plastidial, amylopectin synthesis, preferentially elongates
chains with >25 glucose units
Soluble starch synthase 4
(SS4, SSIV)
At4g18240 Solyc02g071040/
Solyc07g042830
catalytic, plastidial, amylopectin synthesis, role in starch granule
initiation
Glucanotransferase
1,4-α-glucan branching enzyme
(BE)
Cuts α-1,4-linked glucose chains and transfers the reducing end
to another chain creating a α-1,6-linkage (branch point).
Starch branching enzyme 1
(BE1)
At3g20440 Solyc07g064830/
Solyc04g082400
putative glycoside hydrolase unlikely to be involved in amylopectin
synthesis
Starch branching enzyme 2
(BE2)
At5g03650 Solyc09g009190 catalytic, plastidial, amylopectin synthesis
Starch branching enzyme 3
(BE3)
At2g36390 catalytic, plastidial, amylopectin synthesis
α-1,6-glucosidase Starch debranching enzyme
(DBE)
Hydrolyze α-1,6-linkage (branch point) and release the resulting
chain into the stroma.
Isoamylase 1 (ISA1) At2g39930 Solyc07g014590 catalytic, plastidial, amylopectin synthesis, forms complex with ISA2,
mutant has altered starch
Isoamylase 2 (ISA2, DBE1) At1g03310 Solyc09g064800 non-catalytic, plastidial, amylopectin synthesis, forms complex with
ISA1, mutant has altered starch
Adapted from Streb and Zeeman, 2012; Moustakas, 2013.

Part I-Introduction
11
AGPase, which plays an important role in carbon partitioning and starch synthesis (details see
Chapter 1.2.2), consists of two large regulatory subunits and two small catalytic subunits. Those 4
subunits synergistically interact with each other to form a heterotetramer that responds to different
posttranslational regulations. In Arabidopsis, there are two genes coding small subunits and four
genes coding large regulatory subunits (Table 2), which also showed different spatial patterns of
expression, potentially giving rise to AGPase with distinct properties in different tissues of the
plant.
Enzymes Involved in Starch Synthesis (SSs, SBEs and DBEs)
There are five SS classes involved in starch biosynthesis: four that are soluble in the stroma (or
partially bound to the granule) are responsible for amylopectin synthesis, and one that is almost
exclusively granule-bound (so called granule-bound SS, GBSS) is responsible for amylose
synthesis. According to a series of SSs mutants, SS1 preferentially elongates short chains of
amylopectin (6 or 7 glucose residues), which are further elongated by SS2 to 13–20 glucose
residues — sufficient to form double helices with neighboring chains. SS3 is proposed to elongate
chains to generate longer, cluster-spanning chains. While SS4 has little roles in chain elongation
but more in the initiation of starch granules (Smith and Zeeman, 2020). However, their functions
are partially overlapping, and interfering via complex formation between enzymes.
SBEs create branches from existing chains via glucanotransferase reactions. Most plants have two
distinct classes of SBE isoforms, SBE1 and SBE2, which differ considerably in their substrate
preferences and products. For example, SBE1 has high activity on long linear chains and can
cleave α-1,4 linkages behind existing branch points, whereas SBE2 isoforms preferentially act on
outer chains of branched structures (Smith and Zeeman, 2020).
Debranching enzymes can be classified as isoamylase type (ISA1, ISA2, and ISA3) and limit
dextrinase type (LDA, also called pullulanase). All are specific for the hydrolysis of α-1,6 linkage
but differ in their substrate preferences (Kobayashi et al., 2016). ISA1, ISA3, and LDAs are active
hydrolases, while ISA2 lacks conservative substitutions essential for catalysis, appearing to be
inactive (Pfister and Zeeman, 2016). However, ISA2 is required to form heteromultimers with
ISA1 to improve the enzyme activity or stabilize the enzyme complex. In plants, ISA1 deficiency

Part I-Introduction
12
leads to accumulate more branched glucans, which fails to form a crystalline granular and remains
soluble as phytoglycogen. It suggests that misplaced or excessive branches may impede the
formation and packing of double helices, and hence impede the formation of the semicrystalline
matrix. Therefore, selective debranching (trimming) by isoamylase is essential for starch structure.
LDA and ISA3 are believed to be primarily involved in starch degradation, but may also contribute
to debranching during synthesis (Streb et al., 2008; Fujita et al., 2009; Kubo et al., 2010).
1.1.3 Starch Degradation
For starch degradation in leaves, the breaking of glucan polymers is mainly catalyzed by two types
of hydrolytic enzymes, i.e. exoamylase (β-amylase) that cleaves α-1,4 linkages, and the
debranching enzyme isoamylase that cleaves α-1,6 linkages. Moreover, as starch is compacted into
semi-crystalline structures, it is essential to decreases the degree of crystallinity to facilitate and
speed up degradation allowing a quick turnover. Phosphorylation at the granule surface, probably
by interfering with the packing of double helices, facilitates the opening of the granule surface,
thus making starch more accessible for hydrolytic enzymes. However, for full degradation of
starch, removing the inhibitory phosphates (dephosphorylation) is also required to allow β-amylase
to access (Fulton et al., 2008). The main processes of starch degradation in chloroplast are showed
in Fig 3, and the involved genes in Arabidopsis and tomato are listed in Table 3.
Hydrolysis of Glucan
Higher-plant genomes have large numbers of β-amylase like proteins (BAM). Analysis of the
genomic data from different species revealed that BAM gene family has increased in size and
diversified in structure during evolution (Monroe and Storm, 2018). They have catalytic and non-
catalytic members located in several subcellular compartments. The coding genes show different
transcriptional regulations between species and tissues, combined with various post-transcriptional
regulations, which contributed to high function diversity, and thus need to be further investigated.
For example, among the nine β-amylase genes (BAM1–9) present in the Arabidopsis genome,
none is more than 60% identical regarding the amino acid sequence. Six of these BAM (BAMs 1–
4, 6 and 9) are chloroplastic, two (BAM7 and 8) are located in the nucleus, and one (BAM5) in
the cytosol (Monroe and Storm, 2018).

Part I-Introduction
13
Fig 3 The pathway of starch degradation in chloroplast
The size of arrows indicates the estimated flux, and the minor steps in Arabidopsis are represented
in dash arrows. The figure is cited from Zeeman et al.(2010).
In leaves, two catalytic BAMs (1 and 3) located in the chloroplast play important roles in starch
degradation. BAM1 and BAM3 are believed to be partially redundant: bam1 and bam3 mutants
have a wildtype and a mild starch excess phenotype (also named “sex”) in leaves, respectively, but
the bam1/bam3 double mutant has a strong starch excess phenotype. Further investigation revealed
that they play distinct roles in starch degradation: BAM3 plays a dominant role in nocturnal starch
degradation in leaf mesophyll cells (Lao et al., 1999; Fulton et al., 2008), whereas BAM1 plays a
major role in guard cells. Mutants lacking BAM1 fail to degrade starch in guard cell, which impacts

Part I-Introduction
14
the production of osmotically active metabolites and thus affects stomatal opening (Horrer et al.,
2016).
Debranching enzymes, which include 4 members, i.e. ISA1, ISA2, ISA3 and LDA, cleave α-1,6
bonds of glucans to produce linear malto-oligosaccharides,. Among them the functions of ISA3
and LDA, which are both required for starch granule degradation, partially overlapped. Loss of
LDA alone has no effect on starch metabolism in Arabidopsis leaves, whereas loss of ISA3 results
in a sex phenotype (Wattebled et al., 2005; Delatte et al., 2006). However, the isa3/lda double
mutant has a more severe sex phenotype than the isa3 mutant (Delatte et al., 2006).
Phosphorylation and Dephosphorylation of the Starch Granule
Although the hydrolytic enzymes mentioned above that break the α-1,4 linkages and α-1,6 linkages
are major actors of starch degradation, the rate of hydrolysis depends on the crystalline degree of
the granule surface. To reduce the crystalline degree and make it more accessible for hydrolytic
enzymes, it is essential to phosphorylate the glucose residues with the help of two enzymes, glucan
water dikinase [GWD, also called STARCH EXCESS1 (SEX1)] and phosphoglucan water
dikinase (PWD). GWD adds the β-phosphate of ATP to the 6th position of the glucose residues,
releasing AMP and inorganic phosphate, while the action of PWD requires the prior action of
GWD, and prefers the 3rd position (Ritte et al., 2006). The single or double mutants of those two
enzymes show that they have relatively different importance in leaf starch degradation. The gwd
mutant has a very severe sex phenotype (Yu et al., 2001), with the loss of 6-phosphorylation
preventing the action of PWD so that starch is almost unphosphorylated (Ritte et al., 2006; Hejazi
et al., 2009), while the pwd phenotype is mild.
Dephosphorylation of the phosphorylated glucose residues is also necessary to allow the
progressive degradation of linear chains by β-amylase. There are three glucan phosphatase family
members, SEX4 (Laforin-Like Phosphoglucan Phosphatase), LSF1 (LIKE SEX FOUR 1) and
LSF2 (LIKE SEX FOUR 2) that were reported to be related to starch degradation, but only SEX4
and LSF2 are involved in amylopectin dephosphorylation. SEX4 can remove both 6- and 3-
phosphates from glucose residues, and LSF2 removes only 3-phosphates. Loss of SEX4 blocks β-
amylolysis, therefore sex4 mutant has elevated starch levels and accumulates linear

Part I-Introduction
15
phosphorylated glucans in the chloroplast stroma (Santelia et al., 2011). Loss of LSF2 increases
the amount of 3-phosphorylation in starch but has little effect on starch levels. However, in the
double sex4/lsf2 mutant, levels of starch and starch-bound phosphate are higher than in sex4
(Wilkens et al., 2016). Though LSF1 is closely related to SEX4 and LSF2, lsf1 does not accumulate
soluble phosphorylated glucans, and recombinant LSF1 has no detectable phosphatase activity
(Schreier et al., 2019). However, its loss elevates starch levels, and lsf1/sex4 mutant has higher
starch levels than either single mutant, indicating that LFS1 plays a different role in normal starch
degradation. Recent research suggests that LSF1 interacts with the β-amylases BAM1 and BAM3,
and the BAM1-LSF1 complex shows amylolytic but not glucan phosphatase activity. It may
facilitate the β-amylolytic attack on the granule surface during starch degradation (Schreier et al.,
2019).
Other Enzymes or Proteins Involved in Starch Degradation
Recently, another protein named ESV1 (early starvation1) was found in a screen for Arabidopsis
mutant in which starch reserves are prematurely exhausted (Feike et al., 2016). Loss of ESV1
accelerates starch degradation and the reserves are exhausted before dawn. ESV1 protein is
conserved throughout starch-synthesizing organisms. It contains a series of near-repeated motifs
rich in tryptophan, but has no known catalytic activity. It is proposed that ESV1 functions in the
organization of the starch granule matrix, and affects starch degradation indirectly, by altering the
matrix organization and, thus, the accessibility of starch polymers to starch-degrading enzymes.
Recent in vitro studies indicate that ESV1 can modulate the actions of GWD and PWD on starch-
like surfaces (Malinova et al., 2018).
Plastidial α-amylase may participate in starch degradation when the normal degradation is impeded
by losing other necessary enzymes. In Arabidopsis, amy3 mutants do not result in sex phenotypes
under normal laboratory conditions (Tatge et al., 1999; Streb et al., 2008). However, AMY3
participates in starch degradation when other starch-degrading enzymes are missing. Soluble
branched glucans are accumulated in isa3/lda mutant, while loss of AMY3 in isa3/lda mutant (thus
isa3/lda/amy3 mutant) prevents the accumulation of soluble branched glucans, confirming that in
isa3/ida mutant they arise from amylolysis by AMY3 (Tatge et al., 1999; Streb et al., 2008).

Table 3 Genes encoding proteins involved in starch breakdown in Arabidopsis and tomato
Protein abbreviation
(alternative name)
Locus in
Arabidopsis
Locus in tomato Reaction catalysed / Role attributed
α-glucan water dikinase
(GWD)
Phosphorylates glucosyl residues within amylopectin.
1,4-α-D-Glc + H2O + ATP => phospho- 1,4-α-D-Glc +AMP + Pi
Glucan, water dikinase 1
(GWD1, SEX1)
At1g10760 Solyc05g005020 catalytic, plastidial, phosphorylates at C-6 position, mutant has starch-excess
phenotype
Glucan, water dikinase 2
(GWD2)
At4g24450 Solyc09g098040 catalytic, cytosolic, phosphorylates at C-6 position
Phosphoglucan, water
dikinase (PWD, GWD3)
At5g26570
catalytic, plastidial, phosphorylates at C-3 position, dependent on prior C-6
phosphorylation, mutant has starch-excess phenotype
Phosphoglucan
phosphatase
Dephosphorylates glucosyl residues within amylopectin.
Starch excess 4
(SEX4)
At3g52180 Solyc11g007830/
Solyc03g111160
catalytic, plastidial, releases phosphate bound at C-6 and C-3 positions of glucosyl
residues, mutant has starch-excess phenotype
Like Sex Four 2
(LSF2)
At3g10940 Solyc06g050230 catalytic, plastidial, preferentially releases phosphate bound at C-3 position of
glucosyl residues
Like Sex Four 1
(LSF1)
At3g01510
non-catalytic (?), plastidial, mutant has starch-excess phenotype
Exo-amylase
β-amylase (BAM)
Acts on linear α-1,4-linked glucose chains, liberating β-maltose from the non-
reducing end.
Cannot act on α-1,6-linkages, nor pass them. Cannot pass phosphorylated
glucosyl residues.
BAM1 (BMY7 / TR-
BMY)
At3g23920 Solyc09g091030/
Solyc08g082810
catalytic, plastidial
BAM2 (BMY9) At4g00490
catalytic, plastidial
BAM3 (BMY8 / ctBMY) At4g17090 Solyc08g007130/
Solyc08g077530
catalytic, plastidial, mutant has starch excess phenotype

Part I-Introduction
BAM4 At5g55700
non-catalytic, plastidial, regulatory protein, mutant has starch-excess phenotype
BAM5 (BMY1 / RAM1) At4g15210 Solyc07g052690 catalytic, cytosolic
BAM6 At2g32290
BAM7 At2g45880 Solyc01g094580 non-catalytic, nuclear transcription factor
BAM8 At5g45300 Solyc08g005780 non-catalytic, nuclear transcription factor
BAM9 (BMY3) At5g18670 Solyc01g067660
Endo-amylase
α-amylase (AMY)
Acts on α-1,4-linkages releasing linear α-1,4-linked oligosaccharides and
branched α-1,4- and α-1,6-linked oligosaccharides (acting between branch
points); cannot act on α-1,6-linkages themselves.
AMY1 At4g25000 Solyc03g095710/
Solyc04g078930
catalytic, secreted
AMY2 At1g76130 Solyc04g082090 extracellular
AMY3 At1g69830 Solyc05g007070/
Solyc02g066950
catalytic, plastidial
α-1,6-glucosidase
Starch debranching enzyme (DBE) Acts on α-1,6-linkages (branch points)
releasing oligosaccharides into the stroma.
Isoamylase 3
(ISA3)
At4g09020 Solyc06g009220 catalytic, plastidial, amylopectin degradation, prefers short chains, mutant has
starch-excess phenotype
Limit dextrinase
(LDA, PU1)
At5g04360
catalytic, plastidial, amylopectin degradation, prefers short chains
α-glucan phosphorylase
(PHS)
Acts on the non-reducing end of α-1,4-linked glucose.
(1,4-α-D-Glc)(n) + Pi <=> (1,4-α-D-Glc)(n) + Glc1P (reversible)
PHS1 At3g29320 Solyc03g065340/
Solyc05g012510
catalytic, plastidial
PHS2 At3g46970 Solyc09g031970/
Solyc02g077680
catalytic, cytosolic
4-α-glucanotransferase
Disproportionating
enzyme (DPE)
Transfers glucose/α-1,4-linked glucan moiety from a donor glucan to an
acceptor, releasing the non-reducing end glucose/glucan moiety (reversible)

Part I-Introduction
DPE1 At5g64860 Solyc04g053120 catalytic, plastidial, donor: maltotriose or longer, acceptor: glucoseoligomers
except maltose, mutant has starch-excess phenotype
DPE2 At2g40840 Solyc02g020980 catalytic, cytosolic, donor: β-maltose, acceptor: mixed-sugar polymers
(e.g. heteroglycan), mutant has starch excess-phenotype
Adapted from Streb and Zeeman, 2012; Moustakas, 2013.

Part I-Introduction
19
Products and Connection with Cytosol Carbohydrate Metabolism
The products of starch degradation in chloroplast include maltose (the majority), glucose and Glc-
1-P. Maltose results from the hydrolysis of β-amylase through the actions directly on starch granule
surface or on linear malto-oligosaccharides derived from the catalysis by DBEs or α-amylase.
Glucose is released by DPE1 (disproportionating enzyme, α-1,4-D-glucanotransferase), which
converts 2 maltotrioses to maltopentaose (five glucoses) and one glucose. Some maltotrioses (with
3 glucose residues) are produced through the β-amylase-catalyzed hydrolysis of linear malto-
oligosaccharides, and cannot be further hydrolyzed by β-amylase as it cannot remove a maltose
unit from the reducing ends. Thus, further mobilization of maltotriose needs the catalysis of DPE1
in the chloroplast (as mentioned before). Besides, DPE1 can also transfer maltosyl residues from
maltodextrin in different lengths to malto-oligosaccharides without releasing a free glucose.
Mutants lacking DPE1 accumulate malto-oligosaccharides at night and have slightly elevated
starch contents (Critchley et al., 2001).
In Arabidopsis chloroplasts, Glc-1-P can be also generated in small proportion by plastidial α-
glucan phosphorylase (PHS1) from linear malto-oligosaccharides. Also in Arabidopsis, phs1
mutants do not result in sex phenotypes under normal laboratory conditions, but loss of PHS1 in
ss4, mex1, and dpe2 mutants reduces granule number and alters granule morphology (Malinova et
al., 2014, 2017; Malinova and Fettke, 2017).
Exported maltose is metabolized by a cytosolic glucosyl transferase, DPE2, which releases one
glucose and transfers the other to an acceptor polysaccharide. The loss of DPE2 blocks the
conversion from maltose to sucrose, and the higher amount of maltose feeds back on starch
degradation in chloroplasts. As a result, dpe2 mutants have higher maltose, higher starch, and
higher maltodextrin but lower nighttime sucrose than wild-type plants (Chia et al., 2004; Lu and
Sharkey, 2004). The polysaccharide acceptor in vivo is believed to be heteroglycan, a
heterogeneous cytosolic glycan composed of several different, variously linked sugars (Fettke et
al., 2004). Then, heteroglycan can be metabolized by a cytosolic phosphorylase, PHS2, to generate
Glc-1-P, which is thereafter used for cytosolic sucrose synthesis, glycolysis or oxidative pentose
phosphate pathway after conversion into Glc-6-P by PGM.

Part I-Introduction
20
Starch Degradation in Other Plant Species or Tissues
The relative importance of enzymes or proteins involved in leaf starch degradation may differ
between species. The mutants lacking α-amylase, LDA or glucan water dikinase (GWD) are good
examples for illustrating those differences. Unlike in Arabidopsis leaves, α-amylase plays a
significant role in starch degradation in rice leaves. When knocked down, a significant increase of
starch accumulation in the young leaf tissues was observed under sugar-supplemented growth
conditions. In contrast, the starch content of leaves was reduced in the plants overexpressing α-
amylase I-1 (Asatsuma et al., 2005). Maize mutants lacking LDA alone (Zmpu1 mutants) are
impaired in transient and storage starch degradation, suggesting that LDA contributes to starch
catabolism in maize (Dinges et al., 2003).
Although GWD was suggested to have universal importance in leaf starch degradation in higher
plants, the physiological priority of leaf starch in photoassimilate allocation may vary among plant
species, thus leading to variously relative importance of enzymes involved in starch degradation
in leaves. Thus, a rice mutant accumulating high levels of starch in the leaf blades has been
identified as GWD1 mutant. Surprisingly, through it exhibited more than 10-fold higher starch
than the wild-type plants throughout the day, the OsGWD1 mutant showed no significant change
in vegetative growth, presenting a clear contrast to the reported mutants of Arabidopsis thaliana,
in which disruption of the genes for GWD leads to marked inhibition of vegetative growth (Hirose
et al., 2013).
Unlike starch turnover in leaves, in cereal endosperm there is no evidence that transient glucan
phosphorylation occurs during germination. Alpha-amylase plays a central role in starch
degradation of during seed germination, but not β-amylase. Maltose and short malto-
oligosaccharides produced in the endosperm are degraded to glucose by α-glucosidase (maltase)
whereas there is no evidence for a role for α-glucosidase in leaf maltose metabolism (Smith and
Zeeman, 2020).

Part I-Introduction
21
Starch Degradation in Fruit
Because fruit starch and sugar metabolism are involved in fruit quality and also in sink/source
relationships, they attracted the interest of scientists since decades. The understanding of the
translocation and metabolism of sugars in fruits progressed dramatically in the last few years, the
primary and secondary metabolomes were well characterized, but the mechanism of starch
breakdown in fleshy fruit remains elusive. Strikingly, although in starchy fruit species such as
banana and kiwifruit, starch plays a major role in fruit growth and postharvest quality, it has been
little investigated in these species. Indeed, in these perennial plants, genetic manipulations are
difficult, as is the use of large mutant collections to study different roles of enzymes or proteins in
vivo. With such limitations, solid in vivo evidence is difficult to obtain and as a consequence, the
knowledge on starch breakdown in fruits grows slowly. Researchers mostly build hypotheses
based on research conducted on Arabidopsis leaves or potato tubers, as well as correlations
between enzyme activities, starch content and transcript levels obtained for different genotypes
and/or postharvest treatments.
In kiwifruit, a comprehensive analysis of the sucrose to starch metabolic pathway during kiwifruit
development combining data on primary metabolites, transcripts, and enzymes revealed that
AMY3 and BAM9 transcripts increased significantly along with starch degradation, and may play
important roles in starch degradation (Nardozza et al., 2013). Unexpectedly, BAM1 transcripts, a
plastidial β-amylase critical in leaf starch degradation (Streb and Zeeman, 2012), did not increase
along with AMY3/BAM9. Moreover, BAM3 whose transcripts exhibit a significant increase at the
late mature stage and a strongly up-regulated level in ripening kiwifruit, could be a candidate for
starch degradation in ripening kiwifruit. Similar results were found in kiwifruit under ethylene
treatment in postharvest ripening (Hu et al., 2016). BAM9 and BAM3.1 were up-regulated while
the starch degradation rate was increased in response to ethylene treatment. Besides, AMY1 and
α-glucosidase (AGL) also showed increased transcript levels. However, those results are only
based on correlations, and the corresponding protein levels or possible regulation targets (BAM9
is a non-catalytic protein) still need to be studied.
There are more reports on banana starch degradation, as recently reviewed by Cordenunsi-Lysenko
et al. (2019). In general, starch degradation during banana ripening appears to be similar to the

Part I-Introduction
22
process in Arabidopsis leaves — it involves few similar enzymes, but there are also noticeable
differences. Firstly, in ripening banana the breakdown of starch granules in amyloplasts is assumed
to also involve AMY acting mainly in amylose-rich regions (amorphous lamella) (Peroni-Okita et
al., 2010). Secondly, large amounts of BAM transcript levels are clearly correlated to a decrease
in starch during fruit ripening (do Nascimento et al., 2006). Ten different MaBAM transcripts were
observed at various stages of development and ripening in two banana cultivars, and among them,
MaBAM9a, MaBAM9b, and MaBAM3c showed high levels of expression following the
climacteric crisis in both cultivars, indicating a more clear relationship between gene expression
and starch degradation. Besides, a recent extensive study (Xiao et al., 2018) has found further
genes potentially associated with starch metabolism in bananas including three GWDs, three
phosphoglucan phosphatases, eight BAMs, seven AMYs, two DBEs, two α-glucan phosphorylases,
two DPEs, two MEXs (maltose excess transporter, MaMEX1 and MaMEX2), and five pGlcTs
(the plastidic glucose translocator).
Tomato, the model plant for fleshy fruit species, also accumulates considerable amounts of starch
(up to around 20% of the dry weight) in immature fruits over a long period, until the beginning of
ripening at which an almost complete breakdown starts. Surprisingly, there are only few studies
dealing with mechanisms of starch degradation in tomato fruit. One attempt was to characterize a
GWD gene in a heterozygous mutant. The loss of GWD (even one copy) caused male
gametophytic lethality; the mutant pollen had a starch-excess phenotype that was associated with
a reduction in pollen germination (Nashilevitz et al., 2009). Further studies conducted in tomato
that involved proteomics or transcriptomics, revealed that during fruit ripening, BAM9 protein
increases in abundance during the differentiation of chromoplasts (Barsan et al., 2012).

Part I-Introduction
23
Chapter1.2 Regulation of Transient Starch
1.2.1 Starch Turnover in Leaves and Fruits
In storage organs, starch synthesis and degradation are temporarily separated, usually occurring at
different developmental phases, and the associated enzymes may not be present during the same
developmental stage. In contrast, starch is only transiently stored as a reserve of carbon and energy
in leaves and fruits, its fate being determined within a day in leaves, or during growth in fruits.
Thus, accumulation and remobilization of starch probably involve different regulation
mechanisms depending on species, organs, tissues or even cell types.
Starch Turnover in Leaves
In Arabidopsis
In Arabidopsis grown under artificial controlled growth conditions and in short photoperiods (12h
or less), leaf starch accumulation is linear during the day, as well as its remobilization at night. In
such conditions, the rate of starch accumulation is adjusted to the light period or to the decreased
light intensity, and seem to only result from its synthesis, as no simultaneous degradation was
detected (Zeeman et al., 2002). However, regardless that the rate of accumulation changed during
the day, the diurnal starch turnover is tightly controlled to prevent the starvation before dawn (Graf
et al., 2010; Scialdone et al., 2013; Sulpice et al., 2014; Vasseur et al., 2011).
However, those well-buildup turnover models were re-examined under longer days or natural
light-dark transitions (with substantial decreased light mimicking twilight). Arabidopsis plants
grown in photoperiods as long as 16–18 h displayed a plateauing of starch content toward the end
of the light period (Hädrich et al., 2012; Mugford et al., 2014; Figueroa and Lunn, 2016), which
was associated with simultaneous synthesis and degradation. Thus, contrary to what has been
observed in short photoperiods, starch degradation is activated in the light in long photoperiods,
suggesting that there is a mechanism to prevent excessive starch accumulation, in order to favor
the export of sucrose to the sink organs or tissues. There is also a lot of evidence indicating that
Part I-Introduction
24
the adjustment of the onset and rate of starch degradation to the length of the night involve the
circadian clock (Lu et al., 2005; Graf et al., 2010), which will be discussed in the next section.
In Other Species
In leaves of many grasses like wheat, barley, maize, rice, etc., besides the accumulation of starch
during the day, there is substantial accumulation of sucrose (Gordon et al., 1980; Balaguer et al.,
1995), which differs from Arabidopsis leaves grown under short photoperiods, as the latter do not
accumulate sucrose. Because of this difference in photoassimilate partitioning between starch and
sucrose, those plants display different phenotypes when starch synthesis or degradation are
impacted. In rice, in which the sucrose to starch ratio is much higher in leaves than in Arabidopsis,
loss-of-function of a large subunit of AGPase (OsAGPL3, Os05g0580000) leads to a defect in
starch biosynthesis in the leaf but does not affect vegetative growth or grain yield under 12-h-
light/12-h-dark controlled conditions (Rösti et al., 2007). This suggests that under such conditions
rice does not rely on leaf starch as a carbon source during the night. In maize, neither the loss-of-
function of the small subunit of AGPase nor RNAi-mediated suppression of a GWD gene affect
plant growth in 12-h-light/12-h-dark or natural light conditions, or leads to respectively a decrease
or an increase in leaf starch levels (Slewinski et al., 2008; Weise et al., 2012). Based on these
results, it appears that grasses accumulating sucrose during the day do not rely as heavily as
Arabidopsis on leaf starch as a carbon source during the night.
In tomato leaves, Bénard et al. (2015) found that starch turnover shows several differences
compared to Arabidopsis leaves. Firstly, regarding the diurnal pattern of starch in mature leaves
of plants bearing fruits and grown under optimal growth conditions, it was shown that starch as
well as sucrose and hexoses peak towards the middle of the day and begin decreasing several hours
before dusk. Secondly, we have seen previously that in Arabidopsis carbon partitioning into starch
is adjusted to decreased light intensity by increasing the proportion of carbon fixed by
photosynthesis into diurnal starch accumulation. In contrast tomato mature leaves submitted to
shading did not increase carbon storage during the day to respond to the decreased cumulated net
photosynthesis, and the starch diurnal pattern was no longer detected (Bénard et al., 2015).

Part I-Introduction
25
Starch Accumulation in Fruits
Strikingly, although daily fluctuations in starch and central metabolites have been intensively
studied in leaves, only a few studies investigated fruit diel changes. Thus, growing tomato fruits
were found to show diel patterns for numerous metabolites as well as starch, with a relatively small
but clear fluctuation, peaking in the early morning and decreasing along the day. In those fruits,
the starch diel pattern was barely related to fruit photosynthesis or photorespiration but appeared
rather associated with the momentary supply of sucrose from source leaves (Bénard et al., 2015).
Many fleshy fruits show a significant accumulation of starch during growth followed by a quick
remobilization at ripening. Thus, starch net accumulation rates were compared between 12 fleshy
fruit species thanks to a normalization of time (Roch et al., 2020) (Fig 4). Remarkably different
patterns were found between climacteric and non-climacteric fruits, the former accumulating
starch at higher rates during fruit growth. However, according to the maximum accumulation rate
and to the timing of its peak, the fruit species can be clustered into 3 groups. For the first group,
which includes clementine, cucumber, and grapevine, there is little starch accumulating during
fruit growth. In fruits of the second group, starch accumulates mostly at early developmental stages
(before fertilization), but then stays at a very low level; this group comprises eggplant, pepper and
strawberry. The third group includes well-known starchy fruits that are also climacteric fruits, like
apple, kiwifruit, mango, peach, pear and tomato. Obviously, banana also belongs to this third group
of fruits, though the accumulation rate curve is missing in Fig 4. For fruits in group three, starch
accumulation rates reach the maximum before ripening, but the peaking time varies largely, from
early (e.g., tomato or peach) to late (mango) developmental stages.
Among the fruits in group three, when considering the amount of accumulated starch but also the
net accumulation and/or degradation rates, there are also noticeable differences. Thus, in tomato,
at its peak starch contributes to around 20% of the dry weight in non-mature fruits (Schaffer and
Petreikov, 1997), while in apple, kiwifruit and banana it represents 40 to 70% of the dry weight
during fruit growth (Zhang et al., 2005; Nardozza et al., 2013; Li and Zhu, 2018). Then, starchy
fruits such as kiwifruit, banana and mango usually maintain relatively high level of starch at
commercial maturity (full fruit size but still unripe), while for the others, starch has already
decreased before the onset of ripening. Because fruits such as apple show conserved temporal

Part I-Introduction
26
profiles for starch accumulation, starch levels are used to define a ripening index for fruit harvest
in several species (Doerflinger et al., 2015).
Fig 4 Starch net accumulation rates in 12 fleshy fruit species.
“Rates expressed in mmol.g-1 FW.day-1 of glucose equivalent were calculated from fit of starch
accumulation and fruit growth. Additional fruit datasets were collected for tomato (Biais et al.,
2014), strawberry (Cakpo et al., 2020), mango (Tandon and Kalra, 1983) and pear (Oikawa et al.,
2015). Time is normalized against total time from anthesis to ripeness. Climacteric species are
symbolized with stars and full lines.” Cited from Roch et al.(2020).
In all these fruit species, in addition to a temporal accumulation, starch also shows spatial
distribution patterns. Thus, in tomato fruit, starch accumulates more in the inner pericarp
(parenchyma) than in the outer pericarp (Schaffer and Petreikov, 1997). In apple, different spatial
starch accumulation/degradation patterns, such as ring or star-shaped patterns, were observed
when comparing cultivars (Szalay et al., 2013). In banana, starch was degraded from the fruit
center to the outward (Blankenship et al., 1993).

Part I-Introduction
27
Different species have different strategies in fruit carbon partitioning. For fruits of the first group,
such as grape, large amounts of sugars are accumulated instead of starch during growth (Roch et
al., 2019). In contrast, in kiwifruit, which belongs to the third group, sucrose, fructose and glucose
decrease during early development, then remain stable whereas starch accumulates significantly
until reaching a plateau at maturation. In apple fruit, also a member of the third group, starch and
sugar accumulation appear coupled. In tomato, another fruit of the third group, carbon partitioning
appeared as intermediary between apple and kiwifruit, where sugars (mostly hexoses) remain
rather stable during fruit growth while starch accumulates until fruit growth ceases when expressed
on a fruit-basis. Additionally, it has been found that starch accumulation responds to abiotic stress,
such as shading, water stress or salinity, whereas sugars are more stable and repeatable (Yin et al.,
2010; Biais et al., 2014).
We have seen that starch accumulation varies greatly between fruit species and tissues. The
influence of the environment and/or agricultural practices may also affect starch accumulation in
fruit, but it has been little investigated so far.
Starch Remobilization in Fruits
In tomato, starch that is accumulated during fruit growth is nearly completely degraded at
maturation. Experiments based on [3H]-(fructosyl)-sucrose labeling with fruits still attached on
their pedicels showed that 25% of the sucrose taken up by the fruit was converted into starch
regardless of fruit age, suggesting that tomato fruits perform constant starch turnover throughout
development (N’tchobo et al., 1999). Surprisingly, 14C-pulse-chase analyses of tomato fruit disks
indicated that starch synthesis was highest in immature fruit [10 days post anthesis (DPA)]
(Luengwilai and Beckles, 2009). It appeared that the rate of starch degradation was maximal at
early immature stage and was lowest at maturity. Although those striking results remind us that
results obtained in vitro should be considered with care, both results implied that starch turnover
never ceases in the developing tomato fruit, and that starch remobilization may rather result from
a drop in starch synthesis. The underlying mechanisms, which may have evolved to offer flexibility
in balancing starch accumulation and utilization in the developing fruit, are largely unknown.

Part I-Introduction
28
In strawberry, in vitro experiments using [U-14C] glucose revealed that although starch content
was highest at the earliest developmental stages (below days post anthesis) the incorporation of
radioactivity into starch was relatively low (11%) (Souleyre et al., 2004). The incorporation of [U-
14C] glucose into starch then increased to a maximum of 20% at 21 days post anthesis but starch
had already strongly decreased. These results also show that there is a continuous starch turnover
in growing strawberry fruit. Simultaneous starch synthesis and degradation was also found in
ripening banana fruit, even though the conversion of hexose monophosphates to starch (0.4 µmol
hexose.g-1.h -1 FW) was much smaller than the reverse (5.9 μmol hexose.g-1.h -1 FW) (Hill and ap
Rees, 1993).
1.2.2 Regulation of Starch Accumulation
Unlike storage starch that is mobilized at specific moments such as germination or growth recovery,
following dormancy, transient starch appears as a more flexible reserve of carbon and energy. Thus,
the accumulation of transient starch fluctuates largely when plants face environmental challenges
or during shifts in developmental stages, implying that starch plays an important role for plant
fitness and growth. While there are in fact many ways of regulating starch levels between the two
extremes of storage and transient starch, it seems logical that the underlying regulation is complex
and diverse. In general, plants regulate starch metabolism in several ways, as listed below:
1. Plants sense the inner carbon/energy balance (supply and demand) and the changes in
relative source/sink strength during development to regulate carbon partitioning and
allocation.
2. Genes encoding proteins involved in the synthesis and degradation of starch (pathway
enzymes, enzyme regulators, transcription factors…) are regulated at the transcriptional
and post-transcriptional levels.
3. By duplicating and then modifying these genes or even recruiting other ones during
evolution, plants have considerably broadened the possibilities of regulation.
This complex network for starch regulation underpins the important roles starch plays for plant
growth and maintenance but also for coping with environmental stresses. Moreover, for different
tissues or species, different regulation strategies have been found. The details of the regulation of

Part I-Introduction
29
synthesis and degradation of starch, and their physiological relevance, are discussed in the
following subsections.
Sugar Signaling and Carbon Partitioning
To cope with carbon supply and demand, plants use several sugar signaling pathways sensing
carbon availability including hexokinase-1 (HXK1), trehalose-6-phosphate (Tre-6-P) and target of
rapamycin (TOR) for high carbon availability, and pathways including sucrose-non-fermenting 1
(SNF1)-related protein kinase 1 (SnRK1) and C/S1 bZIP transcription factors (reviewed by
Wingler, 2018) for low carbon availability. Among those sensors, researchers found that Tre6P
and SnRK1 interact together to regulate sucrose and starch contents in plants.
Trehalose-6-phosphate Plays a Role in Carbon Partitioning
In plants, sucrose is the main product of photosynthesis and also the most common product
transported from source to sink organs through the phloem. The partitioning between sucrose and
starch in source organs and the availability of sucrose for sink organs are major determinants for
starch accumulation. Cytosolic sucrose correlates with Tre-6-P content, which suggests that
sucrose content is regulated by Tre-6-P, but synthesis of Tre-6-P is also affected by changes in
sucrose content (Geigenberger et al., 2005; Lunn et al., 2006). Tre-6-P acts as a signaling
metabolite coordinating sucrose status, carbon assimilation and development. In Arabidopsis, Tre-
6-P is synthesized from UDP-glucose and Glc-6-P by trehalose-6-phosphate synthase1 (TPS1),
and then subsequently dephosphorylated by trehalose-6-phosphate phosphatase (T6PP) to produce
trehalose. It was envisaged that the circadian clock-controlled starch turnover, which prevents the
plant from carbon starvation before dawn, is achieved via the sucrose/Tre-6-P negative feedback
circuit, to balance the supply and demand for sucrose. During the day, Tre-6-P plays little role in
regulating starch synthesis, but at night, high levels of Tre-6-P inhibit starch degradation, leading
to a starch excess phenotype at the end of the night (Martins et al., 2013). Thus, Tre-6-P feedbacks
starch degradation at night, contributing to the maintenance of optimal ratios of starch to sucrose
in leaves and export of carbon to the rest of the plant. The details of the regulation mechanism
involving Tre-6-P are not yet known.

Part I-Introduction
30
Interaction between SNF1-related protein kinase 1 and Trehalose-6-phosphe Signaling
SNF1-related protein kinase 1 (SnRK1) is regarded as a central integrator of plant stress and carbon
signaling cascades that directly phosphorylates key metabolic enzymes and regulatory proteins,
and performs extensive transcriptional regulation (e.g., through bZIP transcription factors) (Baena-
González et al., 2007; Nunes et al., 2013). There is an important regulatory link between SnRK1
and Tre-6-P. Processes such as starch metabolism during flowering, anthocyanin biosynthesis, and
senescence (Wingler et al., 2012), which were known to be under Tre-6-P-regulation, were also
identified as SnRK1 targets (Baena-González et al., 2007).
In storage tissues, overexpression of SnRK1 usually leads to increased starch content. In potato,
overexpressing SnRK1 under the control of a tuber-specific promoter resulted in an increase of 23
to 30% of the starch content and a decrease of 17 to 56% of the glucose levels. The activity of
sucrose synthase and AGPase, two important enzymes involved in carbon partitioning in the tuber
was also increased, by approximately 20–60% and three- to five-fold, respectively (Tiessen et al.,
2003). SnRK1 may also play an important role in improving quality traits linked to starch. Thus,
in sweet potato (Ipomoea batatas), the IbSnRK1 gene is highly expressed in the storage roots and
strongly induced by exogenous sucrose. Its overexpression not only increased starch content, but
also decreased the proportion of amylose, enlarged the size of the starch granules and improved
the degree of crystallinity and gelatinization. In transgenic plants, the genes involved in starch
biosynthesis were systematically up-regulated (Ren et al., 2019). Overexpression of SnRK1 in
fleshy fruits led to similar results. Thus, the heterologous overexpression of the MhSnRK1 gene
from pingyitiancha (Malus hupehensis) in tomato, led to increased activities of sucrose synthase
and AGPase, and to increased content of starch in the leaves and red-ripening fruits (Wang et al.,
2012). Surprisingly, the transgenic fruit ripened about 10 days earlier than the wildtype, implying
that SnRK1 may play different roles in different tissues. Above all, those results emphasize the
importance of SnRK1 in the regulation of carbohydrate metabolism and resource partitioning.

Part I-Introduction
31
ADP-glucose Pyrophosphorylase Plays a Central Role in the Regulation
of Starch Synthesis
AGPase catalyzes the before-last step in starch synthesis, by providing ADP-glucose to the
reactions of polymerization catalyzed by starch synthases. The genes encoding AGPase but also
the enzyme itself are subject to multiple regulations at both transcriptional and post-transcriptional
levels, which play a central role in the regulation of starch synthesis.
Transcriptional Regulation of ADP-glucose Pyrophosphorylase
Plant AGPase is a heterotetramer consisting of two large and two small subunits that is usually
located in the plastid of leaves and fruits. One exception is the cereal endosperm, in which there
are two isoenzymes of AGPase, one located in the plastid and one in the cytosol (Hannah and
James, 2008). Four subunits are required for optimal enzyme activity, but the large subunit plays
more of a regulatory role, while the small subunit has both catalytic and regulatory properties
(Cross et al., 2004). Multiple isoenzymes of AGPase are present at varying levels in different plant
tissues. In Arabidopsis, there are four genes encoding the large subunit (Apl1–Apl4) and two genes
(Aps1 and 2) encoding the small subunit (Table 2). In tomato, there are three genes encoding the
large subunit and small unit, respectively (Table 2)
The temporal and spatial control of these genes varies between tissues, allowing to produce
AGPase with different sensitivity to allosteric effectors to respond to the particular metabolic
demands for different tissues. The transcript levels of the genes encoding AGPase are increased
by sugars and decreased by nitrate and phosphate (reviewed by Geigenberger, 2011), which may
allow starch accumulation to cope with fluctuations of the carbon and nutritional availabilities.
In tomato fruit, AGPase related genes AgpL1, AgpL3 and AgpS1 show particularly abundant
expression in the parenchyma, and highest expression at immature stages (Shinozaki et al., 2018).
The spatiotemporal expression is coordinated with the more abundant AGPase enzyme activities
and more starch accumulation at the inner pericarp (Schaffer and Petreikov, 1997). It was also
found that AGPase coding genes AgpL1 and AgpS1 are upregulated by sugar, but not by abscisic
acid or osmotic stress (Yin et al., 2010).

Part I-Introduction
32
A series of studies were performed using introgression lines derived from a cross between the
Solanum lycopersicum cultivar M-82 and the wild tomato Solanum habrochaites. The mapping of
an introgression line characterized by fruits with high Brix(a proxy for sugar content) identified
AGPase as a rate-limiting enzyme in starch synthesis in tomato fruit, and that modifying this single
rate-limiting enzymatic step can influence fruit sink carbohydrate metabolism, leading to an
increase of the net import of photoassimilates into the fruit (Schaffer et al., 2000). It showed an
increased level of starch in the immature fruit, accompanied with increased soluble sugar level in
the mature fruit. It was then found that this introgression line harbors the S. habrochaites allele of
AgpL1, which provides higher AGPase activity, probably because expression of AgpL1 was
prolonged, leading to an extended presence of the AgpL1 protein (Schaffer et al., 2000). The fact
that the small subunit protein also remained for an extended period during fruit development in
the AgpL1H fruit, suggested that the large subunit contributes to stabilize the AGPase
heterotetramer (Petreikov et al., 2006). This introgression line showed increased fruit size,
carbohydrate concentrations, and carbohydrate contents of the whole fruit. This was related to a
large increase in the transient starch reservoir that, upon degradation, accounted for the subsequent
increase in soluble sugars (Petreikov et al., 2010).
Posttranscriptional Regulation of ADP-glucose Pyrophosphorylase
The AGPase enzyme is regulated both by the 3-phosphoglycerate (3-PGA) to phosphate (Pi) ratio
and by the redox state.
AGPase is allosterically activated by 3-PGA and inhibited by Pi. When concentrations of cytosolic
triose-phosphates are high, their export from the chloroplast is impeded, leading to the
accumulation of 3-PGA in the plastid and thus increased AGPase activity leading to increased
production of starch. Conversely, in low light or darkness, free Pi accumulates inside the plastid,
inhibit AGPase and thus restricts carbon allocation to starch (Tiessen and Padilla-Chacon, 2012).
This mechanism allows the source tissues of the plant to react to both the cytoplasmic carbon status
and light intensity (Hendriks, 2003).
The two catalytic small subunits of AGPase can form a disulphide bridge at a conserved cysteine
residue, which inhibits its activity, while its reduction and the subsequent release of the disulphide

Part I-Introduction
33
bridge lead to activation (reviewed by Geigenberger, 2011). It was demonstrated that two different
forms of thioredoxin (Trx) are involved in the redox regulation of plastid metabolism. One is freely
linked to ferredoxin (Fdx) and the other bound to NADPH-dependent thioredoxin reductase C
(NTRC). Their importance for starch synthesis in photosynthetic and non-photosynthetic tissues
differs, with Fdx/Trx being predominant in chloroplasts and NTRC in amyloplasts (Michalska et
al., 2009). However, this conclusion was later challenged by a study conducted with an
Arabidopsis ntrc mutant. Its complementation with NTRC overexpression under the control of a
leaf-specific promoter led to wild-type phenotypes, but the mutant phenotype remained unaltered
when a root-specific promoter was used (Kirchsteiger et al., 2012). These data thus indicate a role
of NTRC in photosynthetic leaves, rather than in roots. In contrast, a recent study showed that in
heterotrophic tomato fruit, NTRC downregulation leads to a strong increase in the reductive states
of NAD(H) and NADP(H) redox systems and to decreased transient starch accumulation, which
leads to a subsequent decrease in soluble sugars at ripeness. The inhibition of starch synthesis was
associated with a decrease in the redox-activation state of AGPase (Hou et al., 2019).
During tomato fruit development the redox status can also be manipulated by reducing the
activities of either mitochondrial malate dehydrogenase or fumarase via targeted antisense
approaches, which leads to changes in redox-activation states of AGPase (Centeno et al., 2011).
The changes in AGPase redox state were additionally associated with alterations in starch synthesis
in immature fruits and subsequent alterations in soluble sugar content in mature fruits (Centeno et
al., 2011). However, a similar manipulation in potato (via RNA interference to down-regulate
fumarase expression under a tuber-specific promoter control) led neither to an increased flux to
starch or increased starch levels, nor to an alteration in yield despite displaying similar reductions
in both fumarase activity as observed in tomato fruit expressing a similar construct. The fact is that
small changes were observed in plastidial malate, but probably too small to alter the redox state
and then the activation state of AGPase, thus indicating that the influence of malate on plastidial
starch biosynthesis is highly context dependent (Szecowka et al., 2012).
Interestingly, the redox modulation of AGPase also impacts its allosteric activation. Thus, when
APS1 is oxidized, the holoenzyme is less sensitive to 3-PGA (Tiessen, 2002; Hendriks, 2003).
NTRC-RNAi lines of tomato fruit (Hou et al., 2019) showed AGPase activity comparable to that

Part I-Introduction
34
of the wild type when 3-PGA was omitted from the enzyme assay, but in the presence of 0.25 to
10 mM 3-PGA, there was a 30% to 50% decrease in AGPase activity.
Fig 5 Post-transcriptional regulation of AGPase (Adapted from Nakamura, 2015, p.295)
Is ADP-glucose Pyrophosphorylase Activity Rate-limiting Starch Synthesis?
Because AGPase has multiple regulatory properties, it is widely accepted that it is a rate-limiting
enzyme in starch synthesis. According to Smith and Zeeman (2020), control of flux into starch is
likely dependent on genetic, developmental, and environmental factors, while AGPase can play an
important role, the general use of the term rate-limiting step is misleading. AGPase exerts
significant control over the flux into starch in Arabidopsis leaves under saturating light, but less
under limiting light (Neuhaus and Stitt, 1990). In potato tubers, AGPase exerts a significant control
under non-stressed conditions (Geigenberger et al., 1999, 2004; Sweetlove et al., 1999) but less
under osmotic stress (Geigenberger et al., 1999). In tomato fruit, a constant starch synthesis (about
25% of the sucrose taken up was converted into starch) was observed throughout fruit development
via 3H labeling (N’tchobo et al., 1999). Considering that extractible activity of AGPase, which
L L
S S
S S
L L
S S
SH HS
Trxred
TrxoxC
PSI
RedoxModulation
T6PSnRK1Sugar signaling
Allostericactivation
+
+
Activation
↑PGA:Pi

Part I-Introduction
35
corresponds to its capacity, decreases along fruit growth (Biais et al., 2014), AGPase would thus
be in excess at early stages of fruit development and starch synthesis would rather be controlled
by other mechanisms including sucrose supply. A more striking result revealed that when AGPase
activity is repressed using a constitutive promoter, the transgenic plants appeared phenotypically
normal despite a repression of AGPase activity by 70% that did also not significantly alter starch
levels (Ali, 2003). There was only one line, in which AGPase was reduced by 90%, in which starch
levels were altered, indicating that under the growth conditions used in the experiment, AGPase
activity was in large excess in tomato fruit. It is worth to mention that in this experiment, tomato
fruit stored more carbon in the form of soluble sugars than starch, which may suggest that carbon
limitation occurred under these growth conditions (in a growth chamber), and that in this case
AGPase was not the rate-limiting step.
Regulation of Starch Degradation
Regulation of Starch Degradation in Arabidopsis Leaves
In Arabidopsis leaves, the transcript levels of genes involved in starch metabolism are under strong
diurnal/circadian regulation. However, the levels of the encoded proteins generally remain
relatively constant (Tenorio et al., 2003; Lu et al., 2005), and it was suggested that the diurnal
cycling of transcripts is important for medium- to long-term adjustment of protein levels (Gibon
et al., 2004). Therefore, post transcriptional regulation appears to play an important role in
regulating starch metabolism.
Possible posttranscriptional regulation of starch degradation includes redox regulation,
phosphorylation of proteins and forming of functional protein complexes, as reviewed by Streb
and Zeeman (2012) and Skryhan et al. (2018). Like AGPase, some enzymes participating in starch
degradation were also suggested to be redox regulated, including GWD1, SEX4, BAM1, BAM3,
AMY3, ISA3, and LDA (Glaring et al., 2012; Silver et al., 2013; Seung et al., 2013). GWD is
required for complete starch degradation, and GWD reduction by thioredoxin increases its activity
and stromal localization (Mikkelsen et al., 2005). However, in vivo experiments showed that redox
regulation of GWD is not essential for initiation or modulation of the rate of starch degradation,
as being constitutively active, redox-insensitive GWD mutant could fully complement a gwd–null

Part I-Introduction
36
mutant (Scialdone et al., 2013). Those surprising observations imply that other enzymes also need
further in vivo studies to confirm their redox regulation. Large-scale phosphoproteomic approaches
performed in Arabidopsis have identified a number of starch metabolic proteins as putative
phosphoproteins in vivo, including plastidial PGI, PGM1, AGPase, SS3, GWD1 and GWD2,
DPE2, AMY3, BAM1 and BAM3, LDA, pGlcT and MEX1 (see Kötting et al., 2010).
In addition of using sugar signals to regulate starch metabolism, plants also use hormones to adjust
starch metabolism to cope with environmental changes or developmental shifts. ABA is well
known as a key signal in response to different stress conditions. In Arabidopsis, ABA-dependent
response to osmotic stress is partially triggered by increasing BAM1 and AMY3 gene expression
via the AREB/ABF-SnRK2 pathway. Both BAM1 and AMY3 promoters contain ABA-responsive
element (ABRE) motifs, while none were found in the BAM3 promoter. Application of exogenous
ABA induces BAM1 and AMY3 expression and results in increased BAM1 enzyme activity
followed by increased starch degradation. The amy3/bam1 double mutants are hypersensitive to
osmotic stress and show impaired root growth, thus mimicking the phenotype of ABA-deficient
mutants (Thalmann et al., 2016).
Regulation of Starch Degradation in Fruit
In fruit, the genes participating in starch degradation are temporally expressed, usually
coordinating starch degradation with fruit growth. Unlike in leaves in which diurnal fluctuations
in transcript levels are not reflected at the protein level, evidence in fruits indicates a more
important role for transcriptional regulation during long-term starch turnover. A well-known
regulator of levels of transcripts involved in fruit starch degradation is ethylene, even though the
details are missing. In starchy fruits like banana and kiwifruit, which accumulate starch along the
development and reach a plateau until the climacteric crisis, a commercial practice that has been
used for a century consists in using ethylene to promote ripening and starch degradation. Despite
this obvious role for ethylene, there is a lack of systematic analysis of ethylene response elements
in the promoter regions of genes associated with starch metabolism. Investigations of regulation
mechanism have nevertheless recently emerged, shedding light on ethylene regulation of starch
metabolism. Thus, Xiao et al. (2018) have identified response elements to diverse hormonal
classes in the upstream regions of 16 MaBAM genes in banana. Interestingly, only MaBAM3c,

Part I-Introduction
37
which was highly expressed in the fruit after the climacteric peak, showed a single element of
ethylene response in the promoter region. Similar results were found in kiwifruit by performing a
transcriptomics-based approach to identify transcriptional regulatory components associated with
starch degradation during the ripening phase. Analysis of the regulatory effects of differentially
expressed genes identified a zinc finger transcription factor, DNA BINDING WITH ONE
FINGER (AdDof3), which showed significant transactivation on the AdBAM3L (β-amylase)
promoter. AdDof3 interacted physically with the AdBAM3L promoter. Moreover, transient
overexpression analysis showed that AdDof3 up-regulated AdBAM3L expression in kiwifruit
(Zhang et al., 2018).
Besides ethylene, ABA could also play an important role in the ripening of climacteric and non-
climacteric fruit (Jia et al., 2011). In tomato, ABA accumulates before the production of ethylene
and has been suggested to be required for normal initiation of tomato fruit ripening, while ethylene
acts at later stages of that process (Zhang et al., 2009). The role of ABA in regulating fruit primary
metabolism has emerged by comprehensive investigations of metabolites on SlAREB1-OE,
SlAREB1-RNAi and ABA biosynthesis absent mutant (not). SlAREB1 belongs to a group of bZIP
transcription factors known as ABA response element-binding factors (AREBs) and are part of a
major ABA-dependent signaling pathway that regulates gene expression in response to stress.
Modifications of SlAREB1 expression levels in tomato by overexpressing or silencing resulted
into the up-regulation or down-regulation of genes encoding enzymes involved in primary
carbohydrate and amino acid metabolism (Bastías et al., 2014). In the not mutant, which is
defective in a SlNCED gene, a key gene of ABA biosynthesis, the levels of sugars and sugar
alcohols were significantly lower, suggesting that impairment of ABA synthesis results in
decreased sugar accumulation. ABA also seems to facilitate the degradation of starch to sugars, as
the starch content in the not mutant was significantly higher at both the mature green and red ripe
stages investigated (Li et al., 2019). However, there are only few studies describing a possible
relationship between ABA and starch metabolism in fruits. Underlying mechanisms that link starch
and ABA in tomato fruit remain unknown, and more studies are needed.
It is necessary to mention that transcriptional and post-translational regulation of starch
biosynthetic enzymes may differ between species, tissue types, and developmental stages. The
coordination of this regulation is to a large extent orchestrated by the sugar status, hormones and

Part I-Introduction
38
environmental stimuli. The sensing and signaling mechanisms mediating these processes are
largely unknown. Much more work is required to fully understand how the perception of
endogenous and environmental conditions can cause changes in starch turnover and how these
aspects of regulation are integrated.
1.2.3 Physiological Roles of Transient Starch
Starch can be accumulated in leaves, roots, pollen, fruit and seeds, acting both in the vegetative
growth and the reproductive growth. In Arabidopsis, transitory starch is synthesized during the
light period, and degraded at night to provide substrates for maintenance and growth. The supply
of carbon from starch can be vital for normal plant growth. When diel turnover is impaired, e.g. in
the Arabidopsis starch-excess mutants SEX1 and SEX4, plant growth is slowed down and biomass
decreases (Zeeman et al., 2002). Starch also accumulates in the guard cells that control stomatal
pore size and thus the exchange of water vapor, CO2, and O2 between the leaf and the atmosphere.
Transitory starch in these cells plays a key role in determining the velocity of stomatal opening in
the light. BAM1 was found to be an essential enzyme for starch degradation in guard cells, as the
bam1 knockout mutants were found to have more starch in illuminated guard cells and reduced
stomata opening (Valerio et al., 2011).
For many cereal crops including rice, maize, wheat, and barley, starch is the main storage reserve
in mature pollen grains and used for supplying energy and a carbon skeleton to support pollen
germination and pollen tube growth for proper fertilization. Mutations in the rice plastidic PGM,
OspPGM, and the plastidic AGP LS, OsAGPL4, resulted in starch deficiency in pollen grains and
induced male sterility (Lee et al., 2016). In tomato, starch is synthesized at an early stage of pollen
development (after the first haploid mitosis), and starts to be hydrolyzed during the late two celled
stage. The process is complete just before anther dehydration, and the mature pollen grain of
tomato is starchless (Pacini and Franchi, 1988). The tomato GWD (LeGWD) heterozygous mutant
pollen had a starch-excess phenotype that was associated with a reduction in pollen germination
(Nashilevitz et al., 2009).
For fruit development, starch, as a flexible carbon and energy reserve, plays important roles all
along fruit growth. For early fruit set, starch was suggested to be a carbon reserve that contributes

Part I-Introduction
39
to sink strength, thus buffering the fluctuation of energy supply, particularly under mild stress
conditions (Ruan et al., 2012). A study of kiwifruit suggested that starch turnover occurs during
cell division (Nardozza et al., 2013). Starch (also cell wall polysaccharides) degradation may also
be related to the climacteric respiration of tomato fruit that occurs during ripening, as revealed by
constraint-based modeling (Colombié et al., 2017). Fruit species that do not store carbohydrate
reserves such as starch, for instance muskmelon, must remain attached to the plant for allowing
the accumulation of soluble sugars to occur during ripening (Hubbard et al., 1990). In contrast,
climacteric fruit species that store starch when fruit is commercially mature, such as banana and
kiwifruit, can be harvested before ripening and have a long shelf life. The later net starch
degradation in those starchy fruits, which has been attributed to the complex action of a range of
enzymes related to starch breakdown at transcriptional and translational levels (Xiao et al., 2018),
massively contributes to the final sugar content (Prabha and Bhagyalakshmi, 1998; Nardozza et
al., 2013). Petreikov et al. (2010) proposed an increase in transient starch accumulation in tomato
as a valuable strategy for increasing the sink strength of the developing fruits, the final size and
sugar levels of the ripen fruits.
During growth and development, plants face many abiotic stresses related to water (drought or
flooding), temperature (heat or cold), light (low/high light or UV light). Starch metabolism appears
to play a key role in mitigating the effects of abiotic stress in plants. Thus, when tomato plants
were grown under control, shading or water shortage conditions, fruit hexose and sucrose amounts
were similar, but fruit starch content showed large fluctuations during fruit growth, which
suggested that starch may play a buffering role for carbon supply under different abiotic stresses
(Biais et al., 2014). In many cases, plants respond to abiotic stresses by mobilizing starch reserves
and releasing soluble sugars to provide energy for growth, and/or by providing sugars as
osmoprotectants and substrates for metabolism (intensively reviewed by Thalmann and Santelia,
2017; Dong and Beckles, 2019). Stress-induced starch accumulation has different effects that
depend on the tissue type. In the source, it can alleviate excess sugars that repress photosynthesis.
While in non-photosynthetic tissues, it can maintain sink strength, and also provide a maximal
carbon reserve for the next generation. Dong and Beckles (2019) proposed that starch metabolism
is a key convergence point in plant stress response as a mechanism for changing sugar availability.

Part I-Introduction
40
Through starch-sugar reconversion, starch is able to influence whole-plant carbon allocation, and
functions as a buffer against abiotic stress.

Part I-Introduction
41
Chapter1.3 Strategies for Studying Starch
Metabolism in Fleshy Fruits: Forward and
Reverse Genetics
As seen before, transient starch plays import roles in fruit. It is used as carbon and energy reserve
during early development, thus buffering possible fluctuations in carbon supply that are linked to
the environment, and it contributes to final sugar accumulation. In climacteric fruit it is also
involved in the respiration climacteric that occurs at ripening, thus playing an important role for
postharvest quality (e.g., shelf life). To achieve those multiple roles, a sophisticated network
integrates developmental and environmental signals and orchestrates starch turnover. During last
decades, metabolism of transient starch has been intensively studied in leaves and endosperm,
which nevertheless show significant differences between them and with fruit and further organs
regarding the mechanisms responsible for starch synthesis and degradation. However, even in
leaves and endosperm, the regulation of starch degradation remains largely unknown. Thus, it is
necessary to study starch metabolism in fruit in order to better understand its regulation and
physiological roles during fruit growth and ripening phases, which will ultimately facilitate
breeding strategies to improve fruit quality, fitness and postharvest properties through breeding
and agricultural practices.
1.3.1 Tomato (var. Micro-Tom) as the Model for Studying
Starch Metabolism in Fleshy Fruit
To study starch metabolism in fleshy fruit, tomato can be an excellent model for several reasons.
First and most importantly, tomato fruit accumulates starch under optimal growth to large amounts
with net accumulation rates and accumulation patterns that are comparable to those found in other
starchy fruits like banana, kiwifruit and apple (see Chapter 1.2.1). Second, tomato, which is often
considered as the model plant system for fleshy fruit species (Rothan et al., 2019), has numerous

Part I-Introduction
42
advantages for genetic, molecular and even physiological studies. Thus, rich resources of genomic,
transcriptomic and proteomic data are available for tomato fruit, and bioengineering methods are
well developed and widely applied, and finally are of advantage for both forward and reverse
genetic approaches. Regarding experimentation, unlike most other starchy fruits usually growing
in fields, tomato has a relatively short growth period that enables up to 3 to 4 cultivations per year
and can easily be cultivated in the greenhouse, under well controlled conditions. Besides, there is
a relatively abundant literature on starch regulation, especially on AGPase regulation, in tomato
and potato, which are both members of Solanaceae. This knowledge provides a solid basis for
studying starch metabolism in tomato fruit.
The “micro” tomato (Micro-Tom) is a miniature tomato mutant, which is dwarf, bushy, and
determinate and has dark-green leaves, short internodes, and small fruits. It was bred by crossing
the home gardening cultivars Florida Basket and Ohio 4013-3 (Scott and Harbaugh, 1989). Three
recessive mutations are mainly responsible for those traits: dwarf (d), self-pruning (sp), and
miniature (mnt). The D gene encodes a cytochrome P450 protein involved in brassinosteroid (BR)
biosynthesis (Bishop et al., 1996). SP is the ortholog of Arabidopsis TERMINAL FLOWER 1
(TFL1) and Antirrhinum CENTRORADIALIS (CEN) and is responsible for continuous growth of
shoot apical meristem (Pnueli et al.,1998). The “miniature” mutation associated with the short
internode phenotype is likely due to a reduction in gibberellin (GA) signaling (Marti, 2006).
However, the responsible gene has not yet been identified (reviewed by Okabe and Ariizumi,
2016). Besides those phenotypes, no significant difference were found for fruit central metabolism
when comparing Micro-Tom with other cultivars (Obiadalla‐Ali et al., 2004).
Those Micro-Tom traits also provide several extra experimental advantages compared to other
tomato cultivars. Firstly, Micro-Tom requires less time and space for cultivation. The life cycle of
Micro-Tom from sowing to seed harvesting is shorter (70–90 days), thus allowing more
generations per year. Micro-Tom plants can be raised to maturity in a greenhouse or growth
chamber condition at a very high density, for instance an area <4 m2 is necessary for the culture of
a segregating population of 600 plants. Secondly, transformation of Micro-Tom by Agrobacterium
is well established and has a relatively high efficiency compared to other model plants (Sun et al.,
2006). In addition, Micro-Tom can be crossed to many tomato varieties, allowing easy transfer of
Micro-Tom-derived mutations to other varieties. As a consequence, Micro-Tom facilitates

Part I-Introduction
43
experimentation that requires large numbers of individuals and several generations. Also, Micro-
Tom can easily be grown under well controlled environments that make experiments more
reproducible and this greatly facilitates forward genetic approaches.
1.3.2 Forward Genetics
Forward genetics has proven very valuable to discover and study gene function. Thus a series of
Arabidopsis starchless or starch-excess (sex) mutants greatly facilitated the research on transient
starch in leaves (Caspar et al., 1985; Zeeman et al., 1998). These mutants, carrying random
mutations, were usually obtained by chemical or irradiation treatments. Phenotypic screenings
were carried on those mutants, followed by the identification of the potentially causal mutations
by map-based (positional) cloning. Although this forward genetic approach has been very
successful regarding leaf starch metabolism, it has hardly been used to study starch metabolism in
fruit. For starchy fruits such as kiwifruit, banana, and apple, it is indeed difficult to create and
maintain mutant populations, and because of their long growth cycles mapping the causal genes
can be very time-consuming. However, Micro-Tom shows particular advantages for applying
forward genetic approaches thanks to its miniature and short life cycle (as mentioned above).
To maximize the chances to find interesting phenotypes, the mutated population needs to be highly
mutated and the phenotyping to be robust and amenable to high throughput. Moreover, to identify
causal mutations, a well-developed method for mapping (genotyping) is required. Each of these
three steps can be the bottleneck in the discovery process. Fortunately, in our unit (UMR1332 BFP,
INRAE, Univ. Bordeaux), we maintain a big population of Micro-Tom ethyl methanesulfonate
(EMS) mutants and benefit from a high throughput metabolic phenotyping platform (HiTMe).
EMS Mutant Population of Micro-Tom
Ethyl methanesulfonate (EMS) is a commonly used chemical mutagen that generally causes single
nucleotide transitions and only rarely induces nucleotide transversion. In Bordeaux, ~8,000 EMS
mutant lines have been developed and 30,000 annotations are available for more than 150
phenotypic categories (Just et al., 2013) in the associated Micro-Tom Mutant Database (MMDB,
not yet publicly searchable). According to Just et al. (2013) , seeds of Micro-Tom were treated

Part I-Introduction
44
with 1% EMS as described by Dan et al. (2007) and Okabe et al. (2011), thus generated M1 seeds
and M1 plants. In order to increase the mutation frequency, seeds were collected from part of M1
plants and used to perform a second round of 1% EMS treatment. The M2 seeds generated from
mutant M1 plants produced from one or two rounds of EMS mutagenesis constructed a population
with ∼8,000 M2 families. The mean mutation density of the mutant collection was estimated to be
close to one mutation per 663 kb by screening 49.9 kb of DNA sequence on 7,296 M2 families by
using Endo1 endonuclease. However, this result is probably underestimated because one mutation
per 125 kb was found for some genes by TILLING (Targeting Induced Local Lesions in Genomes),
and a recent whole genome sequencing of an EMS mutant line from the collection uncovered even
higher mutation frequencies.
High Throughput Phenotyping
The HiTMe (High Throughput Metabolic phenotyping) platform is able to quantify metabolites
and enzyme activities in very large numbers of samples. It is equipped with three cryogenic
grinding units, two 96-channel liquid handling robots, one integrated robotic unit (96-channel
liquid handling, centrifuge, heating, microplate reading, etc.), and 11 filter-based microplate
readers, etc. The combination of microplate technology and pipetting robots enables the
measurement of metabolic traits such as starch content in up to hundreds of samples per day (for
details, https://www.phenome-emphasis.fr/phenome_eng/Installations/Bordeaux-Omic).
Mapping-by-sequencing
In classic forward genetic approaches, the causal gene of a given mutation is identified by map-
based (positional) cloning. It is the process of identifying the mutation by looking for linkage to
markers whose physical location in the genome is known. Before the genomic era, it usually took
years with large amounts of lab work to find the corresponding mutation. It was necessary to build
a physical map, develop markers, followed by cloning, complementation by transformation, and
de novo determination of the sequence of the entire region of interest to high quality without a
previously determined wild-type DNA sequence as a guide (Jander, 2002). Nowadays, thanks to
second-generation sequencing, the genotyping procedures have been dramatically shortened and
the cost greatly reduced, thus providing a powerful alternative mapping strategy called mapping-

Part I-Introduction
45
by-sequencing. It consists in identifying the allelic variant underlying the phenotype of interest by
performing whole-genome sequencing. Mapping-by-sequencing, which is very well adapted to
tomato, is considered as considerably shortening the time needed to identify a causal mutation
(Garcia et al., 2016). When applying mapping-by-sequencing to Micro-Tom EMS mutants,
forward genetics becomes remarkably feasible by requiring a limited space for plant culture,
reduced time and cost for mapping.
The whole procedures of mapping-by-sequencing developed on Micro-Tom was documented and
detailed by Garcia et al. (2016). Taking a recessive trait as an example, a homozygous mutant
showing the phenotype of interest after the first screening is selected for confirming the phenotype.
After confirmation, the homozygous mutant is crossed with the WT to generate back-crossed F1
(BC1F1) plants, which are then self-pollinated to produce a BC1F2 population. In this population,
plants segregate and display WT-like and mutant-like traits according to Mendelian laws. Around
30 to 40 individual plants are selected to construct a WT-like bulk and a mutant-like bulk, based
on the phenotype. Then, leaves of the two bulks are used to extract DNA for sequencing to a read
depth of ~20–40. Sequences are analysed based on the pipelines with filtering the natural
polymorphisms, analyzing allelic frequencies and variant calling. According to Mendelian
segregation, the average of allelic frequencies of a target region for the WT-like bulk is around
0.33, while for the mutant-like bulk, it is close to 1. After determining the region of interest, a
recombination analysis can be further performed to refine the target region to identify the causal
mutation (so called fine-mapping).
Identification of the Causal Mutation
After narrowing down the region of interest, the evaluation of the candidate mutations in a clean-
up background (like WT plant) is necessary considering that EMS mutants usually carry on
thousands of mutations with possible interferences. EMS produces mutations randomly on the
chromosomes, which locate in none-coding regions possibly involved in regulation or in coding
regions, resulting in different kinds of mutations. According to the effect on protein sequences, it
can be categorized as moderate, missense and knockout mutations. According to the nature of the
mutation effect, different identification strategies are required.

Part I-Introduction
46
To mimic the different mutation effects mentioned above, we can utilize different bioengineering
methods, including the generation of missense or KO mutants via CRISPR/Cas9 techniques, and
the down- or up-regulation of candidate genes by using gene silencing (via antisense, sense or
RNA interference), or overexpression by fusion with constitutive or tissue-specific expression
promoters. All of those genetic engineering tools (CRISPR/Cas9, RNAi, overexpression and so
on) allow for a comprehensive examination of the different types of mutations.
CRISPR/Cas9 can generate DSBs (DNA double-strand breaks) via RNA-DNA base pairing and
the PAM (protospacer adjacent motif) sequence recognition (Adli, 2018), which can be repaired
either using error-prone non-homology end joining (NHEJ) or homology-directed repair (HDR)
by the organism. Those processes may result InDel mutations or precise substitutions, leading to
knockout mutation or precise-genome editing, respectively. The Second generation of CRISPR
gene-editing tools are developed to perform base-editing, CRISPR-mediated gene expression
regulation, and CRISPR-mediated live cell chromatin imaging etc. (Adli, 2018). All of them are
achieved by turning nuclease Cas9 to nickase Cas9 (nCas9) or dead Cas9 (dCas9, catalytically
inactive Cas9), but still with the capability to recognize specific sequences. The engineered Cas9
can then be fused with other functional enzymes or proteins to enable base editing, gene regulation
or chromatin imaging.
In tomato, the first case of applying CRISPR/Cas9 was reported by Brooks et al. (2014). Later,
Shimatani et al. (2017) succeeded in generating homozygous mutant plants with heritable DNA
substitutions by using nCas9At fused with either a human codon-optimized PmCDA1 (nCas9At-
PmCDA1Hs) or a version codon-optimized for Arabidopsis (nCas9At-PmCDA1At). There is also
room for improvement for this technique, since part of the offspring of T0 generation also carried
InDel mutations, additionally the rate of inducing substitution was much lower than that of InDel
mutations. However, it showed the possibility of base editing for crop improvement. CRISPR-
Cas9 and related second-generation genome-editing tools increase the feasibility and enlarge the
applicable scope of biotechnology.

Part I-Introduction
47
Fig 6 A general workflow for forward genetic approaches.
The procedures include phenotyping via high throughput metabolite measurements, genotyping via mapping-by-sequencing, validation of the causal gene via bioengineering. The figure is adapted
and cited from Garcia et al. (2016) and Causse et al. (2020).

Part I-Introduction
48
1.3.3 Reverse Genetics
In contrast to forward genetics, which is a process without prior assumptions, reverse genetic
approaches rely on prior knowledge to select candidate genes. Therefore, reverse genetics are
considered as being gene-driven rather than phenotype-driven. Both forward and reverse genetics
are widely used and are fruitful strategies. Reverse genetics usually takes advantage from
discoveries made on model species like Arabidopsis to examine a certain set of genes for
unanswered questions.
For starch research, it is worth to take this strategy to create transformants via genetic engineering,
since among leaves and fruits, the basic synthesis and degradation participants are conserved, but
the relatively importance and specific roles might differ. Specially, in leaves, starch is under clock
control with diel turnover, but in fruits, instead of having a diel turnover, starch exhibits a more
stage-depended turnover (introduced in Chapter 1.2.1). Besides, the studies on starchy fruits like
banana and kiwifruit mostly based on correlations and in vitro experiments, to examine the
candidates in vivo of tomato via genetic engineering may provide more evidence and extra
information.
A comprehensive mining of tomato genes homologous to Arabidopsis and potato genes involved
in starch metabolism, which are listed in Table 2 and Table 3, has been performed by Moustakas
(2013). This knowledge on other species and tissues could be a good reference for exanimating
starch metabolism in tomato fruit. Besides, as mentioned above, rich resources of genomic,
transcriptomic and proteomic data are available for tomato. Thus, the newest version of the tomato
annotated genome (SL4.0 and ITAG4.0) was published in 2019 (Hosmani et al., 2019).
Transcriptomic data on developmental stages and different tissues/cell types of fruits are also
available since 2018 (Shinozaki et al., 2018) in the TEA database (Tomato Expression Atlas,
http://tea.solgenomics.net/). To better visualize and explore multiple levels of tomato fruit data
mentioned above, an online tool named ePlant (http://bar.utoronto.ca/eplant_tomato/) was
constructed by Waese et al. (2017). It enables the exploration of subcellular prediction of encoded
proteins, transcript levels in different tissues, genome position, sequences etc., thus facilitating
data mining and function predicting for many genes. To predict the protein abundance according
to the transcript level, a model was built by Belouah et al.(2019) to extract information of protein

Part I-Introduction
49
abundance and destiny from transcript levels. The model for the translation of a protein predicted
the median values of ∼2 min, and a protein lifetime of ∼11 days. Hence, protein concentration is
more strongly affected by the rate of translation than that of degradation. It underpins the prediction
of protein level based on transcript regardless the dilution effect of fruit growth or the unknown
regulation mechanisms.
The subcellular information can be very useful too, as transient starch is synthesized and degraded
in plastids. Hence for some proteins, such as BAM members BAM7 and BAM8, the location is
not in plastid but in nucleus, implying that they do not directly participate in starch granule
attacking like the other members (BAM1 and BAM3), more likely playing as indirect regulators
(Reinhold et al., 2011).
After integrating all the available information and useful references, genetic engineering methods
described above can be used to manipulate the candidate genes in vivo, followed by characterizing
of the derived phenotypes to dissect the functions of those genes in fruit starch metabolism.
1.3.4 Aims and Strategies for the Thesis
In many fruits such as banana, kiwifruit and apple etc., starch, as carbohydrate reservoir, provides
carbon and energy during fruit growth, and contributes to large amount of sugar at ripening.
Additionally, previous studies of the Meta group (Biais et al., 2014; Colombié et al., 2017)
suggested that starch plays a buffering role under mild stressed environment (shading and water
stress) in tomato fruit, and that its degradation enhances respiration during ripening. Although
starch plays important roles in fruit, we know little about its metabolism and regulation in fruit.
We used tomato (var. Micro-Tom) as a model for studying starch metabolism and possible
regulations, as it accumulates considerable amount of starch during fruit growth, and is easier for
bioengineering manipulation than other starchy fruits (banana, kiwifruit, apple, etc.).
The success of a series of starch mutants (sex, sex4…) in Arabidopsis encouraged us to take
advantages of the big EMS mutant population of Micro-Tom in our unit (BFP, Bordeaux) to also
apply forward genetics for screening novel starch mutants in tomato. At the same time, as starch
metabolism shows large diversifications for different tissues and species, we took prior knowledge

Part I-Introduction
50
as references to select candidate genes that may play important roles in starch degradation, to
generate starch mutant via reverse genetics.
With those two strategies, we aimed at finding mutants accumulating abnormal amount of starch,
and identifying the causal mutations, and study the functions of responsible candidate genes or
regions to reveal novel mechanisms of starch metabolism and regulation. We also aimed at
generating new starch mutants to provide new understanding of how starch participating in fruit
growth and ripening.
Fig 7 The schematic presentation of the strategies and aims of thesis
First Screening
Second Screening
Mutant and WT-like Bulk
1
Sequencing
Candidate mutations 1
KO (CRISPR/Cas9) or down/up regulation
of candidate genes in WT plants
Mutants
Characterizations
WT of Micro-Tom
Metabolite profiles of fruits at
development stages
Model Verification
F1 S1 and WT
(Mendelian inheritance analysis)
Phenotyping
Genotyping
Bioengineering
Investigate transcript/protein/metabolism
aspects to see how causal mutations
cause mutant phenotypes
Functional studies
BC1F2 (more than 200p plants)
Map the sequencing
results to Heinz genome
Fine mapping
Output/Input
Output/Input
Output/Input Causal mutation/mutants with
starch-related phenotypes 1
Forward genetics
Reverse genetics
Starch Mutants 1
Constraint-based Modelling 1
Metabolite profiles of fruits at
development stages

Results

Part II-Results
52

Part II-Results
53
Chapter2 Screen for Novel Starch Mutants
in Tomato (var. Micro-Tom) Fruits
2.1 Introduction
As introduced in Chapter 1, starch is an important reservoir of carbon and energy for fruit
development (reviewed by Roch et al., 2019), contributing to final sugar accumulation and central
metabolism of fruits, and also affecting postharvest qualities (brix, shelf storage etc.) (Schaffer
and Petreikov, 1997; Centeno et al., 2011; Nardozza et al., 2013). Besides, it buffers the
environmental changes during fruit growth and may associate with climacteric respiration at
ripening (Biais et al., 2014; Colombié et al., 2017). However, little is known about starch
metabolism in fruit.
Encouraged by the success of a series of starchless or starch-excess (sex) mutants of Arabidopsis
(Caspar et al., 1985; Lin et al., 1988; Zeeman et al., 1998), we applied forward genetics to screen
for starch related mutants in tomato fruit. In this chapter, we used a highly mutated tomato
population (EMS mutant population of Micro-Tom, Just et al., 2013) and robust and high
throughput biochemical phenotyping, and then guided by a previous developed method based on
second-generation sequencing for mapping (so-called mapping-by-sequencing, Garcia et al., 2016)
for searching the causal mutations. After screening nearly 6000 mutant individuals, we selected 3
starch-excess mutants, and then performed Mendelian inheritance analysis for those three. We
selected one homozygous mutant P17C12 with a recessive starch-excess phenotype to be further
mapped. The procedures and results of the whole screening, confirmation and mapping are
presented here.

Part II-Results
54
2.2 Materials and Methods
Plant Material
Experiments were performed on a dwarf determinate tomato cultivar cv. Micro-Tom. At INRAE
Bordeaux, a highly mutagenized EMS (ethyl methanesulfonate) collection of Micro-Tom has been
developed as described by Just et al. (2013). Briefly, seeds of Micro-Tom were treated with 1%
EMS as described by Okabe et al. (2011). Treated seeds were sown and mutant plants were
cultivated in the greenhouse to produce mutated seeds. This first batch of mutated seeds was pooled
and submitted to a second 1% EMS treatment, in order to increase the mutation frequencies. The
seeds of the second round of EMS treatment were cultivated and leaves were harvested on each
single mutant plant for DNA extraction and stored at -80°C in 96 well microplates. Thus, the plate
number and the position on the plate give the name of a single mutant plant corresponding to one
EMS treated seed. For example, the mutant in plate 17, row C, column 12, was named P17C12,
and all the seeds harvested from this plant, are sorted as progenies from one family, P17C12.
During the 2012–2013 period, 500 mutant families of the EMS Micro-Tom population and WT
plants with 12 plants per genotype have been cultivated in the green house (Bournonville, 2015),
the whole representing about 6000 plants. Fruits at ripening stage (3–4 fruits per plant) were
harvested, ground in liquid nitrogen and stored at -20°C until used for specific assays. Thereafter,
A. Mirto (PhD 2016 Caserta University-Italy), in the frame of an ERASMUS exchange program,
stayed at UMR BFP in two periods (2015–2016) during which he screened samples of 250 families
for differences soluble sugars (glucose, fructose, sucrose) and/or starch (corresponding to mutants
in plates P17, P20 and P21). This investigation allowed selecting 11 mutant families displaying
altered starch and/or sugar contents compared to WT fruits. In order to confirm these phenotypes,
12 plants of each of the 11 selected families and WT were grown again in 2016. This time fruits
at the immature green (IMG), breaker (Br), and red ripe (RR) stages were collected and assayed
for metabolite contents. Regarding starch levels, only three over the 11 families displayed a
significant increase in IMG and RR fruits. The work described above was a part of A. Mirto PhD
study.

Part II-Results
55
Methods
Greenhouse Settings, Plant Growth Conditions and Management
The greenhouse settings and tomato growth conditions are described in detail by Rothan et al.
(2016). In brief, plants were grown under a long day photoperiod with 15 h/9 h day/night.
Temperature settings were 18°C during the night and 23°C during the day. During the day, if
natural irradiance was decreased below 4000 lux, supplemental lighting would be provided, and if
natural irradiance was too high (more than 450 W/m2), a shading screen would be unrolled over
the plant culture. The relative humidity was generally set at around 70%.
Since Micro-Tom is a cultivar with poor self-pollination ability, it is necessary to perform manual
pollination, otherwise most of flowers would abort or this might result in an abnormal fruit
development leading to small and seedless fruits. Therefore, at anthesis (fully open flower),
manual pollination of the flower was carried out using the tip of an electric toothbrush device. The
flower was then tagged at its petiole using a straw ring dated at the pollination day, hence allowing
to harvest fruits at exact developmental stages defined as days after pollination (DAP). In order to
reduce source/sink competition between trusses and to allow optimal fruit development, when the
first three fruits started to develop on the first two trusses (total of 6 to 8 fruits per plant), the extra
flowers as well as the extra inflorescences were removed.
Seeds were obtained from fruits harvested at the red ripe stage. After removing the outside locular
tissue, they were treated with a hypochlorite solution at 2.5% of active chloride for 15 min and
then rinsed with water three times for 10 min to eliminate the remaining active chloride, and placed
under a hood overnight to get dry. Dry seeds are stored in paper bags at 8–10°C in the presence of
a desiccant to prevent rehydration.
Analysis of Sugar and Starch Contents
For the extraction of sugars and starch, 96-well micronic tubes™ equipped with screw cap and
silicon-O-ring were used. About 15 to 25 mg fresh powder of tomato fruit pericarp was weighted
precisely. A batch of analysis consisted of 6 aliquots as biological standards, which were used on
every batch of a given experiment, 6 blanks (without sample), and 84 randomly placed tubes with

Part II-Results
56
samples, for a total of 96 wells. The map of the plate was recorded (sample names and powder
weight) for calculations.
Extraction of sugars: This extraction is robotized using a designed Robot (Hamilton Microlab
STAR Liquid Handling System), allowing the extraction of 4 plates in 4 hours. The protocol was
as follows. The first extraction was carried out with 250 µL 80% v/v ethanol and HEPES/KOH 10
mM (pH6) added to all tubes that were shaken for 30 sec. Then plates were moved to an incubator
at 80C for 20 min, followed by a centrifugation step at 5,000 rpm for 10 min. The robot transferred
the first supernatant (S1) into new tubes. The second extraction was carried out with 150 µL 80%
v/v ethanol and followed the same steps to obtain the second supernatant (S2), which was pooled
to S1. The third extraction was carried out with 250 µL of 50% v/v ethanol and the supernatant S3
was pooled to S1 and S2 (in total 650 µL), and finally stored at -20C for metabolite assays.
Extraction of starch: starch, which is insoluble in 70% or 50% ethanol, is contained in the pellet
left following the ethanol fractionation. For that reason, the pellet was re-suspended in 400 µL
NaOH (0.1 M) and vigorously mixed, and then incubated at 90C for 30 min. The extract was then
neutralized before adding degradation enzymes whose optimal pH is 4.9. After adding 80 µL
neutralization mix (acetate/NaOH, 0.1 M, pH=4.9, plus HCl 0.5 M), it was necessary to check the
pH, which should be around 4 to 5. Then we added 100 µL of starch degradation mix per sample,
which contained amyloglucosidase (100 U/mL) and α-amylase (140 U/mL) in 50 mM
acetate/NaOH buffer (pH=4.9), to reach the final volume 580 µL. The plates were incubated at
37C for 10 to 16 hours to reach full degradation.
Determination of glucose and fructose: The method used for the determination of hexose was
adapted from Stitt et al. (1989) for robotic analysis. The assay solution contained HEPES buffer
(0.1 M HEPES/KOH, pH 7.0, with MgCl2 3 mM), ATP (3 µM), NADP (1.4 µM), and G6PDH
(grade II, 3.4 U/mL). A pipetting robot was used to transfer solutions into a 96-well microplate,
and each well was filled with 10 to 50 µL of the supernatant (S1+S2+S3) and 160 µL of
determination mix. The plate was then placed in a SAFAS MP96 microplate reader and the reaction
was measured at 340 nm and at 37°C (1 reading per min). Enzymes were added successively, as
following (once OD stabilized): (1) 1 µL hexokinase (900 U/mL solution in 0.1 M HEPES/KOH

Part II-Results
57
buffer) for measuring glucose; (2) 1 µL phosphoglucose isomerase (1000 U/mL solution in 0.1 M
HEPES/KOH buffer) for measuring fructose.
Fig 8 Principle of the determination of hexoses (Adapted from Roch, 2018)
Firstly, glucose is catalyzed by HK (hexokinase) and G6PDH to produce NADPH, which can be
detected at 340 nm with SAFAS MP96 microplate reader. The enzyme PGI (phosphoglucose
isomerase) is then added to the mixture to convert F6P (fructose 6-phosphate) to G6P (glucose 6-
phosphate) for the measurement of fructose.
Determination of starch: starch was degraded into glucose as mentioned above (section of
“Extracting of starch”), then centrifuged the micronic tubes and used 10–50 µL to measure glucose
as described above.
Calculations:
For NADPH:
𝑁𝐴𝐷𝑃𝐻 𝜇𝑚𝑜𝑙 =𝛥𝑂𝐷
𝜀 𝑙′=
𝛥𝑂𝐷
6.22 2.85 𝜇𝑚𝑜𝑙
ε = 6.22 mL·mol-1·cm-1, extinction coefficient of NADPH at 340 nm.

Part II-Results
58
l’= 2.850 cm·mL-1, was calculated by a standard curve produced by measuring ∆OD with a series
of known concentrations of NADH with the microplate we used in the experiments.
For hexoses:
𝜇𝑚𝑜𝑙 · 𝑔𝐹𝑊−1 =𝛥𝑂𝐷
6.22 2.85𝜇𝑚𝑜𝑙
650 𝜇𝐿
𝑋 𝜇𝐿 𝑠𝑢𝑝𝑒𝑟𝑛𝑎𝑡𝑎𝑛𝑡
1000
𝑌 𝑚𝑔 𝑓𝑟𝑒𝑠ℎ 𝑤𝑒𝑖𝑔ℎ𝑡
In the formula, 650 L is the total solution volume for hexose extraction per sample. X L is the
volume used for hexose measurement, normally from 10 L to 50 L. Y mg is the amount of each
sample used for hexose extraction which was recorded at preparation procedures. Multiplying by
1000 is to convert units from mg to g.
For starch:
𝜇𝑚𝑜𝑙 𝐺𝑙𝑢𝑐𝑜𝑠𝑒 𝐸𝑞𝑢𝑖𝑣𝑎𝑙𝑒𝑛𝑡. 𝑔𝐹𝑊−1
=𝛥𝑂𝐷
6.22 2.85𝜇𝑚𝑜𝑙
580 𝜇𝐿
𝑋 𝜇𝐿 𝑠𝑢𝑝𝑒𝑟𝑛𝑎𝑡𝑎𝑛𝑡
1000
𝑌 𝑚𝑔 𝑓𝑟𝑒𝑠ℎ 𝑤𝑒𝑖𝑔ℎ𝑡
In the formula, 580 L is the total solution volume for starch extraction per sample. X L is the
volume used for starch (converted into glucose) measurement, normally from 10 L to 50 L. Y
mg is the amount of each sample used for starch extraction which was recorded at preparation
procedures. Multiplying by 1000 is to convert units from mg to g.
Apply Mapping-by-sequencing for Starch-excess Mutant P17C12
In 2017, from June to September, 200 individuals of BC1F2 (self-pollinated offspring of BC1F1)
of P17C12 as well as 12 individuals of P17C12 S2 (second generation of self-pollination), 12
plants of BC1F1 (backcross with WT once) and 12 WT plants were cultured. For each plant, the
pericarp of 3 fruits was sampled at 20 DAP and 35 DAP. Starch and sugars were measured as
described above. According to the results obtained for starch at 20 DAP and 35 DAP, ~30 plants
with fruit showing a starch-excess phenotype at 20 DAP were selected for the mutant-like bulk,
and ~30 plants with a WT-like fruit starch phenotype were selected for the WT-like bulk. For each
bulk, 5 leaf disks of 5 mm in diameter were taken using a cork borer from each selected plant, then

Part II-Results
59
pooled into 2 segregate 50 mL tube to extract DNA, as described previously by Garcia et al. (2016).
Later, DNA quality and integrity were controlled by using an agarose-gel and Nanodrop.
The DNA samples obtained for the two bulks were sent to the GeT-PlaGe sequencing platform
(Genotoul, Toulouse) to perform Illumina HiSeq2000 sequencing with a depth of ~20–40×. Before
sequencing, quality was checked by fluorometric measurement with the Quant-iT dsDNA Assay
Kit. The sequencing data was analysed following the steps described and well-documented by
Garcia et al. (2016). In brief, the Heinz 1706 tomato genome sequence (SL3.0) was used to map
the raw reads of the mutant- and WT-like bulks of P17C12 by using the BWA v0.7.15 aligner.
Then we used SAMtools v1.3.1 to perform variant calling for the two bulks, generating output .vcf
files of total variants. Additionally, to filter the natural polymorphisms between Heinz 1706 and
Micro-Tom, the sequencing and mapping of Micro-Tom WT plants were required as a control. To
analyse the remaining EMS variants, an in-house Python script was developed to compare the
variants for each bulk and generate SNP files (1), calculate the variant allelic frequencies for each
bulk (2), indicate the variants present in the Micro-Tom WT line (3) and indicate the localizations
in tomato genes according to the Heinz 1706 genome annotation. When obtained only EMS
mutations, to specifically identify the causal mutation, two filtering parameters were further
considered: the read depth that should be between 10 to 100 to remove false-positive variants, and
allelic frequency that expected for a recessive mutation in two bulks (for mutant-like bulk it tends
toward 1, and for WT-like bulk it tends toward 0.33).
Fine Mapping
For recombinant analysis, the plant material was obtained from the same BC1F2 culture of P17C12.
However, instead of pooling the leaves of the selected plants for the bulk construction, this time
leaves for each plant were harvested individually and placed in 96-well plates for large-scale
analysis. DNA extraction and quality control were carried out as described above. The SNP
markers of EMS mutations were used to genotype the BC1F2 populations. The Kompetitive Allele
Specific PCR (KASP) assay was used to detect the homozygous WT, homozygous mutant or
heterozygous at different EMS mutation loci (LGC Genomics; http://www.lgcgroup.com/our-
science/genomics-solutions/genotyping/). All the primers were designed with the Batch-Primer3
software and are listed in Table 4.
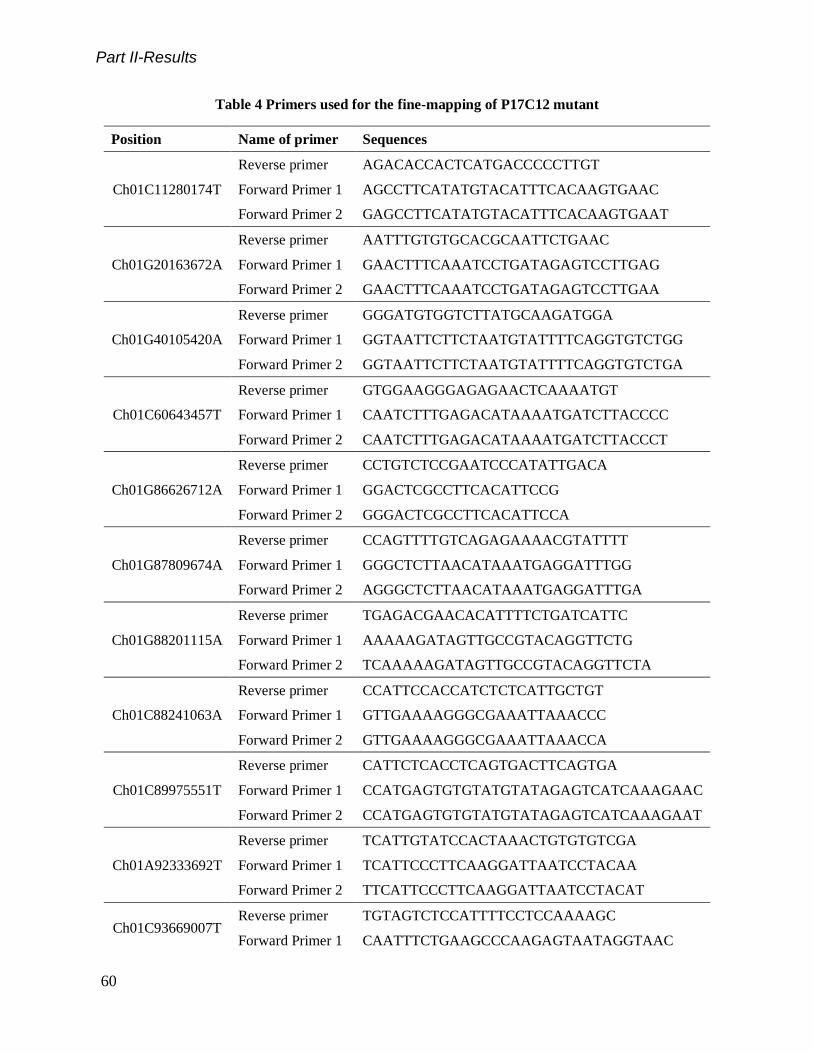
Part II-Results
60
Table 4 Primers used for the fine-mapping of P17C12 mutant
Position Name of primer Sequences
Ch01C11280174T
Reverse primer AGACACCACTCATGACCCCCTTGT
Forward Primer 1 AGCCTTCATATGTACATTTCACAAGTGAAC
Forward Primer 2 GAGCCTTCATATGTACATTTCACAAGTGAAT
Ch01G20163672A
Reverse primer AATTTGTGTGCACGCAATTCTGAAC
Forward Primer 1 GAACTTTCAAATCCTGATAGAGTCCTTGAG
Forward Primer 2 GAACTTTCAAATCCTGATAGAGTCCTTGAA
Ch01G40105420A
Reverse primer GGGATGTGGTCTTATGCAAGATGGA
Forward Primer 1 GGTAATTCTTCTAATGTATTTTCAGGTGTCTGG
Forward Primer 2 GGTAATTCTTCTAATGTATTTTCAGGTGTCTGA
Ch01C60643457T
Reverse primer GTGGAAGGGAGAGAACTCAAAATGT
Forward Primer 1 CAATCTTTGAGACATAAAATGATCTTACCCC
Forward Primer 2 CAATCTTTGAGACATAAAATGATCTTACCCT
Ch01G86626712A
Reverse primer CCTGTCTCCGAATCCCATATTGACA
Forward Primer 1 GGACTCGCCTTCACATTCCG
Forward Primer 2 GGGACTCGCCTTCACATTCCA
Ch01G87809674A
Reverse primer CCAGTTTTGTCAGAGAAAACGTATTTT
Forward Primer 1 GGGCTCTTAACATAAATGAGGATTTGG
Forward Primer 2 AGGGCTCTTAACATAAATGAGGATTTGA
Reverse primer TGAGACGAACACATTTTCTGATCATTC
Ch01G88201115A Forward Primer 1 AAAAAGATAGTTGCCGTACAGGTTCTG
Forward Primer 2 TCAAAAAGATAGTTGCCGTACAGGTTCTA
Reverse primer CCATTCCACCATCTCTCATTGCTGT
Ch01C88241063A Forward Primer 1 GTTGAAAAGGGCGAAATTAAACCC
Forward Primer 2 GTTGAAAAGGGCGAAATTAAACCA
Ch01C89975551T
Reverse primer CATTCTCACCTCAGTGACTTCAGTGA
Forward Primer 1 CCATGAGTGTGTATGTATAGAGTCATCAAAGAAC
Forward Primer 2 CCATGAGTGTGTATGTATAGAGTCATCAAAGAAT
Ch01A92333692T
Reverse primer TCATTGTATCCACTAAACTGTGTGTCGA
Forward Primer 1 TCATTCCCTTCAAGGATTAATCCTACAA
Forward Primer 2 TTCATTCCCTTCAAGGATTAATCCTACAT
Ch01C93669007T Reverse primer TGTAGTCTCCATTTTCCTCCAAAAGC
Forward Primer 1 CAATTTCTGAAGCCCAAGAGTAATAGGTAAC

Part II-Results
61
Forward Primer 2 CAATTTCTGAAGCCCAAGAGTAATAGGTAAT
Reverse primer TGGTGAATACATTTATCCTATTTTGAACC
Ch01T96712294A Forward Primer 1 CTCATGTATGGAATAATCCATGTGGCT
Forward Primer 2 CATGTATGGAATAATCCATGTGGCA
Ch01C96794828T
Reverse primer TCGGAATCGGTATAAACCGATACCG
Forward Primer 1 GAAATGGAACGAAATCGAGATTTGAC
Forward Primer 2 GAAATGGAACGAAATCGAGATTTGAT
Note: The position of the mutation was indicated like Ch01C11280174T, meaning that it is in
chromosome 1, at the position 11280174 (aligned with SL3.0) with a mutation from C (cytosine)
to T (thymine). According to the methods of KASP, we used different 5’ reported dyes to indicate
the alleles for each tested individual (homozygous mutant alleles or WT alleles, or heterozygous
alleles). We used FAM™ dye to indicate the WT allele, a tail (or a probe) with sequence “5’-
GAAGGTGACCAAGTTCATGCT-3’ ” would be attached to the 5’ end of Forward Primer 1. To
indicate mutant allele, VIC® dye was chosen by adding tail with sequence “5’-
GAAGGTCGGAGTCAACGGATT-3’ ” to the 5’ end of Forward Primer 2.
2.3 Results
First Screening for Mutants with Starch- and Hexose-excess Fruits
Fruit powder from nearly 250 families of three groups (P17, P20 and P21) have been used to detect
mutants displaying abnormal starch accumulation. For all the cultures performed during spring,
summer and autumn seasons, WT plants which were randomly placed among the mutant plants
were used as controls. For each plant, the pericarp of three red ripe fruits was sampled to assay
starch and major soluble hexoses (glucose and fructose). It is noteworthy that for the three groups
of WT plants used here, starch measured at red ripe stage was very low, but with a relatively large
SD value (0.36 1.34). This clearly indicated that in red ripe tomato fruit starch has been almost
totally degraded, but displayed a large variation in this culture season (Fig 9 A). The big variations
were also observed in glucose and fructose contents in those mutants (Fig 9 B, C).
Among the mutant plants displaying higher levels of starch or hexoses, 3 families were selected:
P17C12, P21C7 and P21H6. A subsequent culture was performed with 12 plants for each of those
3 families to confirm the phenotypes.

Part II-Results
62
Fig 9 Concentrations of starch (A), glucose (B) and fructose (C) in screened tomato fruits
The red ripe fruits of nearly 6000 EMS mutant plants belonging to three groups (P17, P20 and P21)
were used for measuring starch and hexose contents in pericarps to screen for starch mutants. Data
are presented for each individual.

Part II-Results
63
Second Screening for Confirmation of Three Mutant Families
In the second screening of the P17C12, P21C7 and P21H6 mutant families, mature leaves and
fruits at two developmental stages were individually collected from the 12 plants of each family
to better characterize the starch and hexose phenotypes.
Fig 10 Concentrations of starch (A) and hexoses (B) during fruit ripening of mutants and WT
Mean values (µmol glocose.eq.g-1 FW for starch, and µmol g-1 FW for hexoses) are given with SD
(n=3). Abbreviations: L, leaf; IMG, immature green; Br, breaker; RR, red ripe.

Part II-Results
64
In general, starch levels found in mature leaves of the mutants were comparable to WT, indicating
that the mutations did not affect leaf starch metabolism. In contrast, among the 12 plants cultured
for each family, two P17C12, three P21C7 and one P21H6 plants produced fruits with higher starch
content (Fig 10) than that in the WT, whatever the stages. In WT, starch levels decreased sharply
from 19.7 1.4 at immature green (IMG) stage to 2.6 0.2 at breaker and then to almost nil (i.e.
0.29 0.02) at red ripe. In the mutants, the starch content followed the same pattern. The IMG
fruits of the P17C12, P21C7 and P21H6 plants displayed the highest difference with around 2- to
5-times more starch than in the WT. This difference remained significant at breaker stage and also
at red ripe stage even though starch levels were much lower than at IMG stage.
In contrast to starch, the hexose concentrations of mutant fruits displayed no significant difference
with the WT at IMG stage. Nevertheless, for the P21C7-6 plant, the hexose content was strongly
increased at RR, with 70.9% and 48.5% more glucose and fructose, respectively. According to
their higher starch accumulation at IMG and breaker stages, three individual plants, namely
P17C12-6, P21C7-9 and P21H6-11, were used for self-pollination and back-crossing with the WT.
Mendelian Inheritance of the Mutations Affecting Starch
The first progeny of back-cross between mutant and WT was called BC1F1, while the first progeny
of mutant from a self-pollination was called S1. The fruit samples were harvested at two stages,
immature green stage around 20 days after pollination (DAP), and red ripe stage, to measure starch
and hexose content.
For the P17C12 mutant, IMG fruits of S1 plants had about 2 times higher starch content than the
WT fruits (Fig 11), while BC1F1 fruits showed no significant difference compared with the WT.
For hexoses, IMG fruits from BC1F1 and S1 of P17C12 were comparable to the WT. At red ripe
stage, the starch content was higher in P17C12 S1 fruits than in WT fruits, but the difference
between S1 and WT was less significant than at IMG stage. In contrast, remarkable differences
were found for hexose contents, as S1 red ripe fruits contained 2 to 3 times more fructose and 3
times more glucose than the WT. Starch and hexose contents were similar in red ripe fruits of
BC1F1 of P17C12 and WT plants. At this stage we could conclude that: firstly, as BC1F1
progenies produced fruits displaying starch and hexose contents similar to the WT, the causal

Part II-Results
65
mutation of the P17C12 mutant should be recessive; secondly, since all the fruits of the S1
progenies displayed higher starch content at IMG stage, and higher hexose contents at red ripe
stage, the parent P17C12 was homozygous regarding the mutation responsible for the
corresponding phenotypes.
In addition to the starch-excess phenotype found in fruit, the P17C12 mutant showed other
phenotypes, such as poor fertility leading to limited numbers of fruits, small fruits with few seeds
and thicker pericarp, and relatively taller plants. However, we have no idea about how those
phenotypes associated together. Those phenotypes also reminded us that starch-excess phenotype
may be one of many consequences other than the only and direct consequence of the mutation.
Unlike the P17C12 mutant, BC1F1 and S1 plants of the P21C7 and P21H6 mutants exhibited large
fluctuations of starch and hexose contents that were reflected by large SD values (Fig 12 and Fig
13), suggesting that the mutants selected to produce F1 and S1 were not homozygous. Compared
to P17C12, the other two mutants, P21C7 and P21H6 were more ambiguous. The possible
explanation is that we planted 12 plants for S1, BC1F1 and WT plants, which was a small
population, hence it may not be enough for observing a clear segregation, especially considering
the fact that the starch amount fluctuates even in WT fruits (as described before). They may be
heterozygous dominant mutants of starch phenotype in fruits, but it requires a new culture
including more plants for each group to confirm.
As the P17C12 mutant showed clear homozygous recessive phenotypes, it was selected to apply
the mapping-by-sequencing strategy, and to generate a BC1F2 population from the BC1F1 plants
mentioned above, and thereafter to determine the segregation of the starch-excess phenotype and
constructing bulks for sequencing.

Part II-Results
66
Fig 11 Concentrations of starch and hexoses in immature green and red ripe fruits of S1, F1
plants of P17C12 and WT plants
A. Concentrations of starch in immature green fruits of S1, F1 plants of P17C12 and WT plants
B. Concentrations of hexoses in immature green fruits of S1, F1 plants of P17C12 and WT plants
C. Concentrations of starch in red ripe fruits of S1, F1 plants of P17C12 and WT plants
D. Concentrations of hexoses in red ripe fruits of S1, F1 plants of P17C12 and WT plants
Abbreviations: BC1F1, the first generation of the plant (BC1F1) back-crossed with the WT parent;
S1, the first generation of plants from self-pollinated mutant; WT, wild type plants.

Part II-Results
67
Fig 12 Concentrations of starch and hexoses in immature green and red ripe fruits of S1, F1
plants of P21C7 and WT plants
A. Concentrations of starch in immature green fruits of S1, F1 plants of P21C7 and WT plants
B. Concentrations of hexoses in immature green fruits of S1, F1 plants of P21C7 and WT plants
C. Concentrations of starch in red ripe fruits of S1, F1 plants of P21C7 and WT plants
D. Concentrations of hexoses in red ripe fruits of S1, F1 plants of P21C7 and WT plants
Abbreviations: BC1F1, the first generation of the plant (BC1F1) back-crossed with the WT parent;
S1, the first generation of plants from self-pollinated mutant; WT, wild type plants.

Part II-Results
68
Fig 13 Concentrations of starch and hexoses in immature green and red ripe fruits of S1, F1
plants of P21H6 and WT plants
A. Concentrations of starch in immature green fruits of S1, F1 plants of P21H6 and WT plants
B. Concentrations of hexoses in immature green fruits of S1, F1 plants of P21H6 and WT plants
C. Concentrations of starch in red ripe fruits of S1, F1 plants of P21H6 and WT plants
D. Concentrations of hexoses in red ripe fruits of S1, F1 plants of P21H6 and WT plants
Abbreviations: BC1F1, the first generation of the plant (BC1F1) back-crossed with the WT parent;
S1, the first generation of plants from self-pollinated mutant; WT, wild type plants.
Starch Accumulation in WT Fruits during Development
I found that the starch content of WT fruits at IMG was 2 times higher (~50 µmol.glucose.eq.g-1
FW) without fruit thinning than previously measured by A. Mirto (~25 µmol.glucose.eq.g-1 FW).
In order to perform a solid and precise phenotyping of the P17C12 BC1F2 big population, I firstly
examined starch content in development stages of WT plants from March to June of 2017. I

Part II-Results
69
cultivated nearly 20 WT plants and designed a series of harvesting through the whole development
of tomato fruits, with a sampling gap of 5 to 7 days. As fruits at 6 DAP are too small (~0.2 g), only
3 samples with numerous fruits were collected. After harvesting 6 DAP fruits, I did fruit thinning
to keep 6–8 fruits per plant, then marked the flowers when they were pollinated. For the other fruit
stages, I harvested at least 3 fruits per sample and 5 samples per stage.
With all the controls mentioned above, for fruits of Micro-Tom plants grown under optimal growth
conditions, the starch content in the pericarp reached a very high level (~135 µmol.glucose.eq.g-1
FW) at 16 DAP (Fig 14 B), then decreased until the red ripe stage to reach nearly zero. Fruits from
28 DAP to 42 DAP showed a sharp decrease in starch. In contrast to the big variation in starch
content during fruit development, the contents of glucose and fructose were relatively stable; they
started to increase after 35 DAP in parallel, when starch was quickly decreasing.

Part II-Results
70
Fig 14 Starch and hexose contents in development fruits of Micro-Tom WT plants
A. Fruits harvested in different development stages of Micro-Tom WT plants;
B. Starch and hexose contents in development fruits of WT plants.
Mean values (expressed as µmol.glucose.eq.g-1 FW for starch content or µmol.g-1 FW for hexose
content) are given with SD. Pericarp of fruits were harvested from 6 days after pollination (DAP)
to 50 DAP with at least 3 samples per stage.
Culture of the BC1F2 Population of P17C12 for Performing the Mapping-
by-sequencing
Before cultivating a large number of BC1F2 plants, we cultivated a small BC1F2 population of 24
plants to check if the starch-excess phenotype reappeared in this generation, which would indicate
0
40
80
120
160
6 DAP
11 DAP
16 DAP
22 DAP
28 DAP
35 DAP
42 DAP
50 DAP
Starch
Glucose
Fructose
Sta
rch
and
hexo
se
con
tent
Fruits at different development stages
B
6 DAP11 DAP
16 DAP22 DAP
28 DAP35 DAP
42 DAP50 DAP
A
A

Part II-Results
71
the segregation of the mutant phenotype. After observing that ~5 plants showed a 1.5-times higher
level of starch than WT control plants, we confirmed there was a segregation of the starch-excess
trait in the BC1F2 population of P17C12. Then, I carried out a culture of 200 BC1F2 plants of
P17C12, as well as 12 plants for WT, BC1F1 and S2, as controls. To optimize the source-sink
relationship, flower- and fruit-thinning were performed to limit the fruit number to about 6 to 8
per plant. In order to know the exact stage of the fruits, as well as to be able to compare the mutant
fruit with the WT, the flowers were marked at anthesis (i.e. after having been pollinated with a
vibrating electric toothbrush). This allowed to sample the fruits at 20 and 35 DAP more accurately,
and thus to reduce the fluctuation of the starch content, as starch varies quite dramatically along
fruit growth and development. I decided to sample the fruits at 35 DAP instead at red ripe stage,
because I observed that in the 35 DAP fruit of the P17C12 mutant, the starch content was still high,
probably resulting from more synthesis of starch at IMG stage or a delay in the remobilisation of
starch, which occurred at the beginning of ripening. The differences of starch content at 35 DAP
between mutants and WT were more significant than that at red ripe stage (Fig 15 D), thus those
remarkable differences could be considered as part of the starch-excess phenotype of P17C12
mutant, further to provide additional information to help us distinguish WT-like and mutant-like
plants.
For the 20 DAP fruits of control plants, S1 plants had higher starch amount, while those from the
BC1F1 plants displayed similar starch content to WT (Fig 15 B). Similar results were also
observed in the analysis of Mendelian inheritance of P17C12 (Fig 11), indicating that the
homozygous starch-excess phenotype was reproducible in different cultures.
The analysis of the large BC1F2 population showed that the starch amount at 20 DAP displayed a
normal distribution (Fig 15, A). The average amount of starch for the whole BC1F2 plants at this
stage was 129 31 (µmol.glucose.eq.g-1 FW), there were 37 over 200 plants that had fruits with
starch levels higher than 159 µmol.glucose.eq.g-1 FW, which was equal to mean + 1 SD, while
nearly half had starch level less than the mean (129 µmol.glucose.eq.g-1 FW). This normal
distribution of starch amount in fruits at 20 DAP implied that the trait we were interested in maybe
a QTL trait, other than Mendelian trait, which showed more clearly when we examined starch
content in a big population. It is interesting to notice that fruits from the F1 contain 20% more

Part II-Results
72
starch than the WT in a significant manner, thus suggesting that the phenotype is not strictly
recessive.
Fig 15 Starch levels in mature green fruits of a population of 200 individuals of P17C12
BC1F2 and in controls
A. Distribution of starch levels in 20 DAP fruits of the P17C12 BC1F2 population.
B. Starch levels in 20 DAP fruits of P17C12 S2, F1 and WT plants.
C. Distribution of starch levels in 35 DAP fruits of the P17C12 BC1F2 population.
D. Starch levels in 35 DAP fruits of P17C12 S2, F1 and WT plants.
Abbreviations: F1, the first generation of progeny for back-crossed (BC1) with the WT genotype
plants; S2, the second generation of progeny for self-pollinated mutant; WT, wild type; DAP, days
after pollination. Asterisks indicate significant differences (Student’s t test, P<0.01); ns, no
significance.

Part II-Results
73
For the 35 DAP fruits, starch content in the BC1F2 plants was not normally distributed (Fig 15 C).
Furthermore, as expected, S2 plants had a delay in starch degradation, which resulted in a higher
difference compared to F1 and WT fruits. However, the delay varied, as for some S2 plants starch
content at 35 DAP was as high as that at 20 DAP, and for others it was only 50%. This variation
found within the S2 population may be the reason for such a non-normal distribution of starch
amount of BC1F2 at 35 DAP.
For the construction of two bulks, the starch data obtained for 20 DAP fruits was used as the main
reference regarding S2, F1 and WT plants. For the starch-excess bulk, we selected the plants
bearing the fruits with the highest starch levels (i.e. as in fruits of S2 plants), and for the WT-like
bulk, we chose the plants bearing fruits with starch levels similar to the WT and F1 plants. For
each bulk, 30 to 40 plants were selected. At the same time, the level of starch at 35 DAP was used
as complementary information to filter out some bias plants. The plants and the corresponding
starch results for two stages are listed in Table 5. After preparing the two bulks as described in
Chapter 2.2, DNA samples were sent to Toulouse-GeT-PlaGe sequencing platform to perform the
sequencing.
Table 5 The plants selected for constructing 2 bulks
Bulk Plant Starch at
20 DAP
Starch at
35 DAP
Mutant 3 172.1 190.2
Mutant 13 176.5 91.4
Mutant 17 175.6 108.2
Mutant 18 171.0 122.7
Mutant 20 164.5 18.7
Mutant 22 166.3 75.7
Mutant 25 185.4 109.9
Mutant 31 189.8 44.5
Mutant 36 153.7 83.6
Mutant 48 187.4 59.2
Mutant 51 210.4 32.8
Mutant 53 196.1 108.6

Part II-Results
74
Mutant 56 162.1 62.8
Mutant 58 167.7 53.0
Mutant 60 176.3 89.7
Mutant 72 170.9 58.0
Mutant 80 159.1 59.3
Mutant 94 184.7 55.5
Mutant 98 152.0 100.8
Mutant 104 178.5 75.7
Mutant 115 164.3 57.7
Mutant 119 185.3 50.4
Mutant 122 170.5 49.5
Mutant 125 177.3 13.3
Mutant 126 167.2 30.9
Mutant 134 174.1 NA
Mutant 140 169.3 90.4
Mutant 150 169.6 65.1
Mutant 151 181.0 32.0
Mutant 153 163.0 61.1
Mutant 156 159.4 69.7
Mutant 158 160.6 64.8
Mutant 167 179.2 46.3
Mutant 170 192.0 NA
Mutant 185 181.7 NA
Mutant 188 174.6 112.9
WT 21 93.2 34.8
WT 95 103.0 25.3
WT 103 95.5 32.4
WT 106 98.4 41.7
WT 107 113.3 19.7
WT 111 107.7 34.9
WT 113 84.4 33.5
WT 116 94.0 9.9

Part II-Results
75
WT 117 111.9 15.5
WT 124 90.6 38.9
WT 135 112.0 25.2
WT 136 106.5 36.4
WT 142 97.6 16.7
WT 146 112.1 31.2
WT 154 117.1 16.3
WT 155 104.9 14.1
WT 161 105.7 24.8
WT 162 110.8 21.3
WT 163 88.9 28.1
WT 164 110.6 17.8
WT 166 93.2 31.2
WT 168 114.2 15.7
WT 169 108.4 7.3
WT 171 106.8 29.6
WT 172 76.7 22.9
WT 173 107.9 34.1
WT 174 107.8 9.3
WT 177 92.3 32.6
WT 178 94.5 19.6
WT 180 102.9 27.1
WT 182 87.8 41.4
WT 184 109.0 19.6
WT 186 99.0 52.4
WT 191 84.4 30.2
WT 192 91.1 13.9

Part II-Results
76
Analysis of Mapping-by-sequencing and Fine-mapping for P17C12
Mutant
According to the NGS quality check performed by the sequencing platform (GetPlace, Genotoul,
Toulouse), the fragments at sizes around 40,000 bp were over 95.6%, which indicated that the
DNA samples had good integrity.
After assembling the sequenced fragments against the Heinz 3.0 genome sequences, and
performing the variant calling frequency analysis described in methods Chapter 2.2, the
differences in SNP frequencies between the WT-like bulk and the mutant-like bulk were
scrutinised (Fig 16). According to the Mendelian segregation law, for a homozygous recessive
phenotype controlled by a single gene, the frequency of the causal SNP would be ~33% in the
WT-like bulk, while for the mutant-like bulk, it would approach 100%. However, as the previous
experiments showed in practice and especially when the trait under study was quantitative,
experimental noise almost always results in false positives or negatives getting included in one or
the other bulk, which results in an allelic frequency of the causal mutation ranging from 60% to
100% in the mutant-like bulk and between 20% and 40% in the WT-like bulk (Bournonville, 2015;
Petit et al., 2016). In our case, the pattern of allelic frequency of the mutant- and WT-like bulks
displayed no difference along the 12 chromosomes, except at the end of chromosome 1 (from
8.5×10⁷ to 1.0×10⁸ bp) where a clear and distinct difference of SNP frequencies was observed
between the two bulks (Fig 16, ch01).

Part II-Results
77
Fig 16 Frequency analysis of SNP mutations for WT- and mutant-like bulks of the P17C12
BC1F2 culture.
Variant calling frequency analysis after sequencing the wild-type-like and mutant-like (starch-
excess) bulks. Variations in SNP frequencies along the 12 tomato chromosomes are shown using a
10-EMS-mutations sliding window for the WT- like bulk (yellow line) and the mutant-like bulk
(cyan line).
ch11 ch12
ch09 ch10
ch07 ch08
ch05 ch06
ch03 ch04
ch01 ch02
0.0e
+00
2.5e
+07
5.0e
+07
7.5e
+07
1.0e
+08
0.0e
+00
2.5e
+07
5.0e
+07
7.5e
+07
1.0e
+08
20
40
60
80
20
40
60
80
20
40
60
80
20
40
60
80
20
40
60
80
20
40
60
80
Position of chromosome
Alle
lic f
requ
ency (
%)
Bulk Mutant WT
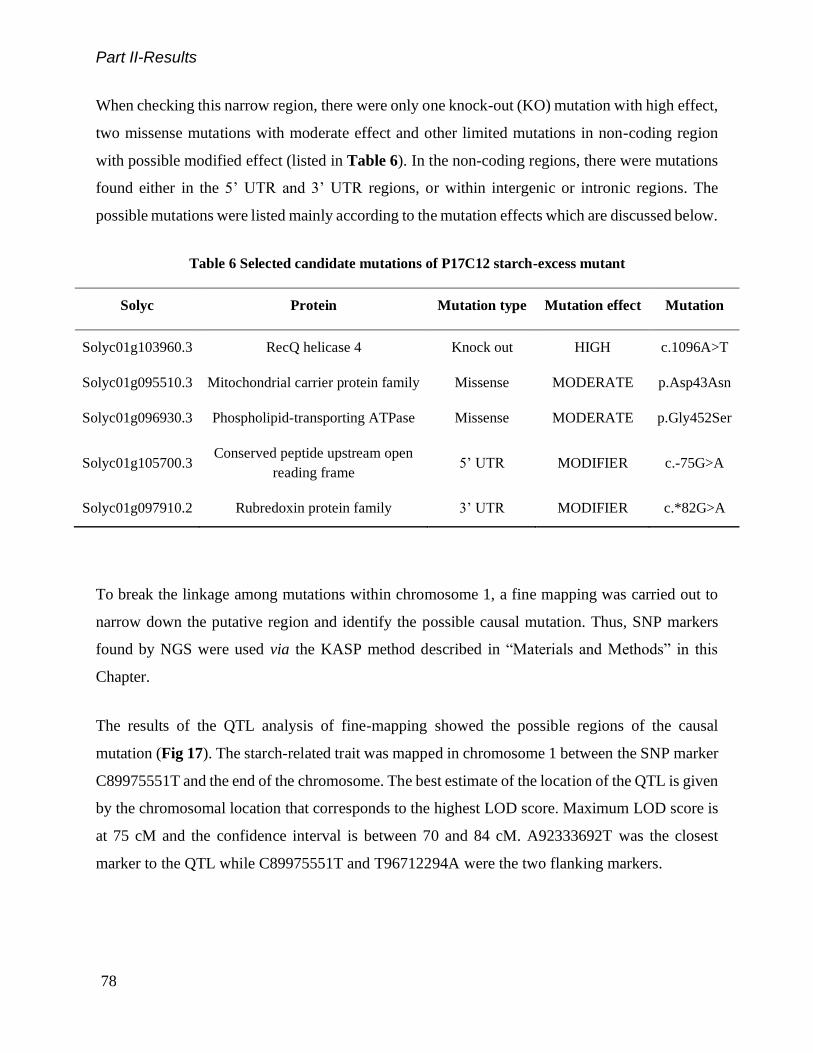
Part II-Results
78
When checking this narrow region, there were only one knock-out (KO) mutation with high effect,
two missense mutations with moderate effect and other limited mutations in non-coding region
with possible modified effect (listed in Table 6). In the non-coding regions, there were mutations
found either in the 5’ UTR and 3’ UTR regions, or within intergenic or intronic regions. The
possible mutations were listed mainly according to the mutation effects which are discussed below.
Table 6 Selected candidate mutations of P17C12 starch-excess mutant
Solyc Protein Mutation type Mutation effect Mutation
Solyc01g103960.3 RecQ helicase 4 Knock out HIGH c.1096A>T
Solyc01g095510.3 Mitochondrial carrier protein family Missense MODERATE p.Asp43Asn
Solyc01g096930.3 Phospholipid-transporting ATPase Missense MODERATE p.Gly452Ser
Solyc01g105700.3 Conserved peptide upstream open
reading frame 5’ UTR MODIFIER c.-75G>A
Solyc01g097910.2 Rubredoxin protein family 3’ UTR MODIFIER c.*82G>A
To break the linkage among mutations within chromosome 1, a fine mapping was carried out to
narrow down the putative region and identify the possible causal mutation. Thus, SNP markers
found by NGS were used via the KASP method described in “Materials and Methods” in this
Chapter.
The results of the QTL analysis of fine-mapping showed the possible regions of the causal
mutation (Fig 17). The starch-related trait was mapped in chromosome 1 between the SNP marker
C89975551T and the end of the chromosome. The best estimate of the location of the QTL is given
by the chromosomal location that corresponds to the highest LOD score. Maximum LOD score is
at 75 cM and the confidence interval is between 70 and 84 cM. A92333692T was the closest
marker to the QTL while C89975551T and T96712294A were the two flanking markers.

Part II-Results
79
In order to confirm which of these candidate genes could be responsible of the starch phenotype,
I developed several strategies like CRISPR/Cas9 or other genomic engineering techniques to
mimic those mutations in a clear genomic background like WT.
Fig 17 QTL mapping of the starch variation in the P17C12 mutant
The Kosambi genetic distance expressed in cM is indicated on the left. Marker identifiers and
positions are indicated on the right. 1-LOD and 2-LOD support intervals of QTL is marked by box
and thin bars, respectively. The result of the QTL mapping is plotted as a likelihood-ratio statistic
test (LOD score) against the chromosomal map distance, measured in recombination units. The
vertical dotted line represents a threshold value, above which a likelihood-ratio test provides a
statistically significant fit to a model of the data (3.0). Results shown are the output of simple
interval mapping (MapMaker/Exp v3.0 Lander et al., 1987; MapMaker/QTL v1.1, Paterson et al.,
1988)
C11280174T G19944195TG40105420A C60643457TC65422937T
0
G86626712A53G87809674A56G88201115A C88241063A57
C89975551T65
A92333692T75
C93669007T78
T96712294A84
sta
rch
0
5
1
Chromosome 1 LOD score

Part II-Results
80
2.4 Discussion
Phenotyping Starch-related Traits in Micro-Tom Fruit
In Micro-Tom fruit, starch accumulation shows a temporary and spatial pattern and is more
abundant in the columella, placenta, pericarp parenchyma and seeds (Obiadalla‐Ali et al., 2004).
When expressed on a fresh weight basis it was peaking during the immature stage, and completely
degraded at the red ripe stage, as also observed in other growth conditions (Obiadalla‐Ali et al.,
2004) and in another cultivar, i.e. the S. lycopersicum L. cv F144 (Schaffer and Petreikov, 1997)
and S. lycopersicum L. cv. Moneymaker (Luengwilai and Beckles, 2009). However, in our
experiments that were performed under optimal growth conditions and in which the sink/source
ratio was controlled via flower and fruit thinning, the amount of starch reached high levels (~135
µmol.glucose.eq.g-1 FW) during the summer, much higher than in previous reports (Obiadalla‐Ali
et al., 2004). During the last three years we found that in the P17C12 mutant the starch level
showed considerable fluctuation between culture seasons and this was even true for the WT. Starch
accumulation in fruit is indeed affected by several factors including the stage of development,
source/sink relationships and environmental conditions, comparing our results to previous
observations in Micro-Tom fruits (Obiadalla‐Ali et al., 2004). By contrast, starch metabolism
varies little considering the age in leaves of Arabidopsis, which makes starch studies easier in
leaves (Smith and Zeeman, 2020) than in fruit.
Therefore, to better phenotype the starch content and avoid false positives that would be caused
by other factors during screening, we paid extra effort on cultivation and sampling. Firstly, we
used only pericarp as material to avoid the possible interfering of the columella, which contains
higher concentrations of starch. Then, as starch accumulates along fruit growth to peak during the
immature stage at around 18–20 DAP and then decreases quite sharply, there was only a short
period that was suitable for sampling. To reduce as much as possible the differences caused by
using inappropriate sampling stages, I marked the pollination date for every flower so to obtain
harvest dates that would match the starch plateau situated between 18 and 20 DAP. It is necessary
to mention that, the accumulation patterns shown in Fig 14 were measured in summer fruits, which
needed around 42 days to develop and ripe, while for fruits in winter, the growth period represented

Part II-Results
81
around 50 days, which implied that the sampling date was shifted for days according to the
developmental stages. Finally, starch amount in tomato fruit largely depends on source/sink
relationships (Osorio et al., 2014), as also observed for the Moneymaker cultivar in our group
(Biais et al., 2014). To minimize those effects, I also performed flower and fruit thinning during
the pollination stage, leaving 6 to 8 fruits on two trusses to make sure that I would have enough
sample for analysis and seed collecting.
However, this more robust screening method was established after the first screening that was
performed on red ripe fruits by A. Mirto (a visiting PhD student) in 2016. The reason why he chose
red ripe fruits to screen for starch-excess mutants was to take advantages of a previous project
which aimed to screen ascorbate-excess mutant in red ripe tomato fruit carried by C. Bournonville
(2015) (details see chapter 2.1 Material and Methods). It was also the reason why he performed a
second screening on selected mutants with fruits in different stages to confirm the phenotypes of
starch-excess. It was not surprising that mutants selected according to the starch content in red ripe
fruits also showed higher starch amounts at green stages, implying there was a stable and clear
correlation between the starch-excess phenotype in immature and starch- or hexose-excess
phenotypes at the red ripe stage. This observation also agreed with the previous reports which
found that higher starch amount during development finally contribute to sugar contents in
ripening in different environment conditions or cultivars (Schaffer and Petreikov, 1997; Yin et al.,
2010).
Putative Causal Mutations for P17C12 Mutant
SNPs in the Coding-region
When the EMS treatment leads to SNP mutations in coding regions that affect the integrity of the
encoded protein (stop codon, non-functional amino acid sequence, etc.), which may result in the
appearance of knock-out (KO) or missense mutations with high possibilities to affect the function
of the encoded protein, those SNP mutations are considered to result in high effect. In the case of
P17C12, in the selected region of interests, there are one KO mutation in the coding region of
enzyme RECQ4, and two missense mutations of MCF and PTA in the coding region.

Part II-Results
82
A Knock-out SNP of RecQ helicase 4
RECQ4 (RecQ helicase 4) is a DNA helicase enzyme belonging to RECQ helicases, which are
evolutionarily conserved and involved in numerous functions such as telomere stability, DNA
replication, recombination and repair (Kaiser et al., 2017). Arabidopsis contains two orthologues,
RecQ4A and RecQ4B due to recent gene duplication (Mieulet et al., 2018), which are both
functional. However, the Recq4ab double mutants but not the single mutants show a higher (six-
fold) increase of crossover frequency in intraspecific Arabidopsis crosses (Séguéla-Arnaud et al.,
2015). To date only one tomato orthologue (Solyc01g103960) was reported (Mieulet et al., 2018;
Maagd et al., 2020). In rice, pea and tomato, a single recq4 mutation increases crossovers about
three-fold, suggesting that manipulating RECQ4 can be a universal tool to increase recombination
in plants (Mieulet et al., 2018). A recent study (Maagd et al., 2020) showed that manipulating
RECQ4 with CRISPR/Cas9 increased crossover frequency significantly in interspecific hybrids: a
1.8‐fold extension of the genetic map when measured by analysing SNP markers in the progeny
(F2) plants. However, there is no report about the role of RECQ4 in starch metabolism. According
to previous studies of RECQ4 functions, it is very unlikely that RECQ4 would be involved in
starch metabolism. However, we cannot exclude a pleiotropic effect of the mutation that may lead
to starch excess. Considering that RECQ4 was the only candidate with a KO mutation, I decided
to examine its relationship with starch.
Missense Mutation of the Gene Encoding a Mitochondrial Carrier Family (MCF) Protein
The other two candidate genes with missense mutations were also in my priorities for function
checking, even though according to the literature, they seemed to have little relation with starch
metabolism. The member of the mitochondrial carrier family (MCF) proteins, which consists of
six membrane spanning helices, exhibits typical conserved domains and forms a homodimer within
the membrane (Haferkamp and Schmitz-Esser, 2012; Lee and Millar, 2016). However, contrary to
what their name suggests, the localization and physiological functions of MCF are not limited to
mitochondria as they are found in several compartments such as the glyoxysome, peroxisome,
plastid, and the plasma membrane. MCF proteins catalyse the specific transport of various
substrates such as nucleotides, amino acids or dicarboxylates. In plants, MCF is a large family of
proteins; for example in Arabidopsis it contains 58 members (Millar and Heazlewood, 2003).
Strikingly, the MCF member Brittle1 (BT1) plays an important role in starch metabolism. It was

Part II-Results
83
first proposed to act as an ADP-glucose transporter in the maize endosperm (Sullivan et al., 1991),
thus being involved in substrate supply for starch synthesis during grain development. Similar
transport proteins were later found in other cereals including barley (HvNST1), wheat (TaBT1)
and rice (OsBT1) that are also able to transport ADP-Glucose and are located in the plastid (Patron
et al., 2004; Bowsher et al., 2007; Kirchberger et al., 2007; Li et al., 2017). However,
Solyc01g095510, the MCF member that was mutated in the P17C12 mutant investigated here, is
not an orthologue of BT1, but of MTM1, which has been found in Arabidopsis (At4g27940.1,
Manganese Tracking Factor For Mitochondrial SOD2) and in the yeast Saccharomyces cerevisiae.
In Arabidopsis, it locates in the plastid according to the prediction of ePlant
(http://bar.utoronto.ca/eplant_tomato/). In yeast, Mtm1p is essential for the posttranslational
activation of a manganese-containing superoxide dismutase (SOD2) (Luk et al., 2003). A
complementation experiment performed with the yeast mtm1 mutant showed that the Arabidopsis
AtMTM1 protein is necessary for SOD2 activation (Su et al., 2007).
Missense Mutation of the Gene Encoding a Phospholipid-transporting ATPase
The other candidate gene harbouring a missense mutation in the P17C12 mutant encodes a
phospholipid-transporting ATPase (P-type ATPase), which is a superfamily of ATP driven
biological pumps that share common features but transports different substrates. P-type ATPases
can be divided into five subfamilies (P1 to P5) according to their transported substrate (Kühlbrandt,
2004).The P-type ATPases are involved in a wide range of fundamental cellular processes such as
cellular signalling or micronutrient redistribution (Pedersen et al., 2012). The mutated
phospholipid-transporting ATPase (PTA, Solyc01g096930) found in P17C12 is an orthologue of
the Arabidopsis ALA1 (At5g04930), a member of P4-ATPases that are also named flippases.
Arabidopsis ala1 mutants showed reduced growth only under chilling growth conditions (Gomès
et al., 2000). The KO or RNAi mutants of other members of P4 ATPases showed different
phenotypes, including impaired defence against viruses (ala2 KO) or pathogens (ala3 KO),
increased sensitivity to heat and heavy metals, altered male fertility (ala4 KO, ala6 KO, and ala6/7
double KO) or impaired stomatal regulation (ala10 KO) (Davis et al., 2020 and references therein).
However, there is no report revealing a link between P4-ATPases and starch metabolism.

Part II-Results
84
SNPs in Non-coding Regions
For the other mutations, the SNPs located in non-coding sequences including those within introns,
5’ UTR, 3’ UTR and intergenic (upstream or downstream) regions might affect mRNA splicing,
transcription or translation etc., but the actual effects are difficult to predict, and need to be
confirmed case-by-case.
SNPs Located within Introns
Intronic SNP can effect phenotypes mainly by creating mRNA alternative splicing, thus affecting
the coding sequence and producing different proteins that may have altered localisation, stability
or even function (Kelemen et al., 2013). In plants, it is estimated that 40%–65% of the transcripts
with introns are alternatively spliced, which suggests that alternative splicing plays an important
role in many physiological processes (Zhang et al., 2010; Marquez et al., 2012; Shen et al., 2014;
Clark et al., 2019). A well-known example is the Waxy (Wx) gene in rice encoding a granule
bound starch synthase. A SNP (G to T) located at the 5’ splice site of the first intron found in the
Wxb allele was found to decrease the splicing efficiency and ultimately to lead to a decrease in
amylose production compared to the Wxa allele (Cai et al., 1998). There are four main types of
alternative splicing events that are exon skipping (ES), alternative donor sites (AD), alternative
acceptor sites (AA), and intron retention (IR), the last one (IR) is the main type in plant species
(Wang and Brendel, 2006), whereas the exon skipping is the most common form of alternative
splicing in human (Wang et al., 2008).
SNPs Located at 5’ UTR
Untranslated regions (UTRs) of mRNAs can play multiple roles in mRNA regulation, acting at
levels such as stability, transport and translation efficiency, and also the functions and sub-
localisation of the encoded protein (Srivastava et al., 2018). Thus, UTRs are considered as
important regulating modules functioning at both the mRNA and protein levels. For many
eukaryotic mRNAs, a short open-reading frame (ORF) is present in the 5’ UTR region; it is then
named “upstream ORF” (uORF), the corresponding downstream mRNA then being named “major
ORF” (mORF). Two general types of uORFs are found in plants: conserved peptide uORFs
(CPuORFs) and sequence‐independent uORFs (SIuORFs) (Merchante et al., 2017). CPuORFs
encode conserved peptides with an inhibitory function while SIuORFs have various sequences that

Part II-Results
85
have been found located in conserved positions in the genome across related species. In
Arabidopsis, ~35% of the genes contain at least one uORF (von Arnim et al., 2014). For the
function of uORF, a well demonstrated case is the uORFs belonging to SIRT (sucrose-induced
repression of translation), and the corresponding major ORF is one member of basic leucine zipper
(bZIP)-type transcription factor family genes, ATB2/AtbZIP11. In Arabidopsis, SIRT is highly
conserved, located within the long 5’ UTR of ATB2/AtbZIP11, which responds to sucrose,
resulting in higher expression of SIRT, leading to reduced level of the AtbZIP11 protein (Wiese
et al., 2004). A new reverse genetics strategy took advantage of this discovery, in which sweeter
tomato fruit was obtained by removing the depressors of SlbZIP1 and SlbZIP2 via creating lines
free of SIRT responsive uORFs (Sagor et al., 2016).
Among the SNP mutations found within the region found in P17C12 with the mapping-by-
sequencing strategy, there is one SNP located in the 5’ UTR region of one CPuORF
(Solyc01g105700), which Arabidopsis orthologue is uORF37 (At5g50010.UORF) that is located
in the upstream of a bHLH transcript factor (At5g50010) named SACL2. In tomato, the
downstream gene (Solyc01g105690) of the above mentioned CPuORF also encodes a basic helix–
loop–helix (bHLH) protein, which is the orthologue of the Arabidopsis SACL2. The full name of
SACL2 is suppressor-of-acl5 (sac) like 2. Together with SACL1, SACL3 and SAC51, it belongs
to the SAC family, which is associated with the loss-of-function mutant for ACAULIS 5 (acl5)
that encodes spermine synthase. This mutant has a severe dwarf phenotype (Hanzawa et al., 2000).
SAC mutants were screened from M2 mutated seeds derived from seeds of the acl5-1 mutant that
were treated by EMS. A dominant mutant, sac51-d, in which the acl5 phenotype was almost
completely restored, turned out to harbour a mutation in the uORF that provoked premature
termination, thus leading to an increase in the transcript level of the corresponding mORF SAC51
(a bHLH transcription factor) (Imai et al., 2006). Among those 4 SAC family members, each single
gene was mutagenized, but none showed an alteration in the phenotype. These mutants were then
crossed, and double, triple and quadruple mutants obtained. Among these combinations, the
sac51/sacl3 double mutant exhibited a slight but significant reduction in plant height. While
SACL2 was KO in the background of sac51/sacl3, mutants exhibited a more severe phenotype,
suggesting an additional effect of SACL2 on the phenotype (Cai et al., 2016). Nevertheless, the
function of SACL2 remains unknown.

Part II-Results
86
SNPs Located at 3’ UTR
Three prime untranslated regions (3’ UTRs) are also in the noncoding parts of mRNAs. According
to the review of Mayr et al (2017), 3’ UTRs are well known for regulating the degradation,
translation, and localization of mRNAs, can also function like long noncoding or small RNAs, and
even affect protein–protein interactions. These functions are usually achieved by the cooperation
between RNA-binding proteins, effector proteins and 3’ UTR cis-element. The 3’ UTRs seem to
be major regulators contributing to phenotypic diversity in higher plants.
In the region of interest of the P17C12 mutant, I found one SNP located in the 3’ UTR of
Rubredoxin (Solyc01g097910). Rubredoxins are found mostly in bacteria and anaerobic archae,
and only in photosynthetic eukaryotes like plants and algae (Maiti et al., 2017). Calderon et al.
(2013) found that photosystem II (PSII) was specifically decreased in Rubredoxin mutants in
different species including the green alga Chlamydomonas reinhardtii, the cyanobacterium
Synechocystis sp. PCC 6803, and Arabidopsis. Thus, Rubredoxin appears as universally required
for photosystem II accumulation. Recently, two groups studied the roles of Rubredoxin in
photosystem II assembly (García-Cerdán et al., 2019; Kiss et al., 2019). Kiss et al. (2019) used
Synechocystis sp PCC 6803 to study the roles of Rubredoxin (or RubA) in PSII assembly. They
found that a Rubredoxin-like domain is located on the cytoplasmic surface of PSII complexes, and
that Rubredoxin plays an important role in early PSII biogenesis, by participating in the formation
of the D1/D2 reaction centre complex. Lack of Rubredoxin also affected the accumulation of PSI,
but in an indirect manner caused by the decrease in light-dependent chlorophyll biosynthesis,
which was induced by PSII deficiency. In C. rheinhardtii, García-Cerdán et al. (2019) found that
besides playing an important role in PSII assembly, Rubredoxin (or RBD1, as named in the article)
is also involved in PSII repair. They proposed that during the de novo assembly of PSII complexes,
Rubredoxin together with the cytochrome b559 protects PS complexes from photooxidative
damage. In summary, those findings revealed the roles of Rubredoxin in the redox control of PSII
biogenesis, supporting the fact that it is essential in photosynthetic eukaryotes.
There are two possible links between Rubredoxin and starch metabolism. As described above,
Rubredoxin is involved in PSII and PSI accumulation in plants. In Arabidopsis, the homozygous
KO Rubredoxin mutants were pale green, showed no detectable chlorophyll fluorescence and had

Part II-Results
87
an Fv/Fm value of 0, indicating a lack of PSII activity (Calderon et al., 2013). Whereas starch
synthesis is closely linked to photosynthetic carbon assimilation in the plastids of autotrophic
organs such as leaves, it is possible that starch metabolism would be affected in Rubredoxin
mutants. The other possible link is that enzymes involved in starch metabolism that are redox-
regulated (i.e. AGPase and some degradation enzymes as mentioned in Chapter 1.2.2) could
interact, directly or indirectly, with Rubredoxin.
SNPs Located at Intergenic (Upstream or Downstream) Regions
In the upstream region of genes, there are different regulators, such as promoters and enhancers.
There are numerous examples of natural mutations in the promoter region that cause changes in
the expression of the downstream genes and lead to phenotypic changes. Thus, in tomato a 3-bp
InDel in the promoter of Sl-ALMT9 (Al-Activated Malate Transporter 9) was found to provoke
high fruit malate content. Further analysis suggested that this InDel impeded the binding of the
WRKY transcription repressor to the promoter of Sl-ALMT9, thereby alleviating the repression
of Sl-ALMT9 expression and increasing fruit malate accumulation (Ye et al., 2017). Another
recent case is an 8-bp InDel mutation of TFA9 (Tomato Fruit Ascorbate On Chromosome 9) that
was found located in the promoter region of SlbHLH59, which promotes high ascorbate
accumulation by directly binding to the promoter of structural genes involved in the D-mannose/L-
galactose pathway (Ye et al., 2019). In tomato, a causal mutation of the locule number was also
found located 1,080 bp from the 3’ end (downstream) of WUSCHEL, which encodes a
homeodomain protein that regulates stem cell fate in Arabidopsis (Muños et al., 2011).
SNPs located in non-coding sequences, which include introns, 5’ UTR, 3’ UTR and intergenic
(upstream or downstream) regions, might cause phenotypic changes through regulating mRNA
splicing, transcription or translation etc. as described above. The evidences of those SNP effects
are accumulating, but lacking systematic examination, especially in tomato, so that the actual
effects are difficult to predict and have to be confirmed case-by-case. The candidate genes of the
P17C12 mutant described before showed faint connections with already-known starch metabolism,
which elevates the challenges of identifying the causal mutation. According to the SNP effect,
genes with knock-out or missense mutation were first examined. Then SNPs found in non-coding
5’ UTR and 3’ UTR sequence were investigated, as such mutations are likely to impact gene

Part II-Results
88
regulation as seen above. The other kinds of SNPs, e.g. intronic or intergenic, are still in the
checking list.

Part II-Results
89
Chapter3 Evaluation of Candidate Genes
3.1 Introduction
In chapter 2, we screened a large EMS tomato mutant population for alterations in fruit starch, and
found several mutants accumulating more starch in fruit (shorted as starch-excess mutants). After
confirming the starch-excess phenotype in fruits taken at different development stages, 3 mutants,
P17C12, P21C7 and P21H6, were selected to perform a Mendelian inheritance analysis, by
crossing the mutant with the WT and observing the phenotypes of the progenies (BC1F1). Among
those three mutants, P17C12 showed a clear recessive and homozygous starch-excess phenotype,
which can be considered as ideal for the next step, i.e. the mapping of the causal mutation (or in
another word, genotyping). A BC1F2 population of about 200 plants was used to measure starch
in the fruit pericarp at 20 and 30 DAP. In the 20 DAP fruit of the BC1F2 population we observed
a clear segregation of the starch amount by using BC1F1, S2 and WT fruits as controls. This
indicated that the phenotyping can be a valuable reference to select the individual plants to
construct mutant-like bulk with 30–40 starch-excess plants and WT-like with plant containing
normal starch amount for extracting DNA and then to perform the sequencing.
The analysis of sequencing data showed that at the end of chromosome 1, there was a narrow
region with a significant difference of allelic frequencies between the two bulks. With the help of
fine-mapping (details see methods of chapter 2), the region was further narrowed down and finally
it showed to contain one knock-out and two missense mutations and also mutations in non-coding
regions. After an intensive literature survey, we selected three mutations affected the
corresponding proteins and two mutations in 5’ UTR and 3’ UTR which may affect mRNA
functions. The details of those mutations are listed in Table 6.
The five candidate genes have distinctive functions, but little relation was found in the literature
between the function/activities of these proteins and starch metabolism (see the discussion in
Chapter 2). Thus, we decided to characterize all of them without a priori. To verify if a candidate
mutation is the one related to the phenotype of interest, a valuable strategy is to mimic this mutation
in a WT background to avoids the interference that could result from other EMS mutations. Thus,

Part II-Results
90
in this chapter, we tested each candidate by using the CRISPR/Cas9 technique to create KO or to
mimic mutations found in putative regulatory regions. We also overexpressed one candidate gene
(Rubredoxin) in WT plants by using constructs with the constitutive CMV-35S promoter.
Thereafter, the resulting transgenic plants were phenotyped, in particular by measuring fruit starch.
3.2 Materials and Methods
RNA Extraction and qRT-PCR Analysis
For each genotype, three plants were sampled as biological replicates. Total RNA was isolated
from mature leaves at flowering and fruits at 12 and 20 DAP from WT, S2 and BC1F1 plants by
using the TRIzol™ reagent (Life Technologies) following the manufacturer’s instructions. After
quality and quantity control of the RNA samples by gel electrophoresis and spectrophotometry
(Nanodrop), 1 µg RNA of each sample was used to perform RQ1 RNase-free DNase (Promega)
treatment. Reverse transcription was performed using a SuperScript™ IV First-Strand Synthesis
System Kit (Invitrogen). For each biological replicate, three technical replicates were analysed
using a CFX96 real-time system (Bio-Rad) and GoTaq qPCR Master Mix (Promega). The qPCR
mixture (20 μL in total) comprised 10 μL master mix, 250 µM (final concentration) of each primer,
and 4 µL of the reverse transcription reaction diluted 20 times (~0.2 µg cDNA). The temperature
program was as follows: initiated at 95°C for 3 min, followed by 45 cycles of 95°C for 10 s, 60°C
for 30 s, then completed with a melting curve analysis program. The primers of each candidate
gene for qRT-PCR reaction were designed with the Primer3.0 software, listed in Table 7. The
transcript levels of the genes were normalized with values obtained for the housekeeping genes
SlActin2 and SleIF4A.
Table 7 List of primers for qRT-PCR
Gene name Solyc Forward/reverse
primer Sequence (5’ to 3’)
CPuORF Solyc01g105700.3 FP CAAACAAGATTTCGGGCCTC
RP GTATTCAGCCTGGCAATTCTC
bHLH146 Solyc01g105690.2 FP ACGCTTGAAGATACAGATGAG
RP GTCCTTGCTCTTTATCCCAG

Part II-Results
91
Rubredoxin Solyc01g097910.2 FP TGACAGTAGGAGGCTTGAGG
RP CGGAAGCTTATCAAACGGCA
eIF4A Solyc12g095990.2 FP AGTGGACGATTTGGAAGGAAG
RP GCTCCTCGATTACGACGTTG
Actin2 Solyc03g078400.2 FP GGACTCTGGTGATGGTGTTAG
RP CCGTTCAGCAGTAGTGGTG
Construction of Plasmids for the CRISPR/Cas9 Approaches and
Overexpression under CMV-35S and PEPC Promoters
CRISPR/Cas9 mutagenesis was performed as described by Bollier et al. (2018) with some
modifications. Briefly, constructs were designed to create InDel mutations, with two sgRNAs
alongside the Cas9 endonuclease gene. The guides of sgRNA target sequences were designed by
using http://crispor.tefor.net/ at the coding sequence of each gene, and the distance between the 2
guides selected was from 60 to 100 bp. The sequences of all guides I used were listed in Table 8.
All constructs were assembled using the Golden Gate cloning method (Weber et al., 2011), and
the plasmids used in cloning are listed in Table 9.
The forward primer contains the 20 nucleotides specific for the targeted gene (in red starting with
a G) and an upstream BsaI site allowing cloning (Blue),and 23 nucleotides corresponding to the
sgRNA to be fused by PCR amplification on the plasmid (green). Thus, in the case of using the
Arabidopsis U6-26 promoter (pICH86966), the primer will have the following sequence:
TGTGGTCTCAATTGNNNNNNNNNNNNNNNNNNNGTTTTAGAGCTAGAAATAGCAAG.
The reverse primer is always the same and corresponds to the following sequence (BsaI site in
blue): TGTGGTCTCAAGCGTAATGCCAACTTTGTAC.
At Level 1, the guide sequence attached with sgRNA was placed under the control of the
Arabidopsis U6 promoter, and then the constructed plasmid would be used for Level 2
constructions to assemble with the modules to express the Cas9 protein, the neomycin

Part II-Results
92
phosphotransferase (NPTII) reporter gene and the backbone of pICSL4723, which delivers the
target sequences into the plant genome.
In order to generate the same mutation (C>T transition) in the 5’ UTR of CPuORF of the P17C12
EMS mutant, a specific Cas9 was used. This is the D10A mutant nCas9At fused with Petromyzon
marinus cytidine deaminase and codon-optimization was made for Arabidopsis (thus nCas9At-
PmCDA1At) (Shimatani et al., 2017b). The plasmid was adapted for Golden Gate cloning.
The Golden Gate cloning method and similar construction procedures were also used to perform
the overexpression of Rubredoxin in tomato under the CMV-35S promoter or under a fruit-specific
expression promoter ⎯ the promoter of PEPC (phosphoenolpyruvate carboxylase 2,
Solyc07g062530.2). For cloning the coding sequences of Rubredoxin and to avoid the possible
recognition by the BsaI and BpiI restriction endonucleases, the coding sequences was changed to
the synonymous codons by designing three pairs of primers and then assembling together. The
corresponding primers are also listed in Table 8.
All plasmids were confirmed by Sanger sequencing (Eurofins Genomics Ltd, Germany) by
covering the cloning regions.
Table 8 Sequences of the guides or primers used in Golden Gate cloning for CRISPR/Cas9
mutagenesis or overexpression
Gene Target
region
Guide or
primer sequence (5’ to 3’)
RECQ4 Exon Guide 1 ATTGAATAGCATGTTGCGTCCAGT
Guide 2 ATTGCTGGCACAATGTCTTTGTGT
MCF Exon Guide 1 CAAGGGCTGTCTTCATGGAT
Guide 2 GACAGGGCTATGTCCGCCGC
PTA Exon Guide 1 CATCTGGTGGGGGGTCTGTG
Guide 2 CCCCGCGACCCACGTCTCAC
CPuORF 5’ UTR Guide 1 AACTAGCTTTTGGAGGAAAA
Rubredoxin 3’ UTR Guide 1 TAATTGTACATGGTTTAGAA
Rubredoxin Exon Guide 1 CTCCTGCTCGGATTCCGAAG

Part II-Results
93
Guide 2 GTCGCACACCTCCAATCCTC
Rubredoxin CDS FP 1 ATGGCTTCAGCAACTAGTAGAG
RP 1 CCTCTTGGGAGACATCAATAGATTTG
FP 2 GAGGACAAACCCATCTCAGAACAAC
RP 2 TCACCAGTAGCTTCATTGTACTTG
FP 3 GTGACCCCTCTTATCCTATTCCTC
RP 3 AAGCTTATTGAAGGAAATAACCAGAC
Table 9 Plasmids used for Golden Gate cloning
N Addgene Type of using Antibiotic
selection Name of vector
46966 sgRNA Kanamycin pICH86966::AtU6p::sgRNA_PDS
46968 U6 promoter Spectinomycin pICSL01009::AtU6p
48002 Guide 1 acceptor (Level 1) Ampicillin pICH47751
48003 Guide 2 acceptor (Level 1) Ampicillin pICH47761
51144 Kana-plant Ampicillin pICSL11024(pICH47732::NOSp-
NPTII-OCST)
49771 Cas9 Ampicillin pICH47742::2×35S-5’UTR-
hCas9(STOP)-NOST
91694 Cas9(CDA) Kanamycin pDicAID_nCas9-PmCDA (adapted for
Golden Gate cloning)
48018 Link for 1 guide Spectinomycin pICH41766
48019 Link for 2 guides Spectinomycin pICH41780
48015 Acceptor of level 2 Kanamycin pICSL4723
47998 LVL0 acceptor Spectinomycin pICH41308
50267 35S promoter Spectinomycin pICH51266
50337 CaMV terminator Spectinomycin pICH41414
48001 acceptor for Level 1 of
overexpression
Ampicillin pICH47742
48017 LVL2 end linker Spectinomycin pICH41744

Part II-Results
94
Transformation of Tomato
The different constructs were introduced into the Agrobacterium tumefaciens strain
GV3101::pMP90 by electroporation. The agro-transformation of tomato cotyledons was
performed as described by Bollier et al. (2018). Cotyledons were cut before the appearance of true
leaves, and put upper side down on a Petri dish with KCMS medium (Knudson C and Murashige
& Skoog medium), besides MS solution, which additionally contained thiamine (0.9 mg.L-1),
acetophenone (200 µM), kinetin (100 µg.L-1) and 2,4-D (200 µg.L-1), and then placed in the dark
at 25°C. After one- or two-days incubation, the cotyledons were transferred to a co-culture with
the transformed Agrobacteria diluted with KCMS solution at OD between 0.05 and 0.08 under
slow stirring in the dark during 30 min. The Agrobacteria was cultivated in LB medium and
collected at OD between 0.6 and 1 (at log phase) before dilution and co-incubation. To prepare 50
mL co-incubation solution, additionally 100 μL acetophenone (100 mM) and 4.5 μL thiamine (0.9
mg.L-1) were added to the KCMS solution. Cotyledons were put back to the same Petri dish for 2
days of co-incubation in the dark, and then transferred to the 2Z medium, which contains 250
mg.L-1 timentin, 100 mg.L-1 kanamycin and 2 mg.L-1 zeatin, in the light. After 15 days, cotyledons
were transferred to the 2Z medium additionally containing 150 mg.L-1 timentin for inhibiting the
growth of Agrobacteria and 150 mg.L-1 kanamycin for selecting the transformants. This
concentration of antibiotic was then maintained until stems would appear. When the meristematic
stems were developed, they were cut without taking callus and transferred into selective rooting
medium containing timentin (75 mg.L-1), kanamycin (150 mg.L-1) and IAA (1 mg.L-1) for rooting.
Once the roots had developed, plants were transferred into soil in a mini greenhouse until new
leaves were obtained.
Identification and Selection of Transformants
To genotype each first-generation transgenic (named T0) line, leaf samples were collected from
each individual to extract DNA as described above. For CRISPR/Cas9 mutants, two primers were
designed for each target gene at the positions around 100 bp before the first guide sequence and
around 100 bp after the second guide sequence. The CRISPR genotyping primers are listed in
Table 10. The PCR products of each pair of primers were sequenced to identify potential mutations
at each guide sequence region. Confirmed mutated T0 plants were kept to obtain seeds for the next

Part II-Results
95
T1 generation. T1 plants of each line were selected on MS medium with 150 mg.L-1 kanamycin,
and then transferred to mini cabinet to be acclimated to natural environment. T1 plantlets were
genotyped, as done for T0 generations and the “positive” T1 plants were finally transferred into
the greenhouse. In the better cases, we expected to work with three homozygous plants in T1 for
each line.
For overexpression mutants, as the plasmids contained the neomycin phosphotransferase (NPTII)
gene for mutant selection, the specific primers corresponding to this gene were used to identify the
transgenic plants for each generation by performing PCR on extracted leaf DNA as the template.
These primers are also listed in Table 10.
Table 10 Primers for selecting transformants
Gene Forward/Reverse
primer Sequence (5’ to 3’)
Size of PCR
product (bp)
RECQ4 FP CTGGACAATTTGGTGGCATT 487
RP AGTTCAGTCACCCCATGGTT
MCF FP TTCAGCTTCTCCATGCAAAC 454
RP TCAAACAAACACCACTCCTC
PTA FP TAGCCTTAGATTGTCTTGTG 340
RP GCAAGAAGGTCACAATAGAG
CPuORF-5'UTR FP CTGCCTATCAACTGTAACCAG 362
RP GATTCCATTCTCATGCTTTGAG
Rubredoxin-3'UTR FP GTGGATTGCTTTTGGGATTTGTG 307
RP CTTGAGCTCGATTCGTATTGTG
Rubredoxin-KO FP TCACACTCCCACCATTTCAC 497
RP CACAAATCCCAAAAGCAATCCAC
NPTII FP AGAGGCTATTCGGCTATGAC 730
RP AGAAGGCGATAGAAGGCGAT

Part II-Results
96
Phenotyping of Mutants
To measure starch in leaves, I sampled the fully expanded mature leaves between 3 and 4 pm, a
period during which starch levels peak in mature tomato leaves (Bénard et al., 2015). Lugol (KI-
I2) solution was prepared with 1 g of KI and 0.26 g of I2 dissolved in 100 mL MilliQ water. First,
leaves were decolorized in 95% alcohol at 100°C to get rid mainly of the chlorophyll and become
white, rinsed twice with MilliQ water, and finally soaked in Lugol solution for 10 minutes.
To measure starch, fruits between 18 and 24 DAP, for which starch levels are relatively stable,
were collected and pericarp tissue was sampled and snap frozen into liquid nitrogen. For some
mutants, fruits between 12 and 14 DAP were also collected. It is worth mentioning that Micro-
Tom fruits developed faster in the summer than in the winter, i.e. 42 days during summer against
52 days during winter between anthesis and red ripe stages. Thus, to make sure fruits were at the
same stage of development, they were collected at 14/24 DAP in the winter and at 12/20 DAP in
the summer.
Leaf chlorophyll was estimated with a Dualex portable device, which is a clip sensor, according
to the manufacturer’s manual. Leaf photosynthesis was measured with a portable CIRAS-3 gas
analyzer, according to the manufacturer manual. For each mature leaf, 3 to 5 technical
measurement replicates were performed.

Part II-Results
97
3.3 Results
According to the mutation effects of the five candidate genes, I clustered them into two groups,
the first group included candidate mutations in coding region, and the second group included
candidate mutations in non-coding regions. As explained before, I used different strategies to
validate each candidate, and the results is presented here on a case-by-case basis.
Evaluation of the Candidates with KO/Missense Mutations: REQC4,
MCF and PTA
According to the starch accumulation pattern found in Micro-Tom, fruits between 18 and 20 DAP
have a relative stable and high level of starch (Fig 14). In consequence, this time-window was used
to phenotype the mutants and transformants by measuring starch. In order to simplify the
presentation of the results, the fruits harvested between 18 and 20 DAP will be designated by 18
DAP.
As a KO mutation clearly results in the suppression of the corresponding protein, RECQ4 was the
first candidate characterized. Then, the missense mutations that corresponded to an amino acid
change may affect the stability and/or the catalytic function of the protein, and possibly affect the
phenotype. To verify the two missense candidate genes (MCF and PTA) in 17C12 mutant I
therefore created KO or missense mutants by using CRISPR/Cas9 techniques.
RecQ helicase 4 (RECQ4)
In the P17C12 mutant, there was only one knock-out (KO) mutation in the identified region of
chromosome 1. This KO is in the Solyc01g103960.3 gene named RECQ4 encoding the RecQ
helicase 4. At the coding sequence position c.1096, the mutation corresponds to an A to T transition
leading to the appearance of the stop codon “TGA” and a truncated protein translation. For the
characterization of the RECQ4 mutation, I used two types of plants: a homozygous KO mutant of
RECQ4 created by CRISPR/Cas9, and an EMS Micro-Tom mutant from the Bordeaux population
that had been previously identified by TILLING (Mieulet et al., 2018). This recq4 tomato mutant
was backcrossed several times with the WT to get rid of the very many mutations present and their

Part II-Results
98
possible effects. Neither three homozygous T2 plants of one CRISPR/Cas9 KO mutant line nor
EMS mutant plants (n=3 plants) displayed changes in the starch content in 18 DAP fruits compared
to WT fruit (Fig 18). Consequently, we concluded that the KO mutation in the RECQ4 protein
was not the causal mutation related to the starch- excess phenotype of the P17C12 mutant.
Fig 18 Mutagenesis of RECQ4 by CRISPR/Cas9 and EMS (A, B), and starch content (C) in
18 DAP fruits of KO mutants and WT

Part II-Results
99
A. The mutations of the EMS mutant P17C12, P79C8, and CRISPR KO mutants. The mutations
are indicated by asterisks and shown in the genome sequences in the black box. For indicating
different mutation types, [A] means an insertion of “A”, and [A>T] means a transversion from
“A” to “T”.
B. The mutations induced by CRISPR/Cas9 (grey cross), and the EMS treatment (red cross for
P17C12, and black cross for P79C8) are positioned in the RECQ4 protein sequence. The EMS
mutant was found with TILLING and backcrossed with WT for several generations to decrease
the numbers of other mutations.
C. Starch amount in fruits at 18 DAP was measured in WT as well as R1, R17 and R18 lines,
which were T2 homozygous for the same mutation induced by CRISPR/Cas9. At least three
individual plants were grown for each line and 3 fruits per individual were sampled and
analysed. T-test was performed at P<0.05 by using WT as control, and there was no significant
difference between mutants and WT.
Mitochondrial Carrier Protein Family (MCF)
The missense mutation found in this gene results is (c.127 G>A) leading to an aspartic acid (Asp)
to asparagine (Asn) change. I succeeded with the CRISPR/Cas9 strategy in obtaining one missense
(deletion of “LSSW” 4 amino acids) and two MCF-KO homozygous lines with 3 homozygous
mutated plants per line in T1 generation (Fig 19 B). There was no difference found for starch in
18 DAP fruits of plants of all 3 lines compared to the WT (Fig 19 C), which suggested that MCF
was not the responsible candidate protein associated with the starch-excessive phenotype of the
P17C12 mutant.

Part II-Results
100
Fig 19 Mutagenesis of MCF by CRISPR/Cas9 (A, B) and starch amount (C) in fruits at 18
DAP in the mutants and WT
A. The mutations are indicated by asterisks and shown in the genome sequences in the black box.
For indicating different mutations, [T] means an insertion of “T”, [G>A] means a transition
from “G” to “A”, and GC means a deletion of “GC”.
B. The mutations induced by CRISPR/Cas9 (grey cross) or the EMS treatment (red cross for
P17C12) are positioned in the MCF protein sequence. The InDel mutations were induced by
CRISPR/Cas9 via target the first exons of MCF (Solyc01g095510), resulting knock-out (KO,
MCF3 and MCF12) or missense (MCF4) mutants.
C. Starch amount in fruits at 18 DAP was measured in three transformed lines, which were T2
homozygous lines with different mutations. At least 3 individual plants were grown for each line and 3 fruits per individual were sampled and analysed. T-test was performed at P<0.05 by
using WT as control, and there was no significant difference between mutants and WT.

Part II-Results
101
Phospholipid-transporting ATPase (PTA)
The PTA gene (Solyc01g096930.3) encodes a phospholipid-transporting ATPase. In the P17C12
mutant, the mutation results in a transition of G to A at c.1354 leading to a change of glycine to
serine that we hypothesized may affect the PTA function. I characterized one missense and two
KO homozygous T1 lines in addition to the corresponding T2 progenies, with three plants per line
(Fig 20, A and B). Phenotyping of these plants revealed that there was no significant difference
in starch levels in 18 DAP fruits in comparison with the WT (Fig 20, C), which suggest that PTA
is not related to the starch phenotype.

Part II-Results
102
Fig 20 Mutagenesis of PTA by CRISPR/Cas9 (A, B) and starch amount (C) in fruits at 18
DAP in the mutants and WT
A. The mutations are indicated by asterisks and shown in the genome sequences in the black box.
For indicating different mutations, [T] means an insertion of “T”, [G>A] means a transition
from “G” to “A”, and GC means a deletion of “GC”.
B. The mutations induced by CRISPR/Cas9 (grey cross) or the EMS treatment (red cross for
P17C12) are positioned in the PTA protein sequence. The InDel mutations were induced by
CRISPR/Cas9 by targeting the first exons of PTA, resulting in knock-out (KO, PTA4 and PTA6)
or missense (PTA1) mutants.
C. Starch amount in fruits at 18 DAP was measured in three transformed lines, which were T2
homozygous lines with different mutations. At least 3 individual plants were grown for each

Part II-Results
103
line and 3 fruits per individual were sampled and analysed. T-test was performed at P<0.05 by
using WT as control, and there was no significant difference among mutants and WT.
Evaluation of Candidates with Mutations in Non-coding-sequence
Regions
Additional mutations within the promising chromosome 1 region predicted by mapping-by-
sequencing and fine-mapping were located in non-coding sequence regions, including upstream,
5’ UTR, intron, 3’ UTR and intergenic regions. The consequences of such mutations could be
more sophisticated and indirect, and in order to be characterized, they required more complicated
and specific strategies. Those mutations are listed in Table 6, and the possible effects are described
in Chapter 2.4. Based on those hypotheses, I decided to begin with the mutations in the 5’ UTR
and 3’ UTR, mainly because of the relatively well-known principle of such regulation mechanisms
described in the literature. Firstly, we examined the transcript levels of those two candidates in
leaves, and in 12 DAP and 18 DAP fruits, in order to predict their possible effects to thereafter
define what strategies for their characterization.
Conserved Peptide Upstream Open Reading Frame (CPuORF)
According to the TEA (Tomato Expression Atlas, http://tea.solgenomics.net/) and ePlant
(http://bar.utoronto.ca/eplant _tomato/) databases (Fig 21, A), CPuORF is weakly expressed in the
leaves and fruits of the M82 and Heinz cultivars. I confirmed this result in Micro-Tom as the
CPuORF transcript was hardly detectable and I also found that there was no difference of
expression between the WT and the P17C12 mutant. I used the CRISPR/nCas9At-PmCDA1At
(coupled with cytidine deaminase) strategy to target the 5’ UTR region to mimic the possible effect
of the SNP mutation found in the P17C12 mutant. However, due to limited efficiency of the
CRISPR/nCas9At-PmCDA1At and to the unprecise mutation window (~3 bp in guide sequence
(Shimatani et al., 2017), I was not able to reproduce the same mutation (Fig 21, B).

Part II-Results
104
Fig 21 CPuORF transcript levels and mutations, and starch contents of CPuORF 5’ UTR
mutants via CRISPR/Cas9 mutagenesis
Plant eFP: CPuORFA
5’ UTR CDS 3’ UTR
CPuORF Solyc01g105700B
*
CPuORF-Solyc01g105700: …TTTTCCTCCAAAAGCTAGTT……………….GAAGGTTAAAAGTAGTTATG…...
CPuORF-P17C12: ……………TTTTCCTCCAAAAGCTA[G>A]TT……….…GAAGGTTAAAAGTAGTTATG......
CPU5-CRISPR: ………………TTTTCCTCCAAAAGCTA[ATAGCTA]GTT…..GAAGGTTAAAAGTAGTTATG…..
CPU13-CRISPR: ……………..TTTTCCTCCAAAAGCTAGTT……………....GAAGGTTAAAAGTAGTTATG…..
Sta
rch
conte
nt
(µm
ol.g
luco
se
.eq.g
-1F
W)
C
0
50
100
CPU5 CPU13 WT
Fruits at 18 DAP

Part II-Results
105
A. Transcript levels of CPuORF of S. lycopersicum (cv. Heinz) whole plant, and in leaves and fruits of the
wild species S. pimpinellifolium. The predicted subcellular localization of CPuORF is also showed on
the left. The figure was obtained from the ePlant database (http://bar.utoronto.ca/eplant_tomato/).
B. The InDel mutations were induced by CRISPR/Cas9 by targeting the 5’ UTR of Solyc01g105700.3
(encoding a CPuORF), resulting in modifier mutations. For indicating different mutations, [T]
means an insertion of “T”, [G>A] means a transition from “G” to “A”, and GC means a deletion of
“GC”.
C. Starch amount in fruits at 18 DAP was measured in two transformed lines, which were T2 homozygous
lines with different mutations. At least 3 individual plants were grown for each line and 3 fruits per
individual were sampled and analysed. T-test was performed at P<0.05 by using WT as control, and
there was no significant difference among mutants and WT.
Rubredoxin
The Rubredoxin gene is known to be highly expressed in the leaves and relatively lowly expressed
in younger fruits in cv. Heinz tomato (Fig 22, A). I confirmed this result in Micro-Tom, in which
Rubredoxin transcript levels were 70-times higher in leaves than in fruits (Fig 22, B). Remarkably,
Rubredoxin appeared more strongly expressed in the fruits of the mutant (Fig 22, C). Thus, in
mutant fruits at 12 DAP, the level of Rubredoxin transcript was ~4-times (P<0.01) higher and at
18 DAP it was ~2-times (P<0.01) higher than in the WT.
Plant eFP: Rubredoxin A

Part II-Results
106
Fig 22 Rubredoxin transcript levels in different tomato organs and subcellular localisations
in S. lycopersicum var. Heinz and S. pimpinellifolium, and in leaves and fruits of WT and S2
mutants of P17C12 in S. lycopersicum var. Micro-Tom
A. Rubredoxin transcript levels in Heinz of whole plant and wild species S.pimpinellifolium, in leaves and
fruits. The predicted subcellular localization of Rubredoxin is also shown on the left. The figure was
obtained from the ePlant database (http://bar.utoronto.ca/eplant_tomato/).
B. Rubredoxin transcript levels in leaves as well as in 12 and 18 DAP fruit in the Micro-Tom EMS mutant
P17C12 and the WT. Significance was tested using a t-test.
C. Rubredoxin transcript levels in 12 and 18 DAP fruit in the Micro-Tom EMS mutant of P17C12 and WT.
Significance was tested using a t-test, and two asterisks indicate P<0.01.
Manipulation of the 3’ UTR Region of the Rubredoxin Gene
To investigate whether a mutation in 3’ UTR of Rubredoxin affected starch accumulation in fruits,
I used more complex strategies. First, like for CPuORF, I used the CRISPR/Cas9 to directly target
the region mutated in P17C12, expecting to introduce similar mutations. As described before, due
to technical limitations, it was difficult to obtain mutants with the exact same mutations as in the
original P17C12 mutant. In order to mimic the SNP in the 3’ UTR region of the Rubredoxin gene,
we designed one guide that covered the target region. This limited us to improve the mutagenesis
efficiency by using multiple guides with carefully selected guide sequences. Among the first 50
transformants of the T0 generation, none of them showed mutations in the targeted region. We
continued with several lines, which had lots of seeds to obtain the T1 generation. Fortunately, I
obtained three T1 mutated lines, named R3’-15, R3’-25, and R3’-28 (R3’ means that mutations
were in 3’ UTR), that displayed insertion or deletions close-by the original EMS SNP position in

Part II-Results
107
P17C12 (Fig 23, A). Then, in the T2 generation, I could characterise 3 plants for each T1 line that
were identified as homozygous mutants.
On those homozygous T2 plants cultured during winter 2019, I collected fruit samples at 14 and
24 DAP, in which I analysed the level of Rubredoxin transcript and starch content. Contrary to
what I previously observed in the EMS P17C12 mutant (Fig 22, C), the mutations introduced by
CRISPR/Cas9, did not cause any change in the expression of Rubredoxin (Fig 23, B). Meanwhile,
neither 14 DAP nor 24 DAP fruits of those CRISPR/Cas9 mutants showed a significant difference
compared to the WT. A first explanation for this result would be that the EMS SNP mutation of
Rubredoxin is not the causal mutation of the starch excess phenotype of P17C12. A second
explanation could be that the mutations obtained with CRISPR/Cas9 would not affect 3’ UTR
functions like the original EMS SNP mutation did. Finally, I could not conclude about the role of
Rubredoxin using this strategy.

Part II-Results
108
Fig 23 Mutagenesis of 3’ UTR of Rubredoxin by CRISPR/Cas9, and transcript level of
Rubredoxin and starch amount in fruits at 14 DAP and 24 DAP in the mutants and WT
A. The InDel mutations were induced by CRISPR/Cas9 by targeting the region harbouring the
SNP of the P17C12 mutant found in the 3’ UTR of Rubredoxin (Solyc01g097910), leading to
three different lines, R3’-15, R3’-25 and R3’-28. For indicating different mutations, [T] means
an insertion of “T”, [G>A] means a transition from “G” to “A”, and GC means a deletion of
“GC”. In T2 homozygous generation, three individual plants were obtained to perform
Rubredoxin transcript and starch analyses.
B. Rubredoxin transcript levels were measured in selected mutated lines in 14 and 24 DAP fruit
of CRISPR/Cas9 mutants and WT plants. T-test was performed by using WT as control, and
there was no significant difference at P<0.05.
C. Starch amount was examined in 14 and 24 DAP fruits of selected 3’ UTR mutants of
Rubredoxin and WT plants. T-test was performed by using WT as control, and there was no
significant difference at P<0.05 except for fruits of R3-15 at 24 DAP.

Part II-Results
109
In order to try to overcome this inconclusive result, I decided to use two other approaches that
would affect the expression of Rubredoxin. The first one was to create homozygous Rubredoxin
KO mutants. In this aim, I chose to target the two main pairs of cysteine motifs (XCXXCX) of
Rubredoxin (Maiti et al., 2017), in order to decrease or suppress the expression of Rubredoxin and
investigate if it would affect starch metabolism.
The last strategy is based on the expression data showing that Rubredoxin was more expressed in
the EMS mutant than in the WT. This strategy consisted to overexpress Rubredoxin under the
CMV-35S and PEPC promoters to analyse if the increase in the Rubredoxin transcript would result
in the increase of fruit starch content.
Knocking out Rubredoxin
To study the possible function of Rubredoxin, I also generated KO mutants via CRISPR/Cas9 by
targeting the CDS. In T0 generation of Rub-KO mutants, 1 heterozygous mutant showed a strong
phenotype compared to the control plant, which was transformed with the same plasmids and in
the same procedures but not mutated. The mutant showed much slower growth and smaller size,
with pale green and smaller leaves, giving few flowers, and failed to bear fruits, so it could not
produce seeds (Fig 24, A). As the leaves of the mutant were pale green, I measured chlorophyll by
Dualex with 3 to 5 fully expanded mature leaves. The results show that mutant leaves only
contained half of the chlorophyll of control leaves (Fig 24, B). If the mutant had less chlorophyll,
it may affect photosynthesis as well.
Therefore, I used a CIRAS-3 photosynthesis system to measure several parameters of
photosynthesis, including CO2 assimilation (A, related to net photosynthesis), transpiration (E),
stomatal conductance (GS, related to stomata opening), and photosynthesis water use efficiency
(WUE). Compared to control leaves, mutant leaves showed almost no transpiration (E=0), kept
stomata almost closed (GS=0), had a very low water use efficiency (WUE=0), and a very low CO2
assimilation rate. I then sampled fully expanded mature leaves between 3:00 and 4:00 PM, a period
during which starch levels peak in mature leaves according to a previous study (Bénard et al.,
2015). KI-I2 staining of those leaves (Fig 24, C) showed that mutant leaves accumulated much
less starch compared to control leaves.

Part II-Results
110
Fig 24 Phenotyping of Rub-KO mutants via measuring chlorophyll, photosynthesis abilities
and starch content
A. T0 heterozygous Rub-KO mutant and control plants.
B. Examples of leaves and chlorophyll content of the mutant and control plants;
C. Starch content evaluated by KI-I2 staining, and the comparison of the photosynthesis capacities
of the mutant and control plants. Abbreviations: A, assimilation of CO2 (µmol CO2 m
-2 s-1),
presented net photosynthesis; E, transpiration (mmol H2O m-2 s-1); GS, Stomatal conductance
(mmol H2O m-2 s-1); WUE, photosynthetic water use efficiency (mmol CO2 mol-1 H2O).
A
B
C
Phenotype and chlorophyll content of heterozygous leaves
Mutant Control
Starch content and photosynthesis ability of leaves
Mutant Control
T0 heterozygous mutant
Phenotype and mutation of Rub-KO mutant
Control T1 homozygous mutant
0
20
40
60
A E GS WUE
Ab
ility
of p
ho
tosyn
the
sis
0
10
20
30
40
Mutant Control
Ch
loro
phyll
(μg
/cm
2)
Mutant Control
0
20
40
60
A E GS WUE
Ab
ility
of p
ho
tosyn
the
sis

Part II-Results
111
However, after performing Sanger sequencing, it was hard to distinguish the exact mutations by
only sequencing the PCR product. I aimed to obtain homozygous in T1 generation, expecting to
have materials and replications for further phenotyping. However, the T1 homozygous plants
contained almost no chlorophyll, and could not grow beyond the cotyledon stage to give functional
leaves. In addition, those plants gradually died at a very young stage, therefore no material for
further analysis was available except for extracting DNA and genotyping to validate the mutations.
Overexpression of Rubredoxin
The last attempt for examining the possible connection between Rubredoxin and starch
metabolism, was to overexpress Rubredoxin in WT plants to see if the up-regulated transcript led
to higher accumulation of starch in IMG fruits, as we observed significant higher expressions of
Rubredoxin in P17C12 EMS mutant. After selection of transformed T0 plants, I selected three T0
lines with 3 plants per line. Unfortunately, the comprehensive characterization of these plants was
interrupted by the sanitary situation due to COVID-19. That is why I checked transcript levels of
Rubredoxin in leaves after we sampled the fruits at 18 DAP. In the fruits at 18 DAP, there was no
difference in starch content between all the transformed lines and the WT. Furthermore,
Rubredoxin was overexpressed by nearly 100 times in the line 35S-1 while it was down regulated
significantly in the line 35S-2 (P<0.01), being expressed less than 70% than in WT plants, and for
the line 35S-3, one plant showed levels similar to those found in the line 35S-1, and two plants
had normal expression of Rubredoxin. Those strong differences in expression among the different
lines, even within the same line, are not astonishing since we know that it happens frequently with
the 35S promoter, which being expressed very strongly can cause posttranscriptional gene
silencing, thus leading to co-suppression of homologous genes in transformants (Napoli et al.,
1990).

Part II-Results
112
Fig 25 Fruit starch content and leaf Rubredoxin transcript levels in tomato cv. Micro-Tom
plants transformed with Rubredoxin under the control of the 35S promoter
A. Starch contents in fruits at 18 DAP of transformants overexpressing Rubredoxin under the
control of the 35S promoter and WT plants. Three transformed lines and three individuals per
line were used to measure starch. There was no significant difference between transformants
and WT plants at P<0.05 (with t test).
B. Transcript levels of Rubredoxin in mature leaves of the same transformants of Rubredoxin for
measuring starch content in fruits, and WT plants.

Part II-Results
113
3.4 Discussion
The homozygous KO or missense mutants of RECQ4, MCF and PTA did not show any phenotype
associated with starch metabolism. Moreover, under optimal growth conditions, they also showed
no obvious phenotype for growth or morphology, whatever the organ. A recent study (Maagd et
al., 2020b) used CRISPR/Cas9 to create a RECQ4 homozygous KO mutant of S. lycopersicum (cv.
Moneymaker) and S. pimpinellifolium, then through crossing they directly created an interspecific
F1 hybrid without RECQ4. Compared with the wild-type F1 hybrid, the F1 recq4 mutant had a
significant increase in crossovers, but no other phenotypes were found.
As mentioned above, MCF is encoded by Solyc01g095510, an orthologue of AtMTM1
(At4g27940) in Arabidopsis. AtMTM1 may also play an important role in activation of MnSOD1
in Arabidopsis (Su et al., 2007). However, there is no report for MTM1 mutated plants or further
investigations of MTM1 function in plants. As our results based on simple observations showed,
mutating MCF (Solyc01g095510) in tomato had no effect on plant growth and organ morphology.
The transformants obtained for PTA (Solyc01g096930) showed no phenotype related to starch,
and also not for plant growth under optimal growth conditions. In Arabidopsis, the orthologue of
this PTA is ALA1 (At5g04930), a member of P4-ATPases (also named flippase). Under normal
growth conditions, Arabidopsis ala1 mutants also showed no growth phenotype. However, under
chilling stress, the lack of ALA1 resulted in reduced growth at the whole plant level (Gomès et al.,
2000).
At this stage of my work, I decided to not further investigate the mutants generated for RECQ4,
MCF and PTA.
The mutation found within the CPuORF gene (Solyc01g105700) in P17C12 is located in the 5’
UTR region, which may change the transcript level of the downstream mORF to cause phenotypic
changes. Therefore, we firstly checked the transcript levels of CPuORF and mORF (bHLH145);
they were both very low and thus close to background noise in the examined tissues including
leaves and fruits of 12 and 20 DAP. Thus, I could not rule out that there was no difference between
the P17C12 mutant and the WT. Since the expression did not give us extra clues for the effect of

Part II-Results
114
mutations in 5’ UTR, I tried to mimic the mutation by using a specially developed CRISPR/Cas9
technique consisting in a nickase Cas9 equipped with cytidine deaminase, which was supposed to
change A to T and thus mimic the SNP detected in the 5’ UTR region of CPuORF. Performing
this technique requires enormous lab work and also some luck, because the efficiency of this
specifically developed method is much lower than for usual CRISPR/Cas9 techniques (Shimatani
et al., 2017a). Another difficulty was that the promoter we used for Cas9 is a U6 promoter, which
belongs to Type 3 Pol III promoters and is widely used for the expression of small RNAs like
guide RNA in CRISPR. It was found that the U6 promoter uses a T-stretch as termination signal,
when there is “TTTT” (T4), the termination efficiency reaches more than 70% (Gao et al., 2018),
which was the case for the guide sequence (AACTAGCTTTTGGAGGAAAA) of CPuORF. We
obtained over 50 T0 transformants but only 2 lines showed possible mutations according to Sanger
sequencing. We further analysed the T1 generation for these 2 lines. Unfortunately, the mutations
were not A/T transitions, but InDel mutations (Fig 21, B), which were relatively close to the EMS
SNP. However, those two CPuORF mutant lines showed no alteration in starch amount either. The
Arabidopsis orthologue of CPuORF (Solyc01g105700), CPuORF37 (At5g50010.UORF), has
been associated to the metabolism of the polyamine spermine. None of the KO mutants of the
single member of this gene family have shown phenotypic changes (Cai et al., 2016).
The case of CPuORF reveals how difficult it can be to identify a mutation located in a non-coding
region. Firstly, there is only limited information available for those non-coding regions and the
corresponding genes. Secondly, we found numerous of such mutations in the EMS mutant, which
multiplies the challenges mentioned before. Thirdly, even if large progress has been achieved
regarding bioengineering, we still lack highly efficient single-base-editing tools that would work
for every possible SNP. So, because we were not able to exactly mimic the mutation found within
this 5’ UTR region of the P17C12 mutant, I could not conclude for its involvement in the starch
phenotype.
The last candidate mutation was located within the 3’ UTR of the Rubredoxin gene. It is well
known that 3’ UTR regions can regulate the degradation, translation and localization of mRNA
(Mayr, 2017). Thus, to examine the possible effect of the SNP found in this region in P17C12, I
first measured the transcript levels of Rubredoxin in the leaves and fruits of the BC1F1 and S2
plants of P17C12, and WT plants. Interestingly, Rubredoxin appeared up-regulated in the 12 and

Part II-Results
115
20 DAP fruit of BC1F1 and S2 mutants, suggesting that this SNP may have a positive effect on
the transcript levels. In consequence, in addition to my attempts to create KO mutants and mutants
with possible InDel mutations near the SNP position, I generated plants overexpressing
Rubredoxin under 35S and PEPC promoters.
We firstly observed interesting phenotypes in a heterozygous KO Rubredoxin mutant. The leaves
were pale green, with highly reduced photosynthetic capacity and reduced amount of chlorophyll,
and, not surprisingly, very little starch in the leaves (Fig 24). I then tried to obtain homozygous
mutants, but the latter turned out to be unable to grow through the cotyledon stage, with the two
cotyledons totally bleached and looking like “burned”. Those phenotypes were consistent with
previous observations on Arabidopsis mutants lacking Rubredoxin (Calderon et al., 2013).
Therefore, my results confirmed that the lack of Rubredoxin, for which there is only one copy in
the tomato genome, is lethal for phototrophic plants. Recent studies on phototrophic bacteria and
alga revealed the roles of Rubredoxin in the protection and repair of PSII from photooxidative
damage during the PSII complex assembly (García-Cerdán et al., 2019; Kiss et al., 2019). The
lethal effect in higher plants may be due to the lack of protection against ROS by Rubredoxin at
the beginning of PSII biogenesis, when the very young plant becomes autotrophic. As all
homozygous KO mutants of Rubredoxin stopped to grow and died at the cotyledon stage, we could
not collect enough material to be able to perform more investigations on those mutants.
Because results obtained with the Rubredoxin KO mutants were promising (nearly starchless
leaves phenotype), I put more efforts into testing this candidate gene. However, the normal
phenotypes of 3’ UTR mutated plants and overexpressing mutants invalidate the hypothesis that
increased Rubredoxin would activate starch accumulation.
There are two possible explanations for those phenotypes of 3’ UTR mutants of Rubredoxin. The
first one is that the InDel mutations did not mimic the exact SNP mutation, thus, they might not
have the same effect as the SNP mutation found in P17C12. The second one is that the SNP
mutation may have no effect on the starch phenotype. The up-regulated mRNA could be a
consequence of other mutations. For example it is known that one mutation can cause mRNA level
to fluctuate on a large scale, as observed for slgpat6 (for glycerol-3-phosphate acyltransferase 6)
mutant and a series of ripe-related mutants (Petit et al., 2016; Li et al., 2018).

Part II-Results
116
I obtained only one overexpressor of Rubredoxin under the control of the fruit specific PEPC
promoter and thus not enough replication, so I did not show the data, as it would not be statistically
valid. Then, the three 35S-overexpressor lines that were selected for phenotyping showed no
starch-excess phenotype either, although transcripts encoding Rubredoxin were increased by up to
100-times. Finally, those results suggested that up-regulating Rubredoxin expression does not lead
to increased starch accumulation during fruit growth.
To conclude, more efforts will be needed to isolate the causal mutation responsible for starch-
excess in P17C12 fruit. Possible strategies for better fine-mapping or examination of new
candidate genes will be discussed in Chapter 5.

Part II-Results
117
Chapter4 Generating Starch-related
Mutant by Knocking out Alpha- and Beta-
amylase
4.1 Introduction
Among the enzymes participating in starch degradation in leaves, β-amylases (BAMs) present the
highest diversity regarding sub-cellular localization, catalytic properties and functions (reviewed
by Monroe and Storm, 2018). In Arabidopsis, there are nine gene members encoding BAM, named
BAM1–9. Among 9 members, BAM1–4, BAM6 and BAM9 are located in the plastid, BAM5 in
the cytosol and the remaining two (BAM7 and 8) in the nucleus. Some of the members (BAM1–
3, BAM5 and BAM6) are catalytically active in vivo, but others such as BAM4 and BAM7–9 show
no catalytic activity in vivo, suggesting that the members of the BAM family may have distinctive
roles in starch metabolism.
It was suggested that BAM3 is the predominant enzyme involved in starch degradation in leaf
mesophyll cells (Monroe, 2020). BAM1 was also found to play an important role, especially in
guard cell starch degradation (Thalmann et al., 2016). In contrast, knocking out the other 3 BAMs,
i.e. BAM2, BAM5, and BAM6, did not impact starch degradation or plant growth under optimal
growth conditions (Monroe, 2020). The fact that BAM5 seems to be only a minor player in starch
degradation is striking, especially when considering that BAM5 shows a 5 to 20 times higher
affinity for soluble starch than other members (Monroe et al., 2017) and is responsible for up to
80% β-amylase activity in extracts of Arabidopsis leaves (Lin et al., 1988).
Compared to BAMs, α-amylase (AMY) seems to play less important roles in leaf starch
degradation, as the plastid-localized α-amylase (AMY3) KO mutants showed no starch-excess
phenotypes in Arabidopsis (Yu et al., 2005). However, reducing activity of chloroplastic α-
amylase in rice plants resulted in increased starch levels in leaves (Asatsuma et al., 2005), implying

Part II-Results
118
that the impact of the chloroplastic α-amylase on starch degradation may vary from species to
species. Furthermore, it has been found that the genes encoding AMY3 and BAM1 both contain
ABA-responsive element (ABRE) motifs in the promoter region, and the transcript levels of
AMY3 and BAM1 are both up-regulated by ABA, and responding to osmotic stress (Thalmann et
al., 2016). In endosperms, it is widely accepted that AMY plays a central role to initiate the attack
of the starch granule and the hydrolysis of α -1,4 bonds to produce linear or branched
oligosaccharides (Zeeman et al., 2010).
In fruit, BAM3, BAM9 and also AMY3 are mentioned to participate in starch degradation in
kiwifruit and banana (Nardozza et al., 2013; Hu et al., 2016; Peroni-Okita et al., 2010; do
Nascimento et al., 2006). This assumption was based on correlations found between transcripts
and starch levels in different development stages, treatments, cultivars and/or species, while the in
vivo roles (BAM9 is a non-catalytic protein) still need to be investigated.
In this chapter I focused on the two BAM and AMY families in tomato fruit, as they play important
and diversified roles in starch degradation. I first mined and named all the members of those two
families based on the phylogenetic analysis. Then, I analysed the transcript levels of those genes
in public databases, as well as their subcellular localizations to select the candidate genes in order
to generate KO mutant plants via the CRISPR/Cas9 techniques. Finally, I selected four genes in
tomato fruit, namely AMY3.2 (Solyc05g007070), BAM1.2 (Solyc09g091030), BAM3.2
(Solyc08g077530) and BAM9 (Solyc01g067660). Besides, our preliminary phenotyping results
showed that BAM9 may play important roles in the reproduction process in tomato.
4.2 Materials and Methods
Phylogenetic Analysis of BAM and AMY Family Members
Family members of BAM and AMY of tomato were identified by Moustakas (2013) with
comprehensive bioinformatic methods. He also performed a phylogenetic tree analysis, with three
species, Arabidopsis, tomato and potato. In order to compare only tomato and Arabidopsis, I
defined a new phylogenetic analysis with genes identified as encoding BAM and AMY protein
sequences (gene ID are listed in Table 3 in Chapter 1.2). Multiple sequence alignments of full-

Part II-Results
119
length protein sequences were executed by using the MEGA X software with default parameters
(Kumar et al., 2018). The Neighbor-Joining phylogenetic tree was constructed using protein
sequences with the Poisson correlation model, with 1000 bootstrap replications (Zuckerkandl and
Pauling, 1965; Saitou and Nei, 1987), and all positions containing gaps and missing data were
eliminated (complete deletion option).
Plasmid Constructions and Tomato Transformation
The same set of plasmids and manipulation procedures for plasmid construction that are described
in the Materials and Methods section of Chapter 3.2 were used. The specific target sequences
(guide sequences) are listed in Table 11. I used cotyledons of WT Micro-Tom to do the
transformation by following the same protocol as described in Chapter 3.2.
Table 11 The guide sequences selected for CRISPR/Cas9 mutagenesis of AMY/BAMs
Gene Guide Sequence (5’ to 3’)
AMY3.2 G1 CGGAGATAATGGCCGACGAG
G2 TTCTCTCGGAGGCCACTCTC
BAM1.2 G1 GATAAGGCACCGATCTGGTG
G2 TTACAGGCGTTGAAAAGCGC
BAM3.2 G1 TAGCCGACATGATGATGGCT
G2 CTTGACACCATGACTATGGG
BAM9 G1 ATAGAACTCCCCGTCTGGTG
G2 ACTGATGTTCCTGTCCTCGA
Genotyping and Phenotyping of Mutants
To select mutated KO mutants, the same procedures as described in Chapter 3.2 were used, and
the specific primers used are listed in Table 12. The phenotyping of the obtained mutants, which
included the determination of starch and hexoses, was as described in Chapters 2 and 3.

Part II-Results
120
Table 12 The primers for PCR
Gene Forward/Reverse
primer Sequence (5’ to 3’)
Size of PCR
product (bp)
SlAMY3.2 FP TCGAACCGCAAAAACCGAAT 706
RP AGAATACACAACGCCCAATC
SlBAM1.2 FP CCACAATTTCAACTCCTCCTTC 850
RP CATGTTTGATTTGACGGTATTC
SlBAM3.2 FP ATCAGCACAAATCATCACACAT 595
RP CCTCCACACTGATGAAAAGAC
SlBAM9 FP ATTCTCTTGCAGAGTGATGGTG 533
RP CATAATGCCCAAAAGCTTGAAAG
Pollen Germination
Solution for in vitro pollen germination: The pollen germination medium contained necessary
nutrients listed in Table 13. The pH of the solution was adjusted to 7 with 0.1 M KOH, and
autoclaved at 120°C for 20 min for sterilization.
Table 13 Pollen germination solution
Composition Final concentration
Sucrose 180 g/L
Boric Acid 100 mg/L
CaCl2 1 mM
Ca(NO3)2 1 mM
MgSO4 1 mM
Tris-HCL 1 mg/L
Sample harvesting and observation: To harvest the pollen, we selected fully opened flowers at
anthesis stage. The anthers were collected and split with tweezers and put into the germination
solution directly, which was then vortex to release the pollen. After overnight incubation at room
temperature, the pollen suspension was analysed using a stereomicroscope. In order to count the
rate of germinated pollen, I usually took at least three pictures per sample and used the ImageJ
software to evaluate the proportion of germinated pollen.

Part II-Results
121
4.3 Results
Identification of AMY and BAM Orthologues in Tomato
The orthologues of AMY and BAM in tomato were searched by using the corresponding
Arabidopsis sequences as seeds (results are listed in Table 3). As the previous phylogenetic trees
of AMY and BAM were made by Moustakas (2013) with Arabidopsis, tomato and also potato
with a different naming system (like BAM can be named as BMY and given a different number),
I constructed a phylogenetic tree based on the Neighbor-joining method using MEGA 7.0 with
AMY and BAM family members only from Arabidopsis and tomato, to further confirm their
phylogenetic relationships. In Arabidopsis, AMY and BAM consist of 3 and 9 family members,
respectively. In tomato, there are 5 AMY members; it is likely that both AMY1 and AMY3 are
duplicated copies, and 8 BAM members, which also showed duplicates, i.e. for BAM1 and BAM3.
However, for the subcluster that contains Arabidopsis BAM4 and BAM9, there was only one
tomato gene close to BAM9. A similar result was found for the subcluster containing Arabidopsis
BAM5 and BAM6, in which only the tomato member BAM5 was found. Those corresponding
genes found in tomato were named based on the results of the clustering analysis used to build the
phylogenetic tree and the position on the chromosome.

Part II-Results
122
Fig 26 Evolutionary relationships of α-amylase and β-amylase in Arabidopsis and tomato
A. Phylogenetic tree of Arabidopsis and tomato AMY. The optimal tree with the sum of branch
length = 1.84710964 is shown. This analysis involved 8 amino acid sequences. There were a
total of 385 positions in the final dataset.
B. Phylogenetic tree of Arabidopsis and tomato BAM. The optimal tree with the sum of branch
length = 4.31328901 is shown. This analysis involved 17 amino acid sequences. There were a
total of 379 positions in the final dataset.
The tree is drawn to scale, with branch length in the same units as those of the evolutionary
distances used to infer the phylogenetic tree.

Part II-Results
123
To be able to predict which genes are possibly involved in fruit starch degradation in tomato, we
retrieved the transcript levels and putative sublocations of AMY and BAM members from the
online database Tomato eFP Browser (http://bar.utoronto.ca/efp_tomato/cgi-bin/efpWeb.cgi) and
eplant (http://bar.utoronto.ca/eplant_tomato/), as shown in Table 14. When comparing those
members, two genes, AMY3.2 and BAM9 appeared striking for their high levels of expression
which significantly increase along with starch degradation during fruit development, especially
considering that BAM9 was reported as being non-catalytic and with unknown function in starch
degradation in Arabidopsis (Steidle, 2010). There were two other members, BAM1.2 and BAM3.2
that were interesting too, as they also showed relatively high levels of expression in fruit that
slightly increased during fruit development towards ripening. As described before, BAM3 and
BAM1 are the two most important BAM members involved in starch degradation in the leaf. They
may also play important roles in fruits. Thus, based on their plastid subcellular localization, the
association of their transcript levels with starch degradation, and their potential involvement in
starch degradation in leaf, I selected AMY3.2, BAM1.2, BAM3.2 and BAM9, i.e. 4 out of 13
AMY/BAM members, for further investigations.

Part II- Results
Table 14 transcript levels of AMY and BAM family in different tissues of tomato
The information of Solyc number, the putative subcellular location and transcript levels of tomato were extracted mainly in eFP
(http://bar.utoronto.ca/efp_tomato/cgi-bin/efpWeb.cgi) and ePlant (http://bar.utoronto.ca/eplant_tomato/) database, and listed in Table 14.
Name SolycSubcellullar
locationLeaves Root
Unopened
Flower Bud
Fully Opened
Flower1cm Fruit 2cm Fruit 3cm Fruit
Mature Green
FruitBreaker Fruit
Breaker Fruit
+ 10 Leaf
Immature
Green FruitBreaker Fruit
Breaker + 5
Fruit
AMY1.1 Solyc03g095710 extracelluar5.51 6.54 13.03 13 2.81 5.95 8.81 17.36 29.67 24.17 4.25 30.04 33.27 22.45
AMY1.2 Solyc04g078930 plastid0.69 5.67 0.72 0.36 0.28 0.43 0.23 0.24 0.52 0.22 0.05 0.47 0.57 0.3
AMY2 Solyc04g082090 cytosol7.75 18.43 15.68 12.5 14.3 17.05 14.89 20.72 19.7 20.48 5.12 20.39 42.04 44.01
AMY3.1 Solyc02g066950 cytosol39.13 13.48 11.74 12.42 18.13 20.5 12.48 7.11 2.16 1.12 52.12 13.67 11.32 5.09
AMY3.2 Solyc05g007070 plastid44.48 16.23 11.81 33.7 20.07 34.44 65.14 135.41 347.97 241.49 72.09 256.52 351 164.96
BAM1.1 Solyc08g082810 plastid7.83 8.06 9.02 7.83 8.86 8.72 9.78 6.77 7.57 13.73 5.88 11.48 10.03 11.95
BAM1.2 Solyc09g091030 plastid23.68 8.71 61.76 167.13 32.18 27.82 15.43 22.71 23.22 56.37 13.83 13.92 18.1 23.78
BAM3.1 Solyc08g007130 Unknown2.34 2.21 4.9 73.56 4.01 6.97 4.43 1.26 0.15 0.56 2.16 0.18 0.13 0.11
BAM3.2 Solyc08g077530 plastid40.96 3.39 6.93 19.36 23.95 64.45 80.7 71.51 62.52 23.01 8.24 26.26 15.82 24.75
BAM5 Solyc07g052690 plastid26.08 1.77 12.19 19.57 2.49 1.45 0.98 9.83 11.95 15.56 29.07 11.88 12.95 12.17
BAM7 Solyc01g094580 nucleus8.46 16.72 11.95 11.91 12.83 11.73 18.01 11.74 10.44 7.34 7.65 14.45 12.29 8.38
BAM8 Solyc08g005780 nucleus6.13 5.87 8.01 6.68 14.01 15.71 13.02 14.09 6.05 5.83 5.42 7.7 6.78 4.24
BAM9 Solyc01g067660 plastid21.64 19.14 39.18 181.62 67.66 188.06 364.32 224.14 415.51 547.63 6.98 232.36 349.51 1002.2
S. lycopersicum cv Heinz S. pimpinellifoliumCoding gene

Part II-Results
125
Generation of Mutants for Putative Fruit-specific Amylases (AMY3.2,
BAM1.2, BAM3.2 and BAM9)
I used CRISPR/Cas9 to generate mutants for each of the four selected candidate gene, i.e. AMY3.2,
BAM1.2, BAM3.2 and BAM9. I designed 2 single-guide RNAs targeted to the exon 1 or exon 2,
aiming to cause InDel mutations that lead to in-frame premature stop codons and truncated proteins.
The putative mutants were screened firstly by PCR amplification of the targeted regions, and the
PCR fragments were Sanger sequenced to identify the InDel mutations. For each candidate gene,
we identified three independent transformants with mutations (from Fig 27 to 30). Before the
COVID-19 lockdown, I had only obtained the T1 generation. In this generation, there were
homozygous KO mutants only for AMY3.2 and BAM9.
For AMY3.2, there were two lines with homozygous KO/missense individual plants, and one line
with a heterozygous mutation. It is necessary to mention that for the transgenic line AMY3.2-3,
there were two types of mutations: plant 3 was a homozygous KO, though plants 5 and 8 were
missense mutants that only missed "RPL" (arginine, proline and leucine), 3 amino acids at the
beginning of the protein, which may not affect the protein function. For BAM9, luckily, we
obtained 3 homozygous KO lines, and at least 3 individual plants per line. All of them had
mutations with single nucleotide insertion or deletion, which led to premature stop codons and
thus truncated proteins. For BAM1.2 and BAM3.2, we only produced heterozygous mutants with
various types of mutations (Fig 28 and 29).
Considering that in Arabidopsis, BAM mutations are usually recessive and also that there is
functional redundancy between these AMY and BAM gene families (reviewed by Monroe and
Storm, 2018), I decided to start with the homozygous mutant lines of AMY3.2 and BAM9 for
detailed phenotyping. For BAM1.2 and BAM3.2, I attempted to select homozygous KO mutants
in the T2 generation.

Part II-Results
126
Fig 27 Mutations in T1 generation of CRISPR/Cas9 mutants for AMY3.2
A. Mutations of 3 transgenic lines are shown for AMY3.2 (Solyc05g007070). The mutations
generated by CRISPR/Cas9 were represented by black asterisks indicating the mutated
positions, and the exact insertions or deletions were also showed in black box. For example,
[C] means an insertion of “C”; C means a deletion of “C”, and [T>C] means a transition from
“T” to “C”. The sequences of two guides are also shown in the black box. For the AMY3.2-3
line there were two types of mutations, which are shown in the black box.
B. The mutated protein sequences are indicated by a grey cross and the exact mutated sequences
are shown in the black box. The stop codon is shown by red asterisks, and M is the methionine
for the start of translation. RPL means the deletion of three amino acids “RPL”.
Exon 3’ UTR
Catalytic domain
8921
C-terminal beta-sheet domain
AMY3.2-Solyc05g007070:
CTCGTCGGCCATTATCTCCGGCGAAGCCCAAAGCTATATCCAAATCAGAAG……TTCTCTCGGAGGCCACTCTCCGGTACCG
CAACTTTGAGA……
AMY3.2-3 P3:
……………………………………………………………………………………………………TTCTCTCGGAGGCCACTCTCCGGTACC
GCAACTTTGAGA……
AMY3.2-3 P5&8:
…………………………………………………………………………………………......……TTCTCTCGGAGGCCACTCTCCGGTACCGCAACT[T>C]TGAGA……
AMY3.2-4:
………………………………………………………………………………………..................TTCTCTCGGAGGCCACTCTCCGG…..
AMY3.2-8:
CTCGTCGGCCATTATCTCCGGCGAAGCCCAAAGCTATATCCAAATCAGAAG……..TTCTCTCGGAGGCCACTCTCCGG……
Guide1 Guide2
AMY3.2-Solyc05g007070: MSTVTMEPLVGHYLRRSPKLYPNQKKTSHFSLNFSRRPLSGTATLRFCDYRRSRTVPIRA……
AMY3.2-3 P3: MSTVTMEPLVGHYLRRSPKLYPNQKKTSHFSLNFSRRPL*
AMY3.2-3 P5&8: MSTVTMEPLVGHYLRRSPKLYPNQKKTSHFSLNFSRRPLSGTATLRFCDYRRSRT……
AMY3.2-4: MSTVTMEPLVGHYLRRSPKLYPNQKKTSHFSLNFSRRLRYRNFEILRLSA*
AMY3.2-8: MSTVTMEPLEENLSFFSKFLSEAISGTATLRFCDYRRSRTVPIRASSTDAAVIETSEQSDV……
*
A AMY3.2 Solyc05g007070
B AMY3.2 Protein
*
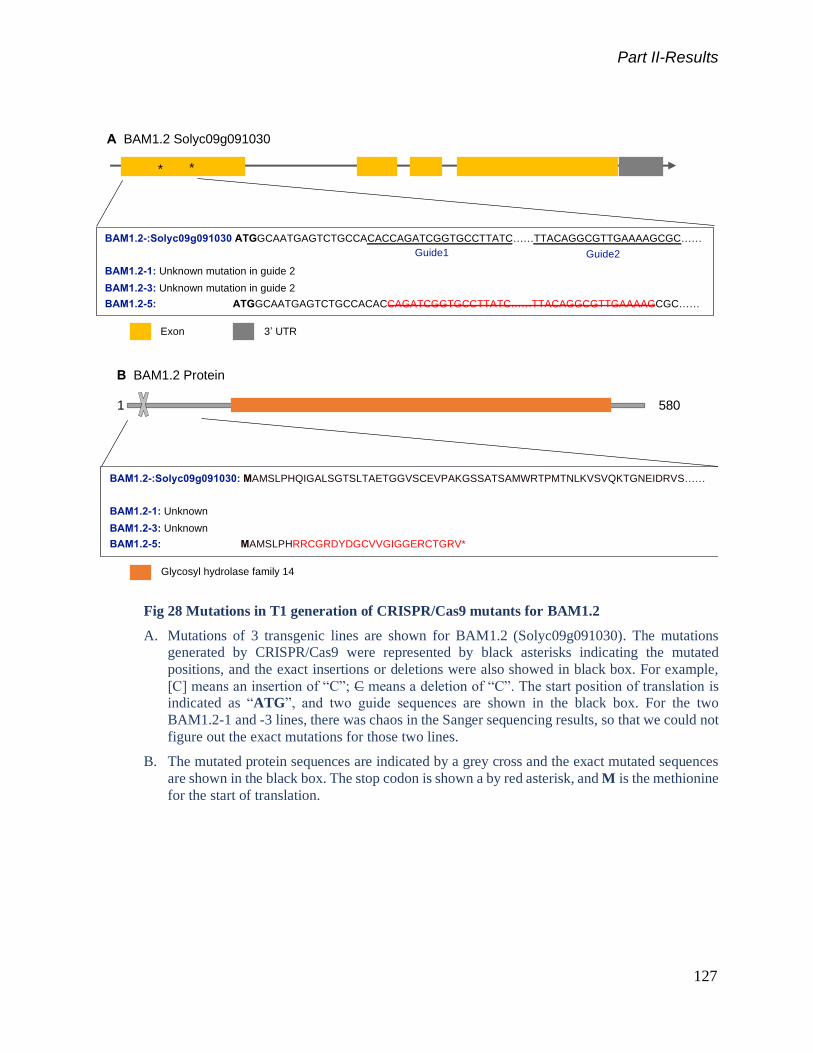
Part II-Results
127
Fig 28 Mutations in T1 generation of CRISPR/Cas9 mutants for BAM1.2
A. Mutations of 3 transgenic lines are shown for BAM1.2 (Solyc09g091030). The mutations
generated by CRISPR/Cas9 were represented by black asterisks indicating the mutated
positions, and the exact insertions or deletions were also showed in black box. For example,
[C] means an insertion of “C”; C means a deletion of “C”. The start position of translation is
indicated as “ATG”, and two guide sequences are shown in the black box. For the two
BAM1.2-1 and -3 lines, there was chaos in the Sanger sequencing results, so that we could not
figure out the exact mutations for those two lines.
B. The mutated protein sequences are indicated by a grey cross and the exact mutated sequences
are shown in the black box. The stop codon is shown a by red asterisk, and M is the methionine
for the start of translation.
BAM1.2-:Solyc09g091030 ATGGCAATGAGTCTGCCACACCAGATCGGTGCCTTATC……TTACAGGCGTTGAAAAGCGC……
BAM1.2-1: Unknown mutation in guide 2
BAM1.2-3: Unknown mutation in guide 2
BAM1.2-5: ATGGCAATGAGTCTGCCACACCAGATCGGTGCCTTATC……TTACAGGCGTTGAAAAGCGC……
Guide1 Guide2
Exon 3’ UTR
5801
Glycosyl hydrolase family 14
BAM1.2-:Solyc09g091030: MAMSLPHQIGALSGTSLTAETGGVSCEVPAKGSSATSAMWRTPMTNLKVSVQKTGNEIDRVS……
BAM1.2-1: Unknown
BAM1.2-3: Unknown
BAM1.2-5: MAMSLPHRRCGRDYDGCVVGIGGERCTGRV*
*
A BAM1.2 Solyc09g091030
B BAM1.2 Protein
*

Part II-Results
128
Fig 29 Mutations in T1 generation of CRISPR/Cas9 mutants for BAM3.2
A. Mutations of 3 transgenic lines are shown for BAM3.2 (Solyc08g077530). The mutations
generated by CRISPR/Cas9 are represented by black asterisks indicating the mutated positions,
and the exact insertions or deletions are shown in the black box. For example, [C] means an
insertion of “C”; C means a deletion of “C”. The start position of the translation is indicated as
“ATG”, and two guide sequences are shown in the black box.
B. The mutated protein sequences are indicated by a grey cross and the exact mutated sequences
are shown in the black box. The stop codon is shown by a red asterisk, and M is the methionine
for the start of translation.
BAM3.2-Solyc08g077530: ATGACTTTAACACTTCA……AGCCATCATCATGTCGGCTA…..CTTGACACCATGACTATGGG…
BAM3.2-1: ATGACTTTAACACTTCA……AGCCATCATCATGT[C]CGGCTA…..CTTGACACCATGACTATGGG…
BAM3.2-11: ATGACTTTAACACTTCA……AGCCATCATCATG[G]TCGGCTA…..CTTGACACCATGACTATGGG…
BAM3.2-13: ATGACTTTAACACTTCA…… AGCCATCATCATGTCGGCTA……CTTGACACCATGACTATGGG…
Guide1 Guide2
Exon 3’ UTR
Glycosyl hydrolase family 14
BAM3.2-:Solyc08g077530: MTLTLQSSASFINFKETKGVKTPDEFLGMVSFAQAKPSSCRLVAKSSMQEAQLSHER…….
BAM3.2-1: MTLTLQSSASFINFKETKGVKTPDEFLGMVSFAQAKPSSCPASCEKFDARSSTLP*
BAM3.2-11: MTLTLQSSASFINFKETKGVKTPDEFLGMVSFAQAKPSSWSASCEKFDARSSTLP*
BAM3.2-13: MTLTLQSSASFINFKETKGVKTPDEFLGMVSFAQAKHHHVG*
B BAM3.2 Protein
5461
A BAM3.2 Solyc08g077530
* *

Part II-Results
129
Fig 30 Mutations in T1 generation of CRISPR/Cas9 mutants for BAM9
A. Mutations of 3 transgenic lines are shown for BAM9 (Solyc01g067660). The mutations
generated by CRISPR/Cas9 are represented by asterisks indicating the mutated positions, and
the exact insertions or deletions are shown in the black box. For example, [A] means a insertion
of “A”; G means a deletion of “G”. For the BAM9-10 line, there were 2 types of mutations
found in the T1 generation, plant 6 and 11 had an insertion of “G”, and plant 1, 3 and 8 had a
deletion of “G”. The start position of translation is indicated as “ATG”, and two guide
sequences are also shown in the black box.
B. The mutated protein sequences are indicated by a grey cross and the exact mutated sequences are shown in the black box. The stop codon is shown by a red asterisk, and M is the methionine
for the start of translation.
5351
Glycosyl hydrolase family 14
BAM9-Solyc01g067660: ATGGAGGTTTCAGTGA……ATAGAACTCCCCGTCTGGTG……ACTGATGTTCCTGTCCTCG……
BAM9-2: ATGGAGGTTTCAGTGA……ATAGAACTCCCCGTCTG[A]GTG……ACTGATGTTCCTGTCCTCG…
BAM9-8: ATGGAGGTTTCAGTGA……ATAGAACTCCCCGTCTGGTG……ACTGATGTTCCTGTCCTCG……
BAM9-10 P6&11: ATGGAGGTTTCAGTGA……ATAGAACTCCCCGTCTGG[G]TG……ACTGATGTTCCTGTCCTCG……
BAM9-10 P1, 3&8: ATGGAGGTTTCAGTGA……ATAGAACTCCCCGTCTGGTG……ACTGATGTTCCTGTCCTCG……
Guide1 Guide2
BAM9- Solyc01g067660: MEVSVMGSSQVNLGRNDL ……LKALKLLGVDGIELPVWWGVVEKETRGKYDWTGYLALA……
BAM9-2: MEVSVMGSSQVNLGRNDL……LKALKLLGVDGIELPV*
BAM9-8: MEVSVMGSSQVNLGRNDL…….LKALKLLGVDGIELPVCGELLRRKPGESMTGQATLHLLK*
BAM9-10 P6&11: MEVSVMGSSQVNLGRNDL…….LKALKLLGVDGIELPVWVGSC*
BAM9-10 P1, 3&8: MEVSVMGSSQVNLGRNDL……LKALKLLGVDGIELPVCGELLRRKPGESMTGQATLHLLK*
B BAM9 Protein
A BAM9 Solyc01g067660
* *
Exon 3’ UTR5’ UTR

Part II-Results
130
Phenotyping of AMY3.2 and BAM9 Homozygous Mutants
Involvement of AMY3.2 in Fruit Starch Metabolism
The first phenotyping was mainly performed on fruit samples collected at three developmental
stages, i.e. 20 and 35 DAP and red ripe. For starch metabolism, those three stages are the most
representative, since starch is most abundant at 20 DAP when expressed on a fresh weight basis.
After 20 DAP starch rapidly decreases to become 4 times lower at 35 DAP, and at the red ripe
stage it is almost totally degraded. Under our growth condition, the mutants grew normally, like
the WT plants. However, in the two homozygous mutant lines of AMY3.2, starch amounts were
significantly lower than in the WT at 20 DAP. In contrast, there was no obvious difference found
for starch at 35 DAP and at ripeness. For hexoses, there was no significant change between mutants
and WT at the red ripe stage (Fig 31, B).

Part II-Results
131
Fig 31 Starch and hexoses contents in AMY3.2 homozygous mutants
A. Amount of starch in fruits at 20 and 35 DAP of AMY3.2 homozygous mutants. Starch content
is presented as means SD (n=5 for the WT; n=3 for the AMY3.2 mutant lines).
B. Fructose and glucose contents in red ripe fruits of AMY homozygous mutants. Hexose content
is presented as means SD (n=5 for the WT; n=3 for AMY3.2 mutant lines).
The Significance was tested using a t-test, and one or two asterisks indicate P<0.05 or P<0.01,
respectively.
Fruits at RR stage
Fructose Glucose
He
xose
con
tent
(μm
ol/g
FW
)
0
10
20
30
40
50
60
70
80
90
WT
AMY3.2-3
AMY3.2-8
Fruits at different stages
20 DAP 35 DAP
Sta
rch
con
tent
(μm
ol.eq.g
lucose
/gF
W)
0
10
20
30
40
50
60
70
80
90
100
WT
AMY3.2-3
AMY3.2-8
*
**A
B

Part II-Results
132
Impaired Pollen Germination in BAM9 Mutants
BAM9 mutants showed more diversified phenotypes. Firstly, at the flowering stage, in two
individuals KO plants BAM9-2_5 and BAM9-8_6 the fertility was impaired as shown by the total
absence of germination for the pollen of these two mutants (Fig 32). As a consequence, these
plants did not produce enough fruit for analysing starch content at 20 and 35 DAP and at red ripe
stages.
Fig 32 Rate of pollen germination in two BAM9 KO individual plants
Pollen was taken from fully opened flowers and submitted to a germination test. For the WT, pollen
was taken from 3 individual plants, and 3 flowers each. For BAM9-2_5, and BAM9-8_6 KO
mutants, pollen was taken from 1 individual per line, and 3 flowers each. Data is expressed as %
of germination (mean SD).
Involvement of BAM9 in Starch Remobilisation in Ripening Fruit
The other individual BAM9 KO mutants produced more fruits than BAM9-2_5 and BAM9-8_6
lines, thus I could sample enough fruits for analysing starch or hexose contents at 3 stages. Starch
levels measured at 20 and 35 DAP were very fluctuating, varying from 22 to 154
71.5%
0.0% 0.0%0%
20%
40%
60%
80%
100%
WT BAM9-2_5 BAM9-8_6
Polle
nge
rmin
atio
n
WT and mutant lines

Part II-Results
133
µmol.eq.glucose.g-1 FW at 24 DAP, and from 11 to 149 µmol.eq.glucose.g-1 FW at 35 DAP (Fig
33, A). Thus, some mutants had higher starch levels than the WT and others had less starch. In the
WT and as expected starch was highest at 20 DAP and strongly decreased at 35 DAP. However,
in a majority of mutant plants (5 out of 9) starch was unchanged or even increased between 20 and
35 DAP (e.g. in lines BAM9-2_8, 8_7, 10_6, 10_8 and 10_11). Besides, in the BAM9-10_11
mutant, starch was much higher than in the WT, whereas in BAM9-2_1, 8_5 and 10_3 mutants
the starch content was similar to that of the WT.
Lack of BAM9 Leads to Increased Glucose in Red Ripe Fruit
I next focused on hexoses (fructose and glucose) amount in red ripe fruits, since starch degradation
is often assumed to contribute to hexose accumulation during ripening (Schaffer and Petreikov,
1997). Because hexose contents in those plants were much more stable and repeatable for
individuals of each transgenic line, I used each individual as biological replicate. Results showed
no differences for fructose among all mutants and WT, but for glucose, in all the three lines studied
glucose content was significantly increased by 1.4 and 1.6 times (P<0.01, Fig 33, B) in comparison
with the WT.

Part II-Results
134
Fig 33 Starch and hexoses contents in BAM9 homozygous KO mutants
A. Amount of starch in fruits at 20 DAP and 30 DAP of BAM9 homozygous KO mutants. Data
are presented as means SD (5 individuals for the WT; for each individual of BAM9 mutant
line, 3 technical replicates were used to calculate the SD).
B. Fructose and glucose contents in red ripe fruits of BAM9 homozygous KO mutants. Data are
presented as means SD (n=5 for the WT; n=3 for each line). The Significance was tested
using a t-test, and one or two asterisks indicate P<0.05 or P<0.01, respectively.
0
30
60
90
120
150
180
WT2_1 2_8
8_5 8_710_1
10_310_6
10_810_11
Sta
rch
co
nte
nt
(μm
ol.e
q.g
luco
se
/gF
W)
BAM9 mutant lines
20 DAP
35 DAP
A
Fructose Glucose
Hexo
se
conte
nt
(μm
ol/g
FW
)
0
20
40
60
80
100
120
140
WT
BAM9-2
BAM9-8
BAM9-10
**
B

Part II-Results
135
4.4 Discussion
Following the integration of genomic and transcriptional data available online, I selected AMY3.2,
BAM1.2, BAM3.3 and BAM9 as candidate proteins potentially involved in the degradation and/or
regulation of starch turnover in tomato fruit. Although homologues of these genes have been
proposed to be involved in starch degradation at ripening in kiwi and banana, based on correlative
evidence (do Nascimento et al., 2006; Nardozza et al., 2013; Hu et al., 2016; Xiao et al., 2018),
they have not been tested in vivo. Taking advantage of the tools available for tomato, I used
CRISPR/Cas9 to generate KO mutants for these four genes.
In the two homozygous lines of AMY3.2, starch content was significantly lower in fruits at 20
DAP than WT. It is tempting to speculate that it may play a role in starch degradation. However,
in the T1 generation, I could only characterize two lines of homozygous mutants, and considering
that starch amounts show large variations along fruit growth and are affected by culture conditions
(described in Chapter 2 Results), more mutants will be required to confirm these data with the T2
generation. Contrarily, Arabidopsis mutant lacking AMY3 displayed no change in leaf starch
turnover (Yu et al., 2005). However, knocking out AMY3 in other mutant backgrounds, such as
KO mutants for the four DBEs or for ISA3 and LDA genes, resulted in alterations of starch
accumulation. These results suggest that there is a functional redundancy of starch related enzymes
in leaf, and that AMY3 also participates in starch degradation. Thalmann et al. (2016) also reported
that AMY3 together with BAM1 are involved in stress-induced starch degradation. Loss of AMY3
and BAM1 activities impaired root growth of Arabidopsis, and those double mutants were
hypersensitive to osmotic stress (Thalmann et al., 2016). However, loss of BAM1 and AMY3
alone or together does not affect starch metabolism in mesophyll cells under normal conditions
(Horrer et al., 2016; Thalmann et al., 2016), indicating that they have tissue-specific functions and
respond to certain abiotic stress signals.
For BAM9 KO mutants, we observed more diversified phenotypes. In two individual lines, a
drastic reduction of pollen germination rate suggested that BAM9 is essential for pollen viability.
A series of studies on the effect of heat stress in tomato suggested that starch plays important roles
in pollen viability and germination. Under optimal temperature conditions (28/22℃, day/night
temperature), the maximum of starch amount in the pollen grains was observed at 3 days before

Part II-Results
136
anthesis, then starch content decreased towards anthesis. In contrast, hexose amounts gradually
increased during flower development, reaching their maximum at anthesis. However, continuous
exposure of the plants to high temperatures (32/26℃) prevented this transient increase of starch
and led to decreased soluble sugar levels in the cell wall of anthers and pollen grains (Pressman et
al., 2002). It was observed that heat stress did not significantly reduce the flower or pollen grain
numbers, but caused significant decreases of pollen viability and the number of released pollen
grains, thus markedly decreasing fruit set (Sato et al., 2006). Those results indicate that in tomato
the failure of fruit set under high temperature is possibly due to the alteration of sugar metabolism
during flower development, mainly at the anther level. A similar scenario was observed in maize,
in which heat stress reduced pollen starch content, sugar related enzymatic activities, decreased
pollen germination rate, and consequently reduced fertility. The integration of metabolic,
lipidomic, and transcriptomic data suggested that, in maize, heat stress strongly affects central
metabolic pathways during pollen development, which impairs its germination capacity and can
result in severe yield losses (Begcy et al., 2019).
There was one attempt to obtain mutants lacking GWD (Glucan water dikinase), an enzyme which
controls the phosphate content of starch in tomato, but it caused sterility in the heterozygous KO
mutant, making the selection homozygous mutant impossible (Nashilevitz et al., 2009). In the
GWD heterozygous mutant, starch content was higher in the pollen at anthesis and pollen
germination rate was reduced. However, in the BAM9-mutant obtained here, the pollen did not
show such a starch-excess phenotype. It is thus tempting to hypothesise that BAM9 may affect
starch degradation in flowers, thus impacting the availability of carbon and/or energy during anther
development, thus impairing pollen viability, and ultimately, fruit set. It will be interesting to
confirm this result.
The large fluctuations found for starch between individual bam9 mutants in fruits at 20 and 35
DAP were unexpected. Was it a consequence of the growth conditions? Probably not, because in
AMY3.2 mutants and WT the starch content was much more reproducible. Was it a consequence
of poor fertility? Even though we had enough fruit set for sampling, the number of seeds per fruit
may have varied. Unfortunately, we did not pay special attention to seed numbers during sampling,
which must be considered in T2 phenotyping. Another possible explanation for this fluctuation in
starch content could be that the mutation impacts the expression and/or activity of other starch-

Part II-Results
137
related genes, thus leading to pleiotropic effects that would partially alleviate the expected starch-
excess phenotype. However, when we compared the relative starch content at two stages of fruit
development within a given plant, there was an obvious trend indicating that BAM9 is involved in
starch degradation. Thus, when expressing starch measured at 35 DAP as a percentage of starch
measured at 20 DAP, we found that in 6 out of 9 transgenic plants, there was still more starch
stored than in the WT (>30%). However, I could not conclude about the starch-excess phenotype
at 35DAP in the BAM9, but this result demonstrates that to be confirmed (or not), more individual
plants for T2 generation are needed to phenotype fruits at those two stages.
Another promising result we observed in red ripe fruits was a significant increase in the glucose
content, in all three BAM9 KO lines, whereas fructose and starch were unchanged. Glucose and
fructose contents are usually very reproducible in red ripe tomato fruit, whatever the position on
the truss, the position of the truss, the growth conditions or even the growth location (Biais et al.,
2014). Moreover, for fruits grown under high salinity, both glucose and fructose increased in
parallel (Yin et al., 2010). Therefore, in transgenic tomato with down-regulated fumarase, starch
content increased by two fold, besides in some lines, glucose and fructose contents were also
increased together (Centeno et al., 2011). Thus, the specific and relatively large increase in glucose
but not in fructose found in the BAM9 KO red ripe fruits can be considered as striking.
There is little information about the possible functions of BAM9 in starch metabolism. In potato,
StBAM9 and also StBAM1 were silenced to study their role during cold-induced sweetening.
However, the silencing of the BAM9 gene did not result in a decrease of β-amylase activity, thus
confirming that BAM9 is a non-catalytic protein (Hou et al., 2017). Nevertheless, silencing
StBAM9 and StBAM1 in potato resulted in elevated starch levels in tubers. This gain was
enhanced for silenced lines for the two genes, implying that a functional redundancy may exist.
More recently, it was shown that StBAM9 interacts with StBAM1 during the starch granules fate,
suggesting that BAM9 may facilitate starch degradation by recruiting StBAM1 to the starch
granule (Hou et al., 2017).
One hypothesis to explain the increase in glucose observed in the BAM9 mutants is that delayed
starch degradation during ripening could result in less sugar used in processes such as the
climacteric respiration, which dissipates energy (Colombié et al., 2017). This hypothesis assumes

Part II-Results
138
that starch would be ultimately degraded into glucose in red ripe fruits. However, we still lack
proof to validate this hypothesis. Firstly, more reproducible data for starch content need to be
obtained from more BAM9 mutants. Next, some direct observations of the starch granule could be
performed during the ripening stage (like 35 DAP), as BAM9 was assumed to act on the starch
granule (Hou et al., 2017), lacking of BAM9 may result the changes of morphology of starch.
All those promising results obtained with the T1 generation of BAM9-KO mutants encouraged us
to include more individual plants in the T2 generation, and examine pollen germination as well as
BAM enzyme activities for all transformants. Besides, as we also generated mutants of BAM1.2
and BAM3.2, which are the two main players of starch degradation in Arabidopsis leaves, it will
be important to phenotype them too. It is worthy to mention that large amounts of starch are
completely degraded when fruits reach the red ripe stage, indicating that a very efficient
degradation machinery exists for fruit starch fate. The extinction of a single starch-related enzyme
may slow down the degradation process without totally stopping it. Thus, it would be interesting
to generate double or triple mutants by crossing the BAM9 with BAM1.2 and BAM3.2 mutants,
to analyse the possible interactions between these three proteins, and the possible functional
redundancy between them. However, we also found that pollen viability is very sensitive to
alterations in starch metabolism. Thus, such multiple mutants might be sterile, and thus very
difficult to study. To overcome this undesired effect on pollen fertility, silencing BAMs in a fruit-
specific manner would be feasible.

Summary and Outlook

Part III-Summary and Outlook
140

Part III-Summary and Outlook
141
Chapter5 Summary and Outlook
Forward genetics have proven powerful for discovering novel mechanisms in plants. To our
knowledge, this the first report of an attempt to screen for fruit starch mutants in tomato and
identify the causal mutations. The fact that screening Arabidopsis mutants for leaf starch
phenotypes has been extremely successful (Caspar et al., 1985; Zeeman et al., 1998) motivated
my project exploiting the Micro-Tom EMS population developed in Bordeaux (Just et al., 2013).
However, we found that compared to starch accumulation in leaves of Arabidopsis, starch levels
found in tomato fruits present large fluctuations, which largely depend on the development stage,
but also the season (temperature and irradiance) as well as sink-source relationships. To reduce the
variation and obtain as reproducible as possible starch measurements, and thus avoid false-
positives or -negatives, I established a protocol with a range of extra controls including the marking
of the pollination date combined to precise sampling dates of the fruit to obtain material at precise
developmental stages, the thinning of flowers and fruits to decrease the influence of source-sink
relationships, and always including enough WT individuals as controls in the experiments. By
following the pipeline proposed by Garcia et al.(2016), I was able to confirm the starch-excess
mutant P17C12 as homozygous mutant with a recessive phenotype, and I subsequently sequenced
and mapped the causal region on chromosome 1. The whole procedure and results are summarized
in Fig 34.
Our results also show that thanks to the combination of next-generation sequencing and robotic
high throughout biochemical phenotyping, the screening and mapping procedure was largely
shorted, so that within 2 years we had identified the region of interest. However, we then
encountered other challenges, especially when considering the difficulties we faced in predicting
and identifying the possible effect of SNP located in non-coding sequence regions.

Part III-Summary and Outlook
142
Fig 34 Summary of results we obtained by using forward and reverse genetics to study starch
metabolism
The arrows indicate the next steps for continuing. The key steps of the whole project were indicated
in dark blue background, and the main outputs (also the inputs for the next steps) were indicated in
purple background. The steps in dashed boxes were the goals for our research.
After excluding the possible candidate mutations according to the SNP effect (KO, missense or
modifications in 5’ UTR and 3’ UTR), how to find the causal mutation in P17C12? By having
used the controls mentioned above, I am confident about the phenotyping, the bulk construction
and the sequencing procedures that have been used. However, it appeared that identifying the
causal gene was much more difficult that initially foreseen. In particular, the most obvious
candidates, which include knockout and missense mutations, were not validated. A previous case
of a causal mutation for locule numbers (the corresponding mutation was named lc) that turned
3000 individual plants
Second Screening
Mutant and WT-like Bulk 1
Sequencing and mapping
Candidate mutations 1
No starch phenotype 1
Characterizations
WT of Micro-Tom
Metabolite profiles of fruits at
development stages
Model Verification
F1 S1 and WT
Phenotyping
Genotyping
Bioengineering
Investigate transcript/protein/metabolism
aspects to see how causal mutations
cause mutant phenotypes
Functional studies
BC1F2
Fine mapping
Output/Input
Output/Input
Output/Input Causal mutation/mutants with
starch-related phenotypes
Forward genetics
Reverse genetics
Starch Mutants 1
Constraint-based Modelling 1
Metabolite profiles of fruits at
development stages
First Screening
3 mutants: 17C12 21
Confirmed as starch-excess mutants
17C12: homozygous mutant with
recessive starch-excess phenotype
End of chromosome 1
RECQ4 (KO)
MCF (Missense)
PTA (Missense)
AMY3.2, BAM1.2, BAM3.2, BAM9
CRISPR/Cas9Overexpression § BAM1.2&BAM3.2: T1 Heterozygous mutants
§ BAM9: homozygous KO mutants, starch
retaining in mature fruits and high glucose
in red ripe fruits
Homozygous KO
or missense mutants
A 14cM region with 1 KO, 2 missense,
numerous non-coding sequence mutations
CPuORF (5’UTR) Rubredoxin (3’UTR)
CRISPR/ nCas9At-
PmCDA1At
Homozygous mutants
with 5’UTR mutations
CRISPR/Cas9
KO / 3’UTR mutants,
35S-overexpressed
mutants
§ AMY3.2: Lower starch content in green fruits
CRISPR/Cas9
T2 generation

Part III-Summary and Outlook
143
out to be an intergenic mutation may give us some clues for finding the causal SNP in a non-coding
region (Muños et al., 2011). A large F2 population was used to identify the genomic region of lc
and a final sequence analysis of the region restricted lc to a 1,608-bp region including 14
polymorphic sites (13 SNPs and a 1 bp InDel). This region was located in a non-coding region
between the WUSCHEL gene and a gene encoding a WD40-repeat protein. Functional studies of
this 1608-bp region (mainly examined the possible transcript and transcript levels) revealed that
there were no differences in the expression of these two genes in sub-near-isogenic lines. Then,
quantitative RT-PCR assays conducted by using several primer pairs inside and surrounding the
locus revealed no expression of this region. Thus, instead of using transformation to try to validate
the mutations, the researchers used a combination of fine mapping and association mapping and
phenotyping with 9,456 F2 individuals to successfully identify the two SNPs responsible for lc.
In our case, we probably need more BC1F2 plants derived from P17C12 to obtain a fine mapping
with higher resolution to be able to further narrow down the possible regions. The BC1F2
population of 200 plants that we used was perhaps too small compared to previous approaches
used to map causal mutations. For example, 343 BC1F2 plants were used to map the mutations
responsible for the glossy phenotype of fruits (Petit et al., 2016) and 440 to map a mutant with
excessive ascorbate in the fruit (Bournonville, 2015). The needed size of the F2 population
strongly depends on the accuracy of the phenotyping but also on the rate of recombination. In our
case, thanks to the KO mutation of RECQ4, we have a very high recombination rate, which enabled
to narrow down the possible candidate regions to a 14 cM region with only 1 KO, 2 missense and
numerous mutations in non-coding sequence regions. However, since we found that the most
possible candidates (according to the mutation effect) were not the causal ones, other mutations
present in non-coding sequences need to be investigated. Examining those candidates will be more
difficult, because mimicking the exact EMS SNP mutations would request the generation of a very
large number of mutants, according to the results we obtained when we tried to mimic the SNP in
the 5’ UTR region of CPuORF. Another concern will be about the assembly of chromosome 1.
Chromosome 1 is the longest chromosome with large physical and genetic distances (Hosmani et
al., 2019). When comparing the end of chromosome 1 as described by SL3.0 and by the recently
released SL4.0 two genome-assembly versions we saw obvious differences between the respective
sequences, such as ch01G91491515A predicted as a downstream gene variant of

Part III-Summary and Outlook
144
Solyc01g102950.3, but actually located in an intron of Solyc01g102970.2. Additionally, we
mapped the sequences to the genome of cv. Heinz, not directly to the Micro-Tom genome; it may
produce some bias too. Thus, it will also be necessary to remap the sequencing results according
to SL4.0 or Micro-Tom genome and to re-analyse the SNP effect.
Reverse genetics, as a complementary strategy for studying starch metabolism in tomato fruit, gave
us some promising results, for AMY3.2 and BAM9. Thus the KO homozygous mutants obtained
for this gene showed an impaired degradation of starch during ripening as well as an increase in
glucose content in the ripe fruit. However, as suggested by our results, knocking out genes involved
in starch metabolism may also affect other reproductive stages. Thus, we have seen that the pollen
of two individuals BAM9 KO mutants was unable to germinate, implying that starch metabolism
is essential for pollen viability. A similar scenario was previously found in a heterozygous GWD
(Glucan, Water Dikinase) mutant (Nashilevitz et al., 2009). We decided to continue the study of
the KO mutants obtained for AMY3.2, BAM1.2, BAM3.2 and BAM9 by phenotyping the T2
generations, of both the pollen and the fruit.
Moreover, starch mutants can be used for studying the diversified physiological roles of starch in
fruit development. In our group, a constraint-based modelling approach was used to estimate
metabolic fluxes along fruit development (Colombié et al. 2017). By investigating the energetic
metabolism of the fruit pericarp, they associated the metabolism of starch (and to a lesser extent
of the cell wall) to the respiration climacteric. According to the model output, it was proposed that
in the ripening tomato fruit, excessive energy resulting from the massive degradation of starch and
cell wall degradation is dissipated via the respiration climacteric. We would like to further confirm
this hypothesis with mutants that accumulate abnormal amount of starch. The mutants obtained
here could be used to verify the hypothesis generated by the model. Additionally, the KO mutants
of BAMs of tomato can be used to study the functions of the orthologues from other species, such
as kiwifruit, banana and apple, as for those fruits in vivo manipulations are more difficult and time-
consuming.
According to the knowledge and experience I obtained from forward genetics for screening starch
mutants in fruits, and reverse genetics for generating starch-related mutants via target AMY/BAMs
by using CRISPR/Cas9 techniques, I would like to propose an alternative way to screen mutants

Part III-Summary and Outlook
145
related to starch degradation or accumulation, which would focus more on glucose content in red
ripe fruit, other than measuring starch directly in immature green, mature green or breaker fruits.
One reason is that starch content shows remarkable variations during fruit growth, affected
significantly by sink/source relationship and environmental conditions, thus it asked more effort
for controlling fruit growth and sampling. Even so, we still obtained results with big fluctuations.
Therefore, in order to overcome this, it required to repeat in a new generation (like for BAM3.2
and BAM9) and include more individuals. All those procedures actually limited us to screen more
mutants and impeded us to confirm a starch-related mutant quickly and robustly.
Secondly, big variations of starch seem have no impact on the repeatability and stability of hexose
contents. A striking case was showed in Chapter 4 for BAM9 KO mutant, regardless how
fluctuating results we obtained for starch content at 20 DAP and 35 DAP, I observed repeatable
results for fructose, and a significant difference for the glucose content in red ripe fruits of mutants
and WT (Fig 33, B). Those results indicated that measuring glucose content instead of starch
content may overcome the fluctuations of starch content. And for starch-excess mutant P17C12,
higher glucose contents were also observed in S1 or S2 mutants than BC1F1 and WT red ripe fruits
(Fig 11, D).
Thirdly, the measurements on glucose could provide us more repeatable phenotyping results, as
previously showed by our group, hexose and sucrose are much more stable than starch in different
growth localization and condition (Biais et al., 2014). But the contents of hexose could reflect
over-accumulation of starch in fruits. Schaffer and Petreikov (1997) proposed that the sugar
content could be affected in a genotype with continually active starch accumulation for a long
period and that reaches a transient maximum of 3% of the FW as starch in the fruit. Thus, if we
aimed for screening for mutants accumulating more starch for a long period in fruits, contents of
sugars (especially for glucose) in red ripe fruits are valuable traits to indicate the potential
accumulations of starch in previous stages.
So for a big BC1F2 population of P17C12 of fine-mapping, I would like to propose to sample
fruits at 20 DAP and red ripe stages, and take the contents of glucose as an important trait related
to starch accumulation in fruits during growth.

Part III-Summary and Outlook
146

Part IV-References
147
References
Ali HAE-RO. 2003. Understanding of carbon partitioning in tomato fruit.
von Arnim AG, Jia Q, Vaughn JN. 2014. Regulation of plant translation by upstream open
reading frames. Plant Science 214, 1–12.
Asatsuma S, Sawada C, Itoh K, et al. 2005. Involvement of alpha-amylase I-1 in starch
degradation in rice chloroplasts. Plant & Cell Physiology 46, 858–869.
Baena-González E, Rolland F, Thevelein JM, et al. 2007. A central integrator of transcription
networks in plant stress and energy signalling. Nature 448, 938–942.
Balaguer L, Barnes JD, Panicucci A, et al. 1995. Production and utilization of assimilates in
wheat (Triticum aestivum L.) leaves exposed to elevated O3 and/or CO2. New Phytologist 129,
557–568.
Barsan C, Zouine M, Maza E, et al. 2012. Proteomic analysis of chloroplast-to-chromoplast
transition in tomato reveals metabolic shifts coupled with disrupted thylakoid biogenesis
machinery and elevated energy-production components. Plant Physiology.
Bastías A, Yañez M, Osorio S, et al. 2014. The transcription factor AREB1 regulates primary
metabolic pathways in tomato fruits. Journal of Experimental Botany 65, 2351–2363.
Begcy K, Nosenko T, Zhou L-Z, et al. 2019. Male Sterility in Maize after Transient Heat Stress
during the Tetrad Stage of Pollen Development. Plant Physiology 181, 683–700.
Belouah I, Nazaret C, Pétriacq P, et al. 2019. Modeling Protein Destiny in Developing Fruit.
Plant Physiology 180, 1709–1724.
Bénard C, Bernillon S, Biais B, et al. 2015. Metabolomic profiling in tomato reveals diel
compositional changes in fruit affected by source–sink relationships. Journal of Experimental
Botany 66, 3391–3404.
Biais B, Benard C, Beauvoit B, et al. 2014. Remarkable Reproducibility of Enzyme Activity
Profiles in Tomato Fruits Grown under Contrasting Environments Provides a Roadmap for Studies
of Fruit Metabolism. Plant Physiology 164, 1204–1221.
Bishop GJ, Harrison K, Jones JD. 1996. The tomato Dwarf gene isolated by heterologous
transposon tagging encodes the first member of a new cytochrome P450 family. The Plant Cell 8,
959–969.
Blankenship SM, Ellsworth DD, Powell RL. 1993. A Ripening Index for Banana Fruit Based on
Starch Content. HortTechnology 3, 338–339.

Part IV-References
148
Bollier N, Sicard A, Leblond J, et al. 2018. At-MINI ZINC FINGER2 and Sl-INHIBITOR OF
MERISTEM ACTIVITY, a Conserved Missing Link in the Regulation of Floral Meristem
Termination in Arabidopsis and Tomato. The Plant Cell 30, 83–100.
Bournonville C. 2015. Identification de gènes candidats impliqués dans la régulation de la teneur
en acide ascorbique chez la tomate: impacts sur le potentiel antioxydant et la qualité post-récolte
du fruit. , 340.
Bowsher CG, Scrase-Field EFAL, Esposito S, et al.. 2007. Characterization of ADP-glucose
transport across the cereal endosperm amyloplast envelope. Journal of Experimental Botany 58,
1321–1332.
Cai Q, Fukushima H, Yamamoto M, et al. 2016. The SAC51 Family Plays a Central Role in
Thermospermine Responses in Arabidopsis. Plant and Cell Physiology 57, 1583–1592.
Cai XL, Wang ZY, Xing YY, et al. 1998. Aberrant splicing of intron 1 leads to the heterogeneous
5’ UTR and decreased expression of waxy gene in rice cultivars of intermediate amylose content.
The Plant Journal: For Cell and Molecular Biology 14, 459–465.
Cakpo CB, Vercambre G, Baldazzi V, et al. 2020. Model-assisted comparison of sugar
accumulation patterns in ten fleshy fruits highlights differences between herbaceous and woody
species. Annals of Botany.
Calderon RH, García-Cerdán JG, Malnoë A, et al. 2013. A Conserved Rubredoxin Is Necessary
for Photosystem II Accumulation in Diverse Oxygenic Photoautotrophs. Journal of Biological
Chemistry 288, 26688–26696.
Caspar T, Huber SC, Somerville C. 1985. Alterations in Growth, Photosynthesis, and
Respiration in a Starchless Mutant of Arabidopsis thaliana (L.) Deficient in Chloroplast
Phosphoglucomutase Activity 1. Plant Physiology 79, 11–17.
Causse M, Zhao J, Diouf I, et al. 2020. Genomic Designing for Climate-Smart Tomato. In: Kole
C, ed. Genomic Designing of Climate-Smart Vegetable Crops. Cham: Springer International
Publishing, 47–159.
Ceballos H, Sánchez T, Morante N, et al. 2007. Discovery of an Amylose-free Starch Mutant in
Cassava (Manihot esculenta Crantz). Journal of Agricultural and Food Chemistry 55, 7469–7476.
Centeno DC, Osorio S, Nunes-Nesi A, et al. 2011. Malate Plays a Crucial Role in Starch
Metabolism, Ripening, and Soluble Solid Content of Tomato Fruit and Affects Postharvest
Softening. The Plant Cell 23, 162–184.
Chia T, Thorneycroft D, Chapple A, et al. 2004. A cytosolic glucosyltransferase is required for
conversion of starch to sucrose in Arabidopsis leaves at night. The Plant Journal 37, 853–863.
Clark S, Yu F, Gu L, Min XJ. 2019. Expanding Alternative Splicing Identification by Integrating
Multiple Sources of Transcription Data in Tomato. Frontiers in Plant Science 10.

Part IV-References
149
Colombié S, Beauvoit B, Nazaret C, et al. 2017. Respiration climacteric in tomato fruits
elucidated by constraint-based modelling. New Phytologist 213, 1726–1739.
Cordenunsi-Lysenko BR, Nascimento JRO, Castro-Alves VC, et al. 2019. The Starch Is (Not)
Just Another Brick in the Wall: The Primary Metabolism of Sugars During Banana Ripening.
Frontiers in Plant Science 10.
Critchley JH, Zeeman SC, Takaha T, et al. 2001. A critical role for disproportionating enzyme
in starch breakdown is revealed by a knock-out mutation in Arabidopsis. The Plant Journal: For
Cell and Molecular Biology 26, 89–100.
Cross JM, Clancy M, Shaw JR, et al. 2004. Both Subunits of ADP-Glucose Pyrophosphorylase
Are Regulatory. Plant Physiology 135, 137–144.
Dan Y, Fei Z, Rothan C. 2007. MicroTom – A New Model System for Plant Genomics. Genes,
Genomes, and Genomics 1(2), 167–179.
Davis JA, Pares RB, Bernstein T, et al. 2020. The Lipid Flippases ALA4 and ALA5 Play Critical
Roles in Cell Expansion and Plant Growth. Plant Physiology 182, 2111–2125.
Delatte T, Umhang M, Trevisan M, et al. 2006. Evidence for distinct mechanisms of starch
granule breakdown in plants. The Journal of Biological Chemistry 281, 12050–12059.
Dinges JR, Colleoni C, James MG, et al. 2003. Mutational Analysis of the Pullulanase-Type
Debranching Enzyme of Maize Indicates Multiple Functions in Starch Metabolism. The Plant Cell
15, 666–680.
Doerflinger FC, Miller WB, Nock JF, et al. 2015. Variations in zonal fruit starch concentrations
of apples – a developmental phenomenon or an indication of ripening? Horticulture Research 2,
1–9.
Dong S, Beckles DM. 2019. Dynamic changes in the starch-sugar interconversion within plant
source and sink tissues promote a better abiotic stress response. Journal of Plant Physiology 234,
80–93.
Ekkehard Neuhaus H, Stitt M. 1990. Control analysis of photosynthate partitioning: Impact of
reduced activity of ADP-glucose pyrophosphorylase or plastid phosphoglucomutase on the fluxes
to starch and sucrose in Arabidopsis thaliana (L.) Heynh. Planta 182, 445–454.
Feike D, Seung D, Graf A, et al. 2016. The Starch Granule-Associated Protein EARLY
STARVATION1 Is Required for the Control of Starch Degradation in Arabidopsis thaliana
Leaves. The Plant Cell 28, 1472–1489.
Fettke J, Eckermann N, Poeste S, et al. 2004. The glycan substrate of the cytosolic (Pho 2)
phosphorylase isozyme from Pisum sativum L.: identification, linkage analysis and subcellular
localization. The Plant Journal: For Cell and Molecular Biology 39, 933–946.

Part IV-References
150
Figueroa CM, Lunn JE. 2016. A Tale of Two Sugars: Trehalose 6-Phosphate and Sucrose. Plant
Physiology 172, 7–27.
Fujita N, Toyosawa Y, Utsumi Y, et al. 2009. Characterization of pullulanase (PUL)-deficient
mutants of rice (Oryza sativa L.) and the function of PUL on starch biosynthesis in the developing
rice endosperm. Journal of Experimental Botany 60, 1009–1023.
Fulton DC, Stettler M, Mettler T, et al. 2008. -AMYLASE4, a Noncatalytic Protein Required
for Starch Breakdown, Acts Upstream of Three Active -Amylases in Arabidopsis Chloroplasts.
The Plant Cell 20, 1040–1058.
Gallant DJ, Bouchet B, Baldwin PM. 1997. Microscopy of starch: evidence of a new level of
granule organization. Carbohydrate Polymers 32, 177–191.
Gao Z, Herrera-Carrillo E, Berkhout B. 2018. Delineation of the Exact Transcription
Termination Signal for Type 3 Polymerase III. Molecular Therapy - Nucleic Acids 10, 36–44.
Garcia V, Bres C, Just D, et al. 2016. Rapid identification of causal mutations in tomato EMS
populations via mapping-by-sequencing. Nature Protocols 11, 2401–2418.
García-Cerdán JG, Furst AL, McDonald KL, et al. 2019. A thylakoid membrane-bound and
redox-active rubredoxin (RBD1) functions in de novo assembly and repair of photosystem II.
Proceedings of the National Academy of Sciences 116, 16631–16640.
Geigenberger P. 2011. Regulation of Starch Biosynthesis in Response to a Fluctuating
Environment. Plant Physiology 155, 1566–1577.
Geigenberger P, Kolbe A, Tiessen A. 2005. Redox regulation of carbon storage and partitioning
in response to light and sugars. Journal of Experimental Botany 56, 1469–1479.
Geigenberger P, Müller-Röber B, Stitt M. 1999. Contribution of adenosine 5′-diphosphoglucose
pyrophosphorylase to the control of starch synthesis is decreased by water stress in growing potato
tubers. Planta 209, 338–345.
Geigenberger P, Stitt M, Fernie AR. 2004. Metabolic control analysis and regulation of the
conversion of sucrose to starch in growing potato tubers. Plant, Cell & Environment 27, 655–673.
Gibon Y, Blaesing OE, Hannemann J, et al. 2004. A Robot-Based Platform to Measure Multiple
Enzyme Activities in Arabidopsis Using a Set of Cycling Assays: Comparison of Changes of
Enzyme Activities and Transcript Levels during Diurnal Cycles and in Prolonged Darkness. The
Plant Cell 16, 3304–3325.
Glaring MA, Skryhan K, Kötting O, et al. 2012. Comprehensive survey of redox sensitive starch
metabolising enzymes in Arabidopsis thaliana. Plant Physiology and Biochemistry 58, 89–97.
Gomès E, Jakobsen MK, Axelsen KB, et al. 2000. Chilling Tolerance in Arabidopsis Involves
ALA1, a Member of a New Family of Putative Aminophospholipid Translocases. The Plant Cell
12, 2441–2453.

Part IV-References
151
Gordon AJ, Ryle GJA, Webb G. 1980. The Relationship between Sucrose and Starch during
‘Dark’ Export from Leaves of Uniculm Barley. Journal of Experimental Botany 31, 845–850.
Graf A, Schlereth A, Stitt M, Smith AM. 2010. Circadian control of carbohydrate availability
for growth in Arabidopsis plants at night. Proceedings of the National Academy of Sciences 107,
9458–9463.
Hädrich N, Hendriks JHM, Kötting O, et al. 2012. Mutagenesis of cysteine 81 prevents
dimerization of the APS1 subunit of ADP-glucose pyrophosphorylase and alters diurnal starch
turnover in Arabidopsis thaliana leaves: Mutation of Cys81 in Arabidopsis AGPase. The Plant
Journal 70, 231–242.
Haferkamp I, Schmitz-Esser S. 2012. The Plant Mitochondrial Carrier Family: Functional and
Evolutionary Aspects. Frontiers in Plant Science 3.
Hannah LC, James M. 2008. The complexities of starch biosynthesis in cereal endosperms.
Current Opinion in Biotechnology 19, 160–165.
Hanzawa Y, Takahashi T, Michael AJ, et al. 2000. ACAULIS5, an Arabidopsis gene required
for stem elongation, encodes a spermine synthase. The EMBO Journal 19, 4248–4256.
Hejazi M, Fettke J, Paris O, et al. 2009. The Two Plastidial Starch-Related Dikinases
Sequentially Phosphorylate Glucosyl Residues at the Surface of Both the A- and B-Type
Allomorphs of Crystallized Maltodextrins But the Mode of Action Differs. Plant Physiology 150,
962–976.
Hendriks JHM. 2003. ADP-Glucose Pyrophosphorylase Is Activated by Posttranslational Redox-
Modification in Response to Light and to Sugars in Leaves of Arabidopsis and Other Plant Species.
Plant Physiology 133, 838–849.
Hill SA, ap Rees T. 1993. Fluxes of carbohydrate metabolism in ripening bananas. Planta 192,
52–60.
Hirose T, Aoki N, Harada Y, et al. 2013. Disruption of a rice gene for α-glucan water dikinase,
OsGWD1, leads to hyperaccumulation of starch in leaves but exhibits limited effects on growth.
Frontiers in Plant Science 4.
Horrer D, Flütsch S, Pazmino D, et al. 2016. Blue Light Induces a Distinct Starch Degradation
Pathway in Guard Cells for Stomatal Opening. Current Biology 26, 362–370.
Hosmani PS, Flores-Gonzalez M, van de Geest H, et al. 2019. An improved de novo assembly
and annotation of the tomato reference genome using single-molecule sequencing, Hi-C proximity
ligation and optical maps. bioRxiv preprint.
Hou L-Y, Ehrlich M, Thormählen I, et al. 2019. NTRC Plays a Crucial Role in Starch
Metabolism, Redox Balance, and Tomato Fruit Growth. Plant Physiology 181, 976–992.

Part IV-References
152
Hou J, Zhang H, Liu J, et al. 2017. Amylases StAmy23, StBAM1 and StBAM9 regulate cold-
induced sweetening of potato tubers in distinct ways. Journal of Experimental Botany 68, 2317–
2331.
Hu X, Kuang S, Zhang A-D, et al. 2016. Characterization of Starch Degradation Related Genes
in Postharvest Kiwifruit. International Journal of Molecular Sciences 17, 2112.
Hubbard NL, Pharr DM, Huber SC. 1990. Sucrose metabolism in ripening muskmelon fruit as
affected by leaf area. Journal of the American Society for Horticultural Science 115, 798–802.
Imai A, Hanzawa Y., Komura M., et al. 2006. The dwarf phenotype of the Arabidopsis acl5
mutant is suppressed by a mutation in an upstream ORF of a bHLH gene. Development 133, 3575–
3585.
Jacobsen E, Hovenkamp-Hermelink JHM, Krijgsheld HT, et al. 1989. Phenotypic and
genotypic characterization of an amylose-free starch mutant of the potato. Euphytica 44, 43–48.
James MG, Denyer K, Myers AM. 2003. Starch synthesis in the cereal endosperm. Current
Opinion in Plant Biology 6, 215–222.
Jander G. 2002. Arabidopsis Map-Based Cloning in the Post-Genome Era. Plant Physiology 129,
440–450.
Jane J-L, Kasemsuwan T, Leas S, et al. 1994. Anthology of Starch Granule Morphology by
Scanning Electron Microscopy. Starch - Stärke 46, 121–129.
Jenkins PJ, Cameron RE, Donald AM. 1993. A Universal Feature in the Structure of Starch
Granules from Different Botanical Sources. Starch - Stärke 45, 417–420.
Jia H-F, Chai Y-M, Li C-L, et al. 2011. Abscisic acid plays an important role in the regulation
of strawberry fruit ripening. Plant Physiology 157, 188–199.
Just D, Garcia V, Fernandez L, et al. 2013. Micro-Tom mutants for functional analysis of target
genes and discovery of new alleles in tomato. Plant Biotechnology 30, 225–231.
Kaiser S, Sauer F, Kisker C. 2017. The structural and functional characterization of human
RecQ4 reveals insights into its helicase mechanism. Nature Communications 8, 15907.
Kelemen O, Convertini P, Zhang Z, et al. 2013. Function of alternative splicing. Gene 514, 1–
30.
Kirchberger S, Leroch M, Huynen MA, et al. 2007. Molecular and Biochemical Analysis of the
Plastidic ADP-glucose Transporter (ZmBT1) from Zea mays. Journal of Biological Chemistry 282,
22481–22491.
Kirchsteiger K, Ferrández J, Pascual MB, et al. 2012. NADPH thioredoxin reductase C is
localized in plastids of photosynthetic and nonphotosynthetic tissues and is involved in lateral root
formation in Arabidopsis. The Plant Cell 24, 1534–1548.

Part IV-References
153
Kiss É, Knoppová J, Aznar GP, et al. 2019. A Photosynthesis-Specific Rubredoxin-Like Protein
Is Required for Efficient Association of the D1 and D2 Proteins during the Initial Steps of
Photosystem II Assembly. The Plant Cell 31, 2241–2258.
Kobayashi T, Sasaki S, Utsumi Y, et al. 2016. Comparison of Chain-Length Preferences and
Glucan Specificities of Isoamylase-Type α-Glucan Debranching Enzymes from Rice,
Cyanobacteria, and Bacteria. PLOS ONE 11, e0157020.
Kötting O, Kossmann J, Zeeman SC, et al. 2010. Regulation of starch metabolism: the age of
enlightenment? Current Opinion in Plant Biology 13, 320–328.
Kubo A, Colleoni C, Dinges JR, et al. 2010. Functions of Heteromeric and Homomeric
Isoamylase-Type Starch-Debranching Enzymes in Developing Maize Endosperm. Plant
Physiology 153, 956–969.
Kühlbrandt W. 2004. Biology, structure and mechanism of P-type ATPases. Nature Reviews
Molecular Cell Biology 5, 282–295.
Kumar S, Stecher G, Li M, et al. 2018. MEGA X: Molecular Evolutionary Genetics Analysis
across Computing Platforms. Molecular Biology and Evolution 35, 1547–1549.
Lander ES, Green P, Abrahamson J, et al. 1987. MAPMAKER: an interactive computer
package for constructing primary genetic linkage maps of experimental and natural populations.
Genomics 1, 174–181.
Lao NT, Schoneveld O, Mould RM, et al. 1999. An Arabidopsis gene encoding a chloroplast-
targeted β-amylase. The Plant Journal 20, 519–527.
Lee S-K, Eom J-S, Hwang S-K, et al. 2016. Plastidic phosphoglucomutase and ADP-glucose
pyrophosphorylase mutants impair starch synthesis in rice pollen grains and cause male sterility.
Journal of Experimental Botany 67, 5557–5569.
Lee CP, Millar AH. 2016. The Plant Mitochondrial Transportome: Balancing Metabolic
Demands with Energetic Constraints. Trends in Plant Science 21, 662–676.
Li Y, Lu Y, Li L, et al. 2019. Impairment of hormone pathways results in a general disturbance
of fruit primary metabolism in tomato. Food Chemistry 274, 170–179.
Li S, Wei X, Ren Y, et al. 2017. OsBT1 encodes an ADP-glucose transporter involved in starch
synthesis and compound granule formation in rice endosperm. Scientific Reports 7.
Li S, Xu H, Ju Z, et al. 2018. The RIN-MC Fusion of MADS-Box Transcription Factors Has
Transcriptional Activity and Modulates Expression of Many Ripening Genes1. Plant Physiology
176, 891–909.
Li D, Zhu F. 2018. Starch structure in developing kiwifruit. International Journal of Biological
Macromolecules 120, 1306–1314.

Part IV-References
154
Lin T-P, Caspar T, Somerville C, et al. 1988. Isolation and Characterization of a Starchless
Mutant of Arabidopsis thaliana (L.) Heynh Lacking ADPglucose Pyrophosphorylase Activity.
Plant Physiology 86, 1131–1135.
Lu Y, Gehan JP, Sharkey TD. 2005. Daylength and Circadian Effects on Starch Degradation
and Maltose Metabolism. Plant Physiology 138, 2280–2291.
Lu Y, Sharkey TD. 2004. The role of amylomaltase in maltose metabolism in the cytosol of
photosynthetic cells. Planta 218, 466–473.
Luengwilai K, Beckles DM. 2009. Starch Granules in Tomato Fruit Show a Complex Pattern of
Degradation. Journal of Agricultural and Food Chemistry 57, 8480–8487.
Luk E, Carroll M, Baker M, et al. 2003. Manganese activation of superoxide dismutase 2 in
Saccharomyces cerevisiae requires MTM1, a member of the mitochondrial carrier family.
Proceedings of the National Academy of Sciences 100, 10353–10357.
Lunn JE, Feil R, Hendriks JHM, et al. 2006. Sugar-induced increases in trehalose 6-phosphate
are correlated with redox activation of ADPglucose pyrophosphorylase and higher rates of starch
synthesis in Arabidopsis thaliana. The Biochemical Journal 397, 139–148.
Maagd RA de, Loonen A, Chouaref J, et al. 2020a. CRISPR/Cas inactivation of RECQ4
increases homeologous crossovers in an interspecific tomato hybrid. Plant Biotechnology Journal
18, 805–813.
Maagd RA de, Loonen A, Chouaref J, et al. 2020b. CRISPR/Cas inactivation of RECQ4
increases homeologous crossovers in an interspecific tomato hybrid. Plant Biotechnology Journal
18, 805–813.
MacNeill GJ, Mehrpouyan S, Minow MAA, P et al. 2017. Starch as a source, starch as a sink:
the bifunctional role of starch in carbon allocation (C Raines, Ed.). Journal of Experimental Botany
68, 4433–4453.
Maiti BK, Almeida RM, Moura I, et al. 2017. Rubredoxins derivatives: Simple sulphur-rich
coordination metal sites and its relevance for biology and chemistry. Coordination Chemistry
Reviews 352, 379–397.
Malinova I, Alseekh S, Feil R, et al. 2017. Starch Synthase 4 and Plastidal Phosphorylase
Differentially Affect Starch Granule Number and Morphology1. Plant Physiology 174, 73–85.
Malinova I, Fettke J. 2017. Reduced starch granule number per chloroplast in the dpe2/phs1
mutant is dependent on initiation of starch degradation. PLOS ONE 12, e0187985.
Malinova I, Mahlow S, Alseekh S, et al. 2014. Double Knockout Mutants of Arabidopsis Grown
under Normal Conditions Reveal that the Plastidial Phosphorylase Isozyme Participates in
Transitory Starch Metabolism. Plant Physiology 164, 907–921.

Part IV-References
155
Malinova I, Mahto H, Brandt F, et al. 2018. EARLY STARVATION1 specifically affects the
phosphorylation action of starch-related dikinases. The Plant Journal: For Cell and Molecular
Biology 95, 126–137.
Marquez Y, Brown JWS, Simpson C, et al. 2012. Transcriptome survey reveals increased
complexity of the alternative splicing landscape in Arabidopsis. Genome Research 22, 1184–1195.
Marti E. 2006. Genetic and physiological characterization of tomato cv. Micro-Tom. Journal of
Experimental Botany 57, 2037–2047.
Martins MCM, Hejazi M, Fettke J, et al. 2013. Feedback Inhibition of Starch Degradation in
Arabidopsis Leaves Mediated by Trehalose 6-Phosphate. Plant Physiology 163, 1142–1163.
Mayr C. 2017. Regulation by 3′-Untranslated Regions. Annual Review of Genetics 51, 171–194.
Merchante C, Stepanova AN, Alonso JM. 2017. Translation regulation in plants: an interesting
past, an exciting present and a promising future. The Plant Journal 90, 628–653.
Michalska J, Zauber H, Buchanan BB, et al. 2009. NTRC links built-in thioredoxin to light and
sucrose in regulating starch synthesis in chloroplasts and amyloplasts. Proceedings of the National
Academy of Sciences 106, 9908–9913.
Mieulet D, Aubert G, Bres C, et al. 2018. Unleashing meiotic crossovers in crops. Nature Plants
4, 1010–1016.
Millar AH, Heazlewood JL. 2003. Genomic and Proteomic Analysis of Mitochondrial Carrier
Proteins in Arabidopsis. Plant Physiology 131, 443–453.
Monroe JD. 2020. Involvement of five catalytically active Arabidopsis beta-amylases in leaf
starch metabolism and plant growth. Plant Direct 4, UNSP e00199.
Monroe JD, Breault JS, Pope LE, et al. 2017. Arabidopsis β-Amylase2 Is a K+-Requiring,
Catalytic Tetramer with Sigmoidal Kinetics. Plant Physiology 175, 1525–1535.
Monroe JD, Storm AR. 2018. Review: The Arabidopsis β-amylase (BAM) gene family:
Diversity of form and function. Plant Science 276, 163–170.
Mugford ST, Fernandez O, Brinton J, et al. 2014. Regulatory Properties of ADP Glucose
Pyrophosphorylase Are Required for Adjustment of Leaf Starch Synthesis in Different
Photoperiods. Plant Physiology 166, 1733–1747.
Muños S, Ranc N, Botton E, et al. 2011. Increase in Tomato Locule Number Is Controlled by
Two Single-Nucleotide Polymorphisms Located Near WUSCHEL. Plant Physiology 156, 2244–
2254.
Nakamura Y (Ed.). 2015. Starch. Tokyo: Springer Japan.

Part IV-References
156
Napoli C, Lemieux C, Jorgensen R. 1990. Introduction of a Chimeric Chalcone Synthase Gene
into Petunia Results in Reversible Co-Suppression of Homologous Genes in trans. The Plant Cell
2, 279–289.
Nardozza S, Boldingh HL, Osorio S, et al. 2013. Metabolic analysis of kiwifruit (Actinidia
deliciosa) berries from extreme genotypes reveals hallmarks for fruit starch metabolism. Journal
of Experimental Botany 64, 5049–5063.
do Nascimento JRO, Júnior AV, Bassinello PZ, et al. 2006. Beta-amylase expression and starch
degradation during banana ripening. Postharvest Biology and Technology 40, 41–47.
Nashilevitz S, Melamed-Bessudo C, Aharoni A, et al. 2009. Tomato GWD The legwd mutant
uncovers the role of starch phosphorylation in pollen development and germination in tomato. The
Plant Journal 57, 1–13.
N’tchobo H, Dali N, Nguyen-Quoc B, et al. 1999. Starch synthesis in tomato remains constant
throughout fruit development and is dependent on sucrose supply and sucrose synthase activity. ,
7.
Nunes C, O’Hara LE, Primavesi LF, et al. 2013. The Trehalose 6-Phosphate/SnRK1 Signaling
Pathway Primes Growth Recovery following Relief of Sink Limitation. Plant Physiology 162,
1720–1732.
Obiadalla‐Ali H, Fernie AR, Kossmann J, et al. 2004. Developmental analysis of carbohydrate
metabolism in tomato (Lycopersicon esculentum cv. Micro-Tom) fruits. Physiologia Plantarum
120, 196–204.
Oikawa A, Otsuka T, Nakabayashi R, et al. 2015. Metabolic Profiling of Developing Pear Fruits
Reveals Dynamic Variation in Primary and Secondary Metabolites, Including Plant Hormones.
PLOS ONE 10, e0131408.
Okabe Y, Ariizumi T. 2016. Mutant Resources and TILLING Platforms in Tomato Research.
Biotechnology in Agriculture and Forestry. Functional Genomics and Biotechnology in
Solanaceae and Cucurbitaceae Crops. Berlin, Heidelberg: Springer, 75–91.
Okabe Y, Asamizu E, Saito T, et al. 2011. Tomato TILLING Technology: Development of a
Reverse Genetics Tool for the Efficient Isolation of Mutants from Micro-Tom Mutant Libraries.
Plant and Cell Physiology 52, 1994–2005.
Oostergetel GT, van Bruggen EFJ. 1993. The crystalline domains in potato starch granules are
arranged in a helical fashion. Carbohydrate Polymers 21, 7–12.
Osorio S, Ruan Y-L, Fernie AR. 2014. An update on source-to-sink carbon partitioning in tomato.
Frontiers in Plant Science 5.
Pacini E, Franchi GG. 1988. Amylogenesis and Amylolysis During Pollen Grain Development.
Sexual Reproduction in Higher Plants. Berlin, Heidelberg: Springer, 181–186.
Part IV-References
157
Paterson AH, Lander ES, Hewitt JD, et al. 1988. Resolution of quantitative traits into Mendelian
factors by using a complete linkage map of restriction fragment length polymorphisms. Nature
335, 721–726.
Patron NJ, Greber B, Fahy BF, et al. 2004. The lys5 Mutations of Barley Reveal the Nature and
Importance of Plastidial ADP-Glc Transporters for Starch Synthesis in Cereal Endosperm. Plant
Physiology 135, 2088–2097.
Pedersen CNS, Axelsen KB, Harper JF, et al. 2012. Evolution of Plant P-Type ATPases.
Frontiers in Plant Science 3.
Peroni-Okita FHG, Simão RA, Cardoso MB, et al. 2010. In vivo degradation of banana starch:
Structural characterization of the degradation process. Carbohydrate Polymers 81, 291–299.
Petit J, Bres C, Mauxion J-P, et al. 2016. The glycerol-3-phosphate acyltransferase GPAT6 from
tomato plays a central role in fruit cutin biosynthesis. Plant Physiology, pp.00409.2016.
Petreikov M, Eisenstein M, Yeselson Y, et al. 2010. Tomato: Characterization of the AGPase
large subunit isoforms from tomato indicates that the recombinant L3 subunit is active as a
monomer. Biochemical Journal 428, 201–212.
Petreikov M, Shen S, Yeselson Y, et al. 2006. Tomato Temporally extended gene expression of
the ADP-Glc pyrophosphorylase large subunit (AgpL1) leads to increased enzyme activity in
developing tomato fruit. Planta 224, 1465–1479.
Pfister B, Zeeman SC. 2016. Formation of starch in plant cells. Cellular and Molecular Life
Sciences 73, 2781–2807.
Pnueli L, Carmel-Goren L, Hareven D, et al. 1998. The SELF-PRUNING gene of tomato
regulates vegetative to reproductive switching of sympodial meristems and is the ortholog of CEN
and TFL. Development 12, 1979–1989.
Prabha TN, Bhagyalakshmi N. 1998. Carbohydrate metabolism in ripening banana fruit.
Phytochemistry 48, 915–919.
Pressman E, Peet MM, Pharr DM. 2002. The Effect of Heat Stress on Tomato Pollen
Characteristics is Associated with Changes in Carbohydrate Concentration in the Developing
Anthers. Annals of Botany 90, 631–636.
Reinhold H, Soyk S, Šimková K, et al. 2011. β-Amylase–Like Proteins Function as Transcription
Factors in Arabidopsis, Controlling Shoot Growth and Development. The Plant Cell 23, 1391–
1403.
Ren Z, He S, Zhao N, et al. 2019. A sucrose non-fermenting-1-related protein kinase-1 gene,
IbSnRK1, improves starch content, composition, granule size, degree of crystallinity and
gelatinization in transgenic sweet potato. Plant Biotechnology Journal 17, 21–32.

Part IV-References
158
Ritte G, Heydenreich M, Mahlow S, et al. 2006. Phosphorylation of C6- and C3-positions of
glucosyl residues in starch is catalysed by distinct dikinases. FEBS Letters 580, 4872–4876.
Roch L. 2018. Etude intégrative et comparative du métabolisme primaire des fruits au cours de
leur développement.
Roch L, Dai Z, Gomès E, et al. 2019. Fruit Salad in the Lab: Comparing Botanical Species to
Help Deciphering Fruit Primary Metabolism. Frontiers in Plant Science 10.
Roch L, Prigent S, Klose H, et al. 2020. Biomass composition explains fruit relative growth rate
and discriminates climacteric from non-climacteric species. Journal of Experimental Botany
71(19), 5823–5836.
Rösti S, Fahy B, Denyer K. 2007. A mutant of rice lacking the leaf large subunit of ADP-glucose
pyrophosphorylase has drastically reduced leaf starch content but grows normally. Functional
plant biology: FPB 34, 480–489.
Rothan C, Diouf I, Causse M. 2019. Trait discovery and editing in tomato. The Plant Journal 97,
73–90.
Ruan Y-L, Patrick JW, Bouzayen M, et al. 2012. Molecular regulation of seed and fruit set.
Trends in Plant Science 17, 656–665.
Sagor GHM, Berberich T, Tanaka S, et al. 2016. A novel strategy to produce sweeter tomato
fruits with high sugar contents by fruit-specific expression of a single bZIP transcription factor
gene. Plant Biotechnology Journal 14, 1116–1126.
Saitou N, Nei M. 1987. The neighbor-joining method: a new method for reconstructing
phylogenetic trees. Molecular Biology and Evolution 4, 406–425.
Santelia D, Kötting O, Seung D, et al. 2011. The Phosphoglucan Phosphatase Like Sex Four2
Dephosphorylates Starch at the C3-Position in Arabidopsis. The Plant Cell 23, 4096–4111.
Sato S, Kamiyama M, Iwata T, et al. 2006. Moderate Increase of Mean Daily Temperature
Adversely Affects Fruit Set of Lycopersicon esculentum by Disrupting Specific Physiological
Processes in Male Reproductive Development. Annals of Botany 97, 731–738.
Schaffer AA, Levin I, Oguz I, et al. 2000. ADPglucose pyrophosphorylase activity and starch
accumulation in immature tomato fruit: the effect of a Lycopersicon hirsutum-derived
introgression encoding for the large subunit. Plant Science 152, 135–144.
Schaffer AA, Petreikov M. 1997. Sucrose-to-Starch Metabolism in Tomato Fruit Undergoing
Transient Starch Accumulation. Plant Physiology 113, 739–746.
Schreier TB, Umhang M, Lee S-K, et al. 2019. LIKE SEX4 1 Acts as a β-Amylase-Binding
Scaffold on Starch Granules during Starch Degradation. The Plant Cell 31, 2169–2186.

Part IV-References
159
Scialdone A, Mugford ST, Feike D, et al. 2013. Arabidopsis plants perform arithmetic division
to prevent starvation at night. eLife 2.
Scott JW, Harbaugh BK. 1989. Micro-tom: A Miniature Dwarf Tomato. Agricultural Experiment
Station, Institute of Food and Agricultural Sciences, University of Florida.
Séguéla-Arnaud M, Crismani W, Larchevêque C, et al. 2015. Multiple mechanisms limit
meiotic crossovers: TOP3α and two BLM homologs antagonize crossovers in parallel to FANCM.
Proceedings of the National Academy of Sciences 112, 4713–4718.
Seung D, Thalmann M, Sparla F, et al. . 2013. Arabidopsis thaliana AMY3 Is a Unique Redox-
regulated Chloroplastic α-Amylase. Journal of Biological Chemistry 288, 33620–33633.
Shen Y, Zhou Z, Wang Z, et al. 2014. Global Dissection of Alternative Splicing in
Paleopolyploid Soybean. The Plant Cell 26, 996–1008.
Shimatani Z, Kashojiya S, Takayama M, et al. 2017a. Targeted base editing in rice and tomato
using a CRISPR-Cas9 cytidine deaminase fusion. Nature Biotechnology 35, 441–443.
Shimatani Z, Kashojiya S, Takayama M, et al. 2017b. Targeted base editing in rice and tomato
using a CRISPR-Cas9 cytidine deaminase fusion. Nature Biotechnology 35, 441–443.
Shinozaki Y, Nicolas P, Fernandez-Pozo N, et al. 2018. High-resolution spatiotemporal
transcriptome mapping of tomato fruit development and ripening. Nature Communications 9, 364.
Silver DM, Silva LP, Issakidis‐Bourguet E, et al. 2013. Insight into the redox regulation of the
phosphoglucan phosphatase SEX4 involved in starch degradation. The FEBS Journal 280, 538–
548.
Skryhan K, Gurrieri L, Sparla F, et al. 2018. Redox Regulation of Starch Metabolism. Frontiers
in Plant Science 9.
Slewinski TL, Ma Y, Baker RF, et al. 2008. Determining the role of Tie-dyed1 in starch
metabolism: epistasis analysis with a maize ADP-glucose pyrophosphorylase mutant lacking leaf
starch. The Journal of Heredity 99, 661–666.
Smith AM, Zeeman SC. 2020. Starch: A Flexible, Adaptable Carbon Store Coupled to Plant
Growth. Annual Review of Plant Biology 71, 217–245.
Souleyre EJF, Iannetta PPM, Ross HA, et al. 2004. Starch metabolism in developing strawberry
(Fragaria x ananassa) fruits. Physiologia Plantarum 121, 369–376.
Srivastava AK, Lu Y, Zinta G, et al. 2018. UTR dependent control of gene expression in plants.
Trends in plant science 23, 248–259.
Steidle E. 2010. Investigation of the role of BAM9 in starch metabolism in Arabidopsis thaliana.
Masters Theses, 2010.
Part IV-References
160
Stevenson D, Domoto P, Jane J. 2006. Structures and functional properties of apple (Malus
domestica Borkh) fruit starch. Carbohydrate Polymers 63, 432–441.
Stitt M, Lilley RMcC, Gerhardt R, et al. 1989. Metabolite levels in specific cells and subcellular
compartments of plant leaves. Biomembranes Part U: Cellular and Subcellular Transport:
Eukaryotic (Nonepithelial) Cells. Methods in Enzymology. Academic Press, 518–552.
Stitt M, Zeeman SC. 2012. Starch turnover: pathways, regulation and role in growth. Current
Opinion in Plant Biology 15, 282–292.
Streb S, Delatte T, Umhang M, et al. 2008. Starch Granule Biosynthesis in Arabidopsis Is
Abolished by Removal of All Debranching Enzymes but Restored by the Subsequent Removal of
an Endoamylase. THE PLANT CELL ONLINE 20, 3448–3466.
Streb S, Zeeman SC. 2012. Starch Metabolism in Arabidopsis. The Arabidopsis Book 2012.
Su Z, Chai M-F, Lu P-L, et al. 2007. AtMTM1, a novel mitochondrial protein, may be involved
in activation of the manganese-containing superoxide dismutase in Arabidopsis. Planta 226, 1031–
1039.
Sullivan TD, Strelow LI, Illingworth CA, et al. 1991. Analysis of maize brittle-1 alleles and a
defective Suppressor-mutator-induced mutable allele. The Plant Cell 3, 1337–1348.
Sun H-J, Uchii S, Watanabe S, et al. 2006. A Highly Efficient Transformation Protocol for
Micro-Tom, a Model Cultivar for Tomato Functional Genomics. Plant and Cell Physiology 47,
426–431.
Sweetlove LJ, Müller-Röber B, Willmitzer L, et al. 1999. The contribution of adenosine 5′-
diphosphoglucose pyrophosphorylase to the control of starch synthesis in potato tubers. Planta 209,
330–337.
Szalay L, Ordidge M, Ficzek G, et al. 2013. Grouping of 24 apple cultivars on the basis of starch
degradation rate and their fruit pattern. Horticultural Science 40, 93–101.
Szecowka M, Osorio S, Obata T, et al. 2012. Decreasing the mitochondrial synthesis of malate
in potato tubers does not affect plastidial starch synthesis, suggesting that the physiological
regulation of ADPglucose pyrophosphorylase is context dependent. Plant Physiology 160, 2227–
2238.
Tandon DK, Kalra SK. 1983. Changes in sugars, starch and amylase activity during development
of mango fruit cv Dashehari. Journal of Horticultural Science 58, 449–453.
Tatge H, Marshall J, Martin C, et al. 1999. Evidence that amylose synthesis occurs within the
matrix of the starch granule in potato tubers. Plant, Cell & Environment 22, 543–550.
Tenorio G, Orea A, Romero JM, et al. 2003. Oscillation of mRNA level and activity of granule-
bound starch synthase I in Arabidopsis leaves during the day/night cycle. Plant Molecular Biology
51, 949–958.

Part IV-References
161
Thalmann M, Pazmino D, Seung D, et al. 2016. Regulation of Leaf Starch Degradation by
Abscisic Acid Is Important for Osmotic Stress Tolerance in Plants. The Plant Cell 28, 1860–1878.
Thalmann M, Santelia D. 2017. Starch as a determinant of plant fitness under abiotic stress. New
Phytologist 214, 943–951.
Tiessen A. 2002. Starch Synthesis in Potato Tubers Is Regulated by Post-Translational Redox
Modification of ADP-Glucose Pyrophosphorylase: A Novel Regulatory Mechanism Linking
Starch Synthesis to the Sucrose Supply. THE PLANT CELL ONLINE 14, 2191–2213.
Tiessen A, Padilla-Chacon D. 2012. Subcellular compartmentation of sugar signaling: links
among carbon cellular status, route of sucrolysis, sink-source allocation, and metabolic
partitioning. Frontiers in Plant Science 3, 306.
Tiessen A, Prescha K, Branscheid A, et al. 2003. Evidence that SNF1-related kinase and
hexokinase are involved in separate sugar-signalling pathways modulating post-translational redox
activation of ADP-glucose pyrophosphorylase in potato tubers. The Plant Journal: For Cell and
Molecular Biology 35, 490–500.
Valerio C, Costa A, Marri L, et al. 2011. Thioredoxin-regulated β-amylase (BAM1) triggers
diurnal starch degradation in guard cells, and in mesophyll cells under osmotic stress. Journal of
Experimental Botany 62, 545–555.
Waese J, Fan J, Pasha A, et al. 2017. ePlant: Visualizing and Exploring Multiple Levels of Data
for Hypothesis Generation in Plant Biology. The Plant Cell 29, 1806–1821.
Wang B-B, Brendel V. 2006. Genomewide comparative analysis of alternative splicing in plants.
Proceedings of the National Academy of Sciences 103, 7175–7180.
Wang X, Peng F, Li M, et al. 2012. Expression of a heterologous SnRK1 in tomato increases
carbon assimilation, nitrogen uptake and modifies fruit development. Journal of Plant Physiology
169, 1173–1182.
Wang ET, Sandberg R, Luo S, et al. 2008. Alternative isoform regulation in human tissue
transcriptomes. Nature 456, 470–476.
Waterschoot J, Gomand SV, Fierens E, et al. 2015. Review: Production, structure,
physicochemical and functional properties of maize, cassava, wheat, potato and rice starches.
Starch-Starke 67, 14–29.
Wattebled F, Dong Y, Dumez S, et al. 2005. Mutants of Arabidopsis Lacking a Chloroplastic
Isoamylase Accumulate Phytoglycogen and an Abnormal Form of Amylopectin. Plant Physiology
138, 184–195.
Weber E, Engler C, Gruetzner R, et al. 2011. A Modular Cloning System for Standardized
Assembly of Multigene Constructs (J Peccoud, Ed.). PLOS ONE 6, e16765.

Part IV-References
162
Weise SE, Aung K, Jarou ZJ, et al. 2012. Engineering starch accumulation by manipulation of
phosphate metabolism of starch. Plant Biotechnology Journal 10, 545–554.
Wiese A, Elzinga N, Wobbes B, et al. 2004. A Conserved Upstream Open Reading Frame
Mediates Sucrose-Induced Repression of Translation. The Plant Cell 16, 1717–1729.
Wilkens C, Auger KD, Anderson NT, et al. 2016. Plant α-glucan phosphatases SEX4 and LSF2
display different affinity for amylopectin and amylose. FEBS Letters 590, 118–128.
Wingler A. 2018. Transitioning to the Next Phase: The Role of Sugar Signaling throughout the
Plant Life Cycle. Plant Physiology 176, 1075–1084.
Wingler A, Delatte TL, O’Hara LE, et al. 2012. Trehalose 6-Phosphate Is Required for the Onset
of Leaf Senescence Associated with High Carbon Availability. Plant Physiology 158, 1241–1251.
Xiao Y, Kuang J, Qi X, et al. 2018. A comprehensive investigation of starch degradation process
and identification of a transcriptional activator MabHLH6 during banana fruit ripening. Plant
Biotechnology Journal 16, 151–164.
Ye J, Li W, Ai G, et al. 2019. Genome-wide association analysis identifies a natural variation in
basic helix-loop-helix transcription factor regulating ascorbate biosynthesis via D-mannose/L-
galactose pathway in tomato. PLOS Genetics 15, e1008149.
Ye J, Wang X, Hu T, et al. 2017. An InDel in the Promoter of Al-ACTIVATED MALATE
TRANSPORTER9 Selected during Tomato Domestication Determines Fruit Malate Contents and
Aluminum Tolerance. The Plant Cell 29, 2249–2268.
Yin Y-G, Kobayashi Y, Sanuki A, et al. 2010. Salinity induces carbohydrate accumulation and
sugar-regulated starch biosynthetic genes in tomato (Solanum lycopersicum L. cv. ‘Micro-Tom’)
fruits in an ABA- and osmotic stress-independent manner. Journal of Experimental Botany 61,
563–574.
Yu TS, Kofler H, Häusler RE, et al. 2001. The Arabidopsis sex1 mutant is defective in the R1
protein, a general regulator of starch degradation in plants, and not in the chloroplast hexose
transporter. The Plant Cell 13, 1907–1918.
Yu T-S, Zeeman SC, Thorneycroft D, et al. 2005. alpha-Amylase is not required for breakdown
of transitory starch in Arabidopsis leaves. The Journal of Biological Chemistry 280, 9773–9779.
Zeeman SC, Kossmann J, Smith AM. 2010. Starch: Its Metabolism, Evolution, and
Biotechnological Modification in Plants. Annual Review of Plant Biology 61, 209–234.
Zeeman SC, Northrop F, Smith AM, et al. 1998. A starch-accumulating mutant of Arabidopsis
thaliana deficient in a chloroplastic starch-hydrolysing enzyme. The Plant Journal 15, 357–365.
Zeeman SC, Tiessen A, Pilling E, et al. 2002. Starch Synthesis in Arabidopsis. Granule Synthesis,
Composition, and Structure. Plant Physiology 129, 516–529.

Part IV-References
163
Zhang G, Guo G, Hu X, et al. 2010. Deep RNA sequencing at single base-pair resolution reveals
high complexity of the rice transcriptome. Genome Research 20, 646–654.
Zhang A, Wang W, Tong Y, et al. 2018. Transcriptome Analysis Identifies a Zinc Finger Protein
Regulating Starch Degradation in Kiwifruit. Plant Physiology 178, 850–863.
Zhang P, Whistler RL, BeMiller JN, et al. 2005. Banana starch: production, physicochemical
properties, and digestibility—a review. Carbohydrate Polymers 59, 443–458.
Zhang M, Yuan B, Leng P. 2009. The role of ABA in triggering ethylene biosynthesis and
ripening of tomato fruit. Journal of Experimental Botany 60, 1579–1588.
Zuckerkandl E, Pauling L. 1965. Evolutionary Divergence and Convergence in Proteins.
Evolving Genes and Proteins. Academic Press, 97–166.