study of low dose nitrite stress on human mononuclear
TRANSCRIPT
University of Northern Iowa University of Northern Iowa
UNI ScholarWorks UNI ScholarWorks
Dissertations and Theses @ UNI Student Work
2018
Study of low dose nitrite stress on human mononuclear cells: An Study of low dose nitrite stress on human mononuclear cells: An
in-vitro case-control study on osteoarthritis in-vitro case-control study on osteoarthritis
Junu Shrestha University of Northern Iowa
Let us know how access to this document benefits you
Copyright ©2018 Junu Shrestha
Follow this and additional works at: https://scholarworks.uni.edu/etd
Part of the Chemical and Pharmacologic Phenomena Commons
Recommended Citation Recommended Citation Shrestha, Junu, "Study of low dose nitrite stress on human mononuclear cells: An in-vitro case-control study on osteoarthritis" (2018). Dissertations and Theses @ UNI. 533. https://scholarworks.uni.edu/etd/533
This Open Access Dissertation is brought to you for free and open access by the Student Work at UNI ScholarWorks. It has been accepted for inclusion in Dissertations and Theses @ UNI by an authorized administrator of UNI ScholarWorks. For more information, please contact [email protected].

Copyright by
JUNU SHRESTHA
2018
All Rights Reserved

STUDY OF LOW DOSE NITRITE STRESS ON HUMAN MONONUCLEAR CELLS:
AN IN-VITRO CASE-CONTROL STUDY ON OSTEOARTHRITIS
An Abstract of a Dissertation
Submitted
in Partial Fulfillment
of the Requirements for the Degree
Doctor of Education
Approved:
____________________________________ Dr. Catherine Zeman, Committee Chair
____________________________________ Dr. Patrick Pease
Interim Dean of the Graduate College
Junu Shrestha
University of Northern Iowa
May, 2018

ABSTRACT
Nitrate, (NOR3RP
-P) is an oxidized form of nitrogen and it is an integral part of the
nitrogen cycle in the natural environment. Nitrates are extensively used in agricultural
practices as fertilizers, applied as either animal manures or derived slurries or as chemical
fertilizers in the form of ammonium nitrate. Most of the toxicologically relevant nitrate
enters the human body through consumption of vegetables, fruits, processed food
products, and drinking water. In the ground water system, nitrates are a problematic and
widespread contaminant, especially in agricultural areas such as the Midwest, South, and
Northeastern U.S. Low-levels of nitrate exposure in drinking water below the EPA level
of 10 ppm are not currently considered acutely lethal to humans, but long-term exposure
has been increasingly called into question due to concerns about some forms of cancer
risk. Nitrate itself is relatively non-toxic, but it transforms to different metabolites once it
enters the human body such as nitrite, nitric oxide (NO), and nitrosamine. These
metabolites are more harmful to human health than nitrate and cause various kinds of
acute human illness such as acute methemoglobinemia (in infants), low blood pressure,
increased heart rate, headache, abdominal cramps, vomiting, and, possible chronic
disease concerns such as cancer of the digestive tract, thyroid, and ovary.
Another chronic disease concern that may be impacted by nitrite/nitrate exposure
is Osteoarthritis (OA). OA, the subject of this study, is the most common type of arthritis
that wears down the articular cartilage between bones and thus weakens the whole joint.
NO production is considered as a mediator for proinflammatory cytokine production that
elevates that pain among OA patients. Nitrate and nitrite are responsible for the

production of NO endogenously. Therefore, this study is important to explore various
concentrations of nitrite exposure and its impact on people having OA and lymphocyte
response, stress, and DNA damage.
This in-vitro case control study explores whether different levels of nitrite
exposure in human mononuclear cells (lymphocytes) has an impact on their proliferation,
NO stress activity, and DNA damage. This will increase understanding of the impacts of
nitrite/nitrate exposure on human lymphocytes and clarify innate, immunotoxicological
impacts at various low doses of nitrite concentration. A total of 32 participants took part
in the study, 16 were cases and 16 were controls. Cases were chosen on the criteria of a
medically diagnosed OA in any joint, and the controls were participants without OA.
Standard cell culture techniques were used to gather lymphocytes from whole blood,
culture and expose those lymphocytes to increasing concentrations of sodium nitrite (0, 1,
5, 10, 15 ppm) and challenge the exposed cells (via mitogen) to monitor lymphocyte
proliferation, NO activity, and DNA damage via immunoassay and flow cytometry.
Additionally, a brief questionnaire about demographics, health history, smoking status,
and herbs/supplement, medications was completed by each participant to explore any
relationships between the self-report factors and lymphocyte proliferation, NO activity
and DNA damage at various nitrite concentrations.
Findings indicated that increasing nitrite concentrations suppressed lymphocyte
proliferation among all participants (p<0.05). Among case and control participants, the
study found increased lymphocyte proliferation, following mitogen stimulation, among
the participants not having OA compared to having OA at the exposure levels of 5 ppm.
Overall there was no increased NO stress activity observed among the cells challenged
with various nitrite concentrations. The DNA damage test showed some interesting
results indicating light DNA damage occurred when exposed to 5ppm or more nitrite
concentration (p<0.05) for pooled cases and controls. Additionally, questionnaire data
indicated some associations between lymphocyte proliferation, NO activity, and DNA
Damage under the circumstances stressful life events, multiple prescription drugs, recent
immunization and a diagnosis of fibromyalgia.
Keywords: Nitrate, Nitrite, Nitric oxide, Lymphocyte Proliferation, NO activity, DNA
Damage, Mononuclear cells.

STUDY OF LOW DOSE NITRITE STRESS ON HUMAN MONONUCLEAR CELLS:
AN IN-VITRO CASE-CONTROL STUDY ON OSTEOARTHRITIS
A Dissertation
Submitted
in Partial Fulfillment
of the Requirements for the Degree
Doctor of Education
Approved:
__________________________________________ Dr. Catherine Zeman, Chair
__________________________________________ Dr. Michele Devlin, Committee Member
__________________________________________ Dr. Robin Lund, Committee Member
__________________________________________ Dr. Gowri Betrabet Gulwadi, Committee Member
Junu Shrestha
University of Northern Iowa
May 2018

ii
DEDICATION
I lovingly dedicate this dissertation to my family. I especially admire my husband, Sushil
Tuladhar who encouraged and supported me throughout this process. A special
dedication to my parents, Hari Prasad Shrestha and Jamuna Shrestha for continuously
pushing me to do my best in each step of the way.

iii
ACKNOWLEGEMENTS
Foremost, I would like to express my sincere gratitude to my advisor Dr.
Catherine Zeman for her continuous support during my doctoral study and research. I
acknowledge her patience, enthusiasm, and guidance that helped me to motivate and
focus more on my research. I am sincerely thankful to Dr. Michele Devlin, Dr. Gowri
Betrabet Gulwadi, and Dr. Robin Lund for their feedback as committee members. I
would like acknowledge the Recycling and Reuse Technology Transfer (RRTTC) at the
University of Northern Iowa (UNI) for providing funding and opportunity to be a part of
this institution.
I am thankful to Dr. Lisa Beltz of Malone University for her support and
feedback. I would like to acknowledge Ms. Jennifer Bruss of the Recycling and Reuse
Technology Transfer Center for providing me support for arranging gift cards for the
participants. I appreciate the help provided by Dr. Noha Fadlalddin and Ms. Julie
Grunklee for helping me during laboratory procedure. I would like to thank my husband
Mr. Sushil Tuladhar for his support, inspiration, and love throughout my study and
research.
Finally, I would like to thank all participants in the study for providing me their valuable
time to fill out the survey and providing their blood samples.

iv
TABLE OF CONTENTS
PAGE LIST OF TABLES ........................................................................................................... xiii LIST OF FIGURES ......................................................................................................... xvi ABBREVIATIONS ....................................................................................................... xviii CHAPTER 1. INTRODUCTION .......................................................................................1 Background ....................................................................................................................1 Problem Statement .........................................................................................................3 Significance of the Study ...............................................................................................5 CHAPTER 2. LITERATURE REVIEW ............................................................................7 Sources of Nitrate and Nitrite ........................................................................................9 Natural Sources ........................................................................................................9 Anthropogenic Sources ..........................................................................................10 Route of Exposure........................................................................................................12 The Nitrate-Nitrite-Nitric Oxide Pathway ...................................................................13 Exogenous Sources of Nitrate ................................................................................13 Endogenous Sources of Nitrate ..............................................................................14 Nitrate-Nitrite-Nitric Oxide and Human Health ..........................................................15 Osteoarthritis ................................................................................................................17 Risk Factors for Osteoarthritis ...............................................................................18 Effects of Environmental Contaminants on Osteoarthritis ....................................20 Nitrate and Its Metabolite’s Effects on Osteoarthritis .................................................22

v
Effects of Nitrate/Nitrite/Nitric Oxide in Human Cells ...............................................23 Nitrite and Lymphocyte Proliferation ....................................................................24 Nitrite and Nitric Oxide Activity ...........................................................................26 Nitrite and DNA Damage ......................................................................................27 CHAPTER 3. RESEARCH HYPOTHESIS, QUESTIONS, OBJECTIVES, AND
LIMITATIONS ..........................................................................................28 Null Hypothesis ...........................................................................................................28 Alternate Hypothesis ....................................................................................................28 Research Questions ......................................................................................................29 Objectives ....................................................................................................................30 Limitations ...................................................................................................................30 CHAPTER 4. METHODOLOGY ....................................................................................31 Study Design ................................................................................................................31 Institutional Review Board (IRB) Approval ................................................................34 Study Participants ........................................................................................................34 Recruiting Participants .................................................................................................35 Blood Draw Appointment ............................................................................................35 Questionnaire Survey ...................................................................................................35 Laboratory Procedures and Preparing Chemicals ........................................................36 Preparation of Peripheral Blood Mononuclear Cells (PBMC) ....................................36 Quality Control and Assurance ....................................................................................37 MUSE Unit Flow Cytometer System Check .........................................................37

vi
Disinfection and Cleaning Equipment and Apparatus ...........................................38 Calibrating Pipettes ................................................................................................38 Statistical Analysis .......................................................................................................39 CHAPTER 5. RESULTS ..................................................................................................40 Demographic Information ............................................................................................40 Age .........................................................................................................................40 Gender Distribution ...............................................................................................42 City of Residence ...................................................................................................44 Drinking Water Sources .........................................................................................46 Medications, Herbs, and Supplemental Information ...................................................47 Health Information .......................................................................................................52 Major Life Changing Events ..................................................................................55 Allergies…. ............................................................................................................57 Sweet-Tooth ...........................................................................................................57 Immunological Disease and Chronic Disease ........................................................57 Immunization .........................................................................................................58 Smoking Habit .......................................................................................................59 Hours Spent Outside in a Good Day ......................................................................59 Lymphocyte Proliferation of all Participants ...............................................................60 Lymphocytes Proliferation in Non-Stimulated and Stimulated Condition ............60 Degree of Change (Quotient) between Non-Stimulated and Stimulated Condition................................................................................................................63

vii
Lymphocyte Proliferation Quotient in Pooled Nitrite Concentrations ..................65
Lymphocyte Proliferation Quotient among Case (Osteoarthritis) and Control (Non-Osteoarthritis ................................................................................................67
Nitric Oxide Activity Quotient of All Participants ......................................................69 Nitric Oxide Activity by Live Cells Quotient at Various Nitrite Concentrations .......................................................................................................69
Nitrite Oxide Activity by Dead Cells Quotient at Various Nitrite Concentrations70
Nitric Oxide Activity by Total Cells Quotient (Live + Dead) at Various Nitrite Concentrations .......................................................................................................71
Nitric Oxide Activity Quotient in Pooled Nitrite Concentrations .........................71
Nitric Oxide Activity Quotient among Case (Osteoarthritis) and Control (Non-Osteoarthritis) ........................................................................................................73
DNA Damage Quotient of All Participants .................................................................74 pATM Activated Cell Quotient by Various Nitrite Concentrations ......................74 pH2A.X Activated Cell Quotient at Various Nitrite Concentrations ....................76 DNA Double-Strand Break Quotient at Various Nitrite Concentrations .......................................................................................................77 Total DNA Damage Quotient at Various Nitrite Concentrations ..........................79 pATM Activated Cells by 5 ppm Nitrite Concentration ........................................80 pH2AX Activated Cells by 5 ppm Nitrite Concentration ......................................82 DNA Double-Strand Break at 5 ppm Nitrite Concentration ..................................82 Total DNA Damage at 5 ppm Nitrite Concentration .............................................83
DNA Damage Quotient among Case (Osteoarthritis) and Controls (Non-Osteoarthritis) ........................................................................................................84
Multivariate Analysis ...................................................................................................85
viii
CHAPTER 6. DISCUSSION, CONCLUSIONS AND RECOMMENDATIONS ..........88 Discussion ....................................................................................................................88 Demographic Information ......................................................................................88 Medication, Herbs, and Supplement ......................................................................90 Health Information .................................................................................................91 Lymphocyte Proliferation ......................................................................................93 Nitric Oxide Activity .............................................................................................96 DNA Stress ............................................................................................................97 Conclusions and Recommendations ............................................................................99 REFERENCES ................................................................................................................103 APPENDIX A: RECRUITING PARTICIPANTS FOR IMMUNE SYSTEM STUDY………………… ................................................................................................114 APPENDIX B: CONSENT TO ACT AS A SUBJECT IN AN EXPERIMENTAL STUDY…………. ...........................................................................................................115 APPENDIX C: QUESTIONNAIRE ...............................................................................119 APPENDIX D: PROCEDURE FOR PREPARING CHEMICAL MIXTURES .............123 D1: Make RPMI* Mixture ........................................................................................123 D2: Make RPMI+ Mixture .......................................................................................124 D3: Reconstitute PHA...............................................................................................125 D4: Make 1000 ppm of Nitrite Solution in 10 ml of RPMI+ ...................................127 APPENDIX E: PREPARATION OF HUMAN MONONUCLEAR CELL POPULATIONS AND SUBPOPULATIONS ................................................................130 APPENDIX F: DNA MULTI COLOR DNA DAMAGE TEST SAMPLE PREPARATION ..............................................................................................................136

ix
APPENDIX G: NITRIC OXIDE TEST SAMPLE PREPARATION ............................137 APPENDIX H: ASEPTIC TECHNIQUE FOR THE LABORATORY WORK.............138 APPENDIX I: STATISTICAL ANALYSIS ...................................................................139
I1: Bivariate Fit of Lymphocyte Proliferation, NO Activity, and DNA Damage at various Nitrite Concentrations by Age ......................................................................139 I2: One-way Analysis of Lymphocyte Proliferation, NO activity, and DNA Damage at various Nitrite Concentrations by Gender .............................................................141 I3: One-way Analysis of Lymphocyte Proliferation, NO Activity, and DNA Damage at various Nitrite Concentrations by City of Residence .............................................143 I4: One-way Analysis of Lymphocyte Proliferation, NO Activity, and DNA Damage at various Nitrite Concentrations by Drinking Water Source ....................................145 I5:One-way Analysis of Lymphocyte Proliferation, NO Activity, and DNA Damage at various Nitrite Concentrations by Major Life Changing Events ...........................147 I6: Bivariate Fit of Lymphocyte Proliferation, NO Activity, and DNA Damage at various Nitrite Concentrations by No. of Supplements .............................................149 I7: Bivariate Fit of Lymphocyte Proliferation, NO Activity, and DNA Damage at various Nitrite Concentrations by No. of Medication ................................................151 I8:One-way Analysis of Lymphocyte Proliferation, NO Activity, and DNA Damage at various Nitrite Concentrations by Allergies...........................................................153 I9: One-way Analysis of Lymphocyte Proliferation, NO Activity, and DNA Damage at various Nitrite Concentrations by Sweet-Tooth.....................................................155
I10: Bivariate Fit of Lymphocyte Proliferation, NO Activity, and DNA Damage at various Nitrite Concentrations by Hours Spent Outside in a Good Day ...................157 I11: One-way Analysis of Lymphocyte Proliferation, NO Activity, and DNA Damage at various Nitrite Concentrations by Immunological and Chronic Disease ...............159 I12: One-way Analysis of Lymphocyte Proliferation, NO activity, and DNA Damage at various Nitrite Concentrations by Immunization ...................................................160 I13: One-way Analysis of Lymphocyte Proliferation, NO Activity, and DNA Damage at various Nitrite Concentrations by Smoking ...........................................................162
x
I14: One-way Analysis of Lymphocyte Proliferation in Non-Stimulate Condition....................................................................................................................164 I15: One-way Analysis of Lymphocyte Proliferation in Stimulate Condition ..........166 I16: One-way Analysis of Lymphocyte Proliferation Quotient and Nitrite Concentration .............................................................................................................168 I17: One-way Analysis of Lymphocyte Proliferation Quotient and Nitrite Concentration Pooled (Less Than 5 ppm to Equal or More Than 5 ppm) .................170 I18: One-way Analysis of Lymphocyte Proliferation Quotient and Nitrite Concentration Pooled (Less Than 10 ppm to Equal or More Than 10 ppm) .............173 I19: One-way Analysis of Lymphocyte Proliferation Quotient and Nitrite Concentration Pooled (Less Than 15 ppm to Equal to 15 ppm) ................................176 I20 (a): One-way Analysis of Lymphocyte Proliferation Quotient and Osteoarthritis (Yes/No) .....................................................................................................................179 I20 (b): One-way Analysis of Lymphocyte Proliferation Quotient and Osteoarthritis (Yes/No) at 5ppm nitrite concentration .....................................................................180 I21: One-way Analysis of Nitric Oxide Activity by Live Cells at various Nitrite Concentration .............................................................................................................183 I22: One-way Analysis of Nitric Oxide Activity by Dead Cells at various Nitrite Concentration .............................................................................................................185 I23: One-way Analysis of Total Nitric Oxide Activity (Live + Dead Cells) at various Nitrite Concentration .................................................................................................187 I24: One-way Analysis of Nitric Oxide by Live Cells in Nitrite Concentration Pooled (Less Than 5 ppm to Equal or More Than 5 ppm) ....................................................189 I25: One-way Analysis of Nitric Oxide by Live Cells in Nitrite Concentration Pooled (Less Than 10 ppm to Equal or More Than 10 ppm) ................................................192 I26: One-way Analysis of Nitric Oxide by Live Cells in Nitrite Concentration Pooled (Less Than 15 ppm to Equal to 15 ppm)....................................................................195 I27: One-way Analysis of Nitric Oxide by Dead Cells in Nitrite Concentration Pooled (Less Than 5 ppm to Equal or More Than 5 ppm) ....................................................198

xi
I28: One-way Analysis of Nitric Oxide by Dead Cells in Nitrite Concentration Pooled (Less Than 10 ppm to Equal or More Than 10 ppm) ................................................201 I29: One-way Analysis of Nitric Oxide by Dead Cells in Nitrite Concentration Pooled (Less Than 15 ppm to Equal to 15 ppm)....................................................................204 I30: One-way Analysis of Nitric Oxide by Total Cells (Live + Dead) in Nitrite Concentration Pooled (Less Than 5 ppm to Equal or More Than 5 ppm) .................207 I31: One-way Analysis of Nitric Oxide by Total Cells (Live + Dead) in Nitrite Concentration Pooled (Less Than 10 ppm to Equal or More Than 10 ppm) .............210 I32: One-way Analysis of Nitric Oxide by Total Cells (Live + Dead) in Nitrite Concentration Pooled (Less Than 15 ppm to Equal to 15 ppm) ................................213 I33: One-way Analysis of Nitric Oxide Activity among Osteoarthritis ....................216 I34: One-way Analysis of pATM Activity at Various Nitrite Concentration ...........217 I35: One-way Analysis of pH2AX Activity at Various Nitrite Concentration ..........219 I36: One-way Analysis of DNA Double Strand Break at Various Nitrite Concentration .............................................................................................................221 I37: One-way Analysis of Total DNA Damage at Various Nitrite Concentration .............................................................................................................223 I38: One-way Analysis of pATM activity in Nitrite Concentration Pooled (Less Than 5 ppm to Equal or More Than 5 ppm) .......................................................................225 I39: One-way Analysis of pH2AX activity in Nitrite Concentration Pooled (Less Than 5 ppm to Equal or More Than 5 ppm) ..............................................................228 I40: One-way Analysis of DNA Double Strand Break in Nitrite Concentration Pooled (Less Than 5 ppm to Equal or More Than 5 ppm) ....................................................231 I41: One-way Analysis of Total DNA Damage in Nitrite Concentration Pooled (Less Than 5 ppm to Equal or More Than 5 ppm) ..............................................................234 I42: One-way Analysis of DNA Damage among Osteoarthritis ...............................237 I43: Multivariate Regression on City of Residence and Lymphocyte Proliferation ...............................................................................................................238
xii
I44: Multivariate Regression on Osteoarthritis (Yes/No) and Lymphocyte Proliferation ...............................................................................................................239 I45: Multivariate Regression on Number of Medications and Lymphocyte Proliferation ...............................................................................................................240 I46: Multivariate Regression on Age and DNA Damage ..........................................241 I47: Multivariate Regression on Drinking Water Source and DNA Damage ...........242 I48: Multivariate Regression on Immunization and DNA Damage ..........................243 I49: Multivariate Regression on Osteoarthritis and DNA Damage ...........................244
APPENDIX J: PHOTOGRAPH OF TISSUE CULTURE PLATE .................................245 APPENDIX K: CELLS IN TISSUE CULTURE PLATE UNDER 10X BIOLOGICAL MICROSCOPE ................................................................................................................246 APPENDIX L: SEPARATION OF BLOOD COMPONENT IN FICOLL-HYPAQUE GRADIENT .....................................................................................................................247 APPENDIX M: PHOTOS OF LABORATORY EXPERIMENTS ................................248

xiii
LIST OF TABLES
TABLE PAGE
1 Global Nitrogen Fixation Prior to Human Influence on Agricultural Biological Nitrogen .................................................................................................................10
2 Age Distribution among Case and Control Study Groups .....................................40
3 Lymphocyte Proliferation, NO activity, and DNA damage at Various Nitrite Concentrations by Age ...........................................................................................42
4 Lymphocyte Proliferation, NO activity, and DNA damage at Various Nitrite Concentrations by Gender ......................................................................................44
5 Lymphocyte Proliferation, NO activity, and DNA damage at Various Nitrite Concentrations by City of Residence .....................................................................45
6 Lymphocyte Proliferation, NO activity, and DNA damage at Various Nitrite Concentrations by Number of Supplements ..........................................................49
7 Lymphocyte Proliferation, NO activity, and DNA damage at Various Nitrite Concentrations by Number of Medications ...........................................................52
8 Health Information .................................................................................................54
9 Lymphocyte Proliferation, NO activity, and DNA damage at Various Nitrite Concentrations by Major Life Changing Events ...................................................56
10 Lymphocyte Proliferation, NO activity, and DNA damage at Various Nitrite Concentrations by Immunological and Chronic Disease .......................................58
11 Lymphocyte Proliferation in both Non-Stimulated and Stimulated Conditions at Various Nitrite Concentrations ..............................................................................60
12 Lymphocyte Proliferation in Non-Stimulated Condition at Various Nitrite Concentrations .......................................................................................................62
13 Lymphocyte Proliferation in Stimulated Condition at Various Nitrite
Concentrations .......................................................................................................63
14 Mean Degree of Change (Quotient) at Various Nitrite Concentration ..................64

xiv
15 Mean Lymphocyte Proliferation Quotient in Pooled Nitrite Concentration (Less Than 10 ppm to Equal or More Than 10 ppm) ......................................................65
16 Mean Lymphocyte Proliferation Quotient in Pooled Nitrite Concentration (Less Than 15 ppm to Equal to 15 ppm) .........................................................................66
17 Mean Lymphocyte Proliferation Quotient between Case and Controls at 5ppm Nitrite Concentration .............................................................................................68
18 Nitric Oxide Activity by Live Cells Quotient at Various Nitrite Concentrations .......................................................................................................70
19 Nitric Oxide Activity by Dead Cells Quotient at Various Nitrite Concentrations .......................................................................................................70
20 Nitric Oxide Activity by Total Cells Quotient (Live + Dead) at Various Nitrite Concentrations .......................................................................................................71
21 Nitric Oxide Activity by Live Cells at Various Pooled Nitrite Concentrations ....72
22 Nitric Oxide Activity by Dead Cells at Various Pooled Nitrite Concentrations ...72
23 Nitric Oxide Activity by Total Cells (Live + Dead) at Various Pooled Nitrite Concentrations .......................................................................................................72
24 Nitric Oxide Activity Quotient among Case and Control ......................................73
25 pATM Activated Cells at Various Nitrite Concentrations .....................................75
26 pH2AX Activated Cells at Various Nitrite Concentrations ...................................76
27 DNA Double-Strand Break at Various Nitrite Concentrations..............................78
28 DNA Double-Strand Break at Various Nitrite Concentrations..............................79
29 pATM Activation at 5 ppm Nitrite Concentrations ...............................................81
30 DNA Double-Strand Break at Various Nitrite Concentrations..............................82
31 DNA Double-Strand Break at 5 ppm Nitrite Concentrations ................................83
32 Total DNA Damage at 5 ppm Nitrite Concentrations ...........................................84
33 DNA Damage Quotient among Case and Controls ...............................................85

xv
34 Whole Model Test of Demographic, Health, and Medication Survey with Lymphocyte Proliferation, NO Activity, and DNA Damage ................................87

xvi
LIST OF FIGURES
FIGURE PAGE
1. Schematic Presentation of a Mammalian Nitrogen Cycle .....................................15
2. Disease Associated With Promotion of OA and Matrix Calcification ..................23
3. Flowchart of Research Design ...............................................................................33
4. Gender Distribution of Study Participants .............................................................43
5. Drinking Water Source of the Participants ............................................................46
6. Herbs and Supplement Intake by the Participants .................................................47
7. Prescribed Medications Intake by the Participants ................................................50
8. Prescribed Medications Categories ........................................................................51
9. Pain Related to Osteoarthritis ................................................................................53
10. Type of Allergies Reported by the Participants .....................................................55
11. Comparing Lymphocyte Proliferation between Non-stimulated and Stimulated Conditions ..............................................................................................................61
12. Lymphocyte Proliferation in Non-stimulated Condition .......................................62
13. Lymphocyte Proliferation in Stimulated Condition ...............................................63
14. Mean Lymphocyte Proliferation Quotient at Various Nitrite Concentrations .......64
15. Lymphocyte Proliferation Quotient in Pooled Nitrite Concentration (Less Than 10 ppm to Equal or More Than 10 ppm) ....................................................................66
16. Lymphocyte Proliferation Quotient in Pooled Nitrite Concentration (Less Than 15 ppm to Equal to 15 ppm) .......................................................................................67
17. Lymphocytes Proliferation Quotient between Case and Controls .........................68
xvii
18. pATM Activated Cells at Various Nitrite Concentrations .....................................75
19. pH2AX Activated Cells at Various Nitrite Concentrations ...................................77
20. DNA Double-strand Break at Various Nitrite Concentrations ..............................78
21. Total DNA Damage at Various Nitrite Concentrations .........................................80
22. pATM Activation at 5 ppm Nitrite Concentration .................................................81

xviii
ABBREVIATIONS
ADI: Average Daily Intake
APHA: American Public Health Association
ATM: Ataxia-Telangiectasia
BNF: Biological Nitrogen Fixation
C: Concentration
CDC: Center for Disease Control
CO2: Carbon dioxide
CWA: Clean Water Act
CYT: Cytokines
DNA: Deoxyribonucleic acid
EPA: Environmental Protection Agency
GEA: Oxatriazole derivatives
GSH: Glutathione
HBSS: Hank’s Balanced Salt Solution
H2A.X: H2A Histone Family, member X
IL: Interleukin
iNOS: Nitric Oxide Synthase
xix
IPA: Isopropanol
metHg: Methemoglobin
MS: Microsoft
N: Nitrogen
N2: Nitrogen gas
NO: Nitric Oxide
NaNO2: Sodium Nitrite
NOEL: No Observed Effective Level
NO3-: Nitrate
NO2-: Nitrite
NK: Natural Killer cells
Nr: Reactive Nitrogen
OA: Osteoarthritis
PBMCs: Peripheral Blood Mononuclear Cell
PBS: Phosphate Buffered Saline
PHA: Phytohaemagglutinin
RBC: Red Blood Cells
RfD: Reference Dose

xx
RNA: Ribonucleic acid
RO: Reverse Osmosis
RPMI: Roswell Park Memorial Institute medium
RPM: Revolution per Minute
SDWA: Safe Drinking Water Act
SHC: Student Health Center
Tg: Teragram
TNF: Tumor Necrosis Factor
U.S.: United States of America
USDA: United State Department of Agriculture
USEPA: United States Environmental Protection Agency
UV: Ultra Violet
V: Volume
WHO: World Health Organization
WWII: World War Two
YMCA: Young Men's Christian Association
µl: Microliter
7- AAD: Dead Cell Marker
1
CHAPTER 1
INTRODUCTION
UBackground
Nitrate is a natural form of nitrogen and it is an integral part of the nitrogen cycle
in natural environments (Santamaria, 2006). Nitrates are generally considered as water
pollutants which occurs due to its extensive use in agricultural practices taking such
forms as fertilizers and manures from animals (Lundberg, Weitzberg & Benjamin,
2004). The proportion of nitrogen load in the environment, from various sources such as
fertilizers, manure, atmospheric deposition, sewage, and industrial sources varies
depending on locality. For example, the fertilizer sources of nitrogen are proportionally
greater in agricultural areas namely the west and the Midwest than other parts of the
nation. Similarly, animal manure contributes mainly in the South and part of the
Northeast as a major source of nitrogen deposition (Puckett, 1994). Nevertheless,
throughout the U.S. nitrates in groundwater are a problematic and widespread
contaminant (Canter, 1997) that occurs due to natural and anthropogenic sources. About
90% of the rural population in the United States uses ground water drawn from private
wells, which are not regulated by the Environmental Protection Agency (EPA) under the
Safe Drinking Water Act (Ward, 2008). Increased nitrate concentrations in the ground
water of Iowa are mainly due to various agricultural practices such as nitrogen fertilizers
and intensive animal farming (Weyer et al., 2001).
Additionally, nitrates are used in various commercial applications such as in the
food industry as food additives. Low- level nitrate exposure below 10 mg/L is not

2
considered acutely lethal to humans but long-term exposure to nitrate could cause gastric
cancer (Lundberg et al., 2004; WHO, 2011). Research indicates that there is a close
relationship between increasing nitrate concentration in drinking water and colon cancer
(Chui, Tsai, Wu & Tang, 2010; McElory et al., 2008). The research also found that
people drinking water below 10 ppm had osteoarthritis complaints, poorer health, lower
recreational activity, muscle, and nerve pain (Zeman et al., 2011) but, further research is
needed before causality can be confirmed beyond reasonable doubt.
Osteoarthritis (OA) is the most common type of arthritis, or inflammatory joint
disease that wears down the articulating cartilage between bones, weakening the whole
joint. According to CDC, 52.5 million adults have arthritis and about 294,000 U.S. kids
under age 18 have arthritis or other rheumatic conditions (American Public Health
Association, 2016). Osteoarthritis is not generally considered as a systemic
inflammatory disease, but associated with mild to moderate localized inflammatory
changes in OA synovium (membranes associated with articulating joints). Nitric Oxide
(NO) production may influence OA through both cartilage and bone metabolism (Lane
et al., 2003). The pro-inflammatory cytokines such as IL-1, TNF and several other
cytokines including IL-6, IL-15, IL-17, IL-18, IL-21, and IL-8 have also been detected
in OA synovial fluid and shown in OA implication (Grabowski et al., 1997; Kapoor,
Pelletier, Lajeunesse, Pelletier & Fahmi, 2011). The study also finds overproduction of
pro-inflammatory mediators such as NO, IL-1, (TNF)-α and prostaglandins on
chondrocytes (a unique cell type found in cartilage connective tissues that is essential for
functionality, formation, and repair of cartilage) harvested from patients with OA

3
(Abramson, 2008; Lin, Willers, Xu & Zheng, 2006; Pelletier, Pelletier & Abramson,
2001). A study done by 31TErsoy et al.31T (2002) found that serum nitrate and nitrite levels
were high in patients with OA as compared to the control group. In addition, older
women using nitrates as medications (for angina) were found to have increased risk of
developing new radiographic findings in hip of OA indicating that nitrates increased NO
production in the articular cartilage, potentially leading to greater catabolism of the
cartilage matrix, and then finally contributing to the OA development (Lane et al.,
2003).
UProblem Statement
Nitrate itself is relatively non-toxic but transforms to different metabolites
(nitrite, NO, nitrosamine) after ingestion that, depending on concentration, age, and
genetics, can be harmful to human health. About 80% of nitrate in the human body
enters through consuming vegetables, fruits, and processed food products (Hord, Tang &
Bryan, 2009). Once ingested, nitrate circulates in plasma and distributes to the tissues. It
has a half-life of approximately five hours (Lundberg, Larsen & Weitzberg, 2011).
Dietary nitrate and nitrite are useful for cardiovascular health via several mechanisms
following reduction to nitric oxide such as vascular relaxation, inhibition of platelet
aggregation and improvement of endothelial functions (Machha & Schechter, 2001).
The World Health Organization, WHO suggests that the No Observed Adverse Effect
Level (NOEL) of nitrate ion for humans is 370 mg per kg of body weight. In addition,
WHO also suggests Acceptable Daily Intake (ADI) for nitrite ions as 0-0.07mg per kg of

4
body weight (Joint FAO/WHO Expert Committee on Food Additives, 2002). Therefore
there is reason for concern about nitrate content in the daily human diet, especially
vegetables and excess nitrates/nitrites in drinking water (Shao-ting, Tong-Song & Xian-
Yong, 2007).
Dietary nitrate metabolizes into nitrite through a symbiotic process by nitrate
reducing bacteria in the human gut which then increases serum levels of nitrite and,
ultimately, salivary nitrite concentration on the posterior surface of the tongue. The
converted nitrite in the gastrointestinal tract, under acidic conditions, forms nitrous acid
which is a potent nitrating/nitrosating agent (Santamaria, 2006; Hord et al., 2009). Since
mammals lack specific nitrate reductase enzymes, the commensal bacteria in the
gastrointestinal tract initially reduce nitrates to nitrites. Formed nitrites, through various
biochemical pathways further reduce into nitric oxide (NO) through biochemical
interactions with hemoglobin, myoglobin, ascorbate, and associated protons. The NO
and NO-modified proteins formed from nitrite reduction, contribute to hypoxic signaling
and create cellular responses to this ischemic stress. In excess this is problematic; on the
other hand, it has been found that NO formed from nitrites in saliva is important for
defending against pathogens that enter via the oral route (Lundberg, Weizberg, &
Gladwin, 2008).
There are two main health issues associated with nitrates; acute
methemoglobinemia also called blue baby syndrome and cancers of the digestive tract
due to chronic nitrosamine exposure (Powlson et al., 2007). High-level nitrite
consumption also results in acute methemoglobinemia, which is a condition where the
5
blood has decreased ability to carry oxygen to tissues causing low blood pressure,
increased heart rate, headaches, abdominal cramps, and vomiting (Gehle, 2013).
As mentioned earlier, nitrate (NO3-) individually has remarkably low toxicity,
but its conversion to nitrite (NO2-) and then to N-nitrosamines creates the carcinogenic
effect. The carcinogenic properties of N-nitroso compounds such as nitrosamines and
nitrosamides are well established in cell culture and animal experiments but the
association of nitrate and its by-products is not as strongly associated epidemiologically
to human gastric cancers and there are vocal advocates on both side of the issue
(Lundberg et al., 2004).
There have been exposure assessments completed on nitrate sources in the
environment and the consequent exposure level in humans, particularly in regard to
calculations of acceptable daily intake (ADI) and reference dose (RfD). Various acute
and chronic health impacts of excess nitrate for human health are explored, but limited
work is done on the immunotoxicological impacts of nitrate exposure to the first-line
immunity (lymphocytes). There has been limited information on lymphocyte
proliferation, DNA damage, and immune response. Thus, this study will help further
knowledge of any effects of nitrate/nitrite on human immunity.
USignificance of the Study
This study will find the impact of nitrite exposure on lymphocyte proliferation in
human blood and immunological response using the following nitrite concentrations (0,
1, 5, 10, and 15 ppm). Lymphocytes, a type of white blood cell, are important for the

6
immune system, and have several forms including T-cells, B-cells and Natural Killer
Cells (NK cells). B cells are produced in the bone marrow, whereas precursors of T cell
are also produced in bone marrow but they leave the bone marrow and mature in the
thymus. Lymphocytes aid the body in preventing diseases and infections (Berke &
Clark, 2007).
The main purpose of the study is to find whether different nitrite concentrations
impact lymphocyte counts and find if there are viable cells after 96 hours of exposure.
Additionally, nitric oxide activity and genetic damage will be assayed. This study is
important because it helps understand possible harmful impacts of nitrite exposure in
human lymphocytes at varying doses of nitrite, further clarifying the
immunotoxicological impacts of varying doses of nitrite exposure. The study is an in-
vitro design, meaning blood samples are used with cells pulled from those samples being
maintained in RPMI culture medium, no direct human exposure will occur. The nitric
oxide stress and genetic assay work will aid in evaluation of any dose associated
relationships in regard to intracellular nitric oxide activity levels, cellular membrane
permeability, cell death, and the DNA damage response through the ATM dependent
signaling pathway. Overall then, this study will provide information on how different
nitrite exposures impact important aspects of the immune system.

7
CHAPTER 2
LITERATURE REVIEW
Environmentally and geochemically, nitrogen circulates through the nitrogen
cycle, and it is an essential component for the growth of green plants and all life (found
as a key component in the DNA, RNA, and proteins) on earth (Weitzberg, Hazel &
Lundberg, 2010; Weitzberg & Lundberg, 2013). Global nitrogen fixation contributes
413 Tg of reactive nitrogen in terrestrial and marine ecosystem per year of which 210 Tg
is made from anthropogenic activities (Fowler at al., 2013). Nitrogen in its gaseous
form, atmospheric nitrogen, are transformed or “fixed” by combining with oxygen in
order to become water soluble and thus absorbable by plants and animals (Weitzberg &
Lundberg, 2013; Puckett, 1994). In the twenty-first century, the Haber-Bosch chemical
process, an artificial nitrogen fixation process used in industries for the production of
ammonia, was used to fix or convert, gaseous nitrogen in the atmosphere to solid,
absorbable agricultural nitrogen to increase the yield of crops and provide sufficient
food sources for increasing populations (Fowler et al., 2013).
The Clean Water Act, implemented in 1972, is essential for controlling water
pollution from point sources such as sewage discharge but there is a lack of control from
non-point sources such as fertilizer and animal manure that triggers nitrogen in
watersheds (Puckett, 1994). The Safe Drinking Water Act (SDWA) enacted in 1974
determines the allowable nitrate level in publicly distributed water sources. Nitrate
(NOR3RP
-P) which is the environmentally stable form of nitrogen, undergoes chemical
breakdown when applied as fertilizers and accumulates in groundwater under

8
agricultural land (Ward, 2008). In soil, fertilizers and animal waste containing inorganic
and organic nitrogen are first decomposed to give ammonia and then oxidized to nitrite
and nitrate. These nitrates are then taken up by plants during their growth (WHO, 2011).
Nitrate is a common chemical compound found in nature especially in soil, water, and
food (Shao-ting et al., 2007). Nitrate in the human diet is mainly found in vegetables
such as beetroot, carrot, cabbage, potato, lettuce, and so on (Santamaria, 2006). The
dietary source of nitrate mainly includes vegetables and animal-based food products
containing nitrate and nitrite for preservatives to enhance taste and appearance with
water adding additional nitrate to the diet depending on its level (Hord et al., 2009;
Skibsted, 2011; WHO, 2011). In 2000, Americans consumed 20 percent more fruit and
vegetables than did their counterparts in 1970s. Per capita consumption of grain
products such as flour and cereal was 200 pounds (45 percent higher) annually in 2000,
which also increased compared to annual average consumption of 138 pounds in 1970s
(USDA, 2003). Additionally, the increased use of synthetic nitrogen fertilizers and
livestock manure in intensive agriculture may be contributing to higher nitrate
concentration in vegetables and drinking water compared to past years (Santamaria,
2006). In the United States, most surface and ground waters have nitrate levels below
4mg/l, with levels exceeding 20mg/l in about six percent of ground water (WHO, 2011).
However, in certain rural areas both surface and groundwater can have seasonally high
spikes in excess of 50 ppm, necessitating removal or tertiary treatment of the water for
publicly distributed systems which is quite costly (Zeman, personal communication,
September 8, 2016).

9
USources of Nitrate and Nitrite
Nitrogen (N) in the form of Nitrogen gas (N2) is the most abundant element in
the atmosphere, making up approximately 78% of the atmosphere, and the largest
“store” or “sink” of nitrogen on Earth. Atmospheric nitrogen is fixed chemically in the
ecosystem through various genera of bacteria that form symbiotic relationships with the
root structures of legumes where it is then converted to ammonia, nitrite, and nitrate in
the soil. The inert atmospheric nitrogen is fixed to make it biologically available or
absorbable to all livable organisms in the form of nitrate, nitrite, and nitric oxide
(Gilchrist & Benjamin, 2011). Plants uptake nitrate as their major nutrient and, along
with phosphorus and potassium, are often limiting factors in plant growth (Fowler et al.,
2013, Gilchrist & Benjamin, 2011; Erisman et al., 2013). There has been demand for
more food which is increasing fertilizer use and expanded acres of land (most more
erosion prone) under production, leading to enhanced losses of reactive nitrogen (Nr)
creating various negative effects such as nitrous oxide emission, eutrophication and
fresh water pollution, biodiversity loss and so on (Erisman et al., 2013).
UNatural Sources
Natural sources of nitrogen input in the ecosystem involve non-anthropogenic
activities such as atmosphere, lightning, terrestrial and marine ecosystem functions
(Fowler et al., 2013). Two natural processes convert inert nitrogen gas to reactive
nitrogen; lightning and biological nitrogen fixation (BNF) by symbiotic bacteria in the
root nodules of leguminous plants (Galloway, Schlesinger, Levy, Micheals & Schnoor,

10
1995). The terrestrial and marine ecosystems account for the highest reactive nitrogen
species production from Biological Nitrogen Fixation (BNF) processes in the
preindustrial world (Gruber & Galloway, 2008; Galloway et al., 1995; Fowler et al.,
2013). Table 1 shows that lightning is relatively unimportant as a means of fixing
nitrogen to its’ reactive nitrogen and bioavailable form, comprising only 2.4 percent of
annual, fixed global nitrogen budget; whereas, the marine ecosystem accounts for the
highest percentage, comprising two-thirds of the total budget (Fowler et al., 2013).
Table 1: Global Nitrogen Fixation Prior To Human Influence on Agricultural Biological
Nitrogen (Source: Fowler et al., 2013)
Pre-industrial terrestrial biological nitrogen
fixation
58 Tg Nyr P
-1
Marine biological nitrogen fixation 140Tg Nyr P
-1
Lightning fixation of nitrogen 5Tg Nyr P
-1
Total global natural annual sources of Nr 203 Tg Nyr P
-1
UAnthropogenic Sources
There are three main drivers of increased nitrogen production from
anthropogenic sources; land-use change, fossil-fuel burning, and industrial nitrogen
fixation (Gruber & Galloway, 2008). After WWII man-made nitrogen fertilizers became
widely popular in U.S. Agriculture, providing an inexpensive way of applying the
nutrient to plants and meeting increased demand in agriculture productivity (Ward,
2008). With increased food production, the artificial nitrogen fertilizers contributed to a
11
host of nitrogen cycle disruptions by pulling non-reactive nitrogen from the gas phase
into bioavailable/reactive and water-soluble forms, leading to environmental problems
such as eutrophication of terrestrial and aquatic systems, global acidification,
atmospheric deposition of airborne soluble nitrates, ground water pollution and human
health problems (Gruber & Galloway, 2008; Puckett, 1994). For example, the ecological
effect of too much soluble nitrogen in the aquatic environment causes algal blooms
resulting in “dead zone” areas in fresh water and coastal areas such as the massive
hypoxic zone in the Gulf of Mexico at the terminus of the Mississippi river (Ward,
2008).
When ground water pollution with nitrate is the issue of concern, nitrate isotopic
signatures are used as a tool to understand the source of nitrate contamination, especially
from agriculture. Animal manure, sewage from septic tanks, orchards, vegetables, and
agriculture were the main cause of groundwater nitrate pollution (Pastén-Zapata,
Ledesma-Ruiz, Harter, Ramírez & Mahlknecht, 2014). In addition to agriculture
sources, nitrate can enter ground water systems from non-agricultural sources. The
difference between rural and urban nitrate concentration is often small because there are
significant sources of nitrogen that are concentrated in cities such as use of lawn
fertilizers, waste water disposal and solid waste disposal (Wakida & Lerner, 2005).
Since the 1970s, the atmospheric deposition of anthropogenic nitrate increased,
reflecting the human impact on the global nitrogen cycle from the burning of fossil fuels
and the increasing reliance on catalytic converters which burn more fully gasoline but
result in higher nitrogen oxide emissions. The research indicates that the nitrogen stable

12
isotope ratio in Greenland and North American remote lake sediments snow decreased
gradually showing increased atmospheric nitrogen deposition (Geng et al., 2014). Again,
this underscores that humanity has become one of the main drivers of a reoriented,
global nitrogen cycle.
URoute of Exposure
The primary route of human exposure is through ingestion of nitrate-
contaminated water and vegetable consumption in the diet (Ward, 2008). The nitrate
ingestion through the water is an additional exposure that can push the individual
towards excess nitrate consumption. Populations living in agricultural areas typically
have high exposure to nitrate especially through private wells (Puckett, 1994;
Santamaria, 2006; Ward, 2008). Nitrates are also found in food such as in vegetables,
meat products, cheese and cheese products, fish products, and liqueurs (Santamaria,
2006; Shao-ting et al., 2007). The amount of nitrate ingestion by humans mainly
depends on the type of food consumed, for example, conventionally grown spinach has
nitrate levels exceeding the maximum level specified by European Commission
Regulation which is more than organic spinach (Muramoto, 1999). The US
Environmental Protection Agency (USEPA) has set Reference Dose (RfD) for nitrate as
1.6 mg nitrate-nitrogen/kg body weight per day which is equivalent to about 7.0 mg
nitrate/kg body weight per day. With the support from a human volunteer study EPA has
set an RfD of 0.1mg nitrite nitrogen / kg of body weight per day which is equivalent to
0.33 mg nitrite ion/kg of body weight per day (Mensinga, Speijers & Meulenbelt, 2003).

13
UThe Nitrate-Nitrite-Nitric Oxide Pathway
All living systems need nitrogen to produce complex organic molecules, such as
proteins, nucleic acids, vitamins, hormones and enzymes (Mensinga et al., 2003). Nitrate
levels in human blood and tissues originate mainly from two sources: oxidation of
endogenously produced NO through the L-arginine-NO synthase pathway and
exogenous sources such as our diet (Weitzberg & Lundberg, 2013).
UExogenous Sources of Nitrate
Consumption of vegetables and drinking water are the major sources of dietary
nitrate exposure in the human body. A single dose of leafy vegetables such as spinach or
lettuce has more nitrate content than what is formed endogenously through NO synthase
pathways (Lundberg et al., 2008; Lundberg et al., 2004). After ingesting food and water
containing nitrate, it is mostly concentrated in saliva where nitrate is rapidly converted
to nitrite by facultative anaerobic bacteria (Santamaria, 2006; Benjamin et al., 1994).
Conversion of nitrate to nitrite in saliva is mainly due to the symbiotic relationship
involving nitrate reducing bacteria on the tongue surface. Nitrite formed in this process
is then converted to nitric oxides in the stomach under acidic conditions and aid in the
host defense mechanism against pathogens (Duncan et al., 1995; Lundberg et al., 2004).

14
UEndogenous Sources of Nitrate
Nitrates are also formed endogenously through the L-arginine- NO pathway. L-
arginine is a proteinogenic amino acid found naturally in dietary proteins and involved
in various metabolic pathways including nitric oxide synthase (Böger, 2007). The L-
arginine- NO pathway is constitutively active in numerous cell types throughout the
body where NO is produced from amino acid L-arginine and molecular oxygen by an
enzyme called NO synthase (Moncada et al., 1991; Lundberg et al., 2004). The L-
arginine-NOS pathway is oxygen dependent and there is no sufficient formation of NO
when oxygen supply is less (Lundberg et al., 2008). NO is produced by different cells
such as vascular endothelial cells, platelets, macrophages, neutrophils, and other cells. In
these tissues, L-arginine acts as a transduction mechanism that releases NO. The
released NO acts as a part of host defense mechanisms, cytotoxic to tumor cells, and
mediates other aspects of the immunological response caused my invasive organisms
(Moncada et al., 1991).
Figure 1 shows nitrate-nitrite-nitric oxide pathways where ingested inorganic
nitrate metabolizes to nitric oxide and other bioactive nitrogen oxides. The figure also
illustrates both endogenous and exogenous sources of nitrate in the human body. Nitrate
generates mainly through diet and nitric oxide through nitric oxide synthase. Nitric
oxide converts to nitrate in two different ways; first is rapid oxidation to nitrite and then
to nitrate and second is through oxyhemoglobin. On the other hand, dietary nitrate
converts to nitric oxide through bacterial nitrate reductase under acidic conditions
(Weitzberg et al., 2010).

15
Figure 1: Schematic Presentation of a Mammalian Nitrogen Cycle (Source: Weitzberg et al., 2010)
UNitrate-Nitrite-Nitric Oxide and Human Health
Nitrogen is essential to all living organisms to produce complex organic
molecules such as proteins, nucleic acid, vitamins, hormones, and enzymes (Mensinga et
al., 2003). In the human body, only 5-10% of ingested nitrate is converted to more toxic
nitrite by salivary or gastrointestinal reduction. However, people should avoid high
nitrate intake for a prolonged period (Boink & Speijers, 2001). Presence of nitrates in
vegetables, drinking water, and other foods, in excessive amounts, is a serious threat to
human health (Santamaria, 2006). Two major toxicological concerns are related with
nitrite. First, nitrite induces methemoglobinemia resulting in tissue hypoxia and possibly
death, particularly in children less than one year of age. Second is the formation of N-
nitroso carcinogens (Mensinga et al., 2003; Santamaria, 2006; Shao-ting et al., 2007).

16
The study by Weyer et al. (2001) showed the relation between drinking water nitrate
level and cancer risk in older women in Iowa. The study showed a positive association
for bladder and ovarian cancer and an inverse association observed for uterine and rectal
cancer among women drinking water from public sources. In addition, there was no
association between drinking water and non-Hodgkin lymphoma, leukemia, melanoma,
and cancers of the rectum, pancreas, kidney, and lung. Nitrate in drinking water is also
associated with a risk of thyroid cancer and thyroid disease among populations
consuming water containing more than 5 ppm nitrate for more than five years. It appears
that nitrate entering the human body may compete with an uptake of iodide by the
thyroid (Ward et al., 2010). Dietary nitrate and nitrite from processed meats are also
associated with increased risk of breast cancer among postmenopausal women (Choi,
Sinha, Gierach & Ward, 2015).
Long-term nitrate therapy in the form of various prescription medications shows
possible genotoxic activity in the form of cytotoxicity and cell cycle delay. In vitro
treatment of peripheral lymphocytes showed dose-dependent increases in the frequency
of micro-nucleated lymphocytes with increasing sodium nitroprusside concentrations
indicating signs of genotoxicity (Andreassi et al., 2001).
A retrospective cohort study done in Iowa on private well users also indicated a
positive association between higher nitrate exposure and health problems such as high
body mass index, low recreational activity, poorer health, and susceptibility to illness. In
addition, nitrate exposure positively correlated with methemoglobin level, high tumor
necrosis factor –beta expression, complaints of the stomach and intestinal difficulties

17
complaint of osteoarthritis, and production of various cytokines associated with bone
and joint disorders such as TNF-β and the Th2/Treg cytokine, IL-10 (Zeman et al.,
2011).
UOsteoarthritis
OA is the most prevalent arthritic disease and affects 10 to 15 percent of world’s
population. The frequency of this disease increases with aging and the incidence is
higher than 60 percent among the population over 65 years of age. Since OA is closely
associated with the aging process, there is also a growing public health cost worldwide
(Pelletier & Pelletier, 2007). In the United States, 23 percent of all adults have arthritis
and it is estimated that by 2040, 26 percent of all adults will have arthritis. Among the
people having arthritis, 60 percent are of working age, (18-64 years) creating a public
health problem that translates into a workforce productivity issue. OA is the most
common form of arthritis affecting 30 million adults in the United States and was the
second most expensive health condition treated at US hospitals in 2013 (CDC, 2016). In
the athlete or young individual, injury, occupational activities, and obesity are the main
factors contributing to the development of OA. Among the athlete, diagnosis of OA is
often delayed and difficult because of their high tolerance to pain and preference for an
expedited return to play (Amoako & Pujalte, 2014).
OA is a degenerative joint disease that causes abnormal remodeling of the joint
and articular tissues. Inflammatory mediators present elevate pain within affected joints.
The pathologic changes seen in OA are degeneration of articular cartilage, thickening of
subchondral bone, and inflammation of the synovium (Loeser, Goldring, Scanzello, &
18
Goldring, 2012). The articular cartilage has a limited repair capacity and therefore it is
difficult to heal the damaged cartilage resulting, in loss of cartilage and ultimately loss
of joint function (Kraan, 2012).
URisk Factors for Osteoarthritis
Age is one of the strongest risk factors for the onset of OA in all joints. It is a
chronic disease which is associated with cumulative exposure to various joint damage
risk factors and biological changes. With increasing OA incidence, there is greater
mobility restriction and increasing financial burden among older people. The conditions
creates greater chronic disease care cost while decreasing opportunities for mobility
related social events and activities. The joints are less able to cope with adversity effects
experienced with aging such as cartilage thinning, weak muscle strength, and oxidative
damage (CDC, 2016; Zhang & Jordan, 2010). Aging causes articular cartilage
degeneration that includes fibrillation of the articular surface, aggregation of
proteoglycan aggrecans, loss of tensile strength, and stiffness (Martin & Buckwalter,
2001).
Gender is another important factor for the prevalence of OA. A Korean study
completed with the elderly population indicated that knee OA is highly prevalent among
the elderly population and elderly women are at high risk of requiring total knee
arthroplasty (Cho et al., 2011). The risk of OA increases among postmenopausal women
due to lack of estrogen. There is increasing evidence that estrogen plays a protective role
in maintaining the homeostasis of articular tissues and hence protects the joint. Estrogen
deficiency is a result of postmenopausal ovary insufficiency and progressive structural

19
and functional changes in articular cartilage begin at early menopause and persist post
menopause. This lack of estrogen leads to increased prevalence of OA especially in
older women, creating a big impact on health costs among these populations (Roman-
Blas, Castañeda, Largo & Herrero-Beaumont, 2009).
Obesity is another factor associated with the incidence and progression of OA.
About 2 in 3 Americans may develop symptomatic knee OA by the age of 85 years
among the obese population. It has a significant impact on the musculoskeletal system
including both degenerative and inflammatory conditions. Obesity leads to increased
loading on the weight-bearing joints leading to knee adduction and impacting the
articular cartilage (Garfinkel, Dilisio, & Agrawal, 2017; King, March, &
Anandacoomarasamy, 2013). Coggon et al. (2001) found that the risk of knee OA
increases by 13.6 times for people having a body mass index of 36 kg/mP
2P or higher.
They also suggested that if all overweight and obese people reduced their weight by 5kg
or within the recommended level, then 24 percent of surgical interventions for OA of the
knee could be avoided (Coggon, Reading, Croft, McLaren, Barrett, & Cooper, 2001).
Other risk factors associated with OA include diet and physical activity. People
with poor nutrition and lack of physical activity have a greater risk of gaining weight
and have a higher chance for accelerated joint damage. Messier and colleagues did an
intervention study to find the effects of diet and exercise for weight loss in overweight
and obese adults with knee OA. Participants who followed the diet and exercise
programs had less inflammation, less pain, better function, faster-walking speed, and
better health-related quality of life (Messier et al., 2013). Vitamin D is important in the

20
reduction of inflammation and influences T and B lymphocytes, macrophages, and
dendritic cells. Vitamin D sufficient patients have a lower risk of developing OA and
decreased articular cartilage degeneration radiographically. Therefore, Vitamin D
supplementation may be a safe method to treat and prevent OA (Garfinkel et al., 2017).
Occupational physical activity is also related to the onset of knee OA. This
disease is common among the populations who have performed heavy physical work
particularly jobs involving knee bending, kneeling, or squatting. Prolonged knee
bending in addition to occupational lifting lead to a higher risk of knee OA. Repetitive
joint injury and high impact exercise are also related to the radiographic progression of
knee OA. Individuals having normal joints and with low-impact exercise did not have
increased risk of developing knee OA, but former elite athletes who performed high-
impact activities involving joints that had accommodated serious stress and load had
increased risk of OA (Hunter, March, & Sambrook, 2002).
UEffects of Environmental Contaminants on Osteoarthritis
Environmental contaminants such as synthetic perfluorooctanoate (PFOA) and
perfluorooctane sulfonate (PFOS) used in the nonstick and stain-resistant coating of
cookware, furniture, food container, and carpets affect metabolic regulation,
inflammation, and implicate the pathogenesis of OA. People with highest quartile serum
PFOA levels were approximately 40% more likely to report a diagnosis of OA, and
people with highest quartile serum PFOS levels were approximately 25% more likely to
report a diagnosis of OA. People with diagnosed OA showed significant positive

21
association with PFOA and PFOS serum levels indicating important public health
implications (Innes, Ducatman, Luster, & Shankar, 2011).
Persistent organic pollutants (POPs) are organic chemical compounds that are
highly toxic, persist in the environment, and bioaccumulate in liver and fatty tissue such
as skin and endocrine system. POPs are stored in adipose tissue. According to Kim et al.
(2011), total POP burden was 2 to 3 times higher in obese than in lean individuals.
Metabolic factors related to obesity such as secretion of leptin (hormone produced by
adipose tissue) have been linked with the onset of OA. Exposure to some kinds of POPs
such as dioxins and poly chlorinated biphenyls (PCB) was positively associated with
arthritis in women. POPs are also endocrine disruptors which are thought to contribute
to the development of obesity and also influence the immune system, possibly
increasing the risk of rheumatoid arthritis (RA) (Lee, Stefffes, & Jacobs, 2007;
Newbold, 2010).
Nitrate is an environmental contaminant present in food, drinking water, and
medications. In an adult’s diet, the largest portion of the nitrite exposure comes from
vegetable consumption. In addition to that, consuming water (depending on water’s
nitrate level) increases individual exposure to this contaminant above dietary intakes.
According to Zeman et al. (2011) people consuming an increased level of nitrate in
drinking water complained of pain in their bone, muscle, and nerve (F=6.05, p=0.015).
In addition, those people also complained about stomach and intestinal problems
(F=5.27, p=0.0231). Another study conducted by Lane et al. (2003) also found that

22
elderly white women who took nitrate medication for chest pain had twice the chance of
having osteoarthritis of hip when compared to controls not taking nitrate medications.
UNitrate and Its Metabolite’s Effects on Osteoarthritis
Osteoarthritis (OA) predominantly affects the diarthrodial joints causing
articular cartilage destruction. There is also evidence that inflammatory mediators such
as proinflammatory cytokines, NO, prostaglandins, and leukotriene are involved in OA
pathophysiology (Pelletier & Pelletier, 2007). NO involvement in arthritis was first
demonstrated when elevated levels of nitrite, which is the stable end product of NO
metabolism, was found in serum and synovial fluid samples of rheumatoid and
osteoarthritis patients (Jang & Murrell, 1998). NO compound supplemental therapy
enhances local NO production and has an estrogen-like beneficial effect in bone, but
without estrogenic adverse effects, and can be an attractive alternative to estrogen
therapy for osteoporosis (Wimalawansa, 2010).
NO is a proinflammatory factor associated with OA, but evidence suggests that
NO and its redox derivatives may also play protective roles in the joint. But an excess
local production of NO aggravates bone destruction in inflammatory arthropathies
(Abramson, 2008; Wimalawansa, 2010). In addition, excess formation of NO results in
the development of osteoarthritis and triggers chondrocyte apoptosis (death of cells
found in healthy cartilage) and matrix destruction (enhancing cartilage destruction). In
osteoarthritis cartilage, 18-21% of chondrocytes showed apoptotic features as opposed
to only 2-5% observed in normal cartilage. The deleterious role of NO can be observed
from measuring nitrite/nitrate and nitro tyrosine concentrations and inducible nitric
23
oxide synthase (iNOS) in various cell cultures such as biopsy specimens, cartilage
explants, and cytokine stimulated cells (Feelisch, 2008; Heraud, Heraud & Harmand,
2000; Mackenzie, Rutherford & Mac Donald, 2008). Figure 2 shows various
heterogeneous processes that promote cartilage injury and nitric oxide redox stress,
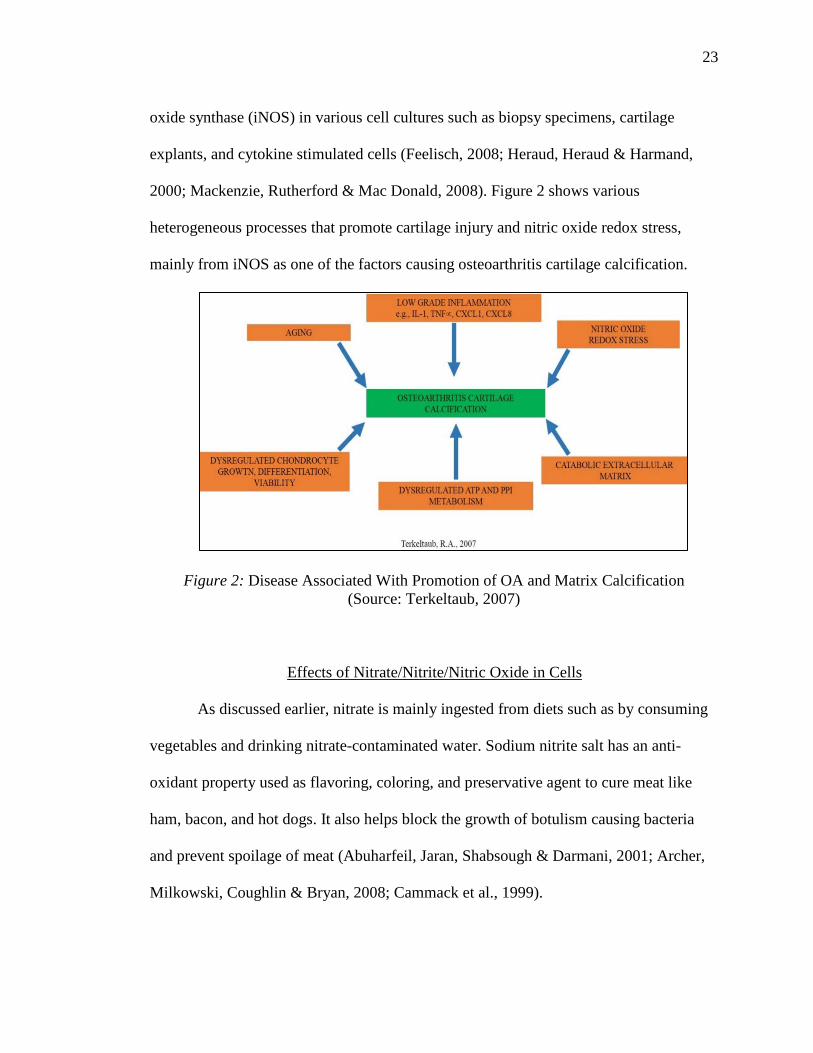
mainly from iNOS as one of the factors causing osteoarthritis cartilage calcification.
Figure 2: Disease Associated With Promotion of OA and Matrix Calcification (Source: Terkeltaub, 2007)
UEffects of Nitrate/Nitrite/Nitric Oxide in Cells
As discussed earlier, nitrate is mainly ingested from diets such as by consuming
vegetables and drinking nitrate-contaminated water. Sodium nitrite salt has an anti-
oxidant property used as flavoring, coloring, and preservative agent to cure meat like
ham, bacon, and hot dogs. It also helps block the growth of botulism causing bacteria
and prevent spoilage of meat (Abuharfeil, Jaran, Shabsough & Darmani, 2001; Archer,
Milkowski, Coughlin & Bryan, 2008; Cammack et al., 1999).

24
A study on the effects of sodium nitrite on red blood cells (RBC) showed
hyperpolarization of the erythrocyte membrane and increases in membrane rigidity due
to RBC oxidation. In addition, exposure to sodium nitrite changed intracellular
methemoglobin (metHg) and reduced glutathione (GSH) levels in the RBC (Zavodnik et
al., 1999). An in-vitro study on the effect of sodium nitrite (NaNO2) on human
erythrocytes also showed a dose dependent decrease of glutathione, total sulfhydryl, and
amino groups. In addition, sodium nitrite was also associated with induction of oxidative
stress resulting in an imbalance between free radicals and detoxification by the body
(Ansari, Ali, & Mahmood, 2015).
Oxatriazole derivatives GEA 3162 and GEA 3175, which is a pharmaceutical
drug containing NO, also showed effects on NK cell proliferation. This drug inhibited
mononuclear cell proliferation in a dose-dependent manner (Kosonen, Kankaanranta,
Vuorinen & Moilanen, 1997).
UNitrite and Lymphocyte Proliferation
Lymphocytes such as T cells, B cells, and NK cells are “white blood cells” that
are essential for the immunological functioning of the human body (Yaqoob & Calder,
1998). T cells or T lymphocytes are the part of the immune system that protects the body
from infection and may help fight cancer. B cells are also one of the white blood cells
that make antibodies. Natural killer cells produce enzymes that can kill tumor cell or
cells infected with a virus. Lower lymphocyte production also called lymphopenia is a
disorder in which the blood does not have enough white blood cells (<1500/µl).

25
Decreased lymphocytes raise the risk of infection (Brass, Mckay, & Scott, 2014).
Lymphopenia is also associated with the onset of infectious diseases such as HIV,
rubella, tuberculosis etc. and occurs in a wide variety of conditions such as Hodgkin
lymphoma, anemia, autoimmune disease, and blood cancer.
Lymphocytosis, on the other hand, is associated with an increased number of
peripheral blood lymphocytes (>4500/µl in individuals older than 12 years of age and
>8000/ µl in individuals younger than 12 years of age). Lymphocytosis is commonly
related to viral infection and is a temporary situation. But in some cases, it can be more
serious such as blood cancer or chronic infection/inflammation (Naeim, Rao, Song, &
Grody, 2013).
Nitric oxide is a free radical that is formed through the reduction of nitrate and
nitrite in a human body. In high concentrations nitric oxide is known to suppress T cell
proliferation (Sato et al., 2007). Sodium nitrite, mainly used as a food preservative, is of
environmental health concern because of its inhibitory effects on natural killer (NK)
cells. NK cells are important in the immune system because they defend the body
against pathogens and tumor cells by modulating both innate and adaptive immune
response. Inhibition of the NK cells contributes to tumor promotion in vivo. Exposure to
several concentrations of sodium nitrite (0, 0.1, 0.2, 0.4, and 0.8 mg/ml) showed
significant inhibition (25.3-66.6%) of NK cell activity. In addition, sodium nitrite also
inhibited the proliferation activity of NK cells in a dose-dependent fashion (Abuharfeil,
Sarsour & Hassuneh, 2001).

26
The study by Ustyugova, Zeman, Dhanwada and Beltz (2002) indicated that
nitrite decreased lymphocyte proliferation. With regard to lymphocyte cytokine
expression, the study found that in one-third to two-thirds of subjects tested, both
sodium nitrate and nitrite decreased the production of T-helper 1 cytokines such as IL-2,
INF-γ, and TNF-β.
UNitrite and Nitric Oxide Activity
Inorganic nitrate ingested through food, water, and medications is converted to
nitrite by facultative bacteria found in the dorsal surface of the tongue and in some areas
of the gut in children less than one year of age. The saliva concentrated with nitrite
arrives in the stomach where it is converted into NO which provides a strong
antibacterial effect (Lundberg et al., 2008). Dietary supplementation, in the form of
beetroot juice, increases plasma nitrite concentration, thereby producing NO. In
addition, dietary nitrate and nitrite also serve as a source to produce nitrogen metabolites
such as RNS (Bailey et al., 2009; Hord, 2011). NO is a marker of inflammation in the
body.
Chronic inflammation is one of the risk factors for human cancer at various sites,
for example, Helicobacter pylori (H. pylori) is associated with chronic gastritis a risk
factor for gastric cancer, inflammatory bowel disease (ulcerative colitis and Crohn’s
disease) a risk for colorectal cancer, and viral hepatitis leading to cirrhosis for liver
cancer. Inflammation of many of the tissues is associated with upregulation of NO for a
prolonged period. Accumulating NO-derived reactive nitrogen species (RNS) have a
damaging impact on nucleic acids, proteins, and lipids. In addition, RNS contributes to

27
DNA and tissue damage by increasing mutation rate, genome instability, and cell
apoptosis. Concurrent generations of NO and superoxide can induce single-strand
breakage under a variety of conditions (Sawa & Ohshima, 2006).
UNitrite and DNA Damage
DNA damage, in particular, DNA double-strand break causes damage to DNA
bases and causes lesions that can block progression and replication in chromosomes. It is
the most deleterious type of damage, if not properly repaired. It can also be caused by
environmental exposure such as irradiation, various genotoxic chemical agents, or
ultraviolet light (UV) (Negritto, 2010). Ataxia telangiectasia- mutated (ATM), encodes a
protein, pATM which acts as a checkpoint that senses DNA damage and in particular
DNA double-strand break (Paules et al., 2001).
Another maker of DNA double-strand break is phosphorylation of histone H2AX
variant (pH2AX). It is the most sensitive marker that can be used to examine DNA
damage. The pH2AX is typically deactivated at the completion of proper DNA repair.
Additionally, activation of the ATM through phosphorylation of one of the variants of
histone H2AX is an early marker of a cell’s response to DNA damage (mainly formation
of DNA double-strand break). The modification of ATM and H2AX are involved in
DNA repair and in activating checkpoints that halt the progression of damage (Zhao et
al., 2017).

28
CHAPTER 3
RESEARCH HYPOTHESIS, QUESTIONS, OBJECTIVES, AND LIMITATIONS
UNull Hypothesis
H01: There is no statistical difference in lymphocyte proliferation between different
nitrite concentrations.
H02: There is no statistical difference in lymphocyte proliferation between case
(osteoarthritis) and controls (no osteoarthritis).
H03: There is no statistical difference in NO activity at different nitrite concentrations.
H04: There is no statistical difference in NO activity between case (osteoarthritis) and
controls (no osteoarthritis).
H05: There is no statistical difference in DNA damage at different nitrite concentrations.
H06: There is no statistical difference in DNA damage between case (osteoarthritis) and
controls (no osteoarthritis).
UAlternate Hypothesis
Ha1: There is a statistical difference in lymphocyte proliferation between different nitrite
concentrations.
H a2: There is a statistical difference in lymphocyte proliferation between case
(osteoarthritis) and controls (no osteoarthritis).
Ha3: There is a statistical difference in nitric oxide activity at different nitrite
concentrations.
29
Ha4: There is a statistical difference in nitric oxide activity between case (osteoarthritis)
and controls (no osteoarthritis).
Ha5: There is a statistical difference in DNA damage at different nitrite concentrations.
Ha6: There is a statistical difference in DNA damage between case (osteoarthritis) and
controls (no osteoarthritis).
UResearch Questions
1. Are there differences in lymphocyte proliferation among different nitrite
concentrations?
2. How do lymphocytes from individuals with and without osteoarthritis respond to
various nitrite concentrations?
3. Are signs of NO activity evident with the nitric oxide activity test? And, if so,
does it exhibit a dose response relation?
4. How do NO activity test from individuals with and without osteoarthritis respond
to various nitrite concentrations?
5. Are signs of DNA damage evident with the DNA damage test? And, if so, does it
exhibit a dose response relation?
6. How do DNA damage test from individuals with and without osteoarthritis
respond to various nitrite concentrations?
30
UObjectives
● To find whether elevated nitrite concentrations have impact on overall
lymphocyte proliferation, nitric oxide activity, and DNA Damage.
● To find whether elevated nitrite concentrations have impact on lymphocytes
proliferation between case and controls.
● To find whether elevated nitrite concentration has an impact on nitric oxide
activity between cases and controls.
● To find whether elevated nitrite concentrations have impact on DNA Damage
between cases and controls.
ULimitations
• The study had only 32 participants, 16 with osteoarthritis and 16 without
osteoarthritis. The sample size was relatively small.
• The participants self-reported health, medication, and herbs/supplement
information which might impact the experimental outcomes.
• Participants self-reported themselves as being osteoarthritis patient.

31
CHAPTER 4
METHODOLOGY
This in-vitro case-control study examined the impact of different low dose nitrite
concentrations (0, 1, 5, 10, and 15 ppm exposure scenarios) on the human mononuclear
cell (lymphocyte proliferation and viability), cellular nitric oxide activity, and DNA
damage. This study focused on participants with osteoarthritis (case) and without
osteoarthritis (control) with ages ranging from 40 to 65, inclusive. This method also
included the addition of phytohaemagglutinin (PHA), a mitogen that triggers
lymphocyte mitosis, to the human mononuclear cells to determine the difference in cell
counts between the stimulated and non-stimulated cells for both cases and controls under
the five exposure scenarios.
UStudy Design
The study is an in-vitro experiment that incorporated the Ficoll-Hypaque density
gradient centrifugation method to process participants’ blood and extract mononuclear
cells. Peripheral blood mononuclear cells (PBMCs) consist of mostly lymphocytes and
monocytes that are used for various experiments including issues with human
immunology and production of cytokines (Panda & Ravindran, 2013). After extracting
the mononuclear cells, a Millipore, Muse (S.N. 7200121194) flow cytometer was used
to perform cell counts and viability, DNA damage, and nitric oxide activity tests on
mitotically stimulated and non-stimulated cells across five exposure groups of nitrate
exposure.

32
Following initial cell counts and viability analysis (Muse), cell concentrations were
determined and adjusted to 4x10P
6Pcells/ml with plating of cells to micro-cell-well plates,
these mononuclear cells were then experimentally dosed with different nitrite
concentrations such as 0, 1, 5, 10, and 15 ppm wherein the cells in 0 ppm mean un-
dosed and the cells in 1, 5, 10, and 15 ppm indicated dosed. In stimulated wells, PHA
was added to trigger lymphocyte mitosis. These cells were then incubated at 35P
oPC with
5% COR2R. After 48 hours of incubation, the nitric oxide stress and DNA damage tests
were completed using the MUSE Unit Flow Cytometer. The functional principle of each
test relies on flow cytometry detection of key immune assay linked molecules indicative
of the outcome under study. The main objective of the nitric oxide activity test was to
detect changes in cellular nitric oxide activity level. Similarly, DNA damage analysis
tests are designed to detect ATM and H2A.X signaling pathways (indicative of DNA
damage through decoupling of phosphorylation pathways and/or DNA strand breaks).
After 96 hours of incubation, the total number of viable cells was counted through the
counts and viability test in the MUSE Unit flow unit (Figure 3)

33
Figure 3: Flowchart of Research Design
Analysis & Report
Eliminate from the study
NO activity: After 48 hours of incubation, this test was conducted to find cellular NO activity
DNA Damage: After 48 hours of incubation, this test was conducted to detect activation of signaling pathways
Counts & Viability: After 96 hours of incubation, this test was conducted to count viability cells at different nitrite concentrations
Did the whole blood produce enough white blood cells?
Yes
No
No
Yes
Selection of Participants 32 Total (16 each With and Without
Osteoarthritis)
Do the participants have
autoimmune disease?
Scheduled a blood draw appointment with the target population at the Student Health Clinic at University of Northern Iowa and Questionnaire Survey
Sample Collection and Processing: • 15-20 ml of blood collected from each
participant • The blood sample was processed on the
same day to extract mononuclear cells
Eliminate from the study
Sample Collection and Processing: • The extracted mononuclear cells was
exposed to different nitrite concentrations (0, 1, 5, 10, 15 ppm)
• The samples were incubated at 35oC at 5% CO2
level
34
UInstitutional Review Board (IRB) Approval
The study design followed the Institutional Review Board (IRB) Approval in
order to maintain confidentiality of the participants and adhere to strict rule of protecting
human subjects from unpredicted consequences due to intervention such as answering
the questionnaire and giving a blood sample. The IRB approval assures the participants
that the research they are involved in meets the required standards and will protect the
identity of the participants. This study was approved by the IRB board at the University
of Northern Iowa and is valid until the completion of the project. All participants gave
full, informed consent to participate (Appendix B)
UStudy Participants
The population chosen for this in-vitro case-control study was 40 to 65 years old,
both with and without OA. Each participant filled out a consent form along with a brief
questionnaire survey about their health and medications (Appendix C). The participation
was voluntary, and there was only slight physical risk (blood draw) and no emotional
stress to the participants. The study involved 32 participants; 16 with osteoarthritis (case
group) and 16 without osteoarthritis (control group). The study excluded participants if
they reported any prior autoimmune disease such as rheumatoid arthritis, Grave’s
disease, etc. or if they were outside the chosen age group.

35
URecruiting Participants
The research adopted various strategies to recruit participants. First, the flyer
(See Appendix A) about the study was distributed across the University area including
departments and the community for their voluntary participation. Second, a brief
presentation about the research was given in faculty meetings and classes to recruit
potential participants. Third, a community outreach approach was done to recruit
additional participants from places such as the YMCA, Cedar Valley Medical Specialist
at the University of Northern Iowa, and Churches. The research provided a $10 Kwik
Star gas card as a gratitude for participation.
UBlood Draw Appointment
Once the individual made contact with the researcher, expressing his/her interest
in participating, a blood draw appointment with the Student Health Center (SHC) at
University of Northern Iowa was scheduled. Participants donated 15-20 mL of blood (2-
5 teaspoons which falls within Red Cross Guidelines), which was drawn by a trained
phlebotomist, at the SHC.
UQuestionnaire Survey
At the time of the blood draw appointment, participants filled out a short
questionnaire survey that included demographic, health, and medication information.
The study assumed that the information provided by each participant is correct and not
biased on any of the questions asked. The questionnaire survey was designed to find out
36
if current health and medication status in addition to the experimental exposures would
impact the mononuclear cell counts. Also, demographic information determines the
social and demographic status of the participants (See Appendix C).
ULaboratory Procedures and Preparing Chemicals
The following general summary outlines the basic procedures of cell culture.
1. Make RPMI* mixture (See Appendix D1)
2. Make RPMI+ mixture (See Appendix D2)
3. Reconstitute PHA (See Appendix D3)
4. Make sodium nitrite solution (See Appendix D4)
UPreparation of Peripheral Blood Mononuclear Cells (PBMC)
The laboratory procedure for preparing mononuclear cells followed a standard
protocol provided by Kanof, Smith, and Zola (1996) section 1 unit 7.1 entitled “Isolation
of whole mononuclear cells from peripheral blood and cord blood.” For detailed
information, please see Appendix E
After isolating mononuclear cells from whole blood, depending on the viable cell
counts, the cells were diluted to get experimental cell concentrations of 4*10P
6P cells/ml.
Finally, the cells were cultured in experimental sterile microcell well culture plates with
different nitrite concentrations (0, 1,5,10, and 15 ppm) followed by adding PHA to the
stimulated wells (non-stimulated wells will not receive PHA). For each blood sample,

37
there were three different tests (counts and viability, DNA damage, and nitric oxide
stress).
The prepared culture plates of each test were incubated at 35P
0PC at 5% CO2 level.
After 48 and 96 hours of incubation respectively, the MUSE flow cytometer provided
DNA damage and nitric oxide activity results, and a count and viability of the cells (see
Appendix F and G).
UQuality Control and Assurance
The laboratory procedures followed all aseptic techniques to minimize
contamination from external sources (see Appendix H). All pipettes were calibrated each
month to ensure accuracy of the equipment. The system check procedure of the
Millipore, MUSE Unit Flow cytometer was performed before each experiment to control
for error in the final data. In addition, 10% Penicillin Streptomycin was added in RPMI
medium to protect from bacterial and fungal growth in the media.
UMUSE Unit Flow Cytometer System Check
A system check procedure is important for quality control of the Muse Unit.
Before running any tests, a system check procedure was run to check the accuracy and
reliability of the instrument. The system check kit included a bead reagent tube and a
small bottle of diluent. For the system check procedure, 20µl of bead reagent was added
to 380 µl of system check diluent in a clean micro-centrifuge tube and mixed thoroughly
on a vortex machine. The system check was run on the Muse instrument. After running
three replicates on the instrument, the display either showed “PASS” or “FAIL” as a

38
result. If the system check was ran properly, then the result showed a “PASS” and after
that the samples were run through the instrument to find lymphocytes proliferation,
nitric oxide activity, and DNA damage among the cultured cells.
UDisinfection and Cleaning Equipment and Apparatus
The laboratory followed strict aseptic technique to minimize any external
contamination during extracting mononuclear cells and then analyzing the lymphocytes
on Muse Unit. Once in a month, the COR2R incubator was cleaned thoroughly with high
heat disinfection technique to ensure that there was no biological contamination inside
the incubation. In this technique, a program was set to increase the internal temperature
of the incubator to 120°C for 4 hours, and then programmed to cool the temperature to
37°C. In addition, the incubator was sterilized with 99.8% isopropanol to remove any
contamination before incubating the cultured plates.
UCalibrating Pipettes
This laboratory method used pipettes of different volume to meet the need of an
experiment. The manufacture or the company calibrated the pipettes used in this
experiment which was valid for one year. In addition, the pipettes were cross checked
each month by following standard calibration technique to ensure accuracy and
precision of the pipettes used for the experiment.
39
UStatistical Analysis
The data collected from the questionnaire survey, counts and viability, DNA
damage, and nitric oxide activity was entered into an MS Excel program and then
imported to JMP 13 software for statistical analysis. Data were analyzed by a standard
statistical procedure that includes univariate, bivariate, and multivariate analysis as
appropriate. Univariate analysis includes descriptive statistics such as age, gender,
location, health status and habits. Bivariate analysis includes one way ANOVA, t-test,
and correlational analysis. Multivariate analysis includes Whole Model Test. The
significance value was set at p<0.05.

40
CHAPTER 5
RESULTS
This chapter presents the analysis of all data collected from questionnaire survey
and laboratory experiment that included cultured cells from case and control groups.
Results from the MUSE Unit (flow cytometry) include data on counts and viability of
lymphocytes proliferation, nitric oxide stress, and DNA damage. All experimental data
were recorded in MS Excel along with the questionnaire responses and then transferred
to JMP 13 for statistical analysis. Following are the findings from the study.
UDemographic Information
UAge
The total number of participants in this study was 32, among which 16
participants had osteoarthritis and 16 did not have osteoarthritis. The participants’ ages
ranged from 41 (minimum) to 65 (maximum). The mean age of case and control groups
was 54.13 and 52.56 (Table 2) respectively.
Table 2: Age Distribution among Case and Control Groups
N Minimum Maximum Mean Std. Deviation Case (With OA) 16 44.00 65.00 54.3125 5.59427 Control (Without OA) 16 41.00 65.00 52.5625 8.39816 Valid N (listwise) 16

41
Bivariate fit tests were conducted between three laboratory experiments on
mononuclear cells (lymphocyte proliferation, NO activity, and DNA damage) with
various nitrite exposures. Since participants ranged in age (see above) age was examined
as a possible confounder or effect modifier of lymphocyte proliferation. Overall, the age
of the participants did not impact the lymphocyte proliferation, however, there was a
decreasing trend of proliferation observed at 10 ppm nitrite concentration with
increasing age but was not statistically significant (p>0.05) (Table 3 and Appendix I1).
In the case of NO activity, a slightly decreasing trend of NO activity by total
cells was observed at 0 ppm nitrite concentration with increasing age but the result was
not statistically significant. However, increasing trend of NO activity by total cells was
observed at 5 ppm nitrite concentration with increasing age and this relationship was
statistically significant (F=6.92, p=0.0144). Therefore, the result indicated that the NO
activity increased by 6.92 times at 5 ppm nitrite concentration among the participant
with increasing age (Table 3 and Appendix I1).
Similarly, for DNA stress, a strong decreasing trend of pH2A.X (histone protein
damage) activated cells was observed at 5ppm nitrite exposure with increasing age. The
result was statistically significant (F=5.01, p=0.034) which indicated that pH2A.X
activated cells declined at 5 ppm nitrite concentration among the participants with
increasing age (Table 3 and Appendix I1).
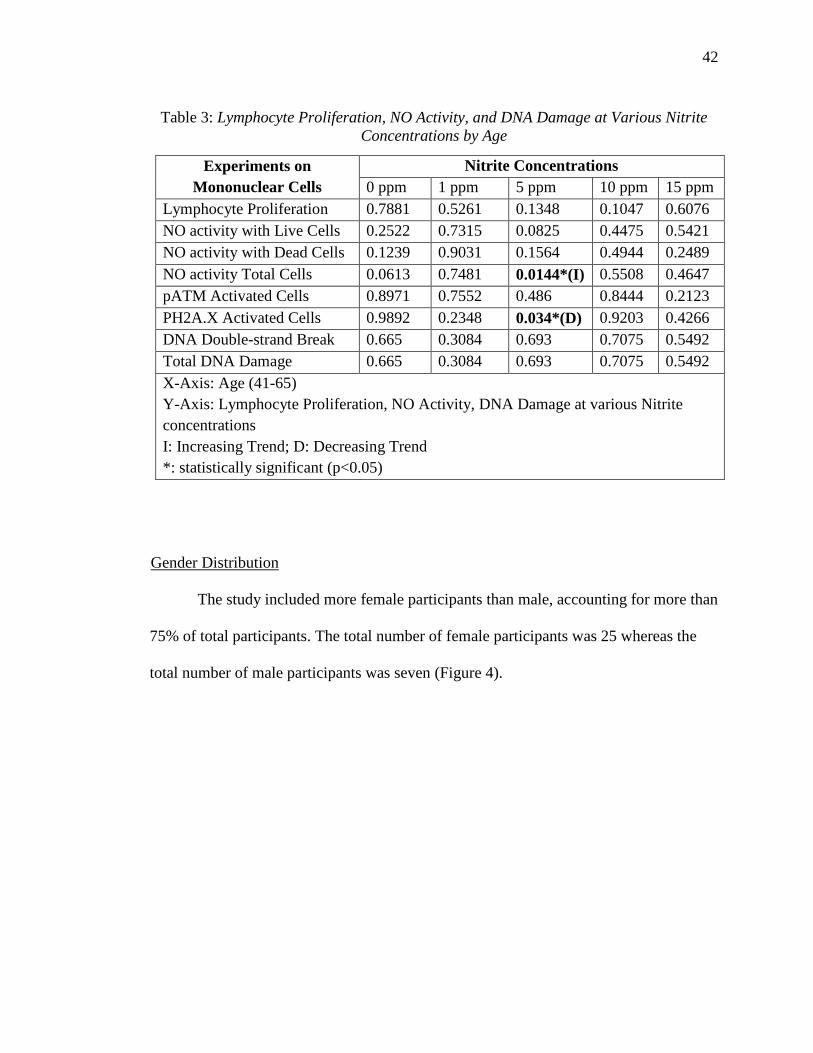
42
Table 3: Lymphocyte Proliferation, NO Activity, and DNA Damage at Various Nitrite Concentrations by Age
Experiments on Mononuclear Cells
Nitrite Concentrations 0 ppm 1 ppm 5 ppm 10 ppm 15 ppm
Lymphocyte Proliferation 0.7881 0.5261 0.1348 0.1047 0.6076 NO activity with Live Cells 0.2522 0.7315 0.0825 0.4475 0.5421 NO activity with Dead Cells 0.1239 0.9031 0.1564 0.4944 0.2489 NO activity Total Cells 0.0613 0.7481 0.0144*(I) 0.5508 0.4647 pATM Activated Cells 0.8971 0.7552 0.486 0.8444 0.2123 PH2A.X Activated Cells 0.9892 0.2348 0.034*(D) 0.9203 0.4266 DNA Double-strand Break 0.665 0.3084 0.693 0.7075 0.5492 Total DNA Damage 0.665 0.3084 0.693 0.7075 0.5492 X-Axis: Age (41-65) Y-Axis: Lymphocyte Proliferation, NO Activity, DNA Damage at various Nitrite concentrations I: Increasing Trend; D: Decreasing Trend *: statistically significant (p<0.05)
UGender Distribution
The study included more female participants than male, accounting for more than
75% of total participants. The total number of female participants was 25 whereas the
total number of male participants was seven (Figure 4).

43
Figure 4: Gender Distribution of Study Participants
The t-Test was conducted between the three laboratory experiments on
mononuclear cells (lymphocyte proliferation, NO activity, and DNA damage) with
various nitrite exposures and gender. The result did not show any significant difference
between lymphocyte proliferation at various nitrite exposure and gender. In the case of
the NO activity and DNA stress test, male participants showed a high response to 5 ppm
nitrite concentration. Results indicated that the mononuclear cells of male participants
produced high NO activity at 5 ppm nitrite concentration. Similarly, in regard to the
DNA stress test, the total DNA damage was high among male participants at 5 ppm
nitrite concentration. Both of the results were statistically significant, F= 6.10 and
p=0.025, NO activity among dead cells and, F= 5.47 and p=0.26, in Total DNA damage
(Table 4 and Appendix I2).
7
25
Gender Distribution
Male Female
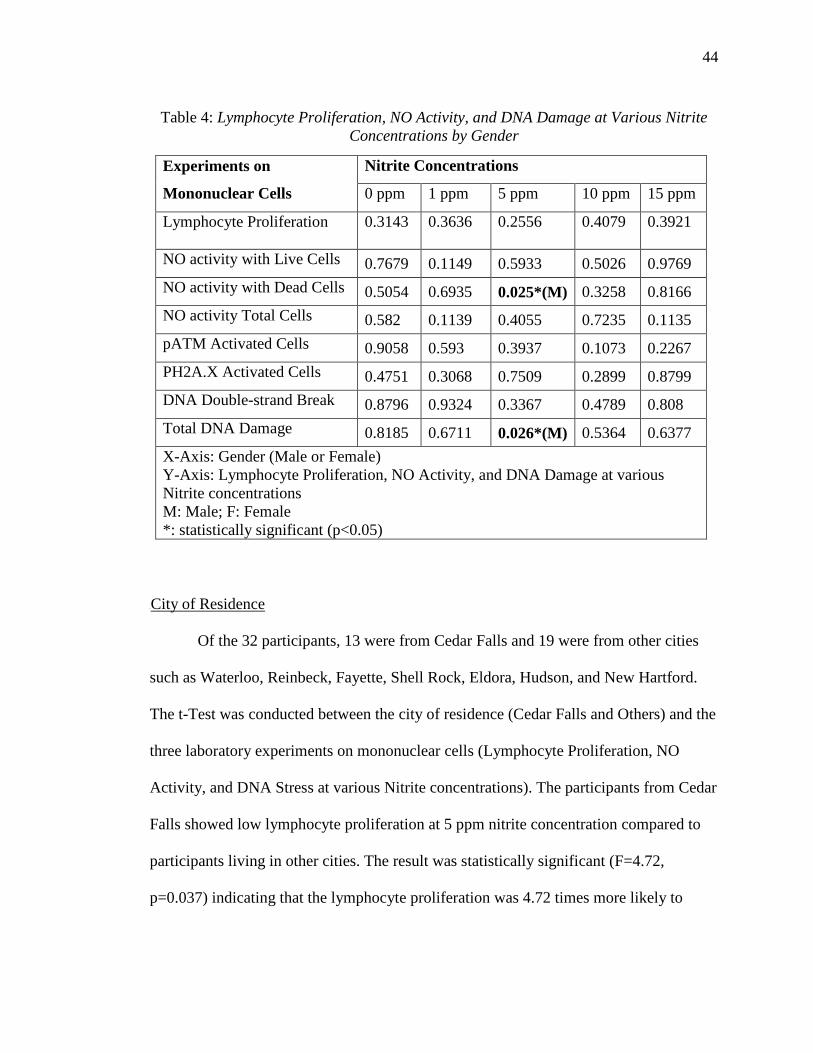
44
Table 4: Lymphocyte Proliferation, NO Activity, and DNA Damage at Various Nitrite Concentrations by Gender
Experiments on
Mononuclear Cells
Nitrite Concentrations
0 ppm 1 ppm 5 ppm 10 ppm 15 ppm
Lymphocyte Proliferation 0.3143 0.3636 0.2556 0.4079 0.3921
NO activity with Live Cells 0.7679 0.1149 0.5933 0.5026 0.9769 NO activity with Dead Cells 0.5054 0.6935 0.025*(M) 0.3258 0.8166 NO activity Total Cells 0.582 0.1139 0.4055 0.7235 0.1135 pATM Activated Cells 0.9058 0.593 0.3937 0.1073 0.2267 PH2A.X Activated Cells 0.4751 0.3068 0.7509 0.2899 0.8799 DNA Double-strand Break 0.8796 0.9324 0.3367 0.4789 0.808 Total DNA Damage 0.8185 0.6711 0.026*(M) 0.5364 0.6377 X-Axis: Gender (Male or Female) Y-Axis: Lymphocyte Proliferation, NO Activity, and DNA Damage at various Nitrite concentrations M: Male; F: Female *: statistically significant (p<0.05)
UCity of Residence Of the 32 participants, 13 were from Cedar Falls and 19 were from other cities
such as Waterloo, Reinbeck, Fayette, Shell Rock, Eldora, Hudson, and New Hartford.
The t-Test was conducted between the city of residence (Cedar Falls and Others) and the
three laboratory experiments on mononuclear cells (Lymphocyte Proliferation, NO
Activity, and DNA Stress at various Nitrite concentrations). The participants from Cedar
Falls showed low lymphocyte proliferation at 5 ppm nitrite concentration compared to
participants living in other cities. The result was statistically significant (F=4.72,
p=0.037) indicating that the lymphocyte proliferation was 4.72 times more likely to
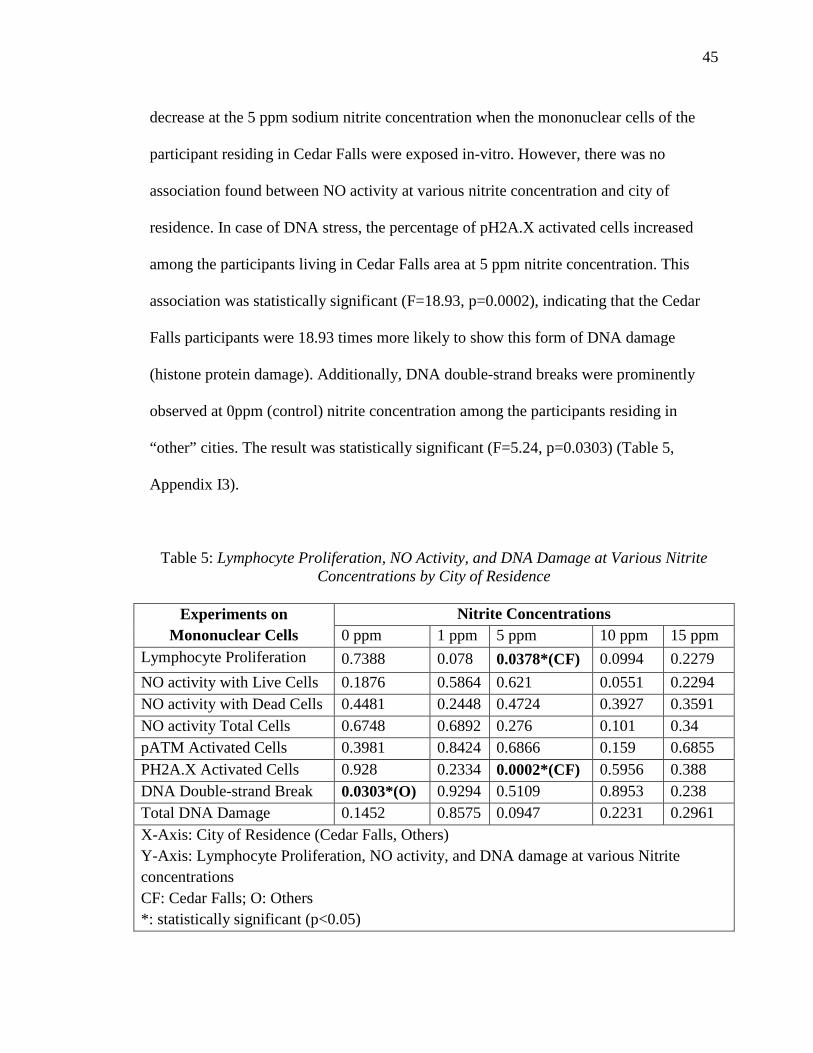
45
decrease at the 5 ppm sodium nitrite concentration when the mononuclear cells of the
participant residing in Cedar Falls were exposed in-vitro. However, there was no
association found between NO activity at various nitrite concentration and city of
residence. In case of DNA stress, the percentage of pH2A.X activated cells increased
among the participants living in Cedar Falls area at 5 ppm nitrite concentration. This
association was statistically significant (F=18.93, p=0.0002), indicating that the Cedar
Falls participants were 18.93 times more likely to show this form of DNA damage
(histone protein damage). Additionally, DNA double-strand breaks were prominently
observed at 0ppm (control) nitrite concentration among the participants residing in
“other” cities. The result was statistically significant (F=5.24, p=0.0303) (Table 5,
Appendix I3).
Table 5: Lymphocyte Proliferation, NO Activity, and DNA Damage at Various Nitrite Concentrations by City of Residence
Experiments on
Mononuclear Cells Nitrite Concentrations
0 ppm 1 ppm 5 ppm 10 ppm 15 ppm Lymphocyte Proliferation 0.7388 0.078 0.0378*(CF) 0.0994 0.2279 NO activity with Live Cells 0.1876 0.5864 0.621 0.0551 0.2294 NO activity with Dead Cells 0.4481 0.2448 0.4724 0.3927 0.3591 NO activity Total Cells 0.6748 0.6892 0.276 0.101 0.34 pATM Activated Cells 0.3981 0.8424 0.6866 0.159 0.6855 PH2A.X Activated Cells 0.928 0.2334 0.0002*(CF) 0.5956 0.388 DNA Double-strand Break 0.0303*(O) 0.9294 0.5109 0.8953 0.238 Total DNA Damage 0.1452 0.8575 0.0947 0.2231 0.2961 X-Axis: City of Residence (Cedar Falls, Others) Y-Axis: Lymphocyte Proliferation, NO activity, and DNA damage at various Nitrite concentrations CF: Cedar Falls; O: Others *: statistically significant (p<0.05)

46
UDrinking Water Sources
Most of the participants in this study used city water as their major drinking
water source. Of the 32 participants, 19 participants used water from a public/city
supply, 10 participants used water from a private water source, 1 used bottled water, and
2 used city water with reverse osmosis filtration for drinking purpose (Figure 5). A one-
way ANOVA analysis was conducted between lymphocyte proliferation, NO activity,
DNA stress at various nitrite concentrations and drinking water source. The analysis did
not yield any significant association between these variables indicating that drinking
water source did not affect lymphocyte proliferation, NO activity, and DNA stress at
various nitrite concentrations.
Figure 5: Drinking Water Source of the Participants
19
2
10
1
City WaterCity Water, ROPrivate WaterBottled Water
Drinking Water Sources

47
Medications, Herbs, and Supplement Information Participants were asked about their prescribed medication, herb, and supplement
intake information. Of the 32 participants in this study, 17 took some form of herb or
supplement, 7 did not answer the question, and 8 did not take any herb or supplement. In
total, the participants used 28 different types of herbs and supplements. Most of the
participants used various forms of vitamins such as Vitamin D (7 participants),
Multivitamin (5 participants), Vitamin B12 (2 participants), and Vitamin C (1
participant). Apart from vitamins, the participants used other supplements such as
Melatonin (2 participants), Fish Oil (2 participants), Lysine (2 participants), Biotin (2
participants), Magnesium (2 participants), and Calcium (2 participants) (Figure 6).
Figure 6: Herbs and Supplement Intake by the Participants
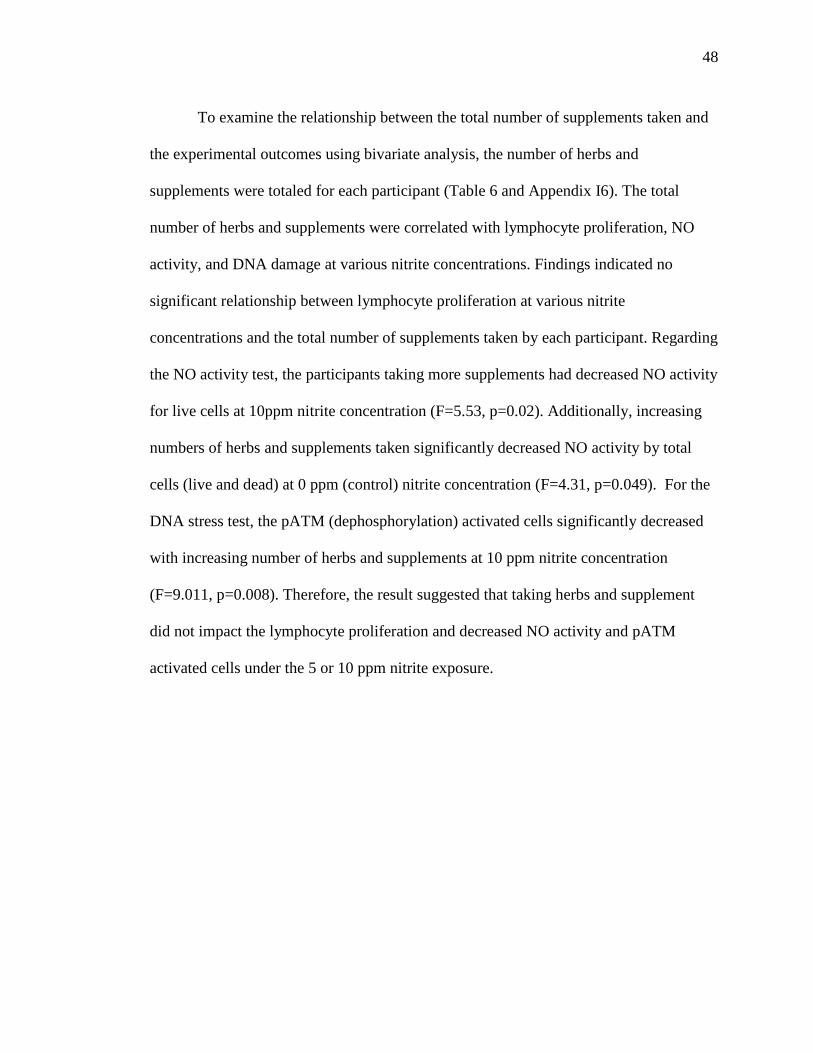
48
To examine the relationship between the total number of supplements taken and
the experimental outcomes using bivariate analysis, the number of herbs and
supplements were totaled for each participant (Table 6 and Appendix I6). The total
number of herbs and supplements were correlated with lymphocyte proliferation, NO
activity, and DNA damage at various nitrite concentrations. Findings indicated no
significant relationship between lymphocyte proliferation at various nitrite
concentrations and the total number of supplements taken by each participant. Regarding
the NO activity test, the participants taking more supplements had decreased NO activity
for live cells at 10ppm nitrite concentration (F=5.53, p=0.02). Additionally, increasing
numbers of herbs and supplements taken significantly decreased NO activity by total
cells (live and dead) at 0 ppm (control) nitrite concentration (F=4.31, p=0.049). For the
DNA stress test, the pATM (dephosphorylation) activated cells significantly decreased
with increasing number of herbs and supplements at 10 ppm nitrite concentration
(F=9.011, p=0.008). Therefore, the result suggested that taking herbs and supplement
did not impact the lymphocyte proliferation and decreased NO activity and pATM
activated cells under the 5 or 10 ppm nitrite exposure.
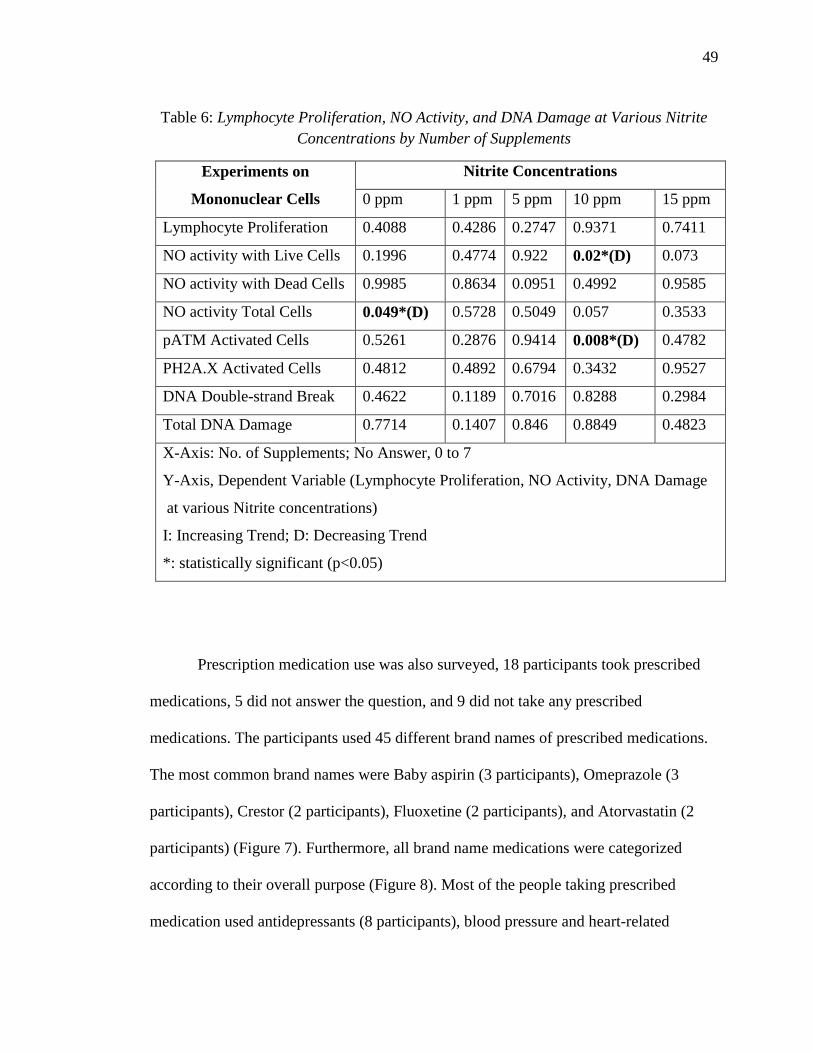
49
Table 6: Lymphocyte Proliferation, NO Activity, and DNA Damage at Various Nitrite Concentrations by Number of Supplements
Experiments on
Mononuclear Cells
Nitrite Concentrations
0 ppm 1 ppm 5 ppm 10 ppm 15 ppm
Lymphocyte Proliferation 0.4088 0.4286 0.2747 0.9371 0.7411
NO activity with Live Cells 0.1996 0.4774 0.922 0.02*(D) 0.073
NO activity with Dead Cells 0.9985 0.8634 0.0951 0.4992 0.9585
NO activity Total Cells 0.049*(D) 0.5728 0.5049 0.057 0.3533
pATM Activated Cells 0.5261 0.2876 0.9414 0.008*(D) 0.4782
PH2A.X Activated Cells 0.4812 0.4892 0.6794 0.3432 0.9527
DNA Double-strand Break 0.4622 0.1189 0.7016 0.8288 0.2984
Total DNA Damage 0.7714 0.1407 0.846 0.8849 0.4823
X-Axis: No. of Supplements; No Answer, 0 to 7
Y-Axis, Dependent Variable (Lymphocyte Proliferation, NO Activity, DNA Damage
at various Nitrite concentrations)
I: Increasing Trend; D: Decreasing Trend
*: statistically significant (p<0.05)
Prescription medication use was also surveyed, 18 participants took prescribed
medications, 5 did not answer the question, and 9 did not take any prescribed
medications. The participants used 45 different brand names of prescribed medications.
The most common brand names were Baby aspirin (3 participants), Omeprazole (3
participants), Crestor (2 participants), Fluoxetine (2 participants), and Atorvastatin (2
participants) (Figure 7). Furthermore, all brand name medications were categorized
according to their overall purpose (Figure 8). Most of the people taking prescribed
medication used antidepressants (8 participants), blood pressure and heart-related
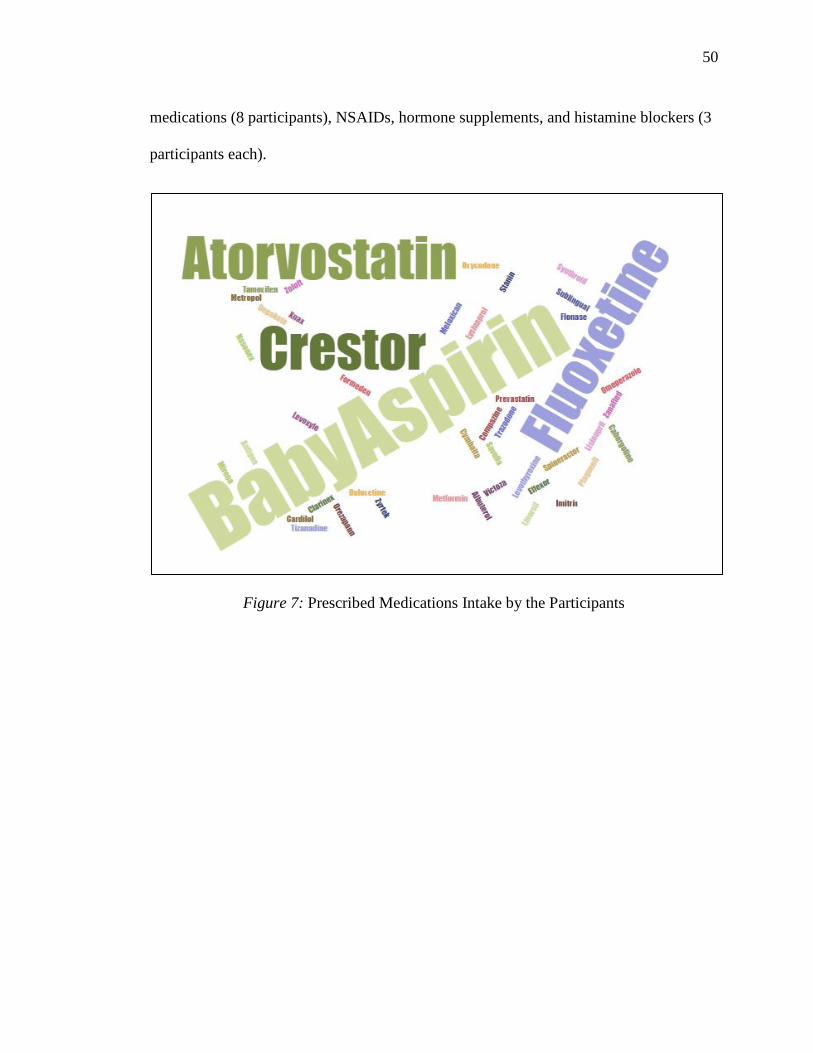
50
medications (8 participants), NSAIDs, hormone supplements, and histamine blockers (3
participants each).
Figure 7: Prescribed Medications Intake by the Participants
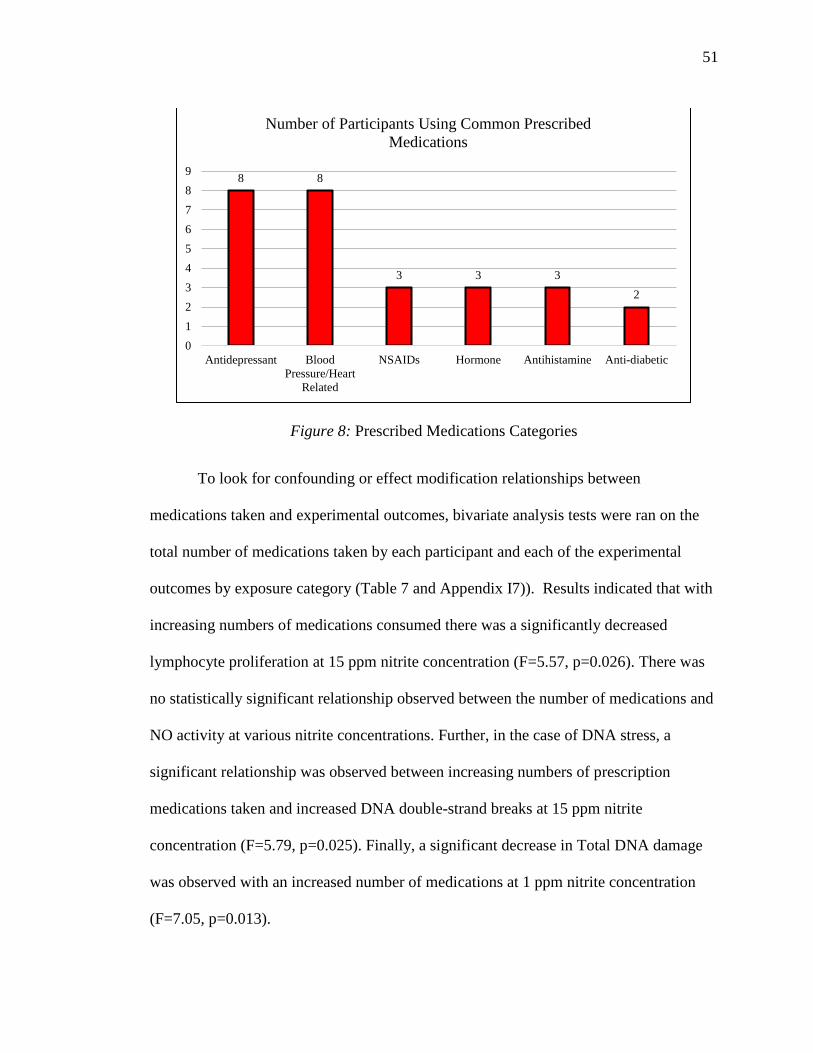
51
Figure 8: Prescribed Medications Categories
To look for confounding or effect modification relationships between
medications taken and experimental outcomes, bivariate analysis tests were ran on the
total number of medications taken by each participant and each of the experimental
outcomes by exposure category (Table 7 and Appendix I7)). Results indicated that with
increasing numbers of medications consumed there was a significantly decreased
lymphocyte proliferation at 15 ppm nitrite concentration (F=5.57, p=0.026). There was
no statistically significant relationship observed between the number of medications and
NO activity at various nitrite concentrations. Further, in the case of DNA stress, a
significant relationship was observed between increasing numbers of prescription
medications taken and increased DNA double-strand breaks at 15 ppm nitrite
concentration (F=5.79, p=0.025). Finally, a significant decrease in Total DNA damage
was observed with an increased number of medications at 1 ppm nitrite concentration
(F=7.05, p=0.013).
8 8
3 3 32
0123456789
Antidepressant BloodPressure/Heart
Related
NSAIDs Hormone Antihistamine Anti-diabetic
Number of Participants Using Common Prescribed Medications

52
Table 7: Lymphocyte Proliferation, NO Activity, and DNA Damage at Various Nitrite Concentrations by Number of Medications
Experiments on Mononuclear Cells
Nitrite Concentrations 0 ppm 1 ppm 5 ppm 10 ppm 15 ppm
Lymphocyte Proliferation 0.5294 0.3636 0.0804 0.5371 0.026*(D) NO activity with Live Cells 0.6089 0.3738 0.592 0.5658 0.7308 NO activity with Dead Cells 0.7172 0.3676 0.6053 0.337 0.2716 NO activity Total Cells 0.9537 0.394 0.475 0.5447 0.2671 pATM Activated Cells 0.2168 0.5812 0.8731 0.212 0.8334 PH2A.X Activated Cells 0.898 0.2675 0.2173 0.3494 0.7733 DNA Double-strand Break 0.0991 0.2456 0.0812 0.4567 0.025*(I) Total DNA Damage 0.3348 0.013*(D) 0.9008 0.5779 0.4146 X-Axis: No. of Medications; No Answer, 0 to 6 Y-Axis: Lymphocyte Proliferation, NO Activity, and DNA Damage at various Nitrite concentrations I: Increasing Trend; D: Decreasing Trend *: statistically significant (p<0.05)
Health Information
The participants were asked about their pain related to osteoarthritis. Of the 16
participants having osteoarthritis, 11 reported pain in their body. Among the 11
participants who reported pain their body, five had pain in their hip, three had pain in
their knee. Additionally, pain in the back, neck, ankles, joints, and hands was reported
by two participants each (Figure 9).
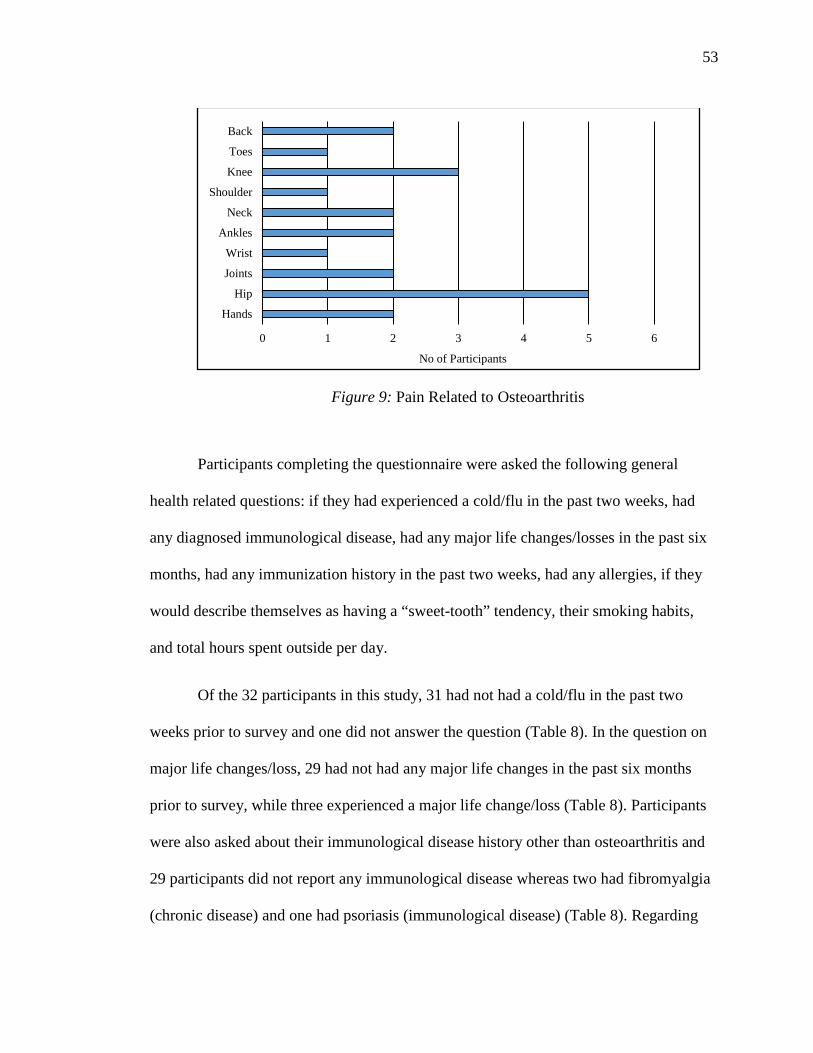
53
Figure 9: Pain Related to Osteoarthritis
Participants completing the questionnaire were asked the following general
health related questions: if they had experienced a cold/flu in the past two weeks, had
any diagnosed immunological disease, had any major life changes/losses in the past six
months, had any immunization history in the past two weeks, had any allergies, if they
would describe themselves as having a “sweet-tooth” tendency, their smoking habits,
and total hours spent outside per day.
Of the 32 participants in this study, 31 had not had a cold/flu in the past two
weeks prior to survey and one did not answer the question (Table 8). In the question on
major life changes/loss, 29 had not had any major life changes in the past six months
prior to survey, while three experienced a major life change/loss (Table 8). Participants
were also asked about their immunological disease history other than osteoarthritis and
29 participants did not report any immunological disease whereas two had fibromyalgia
(chronic disease) and one had psoriasis (immunological disease) (Table 8). Regarding
0 1 2 3 4 5 6
Hands
Hip
Joints
Wrist
Ankles
Neck
Shoulder
Knee
Toes
Back
No of Participants
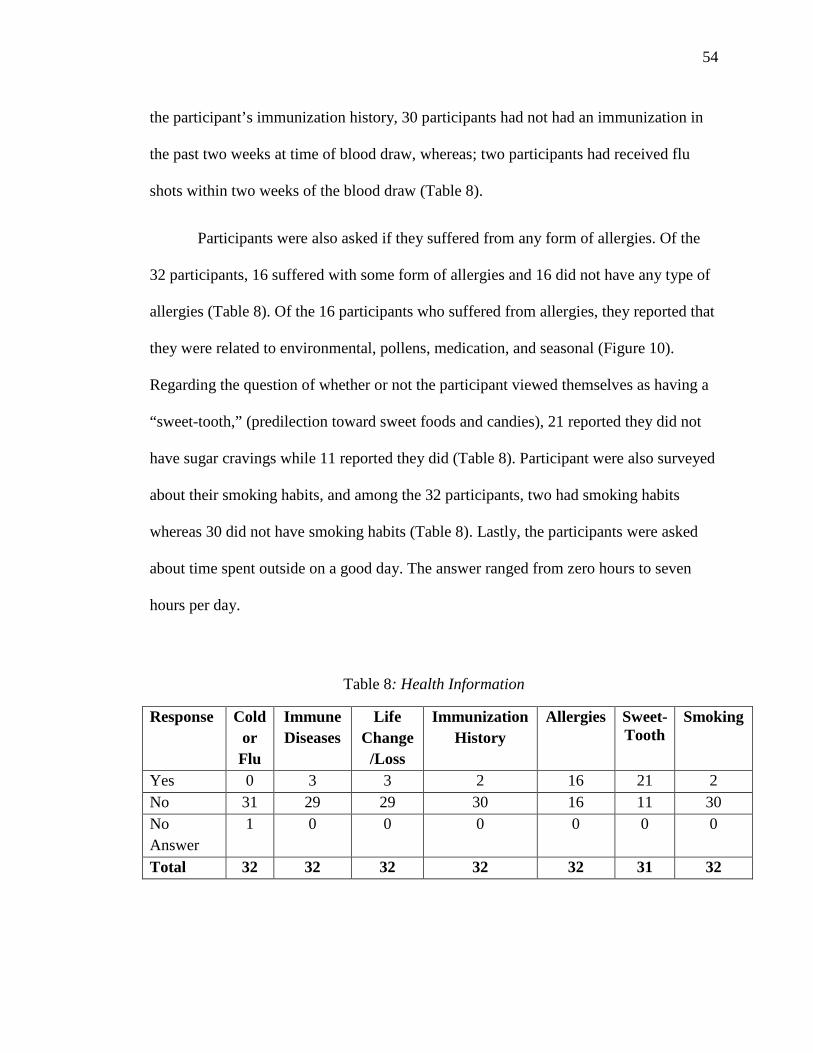
54
the participant’s immunization history, 30 participants had not had an immunization in
the past two weeks at time of blood draw, whereas; two participants had received flu
shots within two weeks of the blood draw (Table 8).
Participants were also asked if they suffered from any form of allergies. Of the
32 participants, 16 suffered with some form of allergies and 16 did not have any type of
allergies (Table 8). Of the 16 participants who suffered from allergies, they reported that
they were related to environmental, pollens, medication, and seasonal (Figure 10).
Regarding the question of whether or not the participant viewed themselves as having a
“sweet-tooth,” (predilection toward sweet foods and candies), 21 reported they did not
have sugar cravings while 11 reported they did (Table 8). Participant were also surveyed
about their smoking habits, and among the 32 participants, two had smoking habits
whereas 30 did not have smoking habits (Table 8). Lastly, the participants were asked
about time spent outside on a good day. The answer ranged from zero hours to seven
hours per day.
Table 8: Health Information
Response Cold or Flu
Immune Diseases
Life Change
/Loss
Immunization History
Allergies Sweet- Tooth
Smoking
Yes 0 3 3 2 16 21 2 No 31 29 29 30 16 11 30 No Answer
1 0 0 0 0 0 0
Total 32 32 32 32 32 31 32

55
Figure 10: Type of Allergies Reported by the Participants
Bivariate statistical analysis was conducted on each health-related questionnaire
item previously described with the three laboratory experiments (lymphocyte
proliferation, NO activity, and DNA Stress) test at various nitrite exposure
concentrations.
Major Life Changing Events
The t-Test was used to examine the difference between major life-changing
events with lymphocyte proliferation, NO activity, and DNA Stress at various nitrite
concentrations. In the case of lymphocyte proliferation, there was no indication of
increase or decrease of lymphocytes with any major life-changing events. However, a
significant difference was observed among the participants responding yes to having
0 1 2 3 4 5 6
Pollens
Environmental
Molds
Plants
Asthma
Medication
No. of Participants

56
experienced major life changing events and NO activity by live cells at 0 ppm (F=11.08,
p=0.0029) and 15 ppm (F=4.60, p=0.041) nitrite concentration. Similarly, a significant
difference was observed on NO activity by dead cells at 0 ppm (F=4.84, p=0.0449) and
10 ppm (F=16.32, p=0.0009) nitrite concentration among the participants responding yes
to having experienced life-changing events. The NO activity by total cells also showed a
significant difference at 0 ppm (F=25.06, p<.0001), and 10 ppm (F=1.86, p=0.035)
nitrite concentration among participants indicating yes to the question. The DNA stress
test also showed some significant difference. The pATM activated cells were higher at 0
ppm (F=4.36, p=0.0498) nitrite concentration and DNA double-strand break was
prominent at 1 ppm (F=6.42, p=0.018) nitrite concentration among the participants who
responded yes to having experienced life-changing events (Table 9).
Table 9: Lymphocyte Proliferation, NO Activity, and DNA Damage at Various Nitrite Concentrations by Major Life Changing Events
Experiment on
Mononuclear Cells Nitrite Concentrations
0 ppm 1 ppm 5 ppm 10 ppm 15 ppm Lymphocyte Proliferation 0.7188 0.6031 0.8043 0.067 0.9896 NO activity with Live Cells 0.0029*(Y) 0.586 0.424 0.129 0.041*(Y) NO activity with Dead Cells 0.0449*(Y) 0.9792 0.1602 0.0009*(Y) 0.8381 NO activity Total Cells <.0001*(Y) 0.4969 0.2731 0.035*(Y) 0.8442 pATM Activated Cells 0.0498*(Y) 0.9225 0.4442 0.9977 0.3024 PH2A.X Activated Cells 0.825 0.0796 0.3593 0.3887 0.424 DNA Double-strand Break 0.825 0.018*(Y) 0.533 0.4528 0.9392 Total DNA Damage 0.9771 0.2083 0.8223 0.0574 0.6716 X-Axis: Major Life Changing Events; Yes or No Y-Axis: Lymphocyte Proliferation, NO Activity, DNA Damage at various Nitrite concentrations Y: Yes; N: No *: statistically significant (p<0.05)
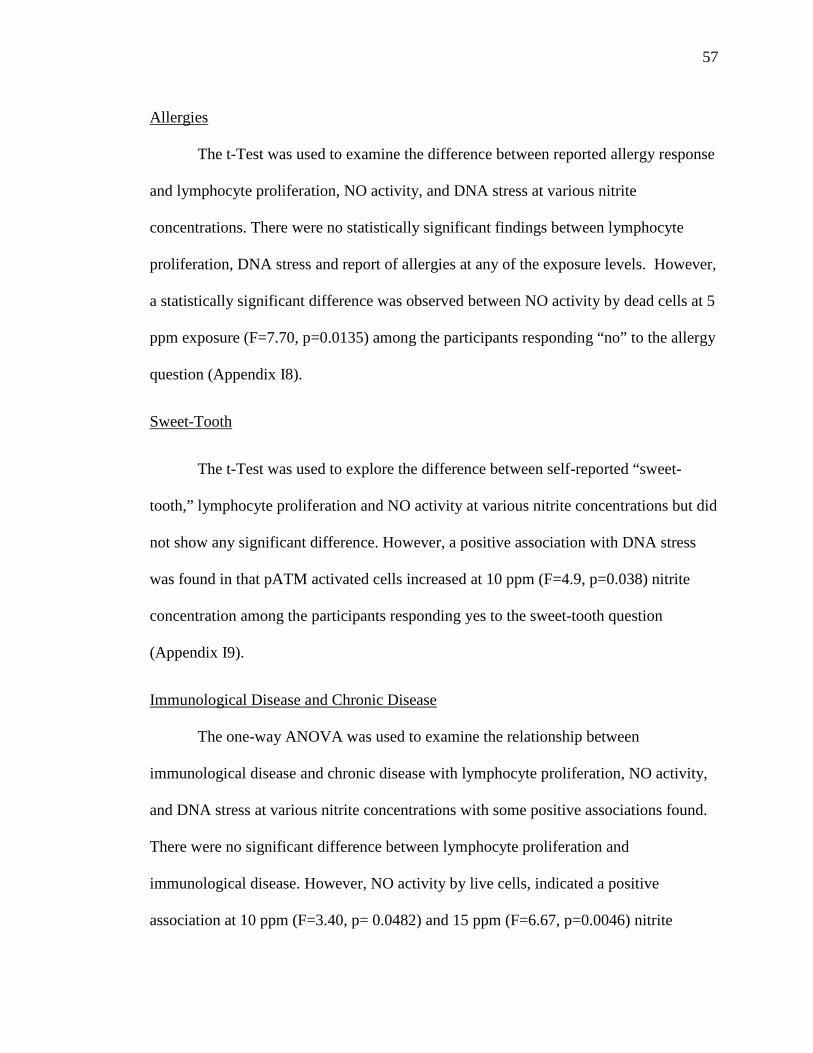
57
Allergies
The t-Test was used to examine the difference between reported allergy response
and lymphocyte proliferation, NO activity, and DNA stress at various nitrite
concentrations. There were no statistically significant findings between lymphocyte
proliferation, DNA stress and report of allergies at any of the exposure levels. However,
a statistically significant difference was observed between NO activity by dead cells at 5
ppm exposure (F=7.70, p=0.0135) among the participants responding “no” to the allergy
question (Appendix I8).
Sweet-Tooth
The t-Test was used to explore the difference between self-reported “sweet-
tooth,” lymphocyte proliferation and NO activity at various nitrite concentrations but did
not show any significant difference. However, a positive association with DNA stress
was found in that pATM activated cells increased at 10 ppm (F=4.9, p=0.038) nitrite
concentration among the participants responding yes to the sweet-tooth question
(Appendix I9).
Immunological Disease and Chronic Disease
The one-way ANOVA was used to examine the relationship between
immunological disease and chronic disease with lymphocyte proliferation, NO activity,
and DNA stress at various nitrite concentrations with some positive associations found.
There were no significant difference between lymphocyte proliferation and
immunological disease. However, NO activity by live cells, indicated a positive
association at 10 ppm (F=3.40, p= 0.0482) and 15 ppm (F=6.67, p=0.0046) nitrite
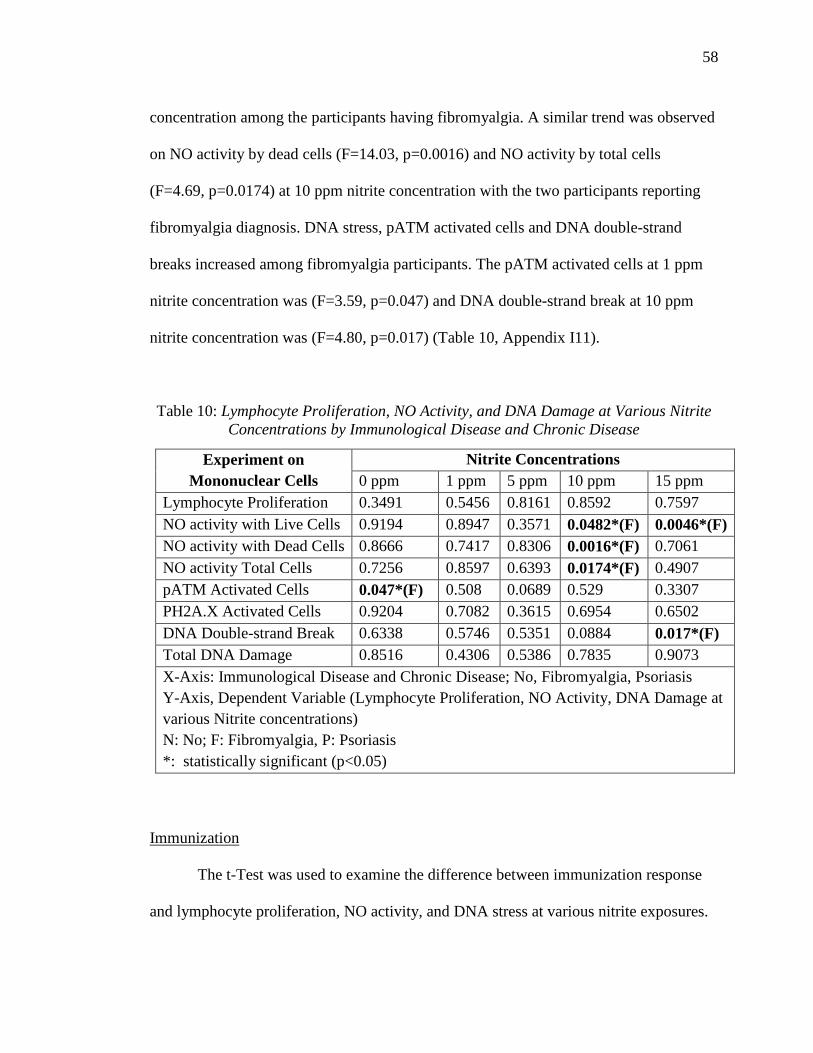
58
concentration among the participants having fibromyalgia. A similar trend was observed
on NO activity by dead cells (F=14.03, p=0.0016) and NO activity by total cells
(F=4.69, p=0.0174) at 10 ppm nitrite concentration with the two participants reporting
fibromyalgia diagnosis. DNA stress, pATM activated cells and DNA double-strand
breaks increased among fibromyalgia participants. The pATM activated cells at 1 ppm
nitrite concentration was (F=3.59, p=0.047) and DNA double-strand break at 10 ppm
nitrite concentration was (F=4.80, p=0.017) (Table 10, Appendix I11).
Table 10: Lymphocyte Proliferation, NO Activity, and DNA Damage at Various Nitrite Concentrations by Immunological Disease and Chronic Disease
Experiment on Mononuclear Cells
Nitrite Concentrations 0 ppm 1 ppm 5 ppm 10 ppm 15 ppm
Lymphocyte Proliferation 0.3491 0.5456 0.8161 0.8592 0.7597 NO activity with Live Cells 0.9194 0.8947 0.3571 0.0482*(F) 0.0046*(F) NO activity with Dead Cells 0.8666 0.7417 0.8306 0.0016*(F) 0.7061 NO activity Total Cells 0.7256 0.8597 0.6393 0.0174*(F) 0.4907 pATM Activated Cells 0.047*(F) 0.508 0.0689 0.529 0.3307 PH2A.X Activated Cells 0.9204 0.7082 0.3615 0.6954 0.6502 DNA Double-strand Break 0.6338 0.5746 0.5351 0.0884 0.017*(F) Total DNA Damage 0.8516 0.4306 0.5386 0.7835 0.9073 X-Axis: Immunological Disease and Chronic Disease; No, Fibromyalgia, Psoriasis Y-Axis, Dependent Variable (Lymphocyte Proliferation, NO Activity, DNA Damage at various Nitrite concentrations) N: No; F: Fibromyalgia, P: Psoriasis *: statistically significant (p<0.05)
Immunization
The t-Test was used to examine the difference between immunization response
and lymphocyte proliferation, NO activity, and DNA stress at various nitrite exposures.

59
The analysis did not yield any significant difference between immunization and
lymphocyte proliferation and NO activity. In the case of DNA stress, the pH2A.X
activated cells were significantly higher among the participants having been recently
immunized at the experimental levels of 1 ppm (F=19.58, p=0.0002) and 10ppm
(F=5.83, p=0.0245) nitrite concentration (Appendix I12).
Smoking Habit
The t-Test was used to examine the difference between smoking habits and
lymphocyte proliferation, NO activity, and DNA stress at various nitrite exposures but
did not yield any significant difference, indicating that smoking habits did not contribute
to any mononuclear damage at various nitrite concentrations (Appendix I13).
Hours Spent Outside in a Good Day
The bivariate fit test was used to examine the relationship between hours spent
outside and lymphocyte proliferation, NO activity, and DNA stress at various nitrite
exposures. There was no significant relationship between hours spent outside and
lymphocyte proliferation or NO activity at various nitrite concentrations. However, in
the case of DNA stress, an increasing trend as observed between greater time spent
outside and Total DNA damage at 15 ppm (F=6.95, p=0.0139) nitrite exposure
(Appendix I10).

60
Lymphocyte Proliferation of all Participants
Lymphocyte Proliferation in Non-Stimulated and Stimulated Condition
The Millipore MUSE flow cytometry unit was used to examine several
parameters of lymphocyte proliferation and vigor. Analyses included: viable cell
concentration, viability percentage, total cells, and events acquired. Among these results,
viable cell concentration data indicative of lymphocyte proliferation response was used
for further analysis. In the non-stimulated (not mitogen treated) condition, the mean
viable cell concentration at 0 ppm nitrite exposure was 3.96E+05 cells/mL whereas, at
15 ppm nitrite exposure, the mean viable cells decreased to 1.95E+05 cells/mL. In the
stimulated condition, the mean viable cell concentration at 0 ppm nitrite exposure was
4.17E+05 cells/mL whereas, at 15 ppm nitrite exposure, the mean viable cells decreased
to 2.78E+05 cells/mL. Therefore, lymphocyte proliferation decreased with increasing
dose of nitrite concentration under both non-stimulated and stimulated conditions (Table
11) showing a dose-response relationship.
Table 11: Lymphocyte Proliferation in both Non-Stimulated and Stimulated Conditions at Various Nitrite Concentrations
Nitrite Concentrations Non-Stimulated Stimulated
0 ppm 3.96E+05 4.17E+05
1 ppm 3.41E+05 3.79E+05 5 ppm 3.09E+05 3.34E+05 10 ppm 2.47E+05 2.82E+05 15 ppm 1.95E+05 2.78E+05

61
Figure 11: Comparing Lymphocyte Proliferation between Non-stimulated and
Stimulated Conditions
One-way ANOVA analysis indicated that there was a statistically significant
(F=7.28, p<.0001*) difference between mean lymphocyte proliferation among various
nitrite concentrations (0, 1, 5, 10, and 15 ppm) in non-stimulated conditions (Table 12
and Figure 12). The F-ratio indicated that the proliferation decreased 7.28 times with
increased nitrite concentration. Similarly, the one-way ANOVA between lymphocyte
proliferation and various nitrite concentrations in stimulated conditions showed some
mean difference where increasing nitrite concentration decreased the lymphocyte
proliferation but the result was not statistically significant (F=1.32, p=0.2613) (Table 12,
Figure 13).
0.00E+00
5.00E+04
1.00E+05
1.50E+05
2.00E+05
2.50E+05
3.00E+05
3.50E+05
4.00E+05
4.50E+05
0PPM 1PPM 5PPM 10PPM 15PPM
Comparing Mean Viability Cell Concentration in Non-Stimulated and Stimuated Conditions
Non-Stimulated Stimulated
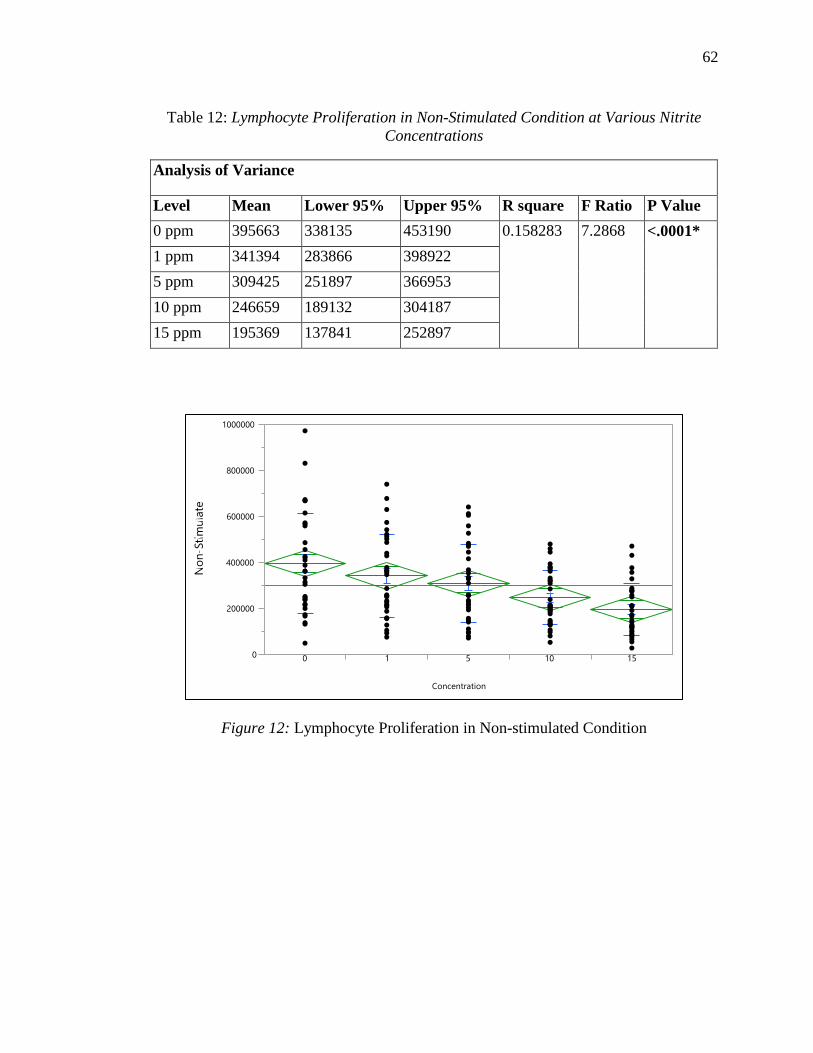
62
Table 12: Lymphocyte Proliferation in Non-Stimulated Condition at Various Nitrite Concentrations
Figure 12: Lymphocyte Proliferation in Non-stimulated Condition
0
200000
400000
600000
800000
1000000
0 1 5 10 15
Concentration
Analysis of Variance
Level Mean Lower 95% Upper 95% R square F Ratio P Value 0 ppm 395663 338135 453190 0.158283 7.2868 <.0001* 1 ppm 341394 283866 398922 5 ppm 309425 251897 366953 10 ppm 246659 189132 304187 15 ppm 195369 137841 252897

63
Table 13: Lymphocyte Proliferation in Stimulated Condition at Various Nitrite Concentrations
Figure 13: Lymphocyte Proliferation in Stimulated Condition
Degree of Change (Quotient) between Non-Stimulated and Stimulated Condition
The magnitude of response (a quotient, r= st/ns, st=stimulated; ns=non-
stimulated) was calculated for lymphocyte proliferation under each of the experimental
exposure conditions. A higher quotient value indicated a greater lymphocyte
proliferation response following mitogenic challenge. A one-way ANOVA analysis was
0
500000
1000000
1500000
2000000
0 1 5 10 15
Concentration
Analysis of Variance
Level Mean Lower 95% Upper 95% R square F Ratio P Value
0 ppm 417069 313358 520779 0.033182 1.3299 0.2613
1 ppm 378516 274805 482226
5 ppm 334153 230443 437863
10 ppm 282369 178658 386079
15 ppm 277500 173790 381210
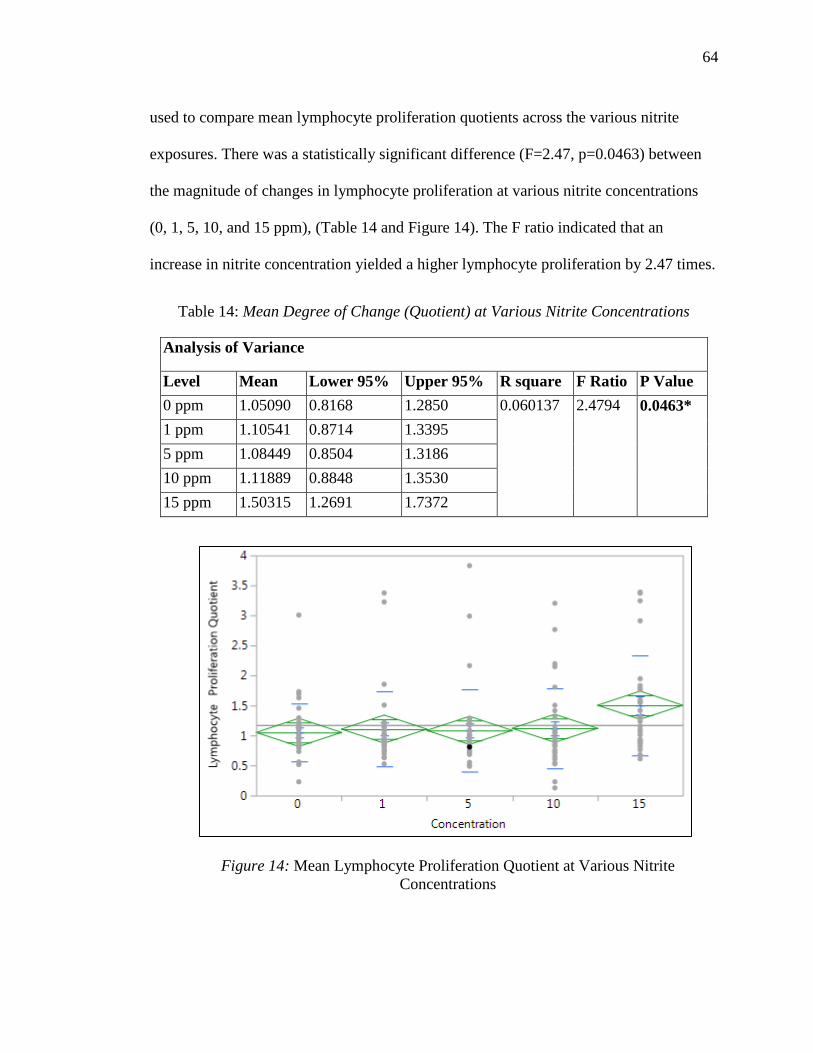
64
used to compare mean lymphocyte proliferation quotients across the various nitrite
exposures. There was a statistically significant difference (F=2.47, p=0.0463) between
the magnitude of changes in lymphocyte proliferation at various nitrite concentrations
(0, 1, 5, 10, and 15 ppm), (Table 14 and Figure 14). The F ratio indicated that an
increase in nitrite concentration yielded a higher lymphocyte proliferation by 2.47 times.
Table 14: Mean Degree of Change (Quotient) at Various Nitrite Concentrations
Figure 14: Mean Lymphocyte Proliferation Quotient at Various Nitrite Concentrations
Analysis of Variance
Level Mean Lower 95% Upper 95% R square F Ratio P Value 0 ppm 1.05090 0.8168 1.2850 0.060137 2.4794 0.0463* 1 ppm 1.10541 0.8714 1.3395 5 ppm 1.08449 0.8504 1.3186 10 ppm 1.11889 0.8848 1.3530 15 ppm 1.50315 1.2691 1.7372

65
Lymphocyte Proliferation Quotient in Pooled Nitrite Concentration
To explore breakpoints in the dose response relationships the nitrite
concentrations were pooled into three different categories:
1. Nitrite Concentration Less than 5 ppm to Equal or more than 5 ppm
2. Nitrite Concentration Less than 10 ppm to equal or more than 10 ppm
3. Nitrite Concentration Less than 15 ppm to Equal to 15 ppm
A t-Test was conducted to detect any difference between mean lymphocyte
proliferation quotients above/below pooled nitrite concentration exposures. Proliferation
was impacted when cells were exposed to equal or more than 10ppm nitrite
concentration and this was statistically significant (F= 4.4841, p=0.0358). Furthermore,
the impact increased when the cells were exposed to even higher nitrite concentrations
of 15 ppm (F= 9.9066, p=0.0020) (Table 15 and Figure 15, Table 16 and Figure 16).
Table 15: Mean Lymphocyte Proliferation Quotient in Pooled Nitrite Concentration (Less Than 10 ppm to Equal or More Than 10 ppm)
Level Mean Lower
95% Upper 95%
T Ratio Assuming equal variances
T Ratio Assuming unequal variances
R square
DF F Ratio
P Value
Less than 10 ppm
1.080 0.9441 1.2164 2.117561 2.013101 0.0275 1 4.484 0.0358*
Equal or More than 10 ppm
1.311 1.1443 1.4777

66
Figure 15: Lymphocyte Proliferation Quotient in Pooled Nitrite Concentration (Less Than 10 ppm to Equal or More Than 10 ppm)
Table 16: Mean Lymphocyte Proliferation Quotient in Pooled Nitrite Concentration
(Less Than 15 ppm to Equal to 15 ppm)
Level Mean Lower 95%
Upper 95%
T Ratio Assuming equal variances
T Ratio Assuming unequal variances
R square
DF F Ratio P Value
Less than 15 ppm
1.503 0.982 1.197 -3.14747 -2.62887 0.059 1 9.9066 0.0020*
Equal to 15 ppm
1.089 1.202 1.803

67
Figure 16: Lymphocyte Proliferation Quotient in Pooled Nitrite Concentration Less Than 15 ppm to Equal to 15 ppm)
Lymphocytes Proliferation Quotient among Case (Osteoarthritis) and Control (Non-
Osteoarthritis)
The participants were categorized into two groups; Case group (participants
having osteoarthritis) and Control group (participants without osteoarthritis). The case or
control status (independent variable) was then compared to the various lymphocyte
experimental conditions (dependent variables). The difference in mean lymphocyte
proliferation in each nitrite exposure test was calculated using the t-test. The mean
lymphocyte proliferation quotient (r=st/ns) varied between the case and the control
group at 5 ppm (F= 4.28, p=0.0388) nitrite concentration and was found to be
statistically significant.

68
Participants no having osteoarthritis had a high lymphocyte proliferation
quotient compared to the case group and the result was statistically significant (F=4.67,
p=0.0388). Therefore, the t-test indicated that the lymphocyte proliferation among
control group was 4.28 times vigorous than the case groups (Table 17, Figure 17, and
Appendix I20).
Table 17: Mean Lymphocytes Proliferation Quotient between Case and Controls at 5 ppm Nitrite Concentration
Level Mean Lower
95% Upper 95%
T Ratio Assuming equal variances
T Ratio Assuming unequal variances
R square
DF F Ratio
P Value
No 1.33 0.85 1.80 -2.16131 -2.16131 0.13473 1 4.2885 0.0388* Yes 0.83 0.71 0.96
Figure 17: Lymphocytes Proliferation Quotient between Case and Controls
0
0.5
1
1.5
2
2.5
3
3.5
4
No Yes
Osteoarthritis

69
Nitric Oxide Activity Quotient of All Participants
Using immunoassay tagging and the Millipore MUSE flow cytometer two
important cell health parameters involving NO where analyzed at each of the exposure
levels, first change in intracellular nitric oxide activity levels and second, cell death with
and without NO expression. The test resulted in five distinct measures:
1. No Nitric Oxide Activity
2. Live Cells with Nitric Oxide Activity
3. Dead Cells with Nitric Oxide Activity
4. Dead Cells with no Nitric Oxide Activity
5. Total cells with Nitric Oxide Activity
In the statistical analysis tests, Live Cells with Nitric Oxide Activity, Dead Cells with
Nitric Oxide Activity, and Total Cells (Live + Dead) were used. These measures are
thought to capture the possible range of responses the lymphocytes would express
following increasing mitotic and exposure level stresses.
Nitric Oxide Activity by Live Cells Quotient at Various Nitrite Concentrations
The one-way ANOVA analysis was conducted to find if there was any difference
between mean live cells with nitric oxide activity at various nitrite concentration (0, 1, 5,
10, and 15 ppm). There was no statistically significant association between nitric oxide
activity by live cells at various nitrite concentrations found (F=1.18, p=0.3186) (Table
18).
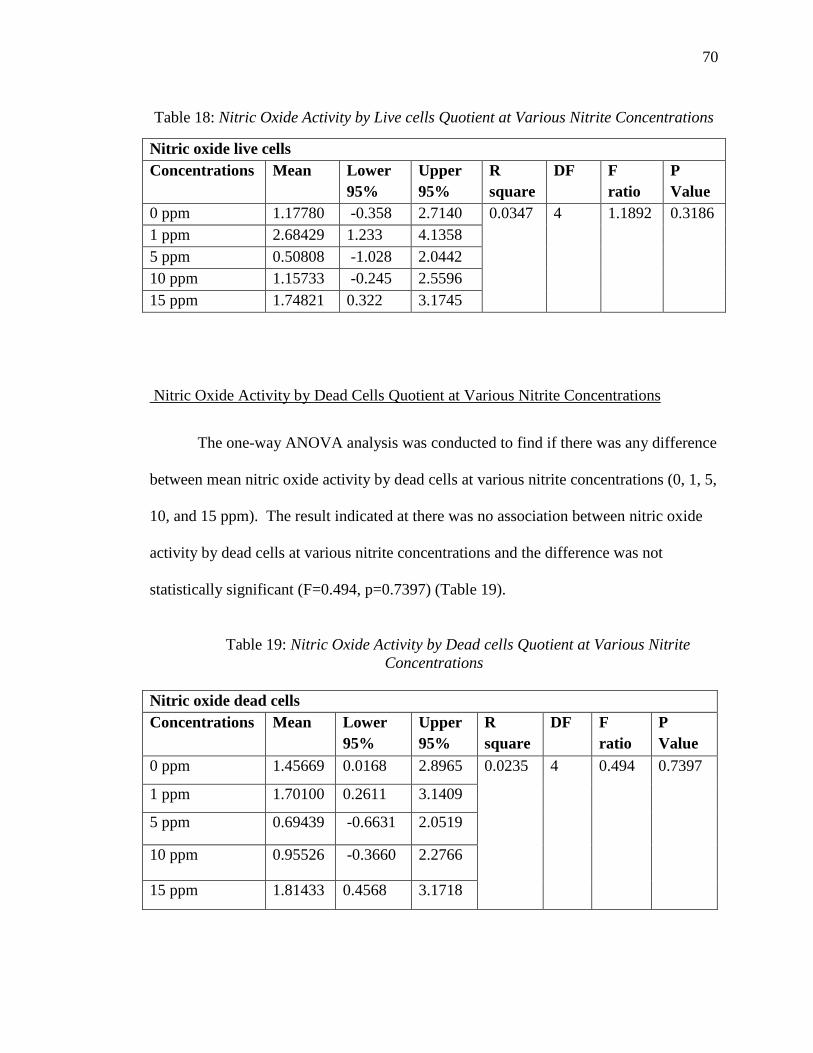
70
Table 18: Nitric Oxide Activity by Live cells Quotient at Various Nitrite Concentrations
Nitric oxide live cells Concentrations Mean Lower
95% Upper 95%
R square
DF F ratio
P Value
0 ppm 1.17780 -0.358 2.7140 0.0347 4 1.1892 0.3186 1 ppm 2.68429 1.233 4.1358 5 ppm 0.50808 -1.028 2.0442 10 ppm 1.15733 -0.245 2.5596 15 ppm 1.74821 0.322 3.1745
Nitric Oxide Activity by Dead Cells Quotient at Various Nitrite Concentrations
The one-way ANOVA analysis was conducted to find if there was any difference
between mean nitric oxide activity by dead cells at various nitrite concentrations (0, 1, 5,
10, and 15 ppm). The result indicated at there was no association between nitric oxide
activity by dead cells at various nitrite concentrations and the difference was not
statistically significant (F=0.494, p=0.7397) (Table 19).
Table 19: Nitric Oxide Activity by Dead cells Quotient at Various Nitrite
Concentrations
Nitric oxide dead cells Concentrations Mean Lower
95% Upper 95%
R square
DF F ratio
P Value
0 ppm 1.45669 0.0168 2.8965 0.0235 4 0.494 0.7397
1 ppm 1.70100 0.2611 3.1409
5 ppm 0.69439 -0.6631 2.0519
10 ppm 0.95526 -0.3660 2.2766
15 ppm 1.81433 0.4568 3.1718

71
Nitric Oxide Activity by Total Cells Quotient (Live + Dead) at Various Nitrite
Concentrations
A one-way ANOVA was used to explore the difference between mean nitric
oxide activity by total cells, both live and dead, at various nitrite concentrations (0, 1, 5,
10, and 15 ppm). There was no association between total nitric oxide activity by total
cells at various nitrite concentrations (F=1.270, p=0.285) (Table 20).
Table 20: Nitric Oxide Activity by Total Cells Quotient (Live + Dead) at Various Nitrite Concentrations
Total Nitric oxide activity Concentrations Mean Lower
95% Upper 95%
R square
DF F ratio
P Value
0 ppm 1.3189 0.5527 2.0851 0.03365 4 1.270 0.285 1 ppm 1.9932 0.2716 3.7148 5 ppm 0.5812 0.3743 0.7882 10 ppm 1.1032 0.7495 1.4568 15 ppm 1.3556 0.9360 1.7753
Nitric Oxide Activity Quotient in Pooled Nitrite Concentrations
A t-test was used to explore the difference between mean nitric oxide activity by
live, dead, and total cells at various break points for pooled nitrite concentration
categories (less than 5 ppm to equal or more than 5 ppm, less than 10 ppm to equal or
more than 10 ppm, and less than 15 ppm to equal to 15 ppm). The results did not
indicate any trend or dose-response relationship (p>0.05), (Table 21, 22, and 23).

72
Table 21: Nitric Oxide Activity by Live Cells at Various Pooled Nitrite Concentrations
Nitrite concentrations
DF R square
t-Ratio Assuming equal variance
t-Ratio Assuming unequal variance
F Ratio
P Value
Concentration Pooled (<5 ppm to >5 ppm)
1 0.010 -1.18112 -0.96625 1.395 0.2396
Concentration Pooled (<10 ppm to >10 ppm)
1 5.1e-5 -0.08331 -0.0928 0.006 0.9337
Concentration Pooled (<15 ppm to =15 ppm)
1 0.0012 -0.41691 -0.57949 0.173 0.6774
Table 22: Nitric Oxide Activity by Dead Cells at Various Pooled Nitrite Concentrations
Nitrite concentrations
DF R square
t-Ratio Assuming equal variance
t-Ratio Assuming unequal variance
F Ratio
P Value
Concentration Pooled (<5 ppm to >5 ppm)
1 0.0052 -0.67041 -0.63508 0.449 0.5044
Concentration Pooled (<10 ppm to >10 ppm)
1 0.0003 0.180707 0.176231 0.032 0.8570
Concentration Pooled (<15 ppm to =15 ppm)
1 0.0082 -0.84105 -0.59881 0.707 0.4027
Table 23: Nitric Oxide Activity by Total Cells (Live + Dead) at Various Pooled Nitrite Concentrations
Nitrite concentrations
DF R square
t-Ratio Assuming equal variance
t-Ratio Assuming unequal variance
F Ratio
P Value
Concentration Pooled (<5 ppm to >5 ppm)
1 0.0158 -1.54935 -1.32404 2.400 0.1234
Concentration Pooled (<10 ppm to >10 ppm)
1 0.0004 -0.24748 -0.28538 0.061 0.8049
Concentration Pooled (<15 ppm to =15 ppm)
1 0.0002 -0.17258 -0.26647 0.029 0.8632

73
Nitric Oxide Activity Quotient among Case (Osteoarthritis) and Control (Non-
Osteoarthritis)
The difference in mean nitric oxide activity between case and control was
calculated using the t-test. The independent variable was osteoarthritis (Yes/No) and the
dependent variable was nitric oxide activity level. In all of the NO expression measures
considered (nitric oxide activity by live cells, nitric oxide activity by dead cells, and
nitric oxide activity by total cells), there was no association with osteoarthritis case
status (Table 24, Appendix I33).
Table 24: Nitric Oxide Activity Quotient among Case and Control
NO Activity Parameters Nitrite Concentrations 0 ppm 1 ppm 5 ppm 10 ppm 15 ppm
NO activity with Live Cells 0.2429 0.4075 0.4815 0.1795 0.5362 NO activity with Dead Cells 0.4588 0.2179 0.7559 0.5845 0.2319 NO activity Total Cells 0.3104 0.4699 0.5696 0.3037 0.6897 X-Axis: Osteoarthritis (Yes or No) Y-Axis: NO Activity Parameters

74
DNA Damage Quotient of All Participants
Using immunoassay tags and the Millipore MUSE flow cytometer, lymphocyte
expression of DNA damage ranging from mild dephosphorylation to histone damage
and double strand breaks was explored in relationship to the various nitrite exposure
levels. The test protocol measured the following parameters:
1. Percentage of negative cells (no DNA Damage)
2. Percentage of ATM activated cells (dephosphorylation)
3. Percentage of H2A.X activated cells (histone protein damage)
4. Percentage of DNA double-strand break (dual activation of both ATM and
H2A.X)
5. Percentage of Total DNA Damage
Using bivariate fit the percentage of ATM activated cells, the percentage of
H2A.X activated cells, the percentage of DNA double-strand break (dual activation of
both ATM and H2A.X), and percentage of total DNA damage was examined at each of
the exposure levels of sodium nitrite.
pATM Activated Cell Quotient at Various Nitrite Concentrations
An ANOVA test was used to explore the difference between mean percentages
of pATM activated cells at various nitrite concentrations. The pATM activated cells
were recorded as a quotient of stimulated to the non-stimulate state. The activation of
pATM indicated light DNA damage and the one-way ANOVA analysis showed that

75
there was some trend of pATM activation with increased nitrite concentration (Table 25)
but the result was not statistically significant (F=1.83, p=0.1281).
Table 25: pATM Activated Cells at Various Nitrite Concentrations
pATM activated cells Concentrations Mean Lower
95% Upper 95%
R square
DF F ratio
P Value
0 ppm 0.50341 0.0576 0.9492 0.07252 4 1.837 0.1281 1 ppm 0.43894 -0.0539 0.9318 5 ppm 1.03872 0.5459 1.5316 10 ppm 1.01609 0.5703 1.4619 15 ppm 1.11263 0.6329 1.5924
Figure 18: pATM Activated Cells at Various Nitrite Concentrations
0
1
2
3
4
5
6
0 1 5 10 15
Concentration
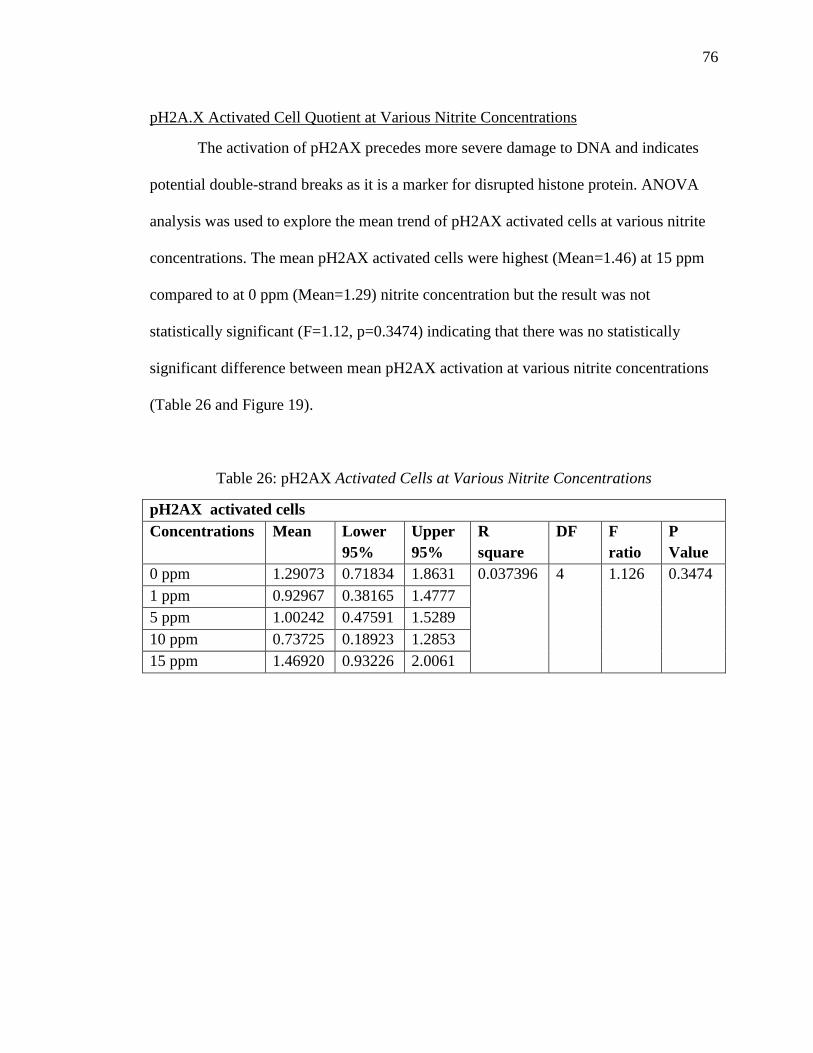
76
pH2A.X Activated Cell Quotient at Various Nitrite Concentrations
The activation of pH2AX precedes more severe damage to DNA and indicates
potential double-strand breaks as it is a marker for disrupted histone protein. ANOVA
analysis was used to explore the mean trend of pH2AX activated cells at various nitrite
concentrations. The mean pH2AX activated cells were highest (Mean=1.46) at 15 ppm
compared to at 0 ppm (Mean=1.29) nitrite concentration but the result was not
statistically significant (F=1.12, p=0.3474) indicating that there was no statistically
significant difference between mean pH2AX activation at various nitrite concentrations
(Table 26 and Figure 19).
Table 26: pH2AX Activated Cells at Various Nitrite Concentrations
pH2AX activated cells Concentrations Mean Lower
95% Upper 95%
R square
DF F ratio
P Value
0 ppm 1.29073 0.71834 1.8631 0.037396 4 1.126 0.3474 1 ppm 0.92967 0.38165 1.4777 5 ppm 1.00242 0.47591 1.5289 10 ppm 0.73725 0.18923 1.2853 15 ppm 1.46920 0.93226 2.0061

77
Figure 19: pH2AX Activated Cells at Various Nitrite Concentrations
DNA Double-Strand Break Quotient at Various Nitrite Concentrations
Activation of both ATM and H2A.X cells triggers DNA double-strand break
which might lead to cell death if not repaired. ANOVA analysis was used to explore the
difference between DNA double-strand break at various nitrite concentrations. Increased
nitrite exposure was not positively, statistically associated with double-strand break (F=
1.34, p>0.05). However, there was a trend in the data in that the double-strand break was
higher as the nitrite exposure level increased to 10 ppm (Mean= 1.64) but the break
instantly decreased (Mean=0.83) at 15 ppm nitrite exposure (Table 27 and Figure 20).
0
2
4
6
8
0 1 5 10 15
Concentration

78
Table 27: DNA Double-Strand Break at Various Nitrite Concentrations
DNA double-strand break Concentrations Mean Lower
95% Upper 95%
R square
DF F ratio
P Value
0 ppm 1.09593 0.6017 1.5901 0.039747 4 1.3453 0.2567 1 ppm 1.16038 0.6475 1.6732 5 ppm 1.21512 0.7023 1.7280 10 ppm 1.64107 1.1469 2.1353 15 ppm 0.83422 0.3310 1.3375
Figure 20: DNA Double-Strand Break at Various Nitrite Concentrations
0
2
4
6
8
0 1 5 10 15
Concentration

79
Total DNA Damage Quotient at Various Nitrite Concentrations
ANOVA analysis was used to examine the difference between increased nitrite
concentration and total DNA damage. Total DNA damage increased as cells were
exposed to greater than 10ppm (Mean=1.73 for 10ppm and Mean=1.56 for 15ppm) as
compared to control (Mean=1.24 for 0ppm). Even though there was some trend seen
between nitrite exposure and total DNA damage, the result (Table 28, Figure 21) was
not statistically significant (F=0.76, p=0.5527).
Table 28: DNA Double-Strand Break at Various Nitrite Concentrations
Total DNA damage Concentrations Mean Lower
95% Upper 95%
R square
DF F ratio
P Value
0 ppm 1.24830 0.5135 1.9831 0.020406 4 0.7603 0.5527 1 ppm 0.97857 0.2438 1.7133 5 ppm 1.08683 0.3521 1.8216 10 ppm 1.73725 1.0258 2.4487 15 ppm 1.56676 0.8194 2.3141

80
Figure 21: Total DNA Damage at Various Nitrite Concentrations
pATM Activated Cells by 5 ppm Nitrite Concentration
The study used five different level of nitrite concentration exposure (0, 1, 5, 10,
and 15 ppm. For statistical analysis, the exposures were pooled together if find if there
was any impact in DNA thorough pATM activated cells. The pooled nitrite
concentration category (less than 5 ppm to equal or more than 5 ppm) was used for the
analysis. The t-test was conducted to find if there was any difference in mean pATM
activated cells in above two pooled categories. The result indicated positive difference
indicating that the percentage of pATM activated cells was high when exposed to nitrite
concentration of 5ppm or more (Figure 22). The t-test showed the statistically significant
result (F=7.44, p=0.0076) indicating that cells exposed to higher nitrite concentration
increased the pATM activated cells by 7.44 times (Table 29).
0
5
10
15
20
0 1 5 10 15
Concentration

81
Table 29: pATM Activation at 5 ppm Nitrite Concentrations
Figure 22: pATM Activation at 5 ppm Nitrite Concentrations
Level Mean Lower 95%
Upper 95%
T Test Assuming equal variances
T Test Assuming unequal variances
R square
DF F ratio
P Value
Less Than 5 ppm
0.474 0.1488 0.8000 2.728137 3.021074 0.0712 1 7.44 0.0076*
Equal or More Than 5 ppm
1.054 0.7860 1.3221
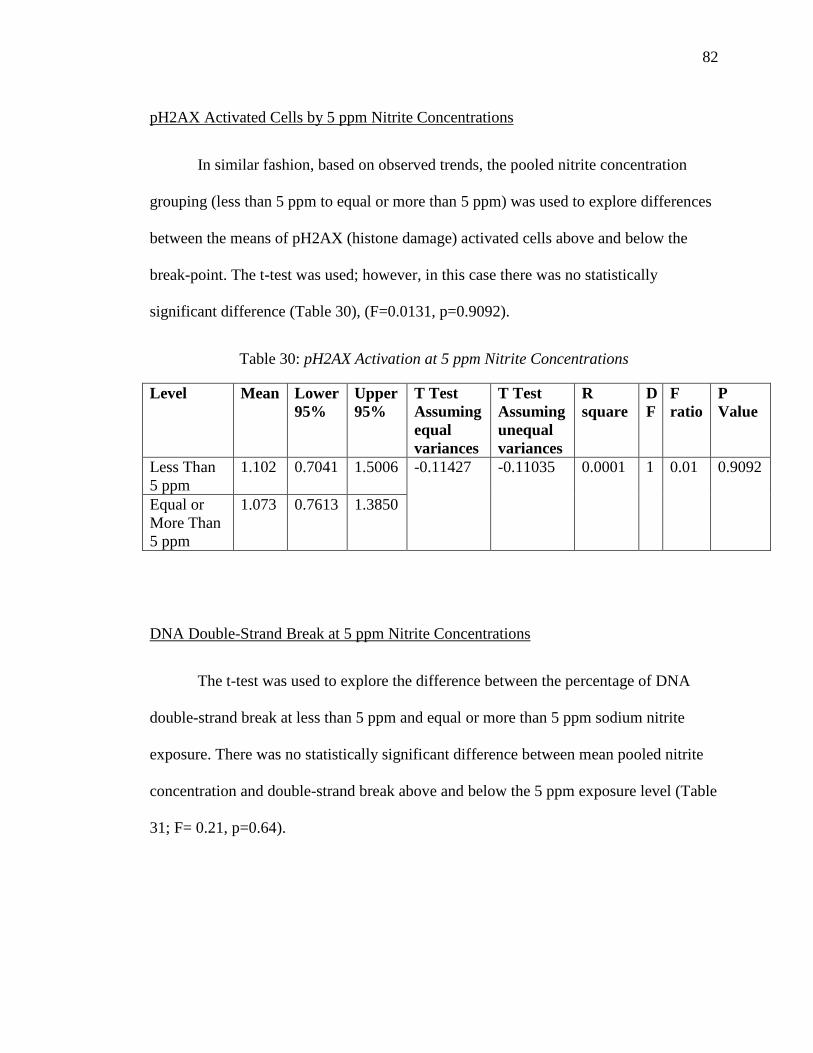
82
pH2AX Activated Cells by 5 ppm Nitrite Concentrations
In similar fashion, based on observed trends, the pooled nitrite concentration
grouping (less than 5 ppm to equal or more than 5 ppm) was used to explore differences
between the means of pH2AX (histone damage) activated cells above and below the
break-point. The t-test was used; however, in this case there was no statistically
significant difference (Table 30), (F=0.0131, p=0.9092).
Table 30: pH2AX Activation at 5 ppm Nitrite Concentrations
DNA Double-Strand Break at 5 ppm Nitrite Concentrations
The t-test was used to explore the difference between the percentage of DNA
double-strand break at less than 5 ppm and equal or more than 5 ppm sodium nitrite
exposure. There was no statistically significant difference between mean pooled nitrite
concentration and double-strand break above and below the 5 ppm exposure level (Table
31; F= 0.21, p=0.64).
Level Mean Lower 95%
Upper 95%
T Test Assuming equal variances
T Test Assuming unequal variances
R square
DF
F ratio
P Value
Less Than 5 ppm
1.102 0.7041 1.5006 -0.11427 -0.11035 0.0001 1 0.01 0.9092
Equal or More Than 5 ppm
1.073 0.7613 1.3850

83
Table 31: DNA Double-Strand Break at 5 ppm Nitrite Concentrations
Total DNA Damage at 5 ppm Nitrite Concentrations
The t-test was used to explore the difference between total DNA damage at less
than 5ppm and greater than 5 ppm. There was a trend as mean total damage observed at
less than 5 ppm was 1.11 and increased to 1.46 when cells were exposed to more than
5ppm of nitrite (Table 32). Even though a trend was observed, the difference was not
statistically significant (F= 1.10, p=0.2944).
Level Mean Lower 95%
Upper 95%
T Test Assuming equal variances
T Test Assuming unequal variances
R square
DF
F ratio
P Value
Less Than 5 ppm
1.126 0.7683 1.4856 0.463202 0.482553 0.0016 1 0.21 0.64
Equal or More Than 5 ppm
1.235 0.9425 1.5282

84
Table 32: Total DNA Damage at 5 ppm Nitrite Concentrations
DNA Damage Quotient among Case (Osteoarthritis) and Controls (Non-Osteoarthritis)
The t-test was used to explore the difference between osteoarthritis cases and
controls and DNA damage in the form of pATM activated cells, pH2AX activated cells,
DNA double-strand break, and total DNA damage. All of the predictors of DNA damage
showed no relationship to osteoarthritis. The analysis showed that there was no
significant difference between pATM activated cells, double-strand break ,pH2AX
activated cells , total DNA damage, and osteoarthritis (Yes/No) (Table 33, Appendix
I42).
Level Mean Lower 95%
Upper 95%
T Test Assuming equal variances
T Test Assuming unequal variances
R square
DF
F ratio
P Value
Less Than 5 ppm
1.113 0.8440 0.0073 1.052223 1.216435 0.0073 1 1.10 0.2944
Equal or More Than 5 ppm
1.468 0.9539 1.9830
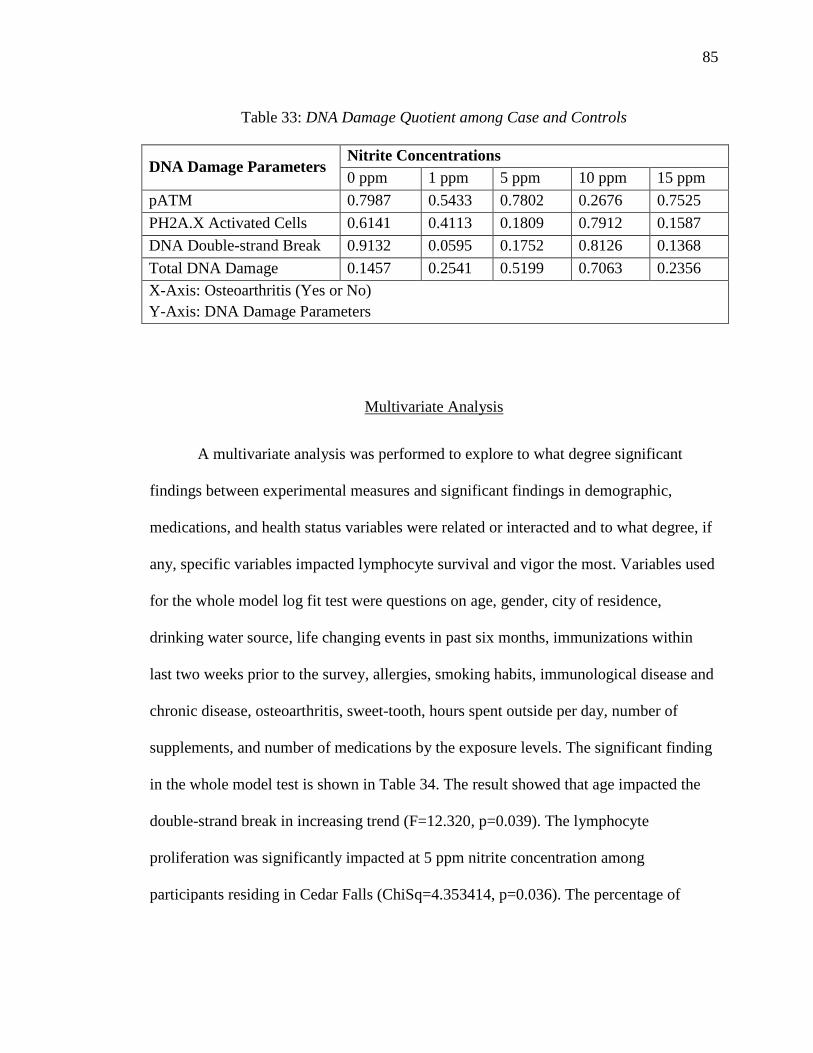
85
Table 33: DNA Damage Quotient among Case and Controls
DNA Damage Parameters Nitrite Concentrations 0 ppm 1 ppm 5 ppm 10 ppm 15 ppm
pATM 0.7987 0.5433 0.7802 0.2676 0.7525 PH2A.X Activated Cells 0.6141 0.4113 0.1809 0.7912 0.1587 DNA Double-strand Break 0.9132 0.0595 0.1752 0.8126 0.1368 Total DNA Damage 0.1457 0.2541 0.5199 0.7063 0.2356 X-Axis: Osteoarthritis (Yes or No) Y-Axis: DNA Damage Parameters
Multivariate Analysis
A multivariate analysis was performed to explore to what degree significant
findings between experimental measures and significant findings in demographic,
medications, and health status variables were related or interacted and to what degree, if
any, specific variables impacted lymphocyte survival and vigor the most. Variables used
for the whole model log fit test were questions on age, gender, city of residence,
drinking water source, life changing events in past six months, immunizations within
last two weeks prior to the survey, allergies, smoking habits, immunological disease and
chronic disease, osteoarthritis, sweet-tooth, hours spent outside per day, number of
supplements, and number of medications by the exposure levels. The significant finding
in the whole model test is shown in Table 34. The result showed that age impacted the
double-strand break in increasing trend (F=12.320, p=0.039). The lymphocyte
proliferation was significantly impacted at 5 ppm nitrite concentration among
participants residing in Cedar Falls (ChiSq=4.353414, p=0.036). The percentage of

86
pATM activated cells was significantly high (ChiSq=4.778267, p= 0.028) among the
participants drinking city water or public water. In the case of immunization in the past
two weeks, participants with no immunization had significantly higher double-strand
break at 1 ppm nitrite concentration (ChiSq=4.057145, p=0.043) and percentage of
pH2AX activated cells at 1 ppm nitrite concentration (ChiSq=4.214185, p=0.040).
Participants in control group i.e without osteoarthritis showed significant impact
in lymphocyte proliferation at 5 ppm nitrite concentration (ChiSq=4.311354, p= 0.037).
In addition, control group also showed significantly higher percentage of pH2AX
activated cells at 0 ppm nitrite concentration (ChiSq=4.620307, p=0.031) and Total
DNA damage at 0 ppm nitrite concentration (ChiSq=4.862667, p=0.027). Lastly, there
was significantly decrease in lymphocyte proliferation at 15 ppm nitrite concentration
(F=5.570, p= 0.026) among the participants taking higher number of medications
(Appendix I43-I49).

87
Table 34: Whole Model Test of Demographic, Health, and Medication Survey with Lymphocyte Proliferation, NO Activity, and DNA Damage
Demographic, Health, and Medication Survey
Experiments Lymphocyte Proliferation
NO Activity
DNA Damage
Age Not Significant Not Significant
DSB 5 ppm (F=12.320, p=0.0392*) (I)
City of Residence
Lymphocyte Proliferation Quotient 5 ppm (ChiSq=4.353414, p=0.03693*) (CF)
Not Significant
Not Significant
Drinking Water Source
Not Significant Not Significant
pATM 1ppm (ChiSq=4.778267, p= 0.02882*) (CW)
Immunization
Not Significant Not Significant
DSB 1 ppm (ChiSq=4.057145, p=0.04398*) (N) pH2AX 1 ppm (ChiSq=4.214185, p=0.04009*) (N)
Osteoarthritis
Lymphocyte Proliferation Quotient 5 ppm (ChiSq=4.311354, p= 0.03786*) (N)
Not Significant
pH2AX 0 ppm (ChiSq=4.620307, p=0.0316*) (N) Total DNA Damage 0 ppm (ChiSq=4.862667, p=0.02744*) (N)
Number of Medications
Lymphocyte Proliferation Quotient at 15 ppm (F=5.570, p= 0.02638*) (D)
Not Significant
Not Significant
X axis: Experiments (Lymphocyte Proliferation, NO Activity, and DNA Damage) Y axis: Demographic, Health, and Medications Survey DSB: Double-Strand Break I: Increasing Trend, D: Decreasing Trend, CF: Cedar Falls, CW: City Water, N:No *: Significant (p<0.05)
88
CHAPTER 6
DISCUSSION, CONCLUSIONS AND RECOMMENDATIONS
Discussion
Findings from the questionnaire survey and laboratory analysis of the 32 subjects
(16 Cases and 16 Controls) participating in this study are herein elaborated upon. As
certain demographic characteristics were found to be statistically, significantly related to
experimental outcomes these are discussed from the perspective of expected and
unpredicted outcomes, the previous literature, and biological plausibility. These are
discussed in light of the experimental exposures to low-level nitrite levels (0, 1, 5, 10,
and 15 ppm) and response of the mononuclear cells. Demographic and health
information is first addressed followed by a discussion of lymphocyte proliferation,
nitric oxide activation, and DNA damage.
Demographic Information
In this study participants ranged in age from 40 to 65 years, consisting of both
cases and controls. This age range corresponds to individuals most likely to have
arthritis in the general population. The Centers for Disease Control, CDC indicates that
34.6% of osteoarthritis patients were between the ages of 45 and 64 years and the risk of
developing osteoarthritis increases with age (Barbour et al., 2013). Therefore, we invited
participants from this age group.
There were 25 female participants and 7 male participants. According to CDC,
arthritis is more common among women (26%) than men, (19%) especially after age 50

89
(CDC, 2016). The prevalence of osteoarthritis dramatically increases in women after
menopause. Osteoarthritis and osteoporosis affects more than 60% of post-menopausal
women in the United States (Avci & Bachmann, 2011). Estrogen is a hormone that has a
protective role in the maintenance of joint homeostasis (Millán & Castañeda, 2013). In
menopausal women, the estrogen level is lower than normal which accelerates the
articular inflammation leading to osteoarthritis (Roman-Blas, Castañeda, Largo, &
Herrero-Beaumont, 2009). This, is a likely reason for getting more female participants
as compared to male participants.
Another demographic examined was the city of residence. An annual water
quality report for public information purposes is required under the Safe Drinking Water
Act, SDWA. Reports from Cedar Falls Utilities indicated that nitrate concentration in
public drinking water was 9.8 ppm and 8.8 ppm in 2015 and 2016 respectively (CFU,
2016 & CFU, 2017). Place of residence was added as a variable in this study to
determine if any difference in mean lymphocyte proliferation, NO activity, and DNA
damage could be detected between participants residing in Cedar Falls and other cities.
The t-Test was used to explore differences in mean lymphocyte proliferation, NO
activity, and DNA stress at various nitrite concentrations based on residence with an
understanding that one local residence namely, Cedar Falls reflected a more highly
exposed group. Results indicated city of residence was associated with an impact on
lymphocyte proliferation and DNA damage at 5 ppm nitrite exposure and the result was
statistically significant. This is interesting in light of the consistently high exposures
seen in Cedar Falls drinking water.

90
Medication, Herbs, and Supplements
Among the 16 participants who had osteoarthritis, nine took some form of
vitamin as their supplement. Vitamin D is an essential supplement, especially for people
suffering from osteoarthritis because it promotes the absorption of calcium and
phosphorus that helps to build bone. Research done by Garfinkel et al. (2017) indicated
that vitamin D deficiency poses a risk for osteoarthritis by decreasing cartilage
thickness. Similarly, Vitamin B12 helps the body to produce healthy red blood cells and
helps lower the production of homocysteine (high levels in the blood have been linked to
weak bones and heart disease). Therefore, supplements such as Vitamin B12 decrease
the level of homocysteine which is considered to weaken the bones and cartilage
between the bones (Avci & Bachmann, 2011; McLean et al., 2004). A bivariate fit
analysis indicated protective trend relative to NO activity by live cells (F=5.53, p=0.02
at 10 ppm nitrite concentration), NO activity by total cells (F=4.311, p=0.049 at no
nitrite exposure), and pATM activity (F= 9.01, p=0.008 at 10 ppm nitrite concentration)
with an increasing number of herbs and supplements taken, indicating protective effect.
Among the 32 participants, 18 were taking prescribed medications. There were 8
participants taking antidepressants and blood pressure/ heart-related medications
respectively. Nine out of 16 participants having OA were taking prescribed medications.
Five were taking antidepressants and NSAIDs medications. Since OA is associated with
chronic pain and long-term inflammatory processes this is also correlated with
associated with depression (Jesus, Jesus, & Agius, 2016). Therefore, it is not surprising
that many participants in this study took an antidepressant as their prescribed

91
medication. The most common brand names reported were duloxetine, fluoxetine, and
Cymbalta, and there brands are commonly reported as prescribed in the literature (Jesus
et al., 2016; Sullivan, Bentley, Fan, & Gardner, 2009). NSAIDs are another common
prescription medication among the participants with osteoarthritis in this study. There
were 10 osteoarthritis patients taking prescribed medications and among them three
were taking NSAIDs. Since these medications are commonly used to relieve
inflammation and pain, it is a common medication among the osteoarthritis patients
(Milder, Williams, Ritchie, Lipworth, & Day, 2011). Interestingly, however, bivariate fit
analysis indicated a decrease in lymphocyte vigor (F=5.57, p=0.026 at 15 ppm nitrite
concentration) and response and an increase in double-strand break (F=5.79, p=0.025 at
15 ppm nitrite concentration) and total DNA damage (F=7.05, p=0.013 at 1 ppm nitrite
concentration) with an increased number of medications taken. Antidepressant
medication is associated with decreased lymphocyte cells such as CD3 and CD4 T-
lymphocytes, and Natural Killer cells because it alters T-cell cytokine production mainly
reducing proinflammatory cytokines production (Ravindran, Griffiths, Merali, &
Anisman, 1995; Diamond, Kelly, & Connor, 2006).
Health Information
Among the various health-related questions, three of them showed a strong
difference with lymphocyte proliferation, NO activity, and DNA stress. Those questions
were; major life-changing events, immunological and chronic disease, and immunization
history. Participants experiencing stressful life events showed a significant increase in
NO activity (F=11.08, p=0.0029 by live cells at no nitrite exposure; F=4.60, p=0.041 by
92
live cells at 15 ppm nitrite concentration; F=4.84, p=0.0449 by dead cells at no nitrite
exposure; F=16.32, p=0.0099 by dead cells at 10 ppm nitrite concentration; F=25.06,
p<0.0001 by total cells at no nitrite exposure; F=4.86, p=0.035 by total cells at 10 ppm
nitrite concentration) and DNA stress (F=4.36, p=0.049 for pATM activated cells at no
nitrite exposure; F=6.42, p= 0.018 for double-strand break at 1 ppm nitrite
concentration). Several studies indicated that stress contributes to DNA methylation
which thereby modifies the function of the gene and affects the gene expression leading
to epigenetic modification (Blaze & Roth, 2015; Klengel, Pape, Binder, & Mehta, 2014;
Unternaehrer et al., 2012). In the case of immunological and chronic disease,
participants having fibromyalgia showed significant response regarding NO activity
(F=3.4004, p=0.0482 by live cells at 10 ppm nitrite concentration; F=6.67, p=0.0046 by
live cells at 15 ppm nitrite concentration; F=14.03, p=0.0016 by dead cells at 10 ppm
nitrite concentration; F=4.69, p=0.0174 by total cells at 10 ppm nitrite concentration)
and DNA damage (F=3.59, p=0.047 for pATM activated cells at no nitrite exposure;
F=3.21, p=0.0689 for pATM activated cells at 5 ppm nitrite concentration). The reactive
oxygen intermediates in autoimmune disease are responsible for genomic DNA damage.
Studies found that a pro-mutagenic DNA lesion, 8-Oxo-7-hydrodeoxyguanosine (8-
oxodG) was significantly high among people having autoimmune disease (Bashir,
Harris, Denman, Blake & Winyard, 1993; Ogawa et al., 2013). In addition, participants
having had a flu shot within two weeks showed significant impact on DNA damage
(F=19.58, p=0.0002 for pH2AX at 1 ppm nitrite concentration; F=5.83, p=0.0245 for
pH2AX at 10 ppm nitrite concentration). Influenza vaccination cause antibody to
93
develop in the body which provide protection against infection with the viruses that are
in the vaccine (WHO, 2017). In elderly population mainly aged over 65 years, the
influenza vaccination significantly lowered the lymphocytes counts at four weeks than at
the baseline (Cummins, Wilson, Foulger, Dawson & Hogarth, 1998). Lymphocytes use
reactive oxygen species (ROS) for carrying out their normal functions but excess
amount of ROS lead to cell damage. ROS is also responsible for the activation of ATM
cells which is also indicates DNA damage (Ash, 2010; Gautam et al., 2010).
Lymphocyte Proliferation
ANOVA analysis was conducted on lymphocyte proliferation at various nitrite
concentrations (0, 1, 5, 10, and 15ppm) to explore the difference between mean
lymphocyte proliferation and nitrite concentration. Lymphocyte proliferation in each
non-stimulated and stimulated exposure scenario was analyzed separately under the
various nitrite exposure scenarios to explore dose-response relationships. In the non-
stimulated condition, the lymphocyte proliferation significantly decreased with higher
exposure to nitrite concentration. Therefore, the study rejected the null hypothesis which
signifies that there is a statistical difference in lymphocyte proliferation between
different nitrite concentrations (F=7.28, p<0.0001). The mean lymphocyte count at no
nitrite exposure (0 ppm) was 395663, which were reduced following various nitrite
concentrations (1 ppm= 341394, 13.71% decrease; 5 ppm= 309425, 21.8% decrease; 10
ppm= 246659, 37.66% decrease; 15 ppm=195369, 50.63% decrease). Similarly, in the
stimulated condition, lymphocyte proliferation decreased with higher exposure to nitrite
concentrations (lymphocyte count at 0 ppm= 417069 and at 15 ppm=277500, 33.46%

94
decrease) but the result was not statistically significant (F=1.32, p=0.2613). In a
stimulated condition, the study had accepted the null hypothesis indicating that there is
no statistical difference in lymphocyte proliferation between different nitrite
concentrations.
A quotient of stimulated to non-stimulated cells was generated to characterize
the mitotic vigor of the samples following mitogen stimulation. This quotient was then
analyzed using one-way ANOVA which indicated that the proliferation vigor was highly
impacted by increasing nitrite concentration. The dose-response relationship was
observed where lymphocyte response significantly decreased with increasing nitrite
(F=2.47, p=0.0463) exposure. Therefore, the null hypothesis was rejected as there was a
statistically significant difference between proliferation response and exposure level.
A study by Ustyugova et al. (2002) exposed human mononuclear cells to sodium
nitrite and sodium nitrate salt, examining lymphocyte proliferation. The study found that
nitrate had no effect on lymphocyte proliferation, but nitrite decreased proliferation. In
addition, it decreased the production of T helper cell 1 (Th1) cytokines, which provides
resistance to a variety of infectious diseases. Another study by Goedert et al. (1982)
found that homosexual men who regularly used butyl nitrite had low counts of T
lymphocytes and suggested that the nitrites may be immunosuppressive. The study used
multiple nitrite concentrations finding nitrite significantly decreased lymphocyte
proliferation at 10ppm (p<0.05) and that a trend was exhibited even at 1ppm although at
other doses the suppression was not found to be statistically significant. Therefore, the
impact of nitrite was observed even in low concentration within the EPA guideline, but

95
it was not statistically significant. However, this should be considered due to the small
sample size.
In the real world, people are not exposed to only one source of nitrite exposure,
but in fact, there are multiple sources of exposure such as drinking water (15-20%),
vegetables (60-80%), cured meat products (0.3 to 2.6 mg/day of nitrite), as well as some
medication (Weitzberg & Lundberg, 2013; WHO, 2011). Since low lymphocyte
proliferation was observed with increasing exposure to nitrite, it is obvious that
continuous exposure to nitrite from non-food sources at higher levels through drinking
water (5-10 ppm nitrite, or 50-100 ppm nitrate) at concentrations not previously seen as
harmful, could be impacting human health or worsening chronic inflammatory
conditions.
In case of lymphocyte proliferation comparison between cases and controls, the
study found that participants with osteoarthritis had decreased lymphocyte proliferation
and mitogenic response as compared to participants without osteoarthritis. Although it
has long been considered a “wear and tear” disease, recent studies found that
osteoarthritis is a much more complex disease with inflammatory mediators released by
cartilage, bone, and synovium (Berenbaum, 2013; Sokolove & Lepus, 2013). Leheita,
Abed, Younes, and Mahmoud (2005) conducted a comparative study of T cell
production among two group of patients, first were osteoarthritis knee patients and
second were rheumatoid arthritis patients. The study revealed that there was no
statistical difference between lymphocyte subsets of both groups indicating a similar
immune profile in both rheumatoid arthritis and osteoarthritis. This study believed that
96
the lymphocytes in osteoarthritis participants were already stressed due to inflammation.
Addition of more stressor in the form of nitrite reduced the number of viable cells which
decreased lymphocyte proliferation in osteoarthritis participants compared to non-
osteoarthritis participants.
In this study, the lymphocyte proliferation of participants with osteoarthritis was
significantly lower when compared to participants without osteoarthritis. Therefore, the
null hypothesis was rejected, signifying that there was a statistically significant
difference between mean lymphocyte proliferation and case and control status.
Nitric Oxide Activity
Nitrite is recycled in blood and tissue to form nitric oxide (NO) and other
bioactive nitrogen oxides (Lundberg et al., 2008). It was hypothesized that there was a
possibility of increased NO stress in the lymphocytes with increased nitrite
concentration. NO is associated with increased production of proinflammatory cytokines
that contribute to inflammation and apoptosis and are involved in the pathogenesis of
inflammatory disorders of the joints, guts, and lungs (Abramson, 2008; Sharma, Al-
Omran, & Parvathy, 2007).
In the case of nitric oxide activity, this study accepted the null hypothesis
indicating that there was no statistically significant difference between nitric oxide
activity in all lymphocyte states (live cells, dead cells, and total cells) and various nitrite
concentrations as well as among the cases and controls. It is interesting to note,
however, that many studies indicate that NO is responsible for production of
97
proinflammatory cytokines such as interleukin-1 and tumor necrosis factor- alfa which is
present at the site of joint damage and responsible for destruction of cartilage which is
part of the pathogenesis of osteoarthritis (Abramson, 2008; Kapoor et al., 2011;
Vuolteenaho, Moulanen, Knowles, & Moilanen, 2007). This study indicates that NO
present around the lymphocytes is not increasing their production or release.
DNA Stress
Double-stranded DNA breaks must be preceded by the activation of ATM
(Ataxia-telangiectasia mutated kinase). Once activated, ATM triggers other downstream
factors such as phosphorylation of histone variant, H2A.X. The presence of ATM and
Histone H2A.X indicates the level of DNA damage present within the cell. Therefore,
understanding of DNA damage is an important area of human health research when
attempting to understand the possible biomolecular impacts of toxicants and toxins
(Millipore Sigma, 2013). This study used the Millipore Muse Multi-Color DNA damage
Kit to detect the activation of ATM and H2A.X using flow cytometry. The activation of
ATM indicates light DNA damage. As the percentage of ATM activated cells increase,
the likelihood of DNA damage increases by disrupting the histone protein, which then
results in activation of H2A.X cells. The activation of H2A.X cells indicates major DNA
damage. The combination of ATM and H2A.X activated cells result in DNA double-
strand damage.
This study found that light DNA damage (percentage of ATM activated cells)
was increased with increased nitrite concentrations especially when cells were exposed
to five ppm and higher nitrite concentration. Therefore, the study rejected the null

98
hypothesis predicting no difference between DNA stress and lymphocyte DNA damage.
Nitrite is converted to nitric oxide endogenously in the human body. The study by
Cherng et al. (2008) indicated that exposure to sodium nitroprusside (SNP) increased
cellular NO level which induced DNA fragmentation and cell apoptosis. The study
indicated that administration of 1 mMol SNP significantly increased DNA fragmentation
by 80% and increased apoptotic cells by 78%. This study further supports those
findings.
Differences between osteoarthritis cases and controls, where not detected
regarding signs of DNA damage such as pATM activated cells, pH2A.X, DNA double-
strand break, and total DNA damage. Therefore, the study accepted the null hypothesis
indicating that there would be no statistically significant difference between cases and
controls regarding DNA damage. The increasing DNA damage seen in lymphocytes
this study was seen across all cases and controls with increasing exposure to sodium
nitrite.
99
Conclusions and Recommendations
Nitrite and nitrate occurs naturally in the environment and the body. It is of use
in certain concentrations for vital bodily and environmental functions. However, levels
of nitrate (nitrite is quickly oxidized in the ambient environment to nitrate) in the
ambient environment near most human habitations and sources of drinking water has
been steadily increasing since the late 1940s, early 1950s (Spiro & Stigliani, 2002). As
levels in surface, ground and potable water have been steadily increasing, it is
considered a water pollutant and agent of eutrophication. This is occurring because of
extensive use of agricultural fertilizers and manures from animals. In groundwater, the
presence of nitrate is problematic and widespread, especially in agricultural areas. Under
Safe Drinking Water Act (SDWA), the EPA has regulated the maximum contaminant
level (MCL) of nitrate at 10 ppm nitrate as nitrogen and nitrite at 1 ppm water from
water treatment facilities. In humans, microorganisms convert 20% of total nitrate intake
into nitrite on the tongue. For normal adults about 5-7% of ingested nitrate can be
detected a salivary nitrite (EFSA, 2008).
However, the population in the United States with private drinking water sources
are consuming water without any regulatory or testing requirements as the SDWA does
not apply to private wells. Nitrates are also commonly found in vegetables such as
spinach, beets, lettuce, and other leafy vegetables. These nitrates in food and water are
converted to nitrite (more toxic form) by microorganisms in saliva and the gut. Nitrite
formed in this process is converted to nitric oxide in the stomach under acidic
conditions. The presence of excessive nitric oxide can have a negative impact on the

100
humans (Cherng et al., 2008). The excess nitric oxide results in a proinflammatory
process which triggers chondrocytes apoptosis leading to pain related to osteoarthritis
(Abramson, 2008) Although osteoarthritis is not considered a general inflammatory
disease wherein the body’s immune system broadly attacks joints and other organs,
synovial joint damage and wear and tear leads to local inflammation and the production
of nitric oxide. Since previous studies had illustrated an in-vivo relationship between
higher levels of nitrate in drinking water and complaints of bone and joint problems,
particularly osteoarthritis, this study was done to determine if cases of osteoarthritis had
a differing lymphocyte response to increasing nitrite exposures (Zeman et al., 2011).
The results of this study illustrate that increasing nitrite exposure has some level
of impact on human mononuclear cells and that there are differences in how the
lymphocytes of arthritis cases versus controls respond to those exposures. Five different
concentrations ranging from 0 ppm (no exposure, control) to 15 ppm (high exposure)
nitrite were used. Lymphocyte proliferation decreased when the nitrite exposure
concentration was increased to 1 ppm and then followed by 5, 10, and 15 ppm.
However, the significant decrease in proliferation was observed at 10 ppm nitrite
exposure (p<0.05). Even though the study included only 32 participants, a significant
impact on proliferation was observed with increasing nitrite concentration. Similarly, for
cases and controls, the result found that proliferation decreased among osteoarthritis
participants.
Further, while nitric oxide stress was not found to play a role for proliferation
nor in differences between cases and controls, DNA stress with increased nitrite

101
concentration was observed in controls and cases with increasing nitrite exposures.
Further, a significant break-point in the data was observed at nitrite concentrations of 5
ppm and more (p<0.05). Therefore, the study indicated that light DNA damage was
observed with increasing nitrite concentration by the activation of pATM in the
lymphocytes.
Overall the study had fairly interesting findings on lymphocyte proliferation and
DNA stress. And even though the study did not find any significant difference between
nitric oxide stress and the lymphocytes, it cannot be concluded that increasing nitrite
concentrations do not have an impact on nitric oxide activity, in fact, ambient levels may
have been suppressing NO production in the lymphocytes. In the past study, another
form of nitrite source was used to measure nitric oxide activity such as SNP. In this
study, exposure of human chondrocytes to less than 1 mMol SNP significantly increased
cellular NO levels by 38 percent (Cherng et al., 2008).
Even through there were a small number of participants in this study, the fact
that increasing nitrite exposure had a negative impact on lymphocyte proliferation and
DNA stress indicates the need for further studies to understand these processes. In
addition, the study participants (40-65 years) were of limited age ranges, due to ease of
recruitment, funding, and time constraints. It is understandable that osteoarthritis
progresses with age, but there are people with this disease at younger ages, even in their
twenties (Amoako & Pujalte, 2014). Future studies should therefore incorporate
participants at younger ages so that their lymphocyte responses can be explored relative
to their older cohorts. Finally, this study was conducted in an in vitro setting where

102
lymphocytes were exposed to various nitrite levels in microcell well plates. People are
exposed to nitrite in their daily lives such as from drinking water, food, and medication,
those should be carefully monitored with a detailed exposure history in a case and
control selected population (in vivo case control study) and their lymphocytes
systematically evaluated as should their cytokine expression. The one previous in vivo
study completed found the association with nitrate exposure and arthritis as part of a
cohort study and not due to a case control design (Zeman et al., 2011). This important
issue of the role of environmental exposures in the course of chronic diseases and
conditions of aging should be further pursued to clarify the etiology of conditions and
the recommendations for prevention and treatment. Additionally, public health
education is important for people to know about the harmful impact of nitrite especially
for people drinking private water with unknown nitrate and nitrite level. Drinking nitrate
and nitrite contaminated water becomes cumulative when combined with consumption
of food such as vegetable and processed meat with sodium nitrite. Therefore, the
research recommend public outreach in term of publication, presentation, and sharing
results with county health department for nitrite awareness.
103
REFERENCES
Abramson, S.B. (2008). Nitric oxide in inflammation and pain associated with osteoarthritis. Arthritis Research & Therapy, 10 (2), 1-7.
Abuharfeil, N., Jaran, A., Shabsough, B. & Darmani, H. (2001). Effects of sodium nitrite
on natural killer cells isolated from human peripheral blood. Archives of Toxicology, 75, 291-296.
Abuharfeil, N., Sarsour, E. & Hassuneh, M. (2001). The effect of sodium nitrite on some
parameters of the immune system. Food and Chemical Toxicology, 39, 119-124. American Public Health Association, APHA (2016). Arthritis: Managing pain through
healthy moves. The Nation’s Health. Retrieved on April 2, 2016 from http://thenationshealth.aphapublications.org/site/healthyyou/HealthyYouArthritis.pdf
Amoako, A.O. & Pujalte, G.G.A. (2014). Osteoarthritis in Young, Active, and Athletic
Individuals. Clinical Medicine Insights: Arthritis and Musculoskeletal Disorders, 7, 27-32.
Andreassi, M.G., Picano, E., Ry, S.D., Botto, N., Colombo, M.G., Giannessi, D…
Biagni, A. (2001). Chronic long-term nitrate therapy: possible cytogenetic effect in humans. Mutagenesis, 16 (6), 517-521.
Ansari, F.A., Ali, S.N. & Mahmood, R. (2015). Sodium nitrite-induced oxidative stress
causes membrane damage, protein oxidation, lipid peroxidation and alters major metabolic pathways in human erythrocytes. Toxicology in Vitro, 29, 1878-1886.
Archer, D., Milkowski, A., Coughlin, J.R. & Bryan, N. (2008).Sodium Nitrite: The Facts. American Meat Institute. Retrieved May 10, 2016 from 31Thttps://www.meatinstitute.org/index.php?ht=a/GetDocumentAction/i/44170
31TAsh, C. (2010). Stress, DNA Damage, and ATM. Science, 330 (6003), 425. 31TAvci, D. & Bachmann, G.A. (2011). Osteoarthritis and osteoporosis in postmenopausal
women: clinical similarities and differences. Menopause, 11 (6), 651-621. 31TBailey S.J., Winyard, P., Vanhatalo, A., Blackwell, J.R., Dimenna, F.J., Wilkerson,
D.P…Jones, A.M. (2009). Dietary nitrate supplementation reduces the O2 cost of low-intensity exercise and enhances tolerance to high-intensity exercise in humans. Journal of Applied Physiology, 107, 1144-1155.

104
Barbour, K.E, Helmick, C.G., Theis, K.A., Murphy, L.B., Hootman, J.M., Brady, T.J. & Cheng, Y.J. (2013). Prevalence of Doctor-Diagnosed Arthritis and Arthritis-Attributable Activity Limitation, United States, 2010–2012. Morbidity and Mortality Weekly Report, 62 (44), 869-873.
Benjamin, N., O’Dris, F., Dougall, H., Duncan, C., Smith, L. & Golden, M. (1994).
Stomach NO synthesis. Nature, 368, 502. Bashir, S., Harris, G., Denman, M.A., Blake, D.R. & Winyard, P.G. (1993). Oxidative
DNA damage and cellular sensitivity to oxidative stress in human autoimmune diseases. Annals of Rheumatic Disease, 52 (9), 659-666.
Berenbaum, F. (2013). Osteoarthritis as an inflammatory disease (osteoarthritis is not
osteoarthrosis!). Osteoarthritis Cartilage, 21 (1), 16-21.
Berke, G. & Clark, W.R. (2007). Killer Lymphocytes. Dordrecht, The Netherlands: Springer.
Blaze, J. & Roth, T. (2015). Evidence from clinical and animal model studies of the
long-term and transgenerational impact of stress on DNA methylation. Seminars in Cell & Developmental Biology, 43, 76-84.
Böger, R.H. (2007). The Pharmacodynamics of L-Arginine. The Journal of Nutrition,
137, 1650S-1655S.
Boink, A. & Speijers, G. (2001). Health effects of nitrates and nitrites: A review. Acta Horticulture 563. 29-36. https://doi.org/10.17660/ActaHortic.2001.563.2
Brass, D., Mckay, P. & Scott, F. (2014). Investigating an incidental finding of lymphopenia. BMJ, 348,g1721
Cammack, R,Joannou, C.L., Cui, X.Y., Martinez, C.T., Maraj, S.R. & Hughes, M.N. (1999). Nitrite and nitrosyl compounds in food preservation. Biochimica et Biophysica Acta (BBA) - Bioenergetics, 1411, 475-488.
Canter, L.W. (1997). Nitrates in Groundwater. Boca Raton, FL: Lewis Publishers. Cedar Falls Utility (2016). Consumer Confidence Report. Retrieved on March 9, 2018
from https://www.cfu.net/webres/File/utilities/2016%20Website%20Cedar%20Falls-6-20-16.pdf
Cedar Falls Utility (2017). Consumer Confidence Report. Retrieved on March 9, 2018
from https://www.cfu.net/webres/File/utilities/Cedar%20Falls%20-%20CCR%20June%202017.pdf

105
Center for Disease Control (2016). Arthritis at a glance: Improving the quality of life for people with arthritis. Retrieved January 25, 2017 from 31Thttps://www.cdc.gov/chronicdisease/resources/publications/aag/pdf/2016/aag-arthritis.pdf
31TCherng, Y.G., Chang, H.C., Lin, Y.L., Kou, M.L., Chiu, W.T. & Chen, R.M. (2008).
Apoptotic Insults to Human Chondrocytes Induced by Sodium Nitroprusside Are Involved In Sequential Events, Including Cytoskeletal Remodeling, Phosphorylation of Mitogen-Activated Protein Kinase Kinase Kinase-1/c-Jun N-Terminal Kinase, and Bax-Mitochondria Mediated Caspase Activation. Journal of Orthopedic Research, 26 (7), 1018-1026.
31TCho, H.J., Chang, C.B., Kim, K.W., Park, J.H., Yoo, J.H., Koh, I.J. & Kim, T.K. (2011).
Gender and Prevalence of Knee Osteoarthritis Types in Elderly Koreans. The Journal of Arthroplasty, 26 (7), 994-999.
Choi, M.I., Sinha, R., Gierach, G.L. & Ward, M.H. (2015). Dietary nitrate and nitrite,
micronutrients, and postmenopausal breast cancer risk in the NIH-AARP Diet and Health Study. Cancer Research, Proceedings: AACR 106P
thP Annual Meeting.
Retrieved on April 10, 2016 from 31Thttp://cancerres.aacrjournals.org/content/75/15_Supplement/1883.short
Chui, H. F., Tsai, S.S., Wu, T. & Tang, C.Y. (2010). Colon cancer and content of
nitrates and magnesium in drinking water. Magnesium Research, 23 (2), 81-89. Coggon, D., Reading, I., McLaren, M., Barrett, D. & Cooper, C. (2001). Knee
osteoarthritis and knee. International Journal of Obesity, 25 (5), 622-627. Cummins, D., Wilson, M.E., Foulger, K.J., Dawson, D. & Hogarth, A.M. (1998).
Haematological changes associated with influenza vaccination in people aged over 65: case report and prospective study. International Society of Laboratory Hematology, 20, 285-287.
Diamond, M., Kelly, J.P. & Connor, T.J. (2006). Antidepressants suppress production of
the Th1 cytokine interferon-g, independent of monoamine transporter blockade. European Neuropsychopharmacology, 16, 481-490.
Duncan, C., Dougall, H., Johnston, P., Green, S., Brogan, R., Leifert, C… Benjamin, N. (1995). Chemical generation of nitric oxide in the mouth from the enterosalivary circulation of dietary nitrate. Nature Medicine, 1 (6), 546-551.
EFSA (European Food Safety Authority) (2008). Nitrate in vegetables: Scientific
opinion of the panel on contaminants in the food chain, The EFSA Journal, 689, 1-79.

106
Erisman, J.W., Galloway, J.N., Seitzinger, S., Bleeker, A., Dise, N.B., Petrescu, R… Vries, W.D. (2013). Consequences of human modification of the global nitrogen cycle. Philosophical Transactions of The Royal Society B, 368, 31Thttp://dx.doi.org/10.1098/rstb.2013.0116.
31TErsoy, Y, Ozerol, E., Temer, I.,MacWalter, R.S., Meral, U. & Altay, Z.E. (2002). Serum
nitrate and nitrite levels in patients with rheumatoid arthritis, ankylosing spondylitis, and osteoarthritis. Annals of Rheumatic Disease, 61, 76-78.
Feelisch, M. (2008). The chemical biology of nitric oxide-an outsider’s reflections about
its role in osteoarthritis. Osteoarthritis and Cartilage, 10 (2), S3-S13.
Fowler, D., Coyle, M., Skiba, U., Sutton, M.A., Cape, N., Ries, A…Voss, M. (2013). The global nitrogen cycle in the twenty-first century. Philosophical Transaction of The Royal Society B, 368, 31Thttp://dx.doi.org/10.1098/rstb.2013.016431T
Galloway, J.N., Schlesinger, W.H., Levy II, H., Micheals, A. & Schnoor, J.L. (1995). Nitrogen fixation: Anthropogenic enhancement-environmental response. Global Biogeochemical Cycle, 9 (2), 235-252.
Garfinkel, R.J., Dilisio, M. F. & Agrawal, D.K. (2017). Vitamin D and Its Effects on
Articular Cartilage and Osteoarthritis, Orthopedic Journal of Sport Medicine, 5 (6), 1-8.
Gautam, N., Das, S., Mahapatra, S.K., Chakraborty, S.P., Kundu, P.K. & Roy, S. (2010).
Age associated oxidative damage in lymphocytes. Oxidative Medicine and Cellular Longevity, 3 (4), 275-282.
Gehle, K (2013). ATSDR Case Studies in Environmental Medicine Nitrate/Nitrite
Toxicity. U.S Department of Health and Human Services, Retrieved on April 12, 2016 from 31Thttp://www.atsdr.cdc.gov/csem/nitrate_2013/docs/nitrite.pdf31T
Geng, L., Alexander, B., Cole-Dai, J., Steig, E.J., Savarino, J., Sofen, E.D…Schauer,
A.J. (2014). Nitrogen isotopes in ice core nitrate linked to anthropogenic atmospheric acidity change. Proceedings of the National Academy of the United State of America, 111 (16), 5808-5812.
Gilchrist, M. & Benjamin, N. (2011). From Atmospheric Nitrogen to Bioactive Nitrogen Oxides. In N.S. Bryan & J. Loscalzo (Eds.), Nitrite and Nitrate in Human Health (pp 9-20). New York, NY: Humana Press.
Goedert, J.J., Wallen, D.L., Strong, D.M., Neuland, C.Y., Greene, M.H., Murray, C…
Blattner, W.A. (1982). Amyl Nitrite may alter T Lymphocytes in Homosexual Men. The Lancet, 319 (8269), 412-416.
107
Grabowski, P.S., Wright, P.K., Hof, R.J., Helfrich, M.H., Oshima, H. & Ralston, S.H. (1997). Immunolocalization of inducible nitric oxide synthase in synovium and cartilage in rheumatoid arthritis and osteoarthritis. British Journal of Rheumatology, 36, 651-655.
Gruber, N. & Galloway, J. (2008). An Earth-system perspective of the global nitrogen
cycle. Nature, 451 (17), 293-296.
Heraud, F., Heraud, A. & Harmand, M.F. (2000). Apoptosis in normal and osteoarthritic human articular cartilage. Annals of the Rheumatic Disease, 59 (12), 959-965.
Hord, N.G. (2011). Dietary Nitrates, Nitrites, and Cardiovascular Disease. Current
Atherosclerosis Reports, 13 (6), 484-492. Hord, N.G, Tang, Y. & Bryan, N.S (2009). Food sources of nitrates and nitrites: the
physiologic context for potential health benefits. The American Journal of Clinical Nutrition, 90, 1-10.
Hunter, D.J., March, L. & Sambrook, P.N. (2002). Knee osteoarthritis: The influence of
environmental factors. Environmental Rheumatology, 20, 93-100.
Innes, K.E., Ducatman, A.M., Luster, M.I. & Shankar, A. (2011). Association of Osteoarthritis with Serum Levels of the Environmental Contaminants Perfluorooctanoate and Perfluorooctane Sulfonate in a Large Appalachian Population. American Journal of Epidemiology, 174 (4), 440-450.
Jang, D. & Murrell, G.A.C. (1998). Nitric Oxide in Arthritis. Free Radical Biology & Medicine, 24 (9), 1511-1519.
Jesus, C., Jesus, I. & Agius, M. (2016). Treatment of Depression in Patients with
Osteoarthritis: The importance of early diagnosis and the role of Duloxetine. Psychiatria Danubina, 28 (1), 149-153
Joint FAO/WHO Expert Committee on Food Additives (2002). Evaluation of certain
food additives. WHO Technical Report Series. Retrieved on August 10, 2017 from http://apps.who.int/iris/bitstream/10665/42601/1/WHO_TRS_913.pdf
Kanof, M.E., Smith, P.D. & Zola, H. (1996). Isolation of whole mononuclear cells from
peripheral blood and cord blood In Immunologic Studies in Humans. Current Protocols in Immunology. Supplement 19.
Kapoor, M., Pelletier, J.M., Lajeunesse, D., Pelletier, J.P. & Fahmi, H. (2011). Role of
Proinflammatory Cytokines in the Pathophysiology of Osteoarthritis. Nature Reviews Rheumatology, 7, 33-42.
108
Kim, M.J., Marchand, P., Henegar, C., Antignac, J.P.,Alili, R, Christine, P…Clement, K. (2011). Fate and Complex Pathogenic Effects of Dioxins and Polychlorinated Biphenyls in Obese Subjects before and after Drastic Weight Loss. Environmental Health Perspective, 119 (3), 377-383.
King, L.K., March, L. & Anandacoomarasamy, A. (2013). Obesity and Osteoarthritis.
Indian Journal of Medical Research, 138 (2), 185-193. Klengel, T., Pape, J., Binder, E.B. & Mehta, D. (2014). The role of DNA methylation in
stress-related psychiatric disorders, Neuropharmacology, 80, 115-132.
Kosonen, O., Kankaanranta, H., Vuorinen, P. & Moilanen, E. (1997). Inhibition of human lymphocytes proliferation by nitric oxide- releasing oxatriazole derivatives. European Journal of Pharmacology, 337 (1), 55-61.
Kraan, P.M. (2012). Age-dependent alteration of TGF-β signalling in osteoarthritis. Cell
and Tissue Research, 347 (1), 257-265.
Lane, N.E., Williams, E.N., Hung, Y.Y., Hochberg, M.C., Cummins, S.R. & Nevitt, M. (2003). Association of Nitrate use with risk of new radiographic features of hip osteoarthritis in elderly white women: The study of osteoporotic fractures. Arthritis and Rheumatism, 49 (6), 752-758.
Lee, D.H., Steffes, M. & Jacobs, D.R. (2007). Positive Associations of Serum
Concentration of Polychlorinated Biphenyls or Organochlorine Pesticides with Self-Reported Arthritis, Especially Rheumatoid Type, in Women. Environmental Health Perspectives, 115 (6), 883-888.
Leheita, O., Abed, NY. Younes, S. & Mahmoud, AZ. (2005). Lymphocytes subsets in
osteoarthritis versus rheumatoid arthritis. The Egyptian Journal of Immunology, 12 (2), 113-124.
Lin, Z., Willers, C., Xu, J. & Zheng, MH. (2006). The chondrocyte: biology and clinical
application. Tissue Engineering, 12 (7), 1971-1984. Loeser, R.F., Goldring, S.R., Scanzello, C.R. & Goldring (2012). Osteoarthritis: A
disease of the joint as an organ. Arthritis and Rheumatism, 64 (6), 1697-1707. Lundberg, J.O., Larsen, F.J. & Weitzberg, E. (2011). Supplementation with nitrate and
nitrite salts in exercise: A word of caution. Journal of Applied Physiology, 111 (2), 616-617.
Lundberg, J.O., Weitzberg, E. & Benjamin, N. (2004). Nitrate, bacteria, and human
health. Nature Reviews, 2, 593-602.

109
Lundberg, J.O, Weizberg, E & Gladwin, M.T (2008). The nitrate-nitrite-nitric oxide pathway in physiology and therapeutics. Nature Reviews, 7, 156-167.
Machha, A. & Schechter, A.N. (2001). Dietary nitrite and nitrate: a review of potential
mechanisms of cardiovascular benefits. European Nutritional Journal, 50, 293-303. Mackenzie, I.S., Rutherford, D. & MacDonald, T.M. (2008). Nitric oxide and
cardiovascular effects: New insights in the role of nitric oxide for the management of osteoarthritis. Arthritis Research & Therapy, 10(2),S3.
Martin, J.A. & Buckwalter, J.A. (2001). Roles of Articular Cartilage Aging and
Chondrocyte Senescence in the Pathogenesis of Osteoarthritis. The Iowa Orthopaedic Journal, 21, 1-7.
McElory, J.A., Dietz, A.T., Gangnon, R.E., Hampton, J.M., Bersch, A.J., Kanarek, M.S.
& Newcomb, P.A. (2008). Nitrogen-nitrate exposure from drinking water and colorectal cancer risk for rural women in Wisconsin. USA. Journal of Water and Health, 6(3), 399-409.
McLean, R.R., Jacques, P.F., Selhub, J., Tucker, K.L., Samelson, E.J., Broe, K.E…Kiel, D.P. (2004). Homocysteine as a Predictive Factor for Hip Fracture in Older Persons. The New England Journal of Medicine, 350, 2042-2049.
Mensinga, T.T., Speijers, G.J. & Meulenbelt, J. (2003). Health implications of exposure to environmental nitrogenous compounds. Toxicology Review, 22 (1), 41-51.
Messier, S.P., Mihalko, S.L., Legault, C., Miller, G.D., Nicklas, B.J., DeVita,
P…Loeser, R.F. (2013). Effects of Intensive Diet and Exercise on Knee Joint Loads, Inflammation, and Clinical Outcomes among Overweight and Obese Adults with Knee Osteoarthritis: The IDEA Randomized Clinical Trial. JAMA, 310 (12), 1263-1283.
Milder, T.Y., Williams, K.M., Ritchie, J.E., Lipworth, W.L. & Day, R.O. (2011). Use of
NSAIDs for osteoarthritis amongst older-aged primary care patients: engagement with information and perceptions of risk. Age and Ageing, 40 (2), 254-259.
Millán, M.M. & Castañeda, S. (2013). Estrogens, osteoarthritis, and inflammation. Joint
Bone Spine, 80 (4), 368-373. Millipore Sigma (2013). Muse Multi-Color DNA Damage Kit User’s Guide: Catalog
No. MCH200107. Darmstadt, Germany: Merck KGaA.

110
Moncada, S., Higgs, E. A., Hodson, H. F., Knowles, R. G., Lopez-Jaramillo, P., McCall, T…Schulz, R. (1991). The L-Arginine: Nitric Oxide Pathway. Journal of Cardiovascular Pharmacology, 17 (3), S1-S9.
Muramoto, J. (1999). Comparison of Nitrate content in leafy vegetables from organic
and conventional farms in California. Center for Agroecology and Sustainable Food Systems. Retrieved on September 9, 2016 from 31Thttp://www.agroecology.org/documents/Joji/leafnitrate.pdf
31TNaeim F., Rao P.N, Song S.X. & Grody W.W. (Eds.) (2013). Atlas of
Hematopathology. Oxford, UK: Academic Press. Negritto, M.C. (2010). Repairing Double-Strand Breaks. Nature Education, 3 (9), 26. Newbold, R.R. (2010). Impact of environmental endocrine disrupting chemicals
on the development of obesity. Hormones, 9 (3), 206-217. Ogawa, M., Matsuda, T., Ogata, A., Hamasake, T., Kumanogoh, A, Toyofuku, T &
Tanaka, T. (2013). DNA Damage in Rheumatoid Arthritis: An Age-Dependent Increase in the Lipid Peroxidation-Derived DNA Adduct, Heptanone-Etheno-2′-Deoxycytidine. Autoimmune Disease, 183487, 1-8.
Panda, S.K. & Ravindran, B. (2013). In vitro culture of Human PMBCs. Bio-Protocol, (3), 1-3.
Pastén-Zapata, E., Ledesma-Ruiz, R., Harter, T., Ramírez, A.I. & Mahlknecht, J. (2014). Assessment of sources and fate of nitrate in shallow groundwater of an
agricultural area by using a multi-tracer approach. Science of the Total Environment, 470, 855-864.
Paules, R.S., Innes, C.L., Sieber, S.O., Shackelford, R.E., Heinloth, A.N., Deming,
P.B…Kaufmann, W.K. (2001). ATM-dependent responses to DNA-damaging agents. Nature Genetics, 27, 78.
Pelletier, J.M. & Pelletier, J.P., (2007). Inflammatory factors involved in Osteoarthritis.
In J. Buckwater et al. (Eds), Osteoarthritis, Inflammation, and Degradation: A Continuum (3-13). Amsterdam, The Netherlands: IOS Press.
Pelletier, J.P., Pelletier, J.M. & Abramson, S.B. (2001). Osteoarthritis, an Inflammatory
Disease: Potential Implication for the Selection of New Therapeutic Targets. Arthritis and Rheumatism, 44 (6), 1237-1247.

111
Powlson, D.S., Addiscott, T.M., Benjamin, N., Cassman, K.G., Kok, T.M., Grinsven, H.V…Kessel, C.V. (2007). When Does Nitrate Become a Risk for Humans? Agronomy & Horticulture- Faculty Publications. Paper 102. 31Thttp://digitalcommons.unl.edu/agronomyfacpub/10231T
Puckett, L.J. (1994). Nonpoint and point sources of nitrogen in major watersheds of the United States. Water-Resources Investigation Report. Retrieved on April 1, 2016 from http://pubs.usgs.gov/wri/1994/4001/report.pdf
Ravindran, A.V., Griffiths, J., Merali, Z. & Anisman, H. (1995). Lymphocyte subsets
associated with major depression and dysthymia: modification by antidepressant treatment. Psychosomatic Medicine, 57 (6), 555-563.
Roman-Blas, J.A., Castañeda, S., Largo, R. & Herrero-Beaumont, G. (2009).
Osteoarthritis associated with estrogen deficiency. Arthritis Research and Therapy, 11, 241.
Santamaira, P. (2006). Nitrate in Vegetables: Toxicity, Content, Intake and EC Regulation. Journal of the Science of Food and Agriculture, 86, 10-17.
Sato, K., Ozaki, K., Oh, L., Meguro, A., Hatanaka, K., Nagai, T., Muroi, K. & O, K.
(2007). Nitric oxide plays a critical role in suppression of T-cell proliferation by mesenchymal stem cells. Immunobiology, 109 (1), 228-234.
Sawa, T. & Ohshima, H. (2006). Nitrative DNA damage in inflammation and its
possible role in carcinogenesis. Nitric Oxide, 14, 91-100.
Shao-ting, DU., Tong-song, Z. & Xian-Yong, L. (2007). Accumulation of Nitrate in vegetables and its possible implications to human health. Agricultural Science in China, 6 (10), 1246-1255.
Sharma, J. N., Al-Omran, A. & Parvathy, S.S. (2007). Role of nitric oxide in
inflammatory diseases. Inflammopharmacology, 15 (6), 252-259.
Skibsted, L.H. (2011). Nitric oxide and quality and safety of muscle based foods. Nitric Oxide, 24, 176-183.
Sokolove, J. & Lepus, C.M. (2013). Role of inflammation in the pathogenesis of
osteoarthritis: latest findings and interpretations. Therapeutic Advances in Musculoskeletal Disease, 5 (2), 77-94.
Spiro, T.G. & Stigliani, W.M. (2002). Chemistry of the Environments (2P
ndP Edition).
Upper Saddle River, NJ: Prentice Hall.

112
Sullivan, M.D., Bentley, S., Fan, M.Y. & Gardner, G. (2009). A Single-Blind, Placebo Run-in Study of Duloxetine for Activity-Limiting Osteoarthritis Pain, American Pain Society, 10 (2), 208-213.
Terkeltaub, R.A. (2007). Aging, Inflammation, and Altered Chrondrocyte Differentation
in Articular Cartilage Calcification and Osteoarthritis. In J. Buckwater et al. (Eds.). Osteoarthritis, Inflammation, and Degradation: A Continuum (31-41). Amsterdam, The Netherlands: IOS Press.
United States Department of Agriculture (USDA) (2003). Chapter 2: Profiling food consumption in America. Agriculture Fact Book 2001-2002 (pp 13-21). Retrieved on May 11, 2016 from 31Thttp://www.usda.gov/documents/usda-factbook-2001-2002.pdf
Unternaehrer, E., Luers, P., Mill, J., Dempster, E., Meyer, A.H., Staehli, …
Meinlschmidt, D.H. (2012). Translational Psychiatry, 2, 1-7.
Ustyugova, I.V., Zeman, C., Dhanwada, K. & Beltz, L.A. (2002). Nitrate/Nitrite alters human lymphocytes proliferation and cytokine production. Environmental Contamination and Toxicology, 43, 270-276.
Vuolteenaho, K., Moulanen, T., Knowles, R.G. & Moilanen, E. (2007). The role of
nitric oxide in osteoarthritis. Scandinavian Journal of Rheumatology, 36 (4), 247-258.
Wakida, F.T. & Lerner, D.N. (2005). Non-agricultural Sources of Groundwater Nitrate:
A Review and Case Study. Water Research, 39 (1), 3-16. Ward, M.H. (2008). Too much of a good thing? Nitrate from nitrogen fertilizers and
cancer. Reviews on Environmental Health, 24 (4), 357-363. Ward, M.H., Kilfoy, B.A., Weyer, P.J., Anderson, K.E., Folsom, A.R. & Cerhan, J.R.
(2010). Nitrate intake and the risk of thyroid cancer and thyroid disease. Epidemiology, 21 (3), 389-395.
Weitzberg, E., Hazel, M. & Lundberg, L.O. (2010). Nitrate-Nitrite-Nitric Oxide Pathway: Implications for Anesthesiology and Intensive Care. Anesthesiology, 113, 1460-1475.
Weitzberg, E. & Lundberg, L.O. (2013). Novel Aspects of Dietary Nitrate and Human Health. The Annual Review of Nutrition, 33, 129-159.
Weyer, P.J., Cerhan, J.R., Kross, B.C., Hallberg, G.R., Kantamneni, J., Breur, G…Lynch, C.F. (2001). Municipal Drinking Water Nitrate Level and Cancer Risk in Older Women: The Iowa Women’s Health Study. Epidemiology, 11 (3), 327-338.

113
Wimalawansa, S.J. (2010). Nitric oxide and Bone. Annals of the New York Academy of Sciences, 1192, 391-403.
World Health Organization (2011). Nitrate and Nitrite in Drinking Water. Retrieved on
May 5, 2016 from URL 31Thttp://www.who.int/water_sanitation_health/dwq/chemicals/Nitratenitrite.pdf
31TWorld Health Organization (2017). Evaluation of influenza vaccine effectiveness: a
guide to the design and interpretation of observational studies. Retrieved on March 18, 2018 from URL http://apps.who.int/iris/bitstream/10665/255203/1/9789241512121-eng.pdf
31TYaqoob, P. & Calder, P. (1998). Cytokine production by Human Peripheral Blood
Mononuclear Cells: Differential Sensitivity to Glutamine Availability. Cytokine, 10 (10), 790-794.
Zavodnik, I.B., Lapshina, E.A., Rekawiecka, K., Zavodnik, L.B., Bartosz,G. &
Bryszewska, M. (1999). Membrane effects of nitrite-induced oxidation of human red blood cells. Biochimica et Biophysica Acta (BBA) - Biomembranes, 1421 (2), 306-316.
Zeman, C., Beltz, L., Linda, M., Maddux, J., Depken, D., Orr, J. & Theran, P. (2011). New Questions and Insights into Nitrate/Nitrite and Human Health Effects: A Retrospective Cohort Study of Private Well Users’ Immunological and Wellness Status. Journal of Environmental Health, 74 (4), 8-18.
Zhang, Y., & Jordan, J.M. (2010). Epidemiology of Osteoarthritis. Clinics in Geriatric
Medicine, 26 (3), 355-369. Zhao, J., Guo, Z., Pei, S., Song, L., Wang, C, Jianxio, M… Zhang, H. (2017). pATM
and γH2AX are effective radiation biomarkers in assessing the radiosensitivity of 12C6+ in human tumor cells. Cancer Cell International, 17, 49.

114
APPENDIX A
RECRUITING PARTICIPANTS FOR IMMUNE SYSTEM STUDY

115
APPENDIX B
CONSENT TO ACT AS A SUBJECT IN AN EXPERIMENTAL STUDY
TITLE: On-going in-vitro pilot research in Immunotoxicology and non-cancer
endpoints.
INVESTIGATOR: Catherine Zeman, Ph.D., Professor, KAHHS
Office phone number: 273-7090
University of Northern Iowa
Junu Shrestha, M.S.
University of Northern Iowa
Phone number: 273-7099
INVITATION TO PARTICIPATE: You are invited to participate in a research project
conducted through the University of Northern Iowa, School of Kinesiology, Allied
Health and Human Services. The University requires that you give your signed
agreement to participate in this project. The following information is provided to help
you make an informed decision whether or not to participate.
NATURE AND PURPOSE: You have been asked to participate as a subject in an
investigation of the abilities of various compounds to alter human immune responses in
vitro (test-tube based study). Dr. Zeman will use your blood to test the toxicity of
various compounds on the human immune system in order to help determine
environmentally safe levels of these compounds. These substances include but are not
limited to the following: arsenic, nitrate, nitrite, Atrazine, and organic plastic derivatives
and precursors. These substances will be added to the blood in the laboratory after the
116
blood is withdrawn from the arm. You will not be exposed to the compounds. No other
tests will be conducted on the samples.
EXPLANATION OF PROCEDURES: By participating in this study, 15-20ml of blood
(2-8 teaspoons) will be collected from the vein at your elbow into a 30 ml syringe in a
session that will take approximately 10 minutes. Contact information will be maintained
and you will remain eligible and will be contacted by phone to donate blood on multiple
occasions for up to 4 years. You must give consent for each occasion. Participation is
entirely voluntary and can be refused at any time for any reason without penalty.
The blood taken from each donor will be used in its entirety within 4 hours of being
drawn and will not be stored after that time. During the procedures, samples will be
given a numeric identifier so that only Dr. Zeman will know the general demographics
but not the identity of the donor. Any white blood cells that are remaining after the
immune assays are set up will be autoclaved and thus destroyed.
DISCOMFORT AND RISKS: The only anticipated adverse effect is the minimal
discomfort associated with drawing blood or the causation of a bruise or clot
(hematoma). There is also a remote chance that you may grow light-headed but that the
blood-drawing will immediately cease if this were to occur. You will have told Dr.
Zeman that you have grown light-headed on previous donations.
BENEFITS: This research will not be of any direct benefit to you but will help scientists
determine how these compounds affect the immune response. You will receive a $10
Kwik Star Gas Card for your participation following a draw.

117
REFUSAL TO PARTICIPATE: Your participation is completely voluntary. You are
free to withdraw from participation at any time or to choose not to participate at all, and
that by doing so, you will not be penalized or lose benefits to which you are otherwise
entitled. Refusal to donate blood will not involve a penalty or loss of course credits.
CONFIDENTIALITY: Any information which will identify you will be treated as
confidential. While information from this study may be published in an academic
journal or presented at a scholarly conference, you will not be in any way personally
identified.
VOLUNTARY CONSENT: Dr. Zeman has explained all of this to you and has
answered all of your questions. Any future questions you have about this research will
be answered by Dr. Zeman, whom you may call at 273-7090 or write to at the School of
HPELS, The University of Northern Iowa, Cedar Falls, IA 50614. You may also contact
the office of the Human Subjects Coordinator, University of Northern Iowa, and (319)
273-6148, for answers to questions about the research and about the rights of research
subjects.
You are fully aware of the nature and extent of your participation in this project as stated
above and the possible risks arising from it. You hereby agree to participate in this
project. You acknowledge that you have received a copy of this consent statement. You
are 18 years of age or older.

118
_________________________________________________________________
(Signature of subject) (Date)
________________________________________
(Printed name of subject)
_________________________________________________________________
(Signature of investigator)
(Date)
INVESTIGATOR’S CERTIFICATION
I declare that I have personally explained the above information to the donor.
________________________ _______________________
(Investigator’s signature) (Date)

119
APPENDIX C
QUESTIONNAIRE
Environmental Health Sciences Lab Participant code: _____________
Name:
Email:
Phone Number:
Study Title: On-going in vitro pilot research in immunotoxicology and non-cancer
endpoints
Study Purpose: To study environmental toxins and their effect on the immune system
and non-cancer endpoints. These questions are important in understanding issues that
may be impacting your current immune system.
1. Age:
2. Gender:
3. Where do you currently live?
Cedar Falls
Waterloo
Hudson
Evansdale
Waverly
Other city? Please mention________________
DEMOGRAPHIC INFORMATION

120
4. Major drinking water source?
Private Wells City Water Others. Please explain_________________________________________
5. Have you had a major life change/loss in last six months? (Death of a loved-one, new job, job loss, marriage, etc.)
Yes No
6. Current Herbs or Supplements: (please list all meds, dosage and frequency)
A. B. C. D.
7. Current Prescribed Medication: (please list all meds, dosage and frequency) A. B. C. D.
8. Have you received an immunization in the last 4 weeks?
Yes
No
If yes, please explain
MEDICATION INFORMATION

121
9. Do you suffer from allergies?
Yes No
If yes please describe:
10. Do you smoke? Yes No
If yes how many per day: 11. Do you know your Blood Type? Yes No
If yes, then please indicate blood type_____________ 12. Do you become faint during blood draws?
Yes No
13. Any Diagnosed Immunological diseases?
14. Do you have Rheumatoid Arthritis?
Yes No
15. Have you been diagnosed with Osteoarthritis?
Yes No
16. Do you sometimes feel pain in your bone? If yes, please explain
HEALTH INFORMATION
122
17. Would you say you have “sweet-tooth”? 18. How many hours per day do you spend outside on good day? 19. Have you had cold or flu in last two weeks?

123
APPENDIX D
PROCEDURE FOR PREPARING CHEMICAL MIXTURES
D1: Make RPMIP
*P mixture
RPMIP
* Pmixture include RPMI 1640 with GlutaMAX and 100µl/1ml Pen Strep.
Calculation
100µl/1ml Pen Strep mean that we should add 100µl of Pen Strep in 1ml of RPMI 1640
Therefore, 1ml of RPMI 1640 should contain 100 µl of Pen Strep
500ml of RPMI 1640 should contain 100*500µl of Pen Strep
50000µl of Pen Strep
50ml pf Pen Strep
Finally, 500ml of RPMI 1640 should contain 50ml of Pen Strep
Method:
1. First take 500 ml of RPMI 1640 with GlutaMAX.
2. Now add 50ml of Pen Strep in 500 ml of RPMI 1640 with GlutaMAX.
3. Mix well.
4. Run the mixture through 0.2 PES Nalgene Filter Unit and store at 5-8P
0PC temperature
in a refrigerator.

124
D2: Make RPMI+ Mixture
RPMIP
+P include RPMI* and 10% of Fetal Bovine Serum (FBS)
Calculation:
10% of 40ml RPMI* mixture
Finally we have/ 10/100*40= 4ml of FBS
Method:
1. In a 50ml centrifuge tube, add 4ml of FBS and 36ml of RPMI*
2. This make 10% FBS solution in 40 ml of RPMI* which is finally called as RPMIP
+P
mixture
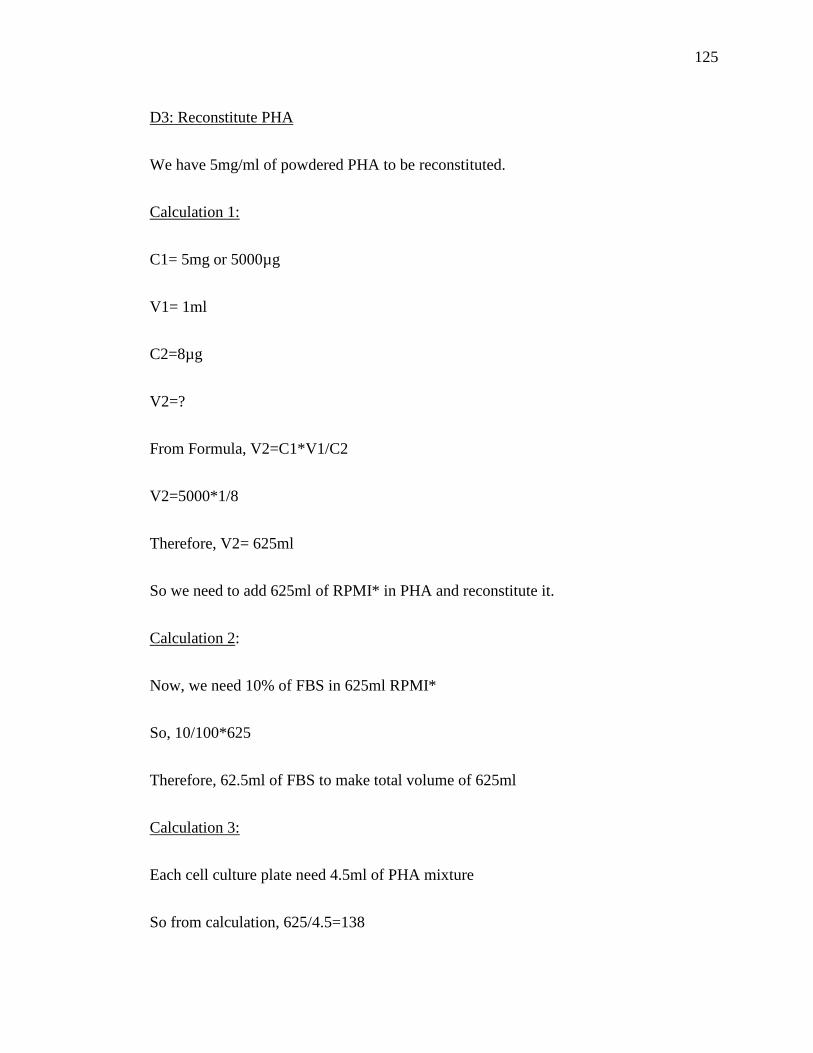
125
D3: Reconstitute PHA
We have 5mg/ml of powdered PHA to be reconstituted.
Calculation 1:
C1= 5mg or 5000µg
V1= 1ml
C2=8µg
V2=?
From Formula, V2=C1*V1/C2
V2=5000*1/8
Therefore, V2= 625ml
So we need to add 625ml of RPMI* in PHA and reconstitute it.
Calculation 2:
Now, we need 10% of FBS in 625ml RPMI*
So, 10/100*625
Therefore, 62.5ml of FBS to make total volume of 625ml
Calculation 3:
Each cell culture plate need 4.5ml of PHA mixture
So from calculation, 625/4.5=138
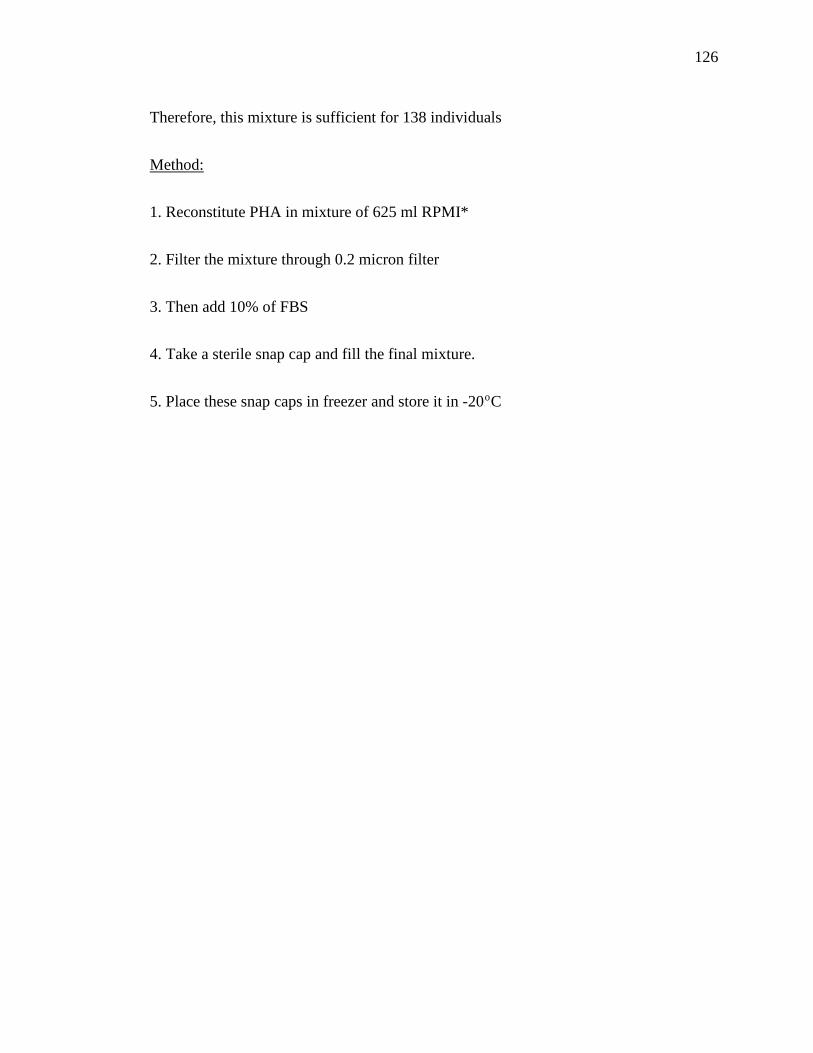
126
Therefore, this mixture is sufficient for 138 individuals
Method:
1. Reconstitute PHA in mixture of 625 ml RPMI*
2. Filter the mixture through 0.2 micron filter
3. Then add 10% of FBS
4. Take a sterile snap cap and fill the final mixture.
5. Place these snap caps in freezer and store it in -20P
oPC
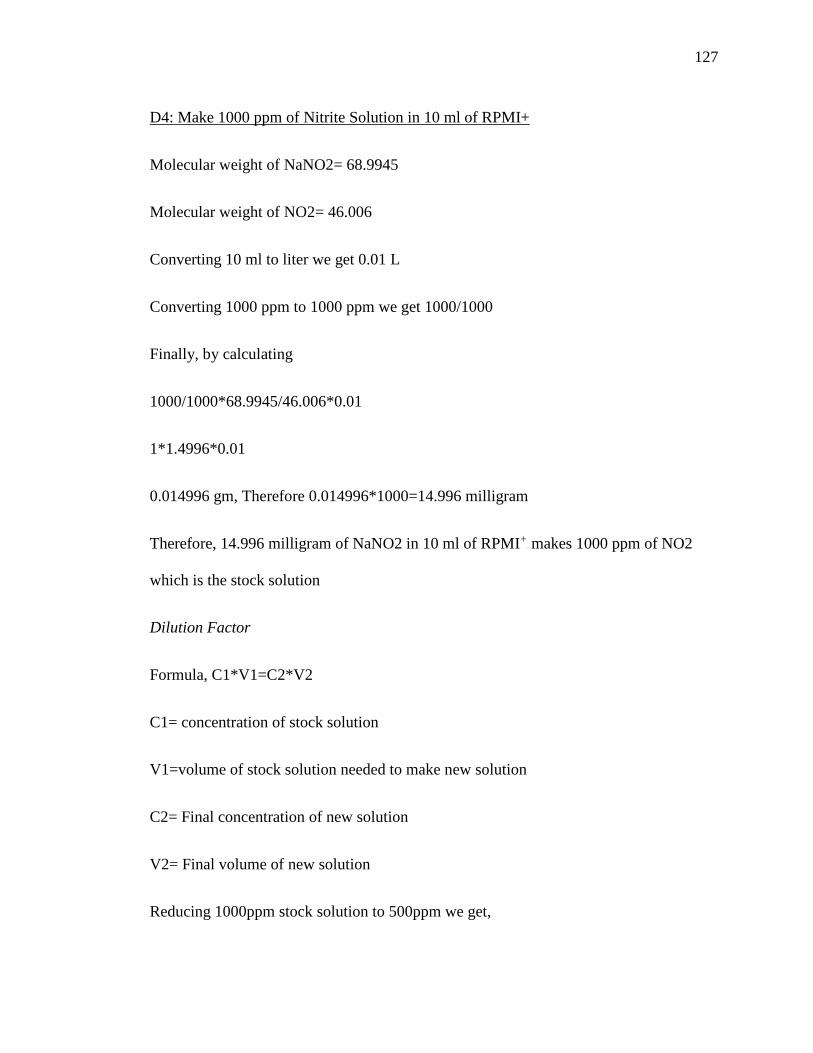
127
D4: Make 1000 ppm of Nitrite Solution in 10 ml of RPMI+
Molecular weight of NaNO2= 68.9945
Molecular weight of NO2= 46.006
Converting 10 ml to liter we get 0.01 L
Converting 1000 ppm to 1000 ppm we get 1000/1000
Finally, by calculating
1000/1000*68.9945/46.006*0.01
1*1.4996*0.01
0.014996 gm, Therefore 0.014996*1000=14.996 milligram
Therefore, 14.996 milligram of NaNO2 in 10 ml of RPMIP
+P makes 1000 ppm of NO2
which is the stock solution
Dilution Factor
Formula, C1*V1=C2*V2
C1= concentration of stock solution
V1=volume of stock solution needed to make new solution
C2= Final concentration of new solution
V2= Final volume of new solution
Reducing 1000ppm stock solution to 500ppm we get,
128
C1= 1000ppm
V1=?
C2= 500ppm
V2= 5ml
Now from Formula, C1*V1=C2*V2
V1= 500*5/1000= 2.5ml
Take a sterile tube and put 2.5ml of stock solution. Then add 2.5ml of RPMI+ in the
tube. This will be the final solution that we will use for further dilution.
Method:
1. Weigh 14.996 milligram of NaNO2 and dilute in 10 ml of RPMIP
+
2. Run the mixture through 0.2 micron Syringe Filter and store in sterilized container or
tube.
3. Dilute this stock solution into desired concentrations.
4. Since sodium nitrite is not stable, very small amount of solution will be made.

129
60 ppm from
500ppm solution in
1.5ml RPMI+
500*V1=60*1.5
V1=60*1.5/500 = 0.18 ml (converting gives 180µl)
Therefore, take 180µl from stock solution and then add 1320µl
RPMIP
+P to make final volume of 1.5ml
40 ppm from
500ppm solution in
1.5ml RPMI+
500*V1=40*1.5
V1= 40*1.5/500 = 0.12 ml (converting gives 120µl)
Therefore, take 120µl from stock solution and then add 1380µl
RPMIP
+P to make final volume of 1.5ml
20 ppm from
500ppm solution in
1.5ml RPMI+
500*V1=20*1.5
V1=20*1.5/500=0.06 ml (converting gives 60µl)
Therefore, take 60µl from stock solution and then add 1440µl
RPMIP
+P to make final volume of 1.5ml
4 ppm from 500ppm
solution in 1.5ml
RPMI+
500*V1=4*1.5
V1=4*1.5/500=0.012 ml (converting gives 12µl)
Therefore, take 12µl from stock solution and then add 1488µl
RPMI to make final volume of 1.5ml

130
APPENDIX E
PREPARATION OF HUMAN MONONUCLEAR CELL POPULATIONS AND
SUBPOPULATIONS
1. In order to successfully complete this entire protocol we will need to obtain 4
green top tubes of blood from OA and non-OA volunteers with a goal of 16 from
each group or 32 overall.
2. Sterilize all necessary glassware and equipment and have ready before blood is
delivered. Sterilize the hood with alcohol (Isopropanol) and UV light. Wipe
down the top of the hood and cabinet tops to control any dusts. Wipe down the
top of the hood with IPA. Make sure to run fan at least 15 minutes on high prior
to beginning, then turn down to low.
3. Place 15ml of fresh heparinized blood into 50ml conical centrifuge tubes using
sterile pipet (utilizing the entire 15 ml of each blood sample).
4. Add 15ml of room temperature PBS using sterile pipet and mix well.
5. Slowly layer the Ficoll-Hypaque solution underneath the blood/PBS mixture by
placing the tip of the pipet containing the Ficoll-Hypaque at the bottom of the
sample tube. Use 3ml of Ficoll-Hypaque per 10ml blood/PBS mixture (10ml for
30 ml of blood/PBS mixture). It is helpful to hold the centrifuge tube at a 45P
oP
angle. Make sure pipettes are sterile.
6. Create counter-weight tubes with balance and lab sterile RO water. Offset the
blood with the RO water counter-balances. Centrifuge 45 minutes at 1300rpm,
with no brake, at room temperature 20P
oPC.
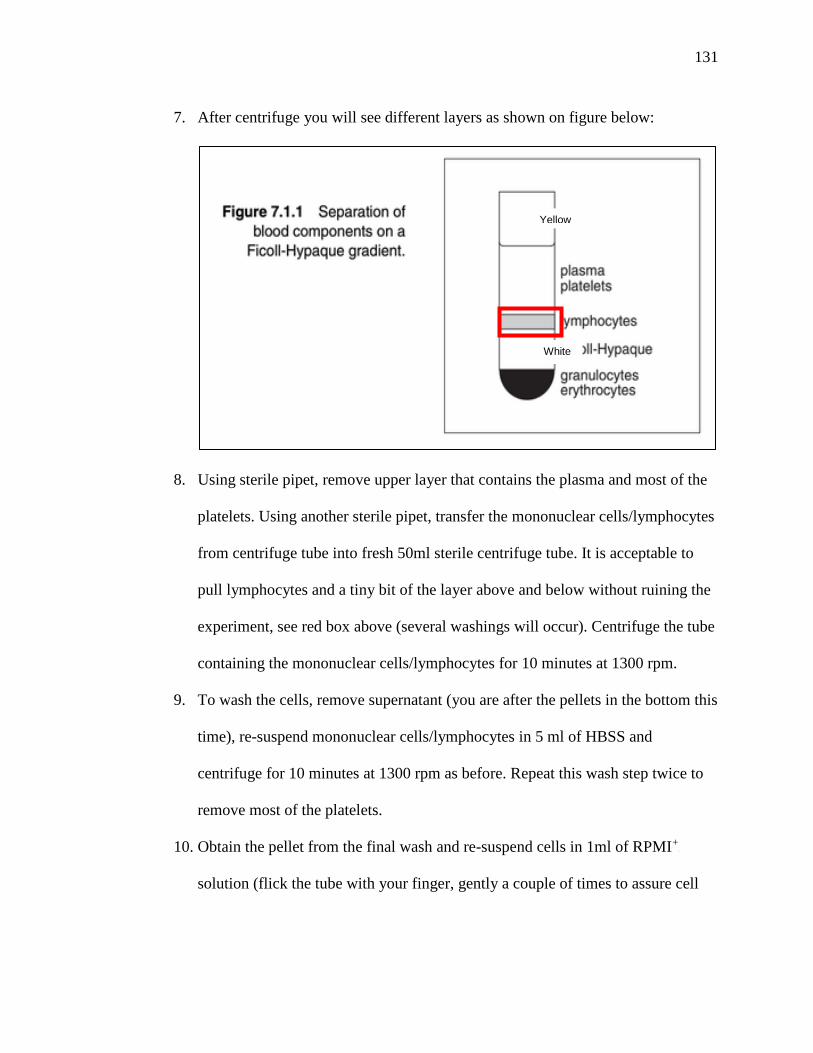
131
7. After centrifuge you will see different layers as shown on figure below:
8. Using sterile pipet, remove upper layer that contains the plasma and most of the
platelets. Using another sterile pipet, transfer the mononuclear cells/lymphocytes
from centrifuge tube into fresh 50ml sterile centrifuge tube. It is acceptable to
pull lymphocytes and a tiny bit of the layer above and below without ruining the
experiment, see red box above (several washings will occur). Centrifuge the tube
containing the mononuclear cells/lymphocytes for 10 minutes at 1300 rpm.
9. To wash the cells, remove supernatant (you are after the pellets in the bottom this
time), re-suspend mononuclear cells/lymphocytes in 5 ml of HBSS and
centrifuge for 10 minutes at 1300 rpm as before. Repeat this wash step twice to
remove most of the platelets.
10. Obtain the pellet from the final wash and re-suspend cells in 1ml of RPMIP
+P
solution (flick the tube with your finger, gently a couple of times to assure cell
Yellow
White

132
dispersion). So assume that you have a cell recovery concentration at this point
of 1.5x10P
7 Pcells/ml. (concentrated from the subject’s whole blood).
11. Refer to the MUSE Count & Viability Kit User’s Guide. Use the bottom range
value on page 4 table: Cell Suspension Dilution Table (recommended volumes).
Using the Muse Procedure, Count cells using MUSE Unit and determine count
and viability.
12. Depending on the viable cell concentration, dilute the cells to the cell
experimental concentration of: 4x10P
6Pcells/ml with RPMIP
+P (RPMI *+10% FBS).
Add 50ul of cells to each experimental well on the culture plates under each
experimental condition (CYT, Stress, Counts). Control wells only receive
RPMIP
+P, 150ul per well and the 50ul of cells. The next steps involve challenging
all experimental wells (except control) with the agent of concern (in this case
Sodium Nitrite). This will be followed by adding PHA to the stimulated wells
(bottom half) of each experimental condition/plate (CYT, Stress, Counts).
13. In the experimental challenge wells, proceed to challenge all wells/cells (across
all three experimental plates) with various sodium nitrite concentrations of 0
(RPMI + cells only), 1, 5, 10, and 15 ppm. Sodium nitrite will be added for a
total of 50ul per well and must be at 4x the desired final concentration [due to
dilution in the other cell well constituents]. Thus, our final desired exposure
levels are 0 [RPMI and cells only], 1, 5, 10, and 15 (multiply by 4).
133
14. Now add 100 ul of 5mg/ml PHA to the designated, “STIMULATED”
wells/cells of each plate (the bottom 3 experimental wells across all challenge
conditions, across all of the experimental plates).
15. In summary re-suspended mononuclear cells in RPMIP
+P (RPMI 1640 with
pen/strep and 10% BFCS, heat inactivated) will be at a final total volume in all
wells of 200ul/well and will be incubated at 35P
oPC, 5% CO2. Therefore,
importantly, when the plates are ready for incubation all plates will contain 200ul
by volume or be “topped” off to that volume. Please note that the relative
amounts of constituents added to each well differ, depending on the experimental
condition [challenge] state and the stimulated or non-stimulated state. However,
the final volume of the experimental cell/well is 200ul, thus:
Control, Non-Stimulated: 50ul cells + 150ul RPMIP
+P = 200ul
Control Stimulated, 50ul cells + 100ul PHA at 8ugm/ml +50ul of RPMIP
+P = 200ul
NS, Challenged, 1,5,10, and 15ppm Sodium Nitrite, 50ul cells +50ul Sodium Nitrate
(at appropriate concentration) + 100ul RPMIP
+P= 200µl
Stimulate, Challenged, 1,5,10, and 15ppm Sodium Nitrite, 50ul cells + 50ul Sodium
Nitrate (at appropriate concentration) + 100ul PHA at 8 ugm/ml = 200ul
16. After 48 hours on incubation the stress tissue culture plates will be used for
DNA Damage Test, Nitric Oxide Test using MUSE Unit (see Appendix F).
17. After 96 hours of incubation, counts and viability tissue culture plate will be used
for Counts and Viability Test using MUSE Unit. Prior to running the test, well plate

134
should be placed under the tissue culture microscope on the highest magnification
setting and a picture of the cell/well color and cellular constituents obtained for all
non-stimulate and stimulate conditions along with dosed and undosed one. Save this
picture by participant ID number and cell ID.
18. Refer to the Muse methodologies for detailed procedures for completing the
Counts and Viability tests.
19. Finally enter the findings from Stress and Counts into the experimental data
base.
20. Clean the lab and deal with all biological waste per established, general
laboratory procedures. The laboratory must be kept clean and uncluttered at all
times!
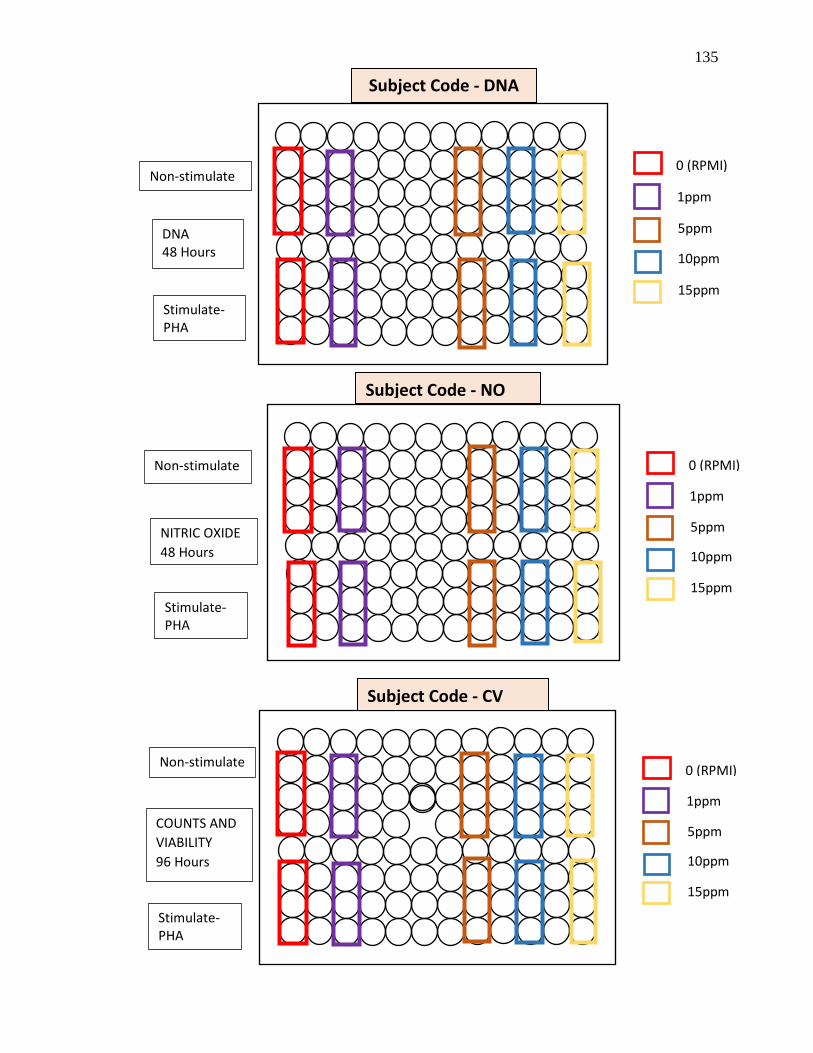
135
DNA 48 Hours
Subject Code - DNA
0 (RPMI)
1ppm
5ppm
10ppm
15ppm
Non-stimulate
Stimulate- PHA
0 (RPMI)
1ppm
5ppm
10ppm
15ppm
NITRIC OXIDE 48 Hours
Subject Code - NO
Non-stimulate
Stimulate- PHA
Non-stimulate 0 (RPMI)
1ppm
5ppm
10ppm
15ppm
COUNTS AND VIABILITY 96 Hours
Subject Code - CV
Stimulate- PHA

136
APPENDIX F
DNA MULTI COLOR DNA DAMAGE TEST SAMPLE PREPARATION
1. This method is for 100,000 cells
2. Prepare 1X Assay Buffer Solution from 5X Assay Buffer solution that has been
provided. So if you want to make 15 ml of 1X Assay Buffer Solution, you have
to take 3ml 5X Assay Buffer solution and add 12 ml deionized water to make
total volume of 15ml. You can store this solution for one year inside refrigerator.
3. Spin down cells at 1890 RPM for 5 minutes and discard supernatant
4. Add 50 µl 1X Assay Buffer Solution to cell sample
5. Add 50 µl Fixation Buffer to the cell solution
6. Incubate for 10 minutes on ice
7. Spin down cells at 1890 RPM for 5 minutes and discard supernatant
8. Add 100 µl Ice cold 1X Permeabilization Buffer
9. Incubate for 10 minutes on ice
10. Spin down cells at 1890 RPM for 5 minutes and discard supernatant
11. Re-suspend 90 µl 1X Assay Buffer Solution
12. Incubate cell testing samples for 30 minutes in dark room temperature
13. Add 100 µl 1X Assay Buffer Solution
14. Spin down cells at 1890 RPM for 5 minutes and discard supernatant
15. Re-suspend cells in each micro centrifuge tube with 200 µl of 1X Assay Buffer
Solution
16. Use muse unit and follow instruction

137
APPENDIX G
NITRIC OXIDE TEST SAMPLE PREPARATION
1. Prepare Nitric Oxide Reagent Working Solution: For 10 test, mix 1 µl Nitric
Oxide Reagent with 999 µl 1X Assay Buffer
2. Prepare 7-AAD Working Solution: For 10 Test, mix 20 µl 7-AAD Stock
Solution with 880 µl 1X Assay Buffer
3. Add 10 µl Cell Suspension in each micro centrifuge tube
4. Add 100 µl Nitric Oxide Reagent Working Solution to each tube and mix
thoroughly
5. Incubate samples for 30 minutes in the 35P
oPC incubator with 5% CO2.
6. After incubation, add 90 µl of 7-AAD Working Solution to each tube and mix
thoroughly
7. Incubate at room temperature for 5 minutes, protected from light.
8. Use muse unit and follow instruction

138
APPENDIX H
ASEPTIC TECHNIQUE FOR THE LABORATORY WORK
1. Wear Personal Protective Equipment (PPE) such as Lab coat, sterile gloves, head
cap, and mask before starting laboratory work.
2. Wipe the hood thoroughly with ethanol (70% v/v) and Kim wipes.
3. Further sterilize the hood by UV light for about 30 minutes.
4. Wipe all equipment necessary for laboratory work with ethanol (70% v/v) such
as pipet aid, biohazard waste can, test tube holder and so on.
5. Place all equipment inside the hood.
6. During laboratory work if any new glassware or equipment is needed then first
wipe it with ethanol before placing inside the hood.

139
APPENDIX I
STATISTICAL ANALYSIS
I1: Bivariate Fit of Lymphocyte proliferation, NO activity, and DNA damage at Various nitrite concentrations by Age
Experiment on
Mononuclear Cells
Nitrite Concentrations
0 ppm 1 ppm 5 ppm 10 ppm 15 ppm
Lymphocyte Proliferation
RSquare 0.002 0.013 0.00561 0.085367 0.008897 F Ratio 0.0735 0.4114 0.1692 2.8 0.2693 Prob > F 0.7881 0.5261 0.1348 0.1047 0.6076 Prob>|t| 0.2049 0.0672 0.1348 0.006 0.0807
NO activity with Live Cells
RSquare 0.056574 0.004607 0.125372 0.020761 0.013925 F Ratio 1.3792 0.1203 3.2969 0.5936 0.3813 Prob > F 0.2522 0.7315 0.0825 0.4475 0.5421 Prob>|t| 0.1209 0.5779 0.2713 0.9935 0.926
NO activity with Dead Cells
RSquare 0.160658 0.001095 0.121455 0.027885 0.08214 F Ratio 2.6797 0.0154 2.2119 0.4876 1.4319 Prob > F 0.1239 0.9031 0.1564 0.4944 0.2489 Prob>|t| 0.0803 0.7328 0.3297 0.3037 0.1815
NO activity Total Cells
RSquare 0.115548 0.00361 0.216822 0.012407 0.018578 F Ratio 3.7887 0.1051 6.9212 0.3643 0.549 Prob > F 0.0613 0.7481 0.0144*(I) 0.5508 0.4647 Prob>|t| 0.0228 (D) 0.5376 0.093 0.8452 0.9277
pATM Activated Cells
RSquare 0.000858 0.006248 0.030815 0.001973 0.089908 F Ratio 0.0172 0.1006 0.5087 0.0395 1.6794 Prob > F 0.8971 0.7552 0.486 0.8444 0.2123 Prob>|t| 0.6498 0.5178 0.8653 0.5682 0.4382
PH2A.X Activated Cells
RSquare 9.45E-06 0.063532 0.172769 0.000465 0.027697 F Ratio 0.0002 1.4925 5.0125 0.0102 0.6552 Prob > F 0.9892 0.2348 0.034*(D) 0.9203 0.4266 Prob>|t| 0.7583 0.0916 0.011 0.624 0.6982
DNA Double-strand Break
RSquare 0.007326 0.043183 0.006611 0.005504 0.01453 F Ratio 0.1919 1.0832 0.1597 0.1439 0.3686 Prob > F 0.665 0.3084 0.693 0.7075 0.5492 Prob>|t| 0.2805 0.1512 0.3319 0.8999 0.8772
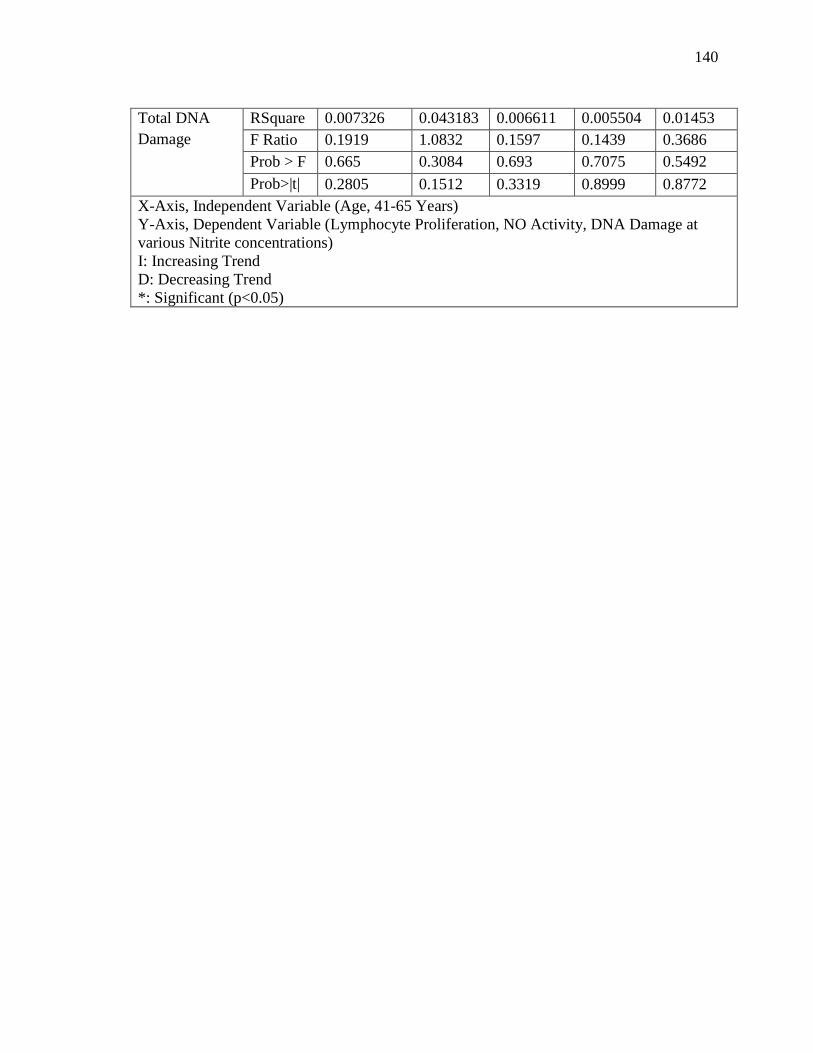
140
Total DNA Damage
RSquare 0.007326 0.043183 0.006611 0.005504 0.01453 F Ratio 0.1919 1.0832 0.1597 0.1439 0.3686 Prob > F 0.665 0.3084 0.693 0.7075 0.5492 Prob>|t| 0.2805 0.1512 0.3319 0.8999 0.8772
X-Axis, Independent Variable (Age, 41-65 Years) Y-Axis, Dependent Variable (Lymphocyte Proliferation, NO Activity, DNA Damage at various Nitrite concentrations) I: Increasing Trend D: Decreasing Trend *: Significant (p<0.05)
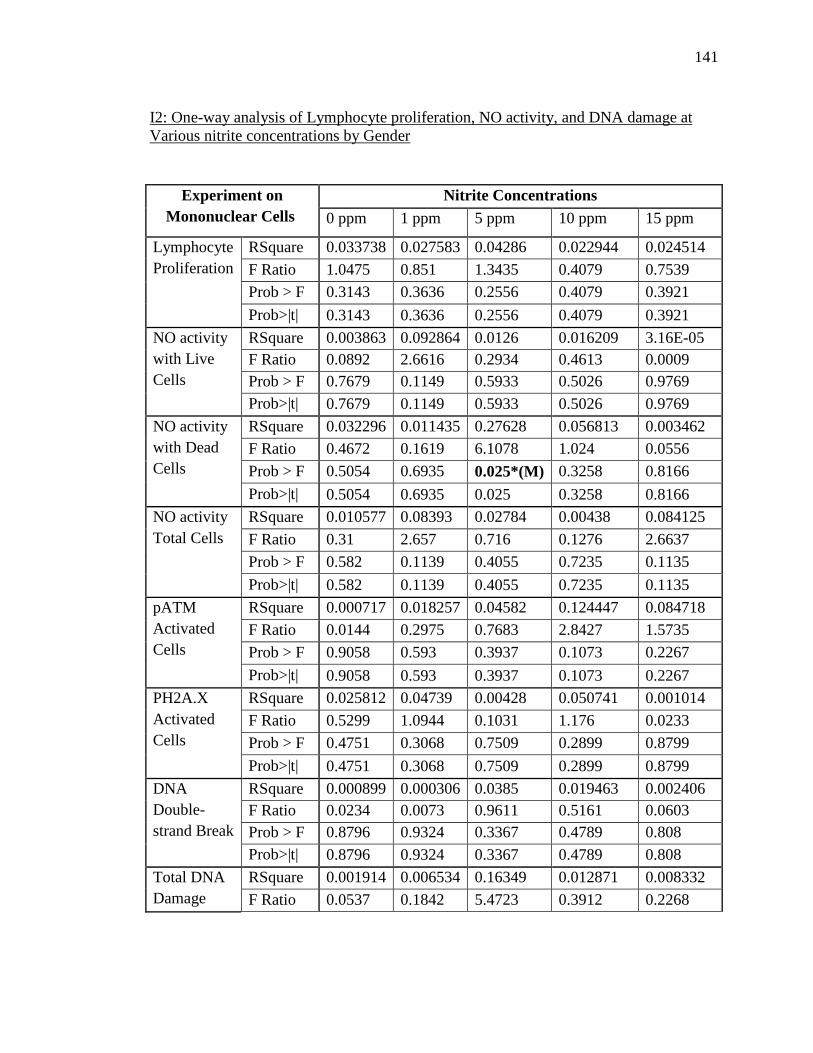
141
I2: One-way analysis of Lymphocyte proliferation, NO activity, and DNA damage at Various nitrite concentrations by Gender
Experiment on Mononuclear Cells
Nitrite Concentrations 0 ppm 1 ppm 5 ppm 10 ppm 15 ppm
Lymphocyte Proliferation
RSquare 0.033738 0.027583 0.04286 0.022944 0.024514 F Ratio 1.0475 0.851 1.3435 0.4079 0.7539 Prob > F 0.3143 0.3636 0.2556 0.4079 0.3921 Prob>|t| 0.3143 0.3636 0.2556 0.4079 0.3921
NO activity with Live Cells
RSquare 0.003863 0.092864 0.0126 0.016209 3.16E-05 F Ratio 0.0892 2.6616 0.2934 0.4613 0.0009 Prob > F 0.7679 0.1149 0.5933 0.5026 0.9769 Prob>|t| 0.7679 0.1149 0.5933 0.5026 0.9769
NO activity with Dead Cells
RSquare 0.032296 0.011435 0.27628 0.056813 0.003462 F Ratio 0.4672 0.1619 6.1078 1.024 0.0556 Prob > F 0.5054 0.6935 0.025*(M) 0.3258 0.8166 Prob>|t| 0.5054 0.6935 0.025 0.3258 0.8166
NO activity Total Cells
RSquare 0.010577 0.08393 0.02784 0.00438 0.084125 F Ratio 0.31 2.657 0.716 0.1276 2.6637 Prob > F 0.582 0.1139 0.4055 0.7235 0.1135 Prob>|t| 0.582 0.1139 0.4055 0.7235 0.1135
pATM Activated Cells
RSquare 0.000717 0.018257 0.04582 0.124447 0.084718 F Ratio 0.0144 0.2975 0.7683 2.8427 1.5735 Prob > F 0.9058 0.593 0.3937 0.1073 0.2267 Prob>|t| 0.9058 0.593 0.3937 0.1073 0.2267
PH2A.X Activated Cells
RSquare 0.025812 0.04739 0.00428 0.050741 0.001014 F Ratio 0.5299 1.0944 0.1031 1.176 0.0233 Prob > F 0.4751 0.3068 0.7509 0.2899 0.8799 Prob>|t| 0.4751 0.3068 0.7509 0.2899 0.8799
DNA Double-strand Break
RSquare 0.000899 0.000306 0.0385 0.019463 0.002406 F Ratio 0.0234 0.0073 0.9611 0.5161 0.0603 Prob > F 0.8796 0.9324 0.3367 0.4789 0.808 Prob>|t| 0.8796 0.9324 0.3367 0.4789 0.808
Total DNA Damage
RSquare 0.001914 0.006534 0.16349 0.012871 0.008332 F Ratio 0.0537 0.1842 5.4723 0.3912 0.2268
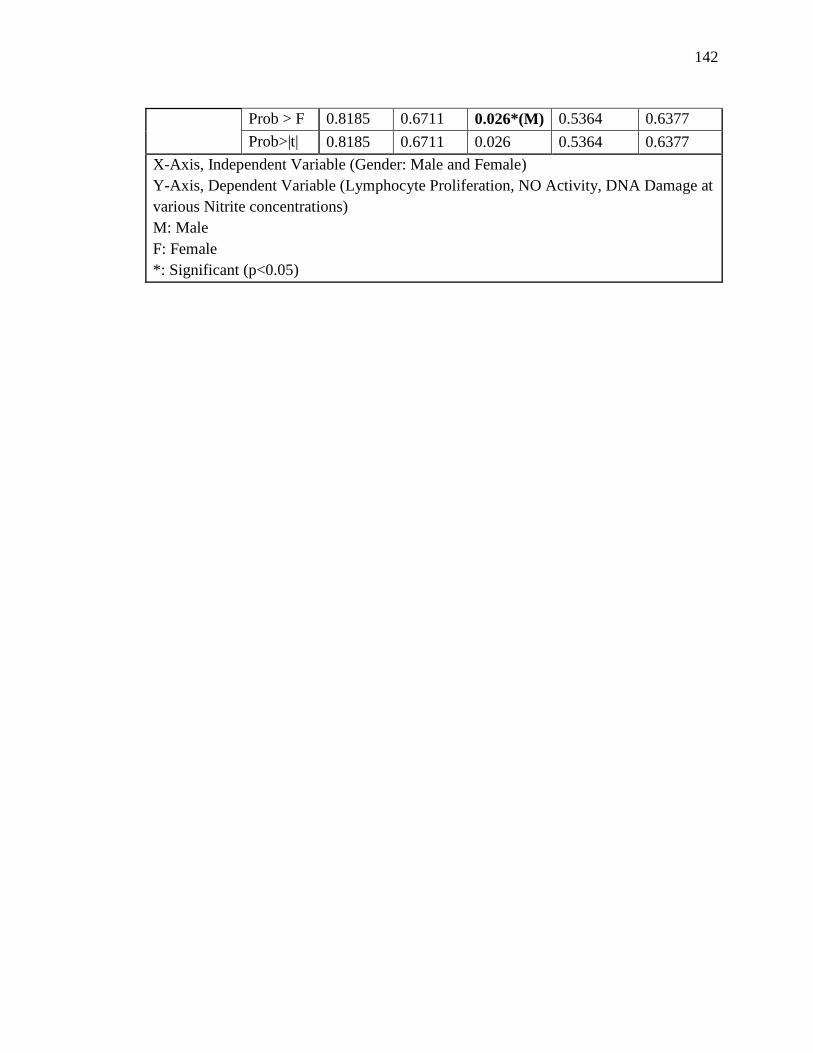
142
Prob > F 0.8185 0.6711 0.026*(M) 0.5364 0.6377 Prob>|t| 0.8185 0.6711 0.026 0.5364 0.6377
X-Axis, Independent Variable (Gender: Male and Female) Y-Axis, Dependent Variable (Lymphocyte Proliferation, NO Activity, DNA Damage at various Nitrite concentrations) M: Male F: Female *: Significant (p<0.05)
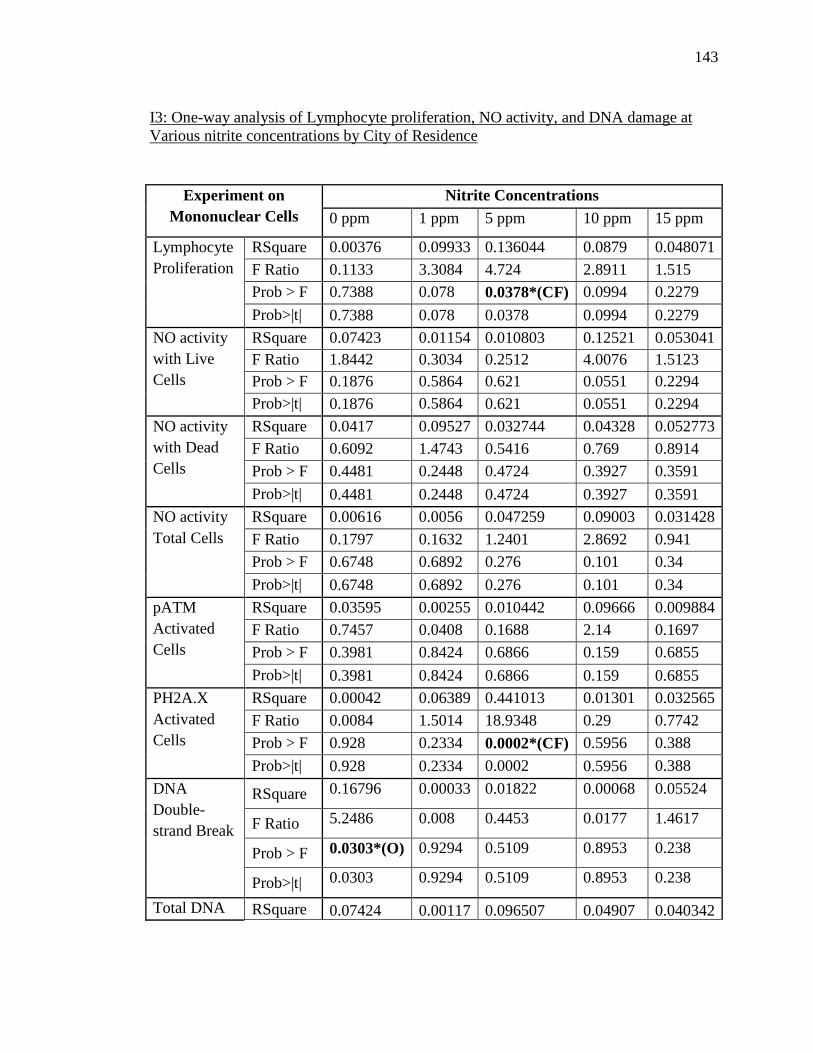
143
I3: One-way analysis of Lymphocyte proliferation, NO activity, and DNA damage at Various nitrite concentrations by City of Residence
Experiment on Mononuclear Cells
Nitrite Concentrations 0 ppm 1 ppm 5 ppm 10 ppm 15 ppm
Lymphocyte Proliferation
RSquare 0.00376 0.09933 0.136044 0.0879 0.048071 F Ratio 0.1133 3.3084 4.724 2.8911 1.515 Prob > F 0.7388 0.078 0.0378*(CF) 0.0994 0.2279 Prob>|t| 0.7388 0.078 0.0378 0.0994 0.2279
NO activity with Live Cells
RSquare 0.07423 0.01154 0.010803 0.12521 0.053041 F Ratio 1.8442 0.3034 0.2512 4.0076 1.5123 Prob > F 0.1876 0.5864 0.621 0.0551 0.2294 Prob>|t| 0.1876 0.5864 0.621 0.0551 0.2294
NO activity with Dead Cells
RSquare 0.0417 0.09527 0.032744 0.04328 0.052773 F Ratio 0.6092 1.4743 0.5416 0.769 0.8914 Prob > F 0.4481 0.2448 0.4724 0.3927 0.3591 Prob>|t| 0.4481 0.2448 0.4724 0.3927 0.3591
NO activity Total Cells
RSquare 0.00616 0.0056 0.047259 0.09003 0.031428 F Ratio 0.1797 0.1632 1.2401 2.8692 0.941 Prob > F 0.6748 0.6892 0.276 0.101 0.34 Prob>|t| 0.6748 0.6892 0.276 0.101 0.34
pATM Activated Cells
RSquare 0.03595 0.00255 0.010442 0.09666 0.009884 F Ratio 0.7457 0.0408 0.1688 2.14 0.1697 Prob > F 0.3981 0.8424 0.6866 0.159 0.6855 Prob>|t| 0.3981 0.8424 0.6866 0.159 0.6855
PH2A.X Activated Cells
RSquare 0.00042 0.06389 0.441013 0.01301 0.032565 F Ratio 0.0084 1.5014 18.9348 0.29 0.7742 Prob > F 0.928 0.2334 0.0002*(CF) 0.5956 0.388 Prob>|t| 0.928 0.2334 0.0002 0.5956 0.388
DNA Double-strand Break
RSquare 0.16796 0.00033 0.01822 0.00068 0.05524
F Ratio 5.2486 0.008 0.4453 0.0177 1.4617
Prob > F 0.0303*(O) 0.9294 0.5109 0.8953 0.238
Prob>|t| 0.0303 0.9294 0.5109 0.8953 0.238
Total DNA RSquare 0.07424 0.00117 0.096507 0.04907 0.040342

144
Damage F Ratio 2.2455 0.0328 2.9908 1.548 1.135 Prob > F 0.1452 0.8575 0.0947 0.2231 0.2961 Prob>|t| 0.1452 0.8575 0.0947 0.2231 0.2961
X-Axis, Independent Variable (City of Residence; Cedar Falls, Others) Y-Axis, Dependent Variable (Lymphocyte Proliferation, NO Activity, DNA Damage at various Nitrite concentrations) CF: Cedar Falls O: Others *: Significant (p<0.05)

145
I4: One-way analysis of Lymphocyte proliferation, NO activity, and DNA damage at Various nitrite concentrations by Drinking Water Source
Experiment on Mononuclear Cells
Nitrite Concentrations 0 ppm 1 ppm 5 ppm 10 ppm 15 ppm
Lymphocyte Proliferation
RSquare 0.080961 0.065789 0.012864 0.029057 0.152178 F Ratio 0.8222 0.6573 0.1216 0.2793 1.6753 Prob > F 0.4927 0.5852 0.9466 0.8398 0.1949 Prob>|t| 0.4927 0.5852 0.9466 0.8398 0.1949
NO activity with Live Cells
RSquare 0.128338 0.08402 0.080961 0.063908 0.030562 F Ratio 1.0306 0.7338 0.3042 0.5917 0.2627 Prob > F 0.3992 0.5421 0.4871 0.626 0.8516 Prob>|t| 0.3992 0.5421 0.4871 0.626 0.8516
NO activity with Dead Cells
RSquare 0.067091 0.068575 0.080775 0.01362 0.075065 F Ratio 0.2877 0.2945 0.4101 0.1105 0.3787 Prob > F 0.8334 0.8287 0.7483 0.8961 0.7698 Prob>|t| 0.8334 0.8287 0.7483 0.8961 0.7698
NO activity Total Cells
RSquare 0.048313 0.08478 0.038166 0.08071 0.051299 F Ratio 0.4569 0.8337 0.3042 0.7902 0.4867 Prob > F 0.7146 0.4871 0.822 0.51 0.6944 Prob>|t| 0.7146 0.4871 0.822 0.51 0.6944
pATM Activated Cells
RSquare 0.03696 0.03599 0.071919 0.097806 0.012174 F Ratio 0.2303 0.28 0.3616 0.6505 0.0986 Prob > F 0.8741 0.7596 0.7817 0.5929 0.9067 Prob>|t| 0.8741 0.7596 0.7817 0.5929 0.9067
PH2A.X Activated Cells
RSquare 0.145137 0.01615 0.072816 0.115144 0.098647 F Ratio 1.6129 0.1724 0.9031 1.3663 1.2039 Prob > F 0.2254 0.8429 0.4192 0.2768 0.319 Prob>|t| 0.2254 0.8429 0.4192 0.2768 0.319
DNA Double-strand Break
RSquare 0.048693 0.048632 0.209768 0.054566 0.072475 F Ratio 0.4095 0.5879 1.9466 0.4617 0.5991 Prob > F 0.7476 0.5637 0.1516 0.7116 0.6221 Prob>|t| 0.7476 0.5637 0.1516 0.7116 0.6221
Total DNA Damage
RSquare 0.063821 0.043323 0.070286 0.019954 0.039366 F Ratio 0.5908 0.3925 0.6552 0.19 0.3415

146
Prob > F 0.6266 0.7594 0.587 0.9023 0.7955 Prob>|t| 0.6266 0.7594 0.587 0.9023 0.7955
X-Axis, Independent Variable (Drinking Water Source; Private Water, City Water, City Water with RO, Bottled Water) Y-Axis, Dependent Variable (Lymphocyte Proliferation, NO Activity, DNA Damage at various Nitrite concentrations)

147
I5:One-way analysis of Lymphocyte proliferation, NO activity, and DNA damage at Various nitrite concentrations by Major Life Changing Events
Experiment on Mononuclear Cells
Nitrite Concentrations 0 ppm 1 ppm 5 ppm 10 ppm 15 ppm
Lymphocyte Proliferation
RSquare 0.004385 0.009119 0.00208 0.107465 5.78E-06 F Ratio 0.1321 0.2761 0.0625 3.6121 0.0002 Prob > F 0.7188 0.6031 0.8043 0.067 0.9896 Prob>|t| 0.7188 0.6031 0.8043 0.067 0.9896
NO activity with Live Cells
RSquare 0.325242 0.011565 0.6626 0.080357 0.145797 F Ratio 11.0863 0.3042 0.6626 2.4466 4.6084 Prob > F 0.0029*(Y) 0.586 0.424 0.129 0.041*(Y) Prob>|t| 0.0029 0.586 0.424 0.129 0.0410
NO activity with Dead Cells
RSquare 0.257242 5.02E-05 0.11938 0.489805 0.002689 F Ratio 4.8487 0.0007 2.169 16.3206 0.0431 Prob > F 0.0449*(Y) 0.9792 0.1602 0.0009*(Y) 0.8381 Prob>|t| 0.0449 0.9792 0.1602 0.0009 0.8381
NO activity Total Cells
RSquare 0.463633 0.016064 0.04784 0.143671 0.001354 F Ratio 25.0674 0.4735 1.256 4.8655 0.0393 Prob > F <.0001*(Y) 0.4969 0.2731 0.035*(Y) 0.8442 Prob>|t| <.0001 0.4969 0.2731 0.035 0.8442
pATM Activated Cells
RSquare 0.178988 0.00061 0.03704 4.42E-07 0.062386 F Ratio 4.3602 0.0098 0.6155 0 1.1311 Prob > F 0.0498*(Y) 0.9225 0.4442 0.9977 0.3024 Prob>|t| 0.0498 0.9225 0.4442 0.9977 0.3024
PH2A.X Activated Cells
RSquare 0.6626 0.133114 0.03512 0.033952 0.4969 F Ratio 1.256 3.3782 0.8737 0.7732 2.169 Prob > F 0.825 0.0796 0.3593 0.3887 0.424 Prob>|t| 0.825 0.0796 0.3593 0.3887 0.424
DNA Double-strand Break
RSquare 0.001915 0.211065 0.0164 0.021859 0.000237 F Ratio 0.0499 6.4208 0.4002 0.581 0.0059 Prob > F 0.825 0.018*(Y) 0.533 0.4528 0.9392 Prob>|t| 0.825 0.018 0.533 0.4528 0.9392
Total DNA Damage
RSquare 2.99E-05 0.055943 0.00183 0.115144 0.006759 F Ratio 0.0008 1.6592 0.0514 3.9038 0.1837
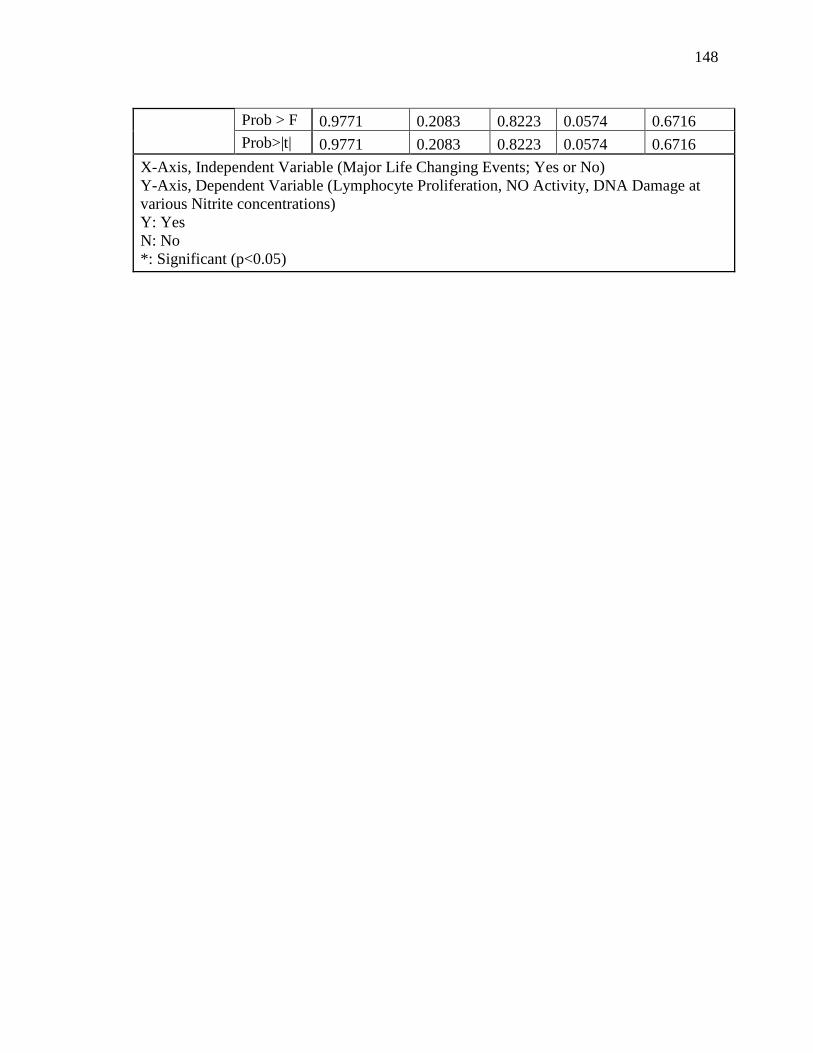
148
Prob > F 0.9771 0.2083 0.8223 0.0574 0.6716 Prob>|t| 0.9771 0.2083 0.8223 0.0574 0.6716
X-Axis, Independent Variable (Major Life Changing Events; Yes or No) Y-Axis, Dependent Variable (Lymphocyte Proliferation, NO Activity, DNA Damage at various Nitrite concentrations) Y: Yes N: No *: Significant (p<0.05)

149
I6: Bivariate Fit of Lymphocyte proliferation, NO activity, and DNA damage at Various nitrite concentrations by No. of Supplements
Experiment on Mononuclear Cells
Nitrite Concentrations 0 ppm 1 ppm 5 ppm 10 ppm 15 ppm
Lymphocyte Proliferation
RSquare 0.029 0.02746 0.0516 0.00028 0.00484 F Ratio 0.7079 0.6494 1.2524 0.0064 0.1119 Prob > F 0.4088 0.4286 0.2747 0.9371 0.7411 Prob>|t| <.0001 <.0001 <.0001 <.0001 <.0001
NO activity with Live Cells
RSquare 0.09485 0.02554 0.000581 0.20112 0.144772 F Ratio 1.7815 0.5243 0.0099 5.5384 3.5548 Prob > F 0.1996 0.4774 0.922 0.02*(D) 0.073 Prob>|t| 0.002 0.0073 0.0425 <.0001 0.0007
NO activity with Dead Cells
RSquare 3.70E-07 0.00311 0.232615 0.03323 0.00021 F Ratio 0 0.0312 3.3344 0.4812 0.0028 Prob > F 0.9985 0.8634 0.0951 0.4992 0.9585 Prob>|t| 0.1891 0.3202 0.01 0.0276 0.3563
NO activity Total Cells
RSquare 0.16386 0.01468 0.023742 0.14863 0.03755 F Ratio 4.3114 0.3277 0.4621 4.0151 0.8975 Prob > F 0.049*(D) 0.5728 0.5049 0.057 0.3533 Prob>|t| <.0001 0.0036 0.0018 <.0001 0.0002
pATM Activated Cells
RSquare 0.02732 0.10195 0.000567 0.37529 0.03939 F Ratio 0.4213 1.2488 0.0057 9.011 0.5332 Prob > F 0.5261 0.2876 0.9414 0.008*(D) 0.4782 Prob>|t| 0.0243 0.0371 0.0345 0.0003 0.0088
PH2A.X Activated Cells
RSquare 0.03362 0.02856 0.009184 0.05003 0.00020 F Ratio 0.5218 0.4997 0.1761 0.9479 0.0036 Prob > F 0.4812 0.4892 0.6794 0.3432 0.9527 Prob>|t| 0.0308 0.0411 0.0183 0.0043 0.0168
DNA Double-strand Break
RSquare 0.02482 0.12964 0.0079 0.0024 0.05391 F Ratio 0.5599 2.6812 0.1513 0.048 1.1398 Prob > F 0.4622 0.1189 0.7016 0.8288 0.2984 Prob>|t| 0.0032 0.0013 0.0055 0.0125 0.0891
Total DNA Damage
RSquare 0.00375 0.09599 0.001752 0.00093 0.02269 F Ratio 0.0865 2.3361 0.0386 0.0214 0.5108

150
Prob > F 0.7714 0.1407 0.846 0.8849 0.4823 Prob>|t| 0.0046 <.0001 0.0003 0.0192 0.2752
X-Axis, Independent Variable (No. of Supplements; No Answer, 0 to 7) Y-Axis, Dependent Variable (Lymphocyte Proliferation, NO Activity, DNA Damage at various Nitrite concentrations) I: Increasing Trend D: Decreasing Trend *: Significant (p<0.05)

151
I7: Bivariate Fit of Lymphocyte proliferation, NO activity, and DNA damage at Various nitrite concentrations by No. of Medication
Experiment on Mononuclear Cells
Nitrite Concentrations 0 ppm 1 ppm 5 ppm 10 ppm 15 ppm
Lymphocyte Proliferation
RSquare 0.016011 0.033126 0.117222 0.015421 0.182214 F Ratio 0.4068 0.8565 3.3197 0.3916 5.5704 Prob > F 0.5294 0.3636 0.0804 0.5371 0.026*(D) Prob>|t| <.0001 <.0001 <.0001 <.0001 0.026
NO activity with Live Cells
RSquare 0.014041 0.037839 0.014617 0.014545 0.005489 F Ratio 0.2706 0.8259 0.2967 0.3395 0.1214 Prob > F 0.6089 0.3738 0.592 0.5658 0.7308 Prob>|t| 0.0376 0.6066 0.0034 0.0034 0.0376
NO activity with Dead Cells
RSquare 0.011334 0.06807 0.021118 0.061561 0.099643 F Ratio 0.1376 0.8765 0.2805 0.984 1.328 Prob > F 0.7172 0.3676 0.6053 0.337 0.2716 Prob>|t| 0.1822 0.2712 0.0234 0.2783 0.0978
NO activity Total Cells
RSquare 0.000143 0.030439 0.024573 0.01549 0.051038 F Ratio 0.0034 0.7535 0.529 0.3776 1.2908 Prob > F 0.9537 0.394 0.475 0.5447 0.2671 Prob>|t| 0.0645 0.4118 0.0003 0.0023 <.0001
pATM Activated Cells
RSquare 0.09367 0.024027 0.002422 0.101772 0.003271 F Ratio 1.6536 0.32 0.0267 1.6995 0.0459 Prob > F 0.2168 0.5812 0.8731 0.212 0.8334 Prob>|t| 0.1689 0.0659 0.0213 0.0085 0.0307
PH2A.X Activated Cells
RSquare 0.001059 0.067809 0.075063 0.048771 0.004474 F Ratio 0.017 1.3094 1.6231 0.9229 0.0854 Prob > F 0.898 0.2675 0.2173 0.3494 0.7733 Prob>|t| 0.0416 0.0024 0.0483 0.0039 0.0066
DNA Double-strand Break
RSquare 0.118778 0.066763 0.144308 0.025427 0.216371 F Ratio 2.9653 1.4308 3.3729 0.574 5.7984 Prob > F 0.0991 0.2456 0.0812 0.4567 0.025*(I) Prob>|t| <.0001 0.0010 <.0001 0.0224 0.1452
Total DNA Damage
RSquare 0.038795 0.227069 0.00069 0.012556 0.029141 F Ratio 0.9687 7.0507 0.0159 0.3179 0.6904
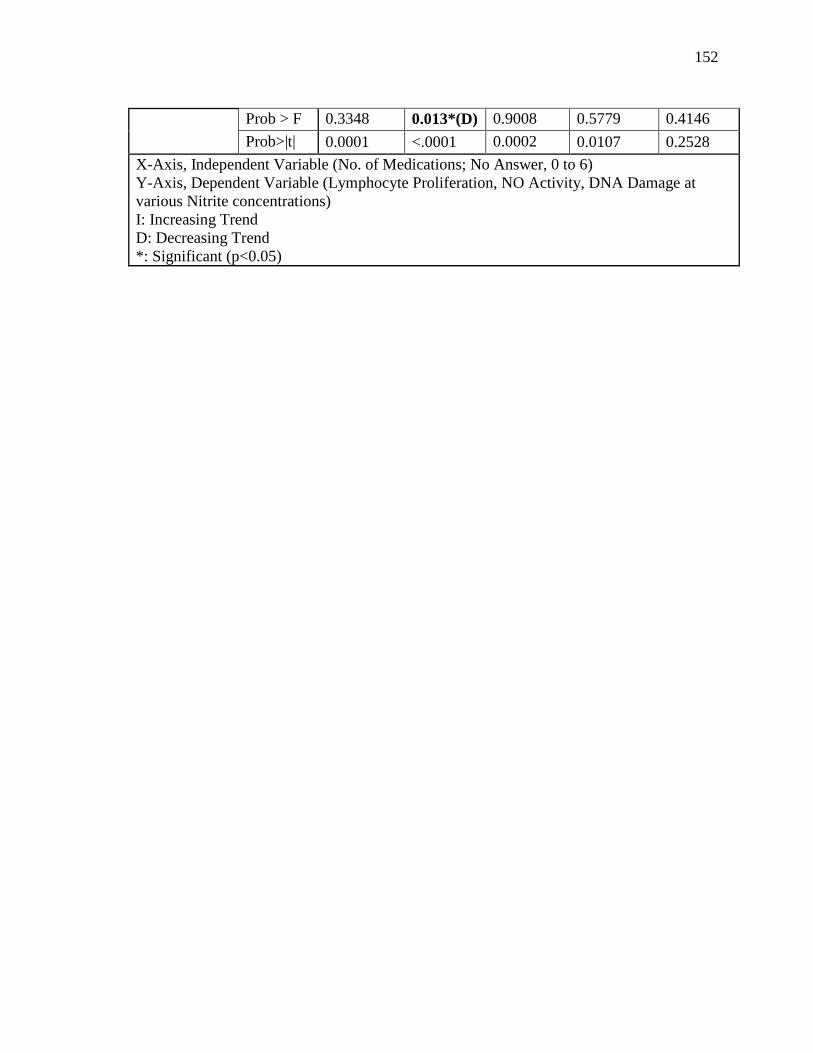
152
Prob > F 0.3348 0.013*(D) 0.9008 0.5779 0.4146 Prob>|t| 0.0001 <.0001 0.0002 0.0107 0.2528
X-Axis, Independent Variable (No. of Medications; No Answer, 0 to 6) Y-Axis, Dependent Variable (Lymphocyte Proliferation, NO Activity, DNA Damage at various Nitrite concentrations) I: Increasing Trend D: Decreasing Trend *: Significant (p<0.05)

153
I8:One-way analysis of Lymphocyte proliferation, NO activity, and DNA damage at Various nitrite concentrations by Allergies
Experiment on Mononuclear Cells
Nitrite Concentrations 0 ppm 1 ppm 5 ppm 10 ppm 15 ppm
Lymphocyte Proliferation
RSquare 0.005004 0.084541 0.01442 0.034835 0.095211 F Ratio 0.1509 2.7705 0.4389 1.0828 3.1569 Prob > F 0.7004 0.1064 0.5127 0.3064 0.0857 Prob>|t| 0.7004 0.1064 0.5127 0.3064 0.0857
NO activity with Live Cells
RSquare 0.054381 0.041845 0.04774 0.039683 0.023205 F Ratio 1.3227 1.1355 1.1532 1.157 0.6414 Prob > F 0.2619 0.2964 0.294 0.2913 0.4302 Prob>|t| 0.2619 0.2964 0.294 0.2913 0.4302
NO activity with Dead Cells
RSquare 0.026544 0.01951 0.32518 0.174445 0.027289 F Ratio 0.3818 0.2786 7.7099 3.5922 0.4489 Prob > F 0.5466 0.6059 0.0135*(N) 0.075 (Y) 0.5124 Prob>|t| 0.5466 0.6059 0.0135 0.075 (Y) 0.5124
NO activity Total Cells
RSquare 0.000817 0.034887 0.05656 0.086951 0.003444 F Ratio 0.0237 1.0483 1.4986 2.7617 0.1002 Prob > F 0.8787 0.3144 0.2323 0.1073 0.7538 Prob>|t| 0.8787 0.3144 0.2323 0.1073 0.7538
pATM Activated Cells
RSquare 0.002886 0.037271 0.02079 0.062703 0.088113 F Ratio 0.0579 0.6194 0.3396 1.338 1.6427 Prob > F 0.8123 0.4428 0.5682 0.261 0.2172 Prob>|t| 0.8123 0.4428 0.5682 0.261 0.2172
PH2A.X Activated Cells
RSquare 3.27E-05 1.29E-07 0.09716 0.006132 0.011094 F Ratio 0.0007 0 2.5827 0.1357 0.258 Prob > F 0.9799 0.9987 0.1211 0.7161 0.6163 Prob>|t| 0.9799 0.9987 0.1211 0.7161 0.6163
DNA Double-strand Break
RSquare 0.000272 0.02825 0.01658 0.003985 0.054804 F Ratio 0.0071 0.6977 0.4047 0.104 1.4495 Prob > F 0.9336 0.4118 0.5307 0.7496 0.2399 Prob>|t| 0.9336 0.4118 0.5307 0.7496 0.2399
Total DNA Damage
RSquare 0.005711 0.00445 0.04648 0.072864 0.024692 F Ratio 0.1608 0.1252 1.3648 2.3577 0.6836

154
Prob > F 0.6914 0.7261 0.2526 0.1351 0.4156 Prob>|t| 0.6914 0.7261 0.2526 0.1351 0.4156
X-Axis, Independent Variable (Allergies; Yes or No) Y-Axis, Dependent Variable (Lymphocyte Proliferation, NO Activity, DNA Damage at various Nitrite concentrations) Y: Yes N: No *: Significant (p<0.05)
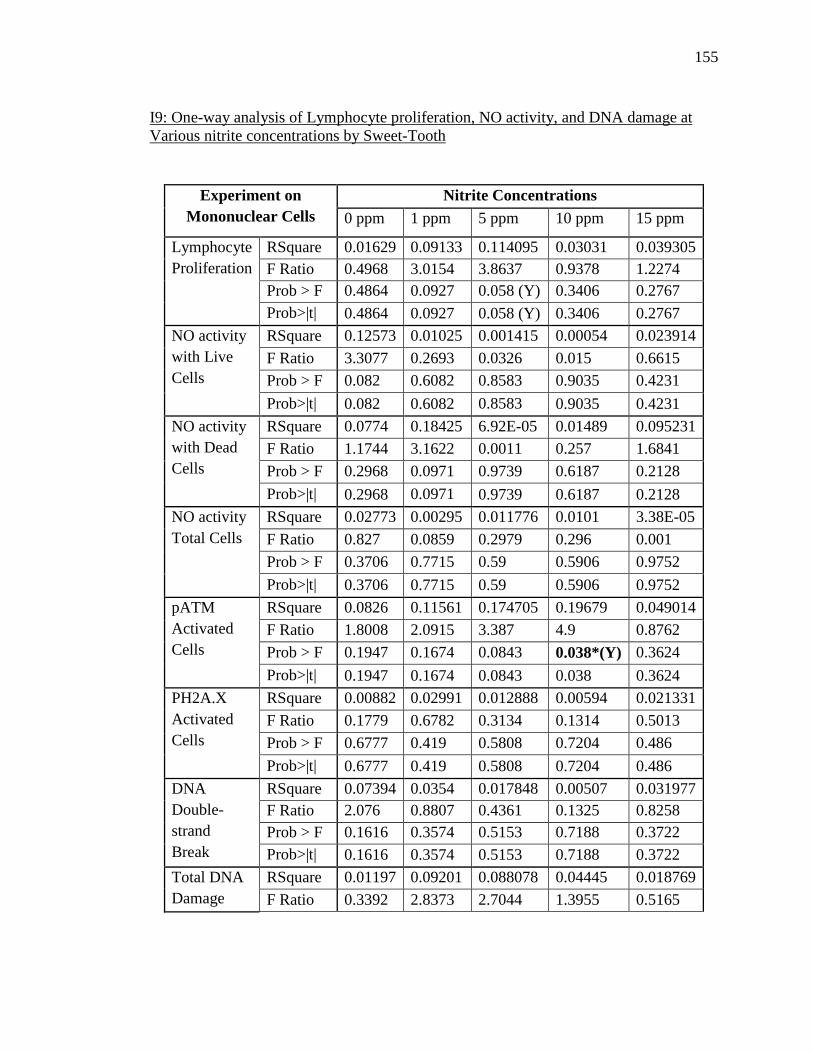
155
I9: One-way analysis of Lymphocyte proliferation, NO activity, and DNA damage at Various nitrite concentrations by Sweet-Tooth
Experiment on Mononuclear Cells
Nitrite Concentrations 0 ppm 1 ppm 5 ppm 10 ppm 15 ppm
Lymphocyte Proliferation
RSquare 0.01629 0.09133 0.114095 0.03031 0.039305 F Ratio 0.4968 3.0154 3.8637 0.9378 1.2274 Prob > F 0.4864 0.0927 0.058 (Y) 0.3406 0.2767 Prob>|t| 0.4864 0.0927 0.058 (Y) 0.3406 0.2767
NO activity with Live Cells
RSquare 0.12573 0.01025 0.001415 0.00054 0.023914 F Ratio 3.3077 0.2693 0.0326 0.015 0.6615 Prob > F 0.082 0.6082 0.8583 0.9035 0.4231 Prob>|t| 0.082 0.6082 0.8583 0.9035 0.4231
NO activity with Dead Cells
RSquare 0.0774 0.18425 6.92E-05 0.01489 0.095231 F Ratio 1.1744 3.1622 0.0011 0.257 1.6841 Prob > F 0.2968 0.0971 0.9739 0.6187 0.2128 Prob>|t| 0.2968 0.0971 0.9739 0.6187 0.2128
NO activity Total Cells
RSquare 0.02773 0.00295 0.011776 0.0101 3.38E-05 F Ratio 0.827 0.0859 0.2979 0.296 0.001 Prob > F 0.3706 0.7715 0.59 0.5906 0.9752 Prob>|t| 0.3706 0.7715 0.59 0.5906 0.9752
pATM Activated Cells
RSquare 0.0826 0.11561 0.174705 0.19679 0.049014 F Ratio 1.8008 2.0915 3.387 4.9 0.8762 Prob > F 0.1947 0.1674 0.0843 0.038*(Y) 0.3624 Prob>|t| 0.1947 0.1674 0.0843 0.038 0.3624
PH2A.X Activated Cells
RSquare 0.00882 0.02991 0.012888 0.00594 0.021331 F Ratio 0.1779 0.6782 0.3134 0.1314 0.5013 Prob > F 0.6777 0.419 0.5808 0.7204 0.486 Prob>|t| 0.6777 0.419 0.5808 0.7204 0.486
DNA Double-strand Break
RSquare 0.07394 0.0354 0.017848 0.00507 0.031977 F Ratio 2.076 0.8807 0.4361 0.1325 0.8258 Prob > F 0.1616 0.3574 0.5153 0.7188 0.3722 Prob>|t| 0.1616 0.3574 0.5153 0.7188 0.3722
Total DNA Damage
RSquare 0.01197 0.09201 0.088078 0.04445 0.018769 F Ratio 0.3392 2.8373 2.7044 1.3955 0.5165
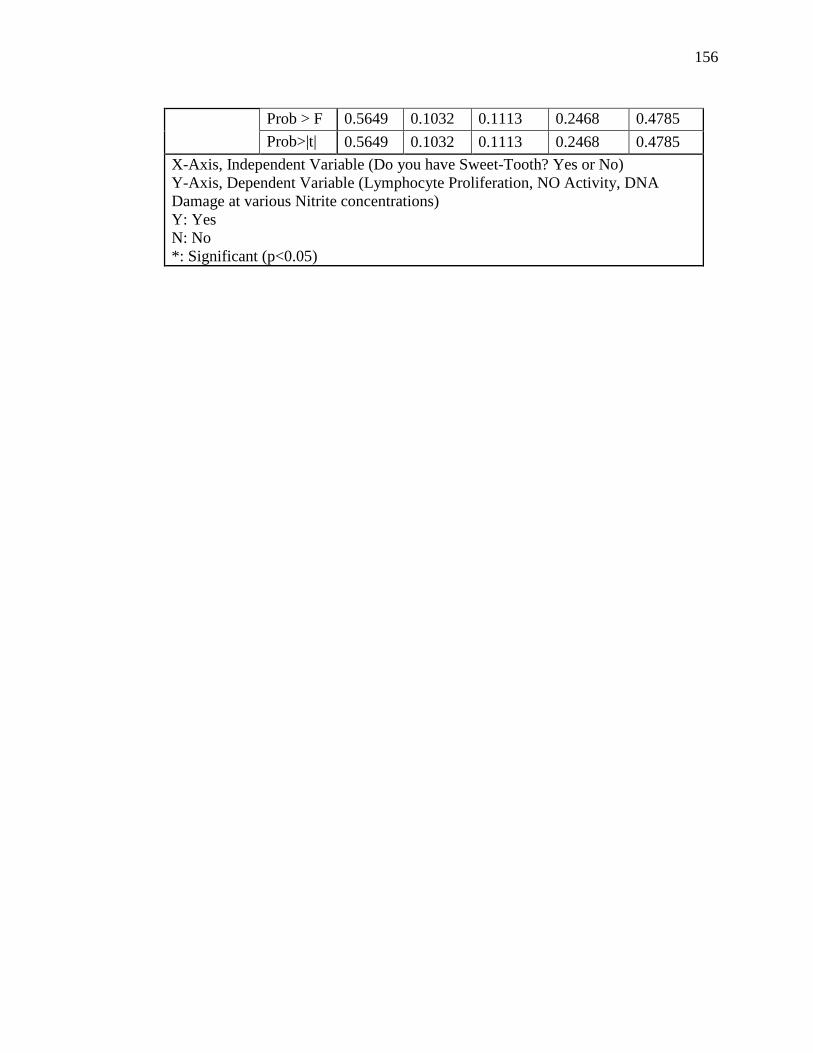
156
Prob > F 0.5649 0.1032 0.1113 0.2468 0.4785 Prob>|t| 0.5649 0.1032 0.1113 0.2468 0.4785
X-Axis, Independent Variable (Do you have Sweet-Tooth? Yes or No) Y-Axis, Dependent Variable (Lymphocyte Proliferation, NO Activity, DNA Damage at various Nitrite concentrations) Y: Yes N: No *: Significant (p<0.05)

157
I10: Bivariate Fit of Lymphocyte proliferation, NO activity, and DNA damage at Various nitrite concentrations by Hours spent outside in a good day
Experiment on Mononuclear Cells
Nitrite Concentrations 0 ppm 1 ppm 5 ppm 10 ppm 15 ppm
Lymphocyte Proliferation
RSquare 0.082852 0.000621 0.000672 0.004451 0.0002 F Ratio 2.6198 0.018 0.0195 0.1297 0.0058 Prob > F 0.1164 0.8941 0.8899 0.7214 0.9398 Prob>|t| <.0001 <.0001 <.0001 <.0001 <.0001
NO activity with Live Cells
RSquare 0.048693 0.020735 0.000857 0.043698 0.104719 F Ratio 1.1261 0.5293 0.0189 1.2338 3.0412 Prob > F 0.3001 0.4736 0.892 0.2765 0.093 Prob>|t| 0.0151 0.1377 0.0166 0.0002 0.0008
NO activity with Dead Cells
RSquare 0.04029 0.053914 0.00741 0.036025 0.205551 F Ratio 0.5877 0.7978 0.112 0.5979 3.881 Prob > F 0.456 0.3868 0.7425 0.4506 0.0676 Prob>|t| 0.1145 0.8335 0.0562 0.0250 0.5316
NO activity Total Cells
RSquare 0.026476 0.017055 0.024139 0.026599 0.000152 F Ratio 0.7615 0.4858 0.5937 0.7651 0.0043 Prob > F 0.3903 0.4915 0.4485 0.3892 0.9484 Prob>|t| 0.0151 0.0768 0.0010 0.0002 0.0012
pATM Activated Cells
RSquare 0.002266 0.043784 0.080193 0.058837 0.109178 F Ratio 0.0431 0.6868 1.3078 1.1878 1.9609 Prob > F 0.8377 0.4202 0.2707 0.2894 0.1805 Prob>|t| 0.1471 0.4064 0.0049 0.0146 0.0031
PH2A.X Activated Cells
RSquare 0.025549 0.040041 0.003615 0.156238 0.139755 F Ratio 0.4982 0.8759 0.0834 3.8885 3.5741 Prob > F 0.4889 0.36 0.7753 0.0619 0.0719 Prob>|t| 0.0381 0.0048 0.0432 0.0010 0.3686
DNA Double-strand Break
RSquare 0.003508 0.018295 0.052336 0.01278 0.009866 F Ratio 0.088 0.4286 1.2702 0.3236 0.2391 Prob > F 0.7692 0.5192 0.2714 0.5745 0.6293 Prob>|t| 0.0020 0.0116 0.0446 0.0081 0.0202
Total DNA Damage
RSquare 0.019251 0.009949 0.000735 0.012919 0.210964 F Ratio 0.53 0.2713 0.0199 0.3796 6.9516
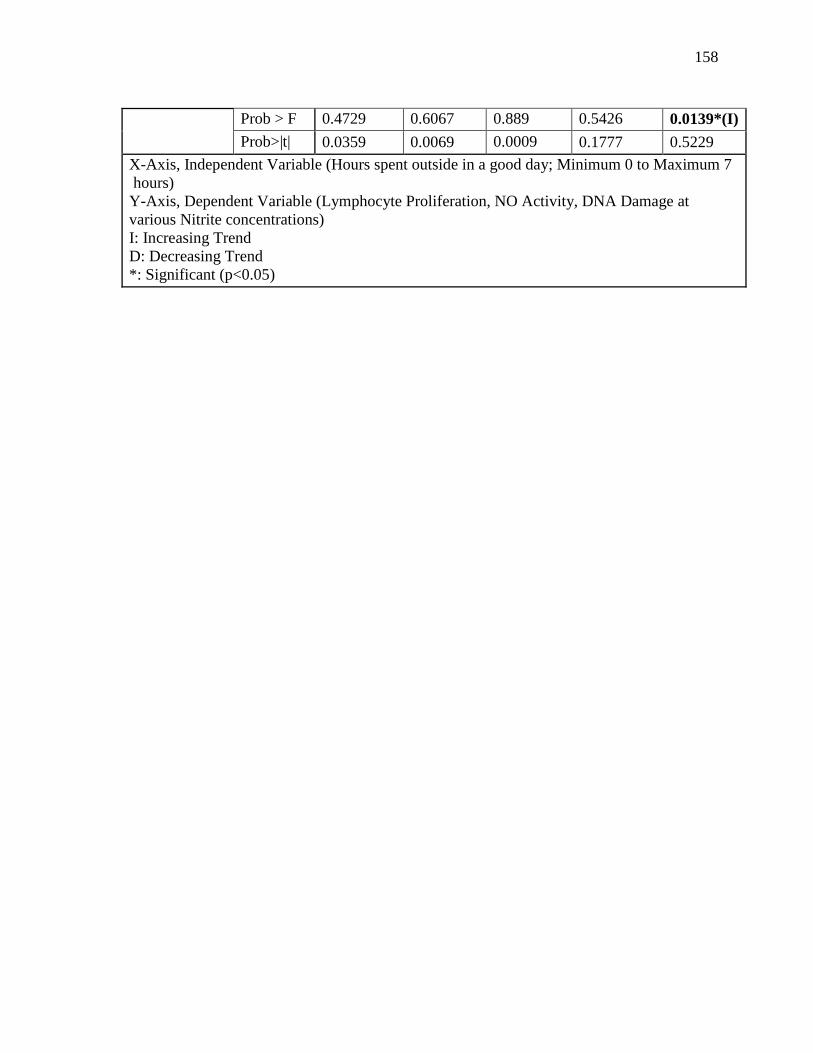
158
Prob > F 0.4729 0.6067 0.889 0.5426 0.0139*(I) Prob>|t| 0.0359 0.0069 0.0009 0.1777 0.5229
X-Axis, Independent Variable (Hours spent outside in a good day; Minimum 0 to Maximum 7 hours)
Y-Axis, Dependent Variable (Lymphocyte Proliferation, NO Activity, DNA Damage at various Nitrite concentrations) I: Increasing Trend D: Decreasing Trend *: Significant (p<0.05)

159
I11: One-way Analysis of Lymphocyte proliferation, NO activity, and DNA damage at Various nitrite concentrations by Immunological and Chronic Disease
Experiment on Mononuclear Cells
Nitrite Concentrations 0 ppm 1 ppm 5 ppm 10 ppm 15 ppm
Lymphocyte Proliferation
RSquare 0.070003 0.040925 0.013921 0.010409 0.018774 F Ratio 1.0915 0.6187 0.2047 0.1525 0.2774 Prob > F 0.3491 0.5456 0.8161 0.8592 0.7597
NO activity with Live Cells
RSquare 0.000455 0.008863 0.036975 0.201202 0.339227 F Ratio 0.0105 0.1118 0.8831 3.4004 6.6739 Prob > F 0.9194 0.8947 0.3571 0.0482*(F) 0.0046*(F)
NO activity with Dead Cells
RSquare 0.021781 0.044934 0.002948 0.452176 0.009129 F Ratio 0.1447 0.3058 0.0473 14.0319 0.1474 Prob > F 0.8666 0.7417 0.8306 0.0016*(F) 0.7061
NO activity Total Cells
RSquare 0.022648 0.010744 0.008921 0.251153 0.049581 F Ratio 0.3244 0.152 0.225 4.6954 0.7303 Prob > F 0.7256 0.8597 0.6393 0.0174*(F) 0.4907
pATM Activated Cells
RSquare 0.274651 0.027855 0.299972 0.020114 0.055706 F Ratio 3.5971 0.4584 3.2139 0.4105 1.0029 Prob > F 0.047*(F) 0.508 0.0689*(F) 0.529 0.3307
PH2A.X Activated Cells
RSquare 0.008695 0.032325 0.084675 0.033999 0.038377 F Ratio 0.0833 0.3507 1.0638 0.3696 0.439 Prob > F 0.9204 0.7082 0.3615 0.6954 0.6502
DNA Double-strand Break
RSquare 0.035824 0.047042 0.052916 0.176381 0.286027 F Ratio 0.4644 0.5677 0.6425 2.6769 4.8074 Prob > F 0.6338 0.5746 0.5351 0.0884*(F) 0.017*(F)
Total DNA Damage
RSquare 0.011825 0.060512 0.044796 0.01669 0.007453 F Ratio 0.1615 0.8695 0.6331 0.2461 0.0976 Prob > F 0.8516 0.4306 0.5386 0.7835 0.9073
X-Axis, Independent Variable (Immunological and ChronicDisease; No, Fibromyalgia, Psoriasis)
Y-Axis, Dependent Variable (Lymphocyte Proliferation, NO Activity, DNA Damage at various Nitrite concentrations) N: No F: Fibromyalgia P: Psoriasis *: Significant (p<0.05)

160
I12: One-way Analysis of Lymphocyte proliferation, NO activity, and DNA damage at Various nitrite concentrations by Immunization
Experiment on Mononuclear Cells
Nitrite Concentrations 0 ppm 1 ppm 5 ppm 10 ppm 15 ppm
Lymphocyte Proliferation
RSquare 0.004045 0.007184 0.001285 0.000208 0.002003 F Ratio 0.1219 0.2171 0.0386 0.0062 0.0602 Prob > F 0.7295 0.6446 0.8456 0.9376 0.8078 Prob>|t| 0.7295 0.6446 0.8456 0.9376 0.8078
NO activity with Live Cells
RSquare 0.04169 0.000493 0.155493 0.011293 0.006802 F Ratio 1.0006 0.0128 4.2348 0.3198 0.1849 Prob > F 0.3276 0.9107 0.0511 0.5762 0.6706 Prob>|t| 0.3276 0.9107 0.0511 0.5762 0.6706
NO activity with Dead Cells
RSquare 0.002248 0.015698 0.008879 0.035899 0.000208 F Ratio 0.0315 0.2233 0.1433 0.633 0.0386 Prob > F 0.8616 0.6438 0.71 0.4372 0.8616 Prob>|t| 0.8616 0.6438 0.71 0.4372 0.8616
NO activity Total Cells
RSquare 0.019188 1.24E-05 0.09313 0.021922 0.009055 F Ratio 0.5673 0.0004 2.5674 0.65 0.265 Prob > F 0.4574 0.985 0.1217 0.4267 0.6106 Prob>|t| 0.4574 0.985 0.1217 0.4267 0.6106
pATM Activated Cells
RSquare 0.050587 0.059191 0.052485 0.023435 0.007425 F Ratio 1.0657 1.0066 0.8863 0.4799 0.1272 Prob > F 0.3143 0.3306 0.3605 0.4964 0.7258 Prob>|t| 0.3143 0.3306 0.3605 0.4964 0.7258
PH2A.X Activated Cells
RSquare 0.064344 0.470981 0.060845 0.209517 0.011196 F Ratio 1.3754 19.5864 1.5549 5.8311 0.2604 Prob > F 0.2547 0.0002*(Y) 0.2244 0.0245*(Y) 0.6147 Prob>|t| 0.2547 0.0002 0.2244 0.0245 0.6147
DNA Double-strand Break
RSquare 0.011204 0.021748 0.028394 0.020356 0.006994 F Ratio 0.2946 0.5336 0.7014 0.5403 0.1761 Prob > F 0.5919 0.4722 0.4106 0.4689 0.6783 Prob>|t| 0.5919 0.4722 0.4106 0.4689 0.6783
Total DNA Damage
RSquare 0.020369 0.000228 0.004674 0.00161 0.005886 F Ratio 0.5822 0.0064 0.1315 0.0484 0.1599
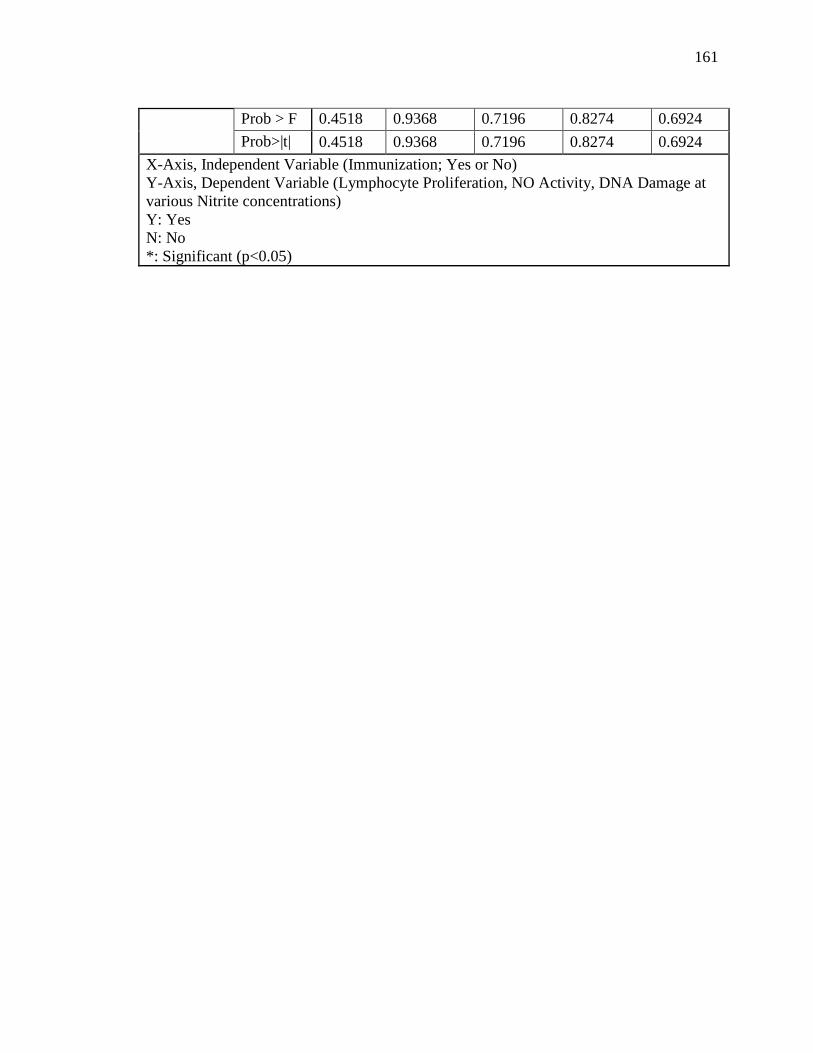
161
Prob > F 0.4518 0.9368 0.7196 0.8274 0.6924 Prob>|t| 0.4518 0.9368 0.7196 0.8274 0.6924
X-Axis, Independent Variable (Immunization; Yes or No) Y-Axis, Dependent Variable (Lymphocyte Proliferation, NO Activity, DNA Damage at various Nitrite concentrations) Y: Yes N: No *: Significant (p<0.05)

162
I13: One-way Analysis of Lymphocyte proliferation, NO activity, and DNA damage at Various nitrite concentrations by Smoking
Experiment on Mononuclear Cells
Nitrite Concentrations 0 ppm 1 ppm 5 ppm 10 ppm 15 ppm
Lymphocyte Proliferation
RSquare 0.01304 0.00013 0.00794 0.07061 0.047881 F Ratio 0.3962 0.0038 0.2401 2.2794 1.5087 Prob > F 0.5338 0.9514 0.6277 0.1416 0.2289 Prob>|t| 0.5338 0.9514 0.6277 0.1416 0.2289
NO activity with Live Cells
RSquare 0.00035 0.00655 0.036975 0.00443 0.004759 F Ratio 0.008 0.1714 0.8831 0.1245 0.1291 Prob > F 0.9293 0.6822 0.3571 0.7268 0.7222 Prob>|t| 0.9293 0.6822 0.3571 0.7268 0.7222
NO activity with Dead Cells
RSquare 0.01773 0.01231 0.002709 0.00391 0.001674 F Ratio 0.2527 0.1744 0.0435 0.0667 0.0268 Prob > F 0.623 0.6825 0.8375 0.7993 0.872 Prob>|t| 0.623 0.6825 0.8375 0.7993 0.872
NO activity Total Cells
RSquare 0.02124 0.00769 0.027775 0.00904 0.000303 F Ratio 0.6293 0.2248 0.7142 0.2644 0.0088 Prob > F 0.434 0.6389 0.4061 0.611 0.9259 Prob>|t| 0.434 0.6389 0.4061 0.611 0.9259
pATM Activated Cells
RSquare 0.02476 0.00391 0.031772 0.02344 0.055706 F Ratio 0.5077 0.0038 0.525 0.4799 1.0029 Prob > F 0.4844 0.2289 0.4792 0.4964 0.3307 Prob>|t| 0.4844 0.2289 0.4792 0.4964 0.3307
PH2A.X Activated Cells
RSquare 0.00255 0.03595 0.000157 0.01328 0.003236 F Ratio 0.0511 0.8205 0.0038 0.2962 0.0747 Prob > F 0.8235 0.3749 0.9516 0.5918 0.7871 Prob>|t| 0.8235 0.3749 0.9516 0.5918 0.7871
DNA Double-strand Break
RSquare 0.00116 0.00367 0.013251 0.01318 0.022114 F Ratio 0.0303 0.0883 0.3223 0.3472 0.5653 Prob > F 0.8632 0.7689 0.5755 0.5608 0.4591 Prob>|t| 0.8632 0.7689 0.5755 0.5608 0.4591
Total DNA Damage
RSquare 0.00087 0.01205 0.00075 0.00078 0.009172 F Ratio 0.0244 0.3415 0.021 0.0234 0.2499

163
Prob > F 0.877 0.5637 0.8858 0.8793 0.6212 Prob>|t| 0.877 0.5637 0.8858 0.8793 0.6212
X-Axis, Independent Variable (Smoking; Yes or No) Y-Axis, Dependent Variable (Lymphocyte Proliferation, NO Activity, DNA Damage at various Nitrite concentrations)

164
I14: One-way Analysis of Lymphocyte Proliferation in Non-Stimulate Condition
Summary of Fit
Rsquare 0.158283
Adj Rsquare 0.136561
Root Mean Square Error 164740.5
Mean of Response 297701.9
Observations (or Sum Wgts) 160
Analysis of Variance
Source DF Sum of Squares Mean Square F Ratio Prob > F
Concentration 4 7.9104e+11 1.978e+11 7.2868 <.0001*
Error 155 4.2066e+12 2.714e+10
C. Total 159 4.9977e+12
0
200000
400000
600000
800000
1000000
0 1 5 10 15
Concentration

165
Means for Oneway Anova
Level Number Mean Std Error Lower 95% Upper 95%
0 32 395663 29122 338135 453190
1 32 341394 29122 283866 398922
5 32 309425 29122 251897 366953
10 32 246659 29122 189132 304187
15 32 195369 29122 137841 252897
Std Error uses a pooled estimate of error variance
Means and Std Deviations
Level Number Mean Std Dev Std Err Mean Lower 95% Upper 95%
0 32 395663 217667 38478 317185 474140
1 32 341394 179938 31809 276519 406268
5 32 309425 170117 30073 248091 370759
10 32 246659 118844 21009 203811 289507
15 32 195369 113476 20060 154456 236281
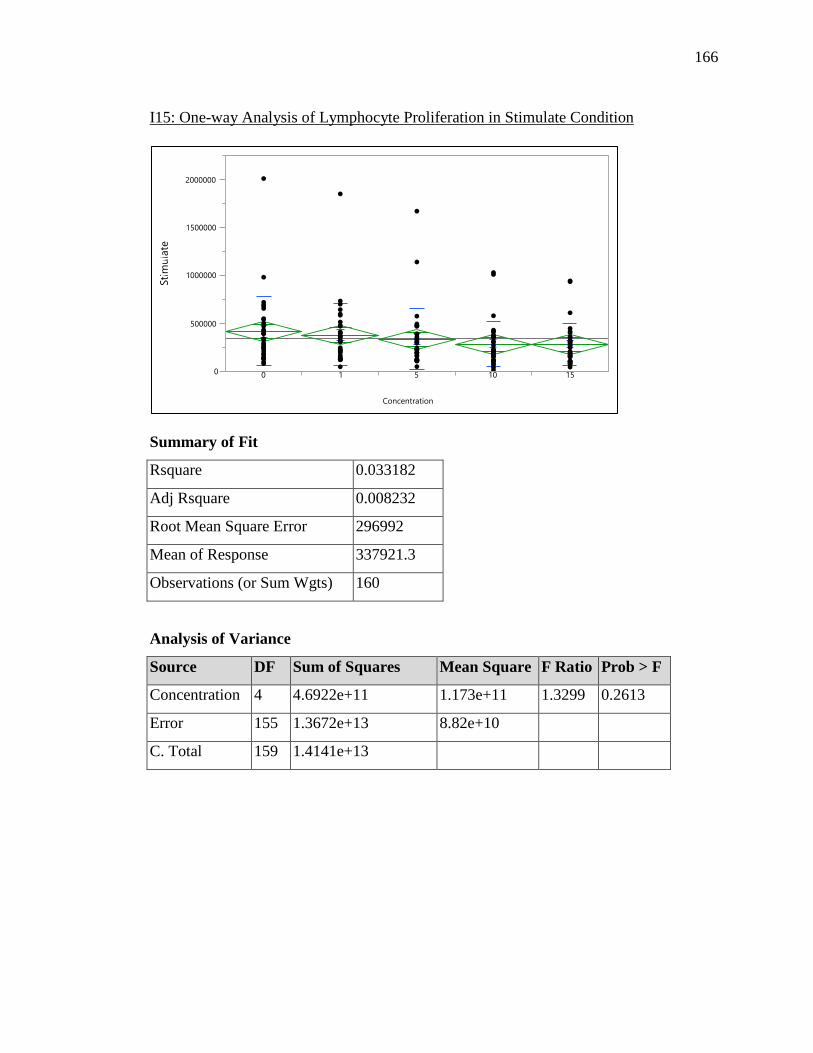
166
I15: One-way Analysis of Lymphocyte Proliferation in Stimulate Condition
Summary of Fit
Rsquare 0.033182
Adj Rsquare 0.008232
Root Mean Square Error 296992
Mean of Response 337921.3
Observations (or Sum Wgts) 160
Analysis of Variance
Source DF Sum of Squares Mean Square F Ratio Prob > F
Concentration 4 4.6922e+11 1.173e+11 1.3299 0.2613
Error 155 1.3672e+13 8.82e+10
C. Total 159 1.4141e+13
0
500000
1000000
1500000
2000000
0 1 5 10 15
Concentration

167
Means for Oneway Anova
Level Number Mean Std Error Lower 95% Upper 95%
0 32 417069 52501 313358 520779
1 32 378516 52501 274805 482226
5 32 334153 52501 230443 437863
10 32 282369 52501 178658 386079
15 32 277500 52501 173790 381210
Std Error uses a pooled estimate of error variance
Means and Std Deviations
Level Number Mean Std Dev Std Err
Mean
Lower
95%
Upper
95%
0 32 417069 361590 63921 286702 547436
1 32 378516 325717 57579 261082 495949
5 32 334153 319423 56467 218989 449317
10 32 282369 235443 41621 197483 367255
15 32 277500 216144 38209 199572 355428

168
I16: One-way Analysis of Lymphocyte Proliferation Quotient and Nitrite Concentration
Summary of Fit
Rsquare 0.060137
Adj Rsquare 0.035882
Root Mean Square Error 0.670271
Mean of Response 1.172571
Observations (or Sum Wgts) 160
Analysis of Variance
Source DF Sum of Squares Mean Square F Ratio Prob > F
Concentration 4 4.455619 1.11390 2.4794 0.0463*
Error 155 69.635769 0.44926
C. Total 159 74.091388
Means for Oneway Anova
Level Number Mean Std Error Lower 95% Upper 95%
0 32 1.05090 0.11849 0.8168 1.2850
1 32 1.10541 0.11849 0.8714 1.3395
0
0.5
1
1.5
2
2.5
3
3.5
4
0 1 5 10 15
Concentration

169
Level Number Mean Std Error Lower 95% Upper 95%
5 32 1.08449 0.11849 0.8504 1.3186
10 32 1.11889 0.11849 0.8848 1.3530
15 32 1.50315 0.11849 1.2691 1.7372
Std Error uses a pooled estimate of error variance
Means and Std Deviations
Level Number Mean Std Dev Std Err Mean Lower 95% Upper 95%
0 32 1.05090 0.480380 0.08492 0.8777 1.2241
1 32 1.10541 0.629718 0.11132 0.8784 1.3325
5 32 1.08449 0.688305 0.12168 0.8363 1.3327
10 32 1.11889 0.670338 0.11850 0.8772 1.3606
15 32 1.50315 0.834200 0.14747 1.2024 1.8039
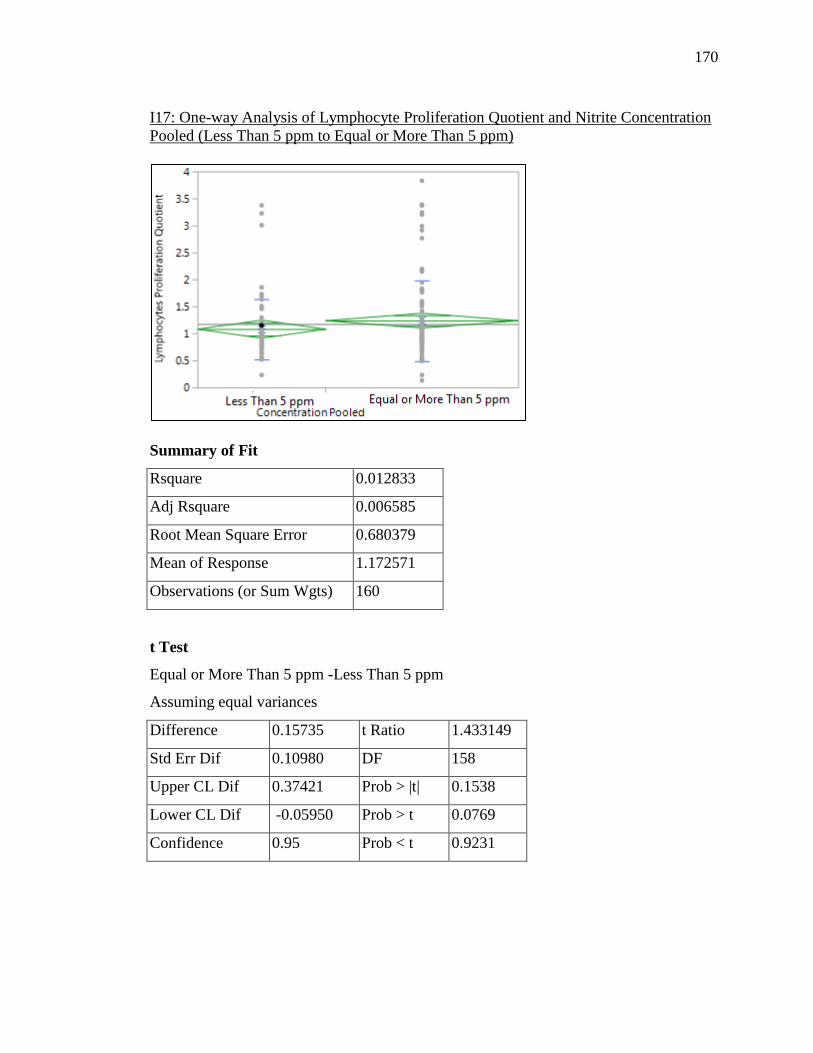
170
I17: One-way Analysis of Lymphocyte Proliferation Quotient and Nitrite Concentration Pooled (Less Than 5 ppm to Equal or More Than 5 ppm)
Summary of Fit
Rsquare 0.012833
Adj Rsquare 0.006585
Root Mean Square Error 0.680379
Mean of Response 1.172571
Observations (or Sum Wgts) 160
t Test
Equal or More Than 5 ppm -Less Than 5 ppm
Assuming equal variances
Difference 0.15735 t Ratio 1.433149
Std Err Dif 0.10980 DF 158
Upper CL Dif 0.37421 Prob > |t| 0.1538
Lower CL Dif -0.05950 Prob > t 0.0769
Confidence 0.95 Prob < t 0.9231
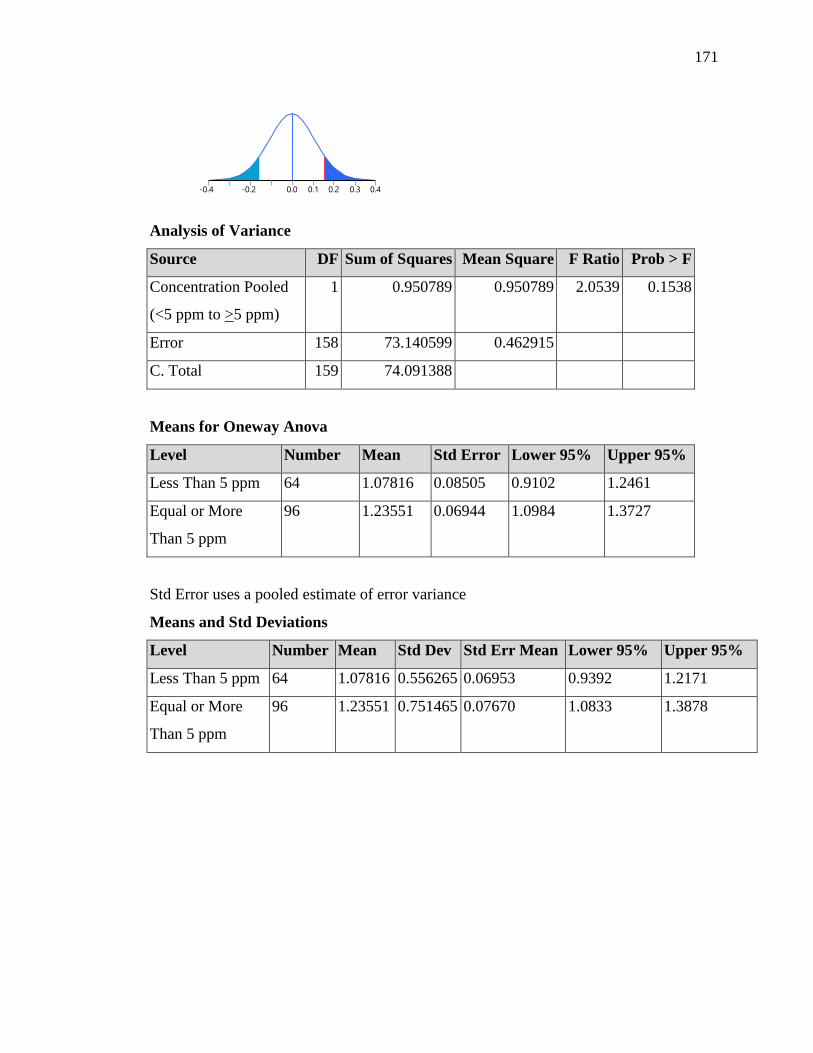
171
Analysis of Variance
Source DF Sum of Squares Mean Square F Ratio Prob > F
Concentration Pooled
(<5 ppm to >5 ppm)
1 0.950789 0.950789 2.0539 0.1538
Error 158 73.140599 0.462915
C. Total 159 74.091388
Means for Oneway Anova
Level Number Mean Std Error Lower 95% Upper 95%
Less Than 5 ppm 64 1.07816 0.08505 0.9102 1.2461
Equal or More
Than 5 ppm
96 1.23551 0.06944 1.0984 1.3727
Std Error uses a pooled estimate of error variance
Means and Std Deviations
Level Number Mean Std Dev Std Err Mean Lower 95% Upper 95%
Less Than 5 ppm 64 1.07816 0.556265 0.06953 0.9392 1.2171
Equal or More
Than 5 ppm
96 1.23551 0.751465 0.07670 1.0833 1.3878
-0.4 -0.2 0.0 0.1 0.2 0.3 0.4

172
t Test
Equal or More Than 5 PPM-Less Than 5 PPM
Assuming unequal variances
Difference 0.15735 t Ratio 1.519977
Std Err Dif 0.10352 DF 156.211
Upper CL Dif 0.36184 Prob > |t| 0.1305
Lower CL Dif -0.04713 Prob > t 0.0653
Confidence 0.95 Prob < t 0.9347
-0.4 -0.2 0.0 0.1 0.2 0.3 0.4
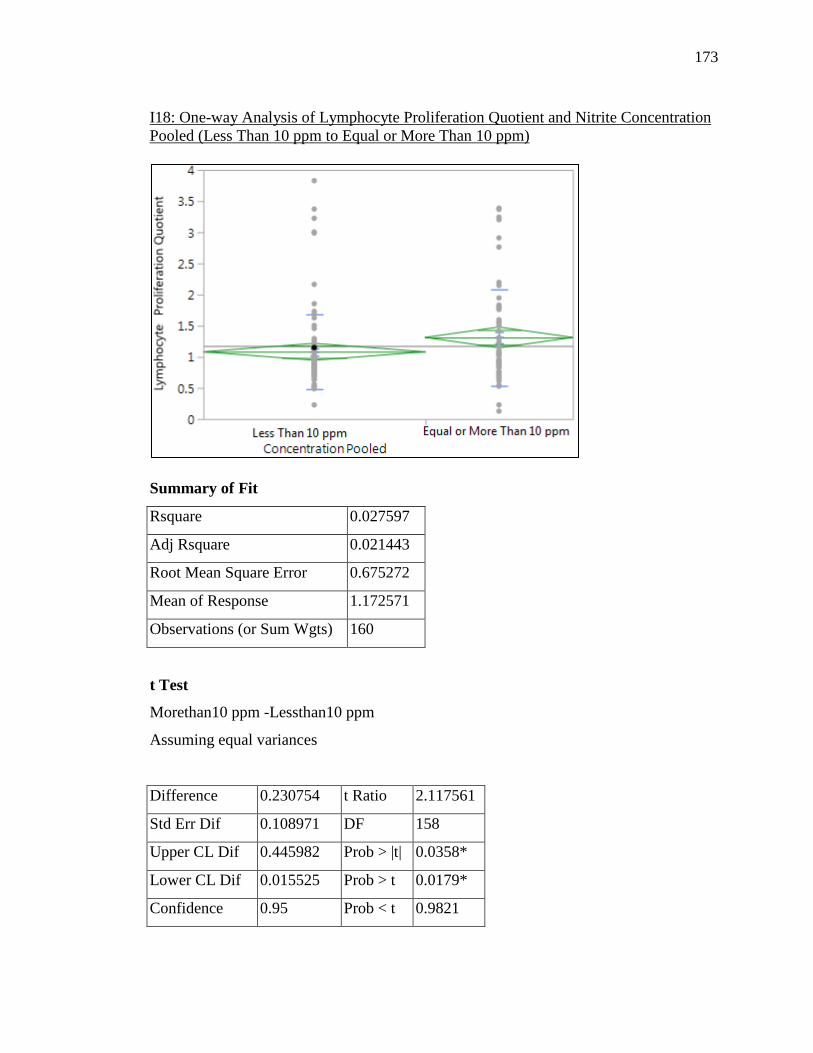
173
I18: One-way Analysis of Lymphocyte Proliferation Quotient and Nitrite Concentration Pooled (Less Than 10 ppm to Equal or More Than 10 ppm)
Summary of Fit
Rsquare 0.027597
Adj Rsquare 0.021443
Root Mean Square Error 0.675272
Mean of Response 1.172571
Observations (or Sum Wgts) 160
t Test
Morethan10 ppm -Lessthan10 ppm
Assuming equal variances
Difference 0.230754 t Ratio 2.117561
Std Err Dif 0.108971 DF 158
Upper CL Dif 0.445982 Prob > |t| 0.0358*
Lower CL Dif 0.015525 Prob > t 0.0179*
Confidence 0.95 Prob < t 0.9821
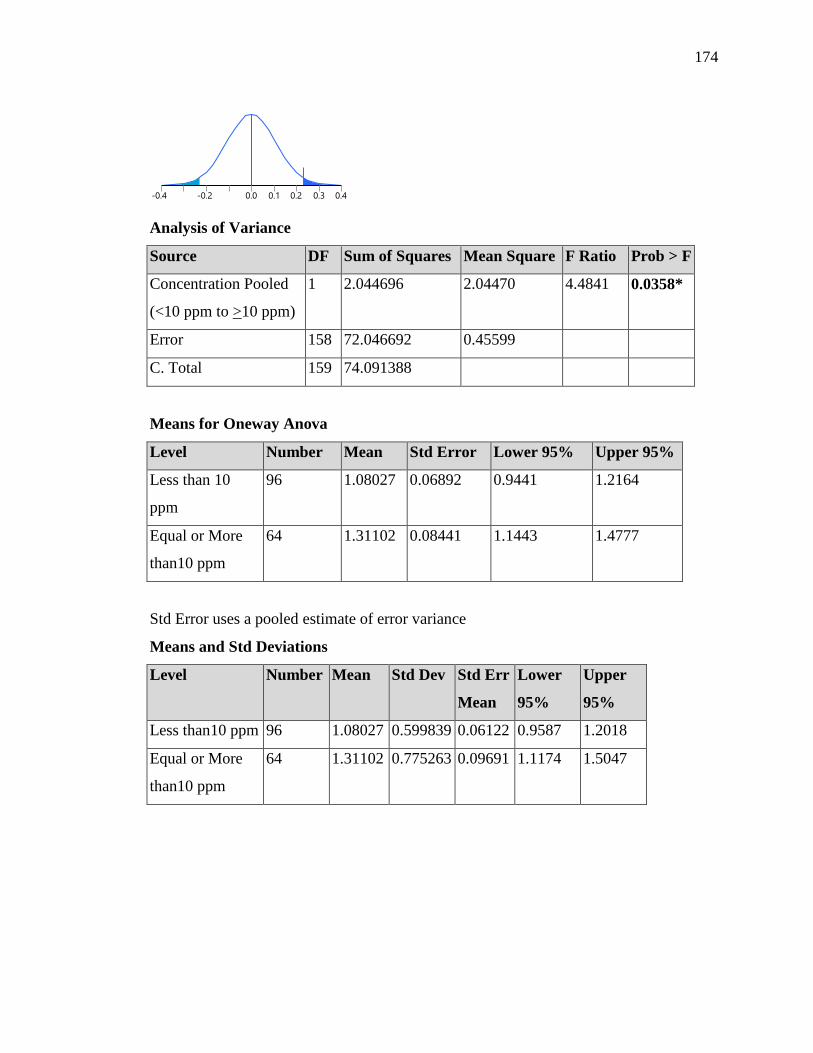
174
-0.4 -0.2 0.0 0.1 0.2 0.3 0.4
Analysis of Variance
Source DF Sum of Squares Mean Square F Ratio Prob > F
Concentration Pooled
(<10 ppm to >10 ppm)
1 2.044696 2.04470 4.4841 0.0358*
Error 158 72.046692 0.45599
C. Total 159 74.091388
Means for Oneway Anova
Level Number Mean Std Error Lower 95% Upper 95%
Less than 10
ppm
96 1.08027 0.06892 0.9441 1.2164
Equal or More
than10 ppm
64 1.31102 0.08441 1.1443 1.4777
Std Error uses a pooled estimate of error variance
Means and Std Deviations
Level Number Mean Std Dev Std Err
Mean
Lower
95%
Upper
95%
Less than10 ppm 96 1.08027 0.599839 0.06122 0.9587 1.2018
Equal or More
than10 ppm
64 1.31102 0.775263 0.09691 1.1174 1.5047

175
t Test
Morethan10 ppm -Lessthan10 ppm
Assuming unequal variances
Difference 0.230754 t Ratio 2.013101
Std Err Dif 0.114626 DF 111.5394
Upper CL Dif 0.457881 Prob > |t| 0.0465*
Lower CL Dif 0.003627 Prob > t 0.0233*
Confidence 0.95 Prob < t 0.9767
-0.4 -0.2 0.0 0.1 0.2 0.3 0.4
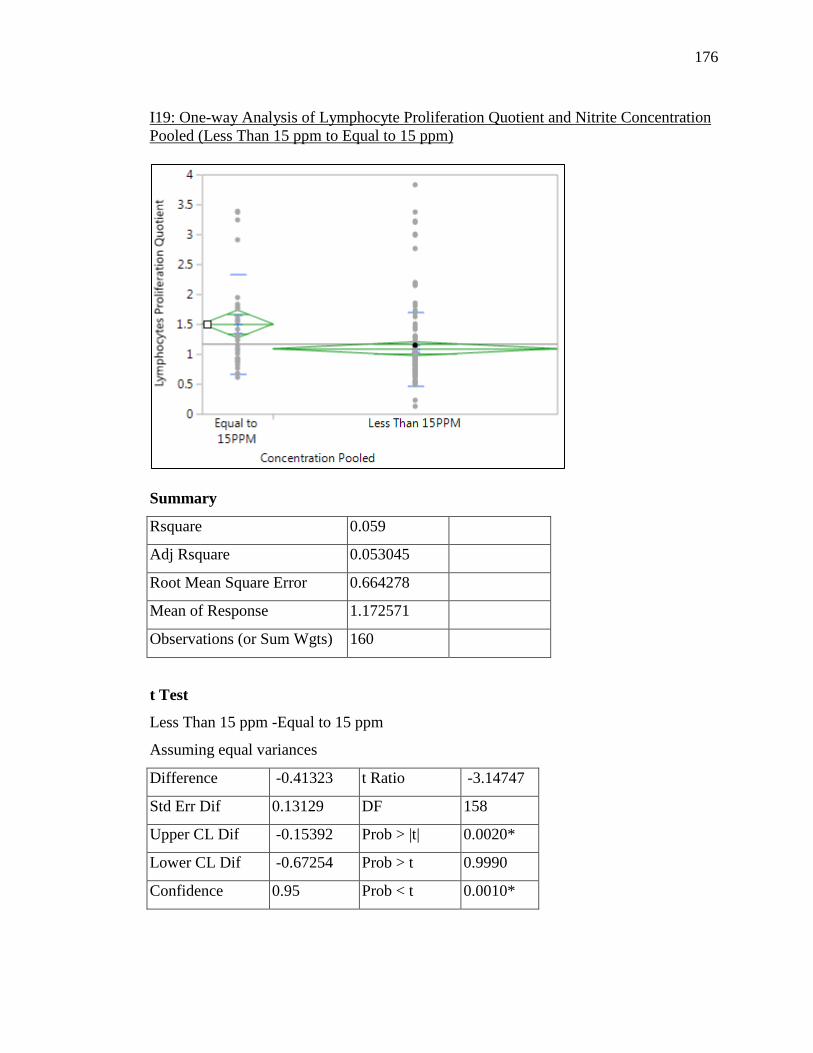
176
I19: One-way Analysis of Lymphocyte Proliferation Quotient and Nitrite Concentration Pooled (Less Than 15 ppm to Equal to 15 ppm)
Summary
Rsquare 0.059
Adj Rsquare 0.053045
Root Mean Square Error 0.664278
Mean of Response 1.172571
Observations (or Sum Wgts) 160
t Test
Less Than 15 ppm -Equal to 15 ppm
Assuming equal variances
Difference -0.41323 t Ratio -3.14747
Std Err Dif 0.13129 DF 158
Upper CL Dif -0.15392 Prob > |t| 0.0020*
Lower CL Dif -0.67254 Prob > t 0.9990
Confidence 0.95 Prob < t 0.0010*

177
Analysis of Variance
Source DF Sum of Squares Mean Square F Ratio Prob > F
Concentration Pooled
(<15 ppm to =15 ppm)
1 4.371422 4.37142 9.9066 0.0020*
Error 158 69.719966 0.44127
C. Total 159 74.091388
Means for Oneway Anova
Level Number Mean Std Error Lower 95% Upper 95%
Equal to 15 ppm 32 1.50315 0.11743 1.2712 1.7351
Less Than 15 ppm 128 1.08993 0.05871 0.9740 1.2059
Std Error uses a pooled estimate of error variance
Means and Std Deviations
Level Number Mean Std
Dev
Std Err
Mean
Lower
95%
Upper
95%
Equal to 15 ppm 32 1.50315 0.834
200
0.14747 1.2024 1.8039
Less Than 15 ppm 128 1.08993 0.615
722
0.05442 0.9822 1.1976
-0.4 -0.2 0.0 0.2 0.4
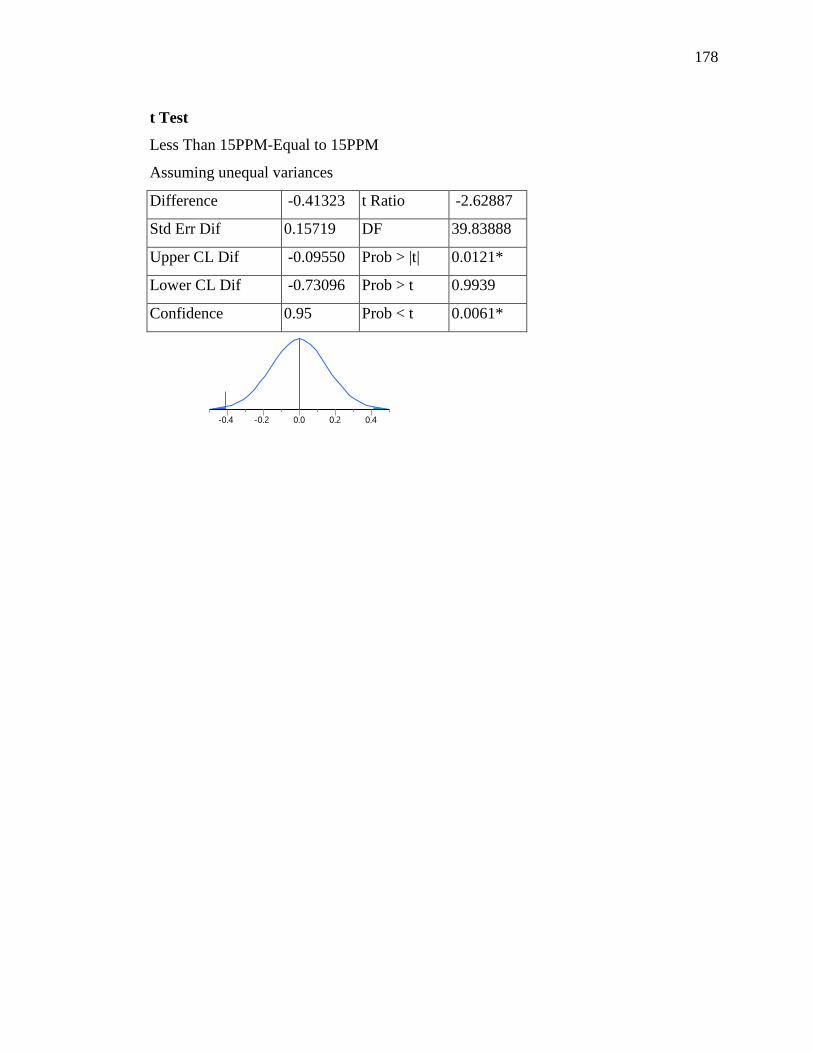
178
t Test
Less Than 15PPM-Equal to 15PPM
Assuming unequal variances
Difference -0.41323 t Ratio -2.62887
Std Err Dif 0.15719 DF 39.83888
Upper CL Dif -0.09550 Prob > |t| 0.0121*
Lower CL Dif -0.73096 Prob > t 0.9939
Confidence 0.95 Prob < t 0.0061*
-0.4 -0.2 0.0 0.2 0.4

179
I20 (a): One-way Analysis of Lymphocyte Proliferation Quotient and Osteoarthritis (Yes/No)
Parameters Statistics Nitrite Concentrations
0ppm 1ppm 5ppm 10ppm 15ppm
Lymphocyte
Proliferation
RSquare 0.001445 0.03937 0.13473 0.018805 0.007905
F Ratio 0.0434 1.2295 4.6713 0.575 0.2391
Prob > F 0.8364 0.2763 0.0388*(N) 0.4542 0.6284
Prob>|t| 0.8364 0.2763 0.0388 0.4542 0.6284
X axis: Osteoarthritis (Yes/No) Y axis: Lymphocyte proliferation at various nitrite concentrations Y: Yes N: No *: Significant (p<0.05)

180
I20 (b): One-way Analysis of Lymphocyte Proliferation Quotient and Osteoarthritis (Yes/No) at 5 ppm nitrite concentration
Summary of Fit
Rsquare 0.13473
Adj Rsquare 0.105887
Root Mean Square Error 0.650844
Mean of Response 1.084491
Observations (or Sum Wgts) 32
0
0.5
1
1.5
2
2.5
3
3.5
4
No Yes
Osteoarthritis

181
t Test
Yes-No
Assuming equal variances
Difference -0.49733 t Ratio -2.16131
Std Err Dif 0.23011 DF 30
Upper CL Dif -0.02739 Prob > |t| 0.0388*
Lower CL Dif -0.96728 Prob > t 0.9806
Confidence 0.95 Prob < t 0.0194*
Analysis of Variance
Source DF Sum of Squares Mean Square F Ratio Prob > F
Osteoarthritis 1 1.978731 1.97873 4.6713 0.0388*
Error 30 12.707925 0.42360
C. Total 31 14.686656
Means for Oneway Anova
Level Number Mean Std Error Lower 95% Upper 95%
No 16 1.33316 0.16271 1.0009 1.6655
Yes 16 0.83582 0.16271 0.5035 1.1681
Std Error uses a pooled estimate of error variance
-0.8 -0.4 0.0 0.2 0.4 0.6 0.8

182
Means and Std Deviations
Level Number Mean Std Dev Std Err Mean Lower 95% Upper 95%
No 80 16 1.33316 0.889725 0.22243 0.85906
Yes 80 16 0.83582 0.235762 0.05894 0.71019
t Test
Yes-No
Assuming unequal variances
Difference -0.49733 t Ratio -2.16131
Std Err Dif 0.23011 DF 17.09615
Upper CL Dif -0.01206 Prob > |t| 0.0451*
Lower CL Dif -0.98261 Prob > t 0.9774
Confidence 0.95 Prob < t 0.0226*
-0.8 -0.4 0.0 0.2 0.4 0.6 0.8

183
I21: One-way Analysis of Nitric Oxide Activity by Live Cells at Various Nitrite Concentration
Summary of Fit
Rsquare 0.034782
Adj Rsquare 0.005533
Root Mean Square Error 3.882916
Mean of Response 1.479745
Observations (or Sum Wgts) 137
Analysis of Variance
Source DF Sum of Squares Mean Square F Ratio Prob > F
Concentration 4 71.7169 17.9292 1.1892 0.3186
Error 132 1990.1687 15.0770
C. Total 136 2061.8855
0
10
20
30
40
0 1 5 10 15
Concentration

184
Means for Oneway Anova
Level Number Mean Std Error Lower 95% Upper 95%
0 25 1.17780 0.77658 -0.358 2.7140
1 28 2.68429 0.73380 1.233 4.1358
5 25 0.50808 0.77658 -1.028 2.0442
10 30 1.15733 0.70892 -0.245 2.5596
15 29 1.74821 0.72104 0.322 3.1745
Std Error uses a pooled estimate of error variance
Means and Std Deviations
Level Number Mean Std Dev Std Err Mean Lower 95% Upper 95%
0 25 1.17780 1.73608 0.3472 0.4612 1.8944
1 28 2.68429 8.00823 1.5134 -0.4210 5.7896
5 25 0.50808 0.55047 0.1101 0.2809 0.7353
10 30 1.15733 1.06698 0.1948 0.7589 1.5558
15 29 1.74821 2.28341 0.4240 0.8796 2.6168
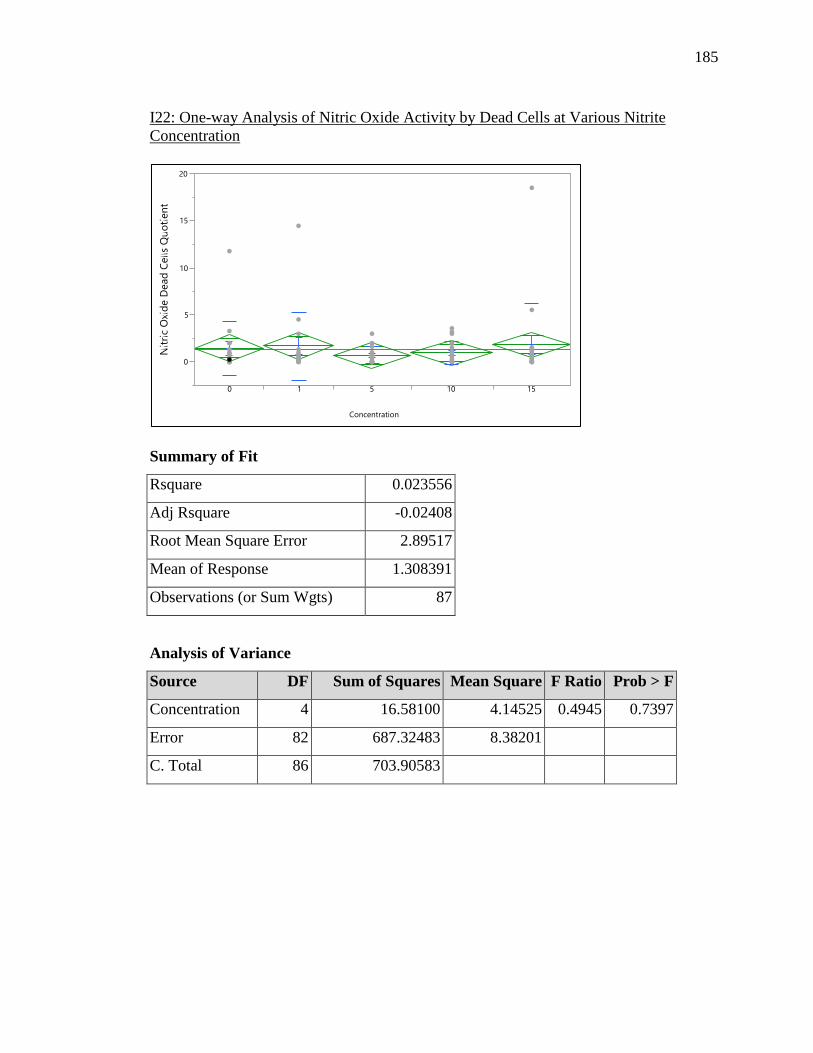
185
I22: One-way Analysis of Nitric Oxide Activity by Dead Cells at Various Nitrite Concentration
Summary of Fit
Rsquare 0.023556
Adj Rsquare -0.02408
Root Mean Square Error 2.89517
Mean of Response 1.308391
Observations (or Sum Wgts) 87
Analysis of Variance
Source DF Sum of Squares Mean Square F Ratio Prob > F
Concentration 4 16.58100 4.14525 0.4945 0.7397
Error 82 687.32483 8.38201
C. Total 86 703.90583
0
5
10
15
20
0 1 5 10 15
Concentration

186
Means for Oneway Anova
Level Number Mean Std Error Lower 95% Upper 95%
0 16 1.45669 0.72379 0.0168 2.8965
1 16 1.70100 0.72379 0.2611 3.1409
5 18 0.69439 0.68240 -0.6631 2.0519
10 19 0.95526 0.66420 -0.3660 2.2766
15 18 1.81433 0.68240 0.4568 3.1718
Std Error uses a pooled estimate of error variance
Means and Std Deviations
Level Number Mean Std Dev Std Err Mean Lower 95% Upper 95%
0 16 1.45669 2.91719 0.7293 -0.0978 3.0111
1 16 1.70100 3.62035 0.9051 -0.2281 3.6301
5 18 0.69439 0.88888 0.2095 0.2524 1.1364
10 19 0.95526 1.22091 0.2801 0.3668 1.5437
15 18 1.81433 4.35761 1.0271 -0.3527 3.9813

187
I23: One-way Analysis of Total Nitric Oxide Activity (Live + Dead Cells) at Various Nitrite Concentration
Summary of Fit
Rsquare 0.033657
Adj Rsquare 0.007181
Root Mean Square Error 2.43232
Mean of Response 1.288479
Observations (or Sum Wgts) 151
Analysis of Variance
Source DF Sum of Squares Mean Square F Ratio Prob > F
Concentration 4 30.08376 7.52094 1.2712 0.2840
Error 146 863.76218 5.91618
C. Total 150 893.84594
0
5
10
15
20
25
0 1 5 10 15
Concentration

188
Means for Oneway Anova
Level Number Mean Std Error Lower 95% Upper 95%
0 31 1.31915 0.43686 0.456 2.1825
1 31 1.99191 0.43686 1.129 2.8553
5 27 0.58130 0.46810 -0.344 1.5064
10 31 1.10263 0.43686 0.239 1.9660
15 31 1.35615 0.43686 0.493 2.2195
Std Error uses a pooled estimate of error variance
Means and Std Deviations
Level Number Mean Std Dev Std Err Mean Lower 95% Upper 95%
0 31 1.31915 2.08966 0.37531 0.55266 2.0856
1 31 1.99191 4.68497 0.84145 0.27345 3.7104
5 27 0.58130 0.52301 0.10065 0.37441 0.7882
10 31 1.10263 0.96355 0.17306 0.74920 1.4561
15 31 1.35615 1.14497 0.20564 0.93617 1.7761
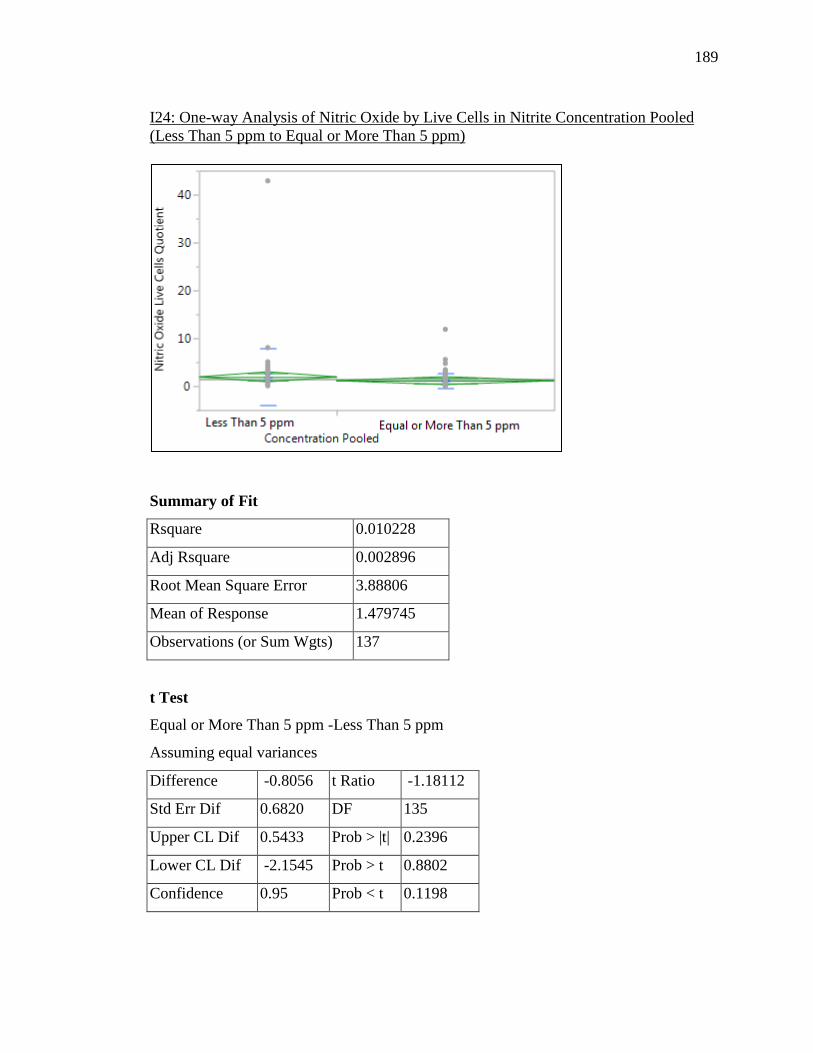
189
I24: One-way Analysis of Nitric Oxide by Live Cells in Nitrite Concentration Pooled (Less Than 5 ppm to Equal or More Than 5 ppm)
Summary of Fit
Rsquare 0.010228
Adj Rsquare 0.002896
Root Mean Square Error 3.88806
Mean of Response 1.479745
Observations (or Sum Wgts) 137
t Test
Equal or More Than 5 ppm -Less Than 5 ppm
Assuming equal variances
Difference -0.8056 t Ratio -1.18112
Std Err Dif 0.6820 DF 135
Upper CL Dif 0.5433 Prob > |t| 0.2396
Lower CL Dif -2.1545 Prob > t 0.8802
Confidence 0.95 Prob < t 0.1198
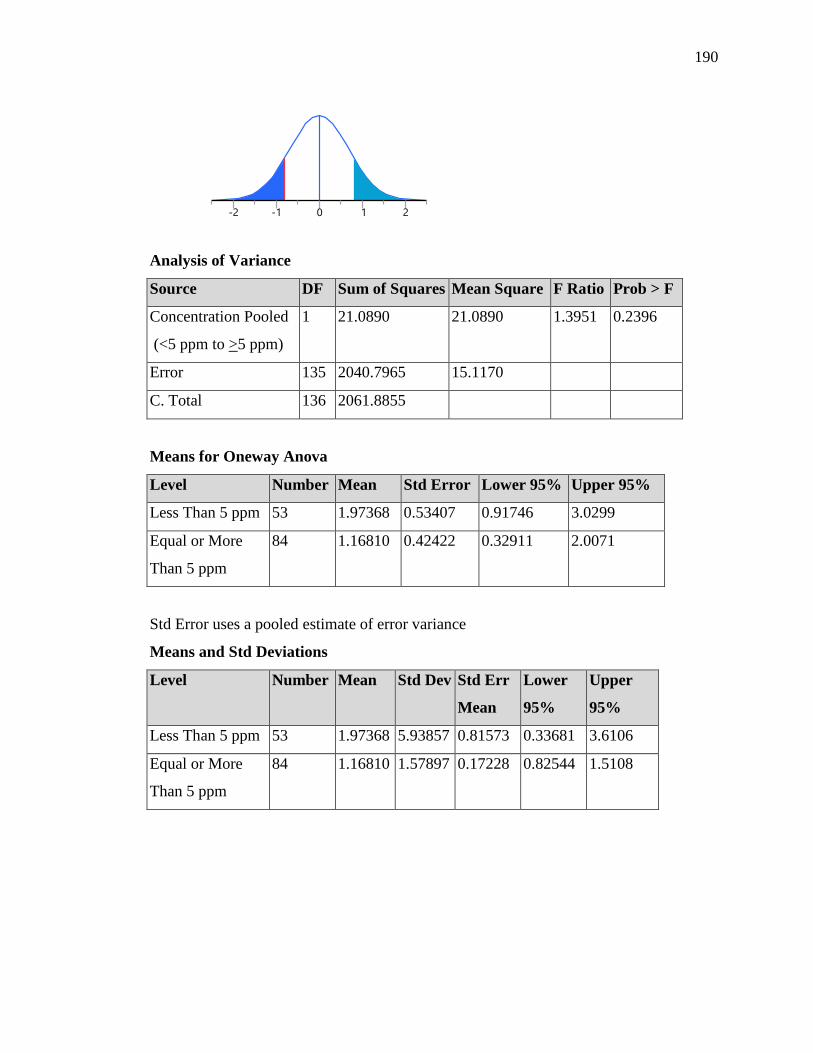
190
Analysis of Variance
Source DF Sum of Squares Mean Square F Ratio Prob > F
Concentration Pooled
(<5 ppm to >5 ppm)
1 21.0890 21.0890 1.3951 0.2396
Error 135 2040.7965 15.1170
C. Total 136 2061.8855
Means for Oneway Anova
Level Number Mean Std Error Lower 95% Upper 95%
Less Than 5 ppm 53 1.97368 0.53407 0.91746 3.0299
Equal or More
Than 5 ppm
84 1.16810 0.42422 0.32911 2.0071
Std Error uses a pooled estimate of error variance
Means and Std Deviations
Level Number Mean Std Dev Std Err
Mean
Lower
95%
Upper
95%
Less Than 5 ppm 53 1.97368 5.93857 0.81573 0.33681 3.6106
Equal or More
Than 5 ppm
84 1.16810 1.57897 0.17228 0.82544 1.5108
-2 -1 0 1 2

191
t Test
Equal or More Than 5 ppm -Less Than 5 ppm
Assuming unequal variances
Difference -0.8056 t Ratio -0.96625
Std Err Dif 0.8337 DF 56.67171
Upper CL Dif 0.8641 Prob > |t| 0.3380
Lower CL Dif -2.4753 Prob > t 0.8310
Confidence 0.95 Prob < t 0.1690
-3 -2 -1 0 1 2 3

192
I25: One-way Analysis of Nitric Oxide by Live Cells in Nitrite Concentration Pooled (Less Than 10 ppm to Equal or More Than 10 ppm)
Summary of Fit
Rsquare 5.141e-5
Adj Rsquare -0.00736
Root Mean Square Error 3.907997
Mean of Response 1.479745
Observations (or Sum Wgts) 137
t Test
Equal or More than10 ppm –Less than10 ppm
Assuming equal variances
Difference -0.0562 t Ratio -0.08331
Std Err Dif 0.6743 DF 135
Upper CL Dif 1.2773 Prob > |t| 0.9337
Lower CL Dif -1.3897 Prob > t 0.5331
Confidence 0.95 Prob < t 0.4669

193
Analysis of Variance
Source DF Sum of Squares Mean Square F Ratio Prob > F
Concentration Pooled 1 0.1060 0.1060 0.0069 0.9337
Error 135 2061.7795 15.2724
C. Total 136 2061.8855
Means for Oneway Anova
Level Number Mean Std Error Lower 95% Upper 95%
Less than10 ppm 78 1.50394 0.44249 0.62882 2.3791
Equal or More
than10 ppm
59 1.44776 0.50878 0.44156 2.4540
Std Error uses a pooled estimate of error variance
Means and Std Deviations
Level Number Mean Std Dev Std Err
Mean
Lower
95%
Upper
95%
Less than 10
ppm
78 1.50394 4.93809 0.55913 0.39057 2.6173
Equal or More
than10 ppm
59 1.44776 1.78187 0.23198 0.98340 1.9121
-2 -1 0 1 2

194
t Test
Equal or More than10 ppm-Less than10 ppm
Assuming unequal variances
Difference -0.0562 t Ratio -0.0928
Std Err Dif 0.6053 DF 101.7868
Upper CL Dif 1.1446 Prob > |t| 0.9262
Lower CL Dif -1.2569 Prob > t 0.5369
Confidence 0.95 Prob < t 0.4631
-2.0 -1.0 0.0 0.5 1.0 1.5 2.0
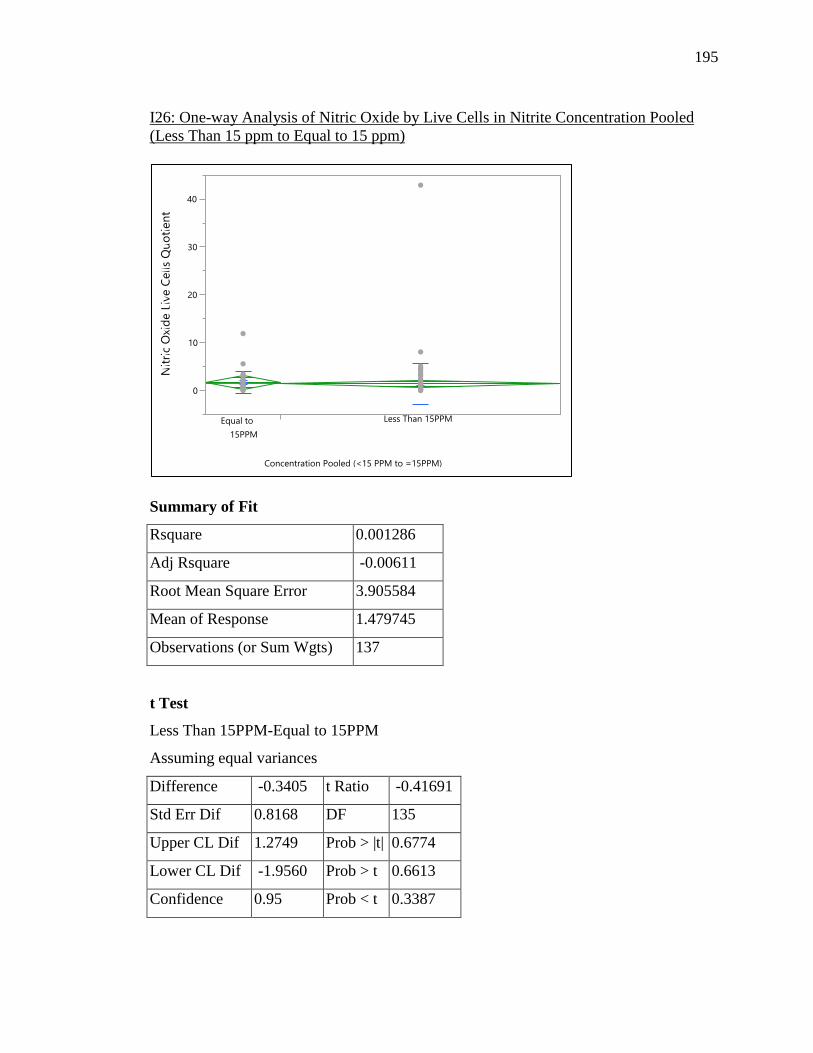
195
I26: One-way Analysis of Nitric Oxide by Live Cells in Nitrite Concentration Pooled (Less Than 15 ppm to Equal to 15 ppm)
Summary of Fit
Rsquare 0.001286
Adj Rsquare -0.00611
Root Mean Square Error 3.905584
Mean of Response 1.479745
Observations (or Sum Wgts) 137
t Test
Less Than 15PPM-Equal to 15PPM
Assuming equal variances
Difference -0.3405 t Ratio -0.41691
Std Err Dif 0.8168 DF 135
Upper CL Dif 1.2749 Prob > |t| 0.6774
Lower CL Dif -1.9560 Prob > t 0.6613
Confidence 0.95 Prob < t 0.3387
0
10
20
30
40
Equal to 15PPM
Less Than 15PPM
Concentration Pooled (<15 PPM to =15PPM)

196
Analysis of Variance
Source DF Sum of Squares Mean Square F Ratio Prob > F
Concentration Pooled
(<15 ppm to =15 ppm)
1 2.6513 2.6513 0.1738 0.6774
Error 135 2059.2342 15.2536
C. Total 136 2061.8855
Means for Oneway Anova
Level Number Mean Std Error Lower 95% Upper 95%
Equal to 15 ppm 29 1.74821 0.72525 0.31389 3.1825
Less Than 15 ppm 108 1.40766 0.37581 0.66441 2.1509
Std Error uses a pooled estimate of error variance
Means and Std Deviations
Level Number Mean Std
Dev
Std Err
Mean
Lower
95%
Upper
95%
Equal to 15 ppm 29 1.74821 2.283
41
0.42402 0.87965 2.6168
Less Than 15 ppm 108 1.40766 4.228
57
0.40689 0.60104 2.2143
-2 -1 0 1 2

197
t Test
Less Than 15 ppm -Equal to 15 ppm
Assuming unequal variances
Difference -0.3405 t Ratio -0.57949
Std Err Dif 0.5877 DF 84.54993
Upper CL Dif 0.8280 Prob > |t| 0.5638
Lower CL Dif -1.5091 Prob > t 0.7181
Confidence 0.95 Prob < t 0.2819
-2.0 -1.0 0.0 0.5 1.0 1.5 2.0

198
I27: One-way Analysis of Nitric Oxide by Dead Cells in Nitrite Concentration Pooled (Less Than 5 ppm to Equal or More Than 5 ppm)
Summary of Fit
Rsquare 0.00526
Adj Rsquare -0.00644
Root Mean Square Error 2.870137
Mean of Response 1.308391
Observations (or Sum Wgts) 87
t Test
Equal or More Than 5 ppm -Less Than 5 ppm
Assuming equal variances
Difference -0.4278 t Ratio -0.67041
Std Err Dif 0.6381 DF 85
Upper CL Dif 0.8410 Prob > |t| 0.5044
Lower CL Dif -1.6966 Prob > t 0.7478
Confidence 0.95 Prob < t 0.2522

199
Analysis of Variance
Source DF Sum of Squares Mean Square F Ratio Prob > F
Concentration Pooled
(<5 ppm to >5 ppm)
1 3.70246 3.70246 0.4495 0.5044
Error 85 700.20337 8.23769
C. Total 86 703.90583
Means for Oneway Anova
Level Number Mean Std
Error
Lower 95% Upper 95%
Less Than 5 ppm 32 1.57884 0.50737 0.57005 2.5876
Equal or More
Than 5 ppm
55 1.15104 0.38701 0.38156 1.9205
Std Error uses a pooled estimate of error variance
Means and Std Deviations
Level Number Mean Std Dev Std Err
Mean
Lower
95%
Upper
95%
Less Than 5 ppm 32 1.57884 3.23654 0.57214 0.41195 2.7457
Equal or More
Than 5 ppm
55 1.15104 2.63689 0.35556 0.43818 1.8639
-2.0 -1.0 0.0 0.5 1.0 1.5 2.0
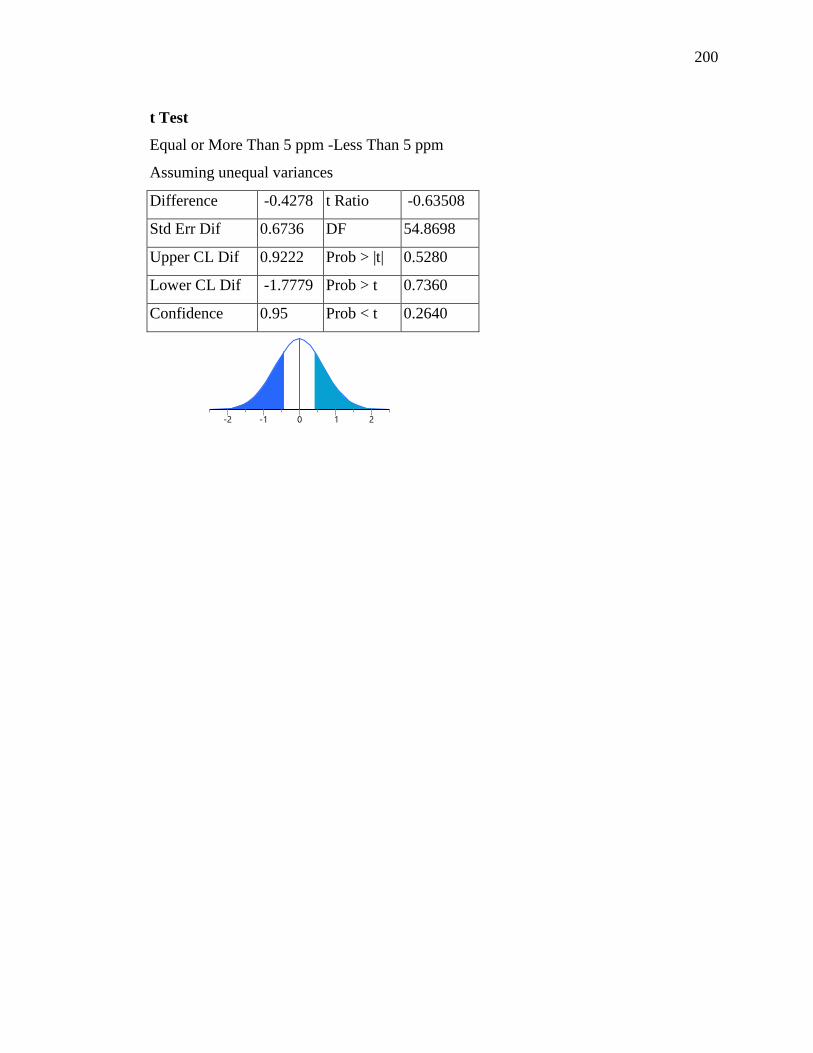
200
t Test
Equal or More Than 5 ppm -Less Than 5 ppm
Assuming unequal variances
Difference -0.4278 t Ratio -0.63508
Std Err Dif 0.6736 DF 54.8698
Upper CL Dif 0.9222 Prob > |t| 0.5280
Lower CL Dif -1.7779 Prob > t 0.7360
Confidence 0.95 Prob < t 0.2640
-2 -1 0 1 2

201
I28: One-way Analysis of Nitric Oxide by Dead Cells in Nitrite Concentration Pooled (Less Than 10 ppm to Equal or More Than 10 ppm)
Summary of Fit
Rsquare 0.000384
Adj Rsquare -0.01138
Root Mean Square Error 2.877163
Mean of Response 1.308391
Observations (or Sum Wgts) 87
t Test
Equal or More than10 ppm –Less than10 ppm
Assuming equal variances
Difference 0.1127 t Ratio 0.180707
Std Err Dif 0.6239 DF 85
Upper CL Dif 1.3533 Prob > |t| 0.8570
Lower CL Dif -1.1278 Prob > t 0.4285
Confidence 0.95 Prob < t 0.5715

202
Analysis of Variance
Source DF Sum of Squares Mean Square F Ratio Prob > F
Concentration Pooled 1 0.27032 0.27032 0.0327 0.8570
Error 85 703.63551 8.27806
C. Total 86 703.90583
Means for Oneway Anova
Level Number Mean Std
Error
Lower 95% Upper 95%
Less than 10 ppm 50 1.26044 0.40689 0.45143 2.0695
Equal or More
than10 ppm
37 1.37319 0.47300 0.43273 2.3136
Std Error uses a pooled estimate of error variance
Means and Std Deviations
Level Number Mean Std Dev Std Err
Mean
Lower
95%
Upper
95%
Less than10 ppm 50 1.26044 2.66180 0.37644 0.50396 2.0169
Equal or More
than10 ppm
37 1.37319 3.14670 0.51731 0.32403 2.4224
-2.0 -1.0 0.0 0.5 1.0 1.5 2.0

203
t Test
Equal or More than10 ppm-Less than10 ppm
Assuming unequal variances
Difference 0.1127 t Ratio 0.176231
Std Err Dif 0.6398 DF 69.83314
Upper CL Dif 1.3888 Prob > |t| 0.8606
Lower CL Dif -1.1633 Prob > t 0.4303
Confidence 0.95 Prob < t 0.5697
-2.0 -1.0 0.0 0.5 1.0 1.5 2.0
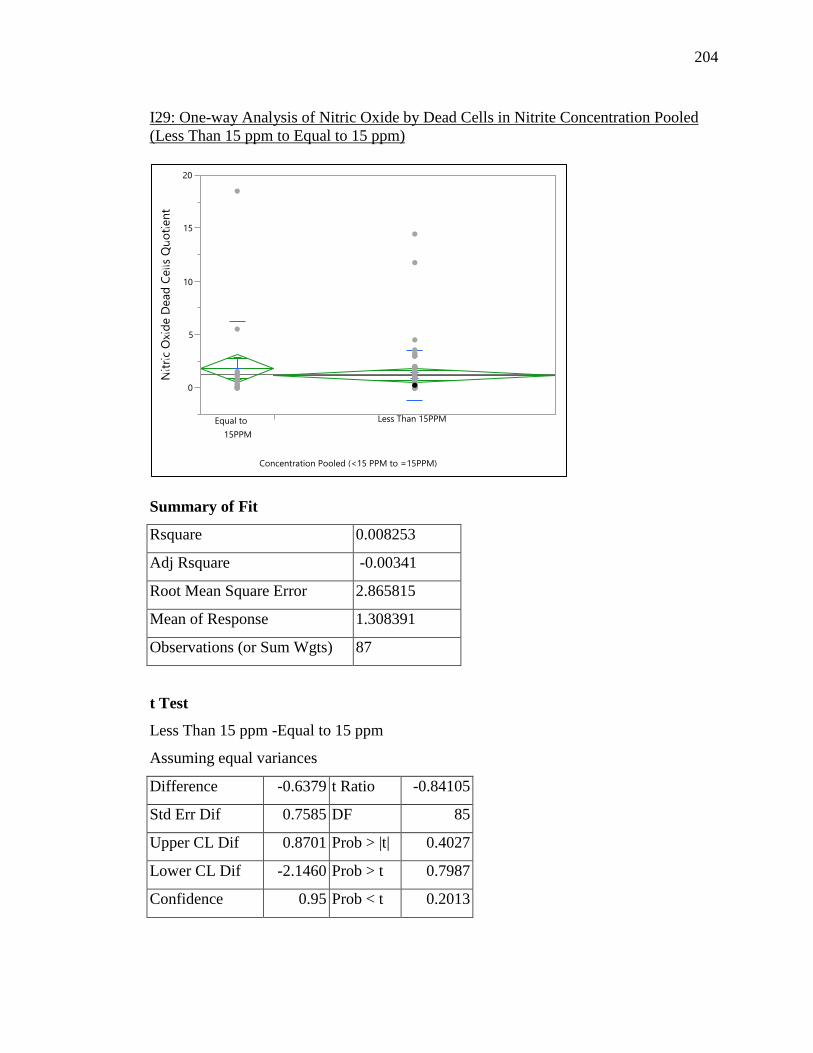
204
I29: One-way Analysis of Nitric Oxide by Dead Cells in Nitrite Concentration Pooled (Less Than 15 ppm to Equal to 15 ppm)
Summary of Fit
Rsquare 0.008253
Adj Rsquare -0.00341
Root Mean Square Error 2.865815
Mean of Response 1.308391
Observations (or Sum Wgts) 87
t Test
Less Than 15 ppm -Equal to 15 ppm
Assuming equal variances
Difference -0.6379 t Ratio -0.84105
Std Err Dif 0.7585 DF 85
Upper CL Dif 0.8701 Prob > |t| 0.4027
Lower CL Dif -2.1460 Prob > t 0.7987
Confidence 0.95 Prob < t 0.2013
0
5
10
15
20
Equal to 15PPM
Less Than 15PPM
Concentration Pooled (<15 PPM to =15PPM)

205
Analysis of Variance
Source DF Sum of Squares Mean Square F Ratio Prob > F
Concentration Pooled
(<15 ppm to =15 ppm)
1 5.80958 5.80958 0.7074 0.4027
Error 85 698.09624 8.21290
C. Total 86 703.90583
Means for Oneway Anova
Level Number Mean Std
Error
Lower 95% Upper 95%
Equal to 15 ppm 18 1.81433 0.67548 0.47130 3.1574
Less Than 15 ppm 69 1.17641 0.34500 0.49045 1.8624
Std Error uses a pooled estimate of error variance
Means and Std Deviations
Level Number Mean Std Dev Std
Err
Mean
Lower
95%
Upper
95%
Equal to 15 ppm 18 1.81433 4.35761 1.0271 -0.3527 3.9813
Less Than 15 ppm 69 1.17641 2.34924 0.2828 0.6121 1.7408
-2 -1 0 1 2

206
t Test
Less Than 15 ppm -Equal to 15 ppm
Assuming unequal variances
Difference -0.6379 t Ratio -0.59881
Std Err Dif 1.0653 DF 19.64736
Upper CL Dif 1.5869 Prob > |t| 0.5561
Lower CL Dif -2.8627 Prob > t 0.7219
Confidence 0.95 Prob < t 0.2781
-4 -3 -2 -1 0 1 2 3 4

207
I30: One-way Analysis of Nitric Oxide by Total Cells (Live + Dead) in Nitrite Concentration Pooled (Less Than 5 ppm to Equal or More Than 5 ppm)
Summary of Fit
Rsquare 0.015855
Adj Rsquare 0.00925
Root Mean Square Error 2.429784
Mean of Response 1.288479
Observations (or Sum Wgts) 151
t Test
Equal or More Than 5 ppm -Less Than 5 ppm
Assuming equal variances
Difference -0.6227 t Ratio -1.54935
Std Err Dif 0.4019 DF 149
Upper CL Dif 0.1715 Prob > |t| 0.1234
Lower CL Dif -1.4170 Prob > t 0.9383
Confidence 0.95 Prob < t 0.0617

208
Analysis of Variance
Source DF Sum of Squares Mean Square F Ratio Prob > F
Concentration Pooled
(<5 ppm to >5 ppm)
1 14.17203 14.1720 2.4005 0.1234
Error 149 879.67391 5.9039
C. Total 150 893.84594
Means for Oneway Anova
Level Number Mean Std Error Lower 95% Upper 95%
Less Than 5 ppm 62 1.65553 0.30858 1.0458 2.2653
Equal or More
Than 5 ppm
89 1.03278 0.25756 0.5238 1.5417
Std Error uses a pooled estimate of error variance
Means and Std Deviations
Level Number Mean Std Dev Std Err
Mean
Lower
95%
Upper
95%
Less Than 5 ppm 62 1.65553 3.61346 0.45891 0.73788 2.5732
Equal or More
Than 5 ppm
89 1.03278 0.97229 0.10306 0.82797 1.2376
-1.0 -0.5 0.0 0.5 1.0

209
t Test
Equal or More Than 5 ppm -Less Than 5 ppm
Assuming unequal variances
Difference -0.6227 t Ratio -1.32404
Std Err Dif 0.4703 DF 67.18994
Upper CL Dif 0.3160 Prob > |t| 0.1900
Lower CL Dif -1.5615 Prob > t 0.9050
Confidence 0.95 Prob < t 0.0950
-1.5 -1.0 -0.5 0.0 0.5 1.0 1.5

210
I31: One-way Analysis of Nitric Oxide by Total Cells (Live + Dead) in Nitrite Concentration Pooled (Less Than 10 ppm to Equal or More Than 10 ppm)
Summary of Fit
Rsquare 0.000411
Adj Rsquare -0.0063
Root Mean Square Error 2.448775
Mean of Response 1.288479
Observations (or Sum Wgts) 151
t Test
Equal or More than 10 ppm –Less than 10 ppm
Assuming equal variances
Difference -0.10025 t Ratio -0.24748
Std Err Dif 0.40509 DF 149
Upper CL Dif 0.70020 Prob > |t| 0.8049
Lower CL Dif -0.90071 Prob > t 0.5976
Confidence 0.95 Prob < t 0.4024

211
Analysis of Variance
Source DF Sum of Squares Mean Square F Ratio Prob > F
Concentration Pooled 1 0.36727 0.36727 0.0612 0.8049
Error 149 893.47867 5.99650
C. Total 150 893.84594
Means for Oneway Anova
Level Number Mean Std Error Lower 95% Upper 95%
Less than 10
ppm
89 1.32964 0.25957 0.81673 1.8426
Equal or More
than10 ppm
62 1.22939 0.31099 0.61486 1.8439
Std Error uses a pooled estimate of error variance
Means and Std Deviations
Level Number Mean Std Dev Std Err
Mean
Lower
95%
Upper
95%
Less than 10
ppm
89 1.32964 3.06242 0.32462 0.68454 1.9747
Equal or More
than10 ppm
62 1.22939 1.05720 0.13426 0.96091 1.4979
-1.0 -0.5 0.0 0.5 1.0

212
t Test
Equal or More than 10 ppm-Less than10 ppm
Assuming unequal variances
Difference -0.10025 t Ratio -0.28538
Std Err Dif 0.35129 DF 115.7955
Upper CL Dif 0.59553 Prob > |t| 0.7759
Lower CL Dif -0.79603 Prob > t 0.6121
Confidence 0.95 Prob < t 0.3879
-1.0 -0.5 0.0 0.5 1.0
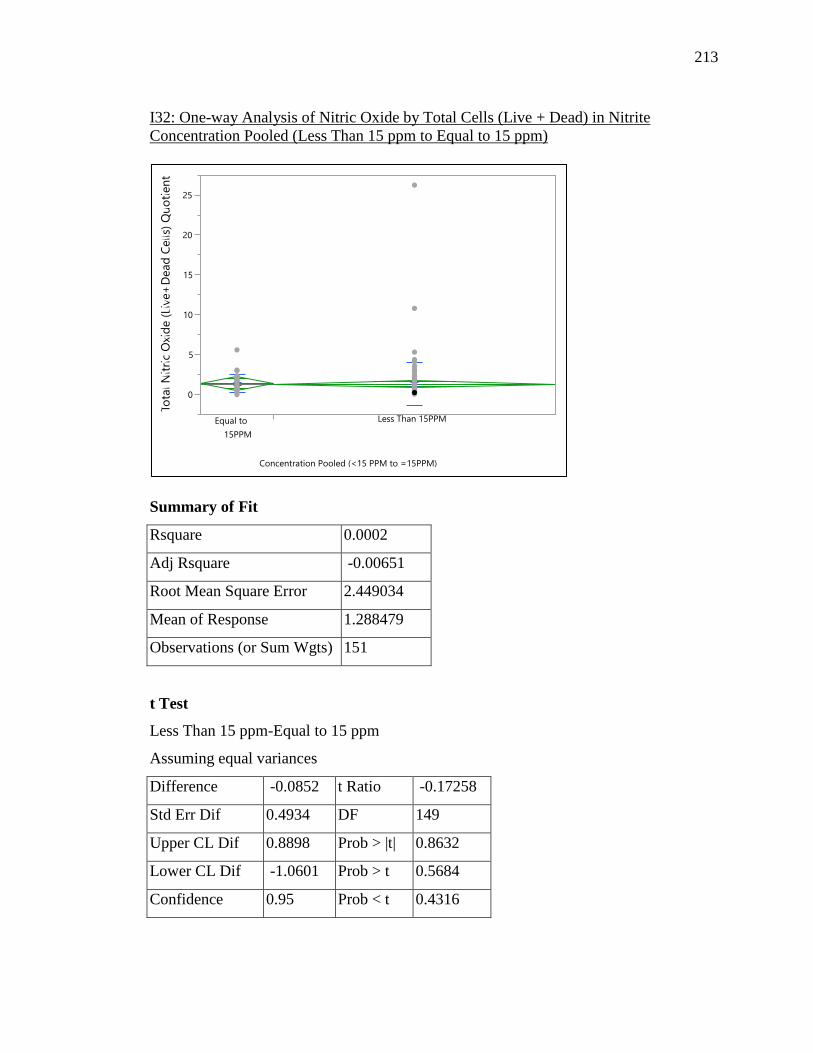
213
I32: One-way Analysis of Nitric Oxide by Total Cells (Live + Dead) in Nitrite Concentration Pooled (Less Than 15 ppm to Equal to 15 ppm)
Summary of Fit
Rsquare 0.0002
Adj Rsquare -0.00651
Root Mean Square Error 2.449034
Mean of Response 1.288479
Observations (or Sum Wgts) 151
t Test
Less Than 15 ppm-Equal to 15 ppm
Assuming equal variances
Difference -0.0852 t Ratio -0.17258
Std Err Dif 0.4934 DF 149
Upper CL Dif 0.8898 Prob > |t| 0.8632
Lower CL Dif -1.0601 Prob > t 0.5684
Confidence 0.95 Prob < t 0.4316
0
5
10
15
20
25
Equal to 15PPM
Less Than 15PPM
Concentration Pooled (<15 PPM to =15PPM)

214
Analysis of Variance
Source DF Sum of Squares Mean Square F Ratio Prob > F
Concentration Pooled
(<15 ppm to =15 ppm)
1 0.17863 0.17863 0.0298 0.8632
Error 149 893.66731 5.99777
C. Total 150 893.84594
Means for Oneway Anova
Level Number Mean Std
Error
Lower
95%
Upper
95%
Equal to 15 ppm 31 1.35615 0.43986 0.48698 2.2253
Less Than 15 ppm 120 1.27100 0.22357 0.82923 1.7128
Std Error uses a pooled estimate of error variance
Means and Std Deviations
Level Number Mean Std Dev Std Err
Mean
Lower
95%
Upper
95%
Equal to 15 ppm 31 1.35615 1.14497 0.20564 0.93617 1.7761
Less Than 15 ppm 120 1.27100 2.67942 0.24460 0.78667 1.7553
-1.5 -1.0 -0.5 0.0 0.5 1.0 1.5

215
t Test
Less Than 15 ppm -Equal to 15 ppm
Assuming unequal variances
Difference -0.08515 t Ratio -0.26647
Std Err Dif 0.31956 DF 116.264
Upper CL Dif 0.54776 Prob > |t| 0.7904
Lower CL Dif -0.71806 Prob > t 0.6048
Confidence 0.95 Prob < t 0.3952
-1.0 -0.5 0.0 0.5 1.0

216
I33: One-way Analysis of Nitric Oxide Activity among Osteoarthritis
Parameters Statistics Nitrite Concentrations
0 ppm 1 ppm 5 ppm 10 ppm 15 ppm
NO activity
with Live Cells
RSquare 0.058796 0.026538 0.02177 1.8957 0.014335
F Ratio 1.4368 0.7088 0.5119 1.8957 0.3927
Prob > F 0.2429 0.4075 0.4815 0.1795 0.5362
Prob>|t| 0.2429 0.4075 0.4815 0.1795 0.5362
NO activity
with Dead
Cells
RSquare 0.039804 0.106268 0.006211 0.017949 0.088011
F Ratio 0.5803 1.6647 0.1 0.3107 1.5441
Prob > F 0.4588 0.2179 0.7559 0.5845 0.2319
Prob>|t| 0.4588 0.2179 0.7559 0.5845 0.2319
NO activity
Total Cells
RSquare 0.035454 0.01815 0.013109 0.036438 0.005578
F Ratio 1.066 0.5361 0.3321 1.0967 0.1627
Prob > F 0.3104 0.4699 0.5696 0.3037 0.6897
Prob>|t| 0.3104 0.4699 0.5696 0.3037 0.6897
X axis: Osteoarthritis (Yes/No) Y axis: NO activity at various nitrite concentrations Y: Yes N: No
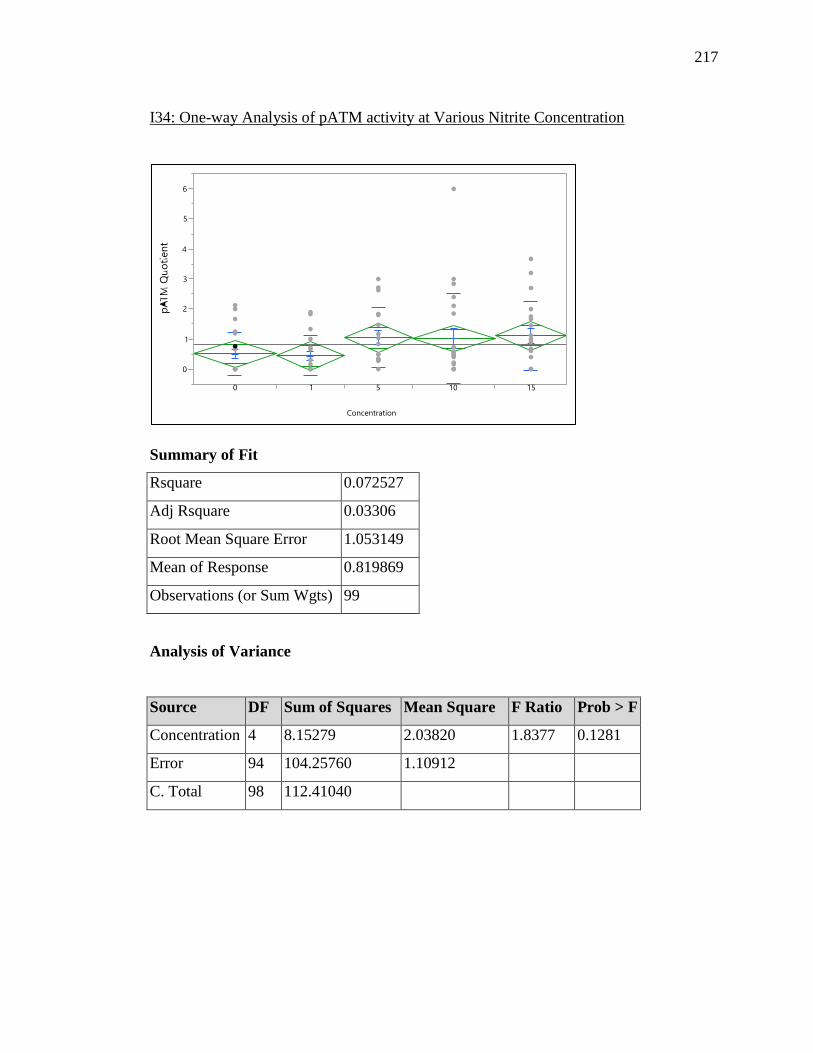
217
I34: One-way Analysis of pATM activity at Various Nitrite Concentration
Summary of Fit
Rsquare 0.072527
Adj Rsquare 0.03306
Root Mean Square Error 1.053149
Mean of Response 0.819869
Observations (or Sum Wgts) 99
Analysis of Variance
Source DF Sum of Squares Mean Square F Ratio Prob > F
Concentration 4 8.15279 2.03820 1.8377 0.1281
Error 94 104.25760 1.10912
C. Total 98 112.41040
0
1
2
3
4
5
6
0 1 5 10 15
Concentration

218
Means for Oneway Anova
Level Number Mean Std Error Lower 95% Upper 95%
0 22 0.50341 0.22453 0.0576 0.9492
1 18 0.43894 0.24823 -0.0539 0.9318
5 18 1.03872 0.24823 0.5459 1.5316
10 22 1.01609 0.22453 0.5703 1.4619
15 19 1.11263 0.24161 0.6329 1.5924
Std Error uses a pooled estimate of error variance
Means and Std Deviations
Level Number Mean Std Dev Std Err Mean Lower 95% Upper 95%
0 22 0.50341 0.71463 0.15236 0.18656 0.8203
1 18 0.43894 0.65637 0.15471 0.11254 0.7653
5 18 1.03872 0.98809 0.23289 0.54736 1.5301
10 22 1.01609 1.48250 0.31607 0.35879 1.6734
15 19 1.11263 1.14158 0.26190 0.56241 1.6629

219
I35: One-way Analysis of pH2AX activity at Various Nitrite Concentration
Summary of Fit
Rsquare 0.037396
Adj Rsquare 0.004203
Root Mean Square Error 1.355492
Mean of Response 1.084256
Observations (or Sum Wgts) 121
Analysis of Variance
Source DF Sum of Squares Mean Square F Ratio Prob > F
Concentration 4 8.27999 2.07000 1.1266 0.3474
Error 116 213.13363 1.83736
C. Total 120 221.41363
0
2
4
6
8
0 1 5 10 15
Concentration

220
Means for Oneway Anova
Level Number Mean Std Error Lower 95% Upper 95%
0 22 1.29073 0.28899 0.71834 1.8631
1 24 0.92967 0.27669 0.38165 1.4777
5 26 1.00242 0.26583 0.47591 1.5289
10 24 0.73725 0.27669 0.18923 1.2853
15 25 1.46920 0.27110 0.93226 2.0061
Std Error uses a pooled estimate of error variance
Means and Std Deviations
Level Number Mean Std Dev Std Err Mean Lower 95% Upper 95%
0 22 1.29073 1.86202 0.39698 0.46516 2.1163
1 24 0.92967 1.04170 0.21264 0.48980 1.3695
5 26 1.00242 1.09093 0.21395 0.56179 1.4431
10 24 0.73725 0.91986 0.18776 0.34883 1.1257
15 25 1.46920 1.66022 0.33204 0.78389 2.1545
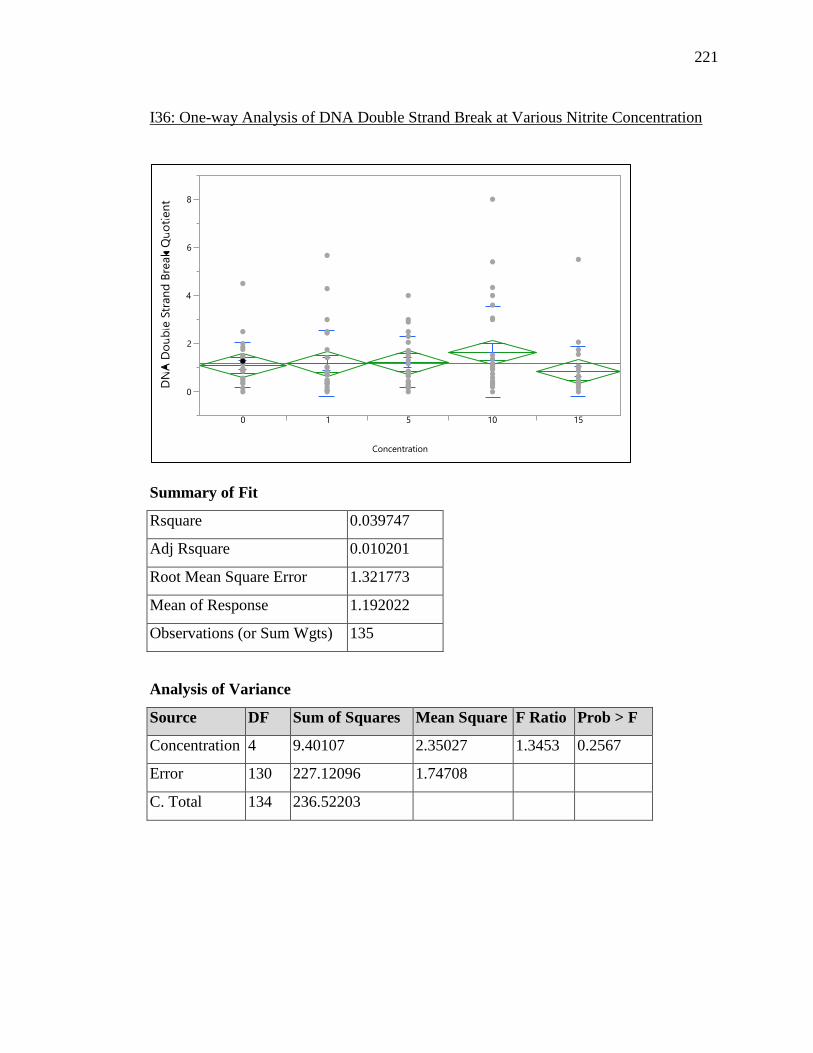
221
I36: One-way Analysis of DNA Double Strand Break at Various Nitrite Concentration
Summary of Fit
Rsquare 0.039747
Adj Rsquare 0.010201
Root Mean Square Error 1.321773
Mean of Response 1.192022
Observations (or Sum Wgts) 135
Analysis of Variance
Source DF Sum of Squares Mean Square F Ratio Prob > F
Concentration 4 9.40107 2.35027 1.3453 0.2567
Error 130 227.12096 1.74708
C. Total 134 236.52203
0
2
4
6
8
0 1 5 10 15
Concentration

222
Means for Oneway Anova
Level Number Mean Std Error Lower 95% Upper 95%
0 28 1.09593 0.24979 0.6017 1.5901
1 26 1.16038 0.25922 0.6475 1.6732
5 26 1.21512 0.25922 0.7023 1.7280
10 28 1.64107 0.24979 1.1469 2.1353
15 27 0.83422 0.25438 0.3310 1.3375
Std Error uses a pooled estimate of error variance
Means and Std Deviations
Level Number Mean Std Dev Std Err Mean Lower 95% Upper 95%
0 28 1.09593 0.93946 0.17754 0.73164 1.4602
1 26 1.16038 1.38763 0.27214 0.59991 1.7209
5 26 1.21512 1.05718 0.20733 0.78811 1.6421
10 28 1.64107 1.90945 0.36085 0.90066 2.3815
15 27 0.83422 1.05193 0.20244 0.41809 1.2504
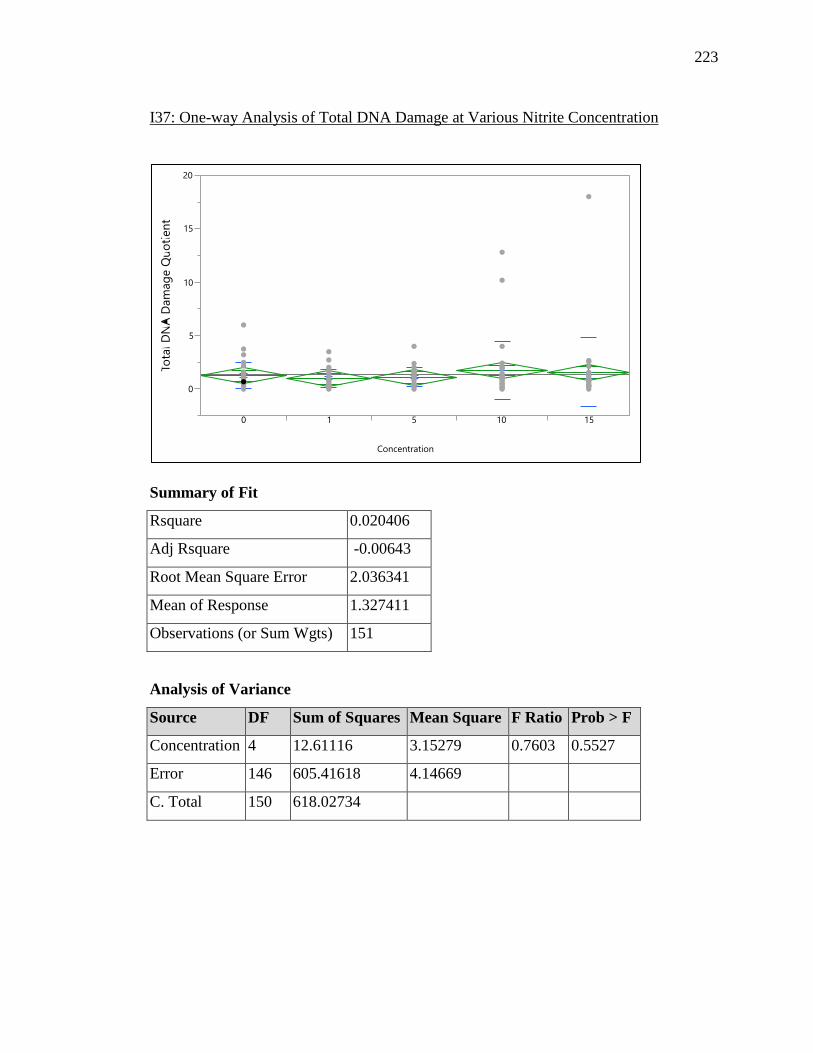
223
I37: One-way Analysis of Total DNA Damage at Various Nitrite Concentration
Summary of Fit
Rsquare 0.020406
Adj Rsquare -0.00643
Root Mean Square Error 2.036341
Mean of Response 1.327411
Observations (or Sum Wgts) 151
Analysis of Variance
Source DF Sum of Squares Mean Square F Ratio Prob > F
Concentration 4 12.61116 3.15279 0.7603 0.5527
Error 146 605.41618 4.14669
C. Total 150 618.02734
0
5
10
15
20
0 1 5 10 15
Concentration

224
Means for Oneway ANOVA
Level Number Mean Std Error Lower 95% Upper 95%
0 30 1.24830 0.37178 0.5135 1.9831
1 30 0.97857 0.37178 0.2438 1.7133
5 30 1.08683 0.37178 0.3521 1.8216
10 32 1.73725 0.35998 1.0258 2.4487
15 29 1.56676 0.37814 0.8194 2.3141
Std Error uses a pooled estimate of error variance
Means and Std Deviations
Level Number Mean Std Dev Std Err Mean Lower 95% Upper 95%
0 30 1.24830 1.22793 0.22419 0.78978 1.7068
1 30 0.97857 0.81706 0.14917 0.67347 1.2837
5 30 1.08683 0.87014 0.15886 0.76192 1.4117
10 32 1.73725 2.71519 0.47998 0.75832 2.7162
15 29 1.56676 3.22841 0.59950 0.33874 2.7948

225
I38: One-way Analysis of pATM activity in Nitrite Concentration Pooled (Less Than 5 ppm to Equal or More Than 5 ppm)
Summary of Fit
Rsquare 0.071261
Adj Rsquare 0.061687
Root Mean Square Error 1.037443
Mean of Response 0.819869
Observations (or Sum Wgts) 99
t Test
Equal or More Than 5 ppm -Less Than 5 ppm
Assuming equal variances
Difference 0.57968 t Ratio 2.728137
Std Err Dif 0.21248 DF 97
Upper CL Dif 1.00141 Prob > |t| 0.0076*
Lower CL Dif 0.15796 Prob > t 0.0038*
Confidence 0.95 Prob < t 0.9962

226
Analysis of Variance
Source DF Sum of Squares Mean Square F Ratio Prob > F
Concentration Pooled
(<5 ppm to >5 ppm)
1 8.01052 8.01052 7.4427 0.0076*
Error 97 104.39988 1.07629
C. Total 98 112.41040
Means for Oneway Anova
Level Number Mean Std Error Lower 95% Upper 95%
Less Than 5 ppm 40 0.47440 0.16403 0.14884 0.8000
Equal or More
Than 5 ppm
59 1.05408 0.13506 0.78602 1.3221
Std Error uses a pooled estimate of error variance
Means and Std Deviations
Level Number Mean Std Dev Std Err
Mean
Lower
95%
Upper
95%
Less Than 5 ppm 40 0.47440 0.68105 0.10768 0.25659 0.6922
Equal or More
Than 5 ppm
59 1.05408 1.21988 0.15881 0.73618 1.3720
-0.8 -0.4 0.0 0.2 0.4 0.6 0.8
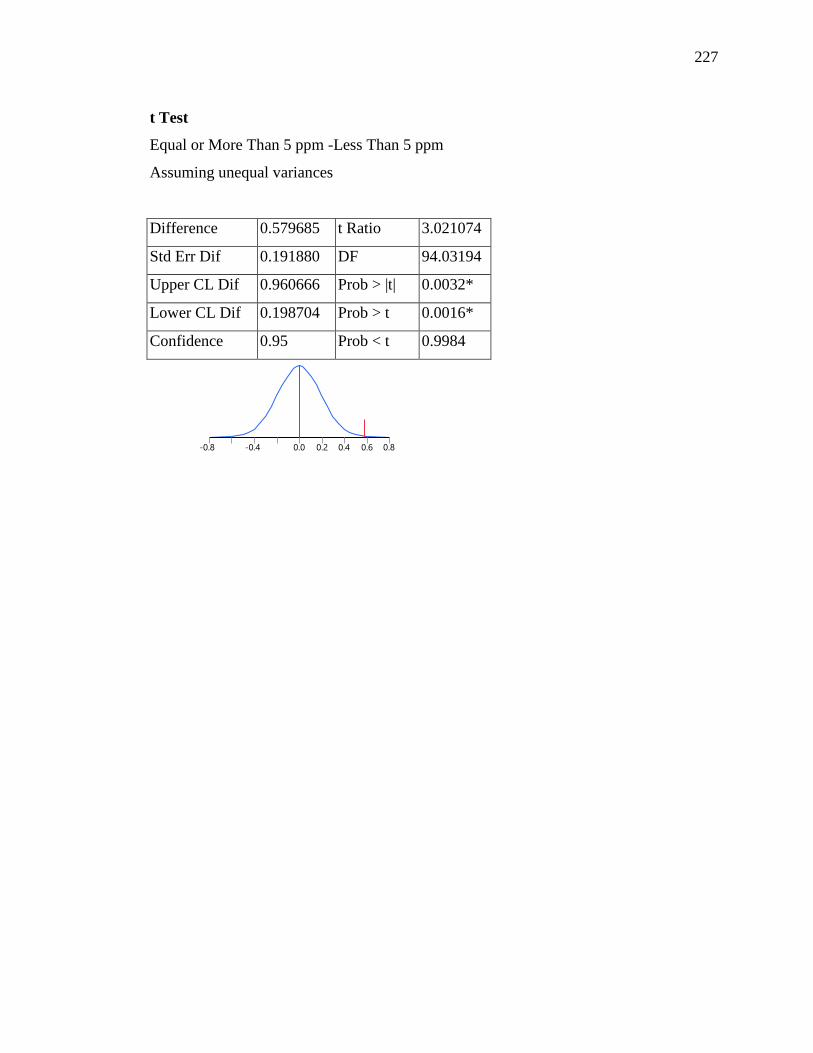
227
t Test
Equal or More Than 5 ppm -Less Than 5 ppm
Assuming unequal variances
Difference 0.579685 t Ratio 3.021074
Std Err Dif 0.191880 DF 94.03194
Upper CL Dif 0.960666 Prob > |t| 0.0032*
Lower CL Dif 0.198704 Prob > t 0.0016*
Confidence 0.95 Prob < t 0.9984
-0.8 -0.4 0.0 0.2 0.4 0.6 0.8
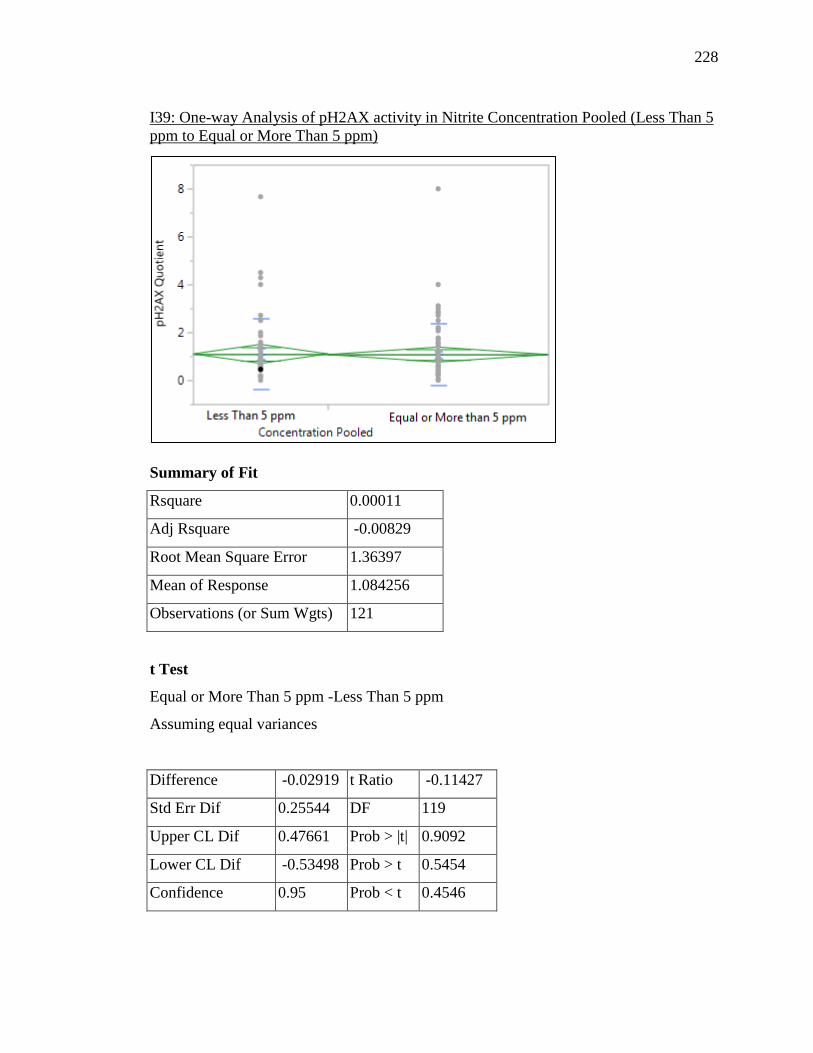
228
I39: One-way Analysis of pH2AX activity in Nitrite Concentration Pooled (Less Than 5 ppm to Equal or More Than 5 ppm)
Summary of Fit
Rsquare 0.00011
Adj Rsquare -0.00829
Root Mean Square Error 1.36397
Mean of Response 1.084256
Observations (or Sum Wgts) 121
t Test
Equal or More Than 5 ppm -Less Than 5 ppm
Assuming equal variances
Difference -0.02919 t Ratio -0.11427
Std Err Dif 0.25544 DF 119
Upper CL Dif 0.47661 Prob > |t| 0.9092
Lower CL Dif -0.53498 Prob > t 0.5454
Confidence 0.95 Prob < t 0.4546
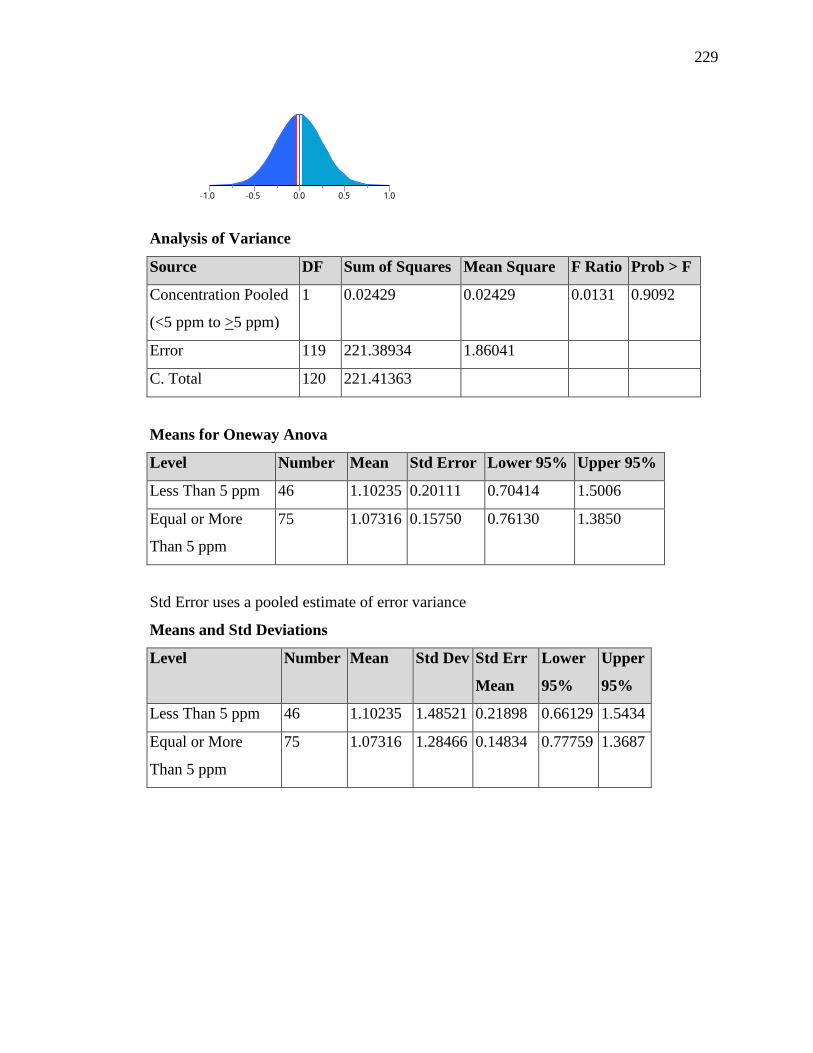
229
Analysis of Variance
Source DF Sum of Squares Mean Square F Ratio Prob > F
Concentration Pooled
(<5 ppm to >5 ppm)
1 0.02429 0.02429 0.0131 0.9092
Error 119 221.38934 1.86041
C. Total 120 221.41363
Means for Oneway Anova
Level Number Mean Std Error Lower 95% Upper 95%
Less Than 5 ppm 46 1.10235 0.20111 0.70414 1.5006
Equal or More
Than 5 ppm
75 1.07316 0.15750 0.76130 1.3850
Std Error uses a pooled estimate of error variance
Means and Std Deviations
Level Number Mean Std Dev Std Err
Mean
Lower
95%
Upper
95%
Less Than 5 ppm 46 1.10235 1.48521 0.21898 0.66129 1.5434
Equal or More
Than 5 ppm
75 1.07316 1.28466 0.14834 0.77759 1.3687
-1.0 -0.5 0.0 0.5 1.0
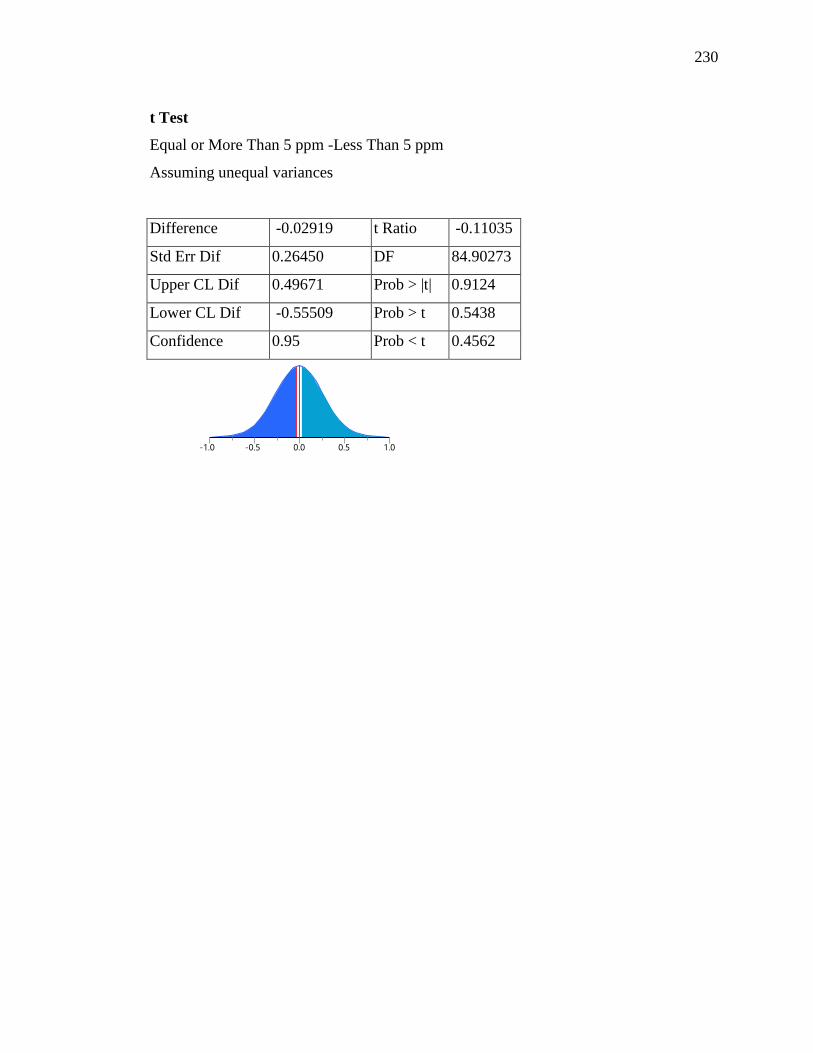
230
t Test
Equal or More Than 5 ppm -Less Than 5 ppm
Assuming unequal variances
Difference -0.02919 t Ratio -0.11035
Std Err Dif 0.26450 DF 84.90273
Upper CL Dif 0.49671 Prob > |t| 0.9124
Lower CL Dif -0.55509 Prob > t 0.5438
Confidence 0.95 Prob < t 0.4562
-1.0 -0.5 0.0 0.5 1.0

231
I40: One-way Analysis of DNA Double Strand Break in Nitrite Concentration Pooled (Less Than 5 ppm to Equal or More Than 5 ppm)
Summary of Fit
Rsquare 0.001611
Adj Rsquare -0.0059
Root Mean Square Error 1.332478
Mean of Response 1.192022
Observations (or Sum Wgts) 135
t Test
Equal or More Than 5 ppm -Less Than 5 ppm
Assuming equal variances
Difference 0.10843 t Ratio 0.463202
Std Err Dif 0.23409 DF 133
Upper CL Dif 0.57146 Prob > |t| 0.6440
Lower CL Dif -0.35459 Prob > t 0.3220
Confidence 0.95 Prob < t 0.6780

232
Analysis of Variance
Source DF Sum of Squares Mean Square F Ratio Prob > F
Concentration Pooled
(<5 ppm to >5 ppm)
1 0.38094 0.38094 0.2146 0.6440
Error 133 236.14109 1.77550
C. Total 134 236.52203
Means for Oneway Anova
Level Number Mean Std Error Lower 95% Upper 95%
Less Than 5 ppm 54 1.12696 0.18133 0.76830 1.4856
Equal or More
Than 5 ppm
81 1.23540 0.14805 0.94255 1.5282
Std Error uses a pooled estimate of error variance
Means and Std Deviations
Level Number Mean Std Dev Std Err
Mean
Lower
95%
Upper
95%
Less Than 5 ppm 54 1.12696 1.16574 0.15864 0.80878 1.4451
Equal or More
Than 5 ppm
81 1.23540 1.43229 0.15914 0.91869 1.5521
-0.8 -0.4 0.0 0.2 0.4 0.6 0.8
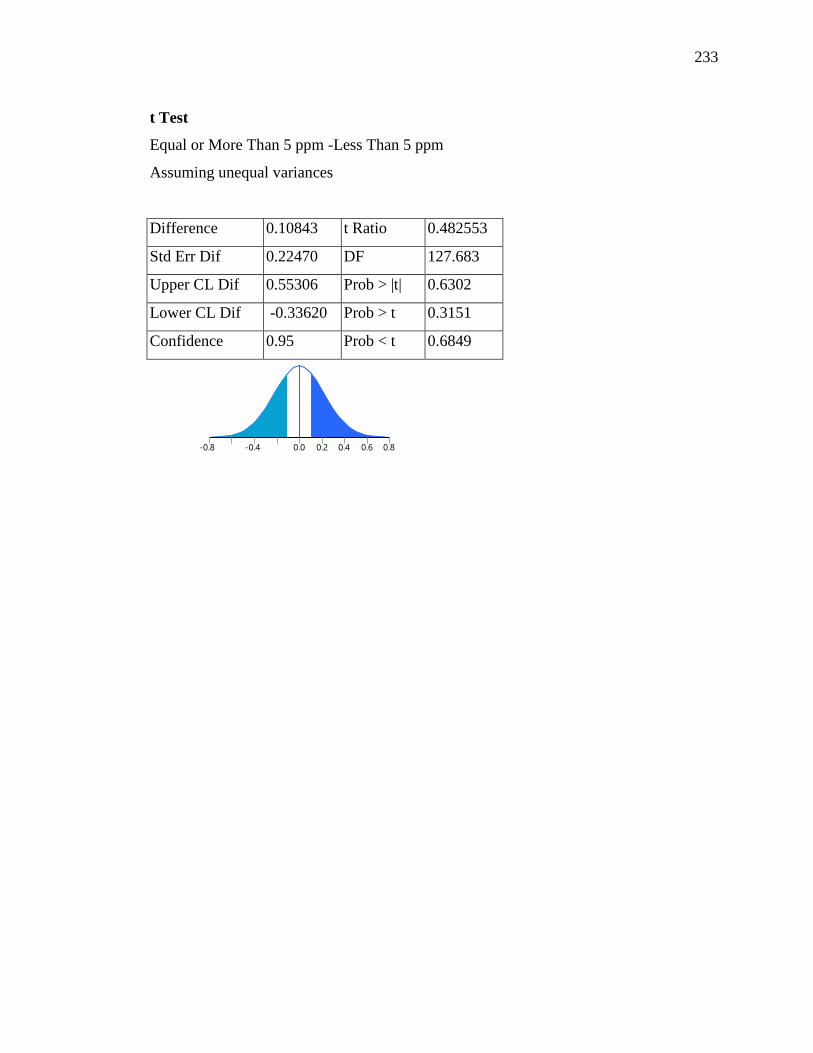
233
t Test
Equal or More Than 5 ppm -Less Than 5 ppm
Assuming unequal variances
Difference 0.10843 t Ratio 0.482553
Std Err Dif 0.22470 DF 127.683
Upper CL Dif 0.55306 Prob > |t| 0.6302
Lower CL Dif -0.33620 Prob > t 0.3151
Confidence 0.95 Prob < t 0.6849
-0.8 -0.4 0.0 0.2 0.4 0.6 0.8

234
I41: One-way Analysis of Total DNA Damage in Nitrite Concentration Pooled (Less Than 5 ppm to Equal or More Than 5 ppm)
Summary of Fit
Rsquare 0.007376
Adj Rsquare 0.000714
Root Mean Square Error 2.029098
Mean of Response 1.327411
Observations (or Sum Wgts) 151
t Test
Equal or More Than 5 ppm -Less Than 5 ppm
Assuming equal variances
Difference 0.3551 t Ratio 1.052223
Std Err Dif 0.3374 DF 149
Upper CL Dif 1.0218 Prob > |t| 0.2944
Lower CL Dif -0.3117 Prob > t 0.1472
Confidence 0.95 Prob < t 0.8528

235
Analysis of Variance
Source DF Sum of Squares Mean Square F Ratio Prob > F
Concentration Pooled
(<5 ppm to >5 ppm)
1 4.55850 4.55850 1.1072 0.2944
Error 149 613.46884 4.11724
C. Total 150 618.02734
Means for Oneway Anova
Level Number Mean Std Error Lower 95% Upper 95%
Less Than 5 ppm 60 1.11343 0.26196 0.5958 1.6311
Equal or More
Than 5 ppm
91 1.46849 0.21271 1.0482 1.8888
Std Error uses a pooled estimate of error variance
Means and Std Deviations
Level Number Mean Std Dev Std Err
Mean
Lower
95%
Upper
95%
Less Than 5 ppm 60 1.11343 1.04296 0.13465 0.84401 1.3829
Equal or More
Than 5 ppm
91 1.46849 2.47047 0.25898 0.95399 1.9830
-1.0 -0.5 0.0 0.5 1.0
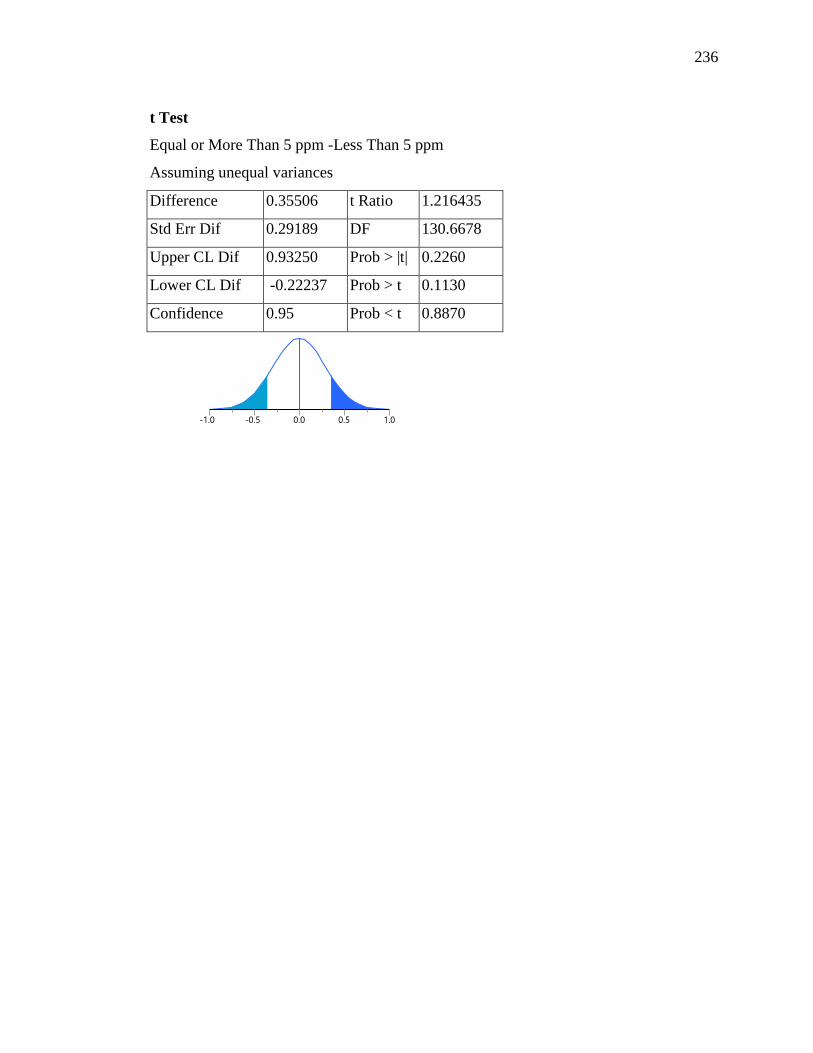
236
t Test
Equal or More Than 5 ppm -Less Than 5 ppm
Assuming unequal variances
Difference 0.35506 t Ratio 1.216435
Std Err Dif 0.29189 DF 130.6678
Upper CL Dif 0.93250 Prob > |t| 0.2260
Lower CL Dif -0.22237 Prob > t 0.1130
Confidence 0.95 Prob < t 0.8870
-1.0 -0.5 0.0 0.5 1.0
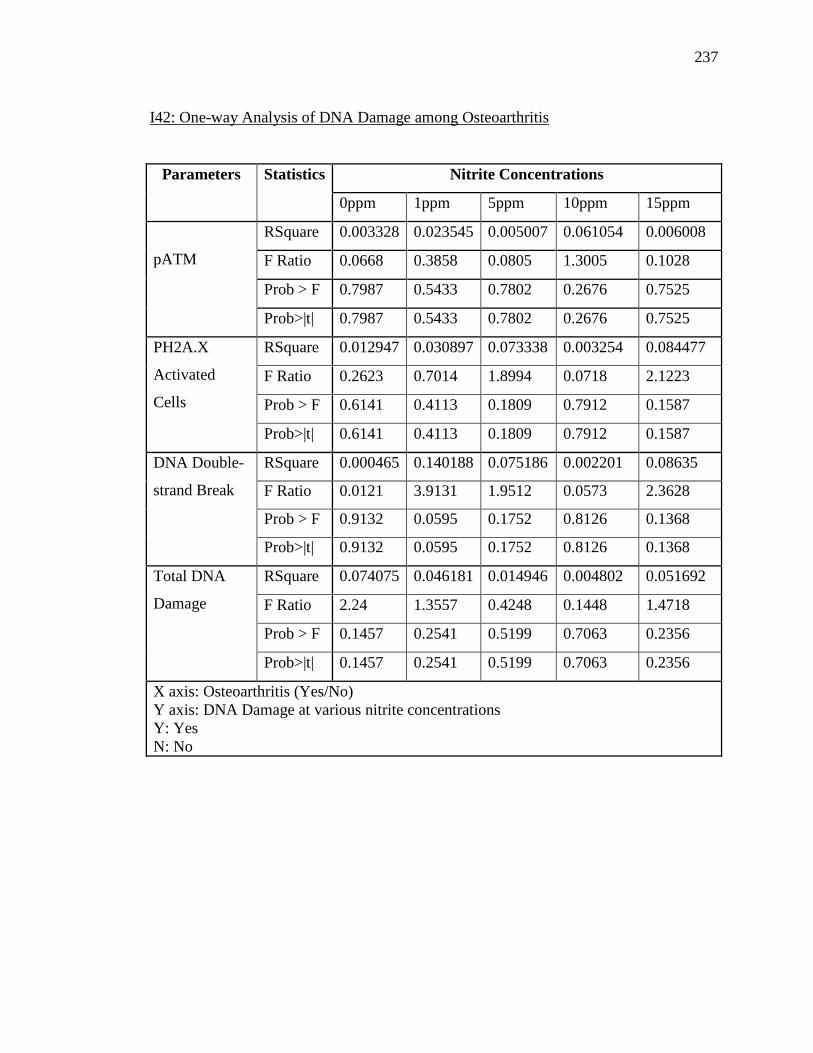
237
I42: One-way Analysis of DNA Damage among Osteoarthritis
Parameters Statistics Nitrite Concentrations
0ppm 1ppm 5ppm 10ppm 15ppm
pATM
RSquare 0.003328 0.023545 0.005007 0.061054 0.006008
F Ratio 0.0668 0.3858 0.0805 1.3005 0.1028
Prob > F 0.7987 0.5433 0.7802 0.2676 0.7525
Prob>|t| 0.7987 0.5433 0.7802 0.2676 0.7525
PH2A.X
Activated
Cells
RSquare 0.012947 0.030897 0.073338 0.003254 0.084477
F Ratio 0.2623 0.7014 1.8994 0.0718 2.1223
Prob > F 0.6141 0.4113 0.1809 0.7912 0.1587
Prob>|t| 0.6141 0.4113 0.1809 0.7912 0.1587
DNA Double-
strand Break
RSquare 0.000465 0.140188 0.075186 0.002201 0.08635
F Ratio 0.0121 3.9131 1.9512 0.0573 2.3628
Prob > F 0.9132 0.0595 0.1752 0.8126 0.1368
Prob>|t| 0.9132 0.0595 0.1752 0.8126 0.1368
Total DNA
Damage
RSquare 0.074075 0.046181 0.014946 0.004802 0.051692
F Ratio 2.24 1.3557 0.4248 0.1448 1.4718
Prob > F 0.1457 0.2541 0.5199 0.7063 0.2356
Prob>|t| 0.1457 0.2541 0.5199 0.7063 0.2356
X axis: Osteoarthritis (Yes/No) Y axis: DNA Damage at various nitrite concentrations Y: Yes N: No
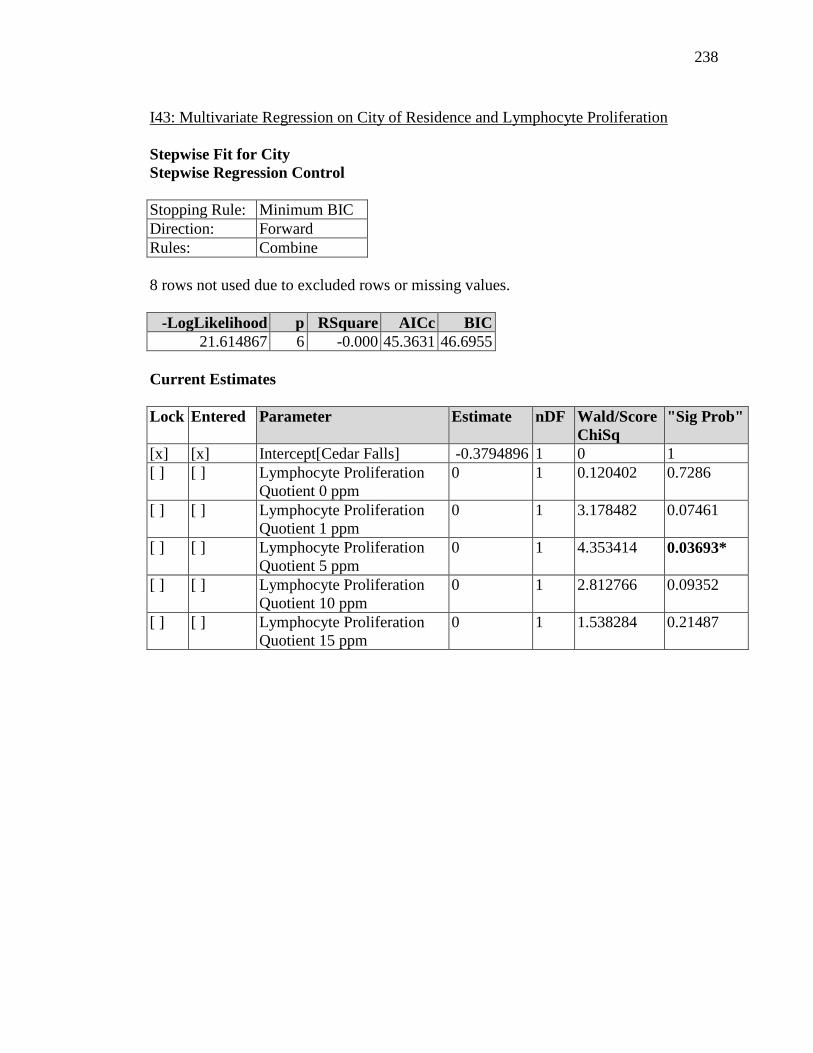
238
I43: Multivariate Regression on City of Residence and Lymphocyte Proliferation Stepwise Fit for City Stepwise Regression Control Stopping Rule: Minimum BIC Direction: Forward Rules: Combine 8 rows not used due to excluded rows or missing values.
-LogLikelihood p RSquare AICc BIC 21.614867 6 -0.000 45.3631 46.6955
Current Estimates Lock Entered Parameter Estimate nDF Wald/Score
ChiSq "Sig Prob"
[x] [x] Intercept[Cedar Falls] -0.3794896 1 0 1 [ ] [ ] Lymphocyte Proliferation
Quotient 0 ppm 0 1 0.120402 0.7286
[ ] [ ] Lymphocyte Proliferation Quotient 1 ppm
0 1 3.178482 0.07461
[ ] [ ] Lymphocyte Proliferation Quotient 5 ppm
0 1 4.353414 0.03693*
[ ] [ ] Lymphocyte Proliferation Quotient 10 ppm
0 1 2.812766 0.09352
[ ] [ ] Lymphocyte Proliferation Quotient 15 ppm
0 1 1.538284 0.21487

239
I44: Multivariate Regression on Osteoarthritis (Yes/No) and Lymphocyte Proliferation Stepwise Fit for Osteoarthritis Stepwise Regression Control Stopping Rule: Minimum BIC Direction: Forward Rules: Combine 8 rows not used due to excluded rows or missing values. -LogLikelihood p RSquare AICc BIC 22.18071 6 0.0000 46.4948 47.8272 Current Estimates Lock Entered Parameter Estimate nDF Wald/Score
ChiSq "Sig Prob"
[x] [x] Intercept[No] -9.835e-15 1 0 1 [ ] [ ] Lymphocyte Proliferation
Quotient 0 ppm 0 1 0.046226 0.82977
[ ] [ ] Lymphocyte Proliferation Quotient 1 ppm
0 1 1.25985 0.26168
[ ] [ ] Lymphocyte Proliferation Quotient 5 ppm
0 1 4.311354 0.03786*
[ ] [ ] Lymphocyte Proliferation Quotient 10 ppm
0 1 0.601773 0.4379
[ ] [ ] Lymphocyte Proliferation Quotient 15 ppm
0 1 0.252972 0.61499

240
I45: Multivariate Regression on Number of Medications and Lymphocyte Proliferation Stepwise Fit for Medication Count Stepwise Regression Control Stopping Rule: Minimum BIC Direction: Forward 8 rows not used due to excluded rows or missing values. SSE DFE RMSE RSquare RSquare Adj Cp p AICc BIC 104.66667 26 2.0064 0.0000 0.0000 8.3741946 1 117.7062 119.7978 Current Estimates Lock Entered Parameter Estimate nDF SS "F
Ratio" "Prob>F"
[x] [x] Intercept 1.888 1 0 0.000 1 [ ] [ ] Lymphocyte Proliferation
Quotient 0 ppm 0 1 1.675842 0.407 0.5294
[ ] [ ] Lymphocyte Proliferation Quotient 1 ppm
0 1 3.467237 0.857 0.36356
[ ] [ ] Lymphocyte Proliferation Quotient 5 ppm
0 1 12.26922 3.320 0.08044
[ ] [ ] Lymphocyte Proliferation Quotient 10 ppm
0 1 1.614115 0.392 0.53714
[ ] [ ] Lymphocyte Proliferation Quotient 15 ppm
0 1 19.07177 5.570 0.02638*

241
I46: Multivariate Regression on Age and DNA Damage Stepwise Fit for Age Stepwise Regression Control Stopping Rule: Minimum BIC Direction: Forward 30 rows not used due to excluded rows or missing values. SSE DFE RMSE RSquare RSquare Adj Cp p AICc BIC 98.8 4 4.9699095 0.0000 0.0000 . 1 39.10768 32.32656 Current Estimates Lock Entered Parameter Estimate nDF SS "F
Ratio" "Prob>F"
[x] [x] Intercept 54.8 1 0 0.000 1 [ ] [ ] pATM 0 ppm 0 1 27.04864 1.131 0.36559 [ ] [ ] pATM 1 ppm 0 1 39.75183 2.020 0.25039 [ ] [ ] pATM 5 ppm 0 1 16.53261 0.603 0.49408 [ ] [ ] pATM 10 ppm 0 1 3.675664 0.116 0.75595 [ ] [ ] pATM 15 ppm 0 1 12.91405 0.451 0.54991 [ ] [ ] DNA Double Strand Break 0 ppm 0 1 6.849604 0.223 0.66867 [ ] [ ] DNA Double Strand Break 1 ppm 0 1 17.05106 0.626 0.48669 [ ] [ ] DNA Double Strand Break 5 ppm 0 1 79.45266 12.320 0.0392* [ ] [ ] DNA Double Strand Break 10 ppm 0 1 0.717183 0.022 0.89165 [ ] [ ] DNA Double Strand Break 15 ppm 0 1 51.04381 3.207 0.17127 [ ] [ ] pH2AX 0 ppm 0 1 39.69554 2.015 0.25083 [ ] [ ] pH2AX 1 ppm 0 1 0.00242 0.000 0.9937 [ ] [ ] pH2AX 5 ppm 0 1 2.446449 0.076 0.80048 [ ] [ ] pH2AX 10 ppm 0 1 6.546395 0.213 0.67591 [ ] [ ] pH2AX 15 ppm 0 1 0.090438 0.003 0.96148 [ ] [ ] Total DNA Damage 0 ppm 0 1 34.58279 1.616 0.29331 [ ] [ ] Total DNA Damage 1 ppm 0 1 16.16394 0.587 0.49941 [ ] [ ] Total DNA Damage 5 ppm 0 1 44.08672 2.417 0.21784 [ ] [ ] Total DNA Damage 10 ppm 0 1 9.481657 0.318 0.61197 [ ] [ ] Total DNA Damage 15 ppm 0 1 6.410048 0.208 0.67923

242
I47: Multivariate Regression on Drinking Water Source and DNA Damage Stepwise Fit for Drinking Water Source Stepwise Regression Control Stopping Rule: Minimum BIC Direction: Forward Rules: Combine -LogLikelihood p RSquare AICc BIC 3.3650583 21 -0.000 10.0635 8.33955 Current Estimates Lock Entered Parameter Estimate nDF Wald/Score
ChiSq “Sig Prob”
[x] [x] Intercept[City Water] 0.405 1 0 1 [ ] [ ] pATM 0 ppm 0 1 0.032615 0.85668 [ ] [ ] pATM 1 ppm 0 1 4.778267 0.02882* [ ] [ ] pATM 5 ppm 0 1 0.000392 0.9842 [ ] [ ] pATM 10 ppm 0 1 1.050069 0.30549 [ ] [ ] pATM 15 ppm 0 1 0.032601 0.85671 [ ] [ ] DNA Double Strand Break 0 ppm 0 1 1.279933 0.25791 [ ] [ ] DNA Double Strand Break 1 ppm 0 1 2.491354 0.11447 [ ] [ ] DNA Double Strand Break 5 ppm 0 1 1.387456 0.23884 [ ] [ ] DNA Double Strand Break 10 ppm 0 1 0.000246 0.98749 [ ] [ ] DNA Double Strand Break 15 ppm 0 1 2.15323 0.14227 [ ] [ ] pH2AX 0 ppm 0 1 1.705646 0.19155 [ ] [ ] pH2AX 1 ppm 0 1 0.487483 0.48505 [ ] [ ] pH2AX 5 ppm 0 1 2.267261 0.13213 [ ] [ ] pH2AX 10 ppm 0 1 2.330852 0.12683 [ ] [ ] pH2AX 15 ppm 0 1 1.026954 0.31088 [ ] [ ] Total DNA Damage 0 ppm 0 1 1.461584 0.22668 [ ] [ ] Total DNA Damage 1 ppm 0 1 0.192698 0.66068 [ ] [ ] Total DNA Damage e5 ppm 0 1 0.017997 0.89328 [ ] [ ] Total DNA Damage 10 ppm 0 1 0.29513 0.58695 [ ] [ ] Total DNA Damage 15 ppm 0 1 0.177152 0.67383

243
I48: Multivariate Regression on Immunization and DNA Damage Stepwise Fit for Immunization Stepwise Regression Control Stopping Rule: Minimum BIC Direction: Forward Rules: Combine -LogLikelihood p RSquare AICc BIC 2.5020121 21 0.0000 8.33736 6.61346 Current Estimates Lock Entered Parameter Estimate nDF Wald/Score
ChiSq "Sig Prob"
[x] [x] Intercept[No] 1.3862 1 0 1 [ ] [ ] pATM 0 ppm 0 1 0.722033 0.39548 [ ] [ ] pATM 1 ppm 0 1 0.796378 0.37218 [ ] [ ] pATM 5 ppm 0 1 1.719622 0.18974 [ ] [ ] pATM 10 ppm 0 1 0.537646 0.46341 [ ] [ ] pATM 15 ppm 0 1 1.179936 0.27737 [ ] [ ] DNA Double Strand Break 0 ppm 0 1 0.227911 0.63308 [ ] [ ] DNA Double Strand Break 1 ppm 0 1 4.057145 0.04398* [ ] [ ] DNA Double Strand Break 5 ppm 0 1 0.095652 0.75711 [ ] [ ] DNA Double Strand Break 10 ppm 0 1 0.866967 0.3518 [ ] [ ] DNA Double Strand Break 15 ppm 0 1 2.269595 0.13193 [ ] [ ] pH2AX 0 ppm 0 1 0.000424 0.98358 [ ] [ ] pH2AX 1 ppm 0 1 4.214185 0.04009* [ ] [ ] pH2AX 5 ppm 0 1 1.833545 0.17571 [ ] [ ] pH2AX 10 ppm 0 1 1.494962 0.22145 [ ] [ ] pH2AX 15 ppm 0 1 0.225537 0.63485 [ ] [ ] T Total DNA Damage 0 ppm 0 1 0.10056 0.75116 [ ] [ ] Total DNA Damage 1 ppm 0 1 0.909069 0.34036 [ ] [ ] Total DNA Damage 5 ppm 0 1 0.110717 0.73933 [ ] [ ] Total DNA Damage 10 ppm 0 1 0.822843 0.36435 [ ] [ ] Total DNA Damage 15 ppm 0 1 0.028565 0.86579
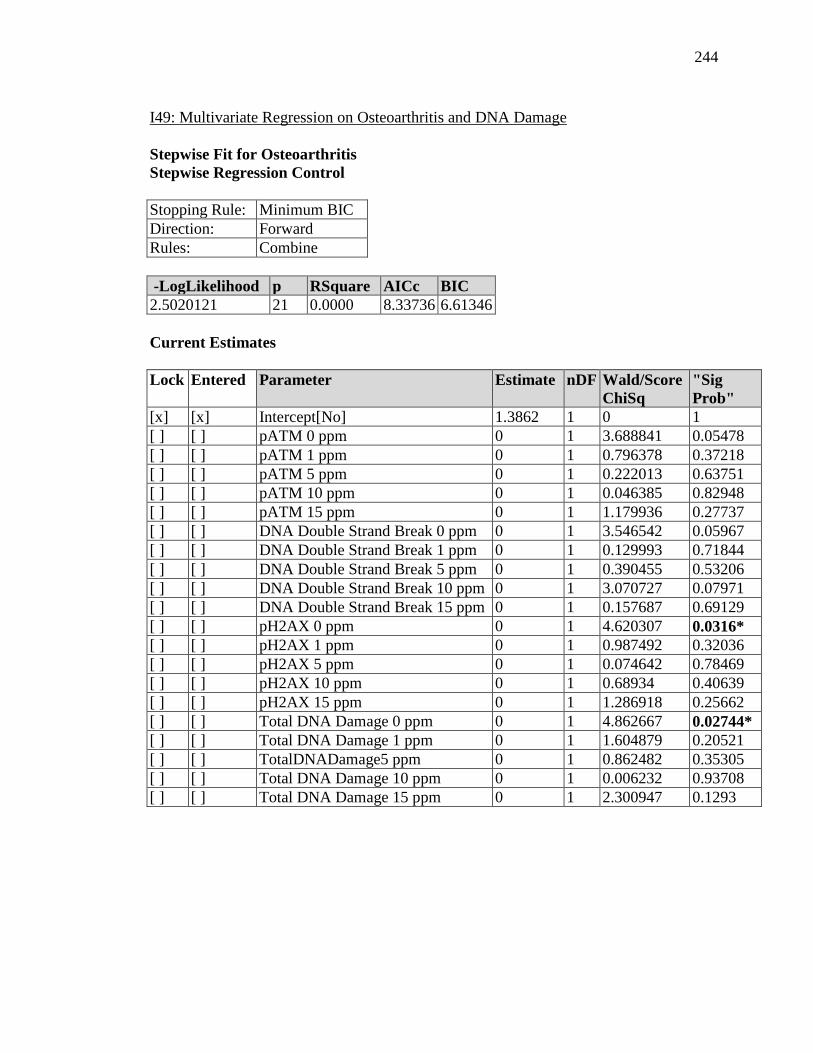
244
I49: Multivariate Regression on Osteoarthritis and DNA Damage Stepwise Fit for Osteoarthritis Stepwise Regression Control Stopping Rule: Minimum BIC Direction: Forward Rules: Combine -LogLikelihood p RSquare AICc BIC 2.5020121 21 0.0000 8.33736 6.61346 Current Estimates Lock Entered Parameter Estimate nDF Wald/Score
ChiSq "Sig Prob"
[x] [x] Intercept[No] 1.3862 1 0 1 [ ] [ ] pATM 0 ppm 0 1 3.688841 0.05478 [ ] [ ] pATM 1 ppm 0 1 0.796378 0.37218 [ ] [ ] pATM 5 ppm 0 1 0.222013 0.63751 [ ] [ ] pATM 10 ppm 0 1 0.046385 0.82948 [ ] [ ] pATM 15 ppm 0 1 1.179936 0.27737 [ ] [ ] DNA Double Strand Break 0 ppm 0 1 3.546542 0.05967 [ ] [ ] DNA Double Strand Break 1 ppm 0 1 0.129993 0.71844 [ ] [ ] DNA Double Strand Break 5 ppm 0 1 0.390455 0.53206 [ ] [ ] DNA Double Strand Break 10 ppm 0 1 3.070727 0.07971 [ ] [ ] DNA Double Strand Break 15 ppm 0 1 0.157687 0.69129 [ ] [ ] pH2AX 0 ppm 0 1 4.620307 0.0316* [ ] [ ] pH2AX 1 ppm 0 1 0.987492 0.32036 [ ] [ ] pH2AX 5 ppm 0 1 0.074642 0.78469 [ ] [ ] pH2AX 10 ppm 0 1 0.68934 0.40639 [ ] [ ] pH2AX 15 ppm 0 1 1.286918 0.25662 [ ] [ ] Total DNA Damage 0 ppm 0 1 4.862667 0.02744* [ ] [ ] Total DNA Damage 1 ppm 0 1 1.604879 0.20521 [ ] [ ] TotalDNADamage5 ppm 0 1 0.862482 0.35305 [ ] [ ] Total DNA Damage 10 ppm 0 1 0.006232 0.93708 [ ] [ ] Total DNA Damage 15 ppm 0 1 2.300947 0.1293

245
APPENDIX J
PHOTOGRAPH OF TISSUE CULTURE PLATE
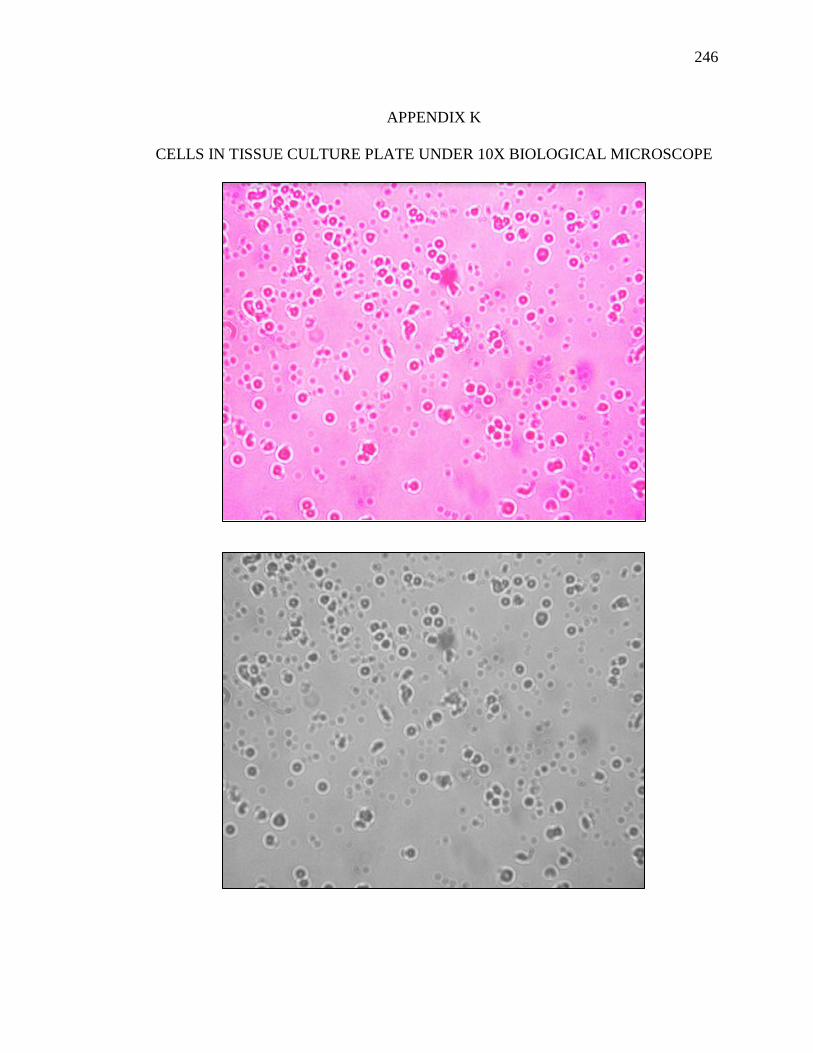
246
APPENDIX K
CELLS IN TISSUE CULTURE PLATE UNDER 10X BIOLOGICAL MICROSCOPE
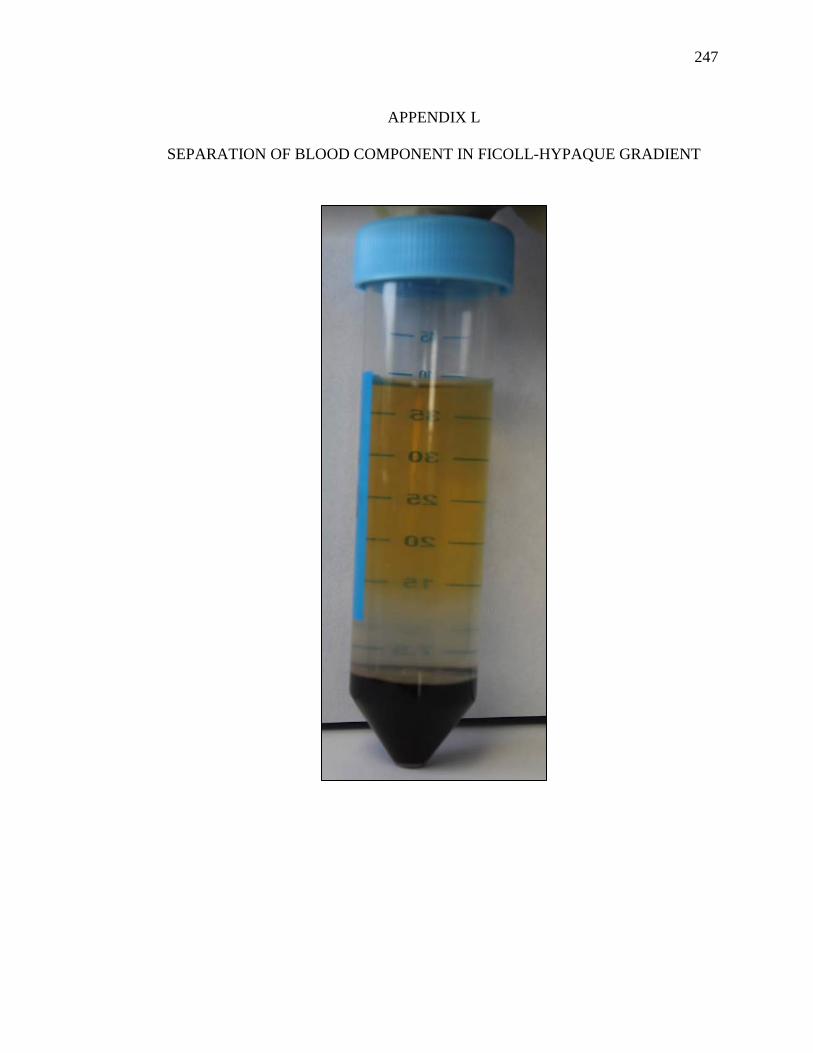
247
APPENDIX L
SEPARATION OF BLOOD COMPONENT IN FICOLL-HYPAQUE GRADIENT

248
APPENDIX M
PHOTOS OF LABORATORY EXPERIMENTS