study of local spectral irradiance for the …eprints.utar.edu.my/2764/1/fyp2_final_report... ·...
TRANSCRIPT
STUDY OF LOCAL SPECTRAL IRRADIANCE FOR THE APPLICATIONS
OF ORGANIC PHOTOVOLTAIC
AARON HONG KAI JEAT
A project report submitted in partial fulfilment of the
requirements for the award of the degree of
Bachelor of Science (Hons.) Physics
Lee Kong Chian Faculty of Engineering and Science
Universiti Tunku Abdul Rahman
May 2016

ii
DECLARATION
I hereby declare that this project report is based on my original work except for
citations and quotations which have been duly acknowledged. I also declare that it has
not been previously and concurrently submitted for any other degree or award at
UTAR or other institutions.
Signature : _________________________
Name : Aaron Hong Kai Jeat
ID No. : 941211-05-5023
Date : _________________________

iii
APPROVAL FOR SUBMISSION
I certify that this project report entitled “STUDY OF LOCAL SPECTRAL
IRRADIANCE FOR THE APPLICATIONS OF ORGANIC PHOTOVOLTAIC”
was prepared by AARON HONG KAI JEAT has met the required standard for
submission in partial fulfilment of the requirements for the award of Bachelor of
Science (Hons.) Physics at Universiti Tunku Abdul Rahman.
Approved by,
Signature : _________________________
Supervisor : Prof. Dr. Chong Kok Keong
Date : _________________________

iv
The copyright of this report belongs to the author under the terms of the
copyright Act 1987 as qualified by Intellectual Property Policy of University Tunku
Abdul Rahman. Due acknowledgement shall always be made of the use of any
material contained in, or derived from, this report.
© 2016, Aaron Hong Kai Jeat. All right reserved.

v
ACKNOWLEDGEMENTS
I would like to thank everyone who had contributed to the successful completion of
this project. I would like to express my gratitude to my research supervisor, Prof. Dr.
Chong Kok Keong for his invaluable advice, guidance and his enormous patience
throughout the development of the research.
In addition, I would also like to express my gratitude to my loving parents and
friends who had helped, supported and given me encouragement in spite of all the time
this project took me away from them.

vi
STUDY OF LOCAL SPECTRAL IRRADIANCE FOR THE APPLICATIONS
OF ORGANIC PHOTOVOLTAIC
ABSTRACT
The performance of organic photovoltaic devices is greatly dependent on the local
spectral irradiances, which is different attributed to spatial and atmospheric variations.
In this project, the local spectral irradiances have been collected from January to July
2016 and all the data can be separated into three categories for organic solar cell
performance analyses. The three categories of spectral irradiances are local direct
spectral irradiance, local diffuse spectral irradiance, and the local total average spectral
irradiance. The on-site measurements have shown that the peak intensities of the
spectral irradiances are at the ranges of 550 – 600 nm, 500 – 550 nm, and 550 – 600
nm for local direct spectral irradiance, local diffuse spectral irradiance, and the local
total average spectral irradiance respectively, while the peak intensity of the standard
AM 1.5G reference is calculated at 450 – 500 nm. The red-shifted of local spectral
irradiances were proved to grant better power conversion efficiency for the organic
solar cells, as compared to the illumination of AM 1.5G spectrum. Among the studied
organic materials, [PTB7:PC60BM] shows the highest power conversion efficiency of
6.90% under local total average spectral irradiance, with an improvement of 10.10%
with respect to illumination under AM 1.5G spectrum. The distribution of local
average photon energy was studied to offer an alternative suggestion in organic solar
cells bandgap designations for its use in the ASEAN region.
vii
TABLE OF CONTENTS
DECLARATION ii
APPROVAL FOR SUBMISSION iii
ACKNOWLEDGEMENTS v
ABSTRACT vi
TABLE OF CONTENTS vii
LIST OF TABLES ix
LIST OF FIGURES xi
LIST OF SYMBOLS / ABBREVIATIONS xv
LIST OF APPENDICES xvii
CHAPTER
1 INTRODUCTION 1
1.1 Research background 1
1.2 Research aims and objectives 2
2 LITERATURE REVIEW 4
2.1 Weather conditions in Kajang, Malaysia 4
2.2 Local spectral irradiances in Kajang, Malaysia 5
2.3 Comparison of average photon energy measured in ASEAN region 6
2.4 The future of organic solar cells 7
2.5 Photovoltaics’ data of various organic materials under AM 1.5G
illumination 10
3 THEORY AND METHODOLOGY 11
3.1 Integrated Spectral Irradiance 11
3.2 Average photon energy of local spectral irradiances 11
3.3 External quantum efficiency and device responsivity 12

viii
3.4 Photovoltaics’ data of organic solar cells 13
3.5 Air mass, relative humidity, and Naan & Riordan Considerations 14
3.6 Spectral irradiances collection uses AVANTES spectrometer 15
3.7 Simulations and calculations by Matrix Laboratory 16
4 RESULTS AND DISCUSSIONS 18
4.1 Local annual spectral irradiances versus reference standard AM 1.5G
18
4.2 Organic materials’ performance under illumination of standard
reference spectrum AM 1.5G 22
4.3 Organic materials’ performance under illumination of various local
spectral irradiances 26
4.3.1 Local direct spectral irradiance illumination 27
4.3.2 Local diffuse spectral irradiance illumination 30
4.3.3 Local total average spectral irradiance illumination 33
4.3.4 Summary of the organic materials’ performance under
different spectral irradiance illumination conditions 36
4.4 Local average photon energy distribution 38
4.5 Probability of getting direct spectral irradiance during daytime 40
5 CONCLUSIONS AND RECOMMENDATIONS 42
REFERENCES 44
APPENDICES 47

ix
LIST OF TABLES
TABLE TITLE PAGE
2.1: Parameters of Various Organic Materials under AM
1.5G Illumination 10
4.1: Weightage of each specific wavelength range of
various spectral irradiance (300 nm – 1100 nm) 21
4.2: Various organic solar materials' photovoltaic data
under the illumination of AM 1.5G (Improvement
of PCE compared to published AM 1.5G) 25
4.3: Various organic materials' photovoltaic data under
the illumination of local direct spectral irradiance
(Improvement of PCE compared to AM 1.5G) 29
4.4: Various organic materials' photovoltaic data under
the illumination of local diffuse spectral irradiance
(Improvement of PCE compared to AM 1.5G) 32
4.5: Various organic materials' photovoltaic data under
the illumination of local diffuse spectral irradiance
(Improvement of PCE was done with respect to
local direct spectral irradiance PCE (L. Direct PCE)
32

x
4.6: Various organic solar cells' photovoltaic data under
the illumination of local total average spectral
irradiance (Improvement of PCE compared to AM
1.5G) 36
4.7: Power conversion efficiency (%) of each of the
organic materials subjected to different spectral
irradiance illuminations 37
4.8: Power conversion efficiency (%) improvement of
each of the organic materials with respect to AM
1.5G Spectrum 37

xi
LIST OF FIGURES
FIGURE TITLE PAGE
2.1: Average photon energy measured under Thailand
climatic conditions (taken from (Sirisamphanwong,
2011)) 7
2.2: Conventional structure of organic solar cells with
bottom-illumination (taken from (Lim, 2012)) 8
2.3: Inverted structure of organic solar cells with
bottom-illumination (taken from (Lim, 2012)) 9
3.1: Processing steps of spectral irradiance collection by
the AVANTES spectrometer 16
3.2: The main part of the MATLAB's coding that used
to calculate the values of ISI and APE 17
4.1: Local annual direct spectral irradiance at each hour
(8.00 am - 6.00 pm) versus wavelength (the middle
period for each hour, for example 830 denotes as
0800 – 0859 for convenience of results presentation)
18
4.2: Local diffuse spectral irradiance at each hour (8.00
am - 6.00 pm) versus wavelength (the middle period
for each hour, for example 830 denotes as 0800 –
0859 for convenience of results presentation) 20

xii
4.3: Local spectral irradiance collected in total average
(blue line), local direct (green line), and local
diffuse (red line), by comparing to AM 1.5G
(yellow-red marker) 20
4.4: External Quantum Efficiency (EQE) of organic
materials under the illumination of AM 1.5G
spectrum (The yellow-red marker is AM 1.5G
spectrum, while the coloured smooth lines are
device QE) 23
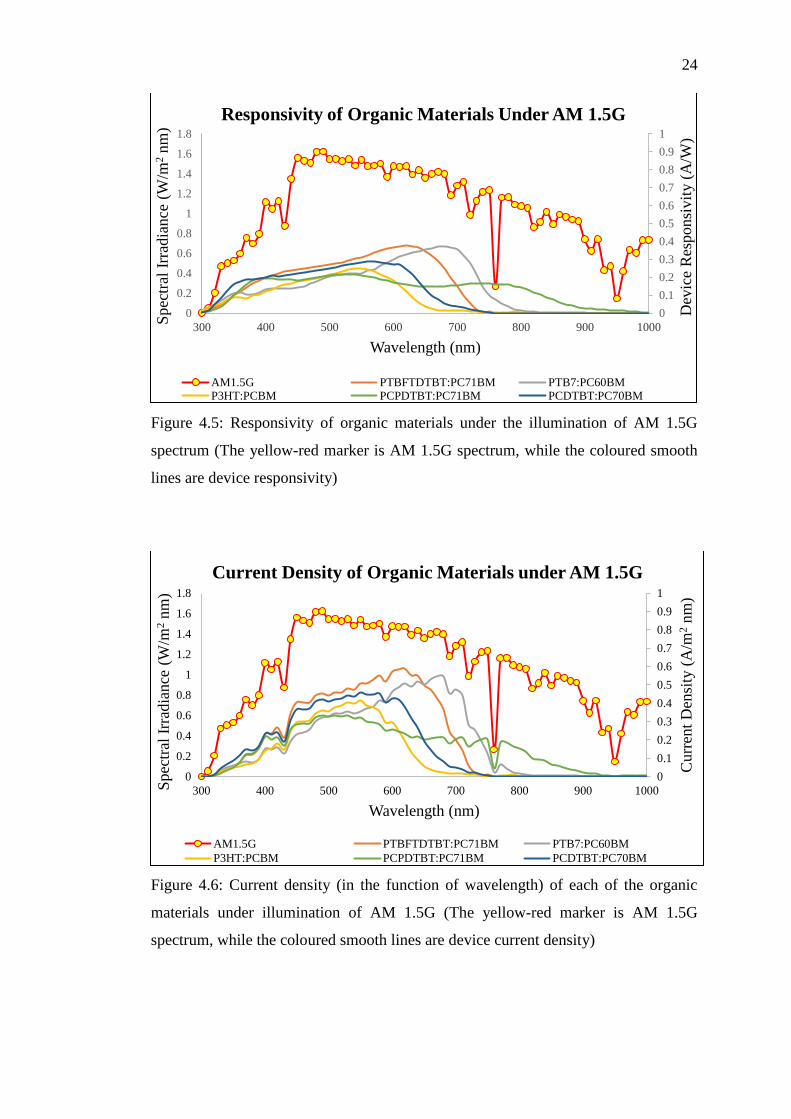
4.5: Responsivity of organic materials under the
illumination of AM 1.5G spectrum (The yellow-red
marker is AM 1.5G spectrum, while the coloured
smooth lines are device responsivity) 24
4.6: Current density (in the function of wavelength) of
each of the organic materials under illumination of
AM 1.5G (The yellow-red marker is AM 1.5G
spectrum, while the coloured smooth lines are
device current density) 24
4.7: External Quantum Efficiency (EQE) of organic
materials under the illumination of local direct
spectral irradiance (green line with solid symbol
denotes the local direct spectral irradiance, while
the coloured smooth lines are device QE) 27
4.8: Responsivity of organic materials under the
illumination of local direct spectral irradiance
(green line with solid symbol denotes the local
direct spectral irradiance, while the coloured
smooth lines are device responsivity) 28

xiii
4.9: Current density (in the function of Wavelength) of
each of the organic materials under illumination of
local direct spectral irradiance (green line with solid
symbol denotes the local direct spectral irradiance,
while the coloured smooth lines are device current
density) 28
4.10: External Quantum Efficiency (EQE) of organic
materials under the illumination of local diffuse
spectral irradiance (red line with solid symbol
denotes the local diffuse spectral irradiance, while
the coloured smooth lines are device QE) 30
4.11: Responsivity of organic materials under the
illumination of local diffuse spectral irradiance (red
line with solid symbol denotes the local diffuse
spectral irradiance, while the coloured smooth lines
are device responsivity) 31
4.12: Current density (in the function of wavelength) of
each of the organic materials under illumination of
local diffuse spectral irradiance (red line with solid
symbol denotes the local diffuse spectral irradiance,
while the coloured smooth lines are device current
density) 31
4.13: External Quantum Efficiency (EQE) of organic
materials under the illumination of local total
average spectral irradiance (light-blue line with
solid symbol denotes the local total average spectral
irradiance, while the coloured smooth lines are
device QE) 34

xiv
4.14: Responsivity of organic materials under the
illumination of local total average spectral
irradiance (light-blue line with solid symbol
denotes the local total average spectral irradiance,
while the coloured smooth lines are device
responsivity) 35
4.15: Current density (in the function of Wavelength) of
each of the organic materials under illumination of
local total average spectral irradiance (light-blue
line with solid symbol denotes the local total
average spectral irradiance, while the coloured
smooth lines are device current density) 35
4.16: Distribution of average photon energy (APE) for
local direct and local diffuse spectral irradiances
(green bars indicate local direct spectrum APEs; red
bars indicate local diffuse spectrum APEs) 39
4.17: Distribution of average photon energy (APE) under
local total average spectral irradiance illumination 39
4.18: Probability of having direct sunlight throughout the
day on the site at Universiti Tunku Abdul Rahman
(UTAR), Kajang, Malaysia (the middle period for
each hour, for example 830 denotes as 0800 – 0859
for convenience of results presentation) 41
xv
LIST OF SYMBOLS / ABBREVIATIONS
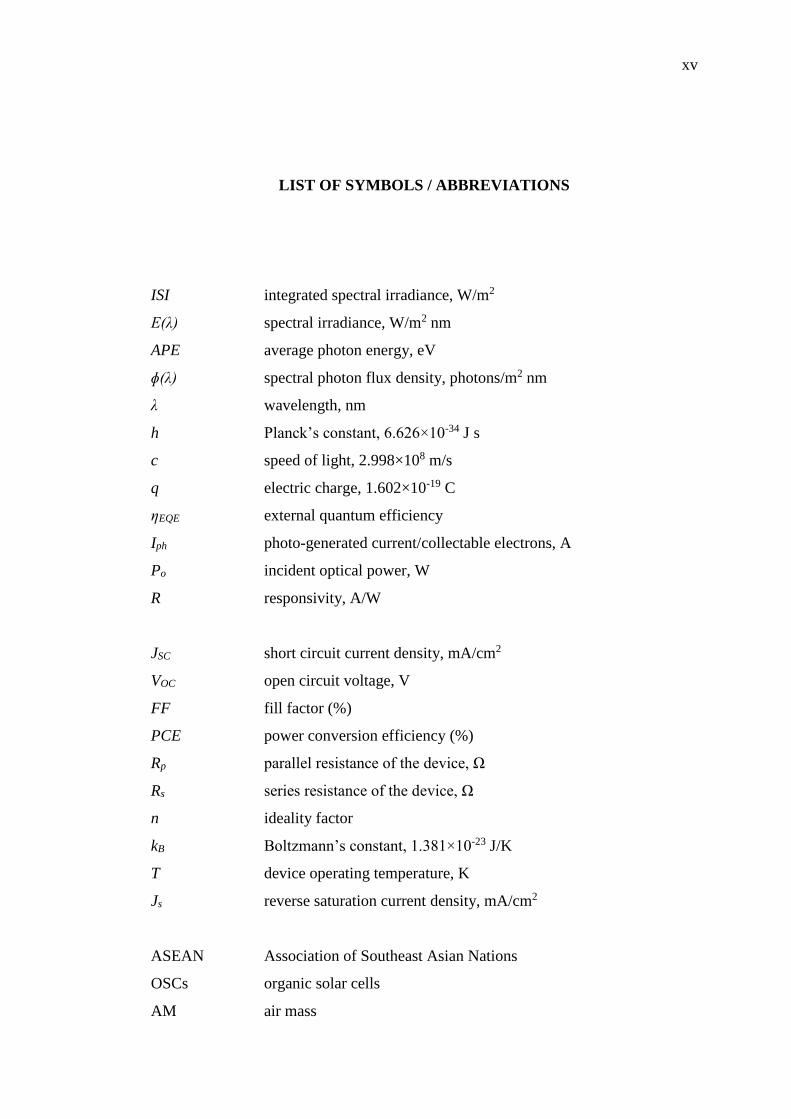
ISI integrated spectral irradiance, W/m2
E(λ) spectral irradiance, W/m2 nm
APE average photon energy, eV
ɸ(λ) spectral photon flux density, photons/m2 nm
λ wavelength, nm
h Planck’s constant, 6.626×10⁻³⁴ J s
c speed of light, 2.998×10⁸ m/s
q electric charge, 1.602×10⁻¹⁹ C
ƞEQE external quantum efficiency
Iph photo-generated current/collectable electrons, A
Po incident optical power, W
R responsivity, A/W
JSC short circuit current density, mA/cm2
VOC open circuit voltage, V
FF fill factor (%)
PCE power conversion efficiency (%)
Rp parallel resistance of the device, Ω
Rs series resistance of the device, Ω
n ideality factor
kB Boltzmann’s constant, 1.381×10⁻²³ J/K
T device operating temperature, K
Js reverse saturation current density, mA/cm2
ASEAN Association of Southeast Asian Nations
OSCs organic solar cells
AM air mass

xvi
AM 1.5G AM 1.5 global spectrum
ASTM American Society for Testing and Materials
USA United State of America
EHPs electron-hole pairs
ITO indium tin oxide
Device QE device quantum efficiency
J current density
V voltage
MATLAB Matrix Laboratory
xvii
LIST OF APPENDICES
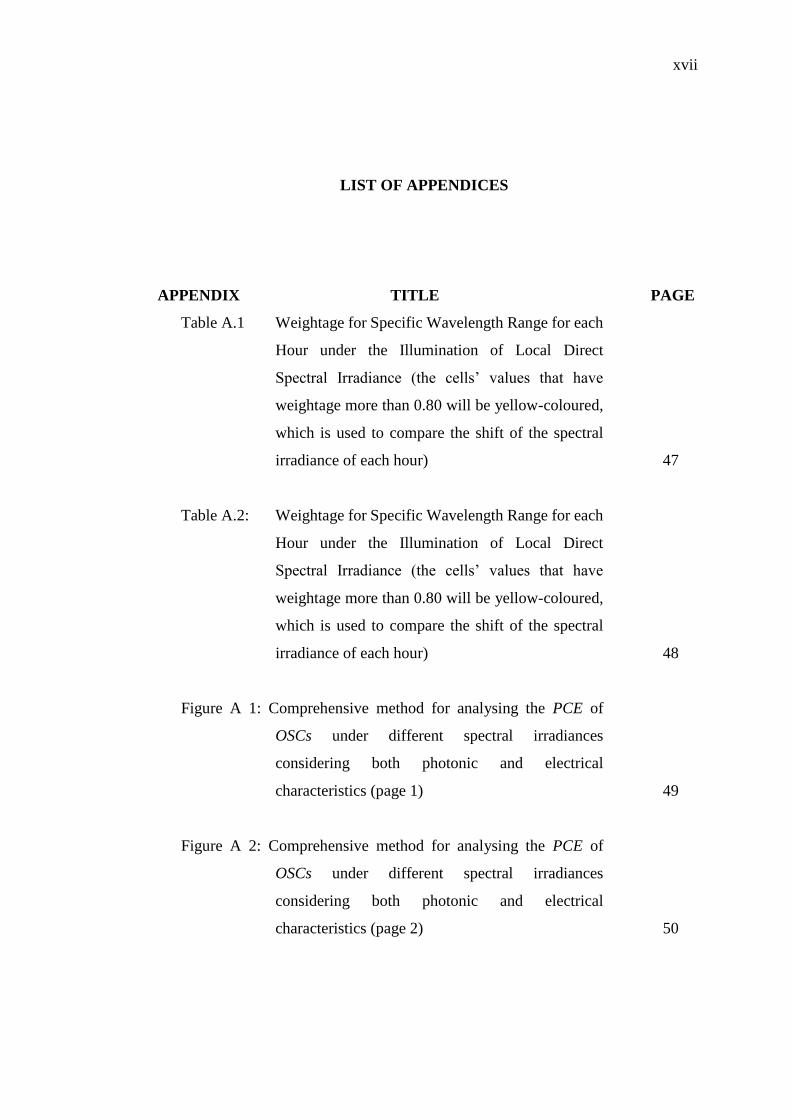
APPENDIX TITLE PAGE
Table A.1 Weightage for Specific Wavelength Range for each
Hour under the Illumination of Local Direct
Spectral Irradiance (the cells’ values that have
weightage more than 0.80 will be yellow-coloured,
which is used to compare the shift of the spectral
irradiance of each hour) 47
Table A.2: Weightage for Specific Wavelength Range for each
Hour under the Illumination of Local Direct
Spectral Irradiance (the cells’ values that have
weightage more than 0.80 will be yellow-coloured,
which is used to compare the shift of the spectral
irradiance of each hour) 48
Figure A 1: Comprehensive method for analysing the PCE of
OSCs under different spectral irradiances
considering both photonic and electrical
characteristics (page 1) 49
Figure A 2: Comprehensive method for analysing the PCE of
OSCs under different spectral irradiances
considering both photonic and electrical
characteristics (page 2) 50

xviii
Figure A 3: Comprehensive method for analysing the PCE of
OSCs under different spectral irradiances
considering both photonic and electrical
characteristics (page 3) 51
Figure A 4: Comprehensive method for analysing the PCE of
OSCs under different spectral irradiances
considering both photonic and electrical
characteristics (page 4) 52
Figure A 5: Comprehensive method for analysing the PCE of
OSCs under different spectral irradiances
considering both photonic and electrical
characteristics (page 5) 53
Figure A 6: Comprehensive method for analysing the PCE of
OSCs under different spectral irradiances
considering both photonic and electrical
characteristics (page 6) 54
Figure A 7: Comprehensive method for analysing the PCE of
OSCs under different spectral irradiances
considering both photonic and electrical
characteristics (page 7) 55
Figure A 8: Comprehensive method for analysing the PCE of
OSCs under different spectral irradiances
considering both photonic and electrical
characteristics (page 8) 56

1
CHAPTER 1
1 INTRODUCTION
1.1 Research background
Spectral irradiance (solar spectrum) is one of the crucial factors that affect the
performance of photovoltaic devices, such as solar cells. Rotation of the Earth allows
majority parts of the world able to receive enough sunlight that enables it to be
harvested by the solar panels to generate electricity for the society. In order to
generalize the spectral irradiance received by every part of the world, a reference
standard spectrum, which is known as AM 1.5G was calculated. Majority of the solar
manufacturers in the world are currently designing and producing photovoltaic devices
based on AM 1.5G spectrum. However, due to latitude of each country is different
with respect to one another, the spectral irradiance received by each country will
ultimately have deviations with respect to AM 1.5G. The realization of this issue that
will affect the solar cells’ performance had caught the attention of the international
solar community. Following from that, intensive researches on the local spectral
irradiance on each geographical area have been carried out. The research on local
spectral irradiance, especially in ASEAN region is still not widely carried out.
Furthermore determination on the tailoring of bandgap of solar cells based on the local
spectral irradiance is even less. Hence, the main topic for this project will be tailoring
the solar cells based on the local spectral irradiances in the ASEAN region to obtain
best power conversion efficiency.
The solar cell types that have chosen to study for this project is organic solar
cells (OSCs). In the current solar industry, the dominating material for the
2
manufacturing solar cells is silicon (Si) based solar cells, which having up to 85% of
market share (Wang, 2016). Although Si-based solar cells is a promising green-
technology, the applications of it is not widespread due to high production cost for its
critical manufacturing processing. As for the OSCs, the production cost can be
effectively lowered due to the introduction of low cost roll-to-roll technique
(Tanenbaum, 2011) for its large area of fabrication. The other advantages, including
its flexibility and dynamics in tailoring molecular properties (Institute of Science in
Society, 2006) are attracting international research groups to study on its potential
applications in order to utilize the advantages of OSCs.
The project was started by investigating of local spectral irradiances in
Malaysia through data collection that conducted in Universiti Tunku Abdul Rahman
(UTAR), Jalan Sungai Long, Bandar Sungai Long, 43000 Kajang, Selangor, Malaysia.
The latitude and longitude of UTAR are 3.0408˚N and 101.7942˚E respectively. The
data collection has taken place for 7 months (January 2016 to July 2016), from 8.00
am to 6.00 pm for every data collection day. The main device that used was AVANTES
spectrometers, which comprised of AvaSpec-2048-USB2-RM (bandwidth: 200 – 1100
nm) and AvaSpec-NIR256-1.7-RM (bandwidth: 1000 – 1750 nm). The second part of
this project would be studying the performance of the organic materials’ groups
theoretically through journal papers that were available. The locally collected spectral
irradiance data were then fit into the calculations of each of the organic materials to
obtain the power conversion efficiency (PCE) respectively.
1.2 Research aims and objectives
The aim of this project is to tailor the bandgap of organic materials to the local spectral
irradiances in the ASEAN region in order to obtain best power conversion efficiency.
The objectives for this project are described as follows:
1. To verify the differences of local spectral irradiances with respect to the
standard reference AM 1.5G through spectrum analysis

3
2. To determine the performance of the OSCs based on the local spectral
irradiances, including local direct spectral irradiance (clear sky), local diffuse
spectral irradiance (cloudy condition), and also total average of local spectral
irradiance
3. To select the best available organic materials for the OSCs designation in the
ASEAN region

4
CHAPTER 2
2 LITERATURE REVIEW
2.1 Weather conditions in Kajang, Malaysia
Kajang is a city that situated in the west of the Peninsular Malaysia, which is roughly
about 23 km away from the Malaysia’s national capital, Kuala Lumpur. Due to its
unique location, which is near to the Earth’s Equator, temperature in Malaysia is nearly
uniform throughout the year (Malaysian Meteorological Department, 2016). The
temperature recorded from June 1, 2015 until July 2016 is ranging from 24 ˚C to 33˚C
(Underground, 2016). Every year, Malaysia will expose to two main seasonal
variations, which are the northeast monsoon season and southwest monsoon season.
During these 2 seasons, including the periods of the interchange of seasons, the rainfall
distributions will be varied accordingly. For instance in Peninsular Malaysia, the
rainfall (small intensity) was recorded to have 70% and more than 80% occurrence
during the northeast monsoon and southwest monsoon seasons respectively
(Varikoden, 2011). This in turns will affect the local spectral irradiances, and also its
exposure hours. The average exposure hours in the direct sunlight in Malaysia was
recorded to be 6 hours (Malaysian Meteorological Department, 2016), and the duration
of exposure hours will be varied according to the geographical variations in Malaysia.
Due to the local average high temperature, this normally leads to high evaporation of
water during the daytime, which eventually increases the relative humidity level of the
air in Malaysia in the range of 70% - 90% (McGinley, 2011).

5
2.2 Local spectral irradiances in Kajang, Malaysia
Local spectral irradiances play a vital role in the performance of solar cells’
technologies, as it depends on the local weather conditions. For each of the materials
used for manufacturing of photovoltaic devices, the corresponding performance is
limited by its spectral response width, whereby the solar cells only able to harvest a
certain wavelength range of light energy and convert it into useful electrical current.
There are several factors that may contribute to the deviation of the local spectral
irradiance from standard reference AM 1.5G, such as the path length through the
atmosphere (Air Mass, AM), the amounts of water vapour in the atmosphere, aerosol
content (Mambrini, 2015), cloud coverage, solar zenith angle (S. Nann & C. Riordan,
1991). All these factors vary according to geographical locations, and also the local
weather conditions.
Due to the presence of many factors that making a significant impact to the
local spectral irradiances, the American Society for Testing and Materials (ASTM)
have published three international standard spectra for basic theoretical calculations
and as the basis for majority solar cells’ designations (Newport Corp., n.d.). The 3
spectra including AM 0, AM 1.5 Direct (AM 1.5D), and AM 1.5 Global (AM 1.5G).
Considering the installation of most of the solar panels on the ground, the standard
reference AM 1.5G is adopted for most of the materials’ selection and solar cells
designations. However, AM 1.5G is obtained based on the average weather conditions
of the 48 contiguous states in the United States of America (USA), by taking solar
zenith angle and tilted surface angle at 48˚ and 37˚, respectively (Green Rhino Energy,
n.d.). Moreover, the local albedo, which also known as surface reflectivity (S. Nann &
C. Riordan, 1991) and the turbidity (cloudiness) were set to be 0.3 and 0.29,
respectively, under an ambient temperature of 20˚C (U.S. Standard Atmosphere, 1976).
All these conditions are harsh to be satisfied by all the countries across the globe
(except in USA) due to variations of local spatial and atmospheric conditions. Hence,
a study of the local spectral irradiances on certain region (“ASEAN region” for this
project) is required.
6
2.3 Comparison of average photon energy measured in ASEAN region
Average photon energy (APE) is another foremost parameter that affects the
performance of photovoltaic devices. Some studies [(C. Cornaro & A. Andreotti,
2013); (Sirisamphanwong, 2014); (Nofuentes, 2014)] have shown the linear
dependency between the performance of certain solar cells to the APE values,
especially in the solar cells (OSCs) that having a narrow spectral response width. The
basic working methodology of solar cell starts with capturing the energy from the
incoming photons, generating electron-hole pairs (EHPs). Then, EHPs would be
separated at the interface of the active layers due to present of the internal electric field
that generated from the potential difference between the bandgap of the donor/acceptor
materials. For narrow bandgap materials, they will only respond to a narrow
wavelength range of photons. Owing to this reason, the incoming photons with
appropriate APE values will be considered “useful” to the organic materials. The
photons that have relatively high APE values than the materials’ bandgap will be
absorbed near the surface of the photovoltaic device due to surface recombination
(Kasap, 2001); while photons that have lower APE values than the materials will be
wasted, as it is not large enough to photo-generate EHPs. This eventually will affect
the open-circuit voltage (VOC) of OSCs (Brus, 2015) that lead to low power conversion
efficiency. Hence an optimum bandgap of organic materials should be considered for
the OSCs’ designations by examining the distribution of local measured APE values.
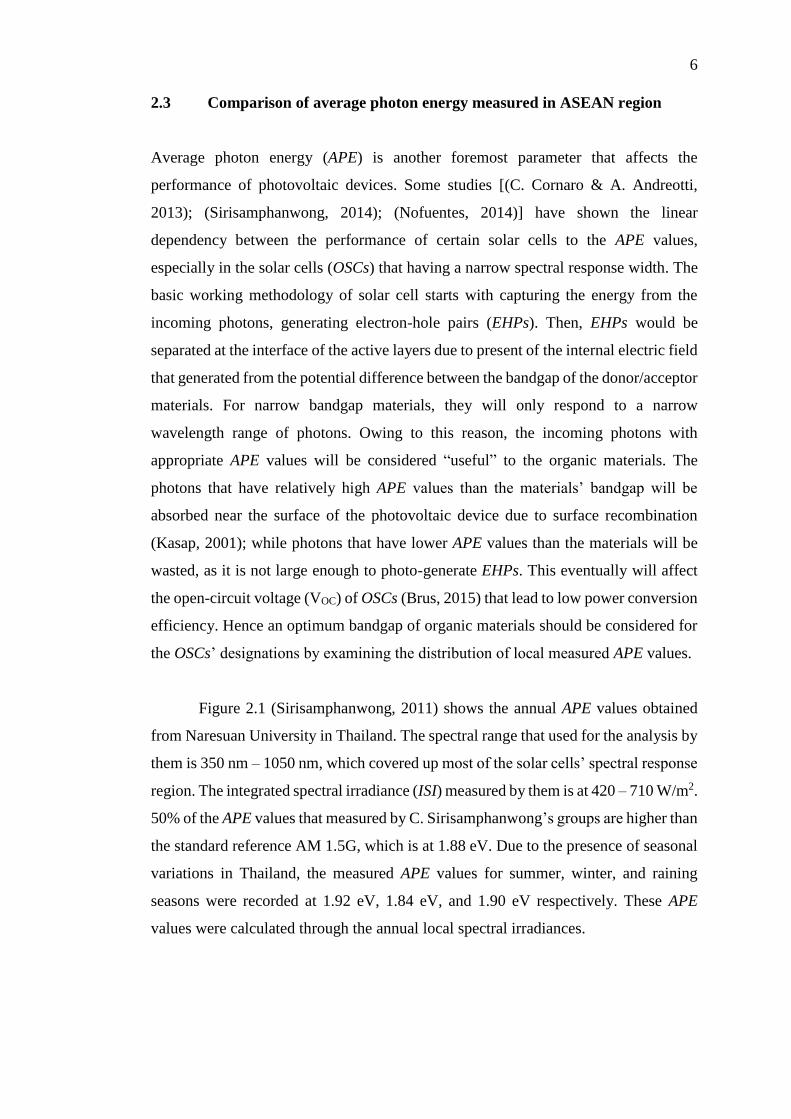
Figure 2.1 (Sirisamphanwong, 2011) shows the annual APE values obtained
from Naresuan University in Thailand. The spectral range that used for the analysis by
them is 350 nm – 1050 nm, which covered up most of the solar cells’ spectral response
region. The integrated spectral irradiance (ISI) measured by them is at 420 – 710 W/m2.
50% of the APE values that measured by C. Sirisamphanwong’s groups are higher than
the standard reference AM 1.5G, which is at 1.88 eV. Due to the presence of seasonal
variations in Thailand, the measured APE values for summer, winter, and raining
seasons were recorded at 1.92 eV, 1.84 eV, and 1.90 eV respectively. These APE
values were calculated through the annual local spectral irradiances.
7
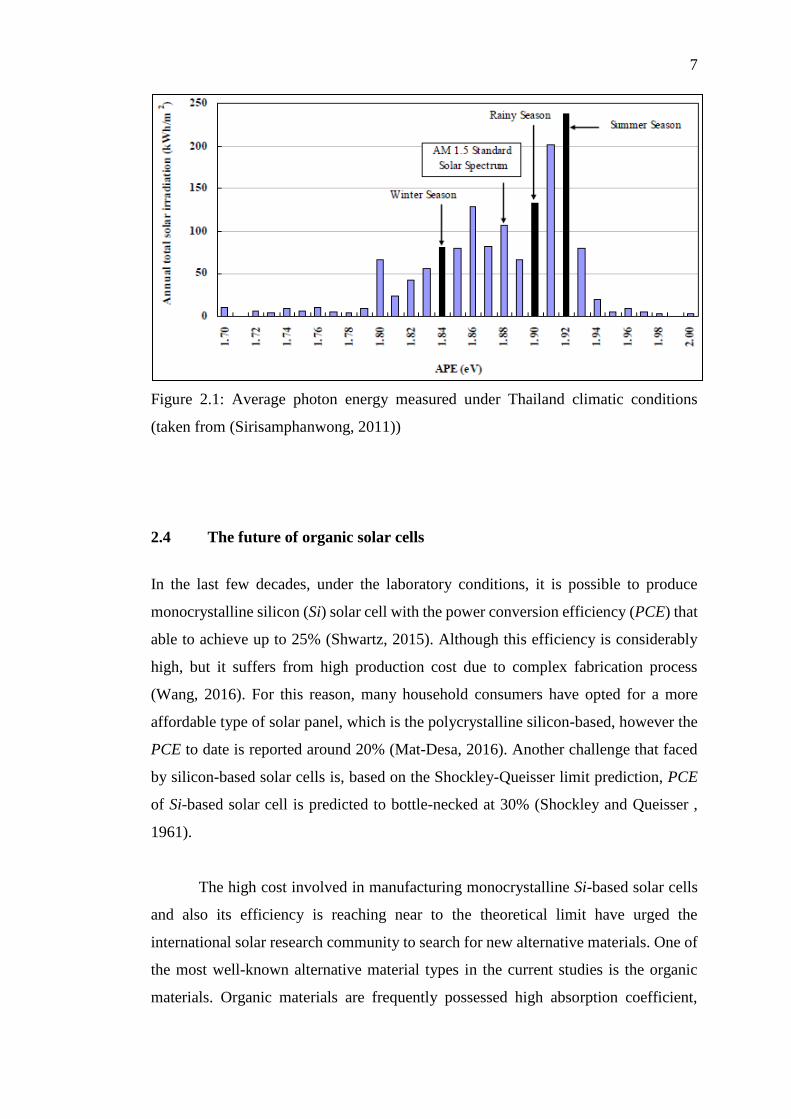
Figure 2.1: Average photon energy measured under Thailand climatic conditions
(taken from (Sirisamphanwong, 2011))
2.4 The future of organic solar cells
In the last few decades, under the laboratory conditions, it is possible to produce
monocrystalline silicon (Si) solar cell with the power conversion efficiency (PCE) that
able to achieve up to 25% (Shwartz, 2015). Although this efficiency is considerably
high, but it suffers from high production cost due to complex fabrication process
(Wang, 2016). For this reason, many household consumers have opted for a more
affordable type of solar panel, which is the polycrystalline silicon-based, however the
PCE to date is reported around 20% (Mat-Desa, 2016). Another challenge that faced
by silicon-based solar cells is, based on the Shockley-Queisser limit prediction, PCE
of Si-based solar cell is predicted to bottle-necked at 30% (Shockley and Queisser ,
1961).
The high cost involved in manufacturing monocrystalline Si-based solar cells
and also its efficiency is reaching near to the theoretical limit have urged the
international solar research community to search for new alternative materials. One of
the most well-known alternative material types in the current studies is the organic
materials. Organic materials are frequently possessed high absorption coefficient,

8
which up to ~ 105 cm-1 (Savenije, 2014). Other advantages that able to be offered by
OSCs are aforementioned in Section 1.1. However, the main drawback of the current
OSCs is its low PCE values, as compare to Si-based solar cell, which partly due to the
narrow absorption band. For instance, the absorption band of majority organic
materials is within 300 nm – 900 nm [(Liu, 2014); (Morinaka, 2013); (Fan, 2014)].
The highest recorded PCE to date under laboratory condition is 13.2%, which achieved
by Heliatek R&D team in Germany. In addition to this, there are several factors that
lead to higher rate of degradation in OSCs, these include majority of the organic
materials are not chemically inert to the oxygen and water molecules (Madsen, n.d.),
and self-etching of indium tin oxide (ITO) electrode under direct illumination with
acidic PEDOT:PSS layer (Wang, 2016).
In order to increase the PCE of the OSCs, the study of local spectral irradiances
was recommended to find the deviation of the peak with respect to AM 1.5G (Chong,
2016); to prolong the lifetime of the OSCs, many alternative designs have come up
with, such as the inverted structure of OSCs. The designs of the OSCs’ conventional
structure and inverted structure are illustrated in Figure 2.2 and Figure 2.3 respectively
(Lim, 2012). The polarity of the charged generation is reversed in inverted OSCs with
respect to the conventional structure.
Figure 2.2: Conventional structure of organic solar cells with bottom-illumination
(taken from (Lim, 2012))

9
Figure 2.3: Inverted structure of organic solar cells with bottom-illumination (taken
from (Lim, 2012))
The conventional OSC stack (Figure 2.2) is [ITO / PEDOT:PSS / P3HT:PCBM
/ LiF / Al], which can be further described as follows:
ITO = anode
PEDOT:PSS = hole transport layer (HTL)
P3HT:PCBM = active layer
LiF (lithium fluoride) = electron injection layer (EIL)
Al (aluminium) = cathode
The inverted OSC stack consists of (Figure 2.3) [ITO / TiOx / P3HT:PCBM /
PEDOT:PSS:CFS-31 / Ag], which can be further described as follow:
ITO = cathode
TiOx = electron-transporting layer (ETL)
P3HT:PCBM = active layer
PEDOT:PSS:CFS-31 = hole transport layer (HTL)
Ag (silver) = anode

10
2.5 Photovoltaics’ data of various organic materials under AM 1.5G
illumination
For analysing the PCE of different organic materials (only in the active layer) under
various local spectral irradiances, there are few critical parameters we need to consider
such as materials’ group (electron donor/ electron acceptor), open-circuit voltage (VOC),
short circuit current density (JSC), fill factor (FF), and the PCE. In addition to these,
the device quantum efficiency (QE) is also another important parameter to consider in
the calculations due to present of different spectral response region for each organic
material. Those values are able to obtain from the published results from each
experimental group. The organic materials’ groups that were studied under this project
are as follows:
1. PTBFTDTBT:PC71BM (Fan, 2014)
2. PTB7:PC60BM (Morinaka, 2013)
3. P3HT:PC60BM (Morinaka, 2013)
4. PCPDTBT:PC71BM (R. Lin, 2014)
5. PCDTBT:PC70BM (Liu, 2014)
The reference values for VOC, JSC, FF, and also PCE under the AM 1.5G illumination
for the mentioned organic materials groups are shown in Table 2.1.
Table 2.1: Parameters of Various Organic Materials under AM 1.5G Illumination
Organic Materials VOC (V) JSC (mA/cm2) FF (%) PCE (%)
PTBFTDTBT:PC71BM 0.80 14.21 51.4 5.84
PTB7:PC60BM 0.76 13.28 62.0 6.24
P3HT:PC60BM 0.61 7.84 69.0 3.27
PCPDTBT:PC71BM 0.63 11.10 42.2 2.93
PCDTBT:PC70BM 0.88 10.80 49.0 4.66

11
CHAPTER 3
3 THEORY AND METHODOLOGY
3.1 Integrated Spectral Irradiance
Integrated spectral irradiance (ISI) is the summation of whole spectrum wavelengths’
intensities by integrating the spectral irradiance in the function of wavelength, as
shown in Equation (1).
dEISI )( (1)
where E(λ) is the spectral irradiance (Watt per meter-squared per wavelength (nm)),
d(λ) is the step size between the wavelength to its adjacent (both of them are obtained
from the AVANTES spectrometers in this project). The lower and upper integration
limits for the wavelength in this project were set at 280 nm and 1750 nm respectively.
3.2 Average photon energy of local spectral irradiances
Average photon energy (APE) is the calculation of total energy divided by total
incoming photons from the Sun, as shown in Equation (2). APE is a parameter that
often used to characterize the pattern of the local spectral irradiance [(Nofuentes, 2014);
(Norton, 2015)]. Thus, for a higher APE values with respect to others, it means the
respective spectral irradiance is more blue-shifted in comparing with others. This
parameter in fact, having significant impact to narrow spectral response width solar

12
cells, such as organic solar cells (OSCs) and amorphous silicon solar cells, as
aforementioned in Section 2.3.
dq
dEAPE
)(
)(
(2)
The ɸ(λ) is the spectral photon flux density (photons per meter-squared per second), λ
is the wavelength of the incoming photons, E(λ) is the spectral irradiance, h is the
Planck’s constant, and c is the speed of light.
3.3 External quantum efficiency and device responsivity
External quantum efficiency (EQE) or device quantum efficiency (QE) is defined as
the number of the free electron-hole-pairs (EHPs) that collected to the number of
incident photons, as shown in Equation (3). EQE of each of the device is different due
to different active layer’s materials were used to harvest photon energy.
q
hc
P
I
hP
qI
o
ph
o
ph
EQE/
/
(3)
Iph / q is refers as the number of collectable electrons per second; while Po / hυ is defines
as the number of the incident photons per second. h is the Planck’s constant, c is the
speed of light, e is the electron’s charge, and λ is the photon’s wavelength. Device
responsivity is a similar term to EQE, which is also used to characterize a photovoltaics’
performance. It defines in terms of the ratio of photocurrent (Iph) generated to the
incident optical power (Po), as shown in Equation (4).
o
ph
P
IR
(4)
13
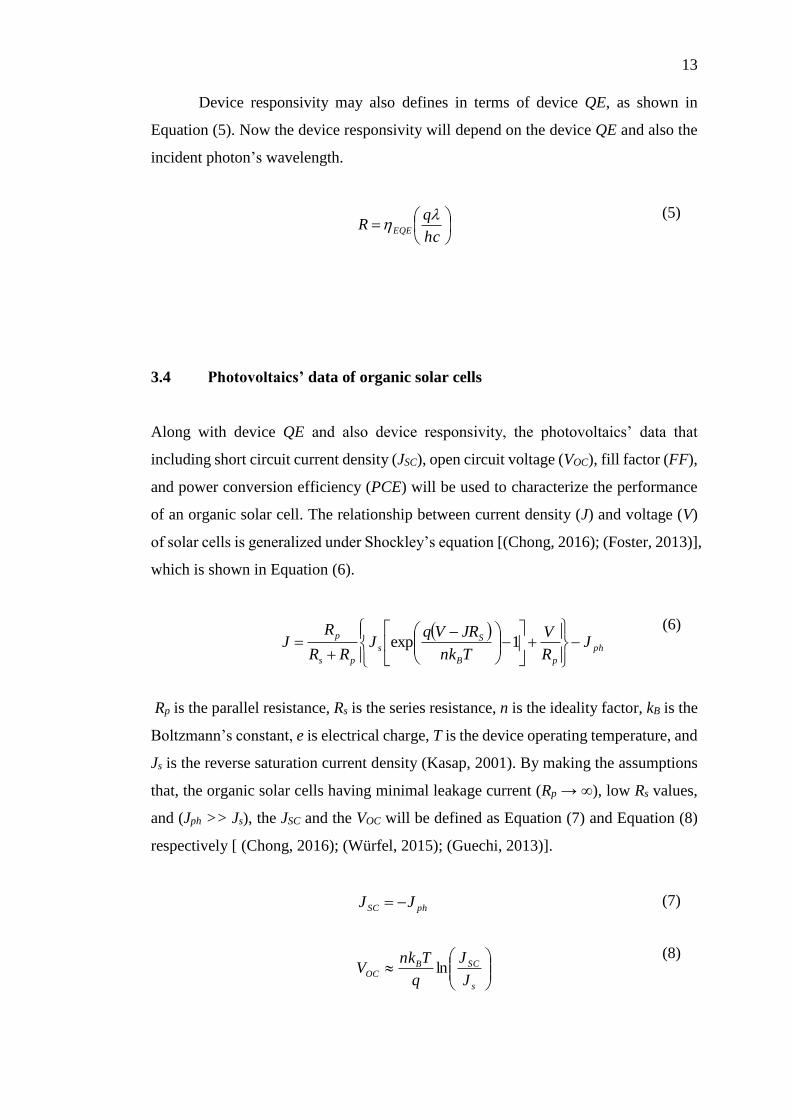
Device responsivity may also defines in terms of device QE, as shown in
Equation (5). Now the device responsivity will depend on the device QE and also the
incident photon’s wavelength.
hc
qR EQE
(5)
3.4 Photovoltaics’ data of organic solar cells
Along with device QE and also device responsivity, the photovoltaics’ data that
including short circuit current density (JSC), open circuit voltage (VOC), fill factor (FF),
and power conversion efficiency (PCE) will be used to characterize the performance
of an organic solar cell. The relationship between current density (J) and voltage (V)
of solar cells is generalized under Shockley’s equation [(Chong, 2016); (Foster, 2013)],
which is shown in Equation (6).
ph
pB
Ss
ps
pJ
R
V
Tnk
JRVqJ
RR
RJ
1exp
(6)
Rp is the parallel resistance, Rs is the series resistance, n is the ideality factor, kB is the
Boltzmann’s constant, e is electrical charge, T is the device operating temperature, and
Js is the reverse saturation current density (Kasap, 2001). By making the assumptions
that, the organic solar cells having minimal leakage current (Rp → ∞), low Rs values,
and (Jph >> Js), the JSC and the VOC will be defined as Equation (7) and Equation (8)
respectively [ (Chong, 2016); (Würfel, 2015); (Guechi, 2013)].
phSC JJ (7)
s
SCBOC
J
J
q
TnkV ln
(8)

14
The fill factor and the power conversion efficiency can be calculated as shown
in Equation (9) and Equation (10) respectively (Kasap, 2001).
OCSCVJ
VJFF maxmax
(9)
AP
VJFFPCE
o
OCSC
/
(10)
Jmax and Vmax are the maximum possible current density and voltage that can be
delivered by the OSCs, while the Po/A is the incident optical power per unit area
received by the OSCs.
3.5 Air mass, relative humidity, and Naan & Riordan Considerations
Air mass (AM) is the ratio of actual sunlight’s travel distance from the atmosphere to
the Earth’s surface with respect its shortest path it can take to reach the surface (Kasap,
2001). The shortest distance where the sunlight travels occur is when the position of
the Sun is directly above the specific location on the Earth. Variation of AM values
will affect the intensity of local spectral irradiances as it affects by the absorption and
scattering effects that present in the particular location’s atmosphere. For high AM
value, the Sun’s beam takes longer path and will subjected to more absorption and
scattering effect, which leads to low intensity in the local spectrum (Guechi, 2013).
Relative humidity is the ratio of the actual water vapour density to the
saturation water vapour density in the air at a particular temperature. The relative air
humidity level in Malaysia was recorded in the range 70% - 90% (McGinley, 2011),
and the local spectral irradiances is dependent on water vapour content in the local
atmosphere (C. Cornaro & A. Andreotti, 2013). Generally the relative humidity in the
morning is high when the temperature is low; while the relative humidity reaches its
minimum when the temperature is the highest during noon hours (FAO Corp. Doc.
Repository, n.d.). Hence, by comparing the spectral irradiances under local clear day
condition throughout the day, during the morning or evening hours, the solar spectrums
15
appear to be red-shifted with respect to the solar spectrums during noon hours. By
understanding this trend, the performance of the organic photovoltaic devices is then
understood, where it performed better in the afternoon, than in the morning or evening
hours, as JSC and VOC values of the OSCs are having linear dependency to the local
spectral irradiances (Kazem, 2012).
Naan and Riordan’s works are based on the effect of overcast condition to the
local spectral irradiances received at the Earth’s surface. Generally during cloudy or
rainy days, the travelling path of the Sun’s beam would be obstructed by cloud layer.
Based on their studies, highly energetic photons are reported to have a higher
transmission probability than the low energetic photons by 30%, during overcast
conditions. Local diffuse spectral irradiance eventually shown to be blue-shifted (also
known as bluish enhancement) with respect to local direct spectral irradiance, in terms
of their relative peak intensities (S. Nann & C. Riordan, 1991).
3.6 Spectral irradiances collection uses AVANTES spectrometer
The collection of the spectral irradiances was conducted at Universiti Tunku Abdul
Rahman (UTAR), by the spectrometer. The time of the data collection was set from
8.00 am to 6.00 pm, and the spectral width was set to be recorded at 200 nm to 1100
nm by the counter AvaSpec-2048-USB2-RM (near-ultra-violet region: visible region,
NUV:VIS); while the spectral width between 1000 nm to 1750 nm was set to be
recorded by the counter AvaSpec-NIR256-1.7-RM (visible region: near-infrared
region, VIS:NIR). These 2 ranges of data were then merged into a single file. The data
were collected at each 15 minutes interval.
Before beginning any data collection, it is necessary to remove any potential
local background noise that might be recorded by the spectrometer. In order to
differentiate the background noise and the spectral irradiance intensity, a dark cover-
slid was made to cover the detector of the spectrometer. The detector was designed to
capture any Sun’s beam (photons) that falls onto it, and the results would be displayed
on the computer screen. Upon the detector was covered up by the cover-slid, which in
16
perfect case no light intensity for the whole spectrum would be detected. However,
during the on-site measurements, there are some light intensities at certain wavelength
range may still detectable. This would be recognised as potential local background
noise, and the spectrometer was set to remove it in order to ensure the accuracy of the
collected data.
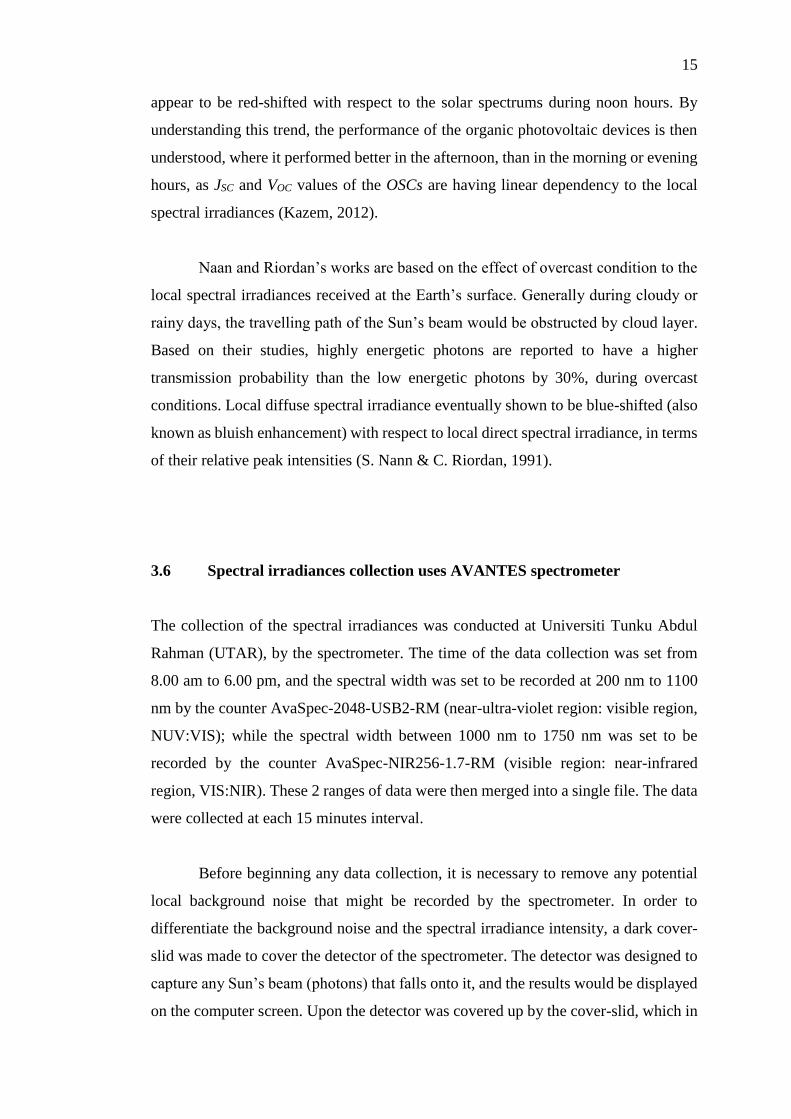
Figure 3.1 shows the steps in collecting the spectral irradiance data. A long
metal strip was constructed on the platform to check for the presence of shadow. The
detector was then tied up with the metal strip to ensure its alignment is parallel to the
metal strip. For every 15 minutes, the sensor would be adjusted to point directly to the
Sun, which would be double confirmed by the long metal strip by having no shadow
appear on the platform. The spectrum data was then merged and saved by the
AVANTES’ software in a “spec” file, and then converted to Microsoft Excel file in
the computer for further analysis.
Figure 3.1: Processing steps of spectral irradiances collection by the AVANTES
spectrometer
3.7 Simulations and calculations by Matrix Laboratory
Matrix Laboratory (MATLAB) is known for performing simulation, analysis, and
calculation, based on a large primary data obtained from the experiment. In this project,
the data of spectral irradiances that converted into Excel files would be computed by
the MATLAB to perform simulations. A simple explanation of the MATLAB
algorithm that used for this project would be done by using the language of pseudocode.
Setting up AVANTES
spectrometer
Spectrum data
collection for every 15 minutes
Grouping of photons to NUV:VIS &
VIS:NIR groups
Displays of spectral
irradiance on computer's
screen
17
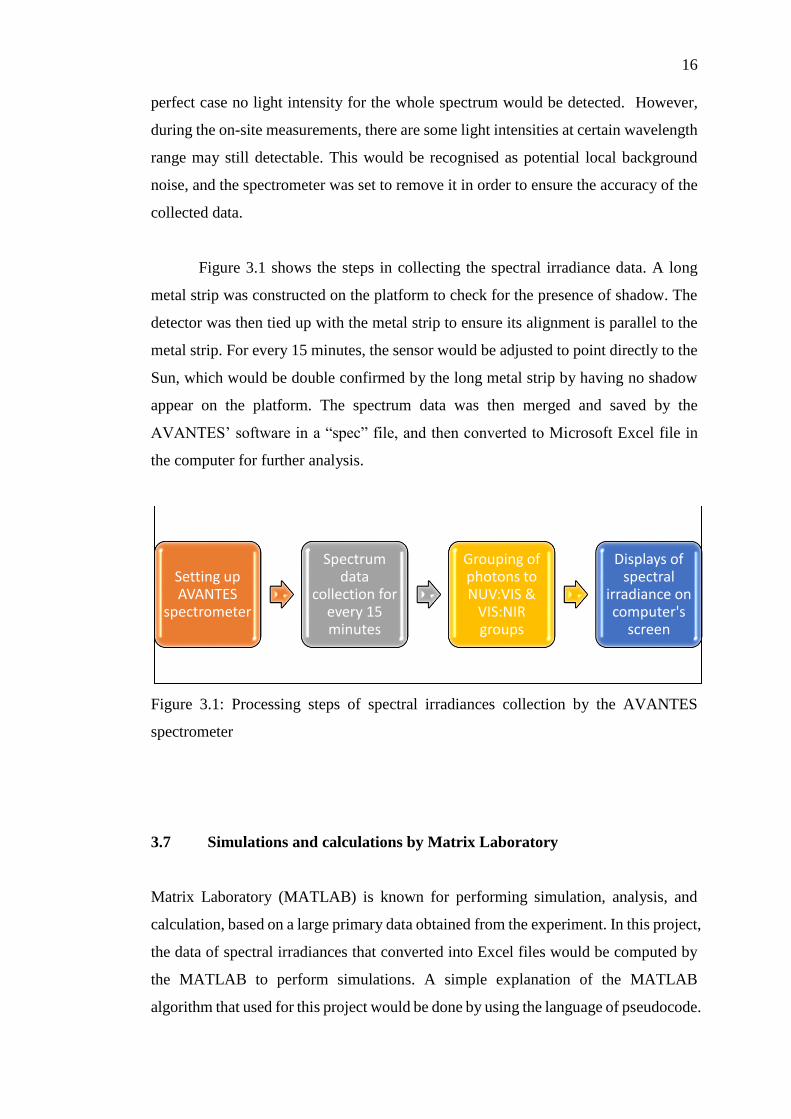
First, the declaration of all the variables and arrays were done. Then the
initiation of certain variables, by pre-setting certain variable arrays to be zero before
filling in any data. The wavelength range of the light source (which is the Sun) and the
respective intensity for each wavelength was called into the MATLAB from the first
Excel file. The calculations of the ISI and APE values would be done by using the
Equations (1) and (2). The whole process would be repeated by calling in the next file,
until all the data files that collected have been successfully inserted in. The
corresponding graphs would then be displayed out for analysis or comparison purposes.
A small part of the MATLAB code, which is the vital part of the ISI and APE
calculations is shown in Figure 3.2.
Figure 3.2: The main part of the MATLAB's coding that used to calculate the values
of ISI and APE

18
CHAPTER 4
4 RESULTS AND DISCUSSIONS
4.1 Local annual spectral irradiances versus reference standard AM 1.5G
The spectral irradiances’ graphs that illustrated in this section was divided into 3
sections, which are local direct spectral irradiance for each hour, local diffuse spectral
irradiance for each hour, and local annual average spectral irradiances. The obtained
results were then compared to AM 1.5G to observe the deviation.
Figure 4.1: Local annual direct spectral irradiance at each hour (8.00 am - 6.00 pm)
versus wavelength (the middle period for each hour, for example 830 denotes as 0800
– 0859 for convenience of results presentation)
0
0.2
0.4
0.6
0.8
1
1.2
1.4
1.6
1.8
300 500 700 900 1100 1300 1500 1700
Spec
tral
Irr
adia
nce
(W
/m2
nm
)
Wavelength (nm)
Local Direct Spectral Irradiance at each hour versus
Wavelength
830 930 1030 1130 1230 1330
1430 1530 1630 1730 AM 1.5G

19
Figure 4.1 shows the average of local annual direct spectral irradiance collected
at each hour, under direct sunlight condition. The peak of the AM 1.5G was measured
at the interval between 450 nm – 500 nm, while the peaks for the 10 hours local direct
spectral irradiance were calculated to be red-shifted, with respect to AM 1.5G. The
deviation was expected due to the conditions in Kajang, Malaysia (in terms of local
spatial and atmospheric conditions) are different as compared to USA. By comparing
the spectral irradiances data under the clear day condition, the morning and the evening
spectrums were appeared to be red-shifted, with respect to the afternoon spectrum, as
illustrated in Figure 4.1, and the corresponding weightage of each hour was calculated
and shown in Table A.1 and Table A.2. The red-shifted of the respective spectrums
was due to higher air mass (AM) in the morning and evening hours than the AM in the
noon hours. Higher AM means longer actual path distance that the Sun’s rays have to
travel to the ground (Kasap, 2001). Majority of the shorter wavelength photons was
scattered due to Rayleigh scattering (Guechi, 2013) at higher AM, and part of the
incident photons would be absorbed by the water vapour in the air along the way,
which prompting red-shifts and intensity decrease in the local direct spectral irradiance.
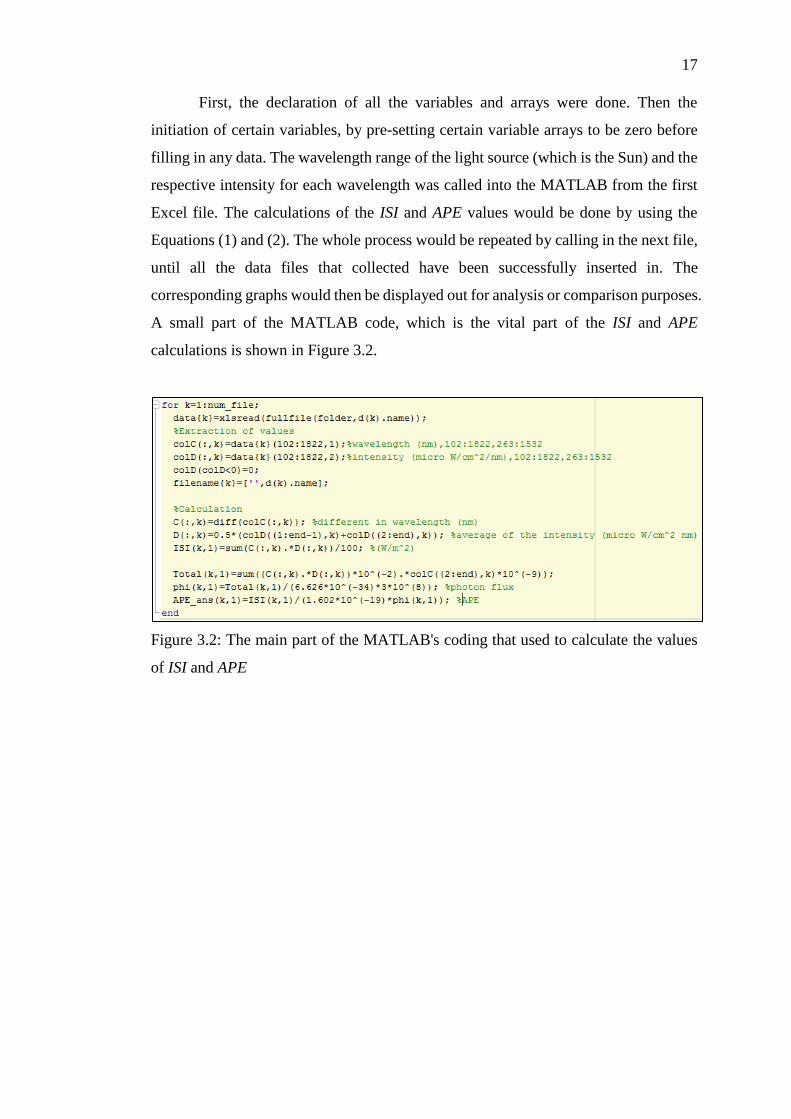
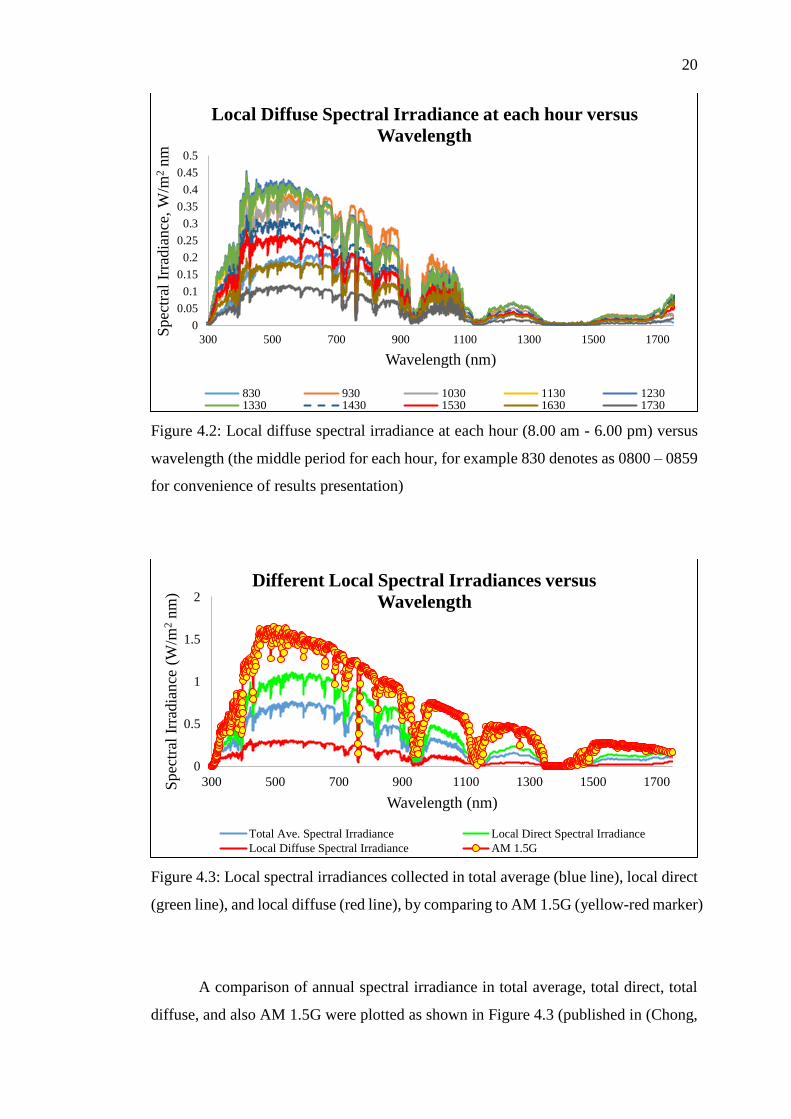
Figure 4.2 displays the average of local annual diffuse spectral irradiance for
each hour, under diffuse sunlight condition. The intensity peaks of the diffuse spectral
irradiance were significantly smaller compared to direct spectral irradiance, and also
the AM 1.5G. Hence, it is difficult to display the comparison between local diffuse
spectral irradiances and the AM 1.5G spectrum together under the same result’s frame.
The intensity’s pattern of the local hourly-diffuse spectral irradiance were noticed to
be not following the trend as in local direct spectral irradiance, due to the fast-varying
cloud thickness upon the data being collected. From Figure 4.2, all the average local
diffuse spectral irradiances were noticed to have peaked at the wavelength interval
between 500 nm – 550 nm, which were red-shifted as compared to AM 1.5G spectrum,
but blue-shifted compared to local direct spectral irradiance. The blue-shifting of
spectral irradiances with respect to clear day condition indicates that the higher energy
photons (near ultraviolet region) are more likely to penetrate through the clouds (S.
Nann & C. Riordan, 1991), as compared to lower energy photons (near infrared region)
that have a lower penetration probability under cloudy (overcast) condition.
20
Figure 4.2: Local diffuse spectral irradiance at each hour (8.00 am - 6.00 pm) versus
wavelength (the middle period for each hour, for example 830 denotes as 0800 – 0859
for convenience of results presentation)
Figure 4.3: Local spectral irradiances collected in total average (blue line), local direct
(green line), and local diffuse (red line), by comparing to AM 1.5G (yellow-red marker)
A comparison of annual spectral irradiance in total average, total direct, total
diffuse, and also AM 1.5G were plotted as shown in Figure 4.3 (published in (Chong,
0
0.05
0.1
0.15
0.2
0.25
0.3
0.35
0.4
0.45
0.5
300 500 700 900 1100 1300 1500 1700
Spec
tral
Irr
adia
nce
, W
/m2
nm
Wavelength (nm)
Local Diffuse Spectral Irradiance at each hour versus
Wavelength
830 930 1030 1130 12301330 1430 1530 1630 1730
0
0.5
1
1.5
2
300 500 700 900 1100 1300 1500 1700Sp
ectr
al I
rrad
iance
(W
/m2
nm
)
Wavelength (nm)
Different Local Spectral Irradiances versus
Wavelength
Total Ave. Spectral Irradiance Local Direct Spectral Irradiance
Local Diffuse Spectral Irradiance AM 1.5G

21
2016)). The integrated spectral irradiance (ISI) for total average, total direct, and also
total diffuse are 408.36 W/m2, 596.81 W/m2, and 156.72 W/m2 respectively, by taking
wavelength range between 280 nm – 1750 nm. The ISI value calculated for AM 1.5G
under the same wavelength range is 954.54 W/m2. The monthly average solar radiation,
Pmonth (by taking local total average ISI) in Malaysia is calculated at 441.03 MJ/m2 (the
reported monthly Pmonth in Malaysia is at 400 – 600 MJ/m2 (S. Mekhilef et al., 2012)),
and the calculation was shown as follow:
𝑃𝑚𝑜𝑛𝑡ℎ =408.36 W
m2×
3600 s
hr×
10 hrs
day×
30 days
month=
441.03 MJ
m2 month
Table 4.1: Weightage of each specific wavelength range of various spectral irradiances
(300 nm – 1100 nm)
Wavelength
range (nm)
Weightage for Specific Wavelength Range
Total Ave. Total Direct Total Diffuse AM 1.5G
300 – 350 0.1646 0.1558 0.2066 0.1704
350 – 400 0.4636 0.4445 0.5531 0.5289
400 – 450 0.7792 0.7603 0.8646 0.8612
450 – 500 0.9362 0.9233 0.9909 1.0000
500 – 550 0.9802 0.9743 1.0000 0.9937
550 – 600 1.0000 1.0000 0.9908 0.9712
600 – 650 0.9486 0.9533 0.9169 0.9131
650 – 700 0.8325 0.8407 0.7845 0.8509
700 – 750 0.8095 0.8153 0.7733 0.8105
750 – 800 0.7651 0.7688 0.7399 0.7430
800 – 850 0.6248 0.6296 0.5955 0.6333
850 – 900 0.4708 0.4771 0.4359 0.5271
900 – 950 0.2115 0.2170 0.1824 0.2866
950 – 1000 0.2483 0.2530 0.2227 0.2843
1000 – 1050 0.3928 0.3999 0.3542 0.4477
1050 – 1100 0.2524 0.2584 0.2205 0.3673

22
Table 4.1 shows the weightage of local spectral irradiances and AM 1.5G
between 300 nm – 1100 nm. For the total average and total direct spectral irradiances,
the peaks were calculated at the interval between 550 nm – 600 nm; total diffuse was
calculated at 500 nm – 550 nm; while AM 1.5G spectrum were calculated at 450 nm
– 500 nm. The spectral irradiances under this wavelength range were chosen for
analysis as it covered up most of the OSCs’ spectral response region. The pattern of
the local spectral irradiances was noticed to have sharp drops in intensity near to 724
nm, 824 nm, 938 nm, and 1120 nm wavelength (as shown in Figure 4.3), which due to
the absorption of these wavelength photons by water vapour content in the air or in the
clouds (S. Nann & C. Riordan, 1991) under clear day and cloudy conditions. The drop
in intensity was obviously shown in the weightage numbers at 900 – 950 nm. For the
sharp drops in other wavelength intervals (as shown in Table 4.1), due to large step
size of the wavelength (50 nm) involved in the weightage calculations, the respective
weightage is not obvious as it only occurred at narrow wavelength width.
4.2 Organic materials’ performance under illumination of standard
reference spectrum AM 1.5G
Spectral irradiance is one of the critical factors in determining the device performance
(in terms of PCE) due to the various spectral response region for different combination
of polymer electron donor and polymer electron acceptor have in the active layer. The
analysis of organic materials begun with by subjecting each of them into the
illumination of AM 1.5G spectrum at 100 mW/cm2, which were conducted by the
experimental groups [(Fan, 2014); (Morinaka, 2013); (R. Lin, 2014); (Liu, 2014)].
This step is crucial for obtaining the device quantum efficiency (QE) under standard
condition, as the QE values would be used in the following sections where the organic
materials would be subjected into illumination of different local spectral irradiances.
The external quantum efficiency (EQE) for each organic material under the
illumination of AM 1.5G is shown in Figure 4.4. For the theoretical study purpose, the
EQE values were obtained based on curve fitting on the EQE’s graphs of the organic
materials published by the experimental groups.

23
Figure 4.4: External Quantum Efficiency (EQE) of organic materials under the
illumination of AM 1.5G spectrum (The yellow-red marker is AM 1.5G spectrum,
while the coloured smooth lines are device QE)
As shown in Figure 4.4, the capability for each of the organic materials’ group
to convert incoming photons (under various wavelengths) to free electron-hole pairs
(EHPs), which partly due to the differences in bandgap of the involved organic
materials. The corresponding device responsivity for the wavelength range (300 nm –
1000 nm) were calculated and shown in Figure 4.5. From Figure 4.4, although some
organic materials having high device QE at the near-ultraviolet (UV) region (300 nm
– 400 nm), such as [PTBFTDTBT:PC71BM], [PCPDTBT:PC71BM], and
[PCDTBT:PC70BM], due to low spectral intensity at this near-UV region, the
collectable EHPs generated in this region is comparatively less, with respect to visible
(VIS) region. By multiplying the AM 1.5G spectrum with device responsivity of each
of the organic materials, the current densities (in the function of wavelength) would be
obtained, as shown in Figure 4.6.
0.0%
10.0%
20.0%
30.0%
40.0%
50.0%
60.0%
70.0%
80.0%
90.0%
100.0%
0
0.2
0.4
0.6
0.8
1
1.2
1.4
1.6
1.8
300 400 500 600 700 800 900 1000
Dev
ice
QE
(%
)
Spec
tral
Irr
adia
nce
(W
/m2
nm
)
Wavelength (nm)
EQE of Organic Materials under AM 1.5G
AM1.5G PTBFTDTBT:PC71BM PTB7:PC60BM
P3HT:PCBM PCPDTBT:PC71BM PCDTBT:PC70BM
24
Figure 4.5: Responsivity of organic materials under the illumination of AM 1.5G
spectrum (The yellow-red marker is AM 1.5G spectrum, while the coloured smooth
lines are device responsivity)
Figure 4.6: Current density (in the function of wavelength) of each of the organic
materials under illumination of AM 1.5G (The yellow-red marker is AM 1.5G
spectrum, while the coloured smooth lines are device current density)
0
0.1
0.2
0.3
0.4
0.5
0.6
0.7
0.8
0.9
1
0
0.2
0.4
0.6
0.8
1
1.2
1.4
1.6
1.8
300 400 500 600 700 800 900 1000
Dev
ice
Res
ponsi
vit
y (
A/W
)
Spec
tral
Irr
adia
nce
(W
/m2
nm
)
Wavelength (nm)
Responsivity of Organic Materials Under AM 1.5G
AM1.5G PTBFTDTBT:PC71BM PTB7:PC60BMP3HT:PCBM PCPDTBT:PC71BM PCDTBT:PC70BM
0
0.1
0.2
0.3
0.4
0.5
0.6
0.7
0.8
0.9
1
0
0.2
0.4
0.6
0.8
1
1.2
1.4
1.6
1.8
300 400 500 600 700 800 900 1000
Curr
ent
Den
sity
(A
/m2
nm
)
Spec
tral
Irr
adia
nce
(W
/m2
nm
)
Wavelength (nm)
Current Density of Organic Materials under AM 1.5G
AM1.5G PTBFTDTBT:PC71BM PTB7:PC60BM
P3HT:PCBM PCPDTBT:PC71BM PCDTBT:PC70BM
25
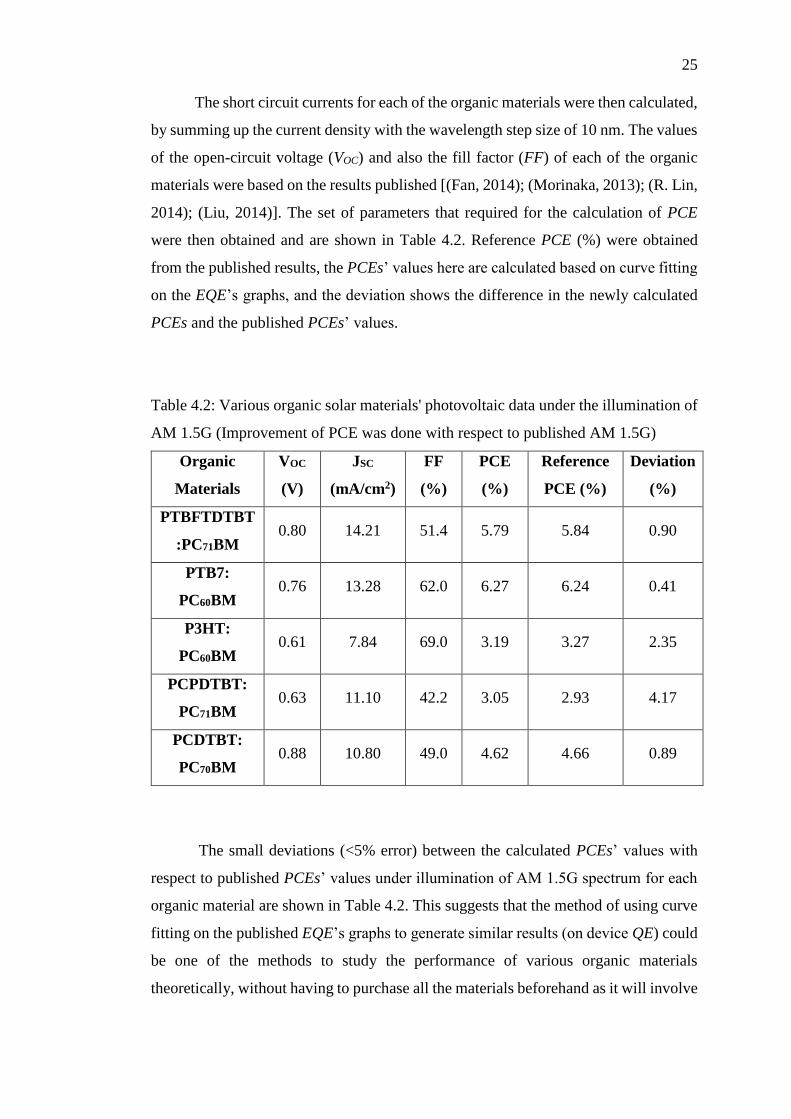
The short circuit currents for each of the organic materials were then calculated,
by summing up the current density with the wavelength step size of 10 nm. The values
of the open-circuit voltage (VOC) and also the fill factor (FF) of each of the organic
materials were based on the results published [(Fan, 2014); (Morinaka, 2013); (R. Lin,
2014); (Liu, 2014)]. The set of parameters that required for the calculation of PCE
were then obtained and are shown in Table 4.2. Reference PCE (%) were obtained
from the published results, the PCEs’ values here are calculated based on curve fitting
on the EQE’s graphs, and the deviation shows the difference in the newly calculated
PCEs and the published PCEs’ values.
Table 4.2: Various organic solar materials' photovoltaic data under the illumination of
AM 1.5G (Improvement of PCE was done with respect to published AM 1.5G)
Organic
Materials
VOC
(V)
JSC
(mA/cm2)
FF
(%)
PCE
(%)
Reference
PCE (%)
Deviation
(%)
PTBFTDTBT
:PC71BM 0.80 14.21 51.4 5.79 5.84 0.90
PTB7:
PC60BM 0.76 13.28 62.0 6.27 6.24 0.41
P3HT:
PC60BM 0.61 7.84 69.0 3.19 3.27 2.35
PCPDTBT:
PC71BM 0.63 11.10 42.2 3.05 2.93 4.17
PCDTBT:
PC70BM 0.88 10.80 49.0 4.62 4.66 0.89
The small deviations (<5% error) between the calculated PCEs’ values with
respect to published PCEs’ values under illumination of AM 1.5G spectrum for each
organic material are shown in Table 4.2. This suggests that the method of using curve
fitting on the published EQE’s graphs to generate similar results (on device QE) could
be one of the methods to study the performance of various organic materials
theoretically, without having to purchase all the materials beforehand as it will involve

26
a large budget amount and also long periods of experimental duration to produce
similar results. Among the 5 organic materials’ groups, the combination between
PTB7:PC60BM showing the best performance under the illumination of AM 1.5G
spectrum. The reasons for its best performance in PCE can be deduced that it’s having
larger spectral response region as compare to other organic materials, under the
illumination of AM 1.5G spectrum.
4.3 Organic materials’ performance under illumination of various local
spectral irradiances
The peaks of the spectral irradiances intensity under local weather conditions, as
shown in Section 4.1, proved to have deviations with respect to the peak intensity of
AM 1.5G spectrum. In order to clarify the effects of the deviation to the performance
of 5 organic materials’ groups, they would be subjected to 3 different local spectral
irradiances’ (local direct, local diffuse, and local total average) illuminations. The
study of the spectral response region of the device were conducted by comparing the
device QE (that obtained from curve fitting) and also device responsivity to respective
local spectrums. The calculations of the device QE and also the device responsivity
will be based on Equations (3) and (5). The JSC (λ) (current density in the function of
wavelength) of each of the organic materials would then be obtained, by multiplying
the device responsivity to various spectral irradiances. The JSC (λ) was then multiplying
with wavelength step size of 10 nm, and totalled up to obtain JSC. This method of
calculations would applied to all 3 different spectral irradiances’ illuminations. The
corresponding photovoltaic data would be displayed to show the performance
improvement of each of the organic materials under different local spectrums with
respect to AM 1.5G. For the evaluation of the effect of various spectral irradiances of
the performance of organic materials, the JSC for each organic material were
normalised to the published JSC values. The conducting of this normalisation enables
the direct extraction of VOC and FF values in the published results, as it was proven
that VOC and FF are dependent on JSC (Chong, 2016).
27
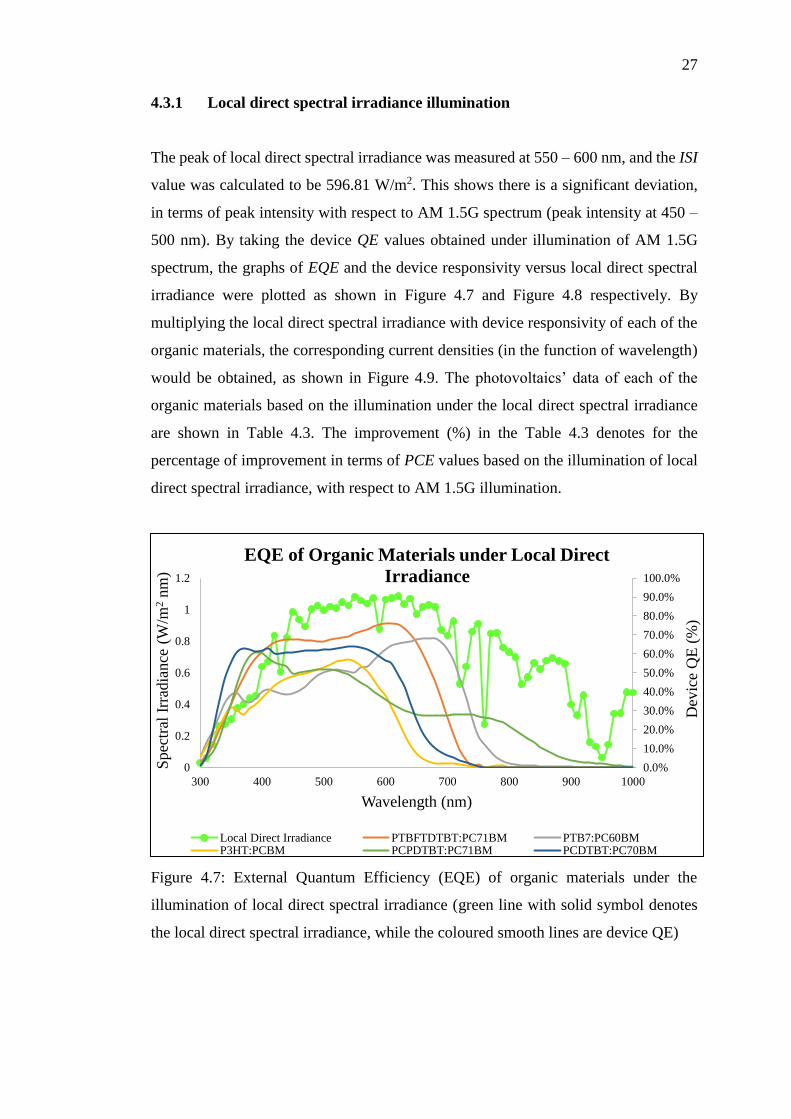
4.3.1 Local direct spectral irradiance illumination
The peak of local direct spectral irradiance was measured at 550 – 600 nm, and the ISI
value was calculated to be 596.81 W/m2. This shows there is a significant deviation,
in terms of peak intensity with respect to AM 1.5G spectrum (peak intensity at 450 –
500 nm). By taking the device QE values obtained under illumination of AM 1.5G
spectrum, the graphs of EQE and the device responsivity versus local direct spectral
irradiance were plotted as shown in Figure 4.7 and Figure 4.8 respectively. By
multiplying the local direct spectral irradiance with device responsivity of each of the
organic materials, the corresponding current densities (in the function of wavelength)
would be obtained, as shown in Figure 4.9. The photovoltaics’ data of each of the
organic materials based on the illumination under the local direct spectral irradiance
are shown in Table 4.3. The improvement (%) in the Table 4.3 denotes for the
percentage of improvement in terms of PCE values based on the illumination of local
direct spectral irradiance, with respect to AM 1.5G illumination.
Figure 4.7: External Quantum Efficiency (EQE) of organic materials under the
illumination of local direct spectral irradiance (green line with solid symbol denotes
the local direct spectral irradiance, while the coloured smooth lines are device QE)
0.0%
10.0%
20.0%
30.0%
40.0%
50.0%
60.0%
70.0%
80.0%
90.0%
100.0%
0
0.2
0.4
0.6
0.8
1
1.2
300 400 500 600 700 800 900 1000
Dev
ice
QE
(%
)
Spec
tral
Irr
adia
nce
(W
/m2
nm
)
Wavelength (nm)
EQE of Organic Materials under Local Direct
Irradiance
Local Direct Irradiance PTBFTDTBT:PC71BM PTB7:PC60BMP3HT:PCBM PCPDTBT:PC71BM PCDTBT:PC70BM

28
Figure 4.8: Responsivity of organic materials under the illumination of local direct
spectral irradiance (green line with solid symbol denotes the local direct spectral
irradiance, while the coloured smooth lines are device responsivity)
Figure 4.9: Current density (in the function of Wavelength) of each of the organic
materials under illumination of local direct spectral irradiance (green line with solid
symbol denotes the local direct spectral irradiance, while the coloured smooth lines
are device current density)
0
0.1
0.2
0.3
0.4
0.5
0.6
0.7
0.8
0.9
1
0
0.2
0.4
0.6
0.8
1
1.2
300 400 500 600 700 800 900 1000
Dev
ice
Res
ponsi
vit
y (
A/W
)
Spec
tral
Irr
adia
nce
(W
/m2
nm
)
Wavelength (nm)
Responsivity of Organic Materials under Local Direct
Irradiance
Local Direct Irradiance PTBFTDTBT:PC71BM PTB7:PC60BM
P3HT:PCBM PCPDTBT:PC71BM PCDTBT:PC70BM
0
0.1
0.2
0.3
0.4
0.5
0.6
0.7
0.8
0.9
1
0
0.2
0.4
0.6
0.8
1
1.2
300 400 500 600 700 800 900 1000
Curr
ent
Den
sity
(A
/m2
nm
)
Spec
tral
Irr
adia
nce
(W
/m2
nm
)
Wavelength (nm)
Current Density Generated by Organic Materials
under Local Direct Irradiance
Local Direct Irradiance PTBFTDTBT:PC71BM PTB7:PC60BMP3HT:PCBM PCPDTBT:PC71BM PCDTBT:PC70BM

29
Table 4.3: Various organic materials' photovoltaic data under the illumination of local
direct spectral irradiance (Improvement of PCE compared to AM 1.5G)
Organic
Materials
VOC
(V)
JSC
(mA/cm2)
FF
(%)
PCE
(%)
AM 1.5G
PCE (%)
Improvement
(%)
PTBFTDTBT
:PC71BM 0.80 14.21 51.4 6.31 5.79 8.97
PTB7:
PC60BM 0.76 13.28 62.0 6.86 6.27 9.48
P3HT:
PC60BM 0.61 7.84 69.0 3.41 3.19 6.69
PCPDTBT:
PC71BM 0.63 11.10 42.2 3.28 3.05 7.45
PCDTBT:
PC70BM 0.88 10.80 49.0 4.95 4.62 7.16
Based on the photovoltaic results obtained and shown in Table 4.3, on average,
each of the organic materials’ group has experienced improvement under the local
direct spectral irradiance illumination, with respect to AM 1.5G. Among the 5 organic
materials’ groups, [PTB7:PC60BM] and [PTBFTDTBT:PC71BM] groups were
calculated to have 9.48% and 8.97% in improvement respectively, which were the first
and second highest improvement on the list. The reason for their improvement may
due to the red-shifted of the local direct irradiance with respect to AM 1.5G spectrum,
where the peak of the local direct spectrum is closer to the peak of the organic materials’
spectral response region. However, owing to larger spectral response width (as shown
in Figure 4.8) of [PTB7:PC60BM] has (300 nm – 900 nm), as compared to
[PTBFTDTBT:PC71BM] (300 nm – 750 nm), thus more photons would be absorbed
and converted to EHPs by the former organic materials than the latter. This led to
higher calculated PCE values for [PTB7:PC60BM] than [PTBFTDTBT:PC71BM],
which were 6.86% and 6.31% respectively.

30
4.3.2 Local diffuse spectral irradiance illumination
The peak intensity of local diffuse spectral irradiance was measured at 500 – 550 nm,
which was red-shifted with respect to AM 1.5G by about 50 nm, but it was blue-shifted
with respect to local direct and local total average spectral irradiances by 50 nm (as
shown in Table 4.1). The ISI value calculated under local diffuse spectral irradiance
illumination is 156.72 W/m2. The device QE and the device responsivity are plotted
versus the local diffuse spectral irradiance, as shown in Figure 4.10 and Figure 4.11.
The current densities that generated from the organic materials under the illumination
of local diffuse irradiance is plotted in Figure 4.12. The corresponding photovoltaics’
data are then obtained for the 5 organic materials’ groups and shown in Table 4.4. The
percentage of improvement for each of the organic materials’ group is done by
comparing the respective PCE values with the PCE values obtained in AM 1.5G; while
the improvement percentage in Table 4.5 is comparing to local direct spectral
irradiance.
Figure 4.10: External Quantum Efficiency (EQE) of organic materials under the
illumination of local diffuse spectral irradiance (red line with solid symbol denotes the
local diffuse spectral irradiance, while the coloured smooth lines are device QE)
0.0%
10.0%
20.0%
30.0%
40.0%
50.0%
60.0%
70.0%
80.0%
90.0%
100.0%
0
0.05
0.1
0.15
0.2
0.25
0.3
0.35
300 400 500 600 700 800 900 1000
Dev
ice
QE
(%
)
Spec
tral
Irr
adia
nce
(W
/m2
nm
)
Wavelength (nm)
EQE of Organic Materials under Local Diffuse
Irradiance
Local Diffuse Irradiance PTBFTDTBT:PC71BM PTB7:PC60BM
P3HT:PCBM PCPDTBT:PC71BM PCDTBT:PC70BM

31
Figure 4.11: Responsivity of organic materials under the illumination of local diffuse
spectral irradiance (red line with solid symbol denotes the local diffuse spectral
irradiance, while the coloured smooth lines are device responsivity)
Figure 4.12: Current density (in the function of wavelength) of each of the organic
materials under illumination of local diffuse spectral irradiance (red line with solid
symbol denotes the local diffuse spectral irradiance, while the coloured smooth lines
are device current density)
0
0.1
0.2
0.3
0.4
0.5
0.6
0.7
0.8
0.9
1
0
0.05
0.1
0.15
0.2
0.25
0.3
0.35
300 400 500 600 700 800 900 1000
Dev
ice
Res
ponsi
vit
y (
A/W
)
Spec
tral
Irr
adia
nce
(W
/m2
nm
)
Wavelength (nm)
Responsivity of Organic Materials under Local
Diffuse Irradiance
Local Diffuse Irradiance PTBFTDTBT:PC71BM PTB7:PC60BMP3HT:PCBM PCPDTBT:PC71BM PCDTBT:PC70BM
0
0.1
0.2
0.3
0.4
0.5
0.6
0.7
0.8
0.9
1
0
0.05
0.1
0.15
0.2
0.25
0.3
0.35
300 400 500 600 700 800 900 1000
Curr
ent
Den
sity
(A
/m2
nm
)
Spec
tral
Irr
adia
nce
(W
/m2
nm
)
Wavelength (nm)
Current Density Generated by Organic Materials
under Local Diffuse Irradiance
Local Diffuse Irradiance PTBFTDTBT:PC71BM PTB7:PC60BMP3HT:PCBM PCPDTBT:PC71BM PCDTBT:PC70BM

32
Table 4.4: Various organic materials' photovoltaic data under the illumination of local
diffuse spectral irradiance (Improvement of PCE compared to AM 1.5G)
Organic
Materials
VOC
(V)
JSC
(mA/cm2)
FF
(%)
PCE
(%)
AM 1.5G
PCE (%)
Improvement
(%)
PTBFTDTBT
:PC71BM 0.80 14.21 51.4 6.66 5.79 15.03
PTB7:
PC60BM 0.76 13.28 62.0 7.09 6.27 13.23
P3HT:
PC60BM 0.61 7.84 69.0 3.68 3.19 15.39
PCPDTBT:
PC71BM 0.63 11.10 42.2 3.45 3.05 13.03
PCDTBT:
PC70BM 0.88 10.80 49.0 5.34 4.62 15.61
Table 4.5: Various organic materials' photovoltaic data under the illumination of local
diffuse spectral irradiance (Improvement of PCE compared to local direct spectral
irradiance PCE (L. Direct PCE))
Organic
Materials
VOC
(V)
JSC
(mA/cm2)
FF
(%)
PCE
(%)
L. Direct
PCE (%)
Improvement
(%)
PTBFTDTBT
:PC71BM 0.80 14.21 51.4 6.66 6.31 5.56
PTB7:
PC60BM 0.76 13.28 62.0 7.09 6.86 3.42
P3HT:
PC60BM 0.61 7.84 69.0 3.68 3.41 8.15
PCPDTBT:
PC71BM 0.63 11.10 42.2 3.45 3.28 5.19
PCDTBT:
PC70BM 0.88 10.80 49.0 5.34 4.95 7.89
33
As shown from Table 4.4, the calculated results for the performance of organic
materials under the illumination of local diffuse spectral irradiance having a great
improvement with respect to AM 1.5G, whereby all of them having an improvement
in performance with more than 13%. The high improvement in PCE values may be
due to peak intensities shifting in the local diffuse spectral irradiance, where the
intensities of the spectral irradiances at the peak of the red-shifted region were more
favourable to the spectral response region of the studied organic materials’ groups.
Positive performance improvement was calculated for the relevant organic
materials’ groups with respect to the local direct irradiance illumination (as shown in
Table 4.5). The explanations for it, other than it appeared that local diffuse spectral
irradiance is more favourable to the spectral response region of respective organic
materials, the higher average photon energy (APE) values of the incoming photons
under overcast condition (1.75 eV) as compared to clear day condition (1.65 eV) were
recorded at the site. During overcast condition, different thickness of clouds may have
blocked the transmission of the majority lower energy photons (longer wavelength
photons) to the ground’s surface; while the higher energy photons (shorter wavelength
photons) having a relatively higher transmission probability than the lower energy
photons by about 30% (S. Nann & C. Riordan, 1991). The spectral gain in performance
of solar cells [amorphous-silicon module] with a narrow spectral response width (330
nm – 810 nm) on the outdoor performance was also shown to have 15% gain with
respect to AM 1.5G under local overcast condition (Nofuentes, 2014). This indicates
that the illumination of local cloudy condition under same intensity (after
normalisation) will be more beneficial to the OSCs that consist of narrow spectral
response width, as compared with AM 1.5G spectrum and local direct spectral
irradiance.
4.3.3 Local total average spectral irradiance illumination
The peak intensity of local total average spectral irradiance was measured at 550 nm
– 600 nm (similar to local direct spectral irradiance), which was red-shifted with
respect to AM 1.5G by about 100 nm. The calculated ISI value for it is 408.36 W/m2.

34
The local total average spectral irradiance is averaging all the spectrum data (including
direct and diffuse conditions) obtained at 8.00 am – 6.00 pm. The device QE and also
the device responsivity under illumination of local total average spectral irradiance
were plotted in Figure 4.13 and Figure 4.14, respectively. The corresponding current
density values and also photovoltaic data for each of the organic materials are
illustrated in Figure 4.15 and Table 4.6 respectively.
Figure 4.13: External Quantum Efficiency (EQE) of organic materials under the
illumination of local total average spectral irradiance (light-blue line with solid symbol
denotes the local total average spectral irradiance, while the coloured smooth lines are
device QE)
0.0%
10.0%
20.0%
30.0%
40.0%
50.0%
60.0%
70.0%
80.0%
90.0%
100.0%
0
0.1
0.2
0.3
0.4
0.5
0.6
0.7
0.8
300 400 500 600 700 800 900 1000
Dev
ice
QE
(%
)
Spec
tral
Irr
adia
nce
(W
/m2
nm
)
Wavelength (nm)
EQE of Organic Materials under Local Spectral
Irradiance
Local Solar Irradiance PTBFTDTBT:PC71BM PTB7:PC60BM
P3HT:PCBM PCPDTBT:PC71BM PCDTBT:PC70BM

35
Figure 4.14: Responsivity of organic materials under the illumination of local total
average spectral irradiance (light-blue line with solid symbol denotes the local total
average spectral irradiance, while the coloured smooth lines are device responsivity)
Figure 4.15: Current density (in the function of Wavelength) of each of the organic
materials under illumination of local total average spectral irradiance (light-blue line
with solid symbol denotes the local total average spectral irradiance, while the
coloured smooth lines are device current density)
0
0.1
0.2
0.3
0.4
0.5
0.6
0.7
0.8
0.9
1
0
0.1
0.2
0.3
0.4
0.5
0.6
0.7
0.8
300 400 500 600 700 800 900 1000
Dev
ice
Res
ponsi
vit
y (
A/W
)
Spec
tral
Irr
adia
nce
(W
/m2
nm
)
Wavelength (nm)
Responsivity of Organic Materials under Local
Spectral Irradiance
Local Solar Irradiance PTBFTDTBT:PC71BM PTB7:PC60BM
P3HT:PCBM PCPDTBT:PC71BM PCDTBT:PC70BM
0
0.1
0.2
0.3
0.4
0.5
0.6
0.7
0.8
0.9
1
0
0.1
0.2
0.3
0.4
0.5
0.6
0.7
0.8
300 400 500 600 700 800 900 1000
Curr
ent
Den
sity
(A
/m2
nm
)
Spec
tral
Irr
adia
nce
(W
/m2
nm
)
Wavelength (nm)
Current Density Generated by Organic Materials
under Local Spectral Irradiance
Local Solar Irradiance PTBFTDTBT:PC71BM PTB7:PC60BM
P3HT:PCBM PCPDTBT:PC71BM PCDTBT:PC70BM

36
Table 4.6: Various organic solar cells' photovoltaic data under the illumination of local
total average spectral irradiance (Improvement of PCE compared to AM 1.5G)
Organic
Materials
VOC
(V)
JSC
(mA/cm2)
FF
(%)
PCE
(%)
AM 1.5G
PCE (%)
Improvement
(%)
PTBFTDTBT
:PC71BM 0.80 14.21 51.4 6.36 5.79 9.97
PTB7:
PC60BM 0.76 13.28 62.0 6.90 6.27 10.10
P3HT:
PC60BM 0.61 7.84 69.0 3.45 3.19 8.12
PCPDTBT:
PC71BM 0.63 11.10 42.2 3.31 3.05 8.37
PCDTBT:
PC70BM 0.88 10.80 49.0 5.01 4.62 8.55
The PCE values and the percentage of improvement with respect to AM 1.5G
obtained in each of the organic materials under the illumination of local total average
spectral irradiance shown in Table 4.6 are similar to the results obtained under the
illumination of local direct spectral irradiance, with the former illumination producing
slightly better results than the latter illumination due to the inclusion of local diffuse
spectral irradiance. The nearly similar results obtained under these 2 types of
illuminations are due to the patterns of the 2 spectral irradiances are identical, in terms
of the wavelength interval where the peak intensities of the spectral irradiance located
(as shown in Figure 4.3).
4.3.4 Summary of the organic materials’ performance under different spectral
irradiance illumination conditions
The summary of the PCE values obtained for each organic material that subjected to
different spectral irradiances’ illuminations and the percentage of improvement are

37
shown in Table 4.7 and Table 4.8 respectively. From the tables, L. Direct S. I. denotes
local direct spectral irradiance; L. Diffuse S. I. denotes local diffuse spectral irradiance;
L. Total Ave. S. I. denotes local total average spectral irradiance.
Table 4.7: Power conversion efficiency (%) of each of the organic materials subjected
to different spectral irradiance illuminations
Organic Materials Power Conversion Efficiency (%)
PTBFTDTB
T: PC71BM
PTB7:
PC60BM
P3HT:
PC60BM
PCPDTBT:
PC71BM
PCDTBT
:PC70BM
Con
dit
ion
s
AM 1.5G 5.79 6.27 3.19 3.05 4.62
L. Direct
S. I. 6.31 6.86 3.41 3.28 4.95
L. Diffuse
S. I. 6.66 7.09 3.68 3.45 5.34
L. Total
Ave. S. I. 6.36 6.90 3.45 3.31 5.01
Table 4.8: Power conversion efficiency (%) improvement of each of the organic
materials with respect to AM 1.5G Spectrum
Organic Materials PCE Improvement (%)
PTBFTDTB
T: PC71BM
PTB7:
PC60BM
P3HT:
PC60BM
PCPDTBT:
PC71BM
PCDTBT
:PC70BM
Con
dit
ion
s
L. Direct
S. I. 8.97 9.48 6.69 7.45 7.16
L. Diffuse
S. I. 15.03 13.23 15.39 13.03 15.61
L. Total
Ave. S. I. 9.97 10.10 8.12 8.37 8.55
As shown in Table 4.7, based on the power conversion efficiency of each of
the studied organic materials, the best candidate for the designation of the organic solar

38
cells’ active layer in ASEAN region would be [PTB7: PC60BM], with the recorded
PCE value of 6.90% under the illumination of local total average spectral irradiance.
The high PCE values that [PTB7: PC60BM] able to generate when subjected to the
total average of local spectral irradiances was mainly due to its large spectral response
region, and the red-shifted local spectral irradiance with respect to AM 1.5G spectrum
was favoured to the organic materials itself. The improvement of [PTB7: PC60BM]
also shown to be the greatest among the 5 organic groups under local total average
spectral irradiance’s illumination (shown in Table 4.8), which calculated to be 10.10%.
4.4 Local average photon energy distribution
The effect of the various local spectral irradiance illuminations to the performance of
organic solar cells (organic materials) have been shown in the results in the previous
section. Apart from the local spectral irradiances, there is another parameter which is
worth to be considered, the average photon energy (APE) index. As aforementioned in
Section 2.3, the solar cells that having a narrow spectral response width would be
affected by the local APE index. Since majority of the OSCs having narrow spectral
response width, it is thus necessary to understand the distribution of the local APE
values, as it may be one of the significant factors that affects the performance of OSCs.
Figure 4.16 displays the distribution of APE index based on separated local direct and
local diffuse spectral irradiances. The APE index for the standard spectrum AM 1.5G
for the spectral range between 280 nm – 1750 nm was calculated to be 1.59 eV. The
highest occurrence of APE index for the local direct spectral irradiance was calculated
at 1.63 eV; while the local diffuse spectral irradiance was calculated at 1.71 eV.
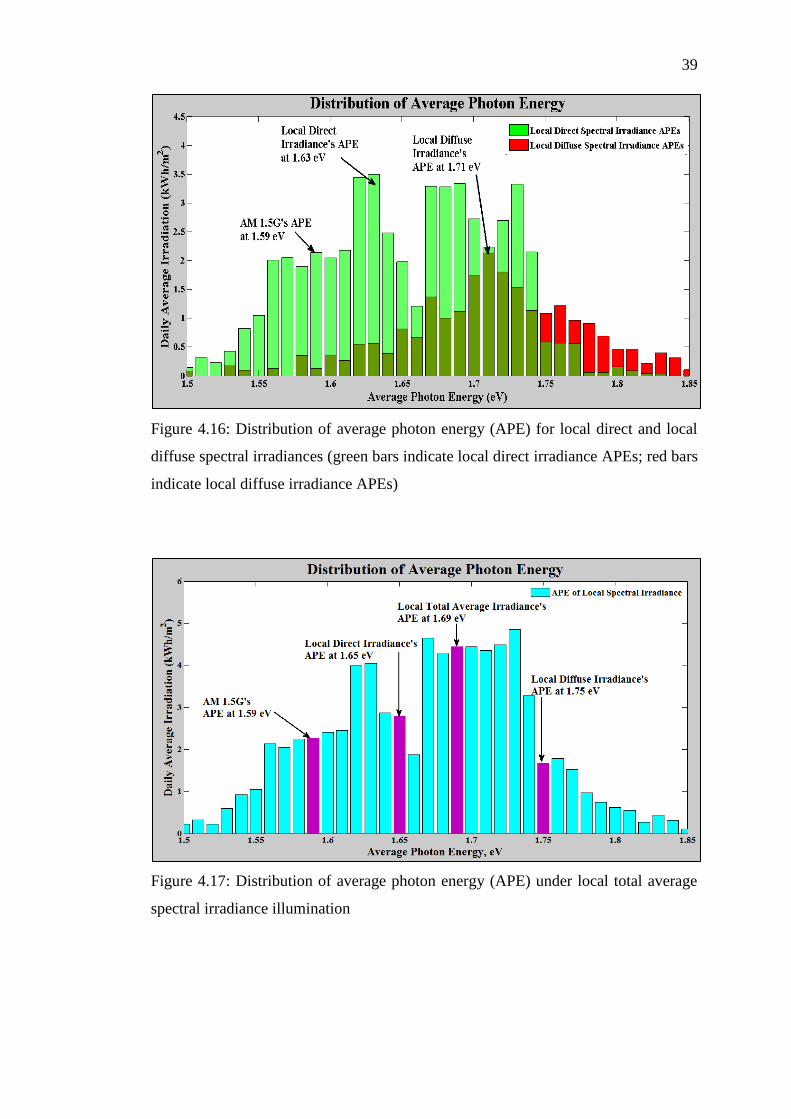
39
Figure 4.16: Distribution of average photon energy (APE) for local direct and local
diffuse spectral irradiances (green bars indicate local direct irradiance APEs; red bars
indicate local diffuse irradiance APEs)
Figure 4.17: Distribution of average photon energy (APE) under local total average
spectral irradiance illumination

40
As illustrated from Figure 4.17, the calculated average APE values for local
direct spectral irradiance, local diffuse spectral irradiance, and local total average
spectral irradiance are 1.65 eV, 1.75 eV, and 1.69 eV respectively. The variations in
the APE values that calculated based on different local weather conditions, is due to
the fact that the spectral irradiance is heavily dependent on the cloud coverage in the
air (C. Cornaro & A. Andreotti, 2013). As aforementioned in Section 4.3.2, the
considerations that made by Naan and Riordan about the blue enrichment in the
spectral irradiance interval will occur under overcast condition. This is due to the fact
that higher energy photons consist relative higher transmission probability than the
lower energy photons by 30%, which lead to higher APE values obtained under local
cloudy condition than in local clear day condition. In addition to local cloudy
conditions, the high air humidity level (70% - 90%) in Malaysia that causes radiation
of sunlight near specific wavelengths would be absorbed by the water vapour during
clear day conditions (as mentioned in Section 4.1). This leads to 83.72% of the APE
values obtained locally at Kajang, Malaysia are higher than the AM 1.5G APE at 1.59
eV. This indicates that APE values are more dependent on the patterns of local spectral
irradiances that shaped by water vapour absorption near specific wavelengths and also
the weather conditions, as compared to the calculated ISI values.
4.5 Probability of getting direct spectral irradiance during daytime
The average annual temperature (29˚C) that recorded in Malaysia (Underground, 2016)
is higher than the standard ambient temperature of 20˚C, which taken by American
Society for Testing and Materials for AM 1.5G calculation. This often led to the
formation of clouds or raining in the noon hours till evening hours, due to evaporation
of water happened in the earlier part of the day. The probability of having direct
sunlight throughout the day during the project data collection (January 2016 – July
2016) that conducted on the site is displayed in Figure 4.18. As shown from the results
in Figure 4.18, the probability of getting direct spectral irradiance data is high in the
morning (more than 70% at 9.00 am – 11.00 am), but the probability shown some
reduction in the noon (around 50% to 60% at 12.00 pm – 2.00 pm), and finally a great
scaling down in probability having direct sunlight was observed in the late evening

41
(less than 35% at 4.00 pm – 6.00 pm). The percentage of having local direct sunlight
data is 57.18%; while local overcast condition data comprised of 42.82% of the total
spectrum data collected. This indicates ASEAN countries that have high average
annual temperature, such as Malaysia, Singapore, Brunei, and Indonesia, will appear
to have cloudy or rainy conditions in the noon to until the evening, which will
significantly affect the local spectral irradiances. Furthermore, those cities that near to
the seaside in ASEAN region will experience even more overcast weather during the
monsoon or interchanged of monsoon seasons (Varikoden, 2011).
Figure 4.18: Probability of having direct sunlight throughout the day on the site at
Universiti Tunku Abdul Rahman (UTAR), Kajang, Malaysia (the middle period for
each hour, for example 830 denotes as 0800 – 0859 for convenience of results
presentation)

42
CHAPTER 5
5 CONCLUSIONS AND RECOMMENDATIONS
In conclusion, the best organic material selection for this project was conducted
through the on-site measurement to obtain the information about annual local spectral
irradiances, and theoretical study of the performance of organic solar cells (or organic
materials) subjected to illumination of various spectral irradiance under same intensity
through normalization process. The annual local spectral irradiances, which comprised
of local direct, local diffuse, and local total average spectral irradiances, showing
significant deviations with respect to standard AM 1.5G spectrum in terms of peak
intensity. The peak intensities of the local direct, local diffuse, and local total average
spectral irradiances were calculated at 550 – 600 nm, 500 – 550 nm, and 550 – 600
nm, respectively; while the peak intensity of the AM 1.5G spectrum was calculated at
450 – 500 nm. The red-shifting of the respective spectral irradiances were proven to
have a positive improvement in the organic solar cells’ performance, especially under
illumination of local diffuse spectral irradiance. The calculated ISI values for total
average, total direct, and also total diffuse are 408.36 W/m2, 596.81 W/m2, and 156.72
W/m2 respectively. The performance of each organic material was studied through the
curve fitting method conducted to the device quantum efficiency in order to calculate
relevant photovoltaic data that required for power conversion efficiency (PCE)
calculations. Among the 5 studied organic materials’ groups, [PTB7: PC60BM]
appeared to be the best organic materials for the designation of organic solar cells, by
having the PCE of 6.90%, and also having the greatest percentage improvement
(10.10%) under local total average spectral irradiance. In addition to spectrum analysis
on local spectral irradiances, the analysis local average photon energy (APE) was also
conducted, with the average APE index calculated for local direct spectral irradiance,

43
local diffuse spectral irradiance, and local total average spectral irradiance are 1.65 eV,
1.75 eV, and 1.69 eV respectively.
For future works, a few more sets of organic material combinations should be
studied in order to maximise the knowledge about the current available organic
materials that the market have so that more options of the materials can be considered.
The architecture of the organic solar cells (OSCs) should also be considered as one of
the selection parameters because based on literature review, it shows that the lifetime
of the OSCs is mainly depends on its device architecture. Upon successfully selected
and fabricated out organic solar cells, it is advisable to conduct an on-site evaluation
for the OSCs’ performance under various local spectral irradiances in order to obtain
more practical results. An optimisation of the selected organic materials may also be
conducted to maximise the performance potential that an organic material may have.
This can be done by studying the morphology of the relevant materials’ surface,
physical and chemical characteristics of the materials, in order to have better
understanding about the materials.

44
REFERENCES
Brus, V.V. "Light Dependent Open-Circuit Voltage of Organic Bulk Heterojunction
Solar Cells In The Presence Of Surface Recombination". Organic
Electronics 29 (2016): 1-6.
Chong, Kok-Keong et al. "Comprehensive Method for Analyzing the Power
Conversion Efficiency of Organic Solar Cells under Different Spectral
Irradiances Considering both Photonic and Electrical Characteristics". Applied
Energy 180 (2016): 516-523.
Cornaro, Cristina and Angelo Andreotti. "Influence of Average Photon Energy Index
on Solar Irradiance Characteristics and Outdoor Performance of Photovoltaic
Modules". Prog. Photovolt: Res. Appl. (2012).
"Defining Standard Spectra for Solar Panels". Greenrhinoenergy.com. Web. 4 Aug.
2016.
Fan, Ling et al. "A New Two-Dimensional Donor/Acceptor Copolymer Based On 4,8-
Bis(2′-Ethylhexylthiophene)Thieno[2,3-F]Benzofuran For High-Performance
Polymer Solar Cells".Journal of Materials Chemistry C 2.28 (2014): 5651.
Foster, J. M., J. Kirkpatrick, and G. Richardson. "Asymptotic And Numerical
Prediction Of Current-Voltage Curves For An Organic Bilayer Solar Cell
Under Varying Illumination And Comparison To The Shockley Equivalent
Circuit". J. Appl. Phys. 114.10 (2013): 104501.
"General Climate of Malaysia". Met.gov.my. 2016. Web. 3 Aug. 2016.
Guechi, A., M. Chegaar, and M. Aillerie. "Air Mass Effect on the Performance of
Organic Solar Cells". Energy Procedia 36 (2013): 714-721.
"Introduction to Solar Radiation". Newport.com. Web. 3 Aug. 2016.
Kasap, S. O. Optoelectronics and Photonics. Upper Saddle River, NJ: Prentice Hall,
2001. Print.
Kazem, H.A. et al. "Effect of Humidity on the PV Performance in Oman". Asian
Transactions on Engineering 02.04 (2012): 29 - 32.

45
Lim, Fang Jeng et al. "Influence Of A Novel Fluorosurfactant Modified PEDOT:PSS
Hole Transport Layer On The Performance Of Inverted Organic Solar
Cells". Journal of Materials Chemistry22.48 (2012): 25057.
Lin, Rui et al. "Enhancement of Ternary Blend Organic Solar Cell Efficiency Using
PTB7 as A Sensitizer". Synthetic Metals 192 (2014): 113-118.
Liu, Jiangang et al. "Improving The Morphology Of PCDTBT:PC70BM Bulk
Heterojunction By Mixed-Solvent Vapour-Assisted Imprinting: Inhibiting
Intercalation, Optimizing Vertical Phase Separation, And Enhancing Photon
Absorption". J. Phys. Chem. C 118.9 (2014): 4585-4595.
Liu, Yuhang et al. "Aggregation and Morphology Control Enables Multiple Cases of
High-Efficiency Polymer Solar Cells". Nature Communications 5 (2014):
5293.
Madsen, Morten. "Why Do Polymer Solar Cells Degrade". Plasticphotovoltaics.org.
Web. 4 Aug. 2016.
Mat Desa, M.K. et al. "Silicon Back Contact Solar Cell Configuration: A Pathway
Towards Higher Efficiency". Renewable and Sustainable Energy Reviews 60
(2016): 1516-1532.
Mambrini, Thomas et al. "Photovoltaic Yield: Correction Method for the Mismatch
between the Solar Spectrum and the Reference ASTMG AM1.5G
Spectrum". EPJ Photovolt. 6 (2015): 60701.
McGinley, Mark. "Climate 0f Malaysia". eoearth.org. 2016. Web. 2 Apr. 2016.
"Meteorological Data". Fao.org. 2016. Web. 13 Aug. 2016.
Mekhilef, S. et al. "Solar Energy In Malaysia: Current State And
Prospects". Renewable and Sustainable Energy Reviews 16.1 (2012): 386-396.
Morinaka, Yuta et al. "Synthesis and Photovoltaic Properties of Acceptor Materials
Based On the Dimerization of Fullerene C60 for Use in Efficient Polymer Solar
Cells". Chemical Communications 49.35 (2013): 3670.
Nann, Stefan and Carol Riordan. "Solar Spectral Irradiance under Clear and Cloudy
Skies: Measurements and a Semiempirical Model". Journal of Applied
Meteorology 30.4 (1991): 447-462.
Nofuentes, G. et al. "Analysis of the Dependence of the Spectral Factor of Some PV
Technologies on the Solar Spectrum Distribution". Applied Energy 113 (2014):
302-309.

46
Norton, M., A.M. Gracia Amillo, and R. Galleano. "Comparison of Solar Spectral
Irradiance Measurements Using the Average Photon Energy Parameter". Solar
Energy 120 (2015): 337-344.
"Organic Solar Power". I-sis.org.uk. 2006. Web. 12 Aug. 2016.
Savenije, Tom J. "Organic Solar Cells". Solar Cells. Rene Janssen. 1st ed. 2014. 8.14.
Web. 19 Aug. 2016.
"Sepang-KL International Airport, Malaysia". Wunderground.com. 2016. Web. 3 Aug.
2016.
Shockley, William and Hans J. Queisser. "Detailed Balance Limit of Efficiency Of P-
N Junction Solar Cells". J. Appl. Phys. 32.3 (1961): 510.
Shwartz, Mark. "Perovskites Provide Big Boost to Silicon Solar Cells, Stanford Study
Finds Energy". Energy.stanford.edu. 2016. Web. 15 Aug. 2016.
Sirisamphanwong, C. et al. "Average Photon Energy under Thailand's Climatic
Condition". Internation Journal of Renewable Energy 6.1 (2016): 25-29.
Sirisamphanwong, Chattariya, Nipon Ketjoy, and Chatchai Sirisamphanwong. "The
Effect of Average Photon Energy and Module Temperature on Performance of
Photovoltaic Module under Thailand's Climate Condition". Energy
Procedia 56 (2014): 359-366.
Tanenbaum, David M. et al. "Edge Sealing for Low Cost Stability Enhancement of
Roll-To-Roll Processed Flexible Polymer Solar Cell Modules". Solar Energy
Materials and Solar Cells 97 (2012): 157-163.
Us, About and Mathias Maehlum. "Which Solar Panel Type Is Best? Mono-,
Polycrystalline Or Thin Film?". Energy Informative. 2015.
U.S. Standard Atmosphere, 1976. Washington D.C: National Oceanic and
Atmospheric Administration National Aeronautics and Space Administration
United States Air Force, 1976.
Varikoden, H., et al. Seasonal variation of rainfall characteristics in different intensity
classes over Peninsular Malaysia. J. Hydrol. (2011),
doi:10.1016/j.jhydrol.2011.04.021
Wang, Kai et al. "Inverted Organic Photovoltaic Cells". Chem. Soc. Rev. 45.10 (2016):
2937-2975.
Würfel, Uli et al. "Impact of Charge Transport on Current–Voltage Characteristics and
Power-Conversion Efficiency of Organic Solar Cells". Nature
Communications 6 (2015): 6951.
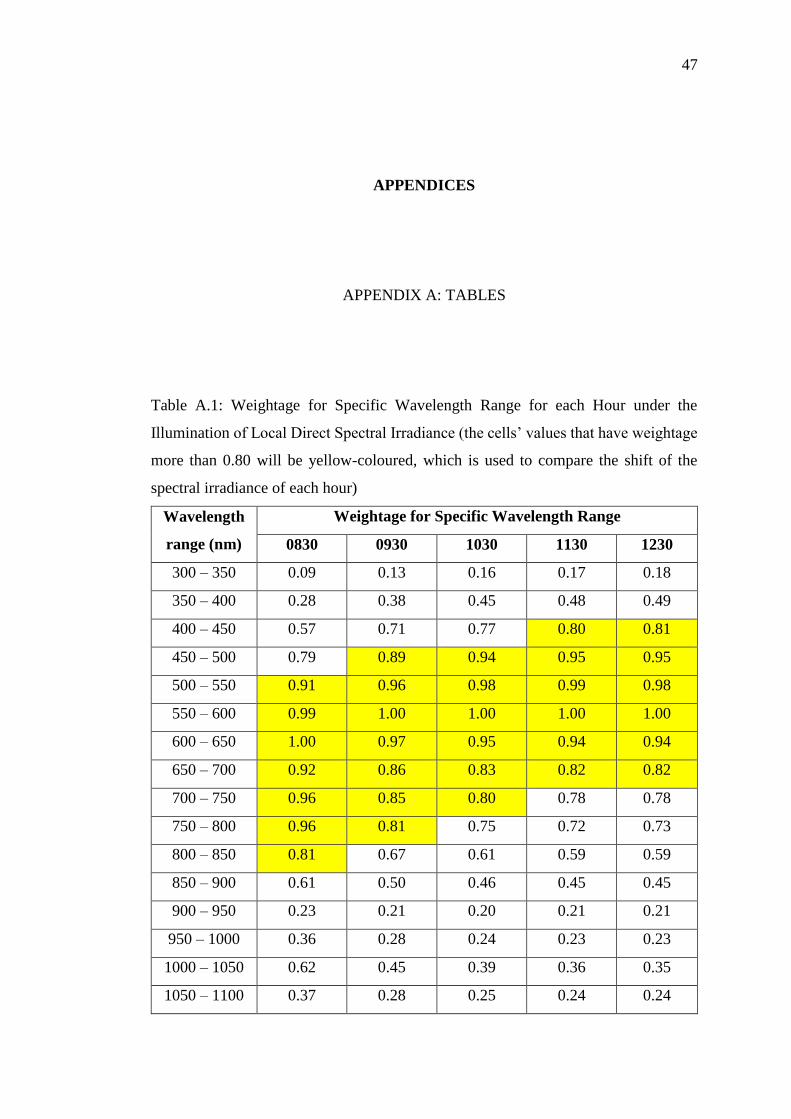
47
APPENDICES
APPENDIX A: TABLES
Table A.1: Weightage for Specific Wavelength Range for each Hour under the
Illumination of Local Direct Spectral Irradiance (the cells’ values that have weightage
more than 0.80 will be yellow-coloured, which is used to compare the shift of the
spectral irradiance of each hour)
Wavelength
range (nm)
Weightage for Specific Wavelength Range
0830 0930 1030 1130 1230
300 – 350 0.09 0.13 0.16 0.17 0.18
350 – 400 0.28 0.38 0.45 0.48 0.49
400 – 450 0.57 0.71 0.77 0.80 0.81
450 – 500 0.79 0.89 0.94 0.95 0.95
500 – 550 0.91 0.96 0.98 0.99 0.98
550 – 600 0.99 1.00 1.00 1.00 1.00
600 – 650 1.00 0.97 0.95 0.94 0.94
650 – 700 0.92 0.86 0.83 0.82 0.82
700 – 750 0.96 0.85 0.80 0.78 0.78
750 – 800 0.96 0.81 0.75 0.72 0.73
800 – 850 0.81 0.67 0.61 0.59 0.59
850 – 900 0.61 0.50 0.46 0.45 0.45
900 – 950 0.23 0.21 0.20 0.21 0.21
950 – 1000 0.36 0.28 0.24 0.23 0.23
1000 – 1050 0.62 0.45 0.39 0.36 0.35
1050 – 1100 0.37 0.28 0.25 0.24 0.24
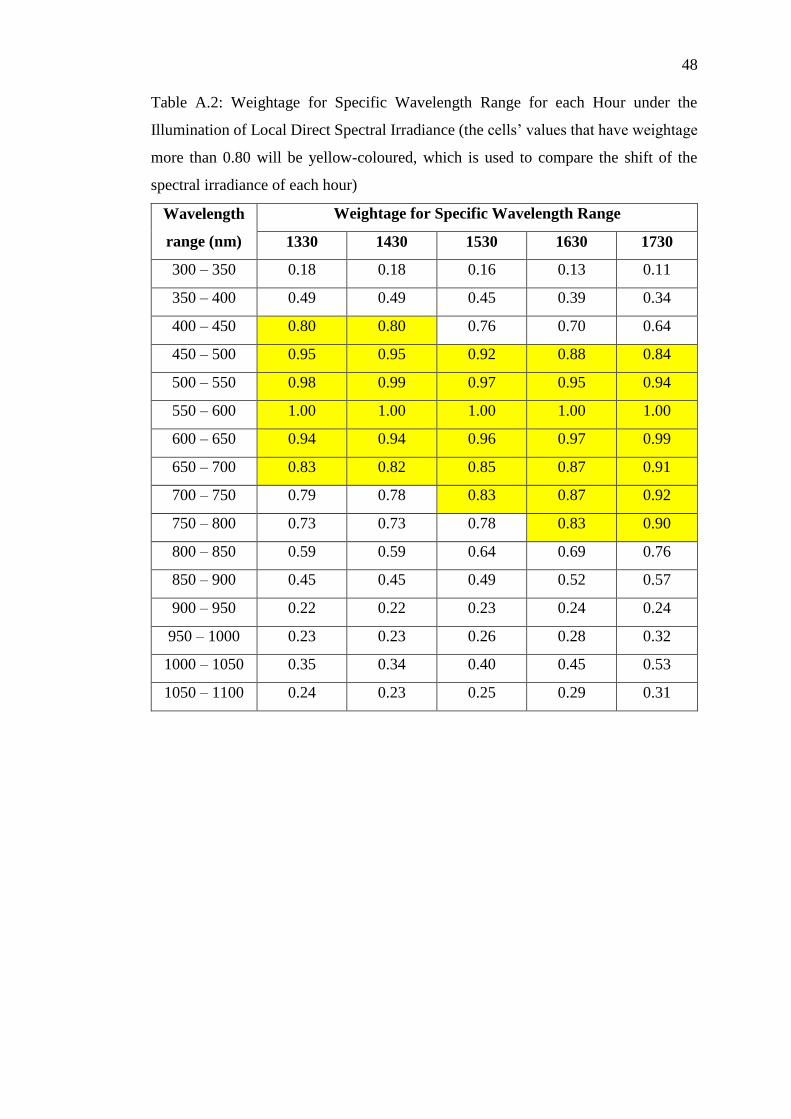
48
Table A.2: Weightage for Specific Wavelength Range for each Hour under the
Illumination of Local Direct Spectral Irradiance (the cells’ values that have weightage
more than 0.80 will be yellow-coloured, which is used to compare the shift of the
spectral irradiance of each hour)
Wavelength
range (nm)
Weightage for Specific Wavelength Range
1330 1430 1530 1630 1730
300 – 350 0.18 0.18 0.16 0.13 0.11
350 – 400 0.49 0.49 0.45 0.39 0.34
400 – 450 0.80 0.80 0.76 0.70 0.64
450 – 500 0.95 0.95 0.92 0.88 0.84
500 – 550 0.98 0.99 0.97 0.95 0.94
550 – 600 1.00 1.00 1.00 1.00 1.00
600 – 650 0.94 0.94 0.96 0.97 0.99
650 – 700 0.83 0.82 0.85 0.87 0.91
700 – 750 0.79 0.78 0.83 0.87 0.92
750 – 800 0.73 0.73 0.78 0.83 0.90
800 – 850 0.59 0.59 0.64 0.69 0.76
850 – 900 0.45 0.45 0.49 0.52 0.57
900 – 950 0.22 0.22 0.23 0.24 0.24
950 – 1000 0.23 0.23 0.26 0.28 0.32
1000 – 1050 0.35 0.34 0.40 0.45 0.53
1050 – 1100 0.24 0.23 0.25 0.29 0.31

49
APPENDIX B: PUBLICATION
Figure A 1: Comprehensive method for analysing the PCE of OSCs under different
spectral irradiances considering both photonic and electrical characteristics (page 1)

50
Figure A 2: Comprehensive method for analysing the PCE of OSCs under different
spectral irradiances considering both photonic and electrical characteristics (page 2)
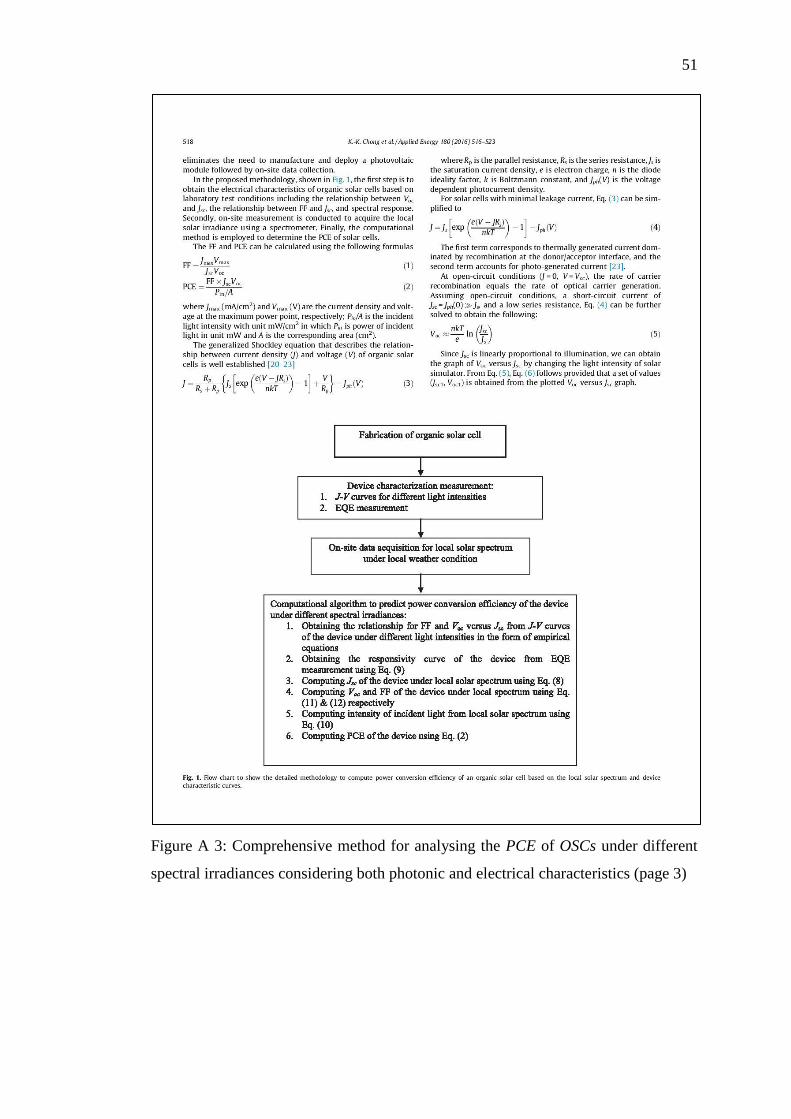
51
Figure A 3: Comprehensive method for analysing the PCE of OSCs under different
spectral irradiances considering both photonic and electrical characteristics (page 3)

52
Figure A 4: Comprehensive method for analysing the PCE of OSCs under different
spectral irradiances considering both photonic and electrical characteristics (page 4)
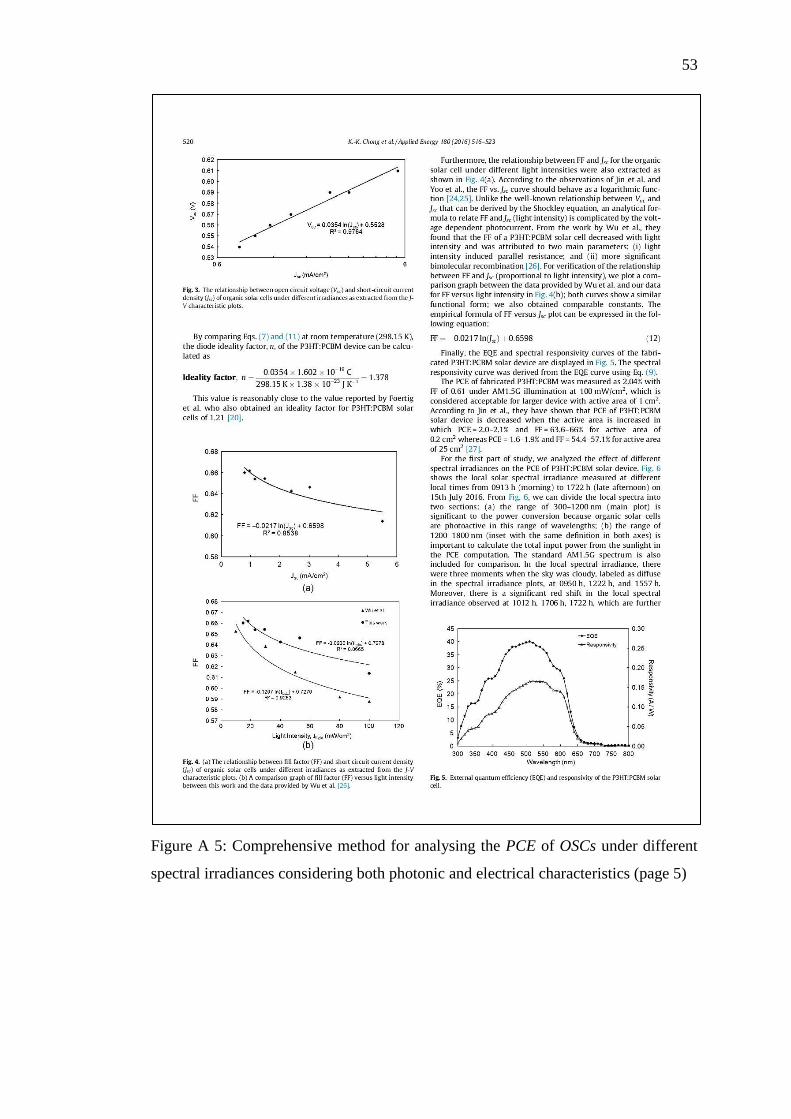
53
Figure A 5: Comprehensive method for analysing the PCE of OSCs under different
spectral irradiances considering both photonic and electrical characteristics (page 5)

54
Figure A 6: Comprehensive method for analysing the PCE of OSCs under different
spectral irradiances considering both photonic and electrical characteristics (page 6)
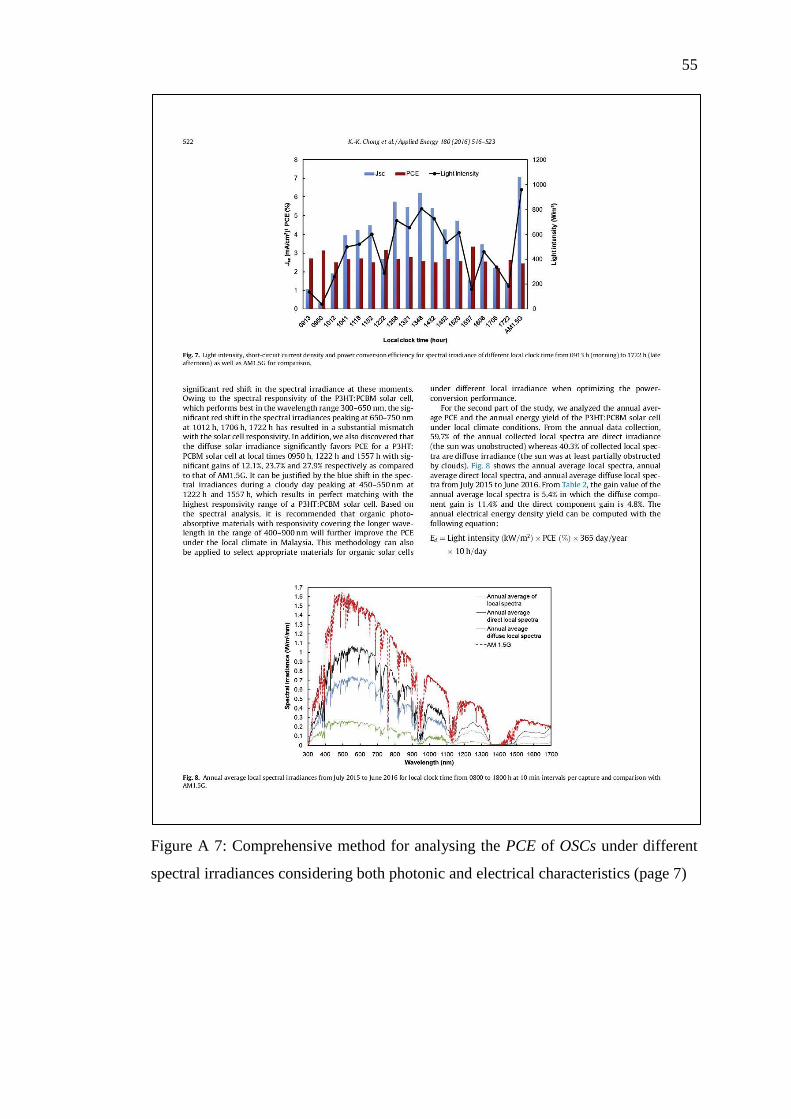
55
Figure A 7: Comprehensive method for analysing the PCE of OSCs under different
spectral irradiances considering both photonic and electrical characteristics (page 7)
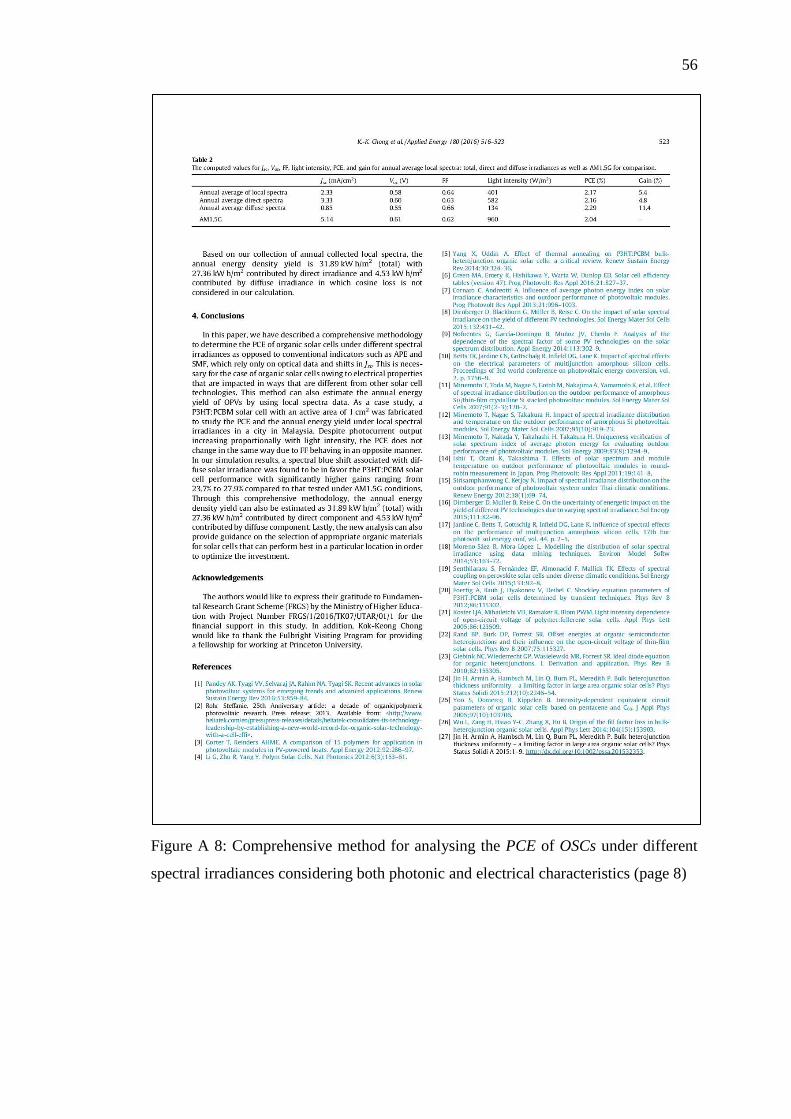
56
Figure A 8: Comprehensive method for analysing the PCE of OSCs under different
spectral irradiances considering both photonic and electrical characteristics (page 8)