study of light backgrounds from relativistic electrons in ... · a 1ˇ-collimation system with an...
TRANSCRIPT

Study of Light Backgrounds from Relativistic Electrons in Air Light-Guides
S. Riordana,b,1, Y. X. Zhaoa,∗, S. Baunackc, D. Beckerc, C. Clarkea, K. Dehmelta, A. Deshpandea, M. Gericked,B. Glaserc, K. Imaic, T. Kutza, F. E. Maasc,e,f, D. McNultyg, J. Pand, S. Parka, S. Rahmand, P.A. Souderh, P. Wangd,
B. Wellmana, K. S. Kumara
aDepartment of Physics and Astronomy, Stony Brook University, Stony Brook, NY 11794, USAbPhysics Division, Argonne National Laboratory, Argonne, IL 60439, USA
cInstitute for Nuclear Physics, Johannes Gutenberg-University Mainz, J. J. Becherweg 45, D-55099 Mainz, GermanydDepartment of Physics and Astronomy, University of Manitoba, Winnipeg, MB R3T 2N2, Canada
eGSI Helmholtzzentrum fur Schwerionenforschung GmbH, Planckstraße 1, D-64291 Darmstadt, GermanyfHelmholtz-Institute Mainz, Johannes Gutenberg-University Mainz, D-55099 Mainz, Germany
gDepartment of Physics, Idaho State University, Pocatello, ID 83209, USAhDepartment of Physics, Syracuse University, Syracuse, NY 13244, USA
Abstract
The MOLLER experiment proposed at the Thomas Jefferson National Accelerator Facility plans a precision low en-
ergy determination of the weak mixing angle via the measurement of the parity-violating asymmetry in the scattering
of high energy longitudinally polarized electrons from electrons bound in a liquid hydrogen target (Møller scattering).
A relative measure of the scattering rate is planned to be obtained by intercepting the Møller scattered electrons with a
circular array of thin fused silica tiles attached to air light guides, which facilitate the transport of Cherenkov photons
generated within the tiles to photomultiplier tubes (PMTs). The scattered flux will also pass through the light guides of
downstream tiles, generating additional Cherenkov as well as scintillation light and is a potential background. In order
to estimate the rate of these backgrounds, a gas-filled tube detector was designed and deployed in an electron beam
at the MAMI facility at Johannes Gutenberg University, Mainz, Germany. Described in this paper is the design of a
detector to measure separately the scintillation and Cherenkov responses of gas mixtures from relativistic electrons,
the results of studies of several gas mixtures with comparisons to simulations, and conclusions about the implications
for the design of the MOLLER detector apparatus.
Keywords: MOLLER Project, Beam Test, Gas Scintillation, Cherenkov, Geant4 Simulation
1. Introduction
The next generation of precision tests of the Standard Model at modern accelerator facilities requires the use
of large area, open geometry detectors to obtain the required statistical precision, which in turn necessitates novel
detector configurations and experimental techniques. The MOLLER experiment [1–3] intends to study a parity-
violating signal in the Møller scattering process to measure the weak mixing angle sin2 θW at the Thomas Jefferson
∗Corresponding authorEmail address: [email protected] (Y. X. Zhao)
1Present address: Physics Division, Argonne National Laboratory, Argonne, IL 60439, USA
Preprint submitted to Elsevier April 24, 2018
arX
iv:1
710.
0710
0v2
[ph
ysic
s.in
s-de
t] 2
3 A
pr 2
018

Liquid H2 target
Toroidal spectrometer
Particle envelopes32 m
Detector assembly
Beam direction
Figure 1: A schematic of the MOLLER experiment setup.
National Accelerator Facility. It will utilize several concentric rings of fused silica Cherenkov radiators as the primary
detectors for the scattered electrons. Such an arrangement allows for in principle the total azimuthal coverage of
the Møller scattering process, but due to the large acceptance one must carefully account for a number sources of
background, including those from the primary flux itself.
Shown in Figure 1, the overall experimental design calls for an 11 GeV polarized electron beam to impinge on a
1.5 m liquid hydrogen target with a spectrometer and collimator system designed to collect Møller scattered electrons
in the full range of the azimuth, and a center-of-mass polar angle range of 60 to 120 degrees. This corresponds to
laboratory scattering angles of 5 to 20 mrad. A 1π-collimation system with an odd number of apertures symmetric in
center-of-mass polar angle is designed to detect one of the pair of indistinguishable electrons in the Møller scattering
process, hence offering 2π azimuthal coverage as both electrons are in the same scattering plane. Two toroidal mag-
netic elements will transport particles from various scattering processes downstream into a set of concentric annuli;
azimuthal-defocussing in the spectrometer produces a scattered flux distribution at the detector plane in the full range
of the azimuth 30 m downstream of the target.
Figure 2 (left) shows a schematic perspective view of the azimuthally and radially segmented detector array de-
signed to intercept the electron annuli. Looking downstream along the beam axis, the fused silica tiles form a series of
concentric rings. Each annulus will intersect electrons in different combinations scattering processes, such as Møller
scattering, elastic electron-proton scattering, and inelastic electron-proton scattering. Coherent and incoherent photon
radiation will additionally cause the migration of electrons into other detector regions.
Figure 2 (right) shows a diagram of how each tile is coupled to a long air light guide to channel tile-produced
Cherenkov light to a PMT. Figure 2 (center) shows a cross-sectional view of the tile, light guide, and PMT arrange-
ment. The rings are ordered such that larger radii are further upstream. Particles will therefore pass through their
respective tile and subsequently all light guides belonging to smaller radius tiles. This allows for the possibility that
Cherenkov or scintillation light generated in the light guide volume will add to the signal from the tiles. While the
Cherenkov light yield, energy, and direction are readily calculable given an index of refraction, the detailed scintil-
lation yield properties of gases are less well-known. Scintillation can also be a dominant contribution as it has an
2

PMT
Light guide
Fused silica tile
Pa
r
t
i
c
l
e
F
l
u
x
0.6
m
0.7 m to central beam axis
Scattered electrons
PMTand holder
Light guide
Fused silica tile
Cherenkov
3 m
Detector assembly
Figure 2: A schematic of the MOLLER experiment detector design. The full array is shown left. The different signals are focused into separate
radial regions (center) and pass through the light guides of the following rings. A charged particle passing through the fused silica tile while
generating Cherenkov photons is illustrated in the right plot.
isotropic distribution and more difficult to geometrically suppress.
A previous forward angle kaon experimental proposal known as KOPIO faced a similar problem and carried
out a systematic analysis of scintillation yield in various gas mixtures [4]. Their results suggest that the potential
background in the MOLLER design with a PMT of a similar response would be small, of order of 0.2% in the main
Møller rings, and could be as large as 10-20% in other rings. Such a background would dilute the parity-violating
asymmetry and reduce the effective analyzing power in various rings.
For a more accurate estimate of the background, a measurement was performed of the light yield from high
energy electrons traversing various gases using a PMT with a similar wavelength response to those planned for use
in the MOLLER experiment. Aside from air, the possibility of specialized gas mixtures was also explored. In the
following a description of the measurement apparatus and experimental configurations is provided. An analysis of
the collected data, a comparison to simulation, and our conclusions as applied to the MOLLER apparatus are also
presented.
2. Scintillation Test
2.1. Detector Design
To measure the Cherenkov and scintillation yields, a detector was constructed which consists of a tube filled
with gas whose axis is collinear with an incident electron beam, as shown in Figure 3. Anolux UVS mirrors angled
45 degrees to the axis are placed on each end which serve to reflect generated light into a PMT which lies 90 degrees
to the axis. The test was carried out using two Hamamatsu H3177 PMTs. The quantum efficiency as a function of
wavelength provided by the manufacturer is shown in Figure 4. The reflectivity of the mirror, as shown in Figure 5,
was measured at an incident angle of 45 degrees for photons over a range of optical and ultraviolet wavelengths.
The upstream PMT will predominantly detect isotropically-produced scintillation light and the downstream PMT will
detect both scintillation light and Cherenkov light. In practice, reflections from the downstream PMT will propagate
3

Incident e-
Photomultiplier
Cherenkov Light Scintillation
UVSMirror
Gas Inlet Gas Outlet
23.5 inches
1.5 inches
(drawing not to scale)
Figure 3: A schematic of the detector design. An upstream PMT and UVS mirror at 45 degrees captures scintillation light and a matching pair
downstream captures both Cherenkov and scintillation light from incident electrons.
some Cherenkov signal to the upstream PMT and is accounted for by collecting data with the downstream PMT and
mirror removed and the aperture sealed with a non-reflective surface. The calculable Cherenkov signal serves as a
known reference quantity.
The inner diameter of the tube was about 2 in, which is slightly larger than the chosen PMT radius. The amount
of collected scintillation light is a combination of length of the detector and the inverse radius-squared distance from
where the light is produced. An interaction length of about 23.5 in was chosen so that the largest Cherenkov ring
(produced by the most upstream electrons) would match the size of the PMT photo-cathode.
The integrated Cherenkov production per unit energy per electron can be approximated by
d2NdEdx
≈ 370 sin2 θc eV−1cm−1 (1)
where θc is the Cherenkov angle, and cos θc = c/(nv) where n is the index of refraction, c is the speed of light, and v is
the particle velocity. For pure nitrogen at atmospheric pressure, an electron energy of at least 100 MeV, and a 3.5 eV
photon energy acceptance width, will produce about 40 photons.
The scintillation yield assuming isotropic uniform production, a beam coincident with the detector axis, and
perfect detection efficiency is approximately given by
N = λa2
16dtan−1
(L + d
d
)(2)
with a yield per unit length λ, a PMT with aperture a of distance d from the mirror, and a detector of length L. The
total optical length from PMT faces for our configuration is 26.5 in and collects more than 95% of the scintillation
light as an equivalent detector of infinite length.
The main body of the detector was constructed using black PVC plastic piping and fittings with a minimum
internal radius of 2.07 in and nominal wall thickness of 0.154 in. The interior of each tube was roughed with sand
4

Wavelength (nm)200 300 400 500 600 700
QE
(%
)
2−10
1−10
1
10
210
Figure 4: Quantum efficiency as a function of wavelength for the Hamamatsu H3177 PMTs.
Wavelength (nm)150 200 250 300 350 400 450 500 550 600
Mir
ror
refl
ectiv
ity
0
0.1
0.2
0.3
0.4
0.5
0.6
0.7
0.8
0.9
1
Figure 5: The measured reflectivity of the mirror as a function of wavelength for incident angle of 45 degrees. The error bar represents the combined
statistical and systematic uncertainties.
5

Figure 6: (Color online) The floor-plan of the first accelerator stages of the MAMI facility in Mainz, Germany with the test site (labeled X1) used
for the scintillation test studies.
paper to minimize internal reflection. A sleeve for the PMT was constructed using the same piping with the internal
radius machined to match the PMT outer radius. Silicone O-rings of thickness 3/32 in were glued into place where
the PMT face would make direct contact with the piping. Mirrors were constructed from Anolux UVS and glued into
place on an elbow fitting cut at 45 degrees.
The system has two 1/4 in inlets to allow gas flow controlled by manual quarter-turn plug valves. Black opaque
silicone tubing was used to help ensure light-tightness. The system was not designed as a pressure vessel or to have
gas tightness. Internal positive gas pressure slightly above atmospheric pressure was ensured by an oil bubbler on the
outlet line. An extruded aluminum frame was constructed to hold the detector in fixed position as well as to mount it
to a fixed plate.
2.2. Test Beam Setup
The measurements were performed at the MAMI electron accelerator facility in Mainz, Germany at the X1 test
site, which is situated after the third Racetrack Microtron (RTM3). A schematic view of the test area is shown in
Figure 6. After 90 circulations in the RTM3, the electrons reach an energy of 855 MeV. The detector was mounted on
an electronically-controlled motion table under the beam line. Two pieces of plastic scintillator connected to PMTs
were mounted downstream of the detector which formed a trigger under a coincidence of only these two signals, as
shown in Figure 7. A CAEN V965 QDC records the integrated charge from the main detector PMTs.
The detector was filled with several different gases, including air, N2, CO2, and Ar with a dedicated gas circulation
system. Prior to the test, gain calibrations for the two main detector PMTs were performed. The nominal PMT oper-
ating high voltages were then determined by requiring that the single photo-electron (P.E.) peak can be distinguished
from the pedestal peak in a QDC with 200 fC/channel resolution. For each gas test, the PMTs were operated with
different high voltages, 2600V, 2700V, and 2800V. In addition to the two-PMT configuration, so-called “block runs”
6

Detector Trigger 1 Trigger 2Electron beam
QDC
Signal
Gate AND
Figure 7: A diagram of the trigger formation for the light measurement.
were performed with the downstream mirror and PMT removed and the opening covered with black paper. These
runs allowed for a determination of the amount of reflected Cherenkov light from the downstream to upstream PMT.
The “block runs” were only performed with the detector filled with air. For each run during the beam test, at least one
million events were taken.
3. Data Analysis and Simulations
3.1. Test Beam Results
The observed signals are significantly less than one photo-electron on average for the upstream PMT and a few
photo-electrons for the downstream PMT. A fit which was developed for the absolute gain calibration of PMTs [5]
using Poisson statistics was employed to analyze the data. The QDC spectrum was fit directly to obtain the expected
mean number of P.E.’s which accounts for details of the PMT response. Figure 8 is a sample fit to a QDC spectrum
collected by the upstream PMT and shows contributions from up to two photo-electrons with a mean value of less
than 0.1 P.E. The exponential tail is attributed to the PMT response due to thermo-emission and noise initiated by the
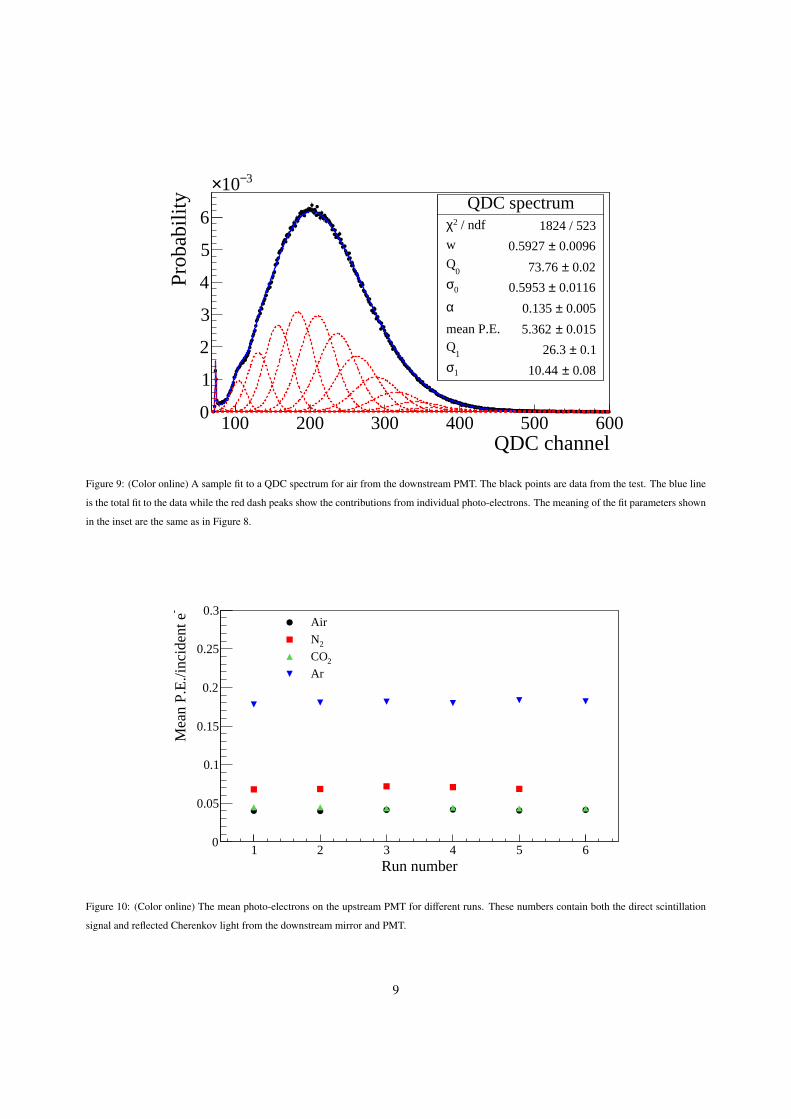
measured light [5]. Figure 9 shows an example fit to the Cherenkov signal on the downstream PMT.
Several runs of about 1 million events each for each of the four different gases were taken. The fitted mean numbers
of P.E.’s for the upstream and downstream PMT are shown in Figures 10 and 11 respectively and are summarized in
Table 1. The standard deviation of the extracted mean number of P.E.’s between runs was typically found to be
better than 0.002 P.E. for the scintillation signal (∼ 2%), a remarkable achievement demonstrating the stability and
robustness of the measurement technique. For the larger Cherenkov signal, the standard deviation was 0.4 P.E. or
better (∼ 5%).
The detected signal in the upstream PMT contains contributions from both the scintillation and Cherenkov light
reflected by the downstream mirror and PMT. This is particularly evident as the CO2 scintillation signal is expected
7

QDC spectrum / ndf 2χ 3199 / 188
w 0.00028± 0.02535
0Q 0.00± 57.47
0σ 0.0005± 0.6683 α 0.00039± 0.03009
mean P.E. 0.00031± 0.04137
1Q 0.1± 61.7
1σ 0.10± 16.17
QDC channel60 80 100 120 140 160 180 200 220 240
Prob
abili
ty
5−10
4−10
3−10
2−10
1−10
1 QDC spectrum / ndf 2χ 3199 / 188
w 0.00028± 0.02535
0Q 0.00± 57.47
0σ 0.0005± 0.6683 α 0.00039± 0.03009
mean P.E. 0.00031± 0.04137
1Q 0.1± 61.7
1σ 0.10± 16.17
Figure 8: (Color online) A sample fit to a QDC spectrum for air from the upstream PMT. The black points are data from the test. The blue line
is the total fit to the data while the red dash peaks show the contributions from individual photo-electrons in the fit. Q0 is the central position for
the pedestal, σ0 is the width of the pedestal peak, Q1 is the difference between the central position of the single photo-electron peak and pedestal,
and σ1 is the width of the single photo-electron peak. w is the probability that a measured signal is accompanied by discrete background processes
from the PMT, such as thermo-emission or noise initiated by the measured light. α is the coefficient of the exponential decrease of the discrete
background processes [5].
Gas type Averaged mean P.E. Standard deviation Averaged mean P.E. Standard deviation
Upstream PMT Upstream PMT Downstream PMT Downstream PMT
Air 0.0409 0.0007 (1.7%) 5.4 0.3 (4.7%)
N2 0.070 0.002 (2.2%) 5.8 0.1 (1.5%)
CO2 0.0440 0.0007 (1.5%) 7.4 0.4 (5.9%)
Ar 0.181 0.002 (1%) 5.7 0.2 (3.8%)
Table 1: The tabulated numbers of the averaged number of mean P.E.’s for different gases. The numbers are directly obtained from the signals
collected from the upstream or downstream PMT as noted. The standard deviation of means for the collection of similar runs is also shown. The
number in the parenthesis is the ratio of the standard deviation to the mean value in percent.
8
QDC spectrum / ndf 2χ 1824 / 523
w 0.0096± 0.5927
0Q 0.02± 73.76
0σ 0.0116± 0.5953
α 0.005± 0.135
mean P.E. 0.015± 5.362
1Q 0.1± 26.3
1σ 0.08± 10.44
QDC channel100 200 300 400 500 600
Prob
abili
ty
0
1
2
3
4
5
6
3−10×QDC spectrum
/ ndf 2χ 1824 / 523
w 0.0096± 0.5927
0Q 0.02± 73.76
0σ 0.0116± 0.5953
α 0.005± 0.135
mean P.E. 0.015± 5.362
1Q 0.1± 26.3
1σ 0.08± 10.44
Figure 9: (Color online) A sample fit to a QDC spectrum for air from the downstream PMT. The black points are data from the test. The blue line
is the total fit to the data while the red dash peaks show the contributions from individual photo-electrons. The meaning of the fit parameters shown
in the inset are the same as in Figure 8.
Run number1 2 3 4 5 6
-M
ean
P.E
./inc
iden
t e
0
0.05
0.1
0.15
0.2
0.25
0.3Air
2N
2CO
Ar
Figure 10: (Color online) The mean photo-electrons on the upstream PMT for different runs. These numbers contain both the direct scintillation
signal and reflected Cherenkov light from the downstream mirror and PMT.
9

Run number1 2 3 4 5 6
-M
ean
P.E
./inc
iden
t e
0
2
4
6
8
10
12
14 Air
2N
2CO
Ar
Figure 11: (Color online) The mean photo-electrons on the downstream PMT for different runs. These numbers are predominantly measurements
of the Cherenkov signal.
to be negligible. A measure of the reflected light efficiency was obtained by the “block run” described above. For air,
the mean number of upstream P.E.’s obtained with two PMTs present is 0.041, while the mean number of upstream
P.E.’s is 0.0086 ± 0.0001 (statistical uncertainty) with the black paper in place, demonstrating that the dominant
contribution in the upstream PMT for all gases but Argon is from reflected Cherenkov light. Thus, a subtraction is
crucial to obtain a meaningful measure of the scintillation response. This is also confirmed in the Geant4 simulation,
as will be discussed in Section 3.2.
3.2. Comparison to Simulations
The experimental and detector configuration was implemented in a Geant4 [6] simulation and the output was
compared to the data. This serves to validate our understanding of the involved processes as well as geometric
dependencies and provides a benchmarked simulation that can be used to study the case of the MOLLER detector
geometry.
The simulation covers a photon wavelength region from 180 to 600 nm. The quantum efficiency of the PMTs
and the mirror reflectivity with 45◦ incidence, both as functions of photon energy, are included. For Cherenkov light
emission, the refractive index used in the simulation is shown in Figure 12. For gas scintillation, the light yield is
implemented for different gas types for which the numbers are tabulated in Table 2. The numbers for air, N2 and CO2
are available explicitly in the reference [4], while the number for Ar gas is an estimation based on the information in
references [4] and [7]. Geant4 allows one to turn on scintillation and Cherenkov processes separately or together. With
both processes on, one can directly compare the simulation results with the beam test results. After the comparison,
one can study individual processes.
10

Photon Energy (eV)2 3 4 5 6 7
Ref
ract
ive
Inde
x
1.00025
1.0003
1.00035
1.0004
1.00045
1.0005
1.00055
1.0006
1.000652CO
Ar
2N
Air
Figure 12: The refractive index used in the simulation for different types of gas as a function of photon energy [8].
Gas type: Air N2 CO2 Ar
Yield(photons/MeV): 25 140 5 510
Table 2: The assumed scintillation light yield for each type of gas [4, 7].
11

Gas type Simulated mean P.E. Data mean P.E. Simulated mean P.E. Data mean P.E.
Upstream PMT Upstream PMT Downstream PMT Downstream PMT
Air 0.039 0.041 6.0 5.4
N2 0.069 0.07 6.3 5.8
CO2 0.021 0.044 9.6 7.4
Ar 0.17 0.18 6.0 5.7
Table 3: The mean number of P.E.’s for different gases in each PMT from the simulation. The results from the measurement as presented in Table
1, are also shown for comparison.
Gas type Beam test results Simulation results
Air 0.0086 0.005
N2 0.035 0.033
CO2 ∼0 (<0.001) 0.001
Ar 0.15 0.14
Table 4: A comparison of pure scintillation signal between measured data and simulations.
The signals from both of the two PMTs were simulated and the mean values for the number of P.E.’s obtained for
different types of gas are summarized in Table 3. The overall agreement is satisfactory for the purposes of controlling
the relative uncertainty of the light guide background over signal at the level of 10%.
In addition, the pure scintillation light yield was also studied using the “block runs” to constrain the reflected
Cherenkov light. The reflection efficiency factor obtained is applied to all configurations, assuming that this factor is
independent of medium. In order to simulate the pure scintillation yield in the upstream PMT, the Cherenkov process
was turned off. Table 4 shows the comparison of pure scintillation signal between the measurement and simulations.
The data obtained during the beam test with air agree with the simulation at the level of 0.003 photo-electron; we
estimate the sensitivity of this method, given the statistical precision and systematic control to be about 0.002 photo-
electron.
It is worth noting that the background subtraction yields a value close to zero for CO2, as should be the case. In
addition to pure gas, gas mixtures such as Ar(95%)+CO2(5%) or Ar(90%)+CO2(10%) were also tested. We observed
that the signal in the two Argon,CO2 mixtures could be completely explained as reflected Cherenkov light, i.e., the
scintillation response of argon with 5 to 10% CO2 was consistent with zero within the measurement precision and
systematic control. The N2 scintillation signal is clearly larger than air by a factor of 3 to 6, showing the importance
of quenching of the N2 signal by other gases in the air.
12

4. Estimation of MOLLER Detector Scintillation Background
After benchmarking the Geant4 simulation of the scintillation test tube, the geometry of a real detector which
is proposed for use in the MOLLER experiment was constructed in the simulation using the same parameters. The
detector is constructed out of a fused silica Cherenkov radiator, a mirror funnel and a long light guide with a PMT in
the end. As illustrated in Figure 2 (right), the dominant signal in the PMT will be generated by high energy electrons
passing through the fused silica tile and the Cherenkov light will be released in a cone of half-angle of about 45◦.
Through repeated total internal reflections, a significant fraction of the light will reach the 45◦ cut at one end of the
radiator, where the light will enter the light guide. Per the design of the detector, the light will be reflected to the PMT
by the mirror attached to the radiator via only one bounce.
To evaluate the main signal, the light yield from individual electrons passing through the tile was simulated. For
the background, the electron beam is shot directly on the long light guide filled with air. As illustrated in Figure 13, a
scan over incident angles was performed with both Cherenkov and scintillation processes turned on. Figure 14 shows
the mean number of P.E.’s as a function of beam angle relative to the surface of the radiator tile. An angle of zero
corresponds to the beam normal to the surface of the tile. Positive angle corresponds to the beam pointing towards
the PMT. The study was performed for different reflectivities of the light guide. As shown in Figure 14, the signal is
strongly suppressed with low reflectivity. The rising effect near −10 degrees with a reflectivity of 0.9 is due to the fact
that the air-produced Cherenkov light is reflected towards the PMT with only a few bounces, as shown in Figure 13
(b) compared to Figure 13 (a), by the mirror attached to the radiator tile. At other incident angles, the light yield will
drop due to the attenuation of many bounces inside the light guide before photons reach the PMT surface. The light
yield also increases in the region where the beam angle is larger than +10◦, since the beam is pointing more towards
the PMT.
A scan over incident angles was also performed with only scintillation. Figure 15 shows the mean number of P.E.’s
as a function of beam angle. Zero angle in this case means that the electron is normal to the surface of the light guide.
This corresponds to the minimum scintillation light yield due to the length of the radiator traversed. The scintillation
yield is much smaller than the multi-bounce Cherenkov light.
In the MOLLER design shown in Figure 2, the detectors with tiles at a smaller radius will receive a larger flux in
their longer light guides. Based on our benchmark simulations, we have carried out a cursory study of the light guide
background for each of the rings. We note that the Cherenkov background can be strongly suppressed by blackening
a small portion of the inside of the downstream face of each light guide near the peak of the Møller flux, shown in the
center frame of Figure 2. For the scintillation background, the contribution is between 0.01 and 0.05 P.E.’s depending
on light guide reflectivity. As noted in the benchmark simulation discussion earlier, the simulation and data differ
from each other by about 0.003 P.E. or about 40%. As a conservative upper limit, we assume a reflectivity of 0.9 for
the Cherenkov light in our estimates; we expect the real design to virtually eliminate the Cherenkov component.
The detector assembly shown in Figure 2 has been designed such that the scattered flux is approximately normal
13

(b)(a)
ElectronElectron
Mirror
Fused silica tile Cherenkov radiator
Long light guide
(1)
Figure 13: An illustration of the detector module proposed in the MOLLER experiment and a depiction of the background Cherenkov light
generated by charged particles going through a neighboring light guide. Line (1) in figure (b) is normal to the fused silica tile while line (2) is
normal to the surface of the long light guide. The angle between (1) and (2) is 11.5 degrees.
Beam Angle (degrees)15− 10− 5− 0 5 10 15
-M
ean
P.E
./inc
iden
t e
0
0.1
0.2
0.3
0.4
0.5
0.6Reflectivity = 0.1Reflectivity = 0.5Reflectivity = 0.9
Figure 14: (Color online) The Cherenkov and Scintillation light yield for beam angle scan with an air-filled light guide . The incident electrons are
shot along the long light guide. The angle is relative to the surface of radiator tile with an angle of zero being parallel to line (1) and positive angle
in the direction of line (2), both shown in Figure 13 (b).
14

Beam Angle (degrees)40− 20− 0 20 40
-M
ean
P.E
./inc
iden
t e
00.010.020.030.040.050.060.070.080.09
0.1Reflectivity = 0.1Reflectivity = 0.5Reflectivity = 0.9
Figure 15: (Color online) Scintillation yield for beam angle scan. Air is filling the light guide. The electron beam is shot on the light guide directly.
The angle is relative to the surface of the light guide with an angle of zero parallel to line (2) in Figure 13 (b) and negative angle in the direction of
(1).
to the fused silica tile and by the simulated result shown in Figure 14, in the region of minimum background. The
anticipated signal from the fused silica tile assuming a thickness of 1.5 cm is about 45 P.E.’s per incident electron,
nearly a factor of 1000 higher. The ratio of the flux of charged particles in a tile to that in its corresponding light guide
varies dramatically and we consider here two important cases.
In the first case we consider the ring that will detect the bulk of the Møller scattering signal and where background
suppression is of paramount importance. We find that the relative light guide background rate ranges between 0.1
to 0.3% depending on the azimuthal positioning of the tile. We expect to measure these background rates directly
in dedicated calibration runs and that the asymmetry of this background is much smaller than the Møller asymmetry
such that we can control the extracted signal systematic error at the 0.1% level. It is worth noting however that
if the estimate were 3 to 6 times higher, as would be the case if one used dry N2 as the medium, the background
contamination would be uncomfortably high.
In the second case we consider the ring which will predominantly detect the scattered electrons from inelastic
electron-proton scattering, which will have light guide backgrounds dominated by the large primary Møller scattered
flux. The relative light yield from background and signal ranges from 5 to 20% due to the relatively lower rate of the
inelastic events. We would like to control the systematic error on the background corrections on this measurement at
the 10% level, which will be possible with this level of background. Again, if it were 3 to 6 times bigger, that would
likely be unacceptably large.
Based on the analysis above, we have concluded that light guides with air as the medium will be acceptable for
the MOLLER apparatus.
15

5. Summary
A new gas-filled detector was designed to measure both the Cherenkov and scintillation response for high energy
electrons traversing different gases in order to quantify an important source of background for the detectors proposed
in the MOLLER experiment. The detector was deployed in a dedicated measurement using the electron beam at
MAMI and the data were analyzed and used to validate a Geant4 simulation. With the simulation, backgrounds
due to Cherenkov and scintillation processes in air-filled light guides were estimated for the proposed design of the
MOLLER detector assembly and found to be manageable. The Cherenkov background was also found to be strongly
suppressed by judiciously blackening small sections of the light guide as well as found to have a minimum for a
particular electron incident angle.
Acknowledgements
We would like to thank Tom Hemmick and Craig Woody for useful suggestions and important contributions to the
test apparatus, and the technical staff of the MAMI facility in Mainz, Germany. This work was supported by the U.S.
Department of Energy and NSF in the United States, NSERC in Canada and DFG in Germany.
References
[1] J. Benesch, et al., The MOLLER Experiment: An Ultra-Precise Measurement of the Weak Mixing Angle Using Møller ScatteringarXiv:
1411.4088.
[2] MOLLER experiment homepage, http://hallaweb.jlab.org/12GeV/Moller/.
[3] MOLLER: Jefferson lab experiment E12-09-005, http://hallaweb.jlab.org/12GeV/Moller/pubs/moller_proposal.pdf.
[4] H. Morii, K. Mizouchi, T. Nomura, N. Sasao, T. Sumida, M. Kobayashi, Y. Murayama, R. Takashima, Quenching effects in nitrogen gas scin-
tillation, Nuclear Instruments and Methods in Physics Research Section A: Accelerators, Spectrometers, Detectors and Associated Equipment
526 (3) (2004) 399 – 408.
[5] E. H. Bellamy, G. Bellettini, F. Gervelli, M. Incagli, D. Lucchesi, C. Pagliarone, F. Zetti, Yu. Budagov, I. Chirikov-Zorin, S. Tokar, Absolute
calibration and monitoring of a spectrometric channel using a photomultiplier, Nucl. Instrum. Meth. A339 (1994) 468–476.
[6] Geant4-a simulation toolkit, Nuclear Instruments and Methods in Physics Research Section A: Accelerators, Spectrometers, Detectors and
Associated Equipment 506 (3) (2003) 250 – 303.
[7] R. Gernhuser, B. Bauer, J. Friese, J. Homolka, A. Kastenmller, P. Kienle, H.-J. Krner, P. Maier-Komor, M. Mnch, R. Schneider, K. Zeitelhack,
Photon detector performance and radiator scintillation in the hades rich, Nuclear Instruments and Methods in Physics Research Section A:
Accelerators, Spectrometers, Detectors and Associated Equipment 371 (1) (1996) 300 – 304.
[8] M. N. Polyanskiy, Refractive index database, https://refractiveindex.info.
16