study of effectiveness of using concept maps in science ... · pdf filedemands continued re...
TRANSCRIPT

International Journal of Scientific and Research Publications, Volume 3, Issue 4, April 2013 1 ISSN 2250-3153
www.ijsrp.org
Study of Effectiveness of Using Concept Maps in Science
among VI Grade Students
Dr. (Mrs.) Laxmi Sharma*, Geeta Harsana
**, Komal Sharma
**
* Principal, Advanced Institute Of Education, Palwal (India)
** Assistant Professor, Advanced Institute Of Education, Palwal (India)
Abstract- Students of Faridabad district .The main findings of the
study are:
(i) A significant difference has been found between the
means scores of post test for the achievement test administered
on the control group and experimental group both at 0.05 and
0.01 levels. The difference between the mean scores of the
student s of the two groups are quite significant showing the
effectiveness of the learning through Concepts Maps over
Lecture method and proving that concepts Maps play positive
role in enhancement of learning basic concepts of science.
(ii) It has been found that the correlation between Maps
score and the scores on the maps related to multiple choice items
on the unit test varied from 0.04 to 1, which inference that
correlations are generally high. The present study was conducted
to study the effectiveness of using concept maps in science
among VI grade 100
Index Terms- Concept Map, Science, Effectiveness,
Achievement
I. INTRODUCTION
ssessment of student achievement is changing largely
because today's students' face a world that will demand new
knowledge and abilities. In the present scientific and
technological age, the conventional methods are not sufficient to
arouse interest among the students and do not meet up to the
intellectual, psychological and emotional needs of the students in
new millennium. The method of teaching needs to be changed.
The trend in education at present does not demand the text book
learning alone. It aims at giving complete preparation to the
pupils‟ .Since; science is a rapidly growing subject, its teaching
demands continued re assessment and periodical review of the
contents and the methods of teaching. Most new learning occurs
through derivatives and correlative assumption of new concept
meanings under existing concept or propositional frame work.
Learning that is meaningful involves reorganization of existing
beliefs or integration of new information with existing
information. Cognitive structure is organized hierarchically, with
new concept or concept meanings being subsumed under broader
more inclusive concepts.
The theoretical frame work that supports the use of concept
mapping is consistent with constructivist epistemology and
cognitive psychology. Constructivism is a major influence in
current science education.
Concept
Teaching concept in general science is not an easy task. It
deals with the scientific objectives. The learning about the
scientific objectives can be possible only by learning a concept.
The general mental notion of things or events is arrived at by the
students by processing of perception, classification and
discrimination; it's used as a basis of thought and is expressed
through symbolic language. The concept can be thought of as
lower or higher order or as from the easily managed to the highly
abstract. Concept formation is a process of developing concept,
which was given by Piaget, Bruner etc. According to Gagne a
concept is learned stimuli that belong to the same category or
classification, but which can be done without applying such rule
as "a chair must have four legs and a seat and a back."
Recognition of the chair would be immediate upon presentation
of an example just as rejection of a stool would be immediate and
not subject to any logical application of rule.
A concept is defined as a class of stimuli or a coding
system. According to Hung, Margin & Stone 1976, "A concept
is a decision rule which, when applied to the description of an
object specifies, whether or not a name can be applied."The
concept centered teaching, a teacher – student interactive
approach, following the constructivist approach, which helps in
meaningful learning. It is a process of sequential instruction that
applies theoretically, thousands of strategies for pupils
understanding.
Constructivists make several assumptions about the learner,
the context for learning, the learning process, and the outcomes.
They believe that learning is a process of meaning making in
which learners constantly explore their worlds, reflect upon their
experience, articulate their thoughts and negotiate meaning with
others. This process may start with a problem, a discrepant event
or cognitive dissonance. On attempting to reconcile their
conflicts, learners are able to create a shared ownership and
meaning of the task, the concepts, the procedures and the
strategies employed. Teaching is not regarded as a process of
knowledge transmission. Rather, teachers should serve as a coach
to facilitate learning and provide scaffolding and fading at
appropriate junctures of the learning process.
Concept mapping fits well with the constructivist approach
that learners "construct their own idiosyncratic understanding of
concepts". The teacher can use a map as a basis for which to
challenge student assumptions of how concepts are related
maintain that most college faculty recognize that students will
not remember specific facts from a course. What's more
important is that students take away major themes or concepts
and an understanding of how these concepts are related. Using a
concept map to design a course can aid the teacher in guiding the
A

International Journal of Scientific and Research Publications, Volume 3, Issue 4, April 2013 2
ISSN 2250-3153
www.ijsrp.org
students to learn relevant concepts rather than trivial facts. Also,
in knowing that students may perceive instruction differently
from the way an educator intended, it can be helpful for the
teacher to "construct a hypothetical model of the particular
conceptual world of the students they are facing".
Concept mapping is a method to visualize the structure of
knowledge. Science the knowledge expressed in the maps is
mostly semantic. Concept maps are sometimes called semantic
networks. Often it is claimed that concept mapping bears a
similarity to the structure of long term memory. Instead of
describing all concepts and their relation in text, one may choose
to draw a map indicating concepts and relations in a graph or
network. It the concept can be represented as eight era circle or a
box .The relationship among concept and displayed using
connecting link. Clarifying words and symbols are typically
associated with linking lines to explain the specific relationships
among the concepts.
II. NEED AND IMPOTRANCE OF THE STUDY
Knowledge of facts, terms and concepts is an important
part of student‟s science knowledge in its own right and is also
the basis for the development procedural knowledge while
declarative knowledge may tend to be less valued.
The establishment of concept maps is a vehicle for
assessing both declarative and procedural aspects of science
knowledge. Concept maps monitor learning outcomes as
instructional strategy emphasizes shift from basic to higher levels
of performance. Concept mapping bears a similarity to the
structure of long term memory Researches supports the idea that
the use of concept mapping tool extend students learning in
science and technology in important and unique ways. Concept
maps may be most effective when use in science to stimulate and
solve real problems, especially when scientific probes and
technological tools are used to assist with lad experiments. Thus,
in the present study investigator wants to study the comparative
effectiveness of concept maps over traditional method
III. STATEMENT OF THE PROBLEM
“A Study of effectiveness of using concept maps in science
among VI grade students”
OBJECTIVES OF THE STUDY
To develop concept maps in science.
To study the effect of using concept maps on
achievement of VI grade student in science class.
To study of effectiveness of using concept maps
over traditional method in learning concepts of
science among VI grade students.
To study the correlation between concept maps and
pupil's achievements.
HYPOTHESIS FORMULATED
There is no difference between the two methods used
traditional method and learning with concept maps.
There is no difference between mean achievement
scores in science of pre-test and post-test of VI class
students.
There is no difference between mean achievement
scores in science of control group and experimental
group.
There is no relation in use of concept maps and
pupil's achievement.
IV. VARIABLES
Independent Variable:
The independent variable that was used in the present study
is Concept Maps. The variable was manipulated to study the
effect on achievement in science. The experimental group was
taught through Concept Maps.
Dependent Variable:
The dependent variable or the criterion variable that was
use in the study is achievement in science. This variable may also
be termed as moderator variable as they include the variable that
could have a moderating affect on the treatment. The students
were scored on this variable before and after the treatment in the
group, this variable was measured twice during the study i.e. first
before the beginning of the treatment (pre-test stage), then after
completing the treatment. (Post-test stage)
Control variable:
Those factors which are controlled by the experimenter to
cancel out or neutralize any effect they might, otherwise have on
the observed phenomenon. In the present study nature of the
school, grade level and administration are controlled.
V. DESIGN OF THE STUDY
The present study is of pre-test - post-test Equivalent Group
of Experimental Group Design
RO1 XO2 O1 O3 = Pre-test
RO3 CO4 O2 O4 = Post-test
Here, the pre-tests are to be administered before the
application of treatment on the Experimental and Control Group
and Post –tests at the end of the treatment on both the groups.
Nature of the School
The sample was selected from Jagriti Vidhya Niketan
School Faridabad, affiliated to C.B.S.E.
Grade level Sixth class is selected for the present study and grade level
is thus kept constant during the study.
Subject
The group was taught the one chapter of Science subject.

International Journal of Scientific and Research Publications, Volume 3, Issue 4, April 2013 3
ISSN 2250-3153
www.ijsrp.org
VI. SAMPLE
The present study was conducted on sample of 100 students
(50 boys and 50 girls) studying in class VI of Jagriti Vidhya
Niketan School.
VII. TOOL USED
(i)Concept maps (developed by the investigator)
(ii)Multiple choice test in science subject
VIII. STATISTICAL TECHNIQUES EMPLOYED
The statistical techniques employed for interpreting the data are:
1. Mean
2. Standard Deviation
3 critical ratio„t‟
4. Correlation (Karl Pearson)
IX. REVIEW OF THE RELATED LITERATURE
Kumar, Satheeshi (2010) Studied learning with
multimedia a constructive co-operative approach in
education. He found that they provide the students with ways to
assemble knowledge constructively when students develop
multimedia materials as a component of project based learning in
cooperative groups.
Km, Ananta (2010) Studied the concept maps in
teaching biology. He found that presenting the theoretical
foundation and origin of concept maps graphical representation
on the information and understanding.
Rai, Renu and Shweta (Aug2010) studied the concept
mapping as a technology to facilitate teacher education
programme and enhance learning. He found that new
technology is capable of overcoming the barriers due to its
importance and use in the field of education.
Antoine Laurent Laviosier (2009) Studied on concept
mapping in elementary science. He found that it is essential
that teachers use technology in a classroom to provide the richest
education possible for our students.
David, Brown (2009) Studied the effect of individual
and group concept mapping on students conceptual
understanding of photosynthesis and cellular respiration in
three different academic levels of biology class. He found that
the constructing concept maps in small groups can significantly
increase the knowledge gained by lower level students.
Hong Gao, E. Shen (2007) Studied on Collaborative
Concept Mapping: What have we learned about the Technical
and what is next. He observed that the concept mapping
technique in combination with other instructional strategies will
hopefully augment the positive result associated with the
technique.
John, Marangos (2007) Studied effectiveness of concept
mapping in economics: evidence from Australia & USA. He
found that concept mapping was in corporate in the teaching
material in both courses at different countries and, at the end of
the semester; the students complicated a survey regarding the
use, effectiveness and accessibility of concept maps.
Hong Gao, E Shen (2007) Studied collaborative concept
mapping: An instructional strategy to foster both individual
learning and group knowledge construction. He found that the
collaborative concept mapping is a potential effective
instructional strategy to facilitate learners in both group
knowledge construction and individual learning.
Raghawan, Andal (1991) Studied concept mapping in
learning physical science and its relation to scholastic
performance, cognitive ability, attitude towards concept
mapping and science interest among standard IX students.
He found that the experimental and control groups of boys, girls
and co-educational students were found to have no difference in
post test scholastic performance scores in physical science.
Joshi, Anuradha (1993) conducted studies on concept
Attainment Model on general ability. He found that the
adjustment mean of the general mental ability scores of student
taught through CAM was significantly different from those who
were taught through traditional method when per general mental
scores were taken as a covariate.
Table1.1INDEPENDENT DEPENDENT &CONTROL VARIABLES
Independent
Variable
Dependent
Variable
Control Variable Control Employed
Concept Maps
(Instructional
package by
investigator &
Inspiration
Programme
Achievement
In Science
Nature of the school
Grade level (only VI
grade to be taught).
Administrative (one
chapter of science
subject in the group
to be taught).
Administrative (all
schools working
under C.B.S.E.)
Administrative.
Administrative (one
chapter of science
subject in the group
to be taught).

International Journal of Scientific and Research Publications, Volume 3, Issue 4, April 2013 4
ISSN 2250-3153
www.ijsrp.org
X. DEVELOPMENT OF CONCEPT MAPS
There are 6 steps of creating Concept Map:-
1. Select key concepts: This is a recognition process
that activates relevant knowledge and assists in topic
identification.
2. Write the key concepts
3. Make an attribute list of the key concepts.
4. Relate key concepts in a special relationship.
5. Rearrange special representations.
6. Compare representation to the text.
XI. ANALYSIS AND INTERPRETATION OF THE DATA
Table 1.2 CALCULATION OF„t‟ VALUE FOR THE
CONTROL GROUP, PRE-TEST, POST- TEST
Mean, S.D, Std Error Mean and„t‟ value of achievement in
science of pre-test and post-test:
GROUP
(Control)
M S.D. N „t‟
value
df Remark
Pre-test 8.72 4.03 50
2.44 98
Significant at
0.05 level
Post-test 10.74 4.22 50 Significant at
0.01 level
From the Table 4.1, it is evident that the„t‟-value is 2.44
that is significant at 0.01 level that is 2.63 and at 0.05 level that is
1.98 with df = 98. It indicates that the mean scores of pre-test and
post-test of control group differ significantly. Thus, NULL
hypothesis that there is no significant difference between means
scores of pre-test and post-test of control group is rejected.
Further the mean scores of post-test of control group is as 10.74,
which is significantly higher than the mean scores of pre-test as
8.72
Table 1.3 CALCULATION OF„t‟ VALUE FOR THE EXPERIMENTAL GROUP, PRE-TEST, POST-TEST
GROUP
(EXPERIMENTAL)
M S.D. N „t‟
value
df Remark
Pre-test 9.20 4.28 50
6.52
98 Significant
at 0.05 level
Post-test 14.74 4.02 50 Significant
at 0.01 level

International Journal of Scientific and Research Publications, Volume 3, Issue 4, April 2013 5
ISSN 2250-3153
www.ijsrp.org
From the table 4.2, it is evident that the„t‟-value is 6.52 that is significant at
0.01 level that is 2.63 and at .05 level that is 1.98 with df = 98. It indicates that the
mean scores of pre-test and post-test of experimental group differ significantly.
Thus, null hypothesis that there is no significant difference between means scores
of pre-test and post-test of experimental group is rejected. Further the mean scores
of post-test as 14.74, is significantly higher than the mean score of pre-test as 9.20.
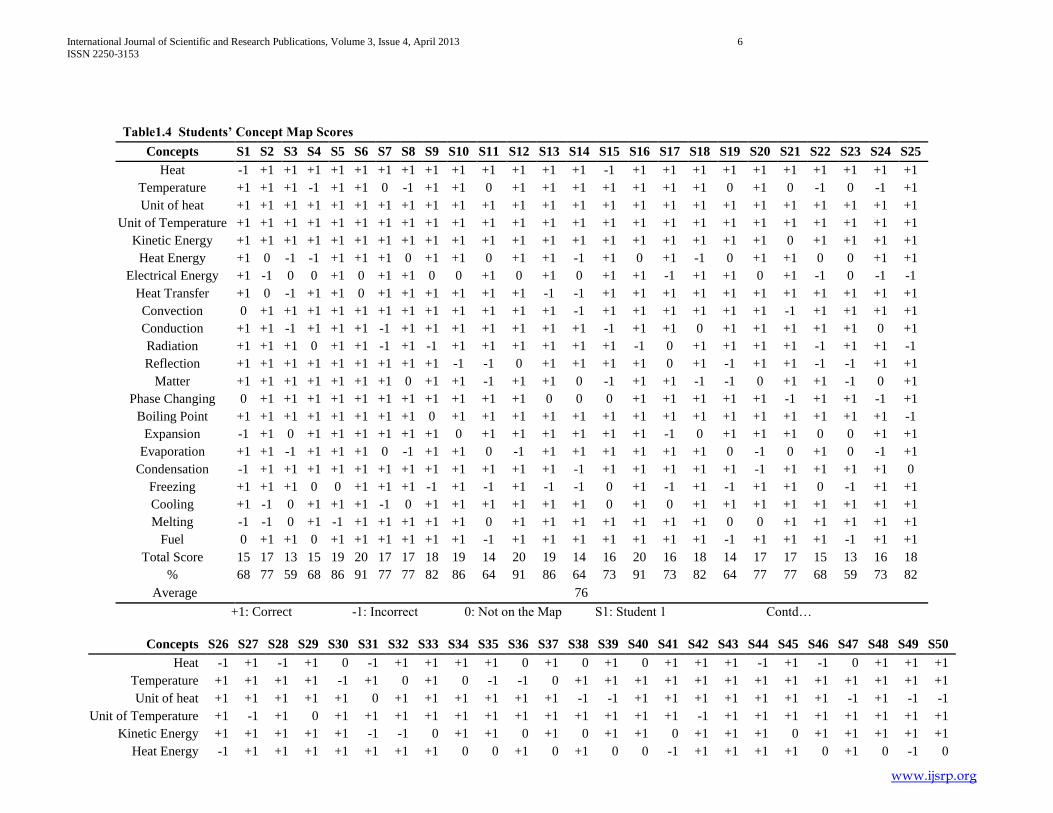
Students‟ Concept Map Scores 12 concept maps were examined and student scores were recorded by using
score. If one or more of the concepts were missing from the map, a score of 0 was
given. To obtain a score other than 0 in this category, students had to have all
essential stem and answer concepts somewhere on their maps. A positive score
(+1) was given if the stem concept was linked accurately to the correct answer, and
a negative score (-1) recorded if a linking error was made. The results of scoring
for the maps of thirteen students are reported in Table 1.4
International Journal of Scientific and Research Publications, Volume 3, Issue 4, April 2013 6
ISSN 2250-3153
www.ijsrp.org
Concepts S26 S27 S28 S29 S30 S31 S32 S33 S34 S35 S36 S37 S38 S39 S40 S41 S42 S43 S44 S45 S46 S47 S48 S49 S50
Heat -1 +1 -1 +1 0 -1 +1 +1 +1 +1 0 +1 0 +1 0 +1 +1 +1 -1 +1 -1 0 +1 +1 +1
Temperature +1 +1 +1 +1 -1 +1 0 +1 0 -1 -1 0 +1 +1 +1 +1 +1 +1 +1 +1 +1 +1 +1 +1 +1
Unit of heat +1 +1 +1 +1 +1 0 +1 +1 +1 +1 +1 +1 -1 -1 +1 +1 +1 +1 +1 +1 +1 -1 +1 -1 -1
Unit of Temperature +1 -1 +1 0 +1 +1 +1 +1 +1 +1 +1 +1 +1 +1 +1 +1 -1 +1 +1 +1 +1 +1 +1 +1 +1
Kinetic Energy +1 +1 +1 +1 +1 -1 -1 0 +1 +1 0 +1 0 +1 +1 0 +1 +1 +1 0 +1 +1 +1 +1 +1
Heat Energy -1 +1 +1 +1 +1 +1 +1 +1 0 0 +1 0 +1 0 0 -1 +1 +1 +1 +1 0 +1 0 -1 0
Table1.4 Students‟ Concept Map Scores
Concepts S1 S2 S3 S4 S5 S6 S7 S8 S9 S10 S11 S12 S13 S14 S15 S16 S17 S18 S19 S20 S21 S22 S23 S24 S25
Heat -1 +1 +1 +1 +1 +1 +1 +1 +1 +1 +1 +1 +1 +1 -1 +1 +1 +1 +1 +1 +1 +1 +1 +1 +1
Temperature +1 +1 +1 -1 +1 +1 0 -1 +1 +1 0 +1 +1 +1 +1 +1 +1 +1 0 +1 0 -1 0 -1 +1
Unit of heat +1 +1 +1 +1 +1 +1 +1 +1 +1 +1 +1 +1 +1 +1 +1 +1 +1 +1 +1 +1 +1 +1 +1 +1 +1
Unit of Temperature +1 +1 +1 +1 +1 +1 +1 +1 +1 +1 +1 +1 +1 +1 +1 +1 +1 +1 +1 +1 +1 +1 +1 +1 +1
Kinetic Energy +1 +1 +1 +1 +1 +1 +1 +1 +1 +1 +1 +1 +1 +1 +1 +1 +1 +1 +1 +1 0 +1 +1 +1 +1
Heat Energy +1 0 -1 -1 +1 +1 +1 0 +1 +1 0 +1 +1 -1 +1 0 +1 -1 0 +1 +1 0 0 +1 +1
Electrical Energy +1 -1 0 0 +1 0 +1 +1 0 0 +1 0 +1 0 +1 +1 -1 +1 +1 0 +1 -1 0 -1 -1
Heat Transfer +1 0 -1 +1 +1 0 +1 +1 +1 +1 +1 +1 -1 -1 +1 +1 +1 +1 +1 +1 +1 +1 +1 +1 +1
Convection 0 +1 +1 +1 +1 +1 +1 +1 +1 +1 +1 +1 +1 -1 +1 +1 +1 +1 +1 +1 -1 +1 +1 +1 +1
Conduction +1 +1 -1 +1 +1 +1 -1 +1 +1 +1 +1 +1 +1 +1 -1 +1 +1 0 +1 +1 +1 +1 +1 0 +1
Radiation +1 +1 +1 0 +1 +1 -1 +1 -1 +1 +1 +1 +1 +1 +1 -1 0 +1 +1 +1 +1 -1 +1 +1 -1
Reflection +1 +1 +1 +1 +1 +1 +1 +1 +1 -1 -1 0 +1 +1 +1 +1 0 +1 -1 +1 +1 -1 -1 +1 +1
Matter +1 +1 +1 +1 +1 +1 +1 0 +1 +1 -1 +1 +1 0 -1 +1 +1 -1 -1 0 +1 +1 -1 0 +1
Phase Changing 0 +1 +1 +1 +1 +1 +1 +1 +1 +1 +1 +1 0 0 0 +1 +1 +1 +1 +1 -1 +1 +1 -1 +1
Boiling Point +1 +1 +1 +1 +1 +1 +1 +1 0 +1 +1 +1 +1 +1 +1 +1 +1 +1 +1 +1 +1 +1 +1 +1 -1
Expansion -1 +1 0 +1 +1 +1 +1 +1 +1 0 +1 +1 +1 +1 +1 +1 -1 0 +1 +1 +1 0 0 +1 +1
Evaporation +1 +1 -1 +1 +1 +1 0 -1 +1 +1 0 -1 +1 +1 +1 +1 +1 +1 0 -1 0 +1 0 -1 +1
Condensation -1 +1 +1 +1 +1 +1 +1 +1 +1 +1 +1 +1 +1 -1 +1 +1 +1 +1 +1 -1 +1 +1 +1 +1 0
Freezing +1 +1 +1 0 0 +1 +1 +1 -1 +1 -1 +1 -1 -1 0 +1 -1 +1 -1 +1 +1 0 -1 +1 +1
Cooling +1 -1 0 +1 +1 +1 -1 0 +1 +1 +1 +1 +1 +1 0 +1 0 +1 +1 +1 +1 +1 +1 +1 +1
Melting -1 -1 0 +1 -1 +1 +1 +1 +1 +1 0 +1 +1 +1 +1 +1 +1 +1 0 0 +1 +1 +1 +1 +1
Fuel 0 +1 +1 0 +1 +1 +1 +1 +1 +1 -1 +1 +1 +1 +1 +1 +1 +1 -1 +1 +1 +1 -1 +1 +1
Total Score 15 17 13 15 19 20 17 17 18 19 14 20 19 14 16 20 16 18 14 17 17 15 13 16 18
% 68 77 59 68 86 91 77 77 82 86 64 91 86 64 73 91 73 82 64 77 77 68 59 73 82
Average 76
+1: Correct -1: Incorrect 0: Not on the Map S1: Student 1 Contd…

International Journal of Scientific and Research Publications, Volume 3, Issue 4, April 2013 7
ISSN 2250-3153
www.ijsrp.org
Electrical Energy +1 +1 +1 -1 0 -1 +1 +1 0 -1 +1 0 -1 +1 +1 +1 +1 +1 +1 -1 +1 +1 +1 +1 +1
Heat Transfer +1 0 +1 +1 +1 +1 0 -1 +1 +1 0 +1 +1 +1 +1 +1 +1 -1 +1 +1 +1 0 0 +1 +1
Convection +1 +1 +1 +1 +1 +1 +1 +1 +1 +1 +1 +1 +1 -1 +1 +1 +1 +1 +1 +1 +1 0 -1 +1 -1
Conduction 0 +1 -1 +1 +1 0 +1 +1 +1 +1 +1 -1 -1 +1 -1 +1 -1 +1 -1 +1 +1 -1 +1 -1 +1
Radiation +1 +1 +1 +1 +1 +1 +1 0 +1 -1 +1 -1 +1 -1 0 +1 +1 +1 +1 -1 +1 -1 +1 +1 +1
Reflection +1 -1 +1 +1 -1 0 +1 +1 -1 -1 +1 -1 +1 +1 +1 +1 +1 +1 +1 +1 -1 +1 +1 +1 -1
Matter +1 0 -1 +1 +1 -1 0 +1 -1 +1 +1 +1 -1 +1 +1 +1 +1 +1 -1 +1 +1 +1 +1 -1 +1
Phase Changing +1 +1 0 -1 +1 +1 +1 +1 +1 +1 -1 -1 +1 0 -1 +1 +1 +1 0 +1 +1 +1 +1 0 +1
Boiling Point +1 +1 +1 +1 -1 +1 +1 -1 +1 +1 -1 +1 +1 +1 +1 +1 +1 +1 +1 -1 +1 +1 +1 +1 +1
Expansion 0 +1 +1 +1 +1 0 +1 +1 0 0 +1 0 +1 +1 +1 -1 +1 +1 +1 +1 +1 +1 +1 +1 +1
Evaporation +1 +1 +1 +1 +1 +1 -1 +1 0 +1 +1 0 +1 -1 -1 +1 -1 +1 +1 +1 +1 0 +1 0 +1
Condensation +1 +1 +1 +1 0 +1 +1 +1 +1 +1 +1 0 +1 +1 +1 +1 +1 +1 +1 +1 +1 +1 0 +1 +1
Freezing -1 +1 0 +1 +1 +1 -1 0 -1 0 +1 +1 +1 +1 +1 +1 +1 +1 0 +1 +1 +1 +1 0 +1
Cooling +1 +1 0 +1 +1 +1 0 +1 +1 +1 0 +1 +1 +1 +1 +1 +1 +1 0 0 -1 +1 +1 +1 +1
Melting -1 +1 +1 +1 +1 +1 +1 +1 +1 +1 +1 +1 +1 +1 0 -1 +1 +1 +1 +1 +1 -1 -1 +1 +1
Fuel +1 +1 +1 +1 +1 +1 0 0 -1 +1 0 -1 +1 +1 0 +1 0 +1 +1 +1 +1 0 +1 +1 +1
Total Score 16 18 16 19 16 14 16 16 13 15 13 11 16 16 15 18 18 21 16 17 18 13 17 14 18
% 73 82 73 86 73 64 73 73 59 68 59 50 73 73 68 82 82 95 73 77 82 59 77 64 82
Average 73
+1 : Correct -1 : Incorrect 0 : Not on the Map S26 : Student 26
Table 1.5 Comparison of answers of related multiple-choice items with concept map answer
1 4 5 6 7 8 9 10 11 12
MC CM MC CM MC CM MC CM MC CM MC CM MC CM MC CM MC CM MC CM
S1 1 +1 1 -1 1 +1 1 +1 1 -1 1 +1 0 -1 1 +1 0 -1 1 +1
S2 1 +1 1 +1 1 +1 1 +1 1 +1 0 0 0 +1 1 +1 1 +1 1 +1
S3 1 +1 0 +1 1 +1 1 +1 1 +1 1 +1 1 +1 0 0 1 +1 1 +1
S4 0 0 1 -1 1 0 1 0 0 -1 0 -1 1 +1 1 +1 1 +1 0 -1
S5 1 +1 1 0 1 +1 1 +1 1 0 1 0 1 0 1 +1 0 0 1 0
S6 0 +1 1 +1 0 +1 1 +1 1 +1 1 +1 1 +1 1 0 0 +1 1 +1
S7 1 0 1 +1 1 +1 1 +1 1 +1 0 +1 0 +1 1 +1 1 +1 1 +1
S8 1 +1 0 -1 1 0 1 0 0 -1 1 0 0 -1 0 0 1 -1 0 -1
S9 1 +1 1 +1 1 +1 1 +1 1 +1 1 +1 1 +1 1 +1 1 +1 1 +1
S10 1 -1 1 0 1 +1 1 +1 1 0 0 +1 1 0 1 +1 1 0 1 0
S11 1 +1 1 +1 1 +1 1 +1 1 +1 0 0 1 +1 1 +1 1 +1 1 +1
S12 0 +1 0 -1 1 0 1 0 1 -1 1 +1 1 -1 1 +1 1 -1 1 +1
S13 0 0 1 +1 0 +1 1 +1 1 +1 1 +1 0 +1 1 -1 1 +1 1 +1

International Journal of Scientific and Research Publications, Volume 3, Issue 4, April 2013 8
ISSN 2250-3153
www.ijsrp.org
S14 1 +1 0 +1 1 +1 1 +1 0 +1 1 +1 1 +1 1 +1 1 +1 1 +1
S15 1 -1 1 +1 1 -1 0 -1 1 +1 0 0 1 +1 1 +1 0 +1 1 +1
S16 1 +1 1 +1 1 +1 1 +1 1 +1 1 +1 0 +1 1 +1 0 +1 1 -1
S17 1 +1 1 +1 1 +1 1 +1 1 +1 1 +1 1 +1 1 -1 1 +1 1 +1
S18 1 -1 0 +1 1 +1 1 +1 1 +1 1 +1 1 +1 1 +1 1 +1 1 +1
S19 1 +1 1 0 1 -1 1 -1 0 0 0 -1 1 0 1 +1 1 0 0 0
S20 1 +1 0 -1 1 +1 1 +1 1 -1 1 +1 1 -1 1 +1 0 -1 1 +1
S21 0 +1 1 -1 1 +1 1 +1 1 -1 1 +1 1 -1 1 +1 1 -1 1 +1
S22 1 +1 1 -1 0 +1 1 +1 1 -1 1 +1 1 -1 1 +1 1 -1 0 +1
S23 1 +1 1 +1 1 +1 0 +1 0 +1 1 -1 1 +1 1 +1 1 +1 1 +1
S24 0 +1 1 +1 1 +1 1 +1 1 +1 1 +1 1 +1 1 +1 1 +1 1 +1
S25 0 +1 1 +1 1 +1 1 +1 1 +1 1 +1 1 +1 0 +1 1 +1 0 +1
Pearson r 0.4 0.4 0.9 0.5 1 0.4 0.4 0.9 0.4 0.4
-1 0 -1 0 -1

International Journal of Scientific and Research Publications, Volume 3, Issue 4, April 2013 9
ISSN 2250-3153
www.ijsrp.org
Table 1.6Comparison of answers of related multiple-choice items with concept map answer
Map-Related Concepts
1 2 3 4 5 6 7 8 9 10 11 12
MC CM MC CM MC CM MC CM MC CM MC CM MC CM MC CM MC CM MC CM MC CM MC CM
S26 1 +1 0 0 1 +1 1 +1 1 +1 1 +1 0 +1 1 +1 1 +1 1 -1 0 -1 0 -1
S27 1 0 1 -1 1 -1 1 0 0 +1 1 0 0 0 1 0 0 0 1 +1 0 +1 1 +1
S28 1 +1 1 +1 1 0 1 -1 0 -1 1 -1 1 -1 1 -1 0 -1 0 +1 1 +1 1 +1
S29 1 +1 1 -1 0 -1 0 +1 1 +1 1 +1 1 +1 0 +1 1 +1 1 -1 1 -1 1 -1
S30 1 +1 1 +1 1 +1 1 +1 1 +1 1 +1 1 +1 1 +1 1 +1 1 +1 1 +1 1 +1
S31 1 0 0 0 1 0 1 0 1 0 1 0 1 0 0 0 1 0 1 +1 1 +1 1 +1
S32 1 +1 1 +1 1 +1 0 0 0 0 0 0 1 0 1 0 1 0 0 -1 1 -1 1 0
S33 0 +1 1 +1 1 +1 1 +1 1 +1 0 +1 0 +1 1 +1 1 +1 0 -1 1 -1 1 +1
S34 1 0 1 -1 1 -1 1 -1 1 -1 1 -1 0 -1 0 -1 0 -1 1 +1 1 +1 1 +1
S35 1 -1 1 +1 0 +1 1 +1 1 +1 1 +1 1 +1 1 +1 1 +1 1 +1 0 +1 1 0
S36 0 +1 1 +1 1 +1 0 +1 0 +1 1 +1 1 +1 0 +1 1 +1 1 -1 0 -1 0 +1
S37 0 +1 0 +1 1 +1 1 -1 0 -1 0 -1 1 -1 1 -1 1 -1 1 -1 1 -1 0 -1
S38 1 +1 1 -1 1 -1 1 +1 1 +1 1 +1 1 +1 1 +1 1 +1 1 0 1 0 1 +1
S39 1 0 1 +1 1 +1 1 +1 1 +1 1 +1 1 +1 1 +1 0 +1 0 -1 1 -1 1 0
S40 1 +1 1 +1 0 +1 0 +1 1 +1 1 +1 1 +1 1 +1 1 +1 0 -1 1 -1 1 +1
S41 1 +1 1 +1 1 +1 0 -1 1 -1 1 -1 1 -1 1 -1 1 -1 0 -1 1 -1 0 +1
S42 1 +1 0 +1 1 +1 1 +1 1 +1 1 +1 1 +1 1 +1 1 +1 1 +1 0 +1 0 0
S43 1 +1 1 +1 1 +1 0 +1 1 +1 0 +1 1 +1 1 +1 1 +1 1 -1 1 +1 1 +1
S44 0 +1 1 -1 1 -1 1 +1 0 +1 1 +1 1 +1 1 +1 1 +1 0 +1 1 +1 1 -1
S45 0 -1 1 +1 0 +1 1 -1 0 -1 1 -1 1 0 1 -1 0 0 1 0 1 0 0 +1
S46 1 +1 1 +1 1 +1 0 +1 1 +1 1 +1 0 +1 1 +1 1 +1 1 0 0 0 1 0
S47 1 -1 1 +1 1 +1 0 +1 1 +1 1 +1 0 +1 1 +1 1 +1 0 +1 1 +1 1 +1
S48 1 +1 0 0 1 0 1 -1 1 -1 1 -1 1 -1 1 -1 1 -1 1 0 0 +1 1 +1
S49 1 +1 1 +1 1 +1 0 +1 0 +1 0 +1 1 +1 0 +1 0 +1 1 +1 1 +1 1 -1
S50 1 -1 1 +1 1 +1 1 +1 0 +1 0 +1 1 +1 0 +1 1 +1 1 +1 1 +1 1 +1
Pearson r 0.4 0.4 0.5 0.6 1 0.7 0.5 0.7 0.5 0.4 0.4 0.7

International Journal of Scientific and Research Publications, Volume 3, Issue 4, April 2013 10
ISSN 2250-3153
www.ijsrp.org
Table 1.7Comparison of answers of related multiple-choice items with concept map answer
Map-Related Concepts
1 2 3 4 5 6 7 8 9 10 11 12
MC CM MC CM MC CM MC CM MC CM MC CM MC CM MC CM MC CM MC CM MC CM MC CM
S1 1 +1 1 +1 1 +1 1 -1 1 +1 1 +1 1 -1 1 +1 0 -1 1 +1 0 -1 1 +1
S2 1 +1 1 +1 0 0 1 +1 1 +1 1 +1 1 +1 0 0 0 +1 1 +1 1 +1 1 +1
S3 1 +1 1 +1 1 +1 0 +1 1 +1 1 +1 1 +1 1 +1 1 +1 0 0 1 +1 1 +1
S4 0 0 0 0 1 -1 1 -1 1 0 1 0 0 -1 0 -1 1 +1 1 +1 1 +1 0 -1
S5 1 +1 1 +1 1 0 1 0 1 +1 1 +1 1 0 1 0 1 0 1 +1 0 0 1 0
S6 0 +1 0 +1 0 +1 1 +1 0 +1 1 +1 1 +1 1 +1 1 +1 1 0 0 +1 1 +1
S7 1 0 1 0 0 +1 1 +1 1 +1 1 +1 1 +1 0 +1 0 +1 1 +1 1 +1 1 +1
S8 1 +1 1 +1 1 0 0 -1 1 0 1 0 0 -1 1 0 0 -1 0 0 1 -1 0 -1
S9 1 +1 1 +1 0 +1 1 +1 1 +1 1 +1 1 +1 1 +1 1 +1 1 +1 1 +1 1 +1
S10 1 -1 1 -1 1 +1 1 0 1 +1 1 +1 1 0 0 +1 1 0 1 +1 1 0 1 0
S11 1 +1 1 +1 1 0 1 +1 1 +1 1 +1 1 +1 0 0 1 +1 1 +1 1 +1 1 +1
S12 0 +1 0 +1 1 +1 0 -1 1 0 1 0 1 -1 1 +1 1 -1 1 +1 1 -1 1 +1
S13 0 0 0 0 1 +1 1 +1 0 +1 1 +1 1 +1 1 +1 0 +1 1 -1 1 +1 1 +1
S14 1 +1 1 +1 1 +1 0 +1 1 +1 1 +1 0 +1 1 +1 1 +1 1 +1 1 +1 1 +1
S15 1 -1 1 -1 1 0 1 +1 1 -1 0 -1 1 +1 0 0 1 +1 1 +1 0 +1 1 +1
S16 1 +1 1 +1 0 +1 1 +1 1 +1 1 +1 1 +1 1 +1 0 +1 1 +1 0 +1 1 -1
S17 1 +1 1 +1 0 +1 1 +1 1 +1 1 +1 1 +1 1 +1 1 +1 1 -1 1 +1 1 +1
S18 1 -1 1 -1 1 +1 0 +1 1 +1 1 +1 1 +1 1 +1 1 +1 1 +1 1 +1 1 +1
S19 1 +1 1 +1 1 -1 1 0 1 -1 1 -1 0 0 0 -1 1 0 1 +1 1 0 0 0
S20 1 +1 1 +1 1 +1 0 -1 1 +1 1 +1 1 -1 1 +1 1 -1 1 +1 0 -1 1 +1
S21 0 +1 0 +1 1 +1 1 -1 1 +1 1 +1 1 -1 1 +1 1 -1 1 +1 1 -1 1 +1
S22 1 +1 1 +1 0 +1 1 -1 0 +1 1 +1 1 -1 1 +1 1 -1 1 +1 1 -1 0 +1
S23 1 +1 1 +1 1 -1 1 +1 1 +1 0 +1 0 +1 1 -1 1 +1 1 +1 1 +1 1 +1
S24 0 +1 0 +1 1 +1 1 +1 1 +1 1 +1 1 +1 1 +1 1 +1 1 +1 1 +1 1 +1
S25 0 +1 0 +1 0 +1 1 +1 1 +1 1 +1 1 +1 1 +1 1 +1 0 +1 1 +1 0 +1
Pearson r 0.4 0.4 0.4 0.4 0.9 0.5 1 0.4 0.4 0.9 0.4 0.4

International Journal of Scientific and Research Publications, Volume 3, Issue 4, April 2013 11
ISSN 2250-3153
www.ijsrp.org

International Journal of Scientific and Research Publications, Volume 3, Issue 4, April 2013 12
ISSN 2250-3153
www.ijsrp.org
XII. FINDINGS
It has been found that the post-test achievement scores
of students of control group were significantly higher
than their pretest achievement scores.
It has been found that the post-test achievement scores
of students of experimental group were higher than their
pretest achievement scores.
A significant difference has been found between the
means scores of post test for the achievement test
administered on the control group and experimental
group both at 0.05 and 0.01 levels. The difference
between the mean scores of the students of the two
groups are quite significant showing the effectiveness of
the learning through Concepts Maps over Lecture
method and proving that concepts Maps play positive
role in enhancement of learning basic concepts of
science.
It has been found that the correlation between Maps
score and the scores on the maps related to multiple
choice items on the unit test varied from 0.04 to 1,
which inference that correlations are generally high.
It has been found that there is a significant difference
between the mean scores of pretest and posttest for the
achievement test administered on the experimental
group is significant at 0.01 levels.
XIII. CONCLUSION
The result revealed that the experimental group performed
better than the control group in all achievement areas i.e. overall,
by levels of cognitive domain and by the type of content
.Students liked the Concept Maps program and benefitted from
it. They found it to be better mode of instruction than the
conventional method i.e. the lecture method.
XIV. EDUCATIONAL IMPLICATIONS
The present study has the implications for the science
teachers and teaching of science.
If the teaching is supplemented with Concept maps, it
can prove to be more effective in enhancing
achievement.
Quality computer which include colorful animation,
graphics display from a versatile and effective
alternative change in instructional strategy.
Concept Maps helps in professional development of
teaching and learning and individuals involved in the
programs for teacher education. It can be infused in the
learning process so as to acquire the knowledge and
skill efficiently.
Using concept map as a tool in science classes will help
student to develop better understanding of the important
concepts, developing interrelationship and creating
meaning schemes and constructing knowledge bases.
The teachers to focus on making connections between
facts and fostering new understanding in students by
allowing , inspiring and guiding their students on their
learning path.
For leading the students on the path of acquisition of
new learning, solving difficult and complex problem or
discovering the facts related to a concept, it is quite
advantageous to put students in situations that might
challenge their previous conceptions and creating
contradictions to encourage them on discovery path for
their individual efforts or engage in discussion with
their individual efforts or engage in discussion with
their peers, teacher or elders.
Since students have to construct their own meaning and
discover the knowledge on their own, constructivist
learning outcomes does not fit in the traditional
evaluation pattern .It calls for flexible, comprehensive
and continuous program to the constructive and create
output of the learners for providing timely assessment,
motivation and assistance to the learners in getting them
engaged in the task of constructing and discovering the
knowledge by themselves.
REFERENCES
[1] Rai,Renu (2010) “Concept mapping as a technology tool to a facilitate” Edutracks .vol.48,no.32,pp8-13
[2] Indian Journal of Teacher Education.Vol.3, no. pp 48-54
[3] Journal of Indian Education. (2008, Feb) Educational Technology Vol.13, no.4. pp 3-4
[4] Best, J.W& Kahn, James (2007) Research in Education: The educational Report (9th edition), pp76-77
[5] Km,Ananta(2009,Jan)Concept centered Teaching in general science.vol.8,no.5,pp-21
[6] Joshi.Anuradha and Patra,Anand (1993) Impact of concept attainment model on general mental ability.vol.23,no2,pp21-23
[7] Aggarwal, Y.P. Better sampling - concepts, techniques and evaluation, Sterling Publisher (P) Ltd., New Delhi.Social Science Abstracts, Vol. XXXII, 2008.Indian, Academy of Social Sciences.
[8] Boyuk, K. (n.d.).European Journal of Physics Education.
[9] Christidou, V. (2011). Interest, Attitudes And Images Related To Science:. International Journal of Environmental & Science Education, 141-159.
[10] Arulsmys, S and Siva Kumar, P (2004), “Interactive Multimedia in teaching and Learning.” Edutracks,vol 7,no,3,pp34-36.
[11] Aggarwal, J.C, Recent Educational Developments in the World New Delhi ,Arya Book Depot,Vol.I, xi,pg. 248,1971.
[12] Bloom, B. S. et.al, Taxonomy of Educational Objectives, Hand book I: Cognitive Domain .New York: David McKay Co., Inc, 1956.
[13] Buch, M.B. (Ed) A Survey of research in education 1978-83: Baroda Centre.
[14] Carter, Good V, Essentials of Educational Research Methodology and Design (N.Y.A.C), pp.128, 1966.
[15] Dash, (2006), Learning Gain from Face to face workshop over SLM.
[16] Dua, M.P and Gupta, V.S (1994), “edited media and development” a mic Singapore Anand publication.
[17] Krishan, S.S (1991), “Instructional media for education and training” Asian publisher Delhi
[18] Kaul,L. Methodology of Educational Research, Vikas Publishing House Pvt.Ltd.,New Delhi,2000.
[19] Guilford,J.P& Frutcher, B (1978), Fundamental Statistics in Psychology and Education (6th Edition), Tokyo, Japan, McGraw Hill Inc., 1978.
[20] Henry, E. Garret (1955), Statistics in Psychology and Education, Kalyani Publishers, Darya Ganj, New Delhi.

International Journal of Scientific and Research Publications, Volume 3, Issue 4, April 2013 13
ISSN 2250-3153
www.ijsrp.org
[21] Hadda, Wadi. I & Jurich, Sonia (2008), The potential of technologies for the enhancement of Science and Mathematics teaching and learning process. Edutracks, Pp 11-14.
[22] Mangal, S.K (2003), Statistics in Psychology and Education, Prentice Hall of India Pvt.Ltd., New Delhi.
[23] Donald, Mc & Michael, L (1997), “The impact of multimedia Instruction upon student‟s attitude and achievement and relationship with learning style.” DAI-A 57/08 PG 34-66.
[24] Nimavathi, V & Gnanadevan, R (April, 2008), Effectiveness of multimedia programme in teaching science. Edutracks, vol7,no.1, pp 28-29.
[25] Ravindernath, M.J (1983), Development of multimedia instructional strategy in teaching Science.Third Survey in education.
[26] Emergent findings: The motivational effect of ICT on pupils. London: DfES. Institute of Advanced Study in Education, M.S.University, 1974.
[27] nhancing multiple intelligences through multimedia trend, (August 2006), “Encyclopedia of education technology”
WEBSITES
[1] http://www.tandf.co.uk/journals/
[2] http://www.futurelab.org.uk/
[3] http://www.educationobservatories.net/eduobs
[4] http://ipts.jrc.ec.europe.eu/
[5] http://www.jrc.ec.europe.eu/
[6] http://www.gly.uga.edu/raiilsback/1122 science defns. html.
AUTHORS
First Author – Dr. (Mrs.) Laxmi Sharma (Principal),
Qualification- M.sc, M.Ed., NET (JRF), Ph.D (Edu.)
Institute - Advanced Institute Of Education, Palwal
Email Address: [email protected]
Second Author – Geeta Harsana, Assistant Professor
Qualification - M.Sc, M.Ed. NET (Edu.)
Institute - Advanced Institute Of Education, Palwal
Email Address: [email protected]
Third Author – Komal Sharma, Assistant Professor
Qualification - M.A, M.Ed
Institute - Advanced Institute Of Education, Palwal
Email Address: [email protected]
Correspondence Author – Geeta Harsana, Assistant Professor
ADVANCED INSTITUTE OF EDUCATION, 70 KM DELHI
MATHURA ROAD, VILLAGE -AURANGABAD, PALWAL -
121105 HARYANA, PHONE: 9813442562 , Email Address:

International Journal of Scientific and Research Publications, Volume 3, Issue 4, April 2013 14
ISSN 2250-3153
www.ijsrp.org