study of cryogenic fluid mixing techniques of cryogenic fluid mixing techniques ... study of...
TRANSCRIPT

N 10 4 1 1 7 6
C R 15 SEPTEMBER 1970
STUDY OF CRYOGENIC FLUID MIXING TECHNIQUES Final Report
(J ULY 1969- J ULY 1970 1
Volzlme I - Large-Scdle Experimentdl Mixing Investigutions and Liqz/id-Oxygen Mixer Design
GENERAL DYNAMICS Fort Worth Division
https://ntrs.nasa.gov/search.jsp?R=19700032463 2018-06-03T07:14:22+00:00Z
GENERAL DYNAMICS Fort Worth Division
FZA -4 50 - 1 15 September 1970
STUDY OF CRYOGENIC FLUID MIXING TECHNIQUES
FINAL REPORT
(July 1969 - June 1970)
Volume I: Large-Scale Experimental Mixing Investigations and Liquid - Oxygen Mixer Design
J. R. Van Hook L. J. Poth
Prepared for the George C. Marshall Space Flight Center
National Aeronautics and Space Administration Huntsville, Alabama
Under
Contract No. NAS8-24882
Approved by:
J..R. Van Hook Project Manager
Approved by:
R. A. Stevens Aerothermodynamics Group Engineer


GENERAL DYNAMICS Fort Worth Division
F O R E W O R D
This document is Volume I of the final report on NASA
Contract NAS8-24882, "Study of Cryogenic Propellant Stratifica-
tion Reduction Techniques." The stbdy was performed by the
Fort Worth Division of General Dynamics Corporation for the
George C. Marshall Space Flight Center of the National Aero-
nautics and Space Administration. The program was conducted
under the technical direction of Mr. T. W. Winstead of the
MSFC Astronautics Laboratory. His assistance in the perform-
ance of this study is gratefully acknowledged.
The final report consists of three volumes:
Volume I. Large-Scale Experimental Mixing Investigations and Liquid-Oxygen Mixer Design
Volume 11. Large-Scale Mixing Data
Volume 111. Computer Procedure f o r the Prediction of Stratification in Supercritical Oxygen Tanks
Volume I contains a presentation of the large-scale experimental
investigation and liquid-oxygen mixer design study together
with a summary of the important findings of the study. Volume
I1 contains a presentation of the experimental data utilized
in this study. Volume 111 describes the computer procedure
developed during the study for the prediction of stratification
development in supercritical oxygen tanks.
iii

GENERAL DYNAMICS Fort Worth Division
T A B L E O F C O N T E N T S
FOREWORD
LIST OF FIGURES
LIST OF TABLES
NOTAT I O N
SUMM4RY
1 . INTRODUCTION
1.1 Study Objec t ives 1.2 Background
2 . EXPERIMENTAL INVESTIGATIONS
2.1 Experimental Test Object ives
2.1.1 T e s t Data Requirements 2.1.2
2.1.3 Experimental/Analytical Data
Large and Small-scale T e s t Data Comparison
Comparison
2.2 T e s t F a c i l i t y Design Considerations 2.3 Experimental F a c i l i t y
2.3.1 T e s t Tank 2.3.2 Flow System 2.3.3 Instrumentat ion System
2.4 Test Procedure 2.5 Experimental Data
2.5.1 Temperature Mixing Data 2.5.2 Je t Motion Data
Page
iii
i x
x i i i
xv
xix
1
2 4
7
7
7 8
8
9 13
13 15 19
22 25
28 33
V
GENERAL DYNAMICS Fort Worth Division
T A B L E O F C O N T E N T S (Cont 'd)
3. EXPERIMENTAL AND ANALYTICAL DATA CORRELATIONS
3.1 Trans ien t Data Corre la t ions
3 , l . l Transient Dimensionless Temperature
3.1.2 Energy I n t e g r a l Corre la t ions
3 . 2 Large-Scale Data Corre la t ions
3.2.1 Jet Trans i t Time Corre la t ion 3.2.2 Corre la t ion of Buoyancy Effec ts 3.2.3 Corre la t ion of Mixing T imes
4 . COMPARISON OF LARGE AND SMALL-SCALE DATA CORRELATIONS
4 .1
4.2
4 , 3
4.4
Comparison of Large and Small-scale J e t T r a n s i t Time Correlat ions Comparison of Large and Small-scale Tank Buoyancy Effects Comparison of Large and Small-scale Tank Mixing T i m e s Effect of Large-Scale Data on Previous Liquid Hydrogen Mixer System Estimates
5. OXYGEN STORAGE MIXER DESIGN STUDIES
5.1 Reference Vehicles and Missions
5.1.1 S - I 1 LOX Tanker Design Conditions 5.1.2 S u p e r c r i t i c a l Oxygen Storage Tank
5,2 Applicat ion of Liquid Hydrogen Mixer Tech- nology t o Liquid Oxygen Systems
5.3 S - I I B LOX Tanker Mixer Design Study
5.3.1 S t r a t i f i c a t i o n 5.3.2 Duty Cycle Evaluation f o r Nonvented
Storage
vi
Page
37
38
38
49
50
52 54 57
67
67
69
69
78
81
81
82 84
85
86
88 89

GENERAL DYNAMICS Fort Worth Division
T A B L E O F C O N T E N T S (Cont'd)
Page
5 . 3 . 3 Mixing Time 5 . 3 . 4 Mixer Sizing and Location 5 .3 .5 Mixer Weight Sumary 5.3 .6 Mixer Operational Sequence
5 . 4 Supercritical Oxygen Tank Mixer Design Study
5 . 4 . 1 Stratification Prediction 5 . 4 . 2 Mixer Requirements
6 . CONCLUSIONS
7, RE COMMENDAT1 ONS
REFERENCE S
APPENDIXES
A: Thermocouple Response Error
B: Pressure Decay Heat Transfer Coefficient
C: Ullage Pressure Decay
D: Pump and Nozzle Operating Characteristics
E: Distribution List
92 92 98 9 8
100
1 0 2 105
109
111
115
117
118
122
125
129
132
v i i

GENERAL DYNAMICS
Figure
1
2
3
4
5
6
7
8
9
10
11
1 2
13
14
L
Fort Worth Division
I S T O F F I G U R E S
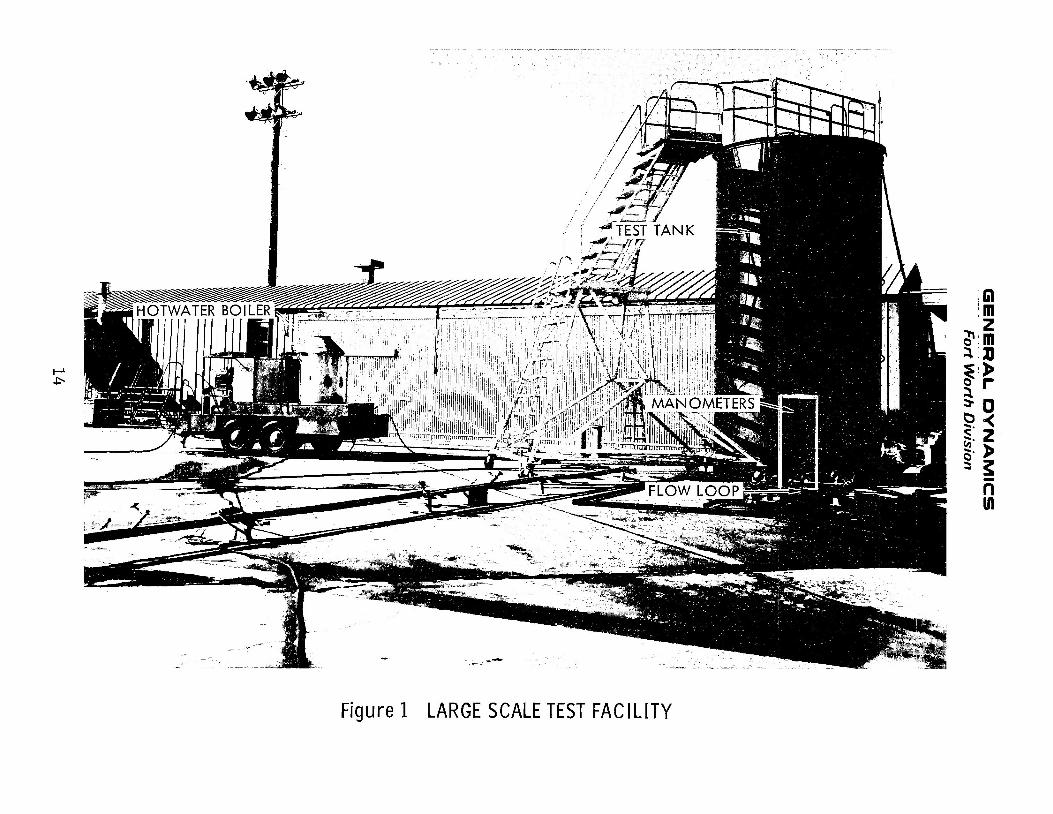
Large-Scale Test Facility
Test Tank and Instrumentation Rake
External Fluid Flow Loop
Large-Scale Tank Experimental Operating Conditions
Test Procedure for Large-Scale Tests
Large-Scale Tank Surface Temperature Variation During Mixing: Run49
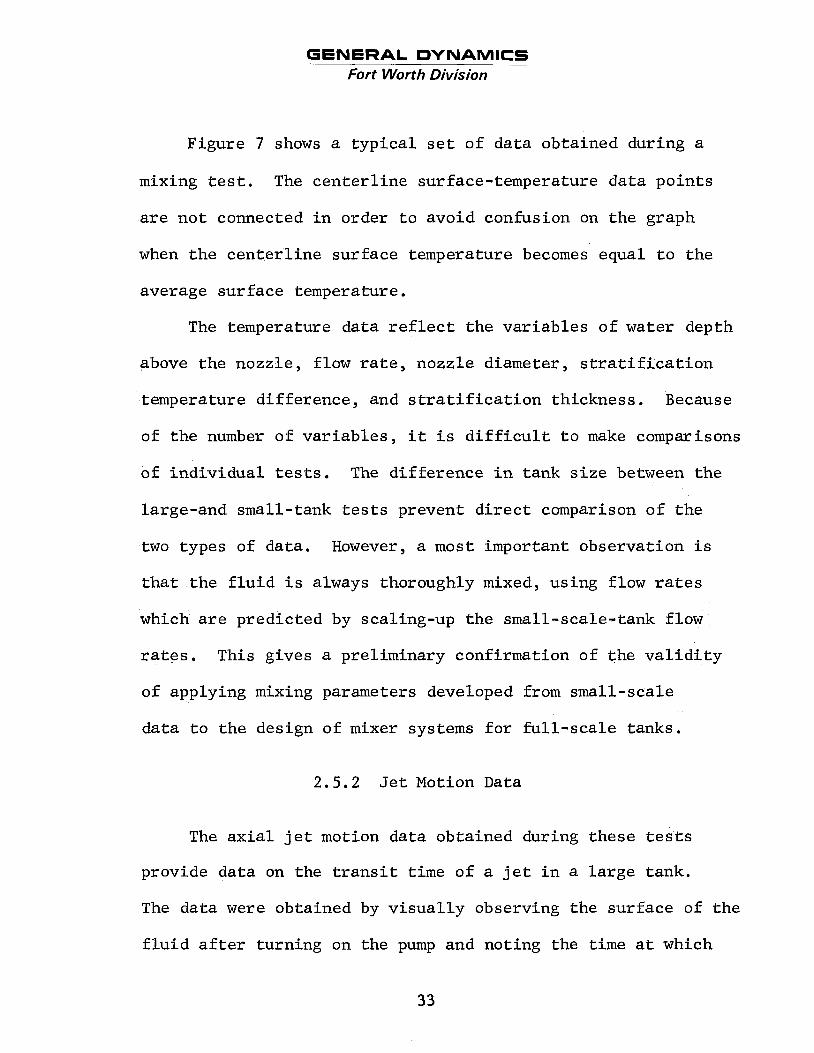
Transient Temperature Destratification: Run 3
Fraction of Initial Temperature Difference After Surface Temperature Starts to Drop: Pump Starts at Q = O . O sec; Average Surface Temperature Drop Starts at QfO.0 sec; Run 3
Fraction of Initial Temperature Difference After Surface Temperature Starts to Drop: Pump Starts at Q = O . O sec; Centerline Surface Ternperatuer Drop Starts at Q1=0.O sec; Run3
Effect of Stratification Thickness on Mixing in Large-Scale Tank
Transient Energy Integral: Run3
Large-Scale Tank Experimental Axial Jet Motion Compared with Prediction From Small Tank Correlations
Correlation of Axial Jet Transit Time for Large-Scale Tank Tests
Effect of Buoyancy on Mixing: Large-Scale Water Tests
ix
Page
14
1 6
18
26
27
30
34
42
43
4 6
51
53
55
56

GENERAL DYNAMICS Fort Worth Division
15
16
17
18
1 9
20
2 1
22
23
L I S T 0 F F I G U R E S (Cont'd)
Correlation of Dimensionless Time Required for Temperature Stratification to Reach 20% of Its Initial Value Versus N:: Scale Tank Tests
Large-
Correlation of Dimensionless Time Required for Temperature Stratificatiog to Reach 10% of Its Initial Value Versus N;: Scale Tank Tests
Large-
Correlation of Dimensionless Time Required for Temperature Stratification to Reach 5% of Its Initial Value Versus N?: Scale Tank Tests
Large-
Correlation of Dimensionless Time Required f o r Temperature Stratification to Reach 20% of Its Initial Value Versus N: Large-Scale Tests
Correlation of Dimensionless Time Required for Temperature Stratification to Reach 10% of Its Initial Value Versus N: Large-Scale Tests
Correlation of Dimensionless Time Required for Temperature Stratification to Reach 5% of Its Initial Value Versus N: Large-Scale Tests
Correlation of Axial Jet Transit Time for Large and Small-Scale Tests
Effect of Buoyancy on Mixing; Large and Small-Scale Water Tests
Correlation of Dimensionless Time Required for Temperature Stratification or Ullage Pressure,to Reach 20% of Its Initial Value Versus N;: Large and Small-Tank Tests
Page
59
60
61
63
64
65
68
70
7 2
X
GENERAL DYNAMICS Fort Worth Division
Figure
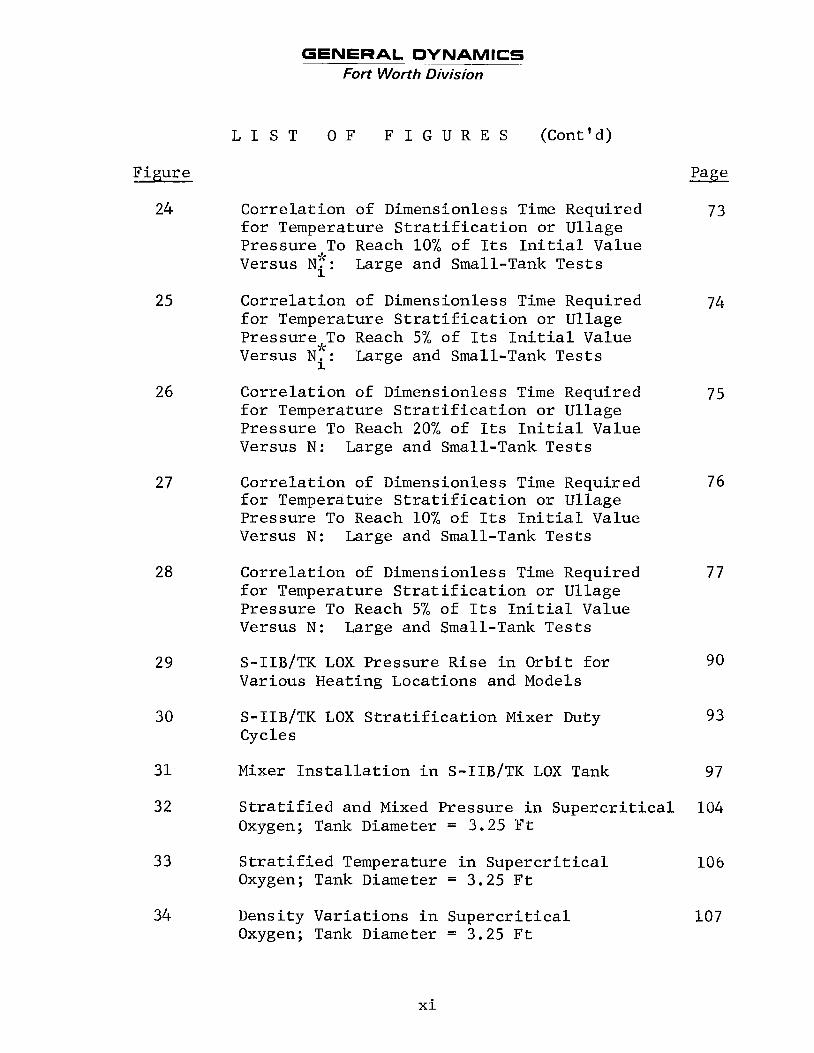
24
25
26
27
28
29
30
3 1
32
33
3 4
L I S T 0 F F I G U R E S (Cont'd)
Page
Correlation of Dimensionless Time Required 7 3 for Temperature Stratification or Ullage Pressure To Reach 10% of Its Initial Value Versus N:: Large and Small-Tank Tests
Correlation of Dimensionless Time Required 7 4 for Temperature Stratification or Ullage Pressure To Reach 5% of Its Initial Value Versus Ni: * Large and Small-Tank Tests
Correlation of Dimensionless Time Required 75 for Temperature Stratification or Ullage Pressure To Reach 20% of Its Initial Value Versus N: Large and Small-Tank Tests
Correlation of Dimensionless Time Required for Temperature Stratification or Ullage Pressure To Reach 10% of Its Initial Value Versus N: Large and Small-Tank Tests
7 6
Correlation of Dimensionless Time Required 77 for Temperature Stratification or Ullage Pressure To Reach 5% of Its Initial Value Versus N: Large and Small-Tank Tests
S-IIB/TK LOX Pressure Rise in Orbit for 9 0 Various Heating Locations and Models
S-IIB/TK LOX Stratification Mixer Duty 9 3 Cycles
Mixer Installation in S-IIB/TK LOX Tank 97
Stratified and Mixed Pressure in Supercritical 104 Oxygen; Tank Diameter = 3.25 Ft
Stratified Temperature in Supercritical 106 Oxygen; Tank Diameter = 3.25 Ft
Density Variations in Supercritical Oxygen; Tank Diameter = 3.25 Ft
107
xi

GENERAL DYNAMICS Fort Worth Division
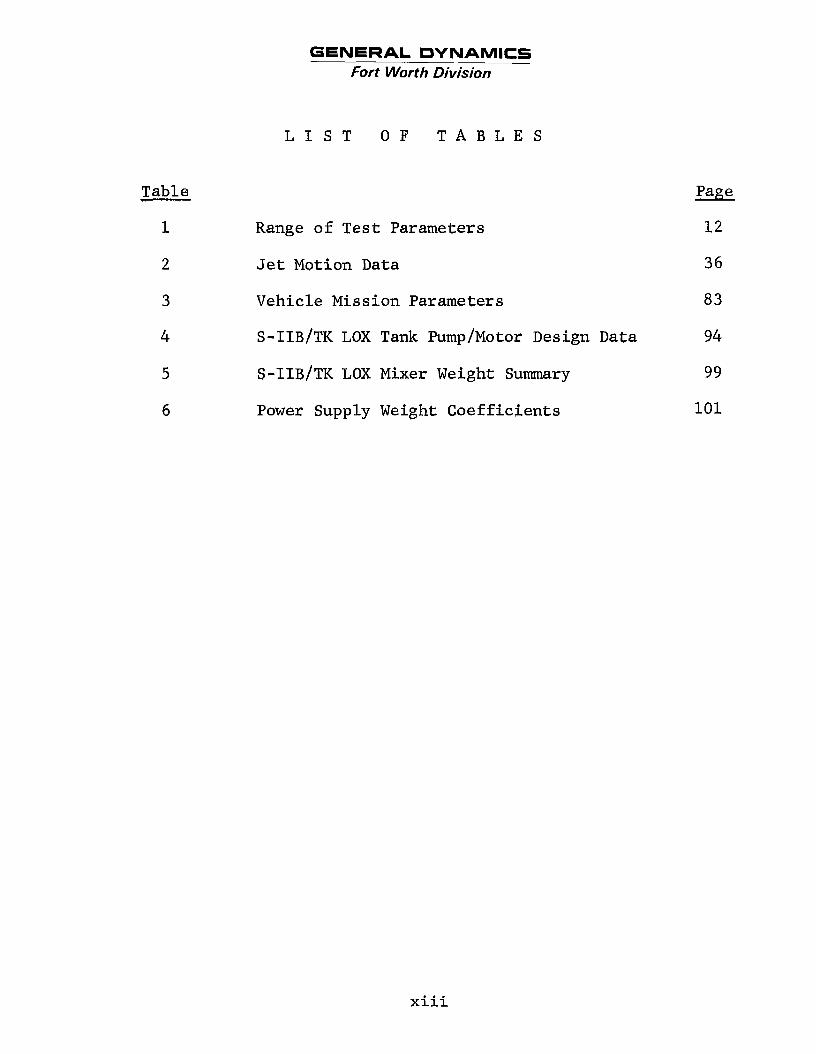
L I S T O F T A B L E S
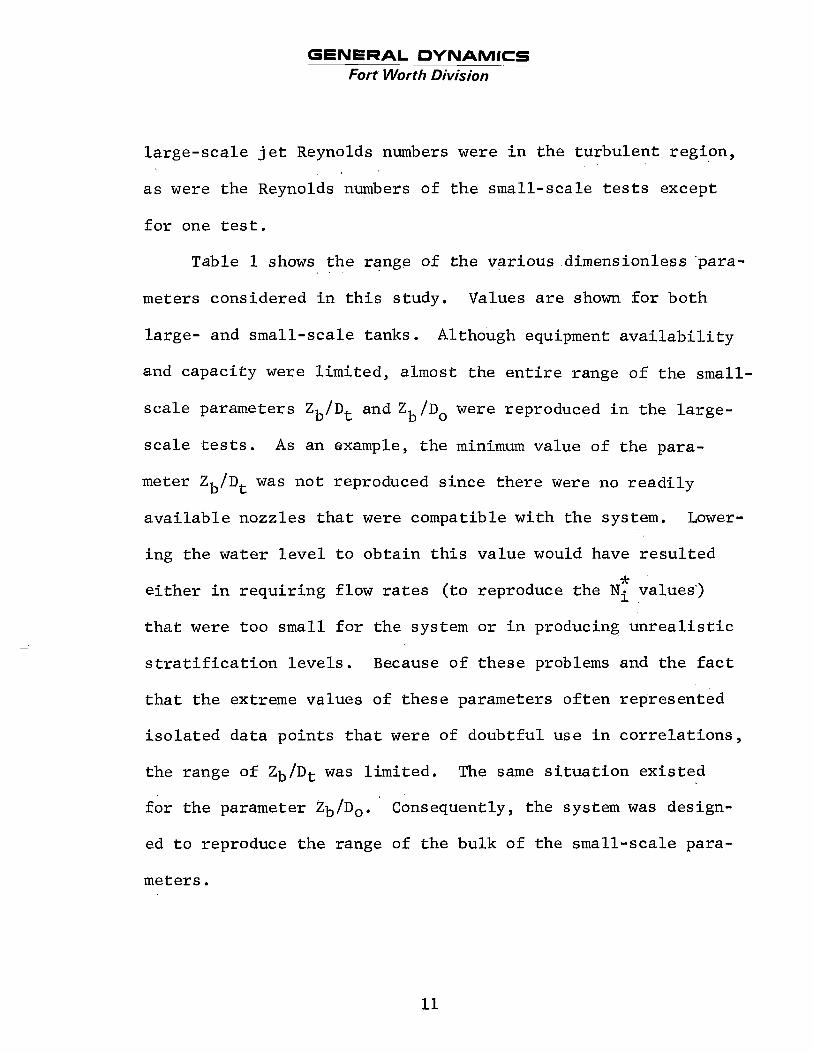
Table Page - 1 Range of Test Parameters 12
2 Jet Motion Data 36
3 Vehicle Mission Parameters 83
4 S-IIB/TK LOX Tank Pump/Motor Design Data 94
5 S-IIB/TK LOX Mixer Weight Summary 99
6 Power Supply Weight Coefficients 101
x i i i

GENERAL DYNAMICS Fort Worth Division
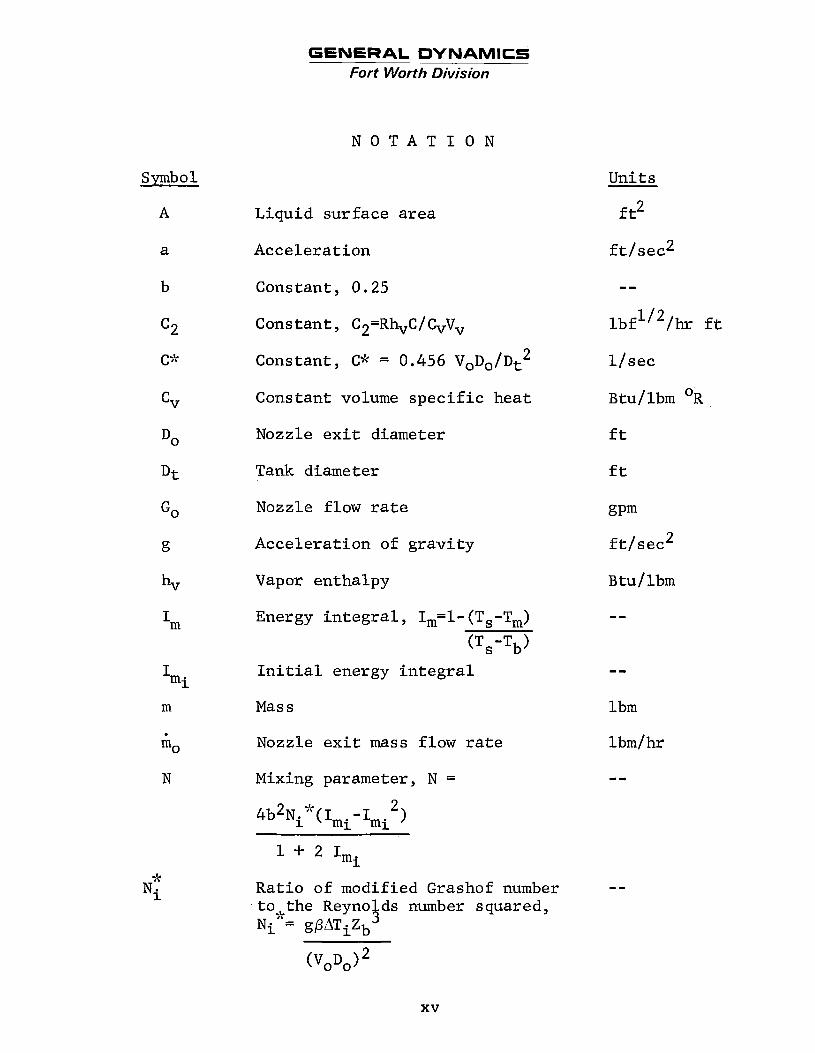
N O T A T I O N
Symbol
A
Units
f t2 Liquid surface area
ft/sec2 Acceleration a
b Constant, 0.25
lbf1j2/hr ft Constant, C2=RhvC/&Vv
Constant, C2k = 0.456 VoDo/Dt2 l/sec
Btu/lbm OR Constant volume specific heat
Nozzle exit diameter ft
ft
gpm
ft/sec2
B tu / lbm --
DO
Dt Tank diameter
GO Nozzle flow rate
Acceleration of gravity
Vapor enthalpy
Energy integral, Im=l-(Ts-Tm) (Ts'Tb>
Initial energy integral I mi
-- Mass lbm
lbm/hr
m
Nozzle exit mass flow rate
Mixing parameter, N = N 4b2NiJk ( Imi - Imi 2
l + 2 1 m i Ratio of modified Grashof number t o the Reynolds number squared, Ni >k = gpATiZb 3
xv
GENERAL DYNAMICS Fort Worth Division
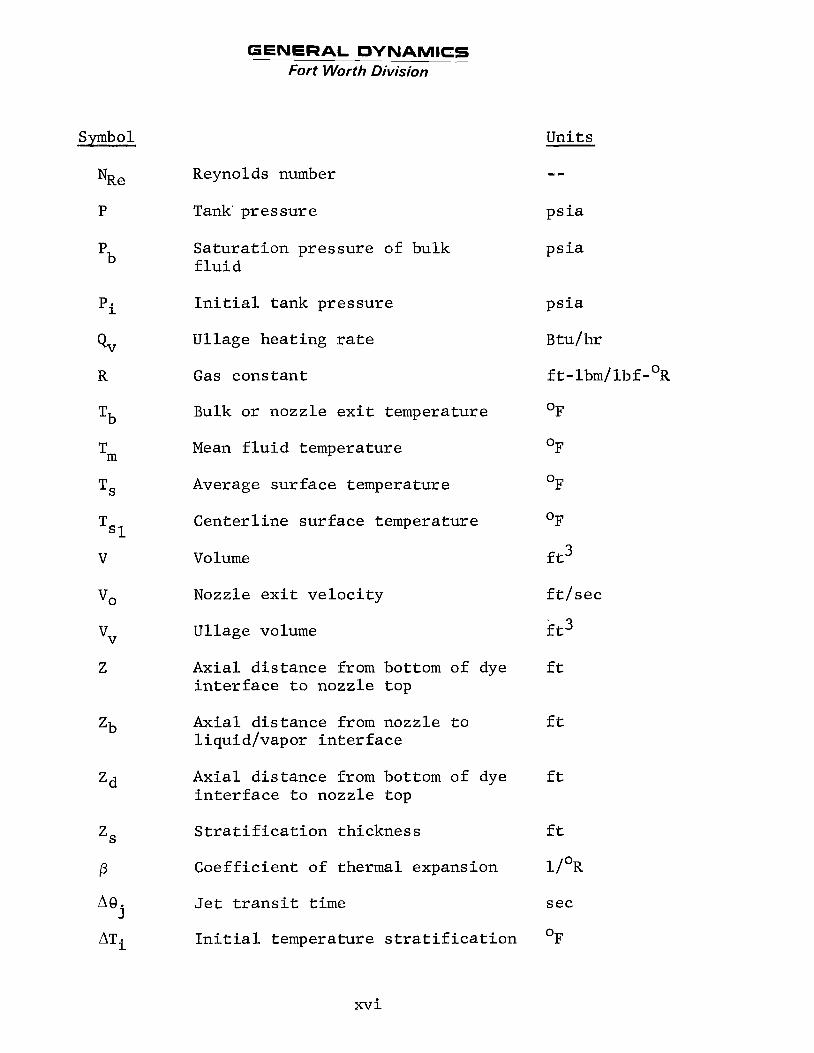
Symbol Units
-- Reynolds number NRe
P Tank' pressure psia
Saturation pressure of bulk fluid
psia 'b
'i
QV
R
Initial tank pressure psia
Btu/hr
f t - lbm/ lb f OF
OF
OF
OF
ft3
ft3
ft/sec
Ullage heating rate
'OR Gas constant
Bulk or nozzle exit temperature Tb
Mean fluid temperature Tm
TS Average surface temperature
Centerline surface temperature
Volume
Nozzle exit velocity
V
VO
vV
Z
Ullage volume
Axial distance from bottom of dye interface to nozzle top
ft
zb Axial distance from nozzle to liquid/vapor interface
ft
Axial distance from bottom of dye interface to nozzle top
ft zd
ZS
P
aej ATi
Stratification thickness ft
1 / O R
sec
O F
Coefficient of thermal expansion
Jet transit time
Initial temperature stratification
xv i
GENERAL DYNAMICS Fort Worth Division
Symbol Units
9 Time or time a f t e r pump turned on sec
9m Mixing time sec
Time a f t e r mixing begins sec
P Fluid density lbm/ft3
cr Surface tension l b f / f t
Subscripts
i I n i t i a l
xv i i

GENERAL DYNAMICS Fort Worth Division
S U M M A R Y
The design of present and f u t u r e spacec ra f t u t i l i z i n g
cryogenic f l u i d s r equ i r e s t h a t adequate p red ic t ion and con-
t r o l of thermal s t r a t i f i c a t i o n be accomplished. In previous
s t u d i e s (References 1 and 2) methods were se l ec t ed f o r mixing
t h e thermally s t r a t i f i e d f l u i d l aye r wi th the remaining colder
bulk f l u i d i n t h e tank and a mixer design procedure w a s de-
veloped. The resul ts of t h e mixer design procedure were
appl ied t o l iquid-hydrogen s torage systems and es t imates made
o f t h e mixer requirements.
The previously developed mixer design procedure w a s
p a r t i a l l y based on small-scale mixing tes ts i n which water
was used as t h e t e s t f l u i d . In t h e present s tudy, t h e
v a l i d i t y of s c a l i n g small-scale t es t da ta f o r use i n design-
ing mixer systems f o r f u l l - s c a l e tanks has been v e r i f i e d
through use of a t e s t tank intermediate i n s i z e between the
previous small-scale tank and t h e f u l l - s c a l e tanks of space-
c r a f t . The experimental mixing i n v e s t i g a t i o n involved mixing
i n a l a rge - sca l e (10-foot-diameter, 20-foot-long) s t r a t i f i e d
tank wi th non-pressurized water used as t h e t e s t f l u i d .
x i x

GENERAL DYNAMICS Fort Worth Division
Tests were conducted t o duplicate the range of the previous
small-scale t e s t parameters. The data obtained consist of
temperature h is tor ies i n the tank during mixing and a limited
amount of j e t motion data. The bulk of t h i s data i s presented
i n Volume 11.
The temperature mixing data were reduced t o a dimension-
l e s s form of temperature s t r a t i f i ca t ion . These data were used
t o make correlations of mixing time and the e f fec t of buoyancy
on mixing.
required for the j e t t o move from the nozzle ex i t t o the l iqu id
surface.
The j e t motion data were used t o check the time
The correlation of buoyancy effects showed that t h e
delay i n the i n i t i a l surface temperature decay (due t o mixing
being retarded by the buoyancy of the s t r a t i f i e d layer) de-
creased w i t h decreasing values o f the parameter N. This para-
meter i s a function of the energy dis t r ibut ion i n the tank and
the r a t i o of the modified Grashof number divided by the square
of the Reynolds number. Since the modified Grashof number i s
a function of acceleration, N i s a lso a function of accelera-
t ion. The large-scale data correlation of the buoyancy ef fec ts
indicates that the delay i n mixing time due t o buoyancy i s
re la t ive ly small for conditions simulating low-g environments,
The data indicate tha t t h i s condition can be ignored i n design-
ing mixers for low-g conditions. xx
GENERAL DYNAMICS Fort Worth Division
The c o r r e l a t i o n of t h e mixing time requi red t o reduce
an i n i t i a l s t r a t i f i c a t i o n t o some f r a c t i o n o f i t s va lue was
i n i t i a l l y accomplished by t h e use of dimensionless t i m e versus
t h e parameter N which i s t h e r a t i o of t h e modified Grashof
number d iv ided by t h e square of t h e Reynolds number. This
c o r r e l a t i o n r e s u l t e d i n t h e d a t a being grouped according t o
t h e th ickness of t h e i n i t i a l s t r a t i f i c a t i o n . A c o r r e l a t i o n of
N versus t h e mixing t i m e r e s u l t e d i n good da ta grouping.
* i’
Comparison of large- and small-scale da ta c o r r e l a t i o n s
revealed e x c e l l e n t agreement between the two sets of data .
The previous conclusion t h a t buoyancy e f f e c t s i n t h e small-
s c a l e tests were s m a l l f o r condi t ions s imula t ing low-g environ-
ments was upheld. Mixing t i m e c o r r e l a t i o n s ind ica t ed t h a t t h e
dimensionless mixing t i m e s requi red t o mix the f l u i d i n l a rge -
and small-scale tanks are approximately t h e same f o r t h e s i m i -
l a r t es t condi t ions. Previous j e t motion p red ic t ions based
on the small-scale da ta were a l s o v e r i f i e d .
Since t h e l a rge - sca l e da t a c o r r e l a t i o n s d i d no t d i f f e r
g r e a t l y from previous small-scale c o r r e l a t i o n s , t h e mixer
design parameters are no t changed. Consequently, no changes
are requi red i n t h e previous liquid-hydrogen mixer system
est i m a t es . The previously def ined methods of p r e d i c t i n g thermal
s t r a t i f i c a t i o n and mixer performance were appl ied t o t h e de-
x x i
GENERAL DYNAMICS Fort Worth Division
sign of mixers for oxygen storage. Two tanks were considered:
(1) an S - I I B / T K o r b i t a l LOX tanker amd ( 2 ) a small. supercr i t ical
storage tank. The previously developed methods of predicting
s t r a t i f i c a t i o n were found t o be adequate for the S - I I B / T K
tank. The prediction of s t r a t i f i c a t i o n i n a supercr i t ical
tank required the development of an en t i re ly new computer pro-
cedure. This procedure i s presented i n Volume 111.
The design of the mixer system for the S - I I B / T K tank was
complicated by the large ullage, which r e su l t s i n ullage heat-
ing being the dominant cause of the tank pressure r i s e . A l s o ,
i f the l iquid oxygen consisted of globules dis t r ibuted through-
out the tank, f l u i d control would be d i f f i c u l t . Therefore, a
mixer system was devised tha t does not disrupt the interface.
The mixer design considers only conventional pumps.
The prediction of s t r a t i f i c a t i o n i n t h e supercr i t ical
oxygen was complicated by the continuous withdrawal of mass
from the tank and by the heating of the tank during withdrawal
i n order t o maintain tank pressure. The s t r a t i f i c a t i o n due t o
the heaters i s controlled par t ia l ly by termination of heating
when the desired tank operating pressure i s exceeded. There-
fore, the major concern was that a sudden mixing of the tank
might cause a pressure collapse t o some pressure below the
tank operating range. Equilibrium mixing of the s t r a t i f i e d
x x i i
GENERAL DYNAMICS Fort Worth Division
t ank considered d i d n o t r e s u l t i n s i g n i f i c a n t p re s su re decay .
It i s expected, however, t h a t if mixers are not employed t h e
ex ten t of t h e pressure c o l l a p s e w i l l increase wi th t i m e as the
s t r a t i f i c a t i o n inc reases (Ref. 11). A l s o , t he s e v e r i t y of
p re s su re c o l l a p s e is determined by t h e l o c a t i o n and s e v e r i t y
of t h e energy added t o t h e tank. The mixer requirements are
c o n s i s t e n t w i th conventional ( ex i s t ing ) mixer designs al though
t h e recent Apollo 13 f a i l u r e may cause changes i n t h e e l e c t r i c
motor design t o e l imina te combustible e l ec t r i ca l i n s u l a t i o n .
It was found t h a t t h e r e i s a l ack of c o n s i s t e n t c lose -
spaced proper ty da t a over the ope ra t ing range considered.
Since i n t h e s u p e r c r i t i c a l region small temperature changes
can r e s u l t i n l a r g e pressure v a r i a t i o n s , i n t e r p o l a t i o n between
d a t a p o i n t s could induce proper ty va lue e r r o r s ,
x x i i i
GENERAL DYNAMICS Fort Worth Division
S E C T I O N 1
I N T R O D U C T I O N
The prediction and control of the thermodynamic s t a t e of
stored cryogens i s required i n order t o design both present
and future spacecraft. The technology required t o predict the
development of thermal s t r a t i f i c a t i o n and the methods of ob-
taining thermal equilibrium (mixing) were developed during a
previous study (Reference 1). These methods a r e based on
analyt ical r e s u l t s which are supported and ver i f ied by mixing
t e s t s conducted i n small-scale tanks. In t h i s study, the use
of the small-scale t e s t data t o develop mixing parameters for
use i n the design of mixing systems in fu l l - s i ze tanks i s
ver i f ied by tes t ing i n an intermediate-size tank,, In addi-
t ion, the previously developed techniques (which were intended
for use i n liquid-hydrogen mixer designs) a re applied t o l iquid-
oxygen systems
The principal e f fo r t i n t h i s study has been expended i n
the experimental evaluation of ax ia l j e t mixing i n a large-
scale tank (intermediate i n s i ze between small tank used i n
e a r l i e r study and ful l -s ized spacecraft tank) and the estab-
lishment of correlations with existing small-scale data. This
includes the assessment of the e f fec t of nozzle diameter, j e t
1
GENERAL DYNAMICS Fort Worth Division
flow r a t e , and buoyancy on mixing parameters and the comparison
of small-scale-tank test parameters with large-scale-tank test
parameters. Also considered is the effect of the large-scale
test results on prior estimates of low-g liquid-hydrogen mixer
systems
The analysis of the oxygen systems considers an
S-IIB LOX tanker concept and a small supercritical storage sys-
tem. Techniques developed in the previous study are applied
to the S-I1 system to predict stratification development and
to size the required mixer system. A new stratification pre-
diction procedure was developed for predicting stratification
in a supercritical storage tank. The results of the super-
critical oxygen stratification study reveal no evidence that
mixing the stratification buildup will result in the collapse
of tank pressure. The stratification developed in the tank
(due to heating to maintain pressure during withdrawal) is
controlled by maintaining pressure limit switches on the
heaters. Therefore a mixer system is not strictly necessary.
1.1 STUDY OBJECTIVES
The objectives of this study were (1) to verify the validity
of utilizing small-scale-tank mixing parameters in the design
of full-scale-tank mixers, and (2) to apply previously developed
2
GENERAL DYNAMICS Fort Worth Division
mixing techniques t o t h e design of liquid-oxygen mixer systems.
In o rde r t o v e r i f y t h e v a l i d i t y of using small-scale tank
da ta c o r r e l a t i o n s t o develop mixer parameters f o r t h e design of
fu l l - s ca l e - t ank mixers, t h e small-scale da ta c o r r e l a t i o n s were
confirmed i n a la rge-sca le tank. The l a rge - sca l e tank w a s an
order-of-magnitude l a r g e r than t h e previous small-scale tank.
The range of dimensionless mixing condi t ions considered i n t h e
smal l - sca le tests were dupl ica ted as f a r a s poss ib le i n t h e
l a rge - sca l e tests. The l a rge - sca l e t es t data were used t o
ob ta in c o r r e l a t i o n s f o r comparison with similar small-scale
da ta c o r r e l a t i o n s . These c o r r e l a t i o n s considered the e f f e c t
of nozzle diameter, l i q u i d depth, flow rate, and s t r a t i f i c a t i o n .
Any v a r i a t i o n between t h e la rge- and small-scale c o r r e l a t i o n s
were evaluated t o determine t h e i r e f f e c t on t h e previously
developed liquid-hydrogen mixer estimates.
The mixer design techniques used i n developing t h e l i qu id -
hydrogen mixer estimates were evaluated t o determine i f they
could be app l i ed t o liquid-oxygen sys tems. Necessary modifi-
ca t ions were made and new techniques developed as required.
The techniques were then appl ied t o an S-I1 LOX tanker and
a s u p e r c r i t i c a l tank.
3

GENERAL DYNAMICS Fort Worth Division
1.2 BACKGROUND
The study of methods of maintaining thermodynamic e q u i l i -
brium of s to red cryogens has been pursued i n previous s tud ie s
(References 1 and 2 ) . These s t u d i e s cons is ted o f both a n a l y t i c a l
and experimental i n v e s t i g a t i o n s i n t o methods o f p red ic t ing
thermal s t r a t i f i c a t i o n development and subsequent s t r a t i f i c a -
t i o n reduct ion. The r e s u l t s of these s t u d i e s include (1)
s t r a t i f i c a t i o n p red ic t ion techniques, (2) s e l e c t i o n of mixing
methods, ( 3 ) pred ic t ion of mixing h i s t o r i e s , ( 4 ) development
of mixer-system design methods, and (5) a p p l i c a t i o n of t h e
design methods t o low-g l iquid-hydrogen systems. The a n a l y t i -
c a l i nves t iga t ion r e s u l t e d i n the s e l e c t i o n of j e t mixing a s
t h e most s u i t a b l e method of mixing a tank i n a low-g environ-
ment.
The ear l ier a n a l y t i c a l i nves t iga t ions w e r e supplemented
and v e r i f i e d by extensive mixing t e s t s conducted i n small-
s c a l e c y l i n d r i c a l tanks. The t e s t s used water a s t h e t es t
f l u i d and included both pressurized and non-pressurized caseso
Test va r i ab le s included nozzle diameter, l i q u i d depth, flow
rate , and s t r a t i f i c a t i o n . Various tank bottoms were a l s o in-
ves t iga t ed . Three mixer types were s tud ied : an a x i a l j e t ,
a r a d i a l j e t , and a 60-degree j e t . The t e s t r e s u l t s ind ica ted
GENERAL DYNAMICS Fort Worth Division
that the axial jet provides the most efficient means of jet
mixing a tank,
The small-scale test results included data on the jet
motion, bulk fluid motion, and temperature and pressure his-
tories in the tank during mixing. Mixing time and the effects
of buoyancy were evaluated from these data. Also, these data
were correlated and used to develop design parameters for use
in the design of mixer systems for full-scale cryogenic hydro-
gen tanks.
The resulting correlations from the experimental testing
and analytical investigations were used to size mixer systems
for various liquid-hydrogen tanks.
resulted in mixer designs. Also, penalties associated with
the mixer systems were assessed,
These sizing analyses
Verification of the analytical results based on these
small-scale tests and the associated development of mixer
parameters based on these results would not be sufficient if
the correlations could not be applied to full-scale tanks.
The small-scale tanks were approximately 1 foot in diameter,
and the full-scale tanks could be 20 or 30 times larger; there-
fore, the scaling up of small-scale data correlations to pre-
dict mixing in a large tank could possibly induce serious
errors in mixer design. This possibility warranted additional
5

GENERAL DYNAMICS Fort Worth Division
testing to be accomplished with a tank intermediate in size
between the small test tanks and full-size tanks. The tank
selected is approximately an order-of-magnitude larger than
the small test tank. The experimental investigation conducted
with this tank is discussed in Section 2. The large-scale-
tank test data correlations are discussed in Section 3 and
compared with the earlier small-scale-tank correlations in
Section 4 .
The results of the mixing investigations could be applied
to any non-viscous fluid. In particular, the study results
are applied to another cryogen, oxygen, that is commonly stored
in low-g environments.
stratification prediction and mixing techniques to an S-IIB
LOX tanker and a supercritical tank are given in Section 5.
The results of the application of the
6
GENERAL DYNAMICS Fort Worth Division
S E C T I O N 2
E X P E R I M E N T A L I N V E S T I G A T I O N S
The experimental phase of the program has provided da ta on
t h e mixing of a thermally s t r a t i f i e d l aye r i n a la rge-sca le tank.
These i n v e s t i g a t i o n s considered a x i a l j e t mixing i n a non-pres-
sur ized , up r igh t c y l i n d r i c a l tank i n which water was used a's
t h e t e s t f l u i d . The t e s t s conducted were designed t o dup l i ca t e ,
where poss ib l e , t h e range of parameters considered i n previous
smal l - sca le t es t s , The experimental da ta have been used t o
v a l i d a t e t h e use of t h e previous small-scale data t o develop
mixing p red ic t ions and mixer design parameters f o r use i n t h e
design of a x i a l j e t mixer systems f o r a la rge-sca le tank.
2 . 1 EXPERIMENTAL TEST OBJECTIVES
The ob jec t ive of t h e experimental tes ts , performed i n a
l a rge - sca l e water tank, w a s t o v a l i d a t e the use i n large- tank
mixer design of parameters based on small-scale-mixing t e s t
da ta .
2 .1 .1 Test Data Requirements
The t e s t da t a requi red were those da ta t h a t per ta ined
only t o mixing. The tes t parameters were required t o dup l i ca t e
7
GENERAL DYNAMICS Fort Worth Division
where poss ib le t h e range of t h e parameters used i n t h e s m a l l -
s c a l e t e s t s .
The tes ts were designed t o y i e l d da ta on temperature decay
i n t h e tank during mixing. The temperature h i s t o r i e s were an-
a lyzed t o y i e l d mixing t i m e s and t r a n s i e n t temperature e f f e c t s .
Some da ta on t h e j e t motion were obtained. No da ta on t h e bulk
f l u i d motion were obtained.
2.1,2 Large and Small-scale Test Data Comparison
Comparison of la rge- and small-scale da ta i s pr imar i ly con-
cerned wi th a comparison of mixing times and t h e e f f e c t of buoy-
ancy on mixing f o r t h e same t e s t parameters. This comparison
r equ i r e s t h a t t h e l a rge - sca l e da ta be f i r s t reduced t o a dimen-
s i o n l e s s form of temperature s t r a t i f i c a t i o n versus a dimension-
less t i m e . The comparison of tes ts under the same condi t ions
was then accomplished. Also , a general expression f o r t h e tem-
pe ra tu re decay developed from small-scale bulk-fluid-motion
da ta can be compared wi th t h e t r a n s i e n t temperature decay from
indiv idua l t es t s . I n t e r p r e t a t i o n of t h e da ta i s o f t e n a mat te r
of judgement. This i s e spec ia l ly t r u e i n s e l e c t i o n of mixing
times from the t e s t da ta .
2 ,1 .3 Experimental/Analytical Data Comparison
The comparison of experimental data and a n a l y t i c a l 8

GENERAL DYNAMICS Fort Worth Division
pred ic t ions w a s repor ted i n Reference 2 f o r t he small-scale da t a .
The presence of a major v a r i a t i o n of large-scale- tank d a t a from
t h e smal l - sca le d a t a w a s t he c r i t e r i o n which determined i f new
comparisons needed t o be made.
2.2 TEST FACILITY DESIGN CONSIDERATIONS
The comparison of t h e r e s u l t s from t h e la rge-sca le tes ts
performed during t h i s study and t h e small-scale tes ts performed
i n e a r l i e r s t u d i e s requi red t h a t c a r e f u l cons idera t ion be given
t o geometrical s i m i l a r i t y . The f i r s t c r i t e r i o n used w a s t o
maintain t h e conf igura t ion of t h e tanks i n as similar a shape
a s poss ib le . The o r i g i n a l small-scale t e s t tanks cons i s t ed of
a cy l inde r wi th concave o r convex bottoms. The non-pressurized
small-scale tanks had no top, while t h e pressurized smal l - sca le
tanks had a hemispherical top. The la rge-sca le tank w a s select-
ed t o be a cy l inde r ,
bottom bulkheads i n the l a rge - sca l e tank and s t i l l maintain a
simple t e s t se tup . However, t h e previous small-scale t e s t
r e s u l t s ind ica ted t h a t t h e r e w a s very l i t t l e f l u i d motion below
t h e nozzle , so the use of a flat-bottomed tank d id n o t d e t r a c t
from t h e r e s u l t s .
It w a s no t poss ib l e t o r e t a i n t h e curved
The tank diameter of 10 f e e t wases tab l i shed as a b a s i c
t e s t gu ide l ine , This dimension w a s approximately an order of
GENERAL DYNAMICS Fort Worth Division
magnitude l a r g e r than those used i n t h e smal l - sca le t es t s . The
tank length w a s determined from the maximum previous L/D r a t i o
of approximately 2. The nozzle diameters were then s e l e c t e d
by s c a l i n g up t h e small-scale nozzle diameters, using t h e r a t i o
of t h e smal l - sca le water depth t o the small-scale nozzle d i a -
meter, and mul t ip ly ing by t h e l a rge - sca l e water depth. The
values of the dimensionless geometry parameters Zb/Dt and
Zb/Do were thus maintained approximately t h e same.
Axial j e t flow r a t e s i n t h e l a rge - sca l e tank were se l ec t ed *
from values of t h e dimensionless parameter N found i n
t h e small-scale t es t s . Subs t i t u t ing i n t o t h e expression f o r
Ni values of t h e ranges o f temperature s t r a t i f i c a t i o n , l i q u i d
i
-1, n
depth, and nozzle diameter enabled values of t he a x i a l j e t flow
rate t o be s e l e c t e d which would reproduce t h e same values of
N . i n t h e l a rge - sca l e tank a s were used i n t h e smal l - sca le
tank
ik
1
Maintaining the same geometry r a t i o s and N T range i n the
l a rge - sca l e tank as were used i n the small-scale tank r e s u l t e d
i n an increase i n t h e j e t Reynolds number.
had been previously found t o be a more important parameter i n
The parameter N" i
p red ic t ing mixing than t h e j e t Reynolds number; t he re fo re t h e
value of t he Reynolds number w a s allowed t o vary as requi red
t o maintain t h e previous range of Ni. 7k
The values of a l l
10
GENERAL DYNAMICS Fort Worth Division
large-scale j e t Reynolds numbers were i n the turbulent region,
as were the Reynolds numbers of the small-scale t e s t s except
for one t e s t .
Table 1 shows the range of the various dimensionless 'para-
meters considered i n t h i s study. Values a r e shown for both
large- and small-scale tanks. Although equipment ava i lab i l i ty
and capacity were limited, almost the en t i r e range o f the small-
scale parameters Zb/Dt and Z b / D o were reproduced i n the large-
scale t e s t s .
meter Zb/Dt was not reproduced since there were no readi ly
A s an example, the minimum value of the para-
available nozzles tha t were compatible with the system. Lower-
ing the water leve l t o obtain t h i s value would have resulted *
ei ther i n requiring flow ra tes (to reproduce the Ni values')
tha t were too small for the system o r i n producing unrea l i s t ic
s t r a t i f i c a t i o n levels. Because of these problems and the f ac t
tha t the extreme values of these parameters often represented
isolated data points t ha t were of doubtful use i n correlations,
the range of Z b / D t was limited.
for the parameter Zb/Do. Consequently, the system was design-
ed t o reproduce the range of the bulk of the small-scale para-
meters.
The same s i tuat ion existed
11
GE
NE
RA
L D
YN
AM
ICS
F
ort W
orth
Divisio
n
2 u
Q)
E
cd k
cd PI
rn 00
d . h
00
0 e
m
0
hl
hl b
m
0 .
0
0
0
4- 4-
n
cn m
cn
0
n
\D
rl
a
0
0
0
0
h
hl m
hl
cn rl
4
0
. n
rn
00 0
0
a
0
b
hl m
n
12
GENERAL DYNAMICS -
Fort Worth Division
2.3 EXPERIMENTAL FACILITY
The experimental f a c i l i t y i n which t h e l a rge - sca l e t e s t s
were conducted cons i s t ed of a tank, a s soc ia t ed flow systems,
instrumentat ion f o r recording temperatures and measuring flow
r a t e s , and equipment f o r inducing s t r a t i f i c a t i o n . These com-
ponents were s e t up on an ou t s ide t e s t s i t e .
t h e t e s t s i t e and major components i s shown i n Figure 1.
A photograph of
2.3.1 T e s t Tank
The t e s t tank was a v e r t i c a l s t ee l cy l inder having a 10-
foct diameter and a 20-foot length (L/D = 2) . The tank had a
f l a t bottom and an open top.
pene t ra ted by 3-inch-diameter por tholes covered by p l ex ig l a s s .
The s idewal l of t he tank w a s \
The purpose of t hese por tholes , arranged v e r t i c a l l y a t 2-foot
i n t e r v a l s , w a s t o allow observat ion of dye movements i n t h e
tank i f f e a s i b l e and necessary.
The tank w a s f i t t e d wi th permanent i n t e r n a l and ex te rna l
ladders t o allow access t o t h e instrumentat ion and piping
wi th in t h e tank. The ladders w e r e mounted over t h e portholes
t o enable personnel t o use' t h e por tholes f o r observat ion pur-
poses. The i n t e r n a l ladder , of open cons t ruc t ion , extended
4 inches from t h e wa l l and d id n o t present a s i g n i f i c a n t flow
13
GE
NE
RA
L D
YN
AM
ICS
Fort W
orth
Divisio
n
14

GENERAL DYNAMICS Fort Worth Division
r e s t r i c t i o n . I n any case , t h e thermocouples were loca ted 180°
from t h e i n t e r n a l ladder .
The tank had a catwalk mounted across the open top. This
w a s intended f o r use i n mounting instrumentat ion, as a work
platform f o r inducing s t r a t i f i c a t i o n p r i o r t o t e s t s , and as an
observat ion platform during tes ts . Figure 2 shows a plan of
t he t es t tank and a s soc ia t ed instrumentat ion.
2 . 3 . 2 Flow System
The flow system cons is ted of t h e a x i a l j e t flow loop and
t h e ho t water supply f o r s t r a t i f i c a t i o n development p r i o r t o
mixing. The h o t water supply w a s a po r t ab le system t h a t was
removed p r i o r t o mixing. The a x i a l j e t flow loop was a f ixed
system.
The a x i a l j e t flow loop cons i s t ed of t h e pump, nozzle,
a s soc ia t ed p ip ing and valves , and flow measurement devices .
The a x i a l j e t nozzle was mounted on t h e cen te r of t h e tank
bottom and d i r e c t e d flow up t h e tank c e n t e r l i n e toward t h e
l i q u i d su r face . Two interchangeable nozzles were used, w i th
diameters of 0.875 and 0.625 inches, r e spec t ive ly . These were
commercial founta in nozzles designed t o produce a v e r t i c a l j e t
of water.
i n t ake loca ted on t h e cen te r of t h e tank bottom j u s t below the
The nozzle was suppl ied wi th water drawn i n t o an
15

GE
NE
RA
L D
YN
AM
ICS
Fort W
orth
Division
I n
I
U
T m
I
'd
16
GENERAL DYNAMICS Fort Worth Division
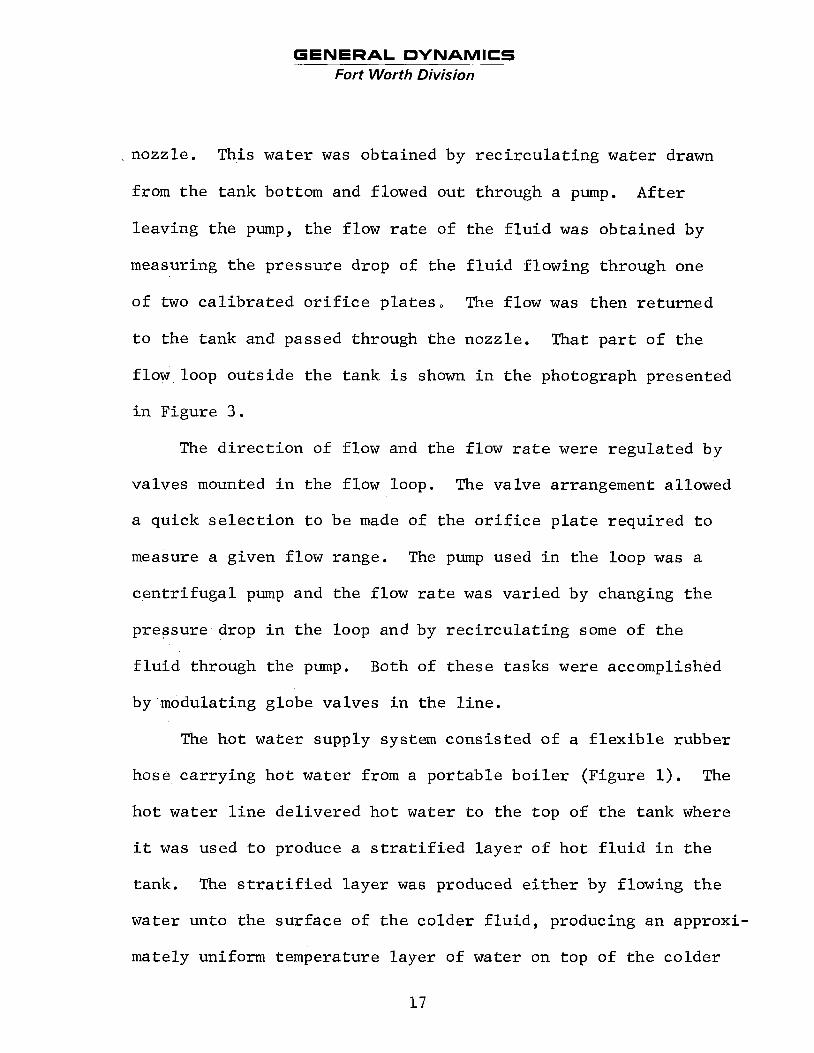
nozzle. This water was obtained by r e c i r c u l a t i n g water drawn
from t h e tank bottom and flowed out through a pump.
leaving t h e pump, t h e flow r a t e of the f l u i d w a s obtained by
measuring t h e pressure drop of t h e f l u i d flowing through one
of two c a l i b r a t e d o r i f i c e p l a t e s , The flow was then re turned
t o the tank and passed through t h e nozzle.
flow loop ou t s ide t h e tank i s shown i n t h e photograph presented
i n Figure 3 .
Afte r
That p a r t of t h e
The d i r e c t i o n of flow and the flow r a t e were regula ted by
valves mounted i n the flow loop. The valve arrangement allowed
a quick s e l e c t i o n t o be made of t h e o r i f i c e p la te requi red t o
measure a given flow range. The pump used i n t h e loop was a
c e n t r i f u g a l pump and t h e flow rate w a s var ied by changing t h e
pressure drop i n t h e loop and by r e c i r c u l a t i n g some of t h e
f l u i d through t h e pump. Both of t hese tasks were accomplished
by modulating globe valves i n the l i n e .
The h o t water supply system cons is ted of a f l e x i b l e rubber
hose car ry ing h o t water from a por tab le b o i l e r (Figure 1). The
h o t water l i n e de l ivered hot water t o the top of t he tank where
i t was used t o produce a s t r a t i f i e d l a y e r o f h o t f l u i d i n t h e
tank. The s t r a t i f i e d l a y e r w a s produced e i t h e r by flowing t h e
water unto t h e
mately uniform
su r face of t h e co lder f l u i d , producing an approxi-
temperature layer of water on top of t h e co lder
1 7
GE
NE
RA
L D
VN
AM
ICS
-
F~
rt
W
orth
BIvisio
n
a. 0
0
Qi
w
k w
18
GENERAL DYNAMICS Fort Worth Division
f l u i d , o r by mixing t h e ho t water wi th t h e co lde r f l u i d .
l a t t e r method produced a s t r a t i f i e d l a y e r t h a t was t h i c k e r and
had a d e f i n i t e temperature g rad ien t i n i t . Thickness of the
s t r a t i f i e d l a y e r w a s c o n t r o l l e d by t h e depth a t which t h e h o t
The
water entered t h e t e s t tank. Uniformity of t h e temperature a t
any depth was obtained by swi r l ing t h e h o t water l i n e around
t h e tank a t t h a t depth.
2 . 3 . 3 Instrumentat ion System
Two types of da ta w e r e obtained: water temperatures dur-
ing mixing and nozzle flow r a t e s . The temperature da ta were
obtained from thermocouples mounted i n t h e tank and recorded
on s t r i p c h a r t recorders . The flow rate w a s obtained from
o r i f i c e p l a t e pressure drop measurements made wi th mercury
manometers.
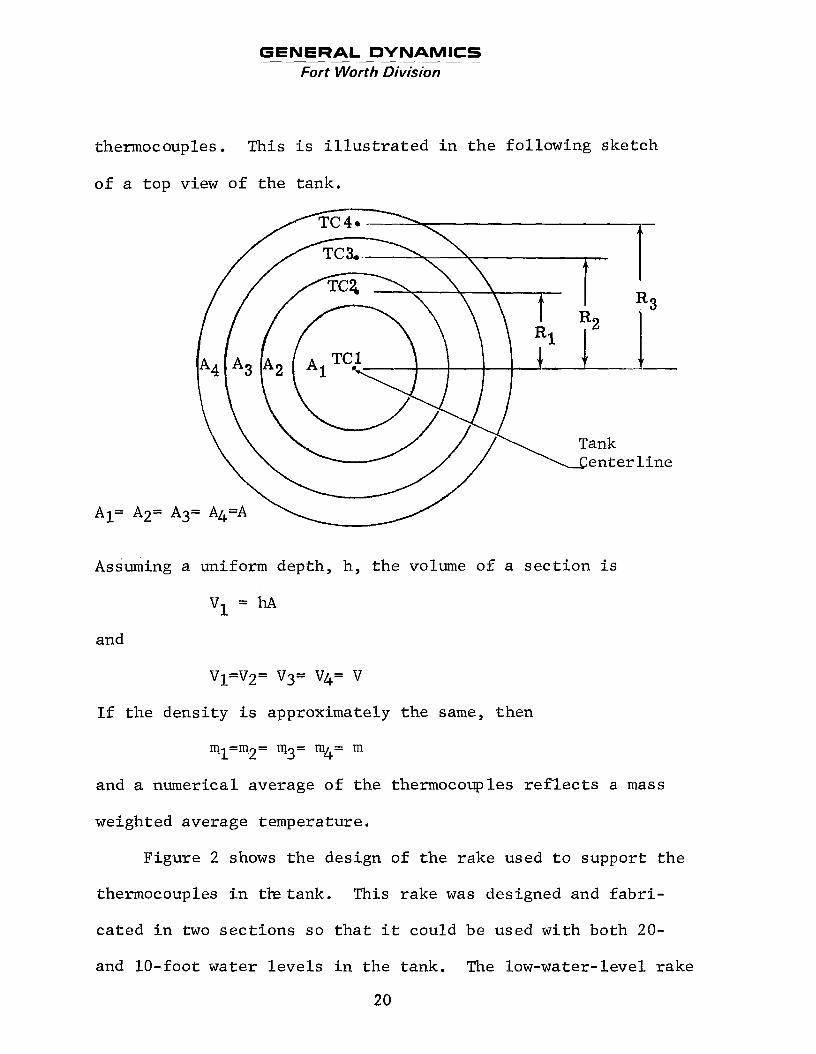
The thermocouples were mounted on a v e r t i c a l rake i n t h e
tank and wi th i t s arms arranged r a d i a l l y across one ha l f o f
t h e tank. Only one-half of t h e tank cross -sec t ion w a s used
s i n c e t h e flow and temperature condi t ions i n t h e tank were
considered t o be symmetrical. The thermocouples a t a given
depth i n t h e tank were arranged r a d i a l l y such t h a t equal-volume
annular s ec t ions were formed when t h e boundaries of t h e sec-
t i o n s were considered t o be a t one-half t h e d is tance between
1 9
GENERAL DYNAMICS Fort Worth Division
thermocouples. This i s i l l u s t r a t e d i n t h e following sketch
of a top view of t he tank.
Assuming a uniform depth, h, t h e volume of a s e c t i o n i s
v1 = hA
and
v1=v2= v3= v4= v
If the densi ty i s approximately t h e same, then
mal =m,2 = rq3= m4= m
and a numerical average of t h e thermocouples r e f l e c t s a mass
weighted average temperature.
Figure 2 shows t h e design of t he rake used t o support t h e
thermocouples i n t k t a n k . This rake was designed and f a b r i -
ca ted in two s e c t i o n s s o t h a t i t could be used wi th both 20-
and 10-foot water l e v e l s i n t h e tank. The low-water-level rake
20
GENERAL DYNAMICS Fort Worth Division
cons is ted of t h e upper h a l f of t h e 20-foot rake which was d i s -
connected and lowered i n t o p o s i t i o n f o r use. The d i s t r i b u t i o n of
t h e thermocouples was denser i n t h e top four f e e t of t he f l u i d
s i n c e major mixing e f f e c t s occur i n t h i s region. Below t h i s
l e v e l , t he number of thermocouples a t any given l e v e l decreases .
The use of thermocouples a t d i f f e r e n t l e v e l s i n t h e tank pro-
v ides a means of determining the s t r a t i f i c a t i o n thickness and
a l s o i n d i c a t e s t h e ex ten t of mixing. The rake support pole
w a s painted wi th a l t e r n a t e black and white s t r i p e s f o r use i n
determining l i q u i d depth i n the tank.
A t o t a l of 28 thermocouples were used i n the tank f o r t h e
20-foot depth and 22 f o r t h e 10-foot depth. These thermocouples
w e r e f ab r i ca t ed from 26-gauge copper-constantan w i r e .
thermocouple lead wires were covered with water - t igh t sh r ink
tubing and connected above t h e water wi th lead wires which
c a r r i e d t h e s i g n a l s t o t h e recorders .
The
The temperature recording devices were two Brown mult i -
po in t s t r i p c h a r t recorders which converted t h e thermocouple
s i g n a l s i n t o temperature readings. Since Ts and Tb were t h e
primary temperatures of i n t e r e s t , t h e thermocouples giving
these values were recorded on one recorder . A s a check,
measurements of t h e su r face and bottom water temperatures
were a l s o made wi th mercury thermometers a t t he s t a r t and
end of a mixing t e s t , 21
GENERAL DYNAMICS Fort Worth Division
The measurement of t he a x i a l j e t flow r a t e was accomplished
by measuring t h e pressure drop across an o r i f i c e p l a t e i n t h e
flow loop. Two o r i f i c e p l a t e s were used, depending on t h e
flow r a t e . Se l ec t ion of the proper p l a t e w a s made by s e t t i n g
valves i n the flow loop t o d i v e r t t h e flow through t h e p l a t e .
The p l a t e s were c a l i b r a t e d by phys ica l ly measuring t h e volume
of water flowing during a given t i m e per iod, c a l c u l a t i n g the
f low rate , and comparing it wi th t h e pressure drop. The
pressure drop ac ross an o r i f i c e p l a t e w a s measured by a c i s t e r n -
type 30-inch mercury manometer.
b ra t ed p r i o r t o use.
These manometers were c a l i -
2.4 TEST PROCEDURE
The t e s t s conducted during t h i s study were performed
t o s tudy a x i a l j e t mixing i n a la rge-sca le tank, Since the
c o r r e l a t i o n s made from t h e data taken i n these tests were t o
be compared with c o r r e l a t i o n s made i n previous small-scale
tes ts , the l a rge and small-scale t e s t procedures were similar.
The da ta taken during t h e t e s t s cons is ted of temperature
measurements as a func t ion of t i m e f o r var ious loca t ions i n
the f l u i d . The t e s t va r i ab le s cons is ted of flow r a t e , nozzle
s i z e , s t r a t i f i c a t i o n temperature, l i q u i d he ight above t h e
nozzle, and thickness of t he s t r a t i f i e d l aye r .
22
GENERAL DYNAMICS Fort Worth Division
Two water l e v e l s were used i n the t e s t s : 10 f e e t and 20
f e e t above t h e tank bottom. The water l e v e l above the nozzle
e x i t va r i ed somewhat owing t o the d i f f e r e n t he ights of the two
nozzles and t o t h e d i f f e r e n t plumbing arrangements t h a t were
used. These d i f f e rences were minor and d i d not compromise
comparisons.
Temperature d i f f e rences i n the f l u i d w e r e va r i ed a s r e -
qu i red t o produce t h e des i r ed values of N".
t he temperature d i f f e rences between t h e average su r face t e m -
pe ra tu re and t h e bulk o r bottom temperatures va r i ed between
approximately 2 and 90°F.
P r i o r t o mixing, i
The thickness of t h e s t r a t i f i e d l aye r var ied from about
0 ,5 t o 19.5 f e e t . This v a r i a b l e could no t be p r e c i s e l y con-
t r o l l e d except f o r t h e th inner l aye r s w i th maximum thicknesses
of about 2 t o 3 feet . Inducing a s t r a t i f i e d l aye r t h i c k e r
than t h i s value requi red r a t h e r crude methods of operat ion.
This involved suspending t h e hot water l i n e i n t o t h e tank and
slowly swi r l ing i t around i n t h e tank f l u i d a t a depth of
about 18 inches above t h e poin t a t which s t r a t i f i c a t i o n w a s
des i r ed t o begin. If t h e b o i l e r inadver ten t ly produced wet
o r dry steam r a t h e r than water a t any time during t h i s opera-
t i on , t h e s t r a t i f i e d depth would d r a s t i c a l l y increase because
t h e steam penetrated deeper i n t o t h e bulk f l u i d than d id t h e
23

GENERAL DYNAMICS Fort Worth Division
water. This could no t a lways be determined immediately and
cor rec ted . Consequently, t h e s t r a t i f i c a t i o n thickness o f t e n
var ied considerably from the intended value.
The a x i a l j e t flow rates were s e t p r i o r t o each t e s t run.
The flow r a t e s were based on t h e previous small-tank para-
meters and t h e new tank and nozzle dimensions.
t hese flow r a t e s w a s from 11.7 t o 136.5 gpm.
The range of
Af te r a s e t of t e s t condi t ions were se l ec t ed wi th in t h e
range of a v a i l a b l e v a r i a b l e s , t h e mixing t e s t procedure w a s
performed a s follows :
1.
2.
3.
4 .
5.
F i l l t h e tank t o the des i r ed water l e v e l a f t e r i n - s t a l l i n g t h e des i red nozzle. Pos i t ion t h e flow loop valves t o produce des i r ed flow loop c i r c u i t .
S e t t h e des i r ed a x i a l j e t flow r a t e by use of t h e modulating valves and thoroughly pre-mix t h e tank f l u i d u n t i l no measurable temperature d i f f e rence i s observed. t o subside i n t h e tank.
Then s t o p mixing and allow f l u i d movement
Induce a s t r a t i f i e d layer i n t o t h e tank f l u i d by flowing h o t water onto o r i n t o t h e top l a y e r of water. Drain water from t h e tank i f necessary t o c o r r e c t an increase i n the water l e v e l . Remove hot water l i n e from t h e tank.
Mix tank f l u i d and record temperature a t t h e various tank pos i t i ons by use of mul t ipo in t s t r i p - c h a r t recorders .
Terminate t e s t when temperature d i f f e rence between the su r face and the bottom f l u i d becomes n e g l i g i b l e and appears t o have reached a s t eady- s t a t e condi t ion.
These s t eps were followed i n a l l t he j e t mixing t e s t s except
24
GENERAL DYNAMICS Fort Worth Division
t h a t , i n a c t u a l p r a c t i c e , t h e tank was seldom drained between
t e s t s .
The movement of t h e j e t a t t h e beginning of mixing w a s
observed by not ing t h e t i m e requi red f o r motion t o appear on
t h e l i q u i d sur face . This enabled t h e t ime f o r t he j e t t o
t r a v e l t h e length of t h e tank and pene t r a t e t h e s t r a t i f i e d
l aye r t o be determined.
The des i r ed la rge-sca le tank operat ing condi t ions a r e
summarized i n Figure 4 .
procedure f o r these tes ts i s presented i n Figure 5. The
a c t u a l operat ing condi t ions a r e given i n Table 1 of Volume 11,
A flow diagram of t h e general t e s t
2.5 EXPERIMENTAL DATA
The experimental da ta obtained i n t h e large- tank t e s t s
during t h i s study c o n s i s t of f l u i d temperatures as a func t ion
of t i m e f o r var ious pos i t i ons i n t h e tank and a l imi t ed amount
of j e t t r a n s i t time da ta , The temperature da ta are concerned
e n t i r e l y wi th mixing and do n o t include any s t r a t i f i c a t i o n
development da ta . The r e s u l t s of 52 tes ts a r e repor ted . The
temperature da ta a r e shown separately i n Volume I1 s ince t h e
l a r g e amount of da ta i s unwieldy. Sample temperature da ta a r e
shown i n t h i s volume f o r d i scuss ion and a r e r ep resen ta t ive of
the bulk of t he data .
25

GE
NE
RA
L D
YN
AM
ICS
F
ort W
orth
Division
m
c 0
.A
U
*d
a c 0
V
eo G *I4
U
(d
k al
d
26

GE
NE
RA
L D
YN
AM
ICS
Fort W
orth
Division
G
al
..
al 3' 1.
m
u vl
PI W al
rl
a 0 v)
1
6 bn k
a t4 k 0
w al k 1
a aJ
t) 0
k
PI u m al
I3
27
GENERAL DYNAMICS Fort Worth Division
2.5.1 Temperature Mixing Data
The temperature data obtained during the mixing of the
thermal stratification consist of temperatures as a function
of time for various positions in the tank. These positions
are detailed in Figure 2 as numbered positions on the thermo-
couple rake. Although data were obtained throughout the tank,
only the temperatures of the liquid surface and bottom are
used in the correlations presented in Section 3.
ing data points are used to determine the stratification depth
and the extent of mixing during the test.
The remain-
The temperature data from the thermocouples immediately
below the liquid surface are especially important since, in
a closed tank, the ullage pressure is directly related to the
surface temperature of the liquid. Consequently, the surface
temperature is of major concern in a stratification mixing
study. The stratification in the tank is usually considered
to be given by
Tstrat = Ts - Tb The surface temperature undergoes some extreme fluctua-
tions almost as soon as the mixing begins. The slight delay
is due to the jet transit time and the retardation of the jet
penetrating the stratified layer, caused by buoyancy forces.
These fluctuations are transient in nature and are due t o the
28
GENERAL DYNAMICS Fort Worth Division
cool jet flowing across the liquid surface and, then, the warm
fluid being entrained in the cooler jet as the stratified layer
begins to mix.
surface can vary considerably, a s shown in Figure 6. In this
figure, the temperature at the tank centerline when mixing
begins (where the jet impinges first on the surface) is much
lower than the surrounding surface because of the cool jet.
A s mixing progresses, the surrounding surface temperatures
also decrease because of the cooler fluid flowing radially
across the tank surface toward the wall. The cooler fluid
displaces warmer fluid and creates turbulence near the wall.
A s the warmer fluid is displaced, some of it is intrained
into 'the jet. This raises the temperature of the jet and
there is a partial recovery of the surface temperature. After
the initial sharp transients, the temperature gradually decays
until it reaches the mean temperature in the tank. This is
the general mode of mixing in the tank.
the jet momentum is insufficient to immediately penetrate the
stratified layer, there is a time period during which the jet
slowly erodes away the bottom of the stratified layer as it
impinges on it.
perature variations at the center of the surface as the jet
The temperature at any given point on the
In a few cases, where
This action may also result in transient tem-
partially penetrates and then is repulsed by the buoyancy of
29

GENERAL DYNAMICS Fort Worth Division
Radial Distance From Tank Centerline, f t
Figure 6 Large-Scale Tank Surface Temperature Variation During Mixing: Run 49
' 130
GENERAL DYNAMICS Fort Worth Division
the stratified layer. Once a permanent penetration is obtained
the temperature history is much the same as that of the pre-
viously described case.
The surface temperature variations can be large, and an
average value of the surface temperature is useful to describe
the surface mixing since it provides a good indication of the
overall condition of the surface. This is especially true
when the stratified layer initially begins to mix as a result
of the axial jet impinging on the interface, since a large
temperature gradient can exist across the liquid surface as
cool fluid flows radially outward the wall. An average value
was obtained from the temperature data by numerically averaging
the output of the four surface thermocouples. This numerical
average assumes that each thermocouple represents the tempera-
ture of an equal volume of fluid at a uniform temperature. The
thermocouples were positioned such that equal-volume annular
sections are obtained when boundaries between sections are
located halfway between adjacent thermocouples. This also
assumes that the flow in the tank is symmetrical about the
tank centerline. This average surface temperature is one type
of data presented.
A second type of temperature data presented is the surface
. This is the point TS 1 temperature at the tank centerline,
31
GENERAL DYNAMICS Fort Worth Division
at which the surface temperature initially begins to decrease;
it is subjected to wider variations in temperature than are
the other surface locations. Therefore it provides a good
indication of when the jet penetrates the stratified layer and
tank mixing begins. This temperature also provides an indica-
tion of either a sharp and complete penetration or a gradual
penetration characterized by the jet slowly eroding away the
stratified layer.
The third type of data presented is the fluid temperature
at the nozzle exit, Tb.
surface temperature reflects the temperature gradient between
This temperature subtracted from a
the surface and the tank bottom. The bottom temperature re-
mains almost constant until the final phase of mixing. At this
time it begins to slowly increase until it reaches equilibrium
with the mean temperature of the tank fluid.
The mean temperature of the fluid is the average tempera-
ture of the fluid, Since for practical purposes no heat is
added to or removed from the tank during mixing, the mean
temperature of the fluid is constant during a given mixing test.
Therefore the value of the mean temperature was taken as the
temperature of the fluid at the end of mixing when the tempera-
ture is uniform in the tank, The difference between the sur-
face temperature and the mean temperature reflects the extent
to which the surface can be cooled by mixing.
32
GENERAL DYNAMICS Fort Worth Division
Figure 7 shows a typical set of data obtained during a
mixing test. The centerline surface-temperature data points
are not connected in order to avoid confusion on the graph
when the centerline surface temperature becomes equal to the
average surface temperature.
The temperature data reflect the variables of water depth
above the nozzle, flow rate, nozzle diameter, stratification
temperature difference, and stratification thickness. Because
of the number of variables, it is difficult to make comparisons
of individual tests. The difference in tank size between the
large-and small-tank tests prevent direct comparison of the
two types of data. However, a most important observation is
that the fluid is always thoroughly mixed, using flow rates
which are predicted by scaling-up the small-scale-tank flow
rates. This gives a preliminary confirmation of the validity
of applying mixing parameters developed from small-scale
data to the design of mixer systems for full-scale tanks.
2.5.2 Jet Motion Data
The axial jet motion data obtained during these tests
provide data on the transit time of a jet in a large tank.
The data were obtained by visually observing the surface of the
fluid after turning on the pump and noting the time at which
33
B ad
HH
I
I
BO
an
H
H
II
a
0
GE
NE
RA
L D
YN
AM
ICS
F
ort W
orth
Divisio
n
__
__
_~
3
oa
L
3b
D
U
n
0
0
0
0
.. 0
d
co 0
4
U
id c) 0
4
0
rer b
0
In
34
GENERAL DYNAMICS Fort Worth Division
motion began. The time interval between turning the mixer
on and the beginning of surface motion i s the j e t t r a n s i t
time, Data were taken for both s t r a t i f i e d and uns t r a t i f i ed
cases.
The i n i t i a l motion of the surface was a s l i g h t upwelling
of water. The magnitude of the upwelling appeared t o be a
function of both flow r a t e and l iquid height; however, t h i s
was a subjective judgement and w a s not confirmed by measure-
ments. The i n i t i a l surface motion w a s c i rcular i n shape,
indicating tha t the j e t retained i t s shape while passing
through the s t r a t i f i e d layer.
Table 2 contains the j e t motion data obtained during the
t e s t se r ies . The data without run numbers are from t e s t s
conducted without s t r a t i f i ca t ion . The t e s t s with the thick
s t r a t i f i c a t i o n of 9.5 f ee t did not reveal a uniform temperature
i n the s t r a t i f i e d layer. Instead, the temperature gradient
across the layer w a s large i n each case.
35

GE
NE
RA
L D
YN
AM
ICS
F
ort W
orth
Divisio
n
rn N
H
P
c N
f3’
0
n 0
a
0
a
rl
m
cn . 0
00 rl
hl
00 rl . m
hl a
0
0
0 a . 0
N
0
0
rl . m
cn . b
rl
d
N
00 rl
m
N a
0
m
m
0
Cn . hl hl
0
0
rl . m
cn . m
b . hl
00 rl . m
hl \o
0
m
cn 00 . m
hl
0
m
m
m
cn
m
m
hl
00 rl . m
cv a
0 . it
00 hl . m
hl
0
m
m . 0
0 . 0
0 . hl
00 rl
m
hl a
0 . 0
0
m . a
hl
0
e\l m
m
rl
m
rl . c\l
00 d
m
hl a
0
0
0
m . b
hl
0
m
m
m
m . m
it
hl
00 rl
m
hl a
0
m
\o
cv . 00 hl
0
0
it
0
0
0
0 . hl
00 rl . m
hl a
0 . a
it
hl . rl
m
0
u3 it
0
0
0
0
hl
00 rl . m
hl u3
0 . 0
0
c\l I I
0
b
m . 0
0 . 0
0
hl
00 rl
m
hl a
0 . 0
m
N I I
0
m
rl . 0
0 . 6,
0
m
00 rl
m
b
00
0 . 0
hl rl
rl .
0
hl rl . 0
0 . 0
0
m
00 rl . m
b
00
0
0
0
0
rl
0
00 rl . 0
0 . 0
0 . m
00
rl . rn
b
00
0
m
rl
co
0
0
hl
0
0 . 0
0
m
00 4 . rn
r- co 0
. 0
m a
0
I4
m
0
0
0
0 . m
00 rl
m
b
00
0 . m
0
it .
I I
I I
I I
I I
I I
36
GENERAL DYN'AMICS Fort Worth. Division
S E C T I O N 3
E X P E R I M E N T A L A N D A N A L Y T I C A L
D A T A C O R R E L A T I O N S
Large-scale experimental data correlations and the com-
parisons of these correlations with analytical predictions
are presented in this section. The correlations consist of
the transient data correlations for individual tests , the
general correlations made from the collective data, and the
jet motion correlations.
The transient data correlations consist of the dimen-
sionless temperature decay during mixing and the energy dis-
tribution during mixing (energy integral) . Only representa-
tive transient data are shown in this section because of the
large amount of data obtained during these tests. All of the
transient data are documented in Volume 11.
The general correlations determined from the collective
transient data and the jet motion data were used to summarize
the following areas of investigation:
1. Transit time of the axial jet from the nozzle exit to the liquid/vapor interface.
2. Effect of buoyancy on mixing.
3 . Mixing time of the axial jet mixer.
37
GENERAL DYNAMICS Fort Worth Division
3 . 1 TRANSIENT DATA CORRELATIONS
The transient data correlations presented in Volume I1
consist of three forms of the dimensionless temperature decay
and the energy integral as a function of dimensionless time.
3 . 1 . 1 Transient Dimensionless Temperature Correlations
In order to make meaningful comparisons between mixing
tests with different stratification levels it is convenient
to reduce the temperature differences to a dimensionless quantity
referenced to the initial stratification when mixing began.
This quantity, represented by
reflects the stratification remaining in the fluid at any
time. Presenting AT/AT~ as a function of a dimensionless time,
given by
enables the other test variables to be considered.
The primary problem in using this type of correlation is
establishing the time that the tank fluid begins to mix. In
this study, mixing is assumed to begin when the surface temper-
ature begins to drop rather than when the mixer is turned on.
38
GENERAL DYNAMICS Fort Worth Division
This mixing time is referred to as el. these two occurrences consists of the transit time of the jet
The time interval between
plus the delay in mixing due to the buoyancy of the stratified
layer retarding the penetration of the cool jet to the surface.
The following sketch shows the relationship between 8 and Q1
Time
Three forms of the dimensionless temperature are shown in
Volume 11. These are
m T - T S
and T - T
b 1 S
39
GENERAL DYNAMICS Fort Worth Division
The use of the average surface temperature, Ts, in the correla-
tions provides a good indication of the overall mixing of the
surface layer. This form of the correlation tends to moderate
the wide variations of temperature that occur at the tank centerline
when mixing begins. The use of the centerline surface tempera-
in the correlations shows this initial variation Sl’
ture, T
better. However, this type of correlation indicates that mixing
occurs faster than it actually does at the beginning of the
test. Therefore the data for the general correlations are
based on the average surface temperature. The temperature at
the nozzle exit subtracted from the surface temperature reflects
the total temperature gradient in the tank and provides an
easily determined value of existing stratification. The use
of the mean fluid temperature, Tm, in the correlations reflects
the extent that the surface temperature has departed from tank
equilibrium conditions.
Also shown on the transient temperature decay correlations
The terms Zb/Do and Zb/Dt reflect the geometry of the tank and
is the Reynolds number of the axial jet as it -1, ,. NRe nozzle.
emerges from the nozzle. Ni is the ratio of the modified
Grashof number to the square of the jet Reynolds number, given
40
GENERAL DYNAMICS Fort Worth Division
where
g = Acceleration
P = Coefficient of thermal expansion
(Ts-Tb> = Initial temperature stratification
= Liquid depth above the nozzle ‘b Vo = Nozzle exit velocity
= Nozzle exit diameter. DO
VoDo (e-el)/Dt2 is the dimensionless time interval, consisting
of the jet transit time and the buoyancy effect,
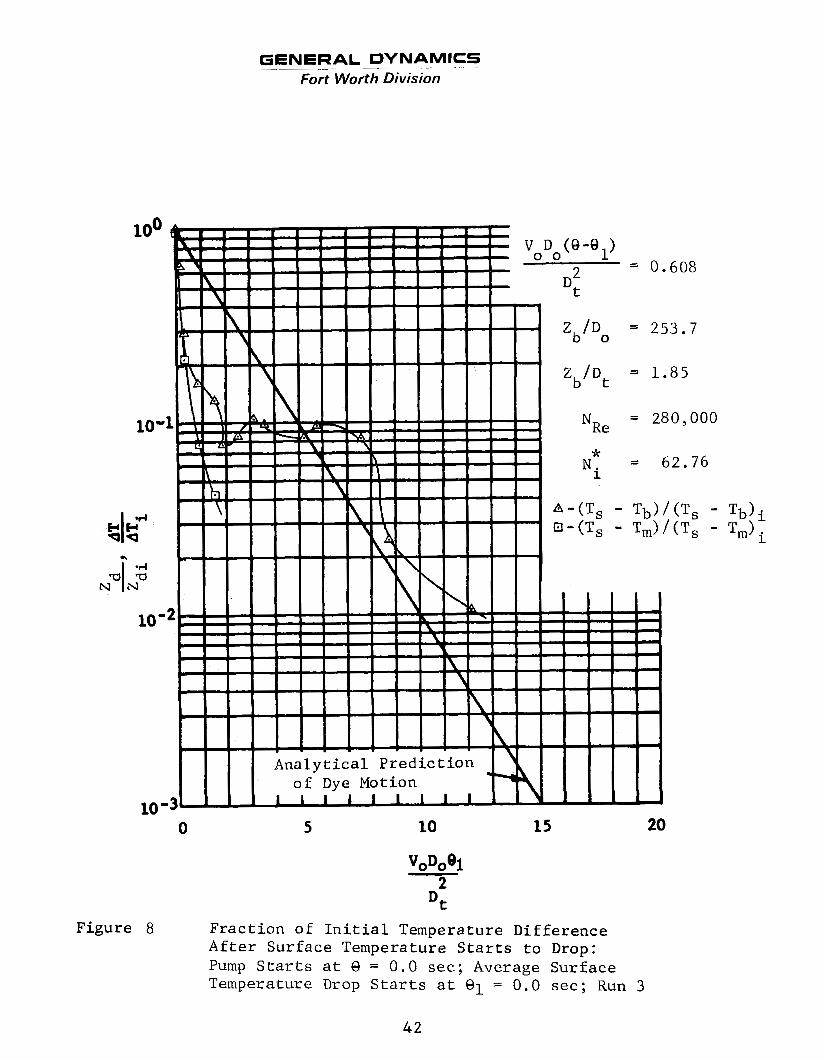
In Figure 8 a correlation is shown for a typical mixing
the correlation (T
An analytical prediction of mixing from Reference 2 is shown
for comparison. This analytical prediction, based on dye obser-
vations o f the bulk’ fluid motion during the small-scale tests,
-Tb)/(Tsl-Tb)i is shown for the same test. S1
is given by
‘d
‘b”i ‘d = - - c*e zb-z
.e - =
i
where -1,
C ‘’ 0.404 P 2
Dt Do 41
GENERAL DYNAMICS Fort Worth Division
- ~
I
I
0.608
1- Z /D =
b o 253.7
1.85
280,000
62.76
--
I
t
I I
\
Ana 1 y t i c a l P red ic t ion
1 1 1 1 1 1 1 1 1
1
o f Dye Motion
- VDt I
L N* - i
- I
f
\ - 10 -3 0 20
3
5 LO 15
D f Figure 8 Fract ion of I n i t i a l Temperature Difference
After Surface Temperature S t a r t s t o Drop: Pump Starts at 9 = 0.0 sec; Average Surface Temperature Drop S t a r t s at 81 = 0.0 s e c ; Run
42
GENERAL DYNAMICS Fort Worth Division
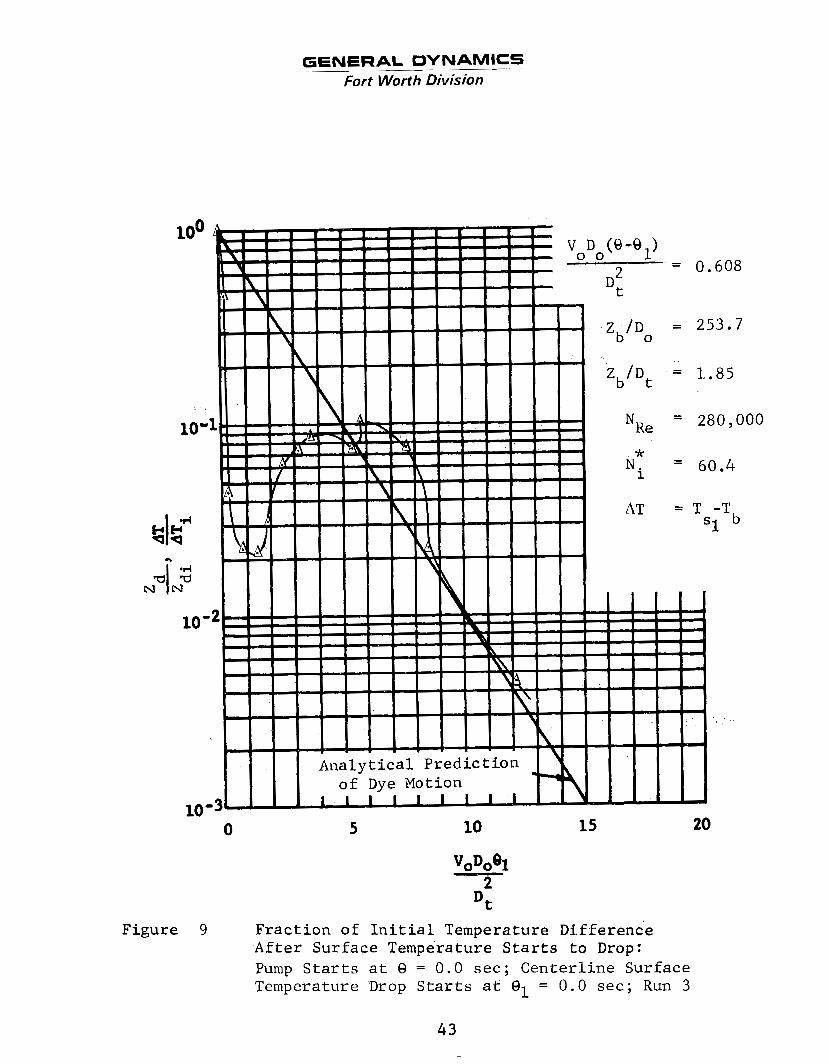
10 -3 I€ 0
Z / D b o
VDt N R e
N* i
AT
0.608
253.7
1.85
280,000
60.4
b = T -T
5 10
"OD,%
Dt 2
15 20
Figure 9 Fract ion of I n i t i a l Temperature Difference Af te r Surface Temperature S t a r t s t o Drop: Pump S t a r t s a t 8 = 0.0 sec ; Center l ine Surface Temperature Drop S t a r t s a t = 0.0 sec ; Run 3
4 3
GENERAL DYNAMICS Fort Worth Division
- -~
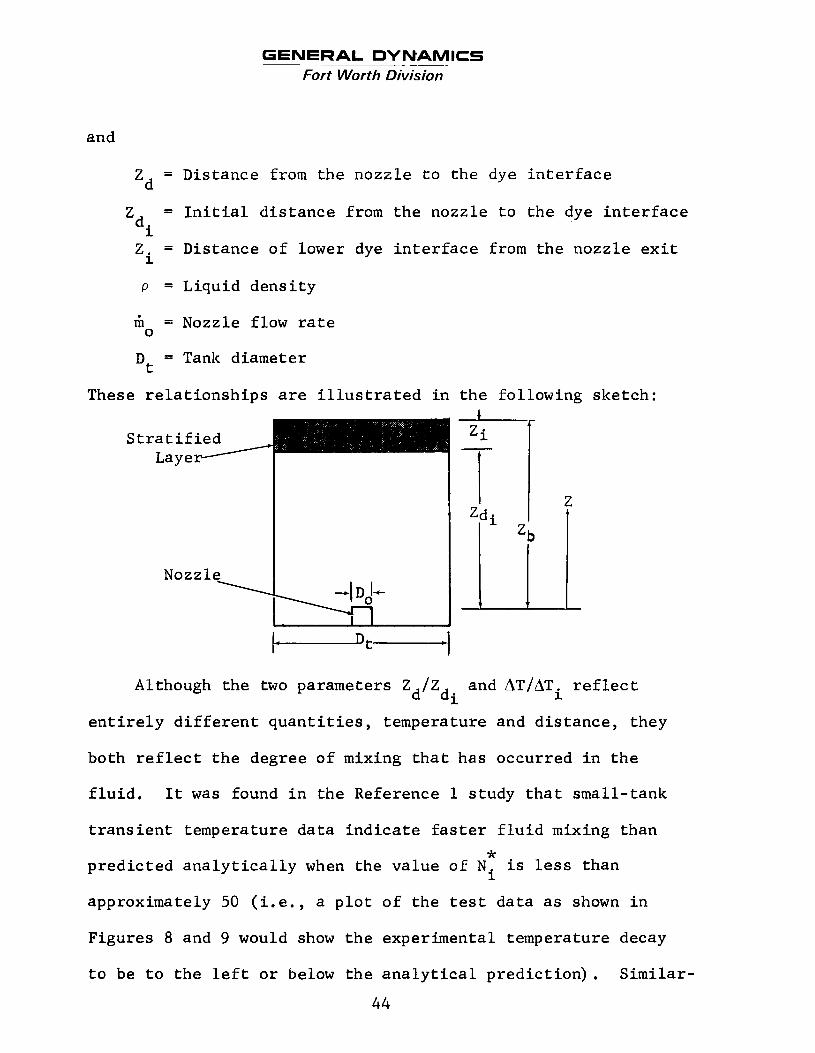
and
= Distance from the nozzle t o t he dye i n t e r f a c e ‘d
Z = I n i t i a l d i s t a n c e from t h e nozzle t o the dye i n t e r f a c e d: 2 = Distance of lower dye i n t e r f a c e from the nozzle e x i t i
P = Liquid dens i ty
& = Nozzle flow ra te
= Tank diameter
0
Dt
These r e l a t i o n s h i p s are i l l u s t r a t e d i n t h e following sketch:
Although t h e two parameters Z / Z and AT/ATi ref lect d d i
e n t i r e l y d i f f e r e n t q u a n t i t i e s , temperature and d i s t ance , they
both re f lec t t h e degree of mixing t h a t has occurred i n t h e
f l u i d . It w a s found i n the Reference 1 study t h a t small-tank
t r a n s i e n t temperature da ta i n d i c a t e fas te r f l u i d mixing than *
pred ic t ed a n a l y t i c a l l y when the va lue of Ni i s less than
approximately 50 ( i . e . , a p l o t o f t h e tes t da ta as shown i n
Figures 8 and 9 would show t h e experimental temperature decay
t o be t o t h e l e f t o r below t h e a n a l y t i c a l p red ic t ion ) . S imi la r -
44
GENERAL DYNAMICS Fort Worth Division
;k ly when Ni i s greater than approximately 50, the t ransient
temperature decay i n the small-scale t e s t tanks w i l l occur
slower than predicted analyt ical ly ,
many Qf the large-scale t e s t s , although there were many impor-
This condition held for
cant exceptions.
Ni greater than 50, i n which observed mixing was less than or
approximately the same as tha t predicted. There were, however,
some t e s t s with values of NT l ess than 50 i n which mixing was
slower than predicted.
These included most ly t e s t s with values of *
1
* Since the t rans i t ion value of Ni = 50 i s an approximate
value a t best and intended Qnly for use i n making i n i t i a l
estimates of mixing, some variations from the norm should be
expected. However, checking the data showed t h a t the r a t i o
of s t r a t i f i c a t i o n thickness t o l iquid depth above the nozzle,
Zs /Zb, was often quite different f o r the various t e s t s ,
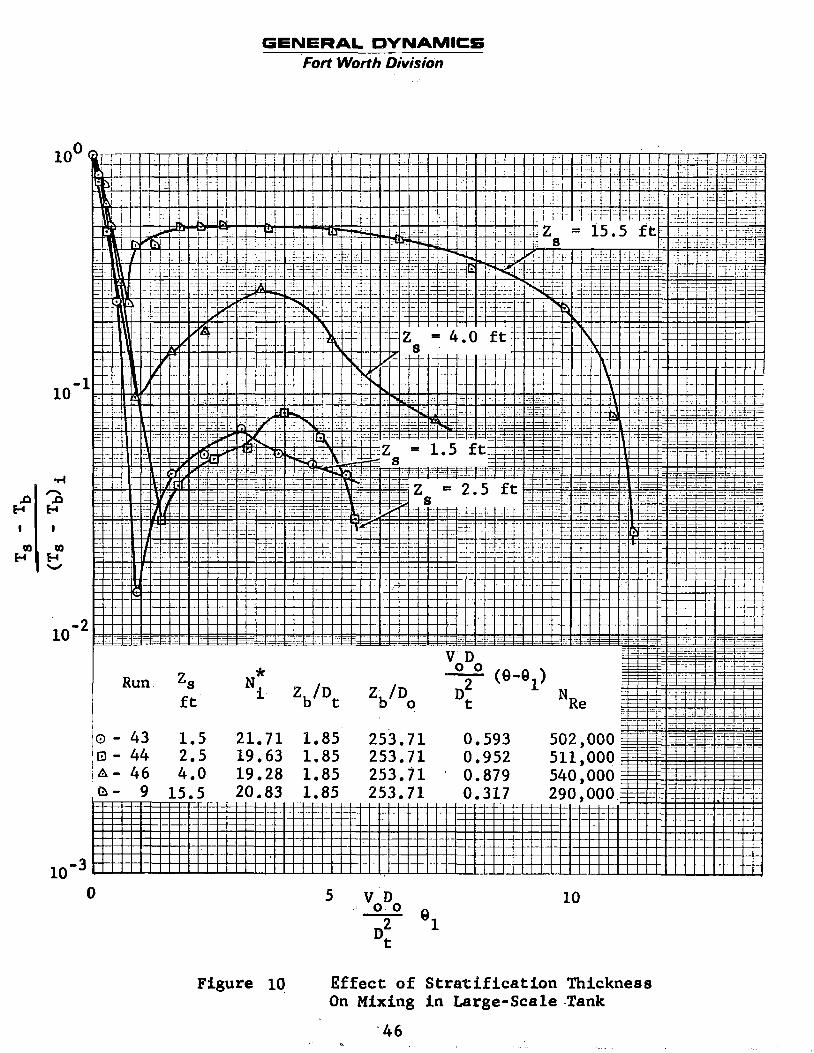
data shown i n Figure 10 i l l u s t r a t e the r e s u l t s of varying
s t r a t i f i c a t i o n depth for constant Zb/Do and Zb/Dt and approxi-
mately constant N". These data show a def in i te trend toward
longer mixing times as the s t r a t i f i e d layer thickness i s in-
The
.
i
creased. There i s a l so a noticeable decrease i n the i n i t i a l
sharp temperature drop when the s t r a t i f i c a t i o n thickness in-
creases. However, the r a t e a t which the temperature decay
i n i t i a l l y occurs appears t o be the same. The percentage of
45
6ENERAL DYNAMICS ~~~ ~
Fort Worth Division
- "oDo 10
Figure 10 Effect of Stratif icat ion Thickness On Mixing in Large-Scale .Tank
GENERAL DYNAMICS Fort Worth Division
temperature recovery is also much smaller for the thin strati-
fied layers than for the thick layers.
In general, experimental mixing occurs faster than pre- ik .I, ,,
dicted for Ni< 50 and slower than predicted for Ni > 50.
observation is applicable for ratios of zs/zb< 0.3.
This
The
analytical prediction generally agrees with the mixing data
for at least part of the mixing time and gives conservative
values unless the stratified thickness is large, The common
behavior of the dimensionless temperature data is initially
to decay sharply, followed by a stratification recovery, and
then to decay gradually, which parallels the analytical pre-
diction. There is often a time period in which the stratifica-
tion remains more or less constant as the temperature of the
fluid around the nozzle is slowly increased to the mean fluid
temperature.
Since small errors in the data can cause large errors in
the correlations, it is valuable to know what the possible
error sources are and when they occur in order to reduce their
effect. The most significant error sources are due to discre-
pancies in reading values of data points, linear interpolation
between data points to normalize data to a specific time, and
the lag in response of the thermocouples to a temperature
change. Discrepancies in reading values of data points be-
come significant when the stratified level is small. This 47
GENERAL DYNAMICS Fort Worth Division
occurs at the end of a l l runs and during the entire test for
runs with small initial temperature differences. In general,
when the temperature differences are less than 1°F the data
become questionable. Errors in the data due to linear inter-
polation between data points are most severe when large temper-
ature changes are rapidly occuring. This is a characteristic
of the time of initial penetration of the stratified layer by
the jet. The lag in thermocouple response also creates errors
when temperature changes occur rapidly. An analysis is pre-
sented in Appendix A for a model of the initial dimensionless
temperature decay which approximates many of the results.
This model indicates that the maximum error due to the lag
in response will occur at the time the fluid begins to mix.
This is also the time of the fastest temperature decay in the
same area. All of these observations indicate that errors
are most likely to occur at the beginning of mixing.
The results of the dimensionless temperature correlations
will be used to make more general correlations; however,
several points can be made about them now. Probably the most
important observation that can be made from a survey of the
correlations is that the analytical prediction is not always
a good indicator of how mixing takes place. It appears to be
a conservative prediction as long as the stratification depth
48
GENERAL DYNAMICS Fort Worth Division
is moderate or the temperature gradients across the stratified
layer are steep.
with moderate sidewall or ullage heating.
The last case is common in cryogenic tanks
3.1.2 Energy Integral
The energy integral, defined as
is a measure of the energy distribution in the tank. This term,
primarily determined as an intermediate step in the calculation
of other parameters, is also a useful indicator of mixing in
the tank.
The initial value of the energy integral, ImiJ depends on
the type of stratification. When I is 0.0, the mean tank
temperature is equal to the bottom temperature, and the
thermally stratified layer is either a very thin uniform layer
mi
or a thick layer with a sharp temperature gradient. Larger
values of I, (0 < I
A s the tank fluid is mixed, the energy is distributed more
evenly and 1, approaches 1.
in which the energy integral becomes greater than 1 as a result
of the cool jet penetrating the stratified layer and flowing
fluid with a temperature below Tm across the surface.
<1) indicate a thicker stratified layer i mi
There may be a transient period
This
49

GENERAL DYNAMICS Fort Worth Division
is always a very short-lived phenomenon and is associated with
the initial sharp temperature drop seen in the dimensionless
temperature correlations.
this period are not always dependable, since the temperature
The values calculated for 1, during
differences can be small and slight errors in temperature
values result in large changes in I . This situation also
exists to a lesser extent as the fluid is approaching a mixed
condition and I approaches 1. When I, is 1.0, the fluid is
completely mixed.
m
m
Comparison of the values of I with the transient tem- mi
mi perature correlations indicate that runs with values of I
that were less than 0.2 tended to undergo faster mixing than
predicted analytically.
Figure 11 shows a typical correlation o f Im versus 2 VoDoB/Dt . This run had a brief period of inverse stratifica-
tion,
3 . 2 LARGE-SCALE DATA CORRELATIONS
The correlations of the large-scale data consist of corre-
lations of jet transit time, correlations demonstrating the
effect of buoyancy on mixing, and correlations of the mixing
time of the axial jet mixer. With the exception of the jet
transient time correlations, the correlations shown are based
on the transient dimensionless temperature correlations dis- 50
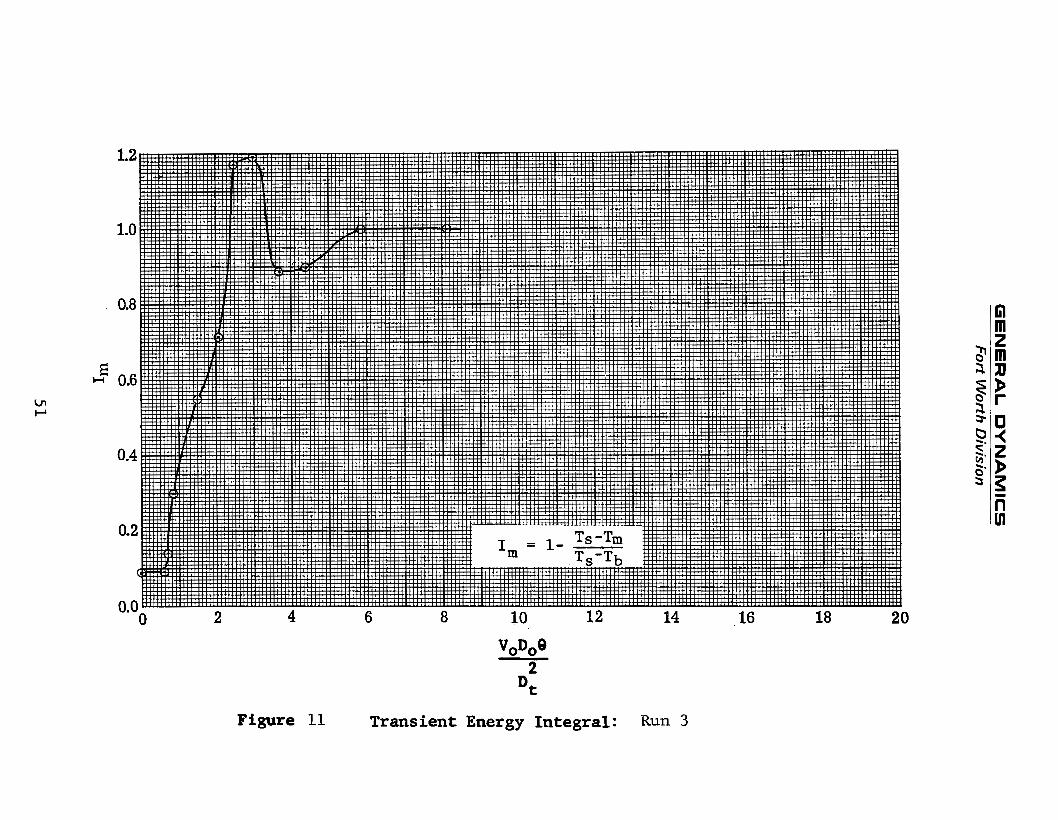
GE
NE
RA
L D
YN
AM
ICS
F
ort W
orth
Divisio
n
J
.. r(
a k M
al U
E H
h
bo k
51
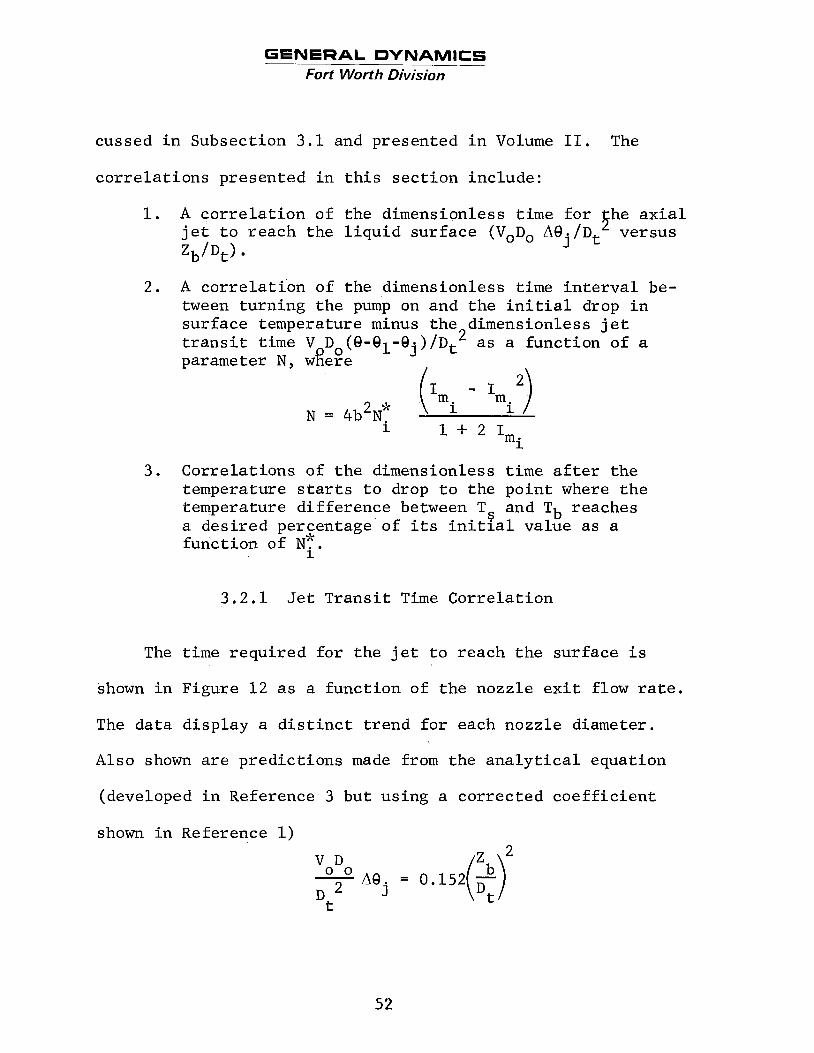
GENERAL DYNAMICS Fort Worth Division
cussed in Subsection 3 . 1 and presented in Volume 11. The
correlations presented in this section include:
1. A correlation of the dimensionless time for he axial jet to reach the liquid surface (VoDo AQ./Dt5 versus
J zb/Dt>
2 . A correlation of the dimensionless time interval be- tween turning the pump on and the initial drop in surface temperature minus the dimensionless jet transit time V Do(Q-Ql-ej)/Dt2 as a function of a parameter N , wRere
2 7k N = 4 b N i 1 + 2 I
mi 3 . Correlations of the dimensionless time after the
and Tb reaches temperature starts to drop to the point where the temperature difference between T a desired percentage of its initial value as a function o f N;.
8
3 . 2 . 1 Jet Transit Time Correlation
The time required for the jet to reach the surface is
shown in Figure 1 2 as a function of the nozzle exit flow rate.
The data display a distinct trend for each nozzle diameter.
A l s o shown are predictions made from the analytical equation
(developed in Reference 3 but using a corrected coefficient
shown in Reference 1) 2 V D
D 2 0 0 AQj = 0.152[$) t
52
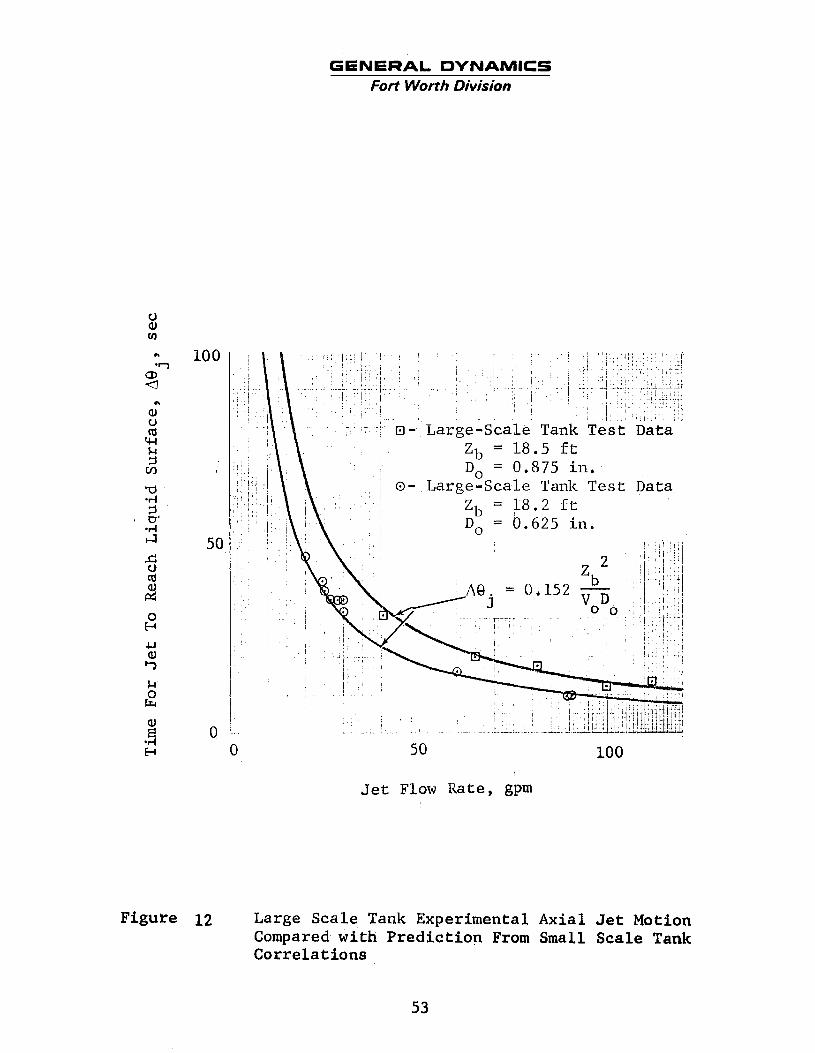
10 0
50
0
GENERAL DYNAMICS Fort Worth Division
100 0 50
Jet Flow Rate, gpm
Figure 12 Large Scale Tank Experimental Axial Jet Motion Compared with Prediction From Small Scale Tank Correlations
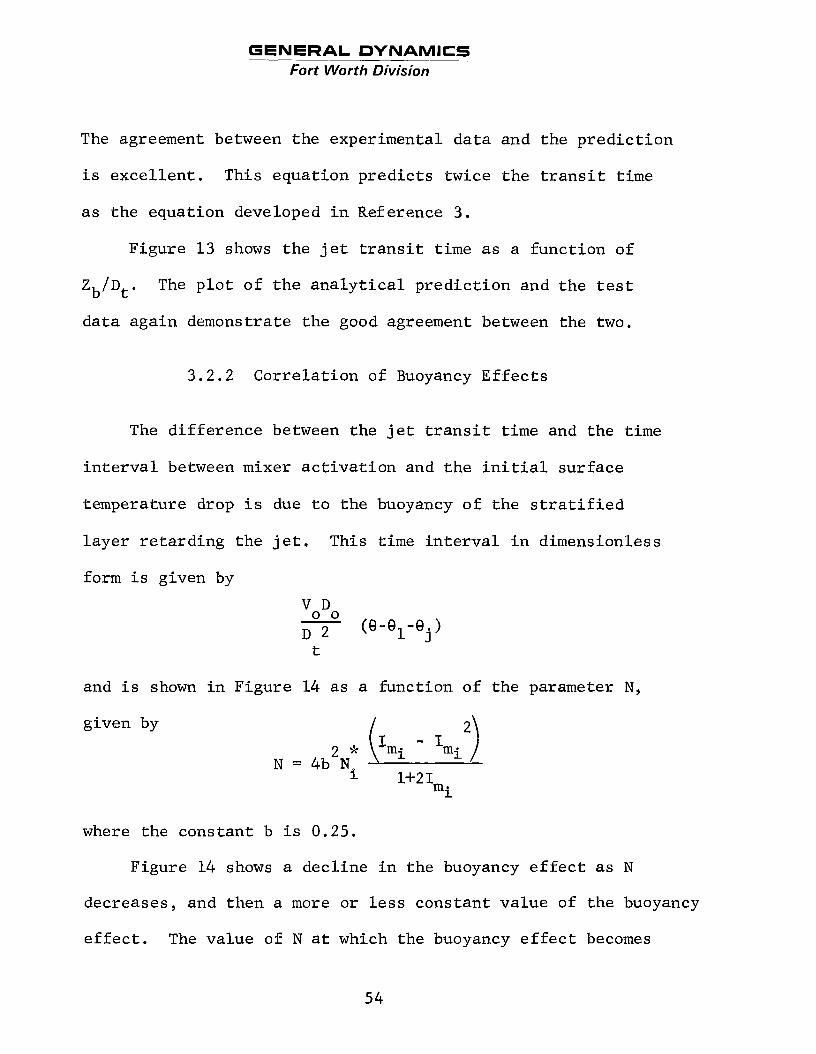
GENERAL DYNAMICS Fort Worth Division
The agreement between the experimental data and the prediction
is excellent. This equation predicts twice the transit time
as the equation developed in Reference 3 .
Figure 1 3 shows the jet transit time as a function of
Zb/Dt. The plot of the analytical prediction and the test
data again demonstrate the good agreement between the two.
3 . 2 . 2 Correlation of Buoyancy Effects
The difference between the jet transit time and the time
interval between mixer activation and the initial surface
temperature drop is due to the buoyancy of the stratified
layer retarding the jet. This time interval in dimensionless
form is given by
t
and is shown in Figure 14 as a function of the parameter N,
given by / 2\
L
where the constant b is 0.25.
Figure 14 shows a decline in the buoyancy effect as N
decreases, and then a more or less constant value of the buoyancy
effect. The value of N at which the buoyancy effect becomes
54
J
1
1
GENERAL DYNAMICS Fort Worth Division
(?)2
lo1
Figure 13 Corre la t ion of Axial Jet T r a n s i t T i m e f o r Large-Scale Tank Tests
55
GE
NE
RA
L D
YN
AM
ICS
Fort W
orth
Division
,,
, , I
,,
, , , , ,
I 0 0
rl
h
z
a
a~ 71
rI
( e-
e-e)
56
GENERAL DYNAMICS Fort Worth Division
approximately constant is about 0.5. The value of VoDo(B-81-
Q.)/Dt2 at this point is about 0.08. This is a relatively J
small value and indicates that the buoyancy effects can be
ignored at values of N less than 0,5.
of Ni, which is a function of the local acceleration, the
effect of buoyancy may be ignored in the prediction of mixing
Since N is a function >k
time for low-g situations.
3 . 2 . 3 Correlation of Mixing Times
The time required for the dimensionless transient tem-
perature to be reduced to some desired percentage of its
initial value is by definition, the mixing time required to
obtain the desired condition. The time can be obtained from the
plots of the dimensionless mixing time given in Volume 11.
The dimensionless temperature considered is
Ts'Tb
The times required for this term to reach 20%, l o%, and 5% of
its initial value were selected from each test. It was
assumed that the temperature stratification is reduced to its
desired value when there is no stratification recovery to a
point above this value. This is demonstrated in the following
sketch,
57
GENERAL DYNAMICS Fort Worth Division
0.2
.rl H
H d
d 0 . 1
0.05
\
I I I I I I I I
I I I
.I
where 8 ml,, and 8 are the mixing times for reducing the m2 m3 e stratification to 20%, 10% and 5%, respectively.
Figures 15, 16, and 17 show the data points from the 7k
transient data as a function of N for the three mixed con- i ditions. These figures show the data falling into two separate
groups. Examination of the individual test data show that the
data points in the two data groups correspond to tests with
stratification depths that can be described as "thick" and
"thin". In the so called "thin1' layer tests, mixing is much
faster than in the "thick" layer tests for otherwise equivalent -1-
mixing conditions. However , as N" increases, the mixing times i
58
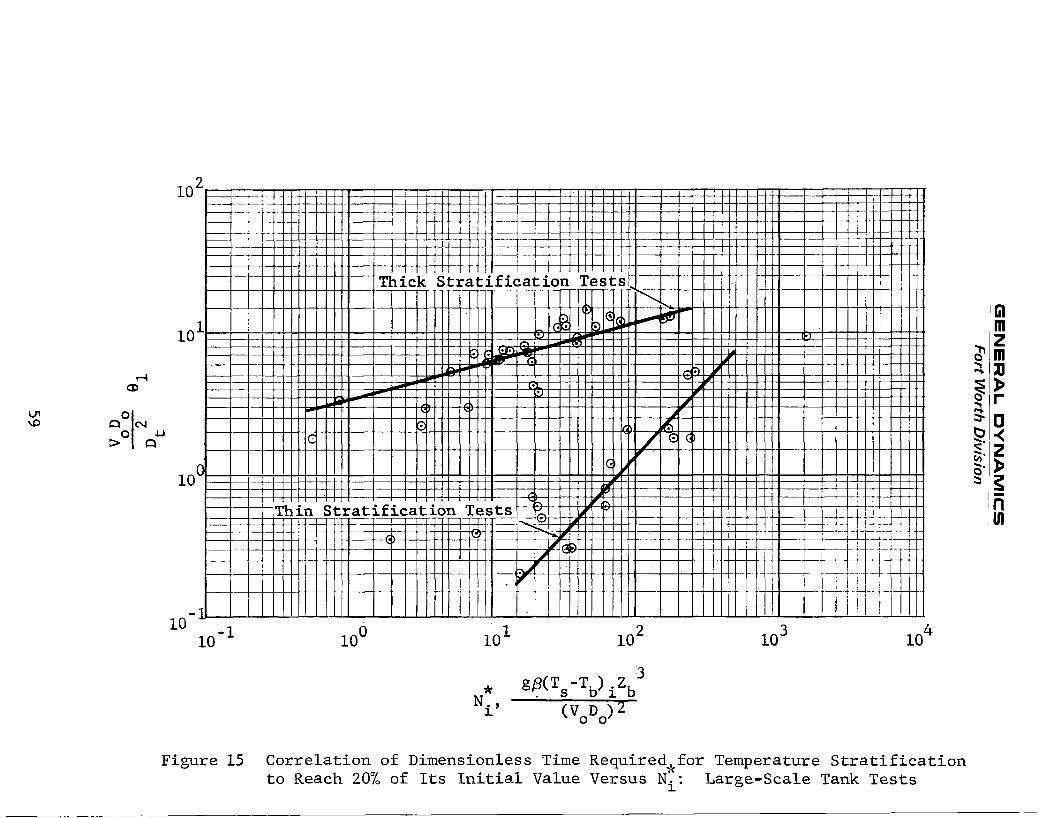
GE
NE
RA
L D
YN
AM
ICS
F
ort W
orth
Divisio
n
__
_~
-
I hl
0
rl
0
rl
0
rl
59
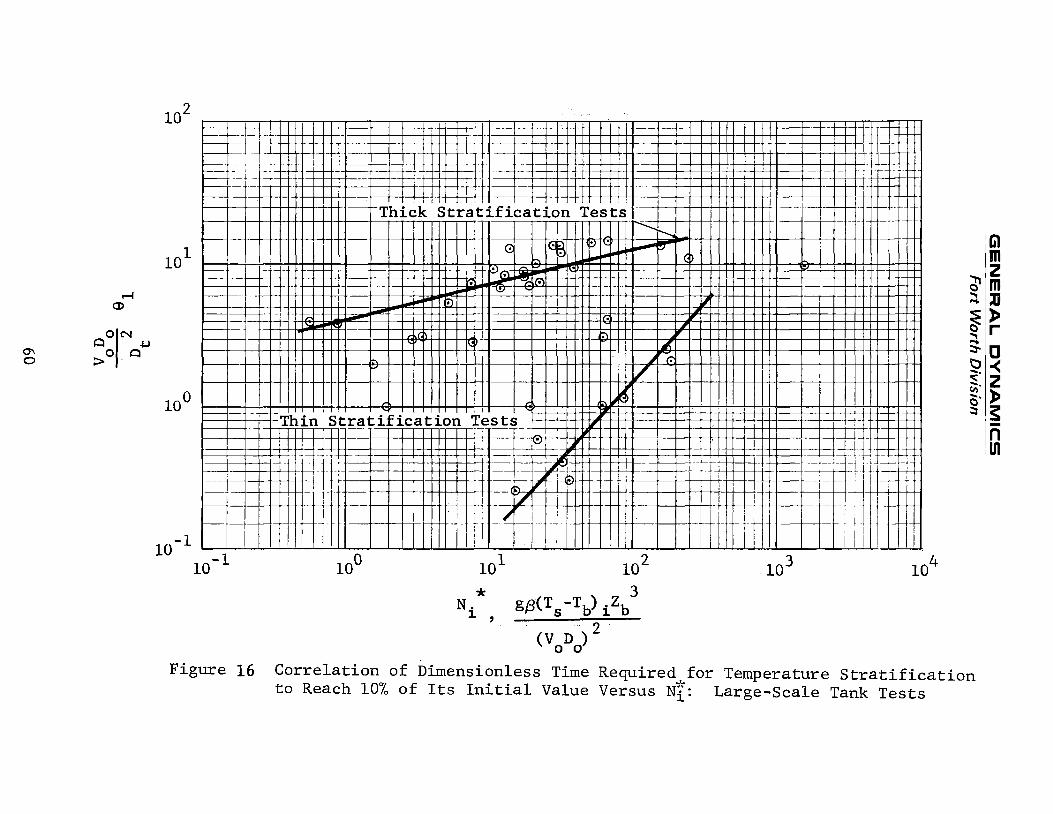
GE
NE
RA
L D
YN
AM
ICS
F
ort W
orth
Division
U
rl
m 0
4
hl 0
rl
rl 0
rl
hl 0
rl
rl 0
rl
0 0
rl
r(
I 0
0 0
rl
Fi
rl I 0
Fi
m P
*Fi
P a
N
n
H I H
Q.
bD
W
60
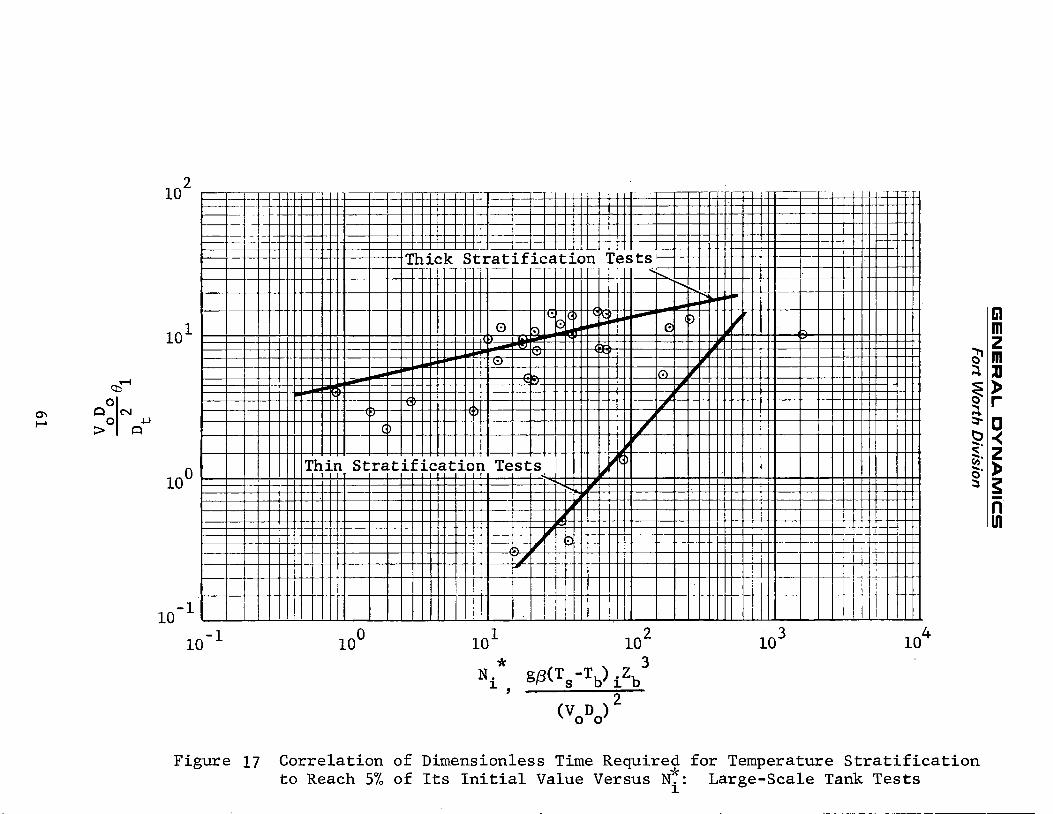
GE
NE
RA
L D
YN
AM
ICS
F
ort W
orth
Divisio
n
N 0
d
rl 0
rl
0 0
rl
rlr
l
I 0
rl
ww
00
C@
om
b
d
a, k
3
M
.rl Fr
61

GENERAL DYNAMICS Fort Worth Division
for both sets o f tests approach each other. This is as
expected since buoyancy forces increase with increasing N . 7k
i
An effort was made to obtain correlations that would
reflect the stratification thickness or the energy distribution.
The most successful correlation was the mixing time versus N.
Figures 18, 19, and 20 show this correlation. The data show
the mixing time to increase with N. The data scatter for
these correlations decreases with increased mixing t i m e .
62
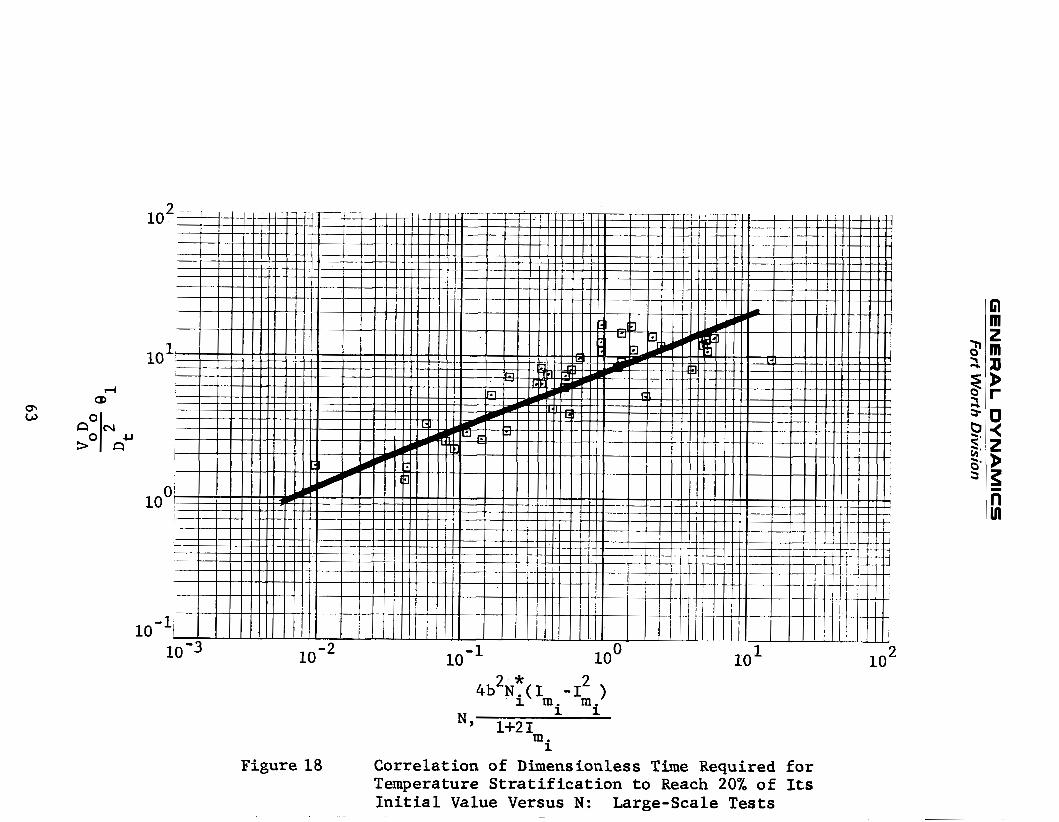
GE
NE
RA
L D
YN
AM
ICS
Fort W
orth
Divisio
n
E H
cv d
+
0
rl
0
d
63
I 0
rl
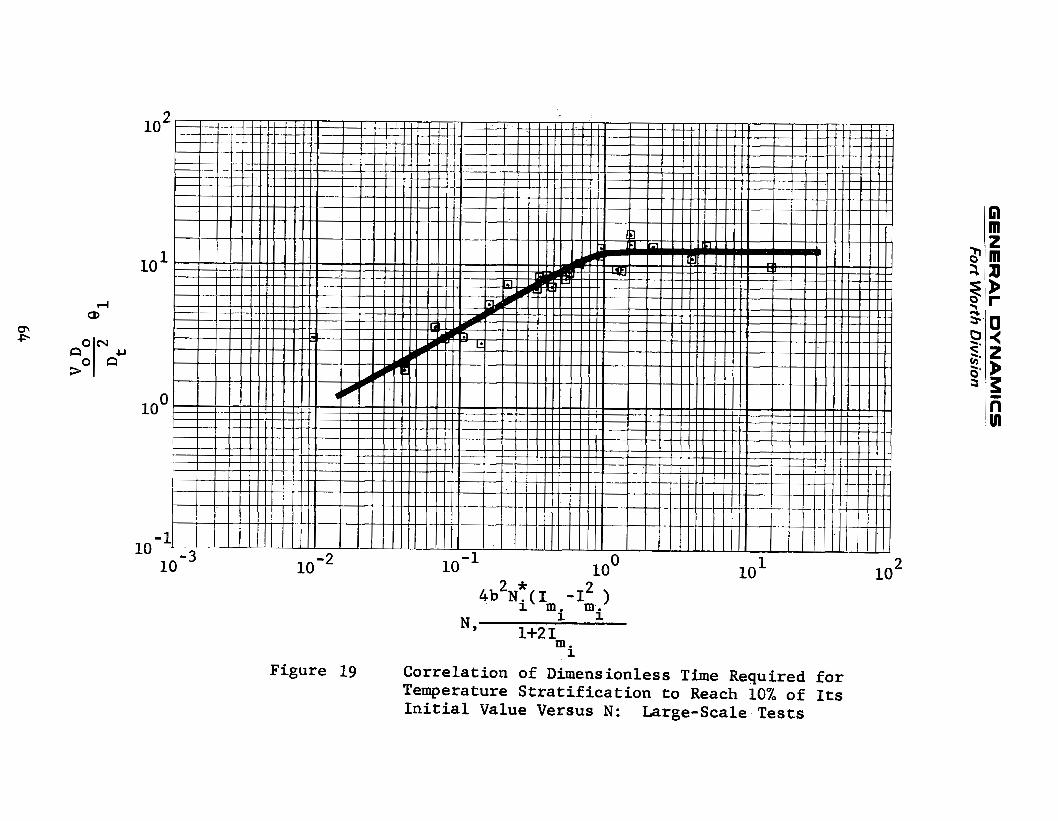
GE
NE
RA
L D
YN
AM
ICS
Fort W
orth
Division
c
64
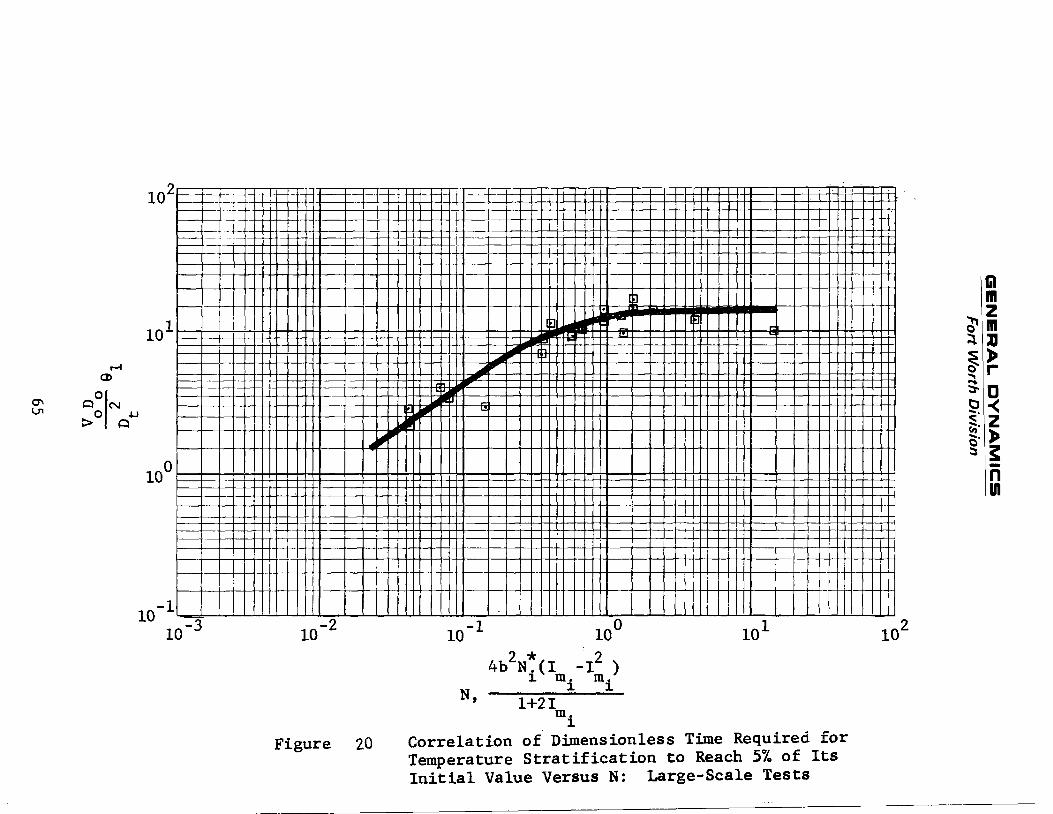
GE
NE
RA
L D
YN
AM
ICS
Fort W
orth
Division
I
65

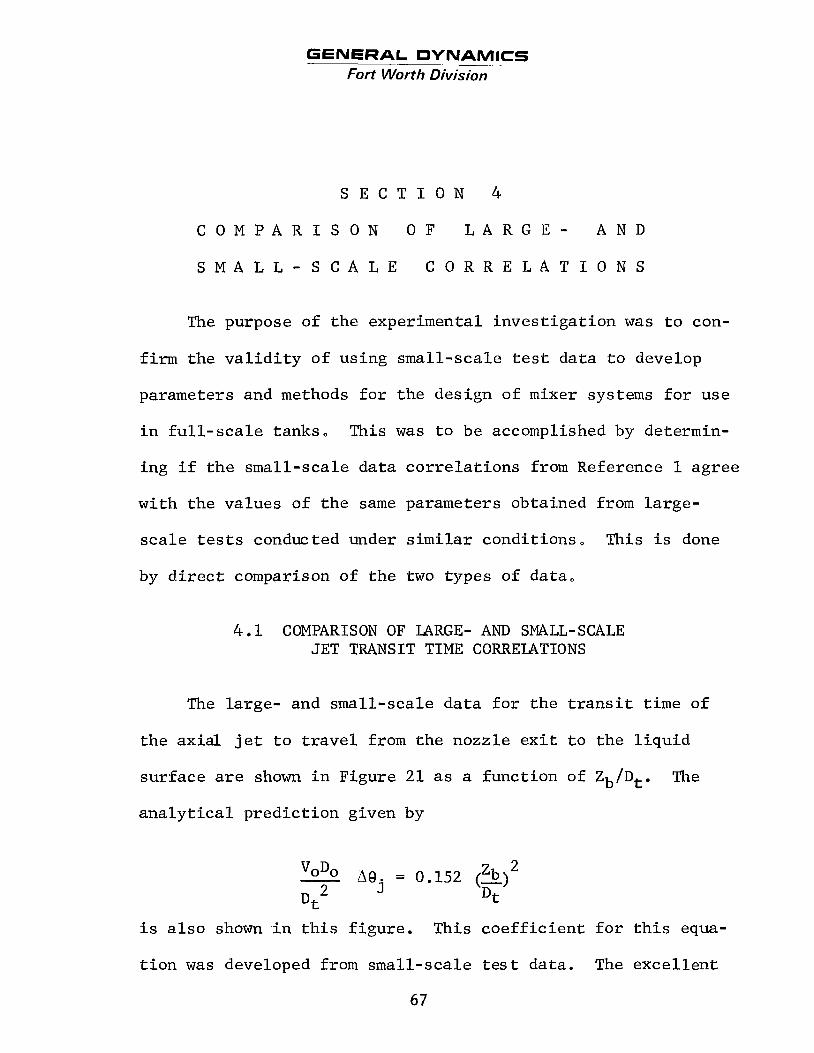
GENERAL DYNAMICS Fort Worth Division
~~ .~
S E C T I O N 4
C O M P A R I S O N O F L A R G E - A N D
S M A L L - S C A L E C O R R E L A T I O N S
The purpose of t h e experimental i n v e s t i g a t i o n was t o con-
firm the v a l i d i t y of using small-scale t e s t data t o develop
parameters and methods f o r t h e design of mixer sys tems f o r use
i n f u l l - s c a l e tanks , This w a s t o be accomplished by determin-
ing i f t h e small-scale da ta c o r r e l a t i o n s from Reference 1 agree
wi th t h e values of t h e same parameters obtained from l a rge -
s c a l e t e s t s conducted under s i m i l a r condi t ions , This i s done
by d i r e c t comparison of t h e two types of da ta ,
4 .1 COMPARISON OF LARGE- AND SMALL-SCALE JET TRANSIT TIME CORRELATIONS
The la rge- and small-scale da t a f o r t h e t r a n s i t t i m e of
t h e ax ia l j e t t o t r a v e l from t h e nozzle e x i t t o t h e l i q u i d
sur face are shown i n Figure 2 1 as a func t ion of Zb/Dt.
a n a l y t i c a l p red ic t ion given by
The
L
i s a l s o shown - in t h i s f i gu re . This c o e f f i c i e n t f o r t h i s equa-
t i o n w a s developed from small-scale tes t data . The exce l l en t
67
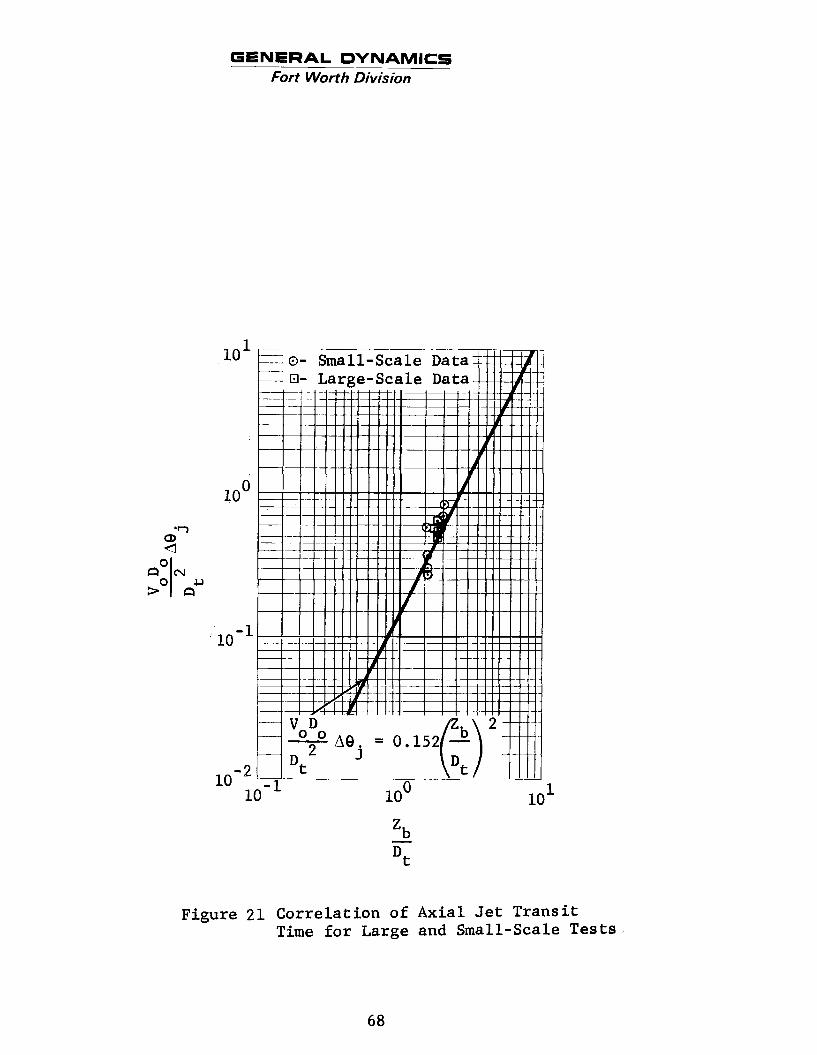
GENERAL DYNAMICS Fort Worth Division
loo
Figure 2 1
. . .
= 0 .1
loo lo1
Correlation of Axial Jet Transit Time for Large and Small-scale Tests
68
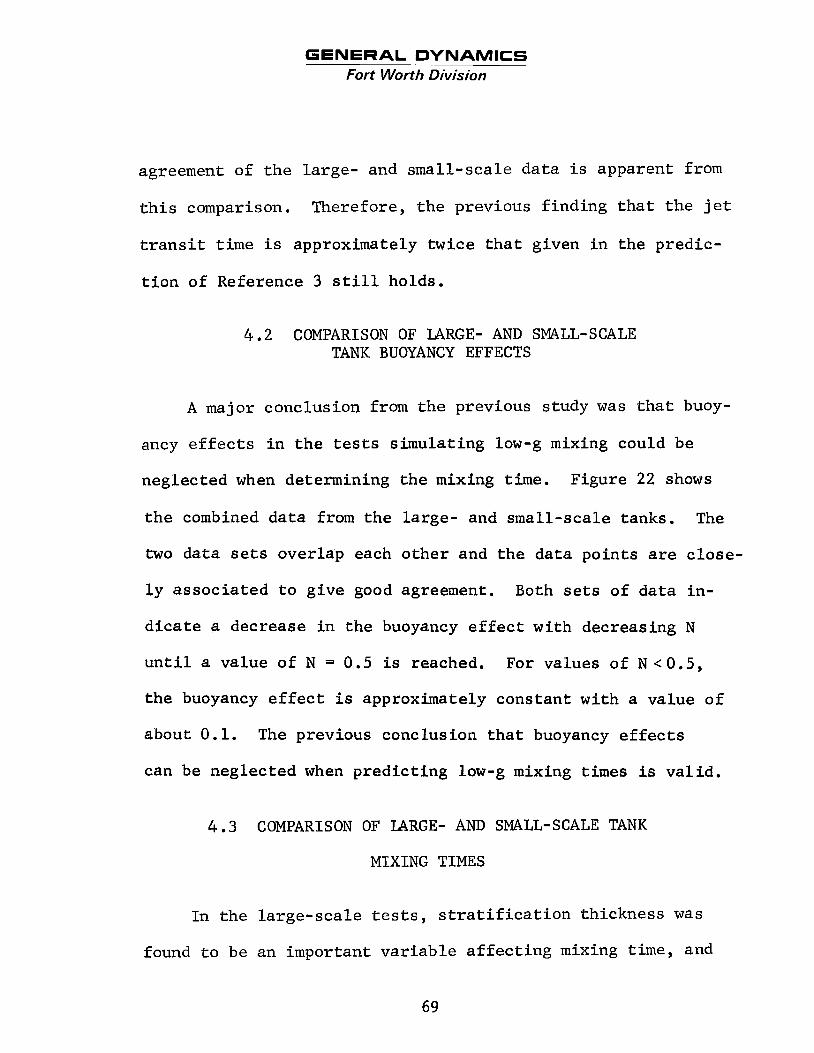
GENERAL DYNAMICS Fort Worth Division
agreement of t h e l a rge - and small-scale da t a i s apparent from
this comparison. Therefore, t h e previous f ind ing t h a t t h e j e t
t r a n s i t t i m e i s approximately twice t h a t given i n the predic-
t i o n of Reference 3 s t i l l holds.
4.2 COMPARISON OF LARGE- AND SMALL-SCALE TANK BUOYANCY E F F E C T S
A major conclusion from t h e previous study w a s t h a t buoy-
ancy e f f e c t s i n t h e tests s imulat ing low-g mixing could be
neglected when determining the mixing t i m e .
t h e combined da ta from t h e large- and small-scale tanks. The
two d a t a sets overlap each o the r and t h e da ta poin ts are c lose -
l y a s soc ia t ed t o g ive good agreement. Both sets of da ta in -
d i c a t e a decrease i n t h e buoyancy e f f e c t with decreasing N
u n t i l a value of N = 0.5 is reached. For values of N < 0.5,
t he buoyancy effect is approximately constant wi th a value of
about 0.1. The previous conclusion t h a t buoyancy e f f e c t s
can be neglected when p red ic t ing low-g mixing times is v a l i d .
Figure 22 shows
4 . 3 COMPARISON OF LARGE- AND SMALL-SCALE TANK
M I X I N G T I M E S
In t h e l a rge - sca l e t e s t s , s t r a t i f i c a t i o n thickness was
found t o be an important v a r i a b l e a f f e c t i n g mixing t i m e , and
69
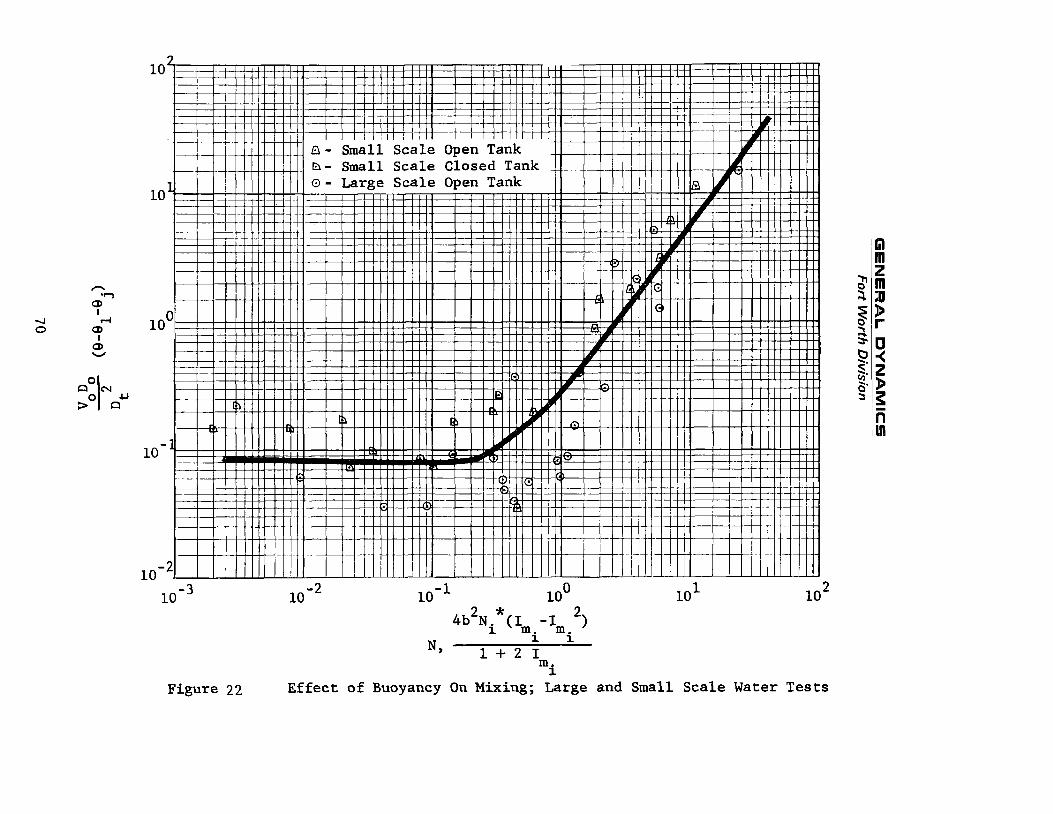
GE
NE
RA
L D
YN
AM
ICS
h
hl 0 0
a‘”
a‘” *
.d
rl
H
I
Hh
l
W
24
P
4
hl
I
+
111 4J 111 a, E-l k
a, 4J 9 a, d
rd 0 cn r(
d
rd B
cn a e 0
a, bo
bD e 4
x *d
c F: 0
h
L)
h
0 1
$ m w 0
4J L) - a,
W
W
w
0
I4
0
rl
- 0
d
1 0
d
..
Id
0
rl
70
GENERAL OYNAMlCS Fort Worth Division
a d i f f e r e n t c o r r e l a t i o n w a s necessary t o produce a good da ta
grouping. The small-scale t es t s do not have as wide a va r i a -
t i o n i n s t r a t i f i c a t i o n thickness as d i d t h e l a rge - sca l e t es t s ,
and t h e c o r r e l a t i o n of N; versus mixing time does not show t h e
d i s t i n c t bands as d id t h e l a rge - sca l e t e s t s , bu t t h e r e i s con-
s i d e r a b l e da ta scat ter . Combining both sets of da t a i n t h e
c o r r e l a t i o n of NZ versus VoDo01/Dt2 i n d i c a t e s t h a t much of t h e
smal l - sca le da ta agrees wi th t h e l a rge - sca l e da ta c o r r e l a t i o n s .
This i s e s p e c i a l l y t r u e as t h e mixing progresses . Figures 23,
24, and 25 show these c o r r e l a t i o n s .
A comparison of la rge- and small-scale da ta based on t h e 2
c o r r e l a t i o n of N versus V D 8 /Dt shows exce l l en t agreement.
These c o r r e l a t i o n s , presented i n Figures 26, 27, and 28, show
0 0 1
t h e small-scale da t a overlapping t h e e n t i r e range of t h e l a rge -
scale da ta wi th good agreement. Mixing t i m e s increase s l i g h t l y
wi th increas ing N , These c o r r e l a t i o n s i n d i c a t e t h a t mixing-
t i m e p red ic t ions based on small-scale data a r e v a l i d i n la rge-
s c a l e tanks.
The a n a l y t i c a l p red ic t ion of mixing time from Reference 1
tends t o g ive conservat ive values of t h e mixing time f o r cases
i n which t h e s t r a t i f i c a t i o n i s no t t h i c k (zs/zb< 0,3),
previous f ind ing t h a t a s t r a t i f i e d f l u i d w i l l mix f a s t e r than
predic ted a n a l y t i c a l l y when NZ i s less than 50 appears t o hold
The
71
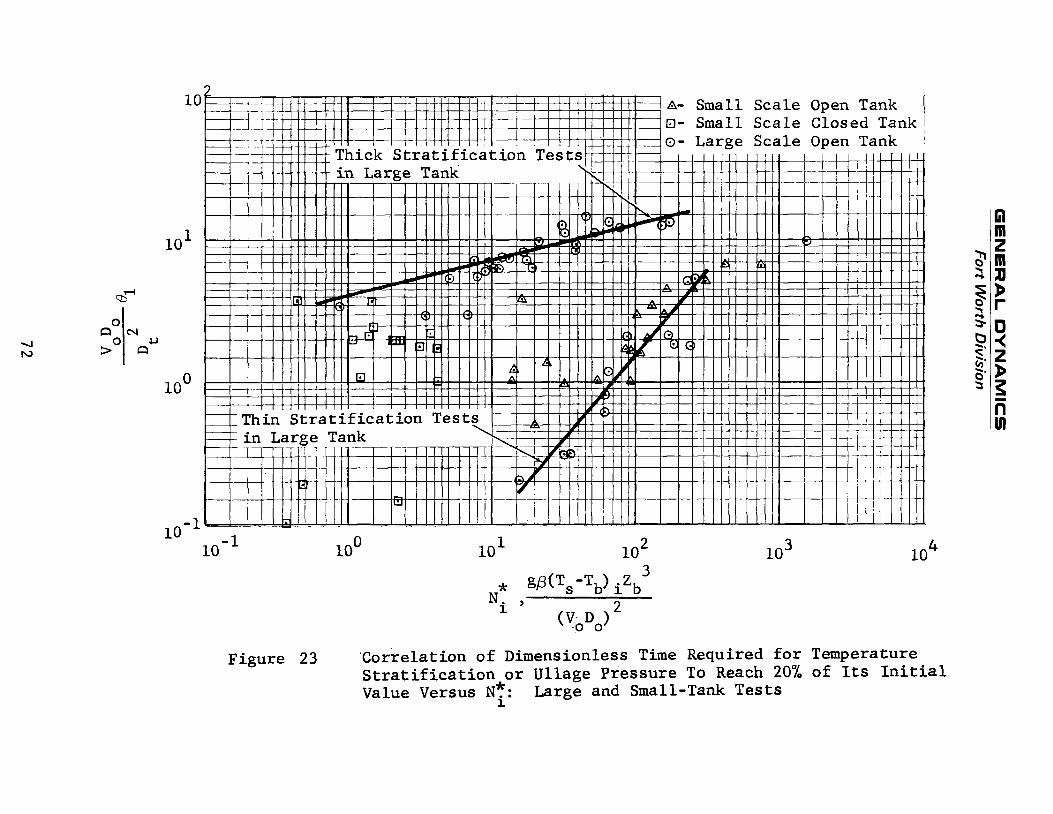
GE
NE
RA
L D
YN
AM
ICS
F
ort W
orth
Divisio
n
0
rl
d
I4
0
I 0
0
C
d
rl
r
4 0
4
cr) 0
I4
cv 0
rl
r( 0
rl
k i+ 00
WN
v) U
OQ
a
urn
3
0 0
rl
a k 9
M
*rl rl I s
72
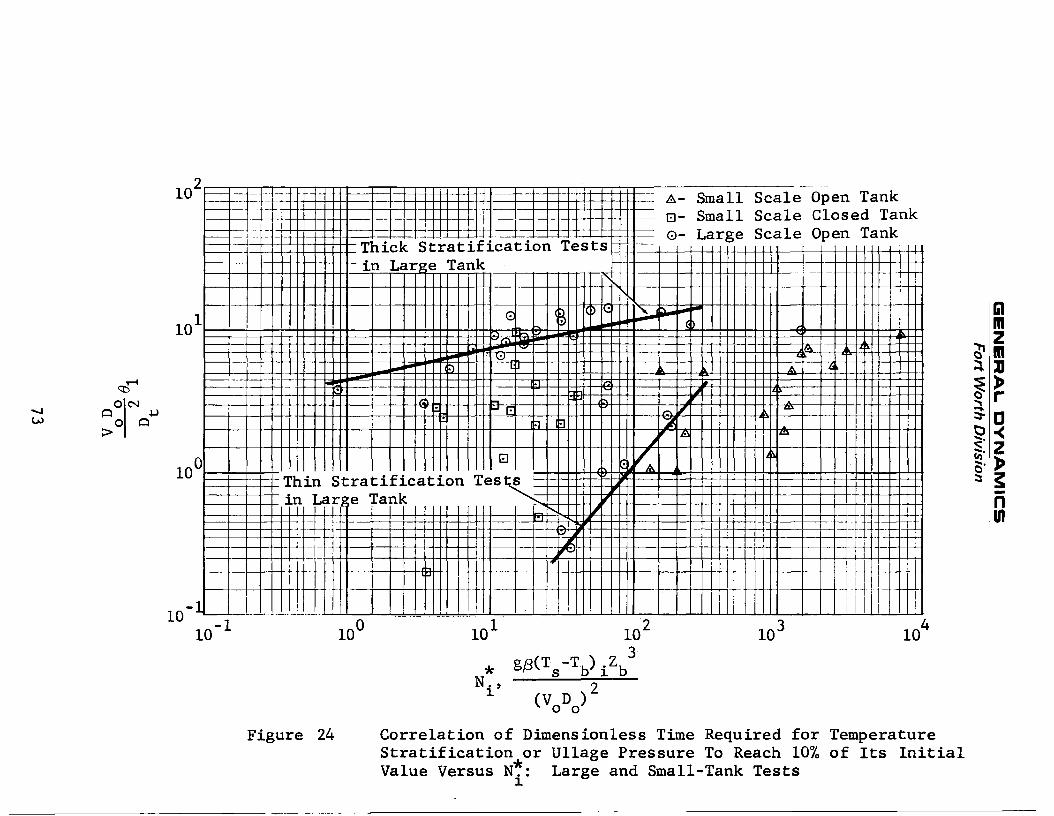
GE
NE
RA
L D
YN
AM
ICS
Fort W
orth
Divisio
n
hl 2
rl 0
rl
0 0
d
I4
I 0
d
s Q)
k
5 M
4
Err
0
rl
0
rl
73
0
rl
I 0
rl
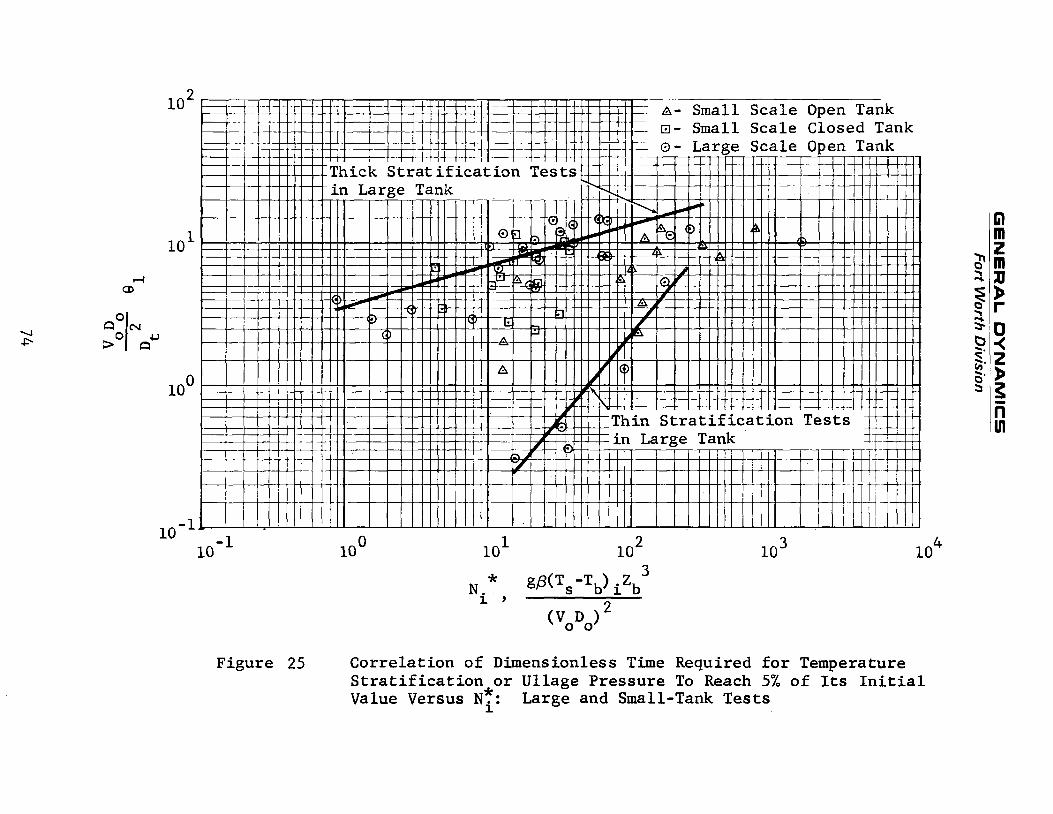
GE
NE
RA
L D
YN
AM
ICS
F
ort W
orth
Division
hl
rl
0
d
0
0
0
I r(
rl
4
C r
m
N
aJ k 7 M
74
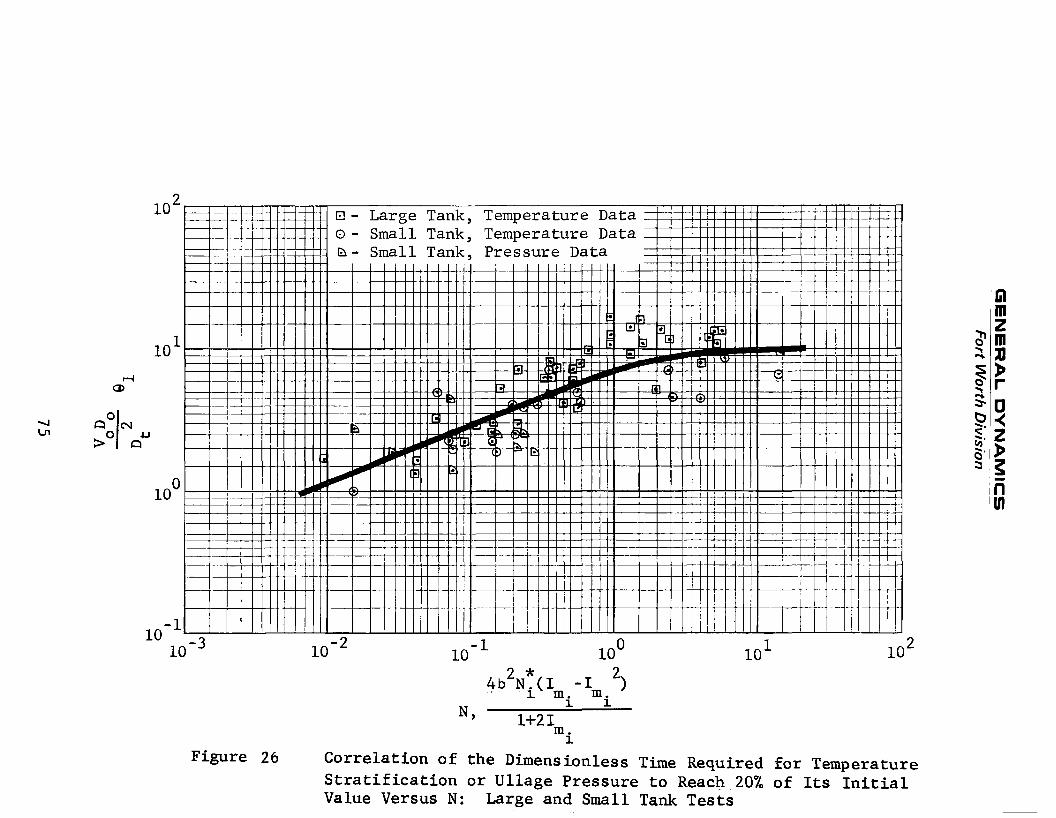
GE
NE
RA
L D
YN
AM
ICS
F
ort W
orth
Division
__
~~
C
al m
k
d
..
9
N
75
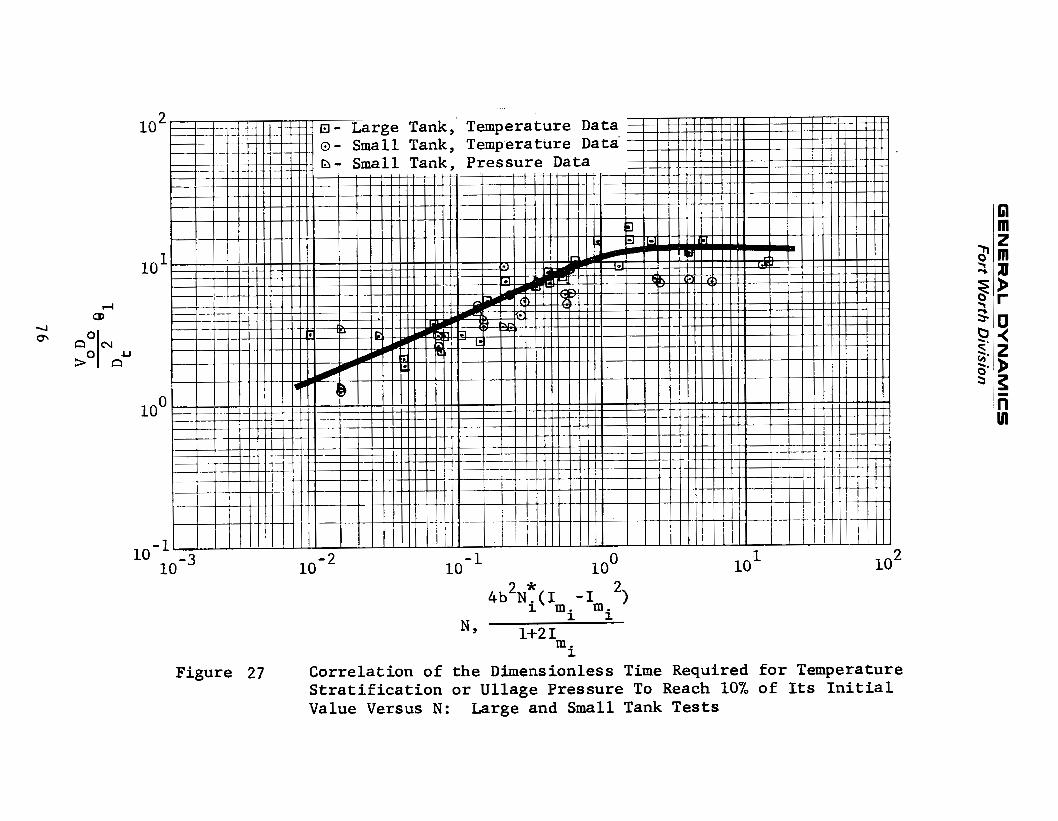
GE
NE
RA
L D
YN
AM
ICS
F
ort W
orth
Divisio
n
..
76

rl 0
rl
0 0
rl
GE
NE
RA
L D
YN
AM
ICS
Fort W
orth
Divisio
n
(v 0
rl
rl 0
4
0 0
rl
rl
I 0
rl
hl
I 0
rl
77
GENERAL DYNAMICS Fort Worth Division
t r u e f o r moderate l e v e l s of s t r a t i f i c a t i o n . However, t h e
i n i t i a l energy i n t e g r a l , Imi, appears t o be a b e t t e r i n d i c a t o r .
When I i s g r e a t e r than 0.2 mixing takes p lace slower than
predic ted a n a l y t i c a l l y .
m i
4.4 EFFECT OF LARGE-SCALE DATA ON
PREVIOUS L I Q U I D HYDROGEN MIXER
SYSTEM ESTIMATES
One of t h e ob jec t ives of t h i s study was t o determine i f
t h e l a rge - sca l e t e s t r e s u l t s ind ica ted t h a t changes were re-
quired i n previous s i z i n g est imates of t h e l iquid-hydrogen
mixer systems descr ibed i n Refererice 1. 'rhesc esti.mates were
p a r t l y based on mixing parameters developed from small-scale
mixing tests. Any departure of t h e l a rge - sca l e da ta co r re l a -
t i o n s from t h e previous small-scale c o r r e l a t i o n s would s i g n a l
a poss ib l e need t o re -eva lua te the previous mixer ana lys i s .
Comparison of la rge- and small-scale j e t motion and buoy-
ancy e f f e c t c o r r e l a t i o n s r evea l s exce l l en t agreement. Since
previous conclusions concerning j e t motion and buoyancy e f f e c t s
remain v a l i d , t h e r e i s no e f f e c t on any of t h e mixing est imates
due t o v a r i a t i o n s i n these condi t ions.
There a r e v a r i a t i o n s between large- and small-scale co r re -
l a t i o n s of dimensionless mixing times versus N'I' i
due t o v a r i a t i o n s
78

GENERAL DYNAMICS Fort Worth Division
in the ratio zs/zb. New correlations of the dimensionless
mixing times versus N for large- a d small-scale data give
excellent agreement, indicating that dimensionless mixing times
are approximately the same for both tank sizes under equivalent
conditions. The expression for mixing time given in previous
studies (References 1 and 2) is found to be generally conser-
vative, and previous results based on it are valid.
The net result of the large- and small-scale data correla-
tion comparisons is that no significant disagreement is found
and, therefore, no changes are necessary in previous estimates
of liquid-hydrogen mixing systems. This is confirmed not only
by comparison of correlations but by the fact that the large-
scale-tank experimental flow rates which give good mixing
results can be obtained by scaling small-scale data.
79

GENERAL DYNAMICS Fort Worth Division
-
S E C T I O N 5
O X Y G E N S T O R A G E M I X E R D E S I G N
S T U D I E S
The s t r a t i f i c a t i o n p red ic t ion methods and mixer design
c r i t e r i a which were developed i n previous s t u d i e s f o r l i qu id -
hydrogen systems were appl ied i n t h i s study t o two types of
oxygen s torage systems. These systems a r e an S-IIB O r b i t a l
Tanker conf igura t ion and a s m a l l s u p e r c r i t i c a l tank.
A bas i c guide l ine of t he s t u d i e s w a s t h a t any system
design would cons i s t of conventional pumps and power suppl ies
Only systems which a r e compatible wi th expected tank modi-
f i c a t i o n s were considered, and no r a d i c a l veh ic l e changes
a r e required.
5 .1 REFERENCE SYSTEMS AND MISSIONS
The two oxygen s to rage systems considered i n t h i s study
a r e v a s t l y d i f f e r e n t ; however, t h e same bas i c parameters
e s t a b l i s h the mixer design requirements f o r both. Some of
t he s i g n i f i c a n t parameters a r e
1. Cryogenic s to rage mode
2 . Propel lant heat ing r a t e
3 . Mission time
81
GENERAL DYNAMICS Fort Worth Division
4 . Tank acceleration
5. Tank size and geometry
Typical examples of these parameters were determined for the
S-IIB LOX orbital tanker and the small supercritical oxygen
storage tank.
5.1.1 S-IIB LOX Tanker Design Conditions
Several configurations of an orbital tanker based on
S-IIB or S-I1 vehicles have been proposed. The vehicle selected
for investigation during the study was a design requiring no
major structural changes to the LOX tank. This configuration,
the S-IIB/TK is described in Reference 4. The LOX tank in this
vehicle consists o f the basic S-IIB LOX tank (an oblate spheroid)
with minor modification tothe internal systems. The J-2s
engines are considered to be insulated, since the study reported
in Reference 4 determined that this was required to make the
S-IIB/TK system acceptable. The basic vehicle mission para-
meters for the S-IIB/TK are shown in Table 3 .
A significant difference between this LOX system and pre-
viously considered liquid-hydrogen systems is the physical pro-
perties of the LOX. The increase in saturation pressure with
temperature for oxygen is not as severe as for hydrogen; how-
ever, the heat capacity of liquid oxygen is much less than
that of hydrogen. Therefore, for equal masses of oxygen and
82
GENERAL DYNAMICS Fort Worth Division
Table 3
VEHICLE MISSION PARAMETERS
Parameter S-IIB/TK LOX Supercriticaloxygen
Tank Diameter, ft 33.0 3.25
Tank Length, ft 22.0 3.25
Tank Volume, ft3 12,553 17.97
Tank Area, ft2 2692 33.18
Initial Oxygen Mass, lb 182,000 988
Initial Temperature, OR 162.3 247.6
Initial Pressure, psia 14.7 870.0
Initial Density, lbm/ft3 71.27 55.0
Initial Void Fraction 0.797 0
Storage Time, days 163.0 --- Final Temperature, OR 1 7 9 . 4 --- Final Pressure, psia 37.0 --- Orbital Heating, Btu/hr 673 0
Acceleration, a/g 5 x 0
Orbital Altitude, n.mi 263 --- Use Rate, lb /hr 0 1 m
Internal Heating, W 0 400
83
GENERAL DYNAMICS Fort Worth Division
hydrogen being heated at the same rate, the oxygen will under-
go a much larger increase in temperature. In addition, the
heat of vaporization of liquid oxygen is less than half that
of liquid hydrogen,
5.1.2 Supercritical Oxygen Storage Tank
The second oxygen tank considered in this study was a
supercritical storage tank such as is used in life-support
systems. This storage mode, which had not been considered in
previous studies, is in many respects unique in both purpose
and operation. The purpose of using high-pressure supercritical
storage is to avoid the low-gravity separation problems en-
countered when a two-phase fluid is utilized. Since there is
no ullage, many problems with mixer design are eliminated,
although several additional problems in the stratification
analysis of the system are encountered because of the mode of
operation, This type oxygen tank is used to supply oxygen con-
tinuously to the life-support system and to the fuel cells of
current spacecraft. This requires a more or less constant
withdrawal of small amounts of oxygen from the tank, and
it is necessary to heat the oxygen in order to maintain the
tank pressure during the withdrawals. The simultaneous pro-
cesses of withdrawal and heating compound the problem of
stratification prediction. However, the recent Apollo 13
84
GENERAL DYNAMICS Fort Worth Division
~-
accident and past Gemini incidents point out the importance of
a good analysis of this problem, even though neither the
Apollo nor the two Gemini problems were the result of natural
stratification development (Reference 5).
The tank selected for analysis in this study is a typical
It is a small sphere example Of a Supercritical oxygen system.
with a low environmental heat leak, similar to the tank pro-
posed in Reference 6 . The major parameters are listed in
Table 3 and are for a so-called "thin wall" tank with high
performance superinsulation.
5.2 APPLICATION OF LIQUID-HYDROGEN MIXER TECHNOLOGY TO LIQUID-OXYGEN SYSTEMS
The technology developed to design liquid-hydrogen mixer
systems is directly applicable to liquid-oxygen mixer systems.
The differences in the thermal properties of the two fluids
will affect the final results but not the design methods.
The only problem in using previously developed mixing methods
is the occasional inclusion of liquid-hydrogen properties in
equation constants. This requires a check of the original
derivations.
In the analysis of stratification development in the S-IIB
LOX tank by the use of computer procedure U94 (Reference 7),
85

GENERAL DYNAMICS Fort Worth Division
no serious difficulty was encountered as long as the problems
conformed to the originally intended usage of the program.
A l l logic in the program is independent of the type of fluid
being analyzed.
However, the application of U94 to the analysis of stra-
tification development in the supercritical storage tank was
found to be impractical. The modifications which would have
been required were of such a major nature that a new program
was developed, This program, SW6, is described in Volume
III of this report,
5.3 S - I I B LOX TANKER MIXER DESIGN STUDY
A thermal stratification mixer system was sized for an
S-IIB/TK orbital LOX tanker configuration in which conventional
components and power supplies were used. This approach was
used rather than selection of an optimum system since it was
felt that a mixer system would be required before the advanced
technology components required in the more sophisticated system
would be available.
In general, the mixer design was accomplished by using
the same methods as presented in References 1 and 2. The major
difference in the design of this system and that of previously
considered systems (other than fluid properties) was due to
86
GENERAL DYNAMICS Fort Worth Division
the large ullage volume (initial ullage void fraction is 0.797).
This large ullage volume presented two problems:
1. Ullage heating is very large and is the dominant cause of the pressure increase.
2. If the axial jet disrupts the stored oxygen and dis- perses it throughout the tank, thermal control becomes difficult.
Consideration of these two problems was a major factor in the
mixer des ign . The number of mixer duty cycles was estimated on the basis
of the time required for the tank pressure to rise from an
initial mixed condition to a value slightly less than the tank
design pressure. Tank pressure rise due to the ullage heating
was found to be dominant over the pressure increase caused
by stratification induced from strictly liquid heating and the
duty cycles are based on ullage heating.
The mixer requirements are based on the considerations
that (1) it would be undesirable to cause the liquid/vapor
interface to be disrupted and the liquid distributed through-
out the tank, and (2) the pump must be a conventional model.
The requirement of no interface disruption resulted in low
flow rates. Mixing times were calculated based on correlations
of jet motion, bulk fluid motion, and temperature decay ob-
tained by previous experimental and analytical methods.
87
GENERAL DYNAMICS Fort Worth Division
The additional weights attributed to mixing were obtained
as a function of total operating time.
assumed a fuel-cell power supply.
The power penalty
5.3.1 Stratification
Stra-ification development and the associated pressure
increase in the S-IIB/TK were evaluated both numerically and
analytically for various heating conditions. The numerical
method of prediction, General Dynamics Computer Procedure U94
(Reference 7) , was used mainly to check the effect on stra-
tification development of various locations of liquid heating.
The liquid heating conditions were also studied by use of an
analytical conduction model.
Numerical analysis of a model in which uniform tank heat-
ing was assumed indicated that ullage heating caused a much
faster pressure increase than that obtained in the previous
liquid heating models. A more exact analysis, based on an
ullage heating model originally presented in Reference 2, was
then made for this heating case. This model predicts a rate
of tank pressure increase by the equation
88
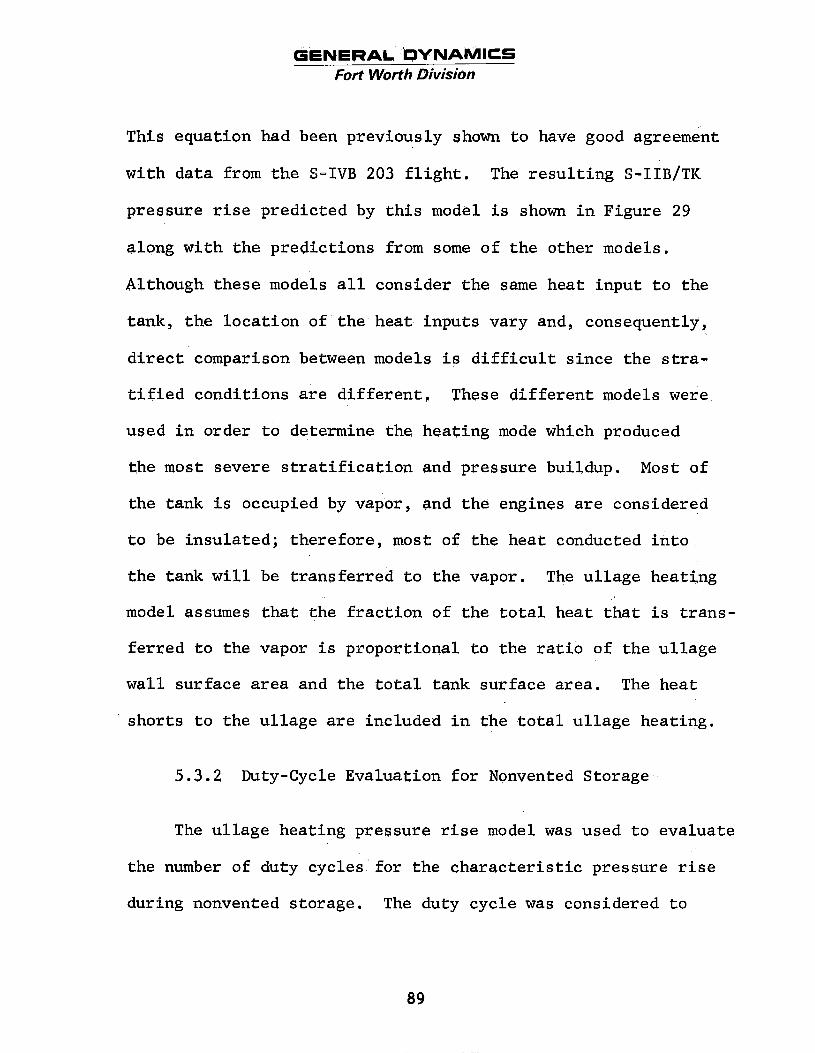
aENERAL DYNAMICS Fort Worth Division
This equation had been previously shown to have good agreement
with data from the S- IVB 203 f l i g h t . The resul t ing S - I I B / T K
pressure r i s e predicted by t h i s model i s shown i n Figure 29
along with the predictions from some of the other models.
Although these models a l l consider the same heat input t o the
tank, the location of the heat inputs vary and, consequently,
d i rec t comparison between models i s d i f f i c u l t since the stra-
t i f i e d conditions a re d i f fe ren t , These different models were
used i n order t o determine the heating mode which produced
the most severe s t r a t i f i c a t i o n and pressure buildup. Most of
the tank i s occupied by vapor, and the engines a re considered
t o be insulated; therefore, most of the heat conducted in to
the tank w i l l be transferred t o the vapor. The ullage heating
model assumes tha t the fract ion of the t o t a l heat tha t i s trans-
ferred t o the vapor i s proportional t o the r a t i o of the ullage
w a l l surface area and the t o t a l tank surface area. The heat
' shorts t o the ullage are included i n the t o t a l ullage heating.
5 . 3 . 2 Duty-Cycle Evaluation for Nonvented Storage
The ullage heating pressure r i s e model was used t o evaluate
the number of duty cycles for the character is t ic pressure r i s e
during nonvented storage. The duty cycle was considered t o
89
GE
NE
RA
L D
YN
AM
ICS
Fort W
orth Division
0
0 0
F-l
90
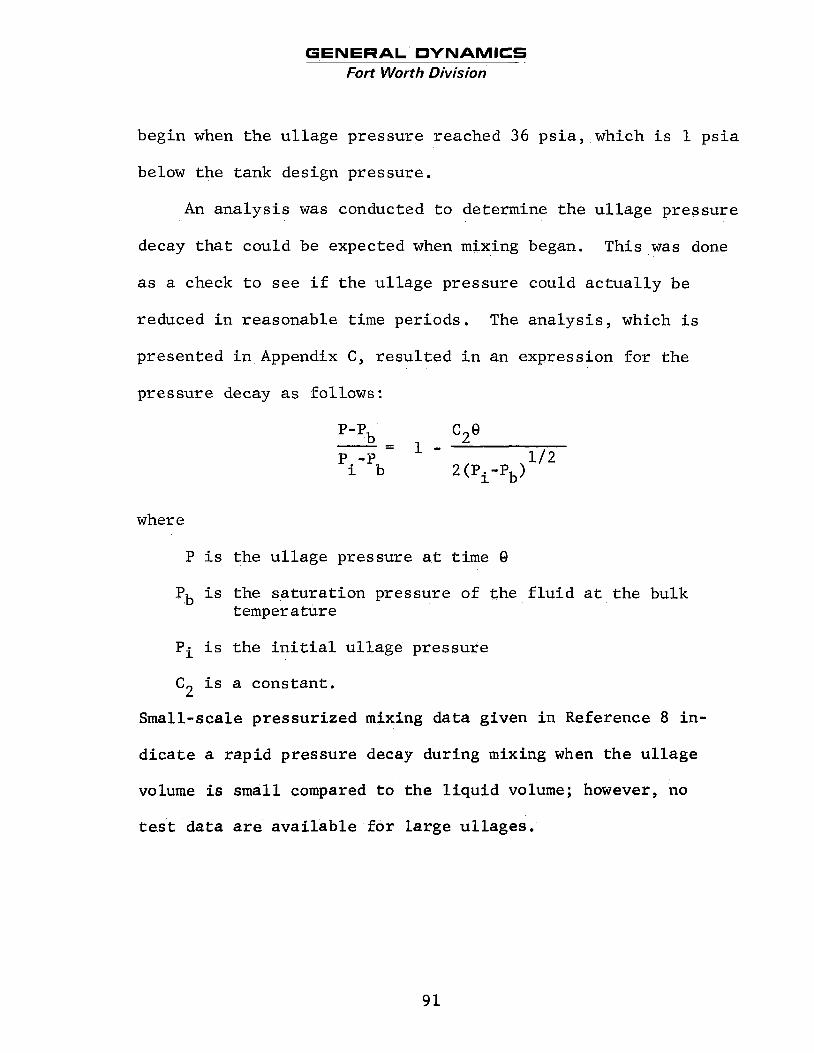
GENERAL DYNAMICS Fort Worth Division
begin when the ullage pressure reached 36 psia, which is 1 psia
below the tank design pressure.
An analysis was conducted to determine the ullage pressure
decay that could be expected when mixing began. This was done
as a check to see if the ullage pressure could actually be
reduced in reasonable time periods. The analysis, which is
presented in Appendix C, resulted in an expression for the
pressure decay as follows:
where
P is the ullage pressure at time 0
Pb is the saturation pressure of the fluid at the bulk temper a ture
Pi is the initial ullage pressure
C is a constant. 2
Small-scale pressur ized mixing da ta given i n Reference 8 in -
d i c a t e a r a p i d pressure decay during mixing when t h e u l l a g e
volume is small compared t o t h e l i q u i d volume; however, no
test da ta are a v a i l a b l e f o r l a r g e u l l ages .
9 1

GENERAL DYNAMICS Fort Worth Division
The predicted duty-cycle sequence i s presented i n Figure
30. The r e su l t s of the duty-cycle evaluation a re presented i n
Table 4 along with the r e s u l t s of the mixing time and mixer
sizing analyses discussed below.
5 . 3 . 3 Mixing Time
The mixing time required t o completely mix the l iquid
oxygen was found from the equation 6Dt2
e = m 0.456 VoDo
The term V D was selected (using the ullage breakup cr i te r ion)
t o be a value that would not cause disruption of the l iquid/
vapor interface. The value of €Im i s a maximum value and re-
0 0
presents a conservative value of the time t o mix the f lu id
completely. The resu l t s o f t h i s analysis are a lso presented
i n Table 4.
5 . 3 . 4 Mixer Sizing and Location
The selection of the nozzle and mixer s i ze was accom-
plished under the c r i t e r i a of no liquid/vapor interface break-
up and use of state-of-the-art equipment.
on the centerline a t the tank bottom. No heat-short problem
i s expected a t t h i s location since the engines must be insulated.
The pump was located
92
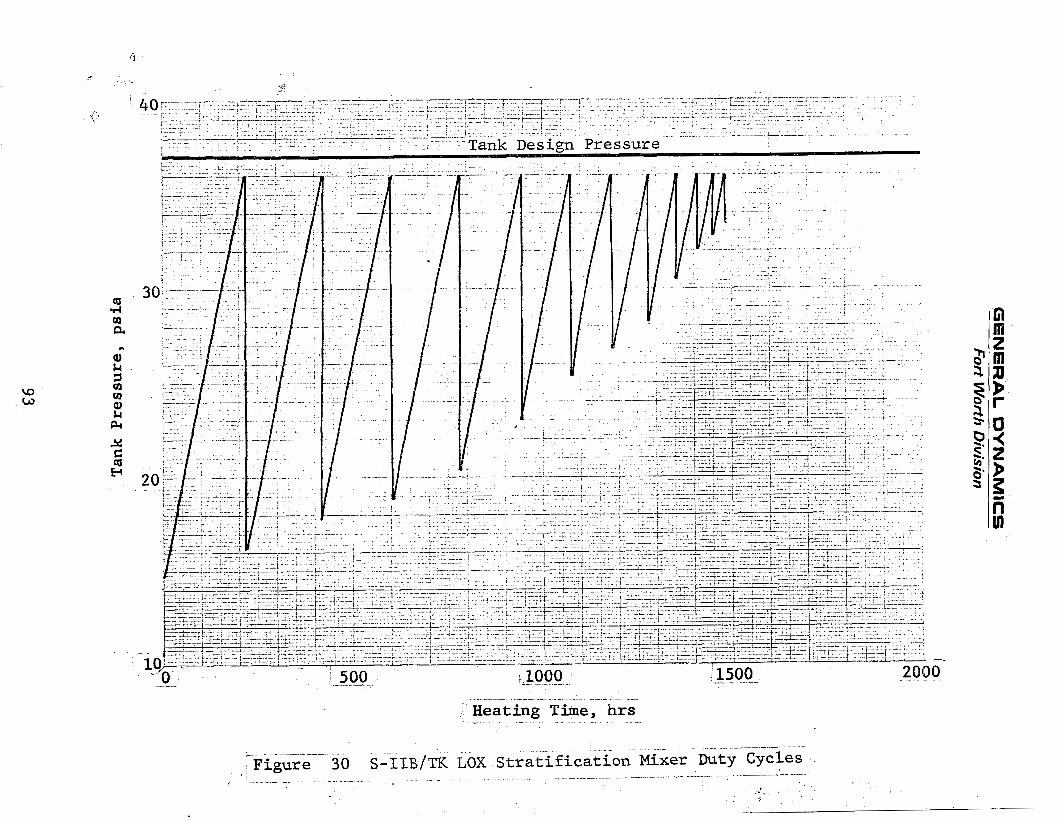
4 I ,
j'
0
-;f c
.,
GE
NE
RA
L D
YN
AM
ICS
Fort W
orth
Divisio
n
.. I.
93

GENERAL DYNAMICS Fort Worth Division
Table 4
S-IIB/TK LOX TANK PUMP/MOTOR DESIGN DATA
First Stratification Development Time, hr
Last Stratification Development Time, hr
Number of Duty Cycles
Mixing Times, hr
Fluid Power, W
Outlet Velocity, ft/sec
Pump Head, feet of LOX
Flow Rate, gpm
Specific Speed
Head Coefficient
Pump Blade Diameter, in.
Outlet Diameter, in.
Fluid Power X Outlet Diameter, W-ft
Pump Speed, rpm
Hydraulic Efficiency, %
Torque , in. -02
Overall Pump-Motor Efficiency, %
Power Input, W
Inverter Weight , lbm Power Supply Output, W
Power Supply Fixed Weight, lbm
94
217.5
33 .1
12
33.1
.0026
0.9271
0.01335
0.9087
LO , 000
0.1
1.187
0.633
0.000138
400
60
0.015
0.19
0.9
0.004
1.8
0.27

GENERAL DYNAMICS Fort Worth Division
Table 4 (Cont'd)
Number o f Mixers
Mixer Weight (Excluding Support S t ruc tu re ) lbm
1
0.6
95
GENERAL DYNAMICS Fort Worth Division
Only one mixer location i s u t i l i zed since the acceleration con-
d i t i ons a re suf f ic ien t t o maintain a se t t l ed l iquid i f the
mixer does not disrupt the interface. Figure 31 shows the
selected mixer location.
The r e s t r i c t i o n of the
given by the ullage breakup
V,Do I
r e s u l t s i n a small value of
ax ia l j e t flow r a t e t o a value
c r i t e r ion 5
(1 055(TZbgc/p )
the ax ia l j e t flow ra t e . No
currently available o r anticipated pump can e f f i c i en t ly pro-
duce the small values of f l u id power required; therefore,
a much larger pump must be u t i l i zed , resul t ing i n a very l o w
efficiency. The pump selected was similar t o tha t described
i n Reference 9 , although the blade diameter and rotat ional
speed were derated i n order t o match it t o a nozzle. The pump
specif ic speed and head coefficient were maintained a t t he i r
or iginal values. A rotat ional speed was selected and the
blade and nozzle determined on the basis of the ullage break-
up c r i t e r ion and the equations shown i n Appendix D. The pump
u t i l i z e s an a.c. motor system, and the pump motor has a very
l o w overall efficiency since most of the input power i s ab-
sorbed by system losses.
96
GENERAL DYNAMICS Fort Worth Division
m d H
97

GENERAL DYNAMICS Fort Worth Division
The pertinent parameters required t o define the mixer
design a re a lso presented i n Table 4 . This includes infor-
mation on both the nozzle and the pump.
5.3.5 Mixer Weight Summary
The weight summaries of the mixer system (excluding wiring,
supports, e t c . ) a re given i n Table 5. The weights l i s t e d in-
clude those for the mixer, fuel c e l l power supply, and boi loff .
The boiloff penalty consists of the t o t a l mass that would be
evaporated i f a l l the pump input power was used t o evaporate
f lu id . A l l weights l i s t e d i n Table 5 are based on data given
i n Table 6 , which are based on data from Reference 1.
5.3.6 Mixer Operational Sequence
The mixer operational sequence and associated controls
a r e simple. The system operates during the non-vent portion
of the ear th o rb i t , and mixing i s i n i t i a t e d when the tank
pressure reaches a desired value below the tank design pressure
and continues u n t i l the tank pressure decays t o a pre-programmed
tank pressure. This cycle i s repeated u n t i l the mixed satura-
t ion pressure of the oxygen i s equal t o the mixer i n i t i a t i o n
pressure. The tank pressure i s then allowed t o increase u n t i l
98
GENERAL DYNAMICS Fort Worth Division
Table 5
S-IIB/TK LOX MIXER WEIGHT SUMMARY
Fuel Cel l Weight, lbm
Boiloff Weight, lbm
Inve r t e r Weight, lb
Pump Weighttk, lbm
Tota l Weight, lbm
m
1.235
13.316
0 043
0.600
15,194
+<Excluding S t r u c t u r a l Supports and Other Fixed Weight.
99

GENERAL DYNAMICS Fort Worth Division
the vent system i s automatically operated when the ullage pres-
sure reaches the vent pressure. Venting continues until the
pressure drops an amount specified by a pract ical vent band.
The controls assumed t o operate the mixer system consist
only of a pre-programmed thermal-equilibrium pressure history
and appropriate pressure sensors. The system i s automatic and
functions with o r without override switches.
5.4 SUPERCRITICAL OXYGEN TANK MIXER DESIGN
The analysis of the storage of supercr i t ical oxygen was
conducted t o assess the effects of thermal s t r a t i f i c a t i o n on
the tank pressure. S t ra t i f ica t ion i s developed by environ-
mental heating and by the use of heaters t o maintain the tank
pressure during f lu id withdrawal, However the extent of the
s t r a t i f i c a t i o n and i t s e f fec t on tank equilibrium conditions
were no t large for the conditions and storage times studied.
The heater and drain locations may be important c r i t e r i a
i n deciding i f a mixer i s required. Heater ins ta l la t ions that
disperse the heat input throughout the tank are c lear ly more
desirable than a "point source" o r r e s t r i c t ed local heating.
This was shown i n Reference 11. Location of the drain i s a lso
important, since flow i n the tank tends t o m i x the contents
and reduce s t r a t i f i c a t i o n .
100
GENERAL DYNAMICS Fort Worth Division
Table 6
POWER SUPPLY WEIGHT COEFFICIENTS
Power Level Operating Time Coefficient
(1bmIw)
Power Level Coefficient
(Ib,/w)
Fuel Cell 0.00135
Boiloff 0.03725
Silver Zinc Battery 0.014
Inverter (50% e f f i c i en t ) ---
0.15
--- --- 0.024
10 1
GENERAL DYNAMICS Fort Worth Division
The actual design of a mixer for a supercritical system
is not as complicated a task as for a two-phase system. There
is no ullage to contend with since the fluid is stored as a
single phase, A l s o the tanks are generally small and feasible
pump designs produce more fluid power than is required for
mixing. Therefore a conventional pump-motor design must be
used that is too large for the system. The Apollo system is
a typical example.
The data used t o make the analysis is presented in Table
3 . The computer procedure developed to predict stratification
is presented in Volume 111.
5.4.1 Stratification Predict ion
Previously developed methods of predicting stratifica-
tion development are not valid for use in an,analysis of the
supercritical tank. The system is unique since during normal
operation there is almost constant fluid withdrawal, which
causes flow to develop in the tank. Coupling fluid withdrawal
with internal heat generation to maintain tank pressure results
in a more complex situation to analyze for stratification. In
addition, the extreme range of operating conditions requires
that variable fluid properties be considered.
102

GENERAL DYNAMICS Fort Worth Divikion
The purpose of predicting stratification in this type of
tank is primarily to determine the difference between the
stratified and the mixed tank pressures. The mixed pressure
is more important since the stratification pressure can be
controlled largely by regulation of the internal heating and
fluid withdrawal. Consequently there is little danger of
too high a pressure unless the heater controls fail, How-
ever, mixing of the stratified fluid might possibly result
in an equilibrium pressure which is less than the minimum
pressure at which the system can function properly.
The computer procedure developed, General Dynamics Com-
puter Procedure SW6, considers stratification developing ~
radially in a spherical tank. Internal heat generation is
considered to be from heaters located on the tank wall. b
Fluid is withdrawn from the tank center.
The results of the analysis of the supercritical’tank
described in Table 3 are presented in Figures 32 through
3 4 .
mixed tank pressures. Fluid withdrawal begins at time zero.
Tank heating begins when withdrawal reduces the pressure below
840 psia (the lower limit of the operating band). The differ-
ence between the stratified and mixed pressure is very small
and at no point does the tank pressure drop below the critical
The data shown in Figure 32 represent the stratified and
103
GENERAL DVNAMICS ~~~
Fort Worth Division
Storage Time,sec
Figure 32 Stratif ied and Mixed Pressure i n Supercritical Oxygen; Tank Diameter =3,25 F t
104
. .

GENERAL DYNAMICS Fort Worth Division
.
pressure. Figure 33 conta ins t h e temperature h i s t o r y of t h e
tank. Figure 34 p resen t s t h e f l u i d dens i ty v a r i a t i o n i n t h e
tank.
The r e s u l t s i n d i c a t e t h a t no mixer opera t ion i s requi red
during t h i s pero id of time. It was noted during t h e a n a l y s i s
t h a t I n many regions t h e thermodynamic p r o p e r t i e s of oxygen
had l a r g e v a r i a t i o n s wi th small changes i n t h e tank condi t ions.
Therefore it is poss ib l e t h a t t h e r e are opera t ing condi t ions
which could lead t o pressure co l l apse when t h e a n a l y s i s is
performed f o r a long per iod of time. It has been noted t h a t
t h e h e a t e r l oca t ion and t h e hea t f l u x a f f e c t t he s e v e r i t y of
t h e s t r a t i f i c a t i o n . In add i t ion , t h e oxygen property da ta
used, in some ins tances , produced apparent property da ta s lope
d i s c o n t i n u t i e s between i n t e r p o l a t i o n regions.
5 . 4 . 2 Mixer Requirements
A cursory examination w a s made of t h e requirements f o r
s u p e r c r i t i c a l oxygen mixer systems. S u p e r c r i t i c a l tanks are
normally much smaller than the l i q u i d hydrogen tanks considered
i n previous s tud ie s . Consequently t h e f l u i d power requirements
t o mix t h e f l u i d are small.
optimize t h e system s i n c e (1) t h e mixer power can be g r e a t e r than
The pump-motor need no t be s i z e d t o
required without c r e a t i n g problems and (2) heat ing of t he f l u i d
does no t r e s u l t i n a pena l ty s i n c e t h e f l u i d i s heated de l ibe r -
10 5

GENERAL DYNAMICS Fort Worth Division
0 I000 2000 3000
Storage Time, sec
Figure 33 Stratified Temperature in Supercritical Oxygen; Tank Diameter p3.25 Ft
106
G6
NE
RA
L D
YN
AM
ICS
Fort W
orth Division
GENERAL DYNAMICS Fort Worth Division
ately i n any ease. The f l u i d is always p resen t as a s i n g l e
phase i n the tank , and mixer designs need not consider two-
phase s p e r a t f s n .
f o r use.
Therefore convent ional pumps are recommended
Other means of mixing small tanks should be inves t iga t ed .
One example is t h e use of a p re s su re dr iven hydraul ic motor
i n s t ead of an e lectr ic motor. The tank conten ts would be
s t o r e d a t a h ighe r p re s su re (e.g. 50 p s i higher) than usua l
and expanded t o provide t h e energy t o ope ra t e the fan. This
type of sys t em would e l imina te the problems r e s u l t i n g from
opera t ing an electric motor i n l i q u i d oxygen.
10 8
GENERAL DYNAMICS Fort Worth Division
S E C T 1
C O N C L U
Principal conclusions der
O N 6
§ I O N S
ved from the experimental anc
mixer design investigations during this study are as follows:
1.
2.
3 .
4 .
5 .
6 .
7.
8.
9.
10.
Small-scale tests provide an excellent means of investigating mixing in large-scale tanks.
The effect of buoyancy on jet-mixing may be neglected in mixer designs for low-gravity con- ditions.
Dimensionless mixing times in large-scale tanks are approximately the same as for small-scale tanks with the same parametric conditions,
The jet-transit-time prediction coefficient given in Reference 1 should be used rather than that given in Reference 3 .
Stratification depth is an important parameter to consider in mixing.
Mixing, as demonstrated by the test results, was adequately achieved with a ratio of tank diameter to mixer diameter as high as 192.
Mixer flow rates scaled up from small-scale mixing data were adequate to mix the large tank.
Mixer design parameters developed from small-scale test data are adequate for use in designing mixer systems for large-scale tanks.
Mixer design methods developed for liquid-hydrogen tanks are applicable to liquid-oxygen systems.
Ullage pressure decay in tanks with large void fractions will occur within reasonable mixing times for axial jet mixing that does not disrupt the liquid/ vapor interface.
109
GENERAL DYNAMICS Fort Worth Division
11. Ullage disruption in a tank with a large void frac- tion is not necessary nor desirable from the stand- point of fluid control.
12. No evidence of a serious pressure collapse was found in the analysis of the supercritical oxygen tank.
GENERAL DYNAMICS Fort Worth Division -~ ~~~
S E C T I O N 7
R E C O M M E N D A T I O N S
The recommendations of this study concerning analytical
and experimental investigations and mixer design are given
below
In the case of analytical investigations, the following
analyses are recommended:
1. Develop a more comprehensive supercritical storage
computer program in order to include two-dimensional
stratification effects in spherical or other axi-
symmetric tank geometries. This will improve pre-
dictions and increase the tank configurations that
can be analyzed. Additional options should be added
to allow more flexibility in heater and drain loca-
tions, initial conditions, and variable transport
properties. This type of program would be a power-
ful tool for use in the analysis of supercritical
systems.
2. Perform a parametric analysis of stratification
development and pressure collapse in supercritical
tanks, with tank size, heater position, and drain
location used as study variables. This study would
111

GENERAL DYNAMICS Fort Worth Division
provide information as t o whether o r no t a mixer i s
requi red i n var ious tanks f o r a wide range of con-
d i t i o n s . In a d d i t i o n , t h e a n a l y s i s would a l s o show
t h e effect of hea te r and d r a i n l o c a t i o n on t h e systems
performance and provide valuable design information
regarding these requirements.
Modify Computer Procedure U94 t o improve l i q u i d /
u l l a g e coupling and t o reduce d a t a prepara t ion .
improved l i q u i d / u l l a g e coupling would produce a s ig -
n i f i c a n t improvement i n t h e program's s o l u t i o n t o
problems having u l l a g e heat ing. This becomes espec-
xially important when problems wi th l a r g e u l l ages a r e
solved. The reduct ion of t h e amount of da ta which
must be prepared and loaded i n t o t h e program can be
accomplished by program modif icat ions t o make t h e
program perform the c a l c u l a t i o n of t h e many nodal
c o e f f i c i e n t s ,
'
3 .
An
4 , Perform a d e t a i l e d a n a l y s i s of t h e e f f e c t on the
u l l a g e pressure decay of an i n i t i a l p ressure spike
caused by t h e cool j e t s t r i k i n g a hot bulkhead. The
delay i n pressure decay due t o t h i s e f f e c t should be
added t o the mixing t ime,
112
GENERAL DYNAMICS Fort Worth Division
5. Perform an analysis to determine the desirability of
ullage breakup mixing in a large-ullage tank and sub-
sequent fluid settling by engine burn as opposed to
non-disruptive mixing,
technique has an advantage of a faster mixing time
than non-disruptive mixing, however, fluid resettling
requirements may be unacceptable.
The ullage breakup mixing
In the case of mixer design studies, the following efforts are
recommended:
1. Investigate the possibility of heating the fluid
externally to pressurize supercritical tanks. An
external fan would be used to mix the tank contents,
This would be an alternative to more hazardous inter-
nal controls,
2. Produce a mixer design handbook, summarizing in
one convenient source all previous work,
Experimental recommendations are:
1, Evaluate experimentally the condensing heat transfer
coefficients f o r axial jet impingement on the liquid/
vapor interface in order to support and confirm
analytical predictions of the ullage pressure decay
during mixing.
2. Conduct an investigation to determine the pressure
113
GENERAL DYNAMICS Fort Worth Division
decay time f o r var ious u l l age volumes i n order t o
include t h i s e f f e c t i n mixing t i m e es t imates .
3 . Perform cryogenic mixing tes ts t o determine t h e e f f e c t
of hea t s h o r t s on mixing.
4 . Conduct an experimental i n v e s t i g a t i o n on t h e pressure
co l l apse i n s u p e r c r i t i c a l cryogenic tanks t o support
and v e r i f y a n a l y t i c a l p red ic t ions ,
5 , Conduct an i n v e s t i g a t i o n t o def ine o r b i t a l experi-
ments on s t r a t i f i c a t i o n and mixing.
6 , I n v e s t i g a t e , i n small-scale tes ts , the e f f e c t of
s t r a t i f i c a t i o n depth on mixing and develop co r re l a -
t i o n s of i t s e f f e c t on mixing t ime,
114
GENERAL DYNAMICS Fort Worth Division
~
R E F E R E N C E S
1. Poth, L. J., et al, A Study of Cryogenic Propellant Mixing Techniques, Volume I, Mixer Design and Experimental Inves- tigations, Final Report, General Dynamics Fort Worth Division Report FZA-439-1, 1 November 1968.
2. Poth, L. J., et al, A Study of Cryogenic Propellant Stratification Reduction Techniques, Volume I, Analytical and Experimental Investigations, Annual Report, General Dynamics Fort Worth Division Report FZA-419-1, 15 September 1967.
3. Schlichting, Herman, Boundary Layer Theory, McGraw-Hill Book Company, Inc,, New York, 1960.
4. Denison, D. E., et al, Feasibility of Modifying the S-I1 Stage A s An Injection Stage For Manned Planetary Fly-By Missions, Final Report, North American Aviation, Inc., Space and Information Systems Division Report SID67-275-3, March 1967.
5. Personal Communication from Jerry Smithson, NASA/MSC, to L. J , Poth, General Dynamics Fort Worth Division, 1970.
6. McDonnell Douglas Single Wall Cryogen Storage Systems, McDonnell Douglas Corporation Report CR-CSS-02.
7. Van Hook, J. R., et al, Study of Cryogenic Propellant Stratification Reduction Techniques, Volume 11, Computer Programs, Annual Report, General Dynamics Fort Worth Division Report FZA-419-1, 15 September 1967.
8. Poth, L. J., Van Hook, J. R., et al, A Study of Cryogenic Propellant Mixing Techniques, Volume 11, Experimental Data, Final Report, General Dynamics Fort Worth Division Report FZA-439-2 , 1 November 1968.
9. Bradshaw, R. D., et al, Thermodynamic Studies of Cryogenic Propellant Management, General Dynamics Convair Division Report GDC-ERR-AN-1144, December 1967.
10. Strickland, Z. , "Many Tests Reveal Mishap Cause", Aviation Week and Space Technology, Vol. 92, No. 2 3 , June 1970.
115
GENERAL DYNAMICS Fort Worth Division
~ ~ _ _
R E F E R E N C E S (Cont'd)
11. VKamat, D . A . , Control Design For A Ciyogenic F lu id Storage and Supply System, Iowa Sta te Univers i ty of Science and Technology, A m e s , Iowa, 1966.
116

GENERAL DYNAMICS Fort Worth Division
A P P E N D I X E S
GENERAL DYNAMICS Fort Worth Division
-
A P P E N D I X A
T H E R M O C O U P L E R E S P O N S E E R R O R
The e r r o r of a thermocouple reading due t o t h e thermal
response l a g can be found from the experimental da ta and a
thermocouple energy balance. The following sketch def ines the
thermocouple bead and i t s surroundings.
Tf Bead
Considering the thermocouple bead t o be a sphere w i t h diameter
D , t he thermocouple energy balance is
Rate of Energy Leaving = Change i n Energy Stored
dTt hAAT = m c p -
de
Solving t h i s equation f o r t h e ra te of change i n the thermocouples
temperature y i e Ids
118
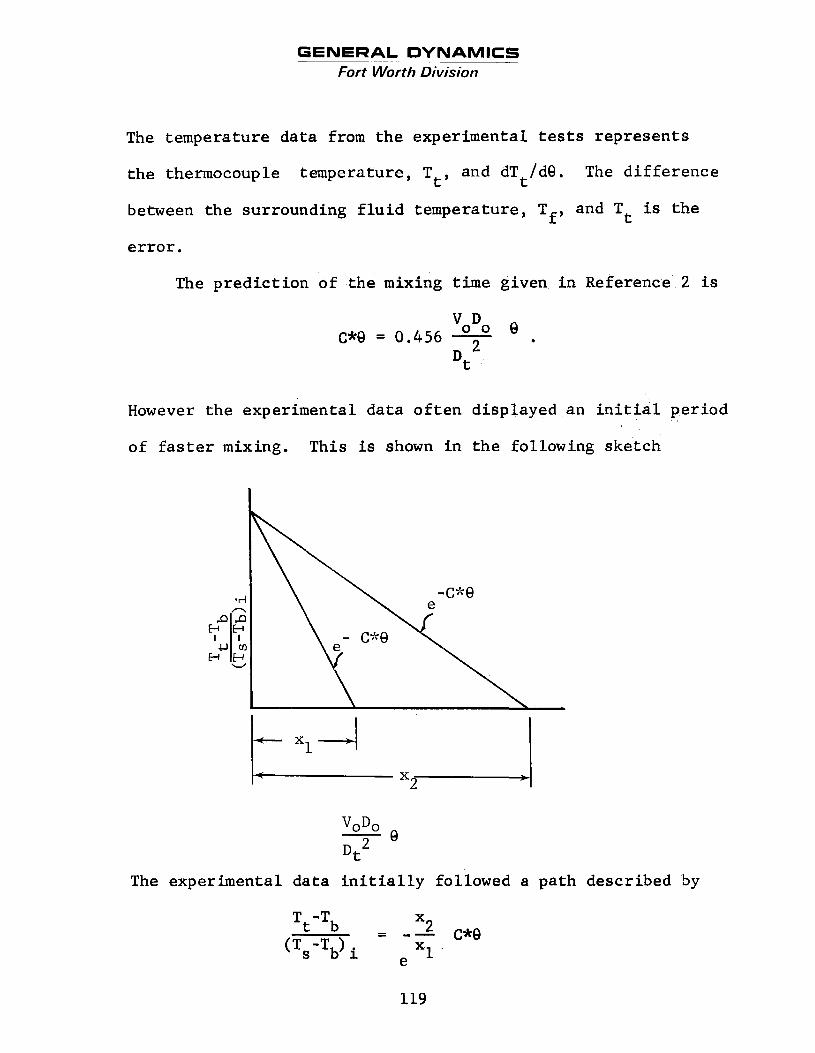
GENERAL DYNAMICS Fort Worth Division
The temperature da ta from t h e experimental tests r ep resen t s
t he thermocouple temperature,
and T is t h e between the surrounding f l u i d temperature, T f ,
e r r o r .
and dTt/dQ. The d i f f e r e n c e Tt,
t
The p red ic t ion of t h e mixing t i m e given i n Reference 2 is
e c*e = 0 .456 . L
Dt
However the experimental da ta o f t e n displayed an i n i t i a l per iod
of f a s t e r mixing. This is shown i n t h e following sketch
The experimental da ta i n i t i a l l y followed a path described by
X Tt‘Tb - - -- c*e
(Ts‘Tb) i e x1 ’
119
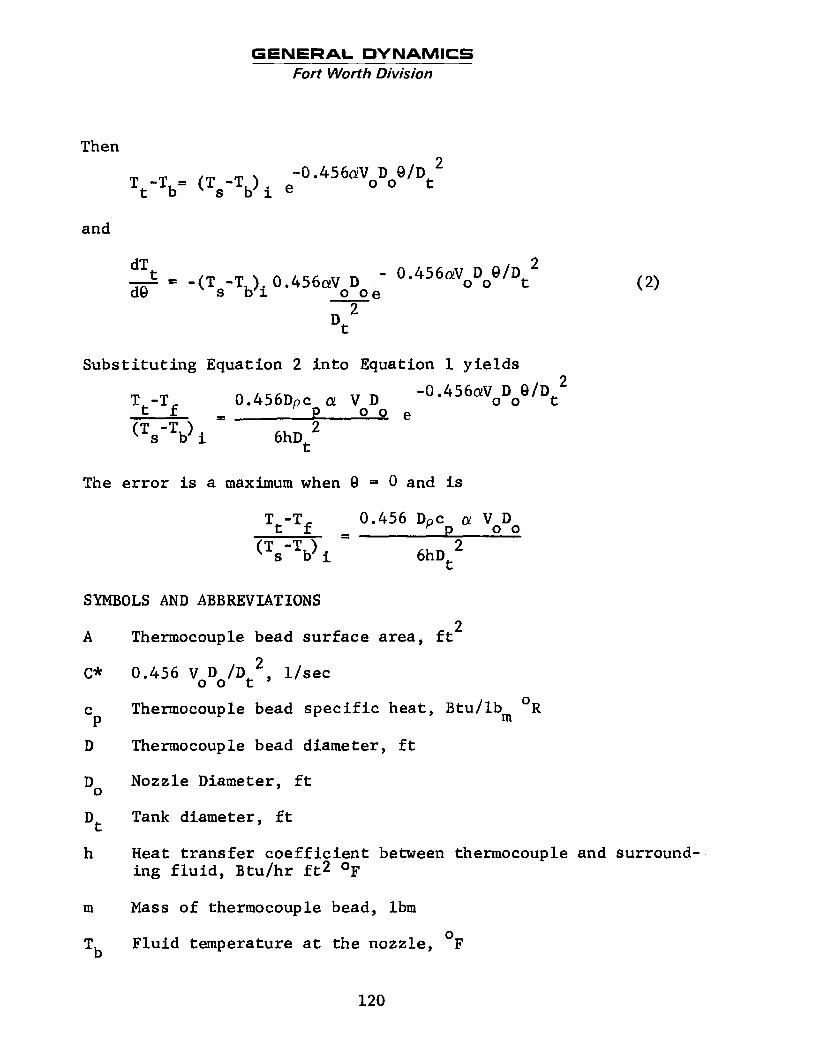
GENERAL DYNAMICS Fort Worth Division
n Then
and
2 - 0.45601V D O/Dt -s dTt V ( T ~ - T ~ ) ~ 0.456aV D 0 0 d0 - 0 o e
2 Dt
S u b s t i t u t i n g Equation 2 i n t o Equation 1 y i e l d s a - 0 . 4 5 6 ~ N ~ D ~ 9 / D ~ L
0.456Dpc a! V D Tt-Tf - - 0 0 e (Ts-TJ i 6hDt 2
The e r r o r is a maximum when 0 = 0 and is
T -Tf 0.456 Dpc Q! V D 0 0
3 t
2 (Ts'Tb) i 6hDt
SYMBOLS AND ABBREVIATIONS
A
C*
C P
D
D 0
Dt
h
m
Tb
2 Thermocouple bead su r face a rea , f t
0.456 VoDo/Dt , l /sec
Thermocouple bead s p e c i f i c hea t , B t u / l b
2
0 R m
Thermocouple bead diameter, f t
Nozzle Diameter, f t
Tank diameter, f t
Heat t r a n s f e r c o e f f i c i e n t between thermocouple and surround- ing f l u i d , Btu/hr f t 2 OF
Mass of thermocouple bead, lbm
Fluid temperature at t he nozzle, F 0
120
GENERAL DYNAMICS Fort Worth Division
Tf
Tt
x1
x2
S T
0 V
a
8
P
0 Fluid temperature, F
F lu id s u r f a c e temperature, F
Thermocouple bead temperature, F
0
0
Nozzle e x i t v e l o c i t y of j e t , f t /sec
V D @/D t8 Lack some percentage of i t s i n i t i a l value.
V D @ / D t8 FeacA same AT/AT. as fast p red ic t ion .
2 requi red for r a p i d temperature decay p r e d i c t i o n
2 requi red f o r slow temperature decay p r e d i c t i o n
1
x2/x1
Time
Thermocouple bead dens i ty
SUBSCRIPTS
i I n i t i a l
121
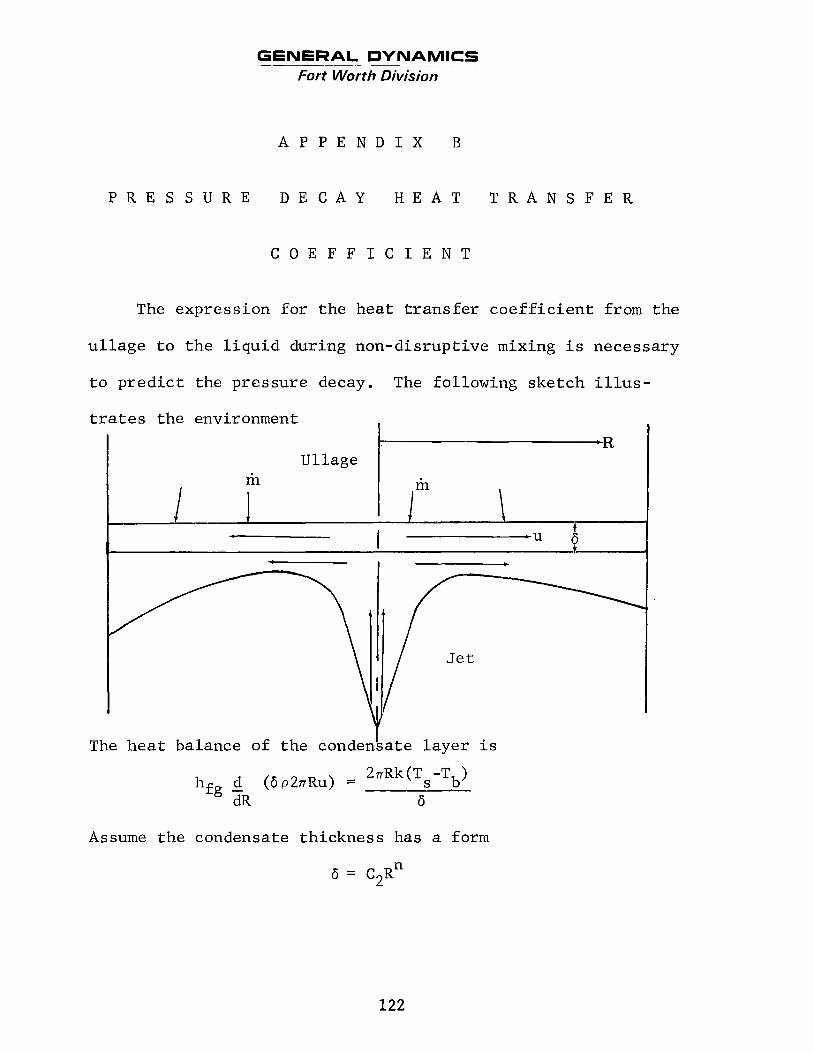
GENERAL DYNAMICS Fort Worth Division
~~ -
A P P E N D I X B
P R E S S U R E D E C A Y H E A T T R A N S F E R
C O E F F I C I E N T
The expression for the heat transfer coefficient from the
ullage to the liquid during non-disruptive mixing is necessary
to predict the pressure decay. The following sketch illus-
I trates the environment
The heat balance of the condenbate layer is d (6p2nRu) = 2nRk(Ts-Tb)
6
Assume the condensate thickness has a form n
6 = C2R
122
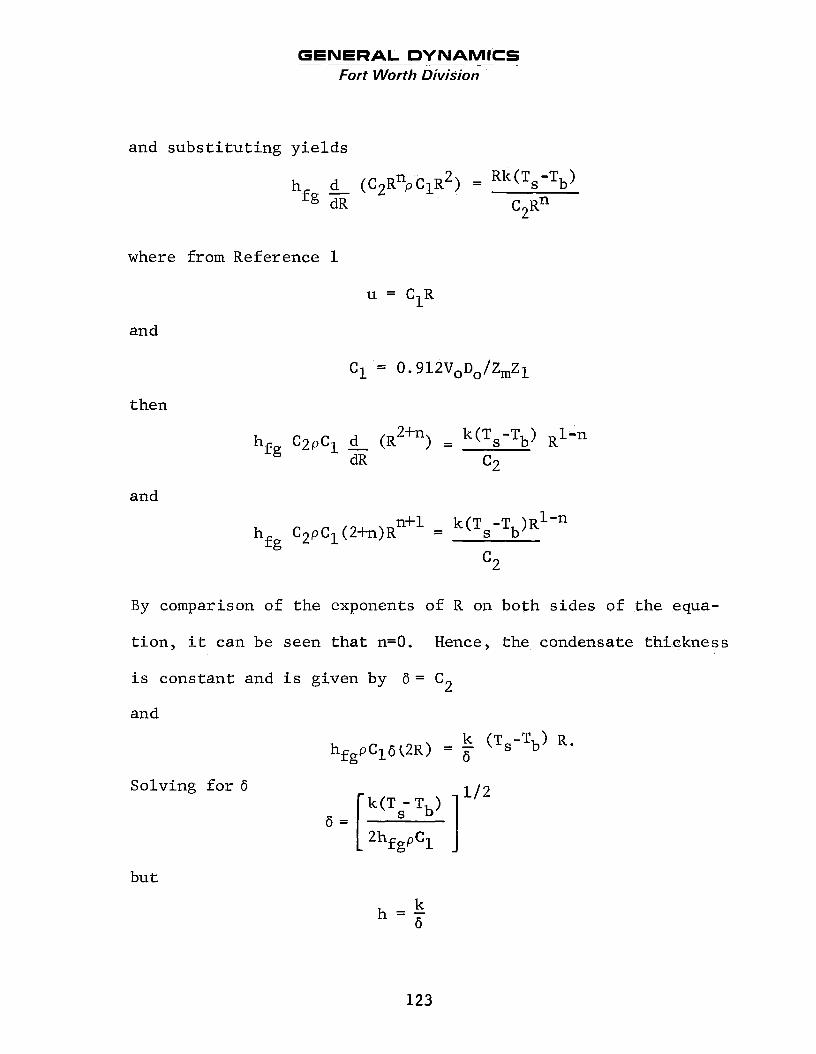
GENERAL DYNAMICS Fori Worth Division
and substituting yields
where from Reference 1
u = CIR
and
C1 = 0.912VoDo/ZmZ1
d (R2S.n) = k(Ts-Tb) R1-n _.
and n+l k(Ts-Tb)R 1-n
h C2pC1(2+n)R = f g
c2
By comparison of the exponents of R on both sides of the equa-
tion, it can be seen that n=O. Hence, the condensate thickness
is constant and is given by 6 = C2
and
hfgPC16(2R) =
Solving for 6 k ( T -Tb) '
6 = [ 2hfgPC1 ,
but
123

GENERAL DYNAMICS Fort Worth Division
1 / 2 Theref o r e
h =[ 2k hf .""I] (Ts-Tb)
SYMBOLS AND ABBREVIATIONS
DO
h
hfg
k
R
T
Tb
S
U
VO
m Z
Z 1
6
P
Nozzle ex i t diameter, f t
Heat t ransfer coeff ic ient between ullage and l iquid, Btu/hr f t 2 OR
Heat of vaporization, Btu/lb, O R
Thermal conductivity, Btu/ft OR hr
Radial distance, f t
Surface temperature, OR
Bulk o r bot tom temperature, OR
Radial velocity, f t / s e c
Nozzle e x i t velocity, f t / s e c
Mixing region thickness, f t
Distance from bottom of mixing region t o nozzle top , f t
Thickness of condensate layer, f t
Density of condensate, l bm/ f t 3
124

GENERAL DYNAMICS Fort Worth Division
A P P E N D I X C
U L L A G E P R E S S U R E D E C A Y
The mixing of a s e t t l e d f l u i d without a d is rupt ion of t h e
l iquid/vapor i n t e r f a c e causes an u l l a g e pressure decay due t o
condensation of vapor from the u l l a g e . Considering the u l l a g e
t o be descr ibed by
PV = mRT
and the hea t removed from t h e u l l a g e t o be
d h\ =-a (mcvT)
an expression can be obtained f o r t he u l l a g e pressure decay.
Subs t i t u t ing t h e term T from Equation 1 i n t o Equation 2 y i e l d s C
6% =-7 he (PV).
I f t h e u l l a g e volume i s constant
‘vV dP Ahv =-- R - de
and
de cVV
The condensation r a t e , m y can be found by considering t h a t t h e
r a t e heat i s removed from the u l l a g e i s given by
The term i s Ts-Tb i s r e l a t e d t o t he s a t u r a t i o n pressure by a
r e l a t i o n s h i p
125
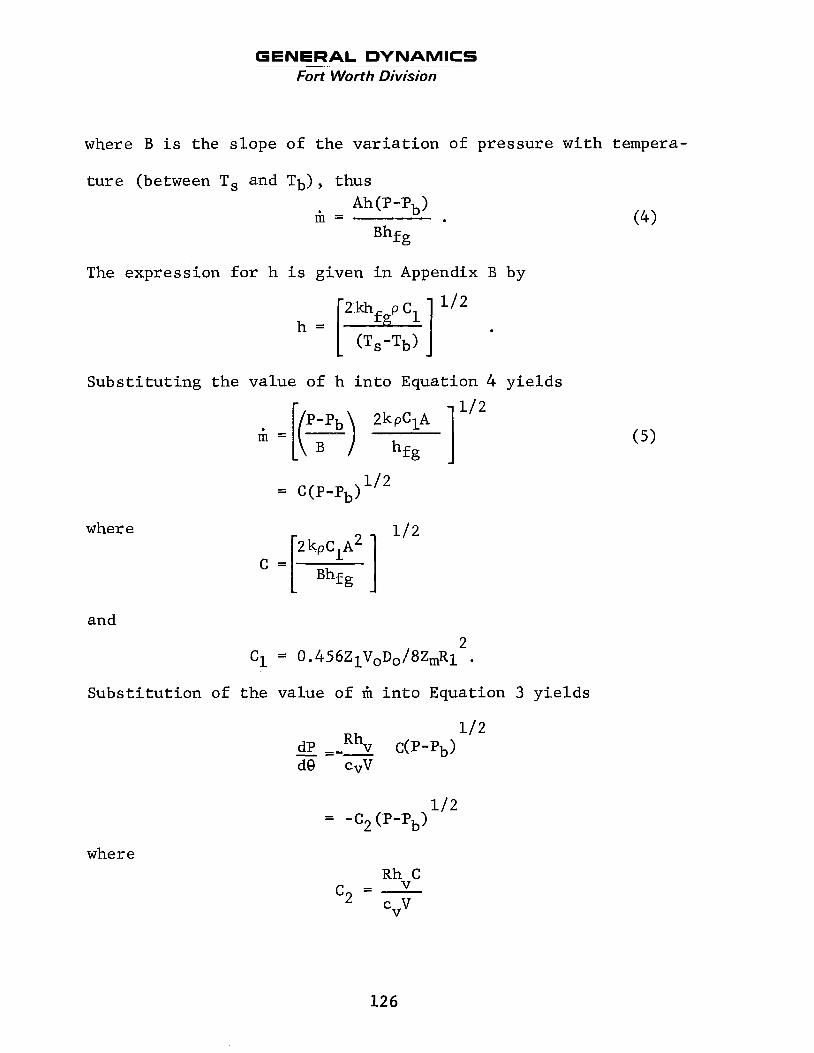
GENERAL DYNAMICS Fort Worth Division
where B is the slope of the variation of pressure with tempera-
ture (between Ts and Tb), thus
The expression for h is given in Appendix B by
Substituting the value of h into Equation 4 yields
where
and 2
CL = 0.456Z1VoDo/8ZmR1 . Substitution of the value of fi into Equation 3 yields
where Rh C - v c2 - - cVv
126

GENERAL DYNAMICS Fort Worth Division
Collecting variables and integrating from the initial ullage
pressure when the mixer is turned on yields
This can be reduced to
SYMBOLS AND ABBREVIATIONS
A
B
C
C1
c2
DO
C V
h
hv k
m
m
P
Liquid/vapor interface area, ft2
Slope of saturation pressure versus temperature, 1bf/ft2'R
Constant, C = (2kpC,P2/Bhfg)l/B lbmft/hr lbf 1 / 2
2 Constant, C1 = 0 .456Z lV D /8ZmR1 , l/sec
Constant, C2 = RbC/cvV, lbf1'2/ft hr
Constant volume specific heat of ullage, Btu/l&OR
0 0
Nozzle exit diameter, ft
Heat transfer coefficient between ullage and liquid, Btu/hr ft2 O R
Heat of vaporization, Btu/lbm
Ullage enthalpy, Btu/lbm
Thermal conductivity of condensate , Btu/hr ft OR
Ullage mass, lbm
Condensation rate, lb,/hr
Ullage pressure, lbf/ft 2
127
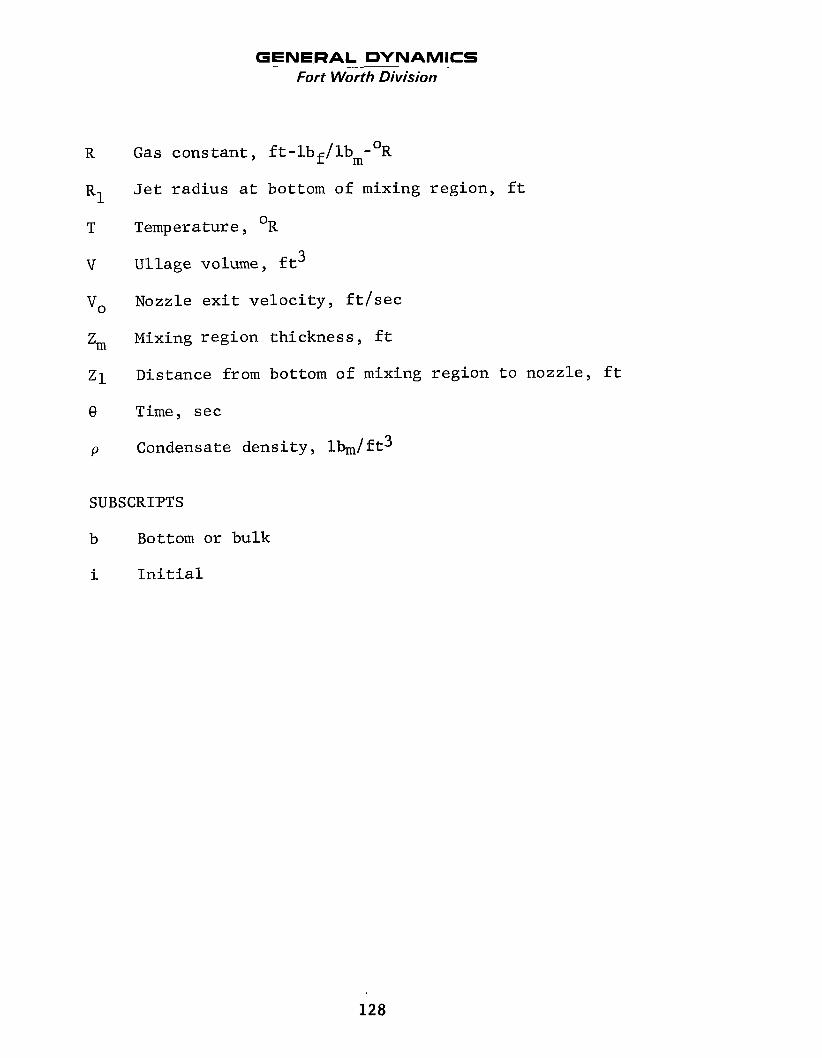
GENERAL DYNAMICS Fort Worth Division
R
R1
T
U
VO
Zm
Z1
0
P
Gas constant, ft-1bf/lbm-OR
Jet radius at bottom of mixing region, ft
Temperature , O R
Ullage volume, ft
Nozzle exit velocity, ft/sec
Mixing region thickness, ft
Distance from bottom of mixing region to nozzle, ft
Time, sec
Condensate density, lh/ft3
3
SUBSCRIPTS
b Bottom or bulk
i Initial
128
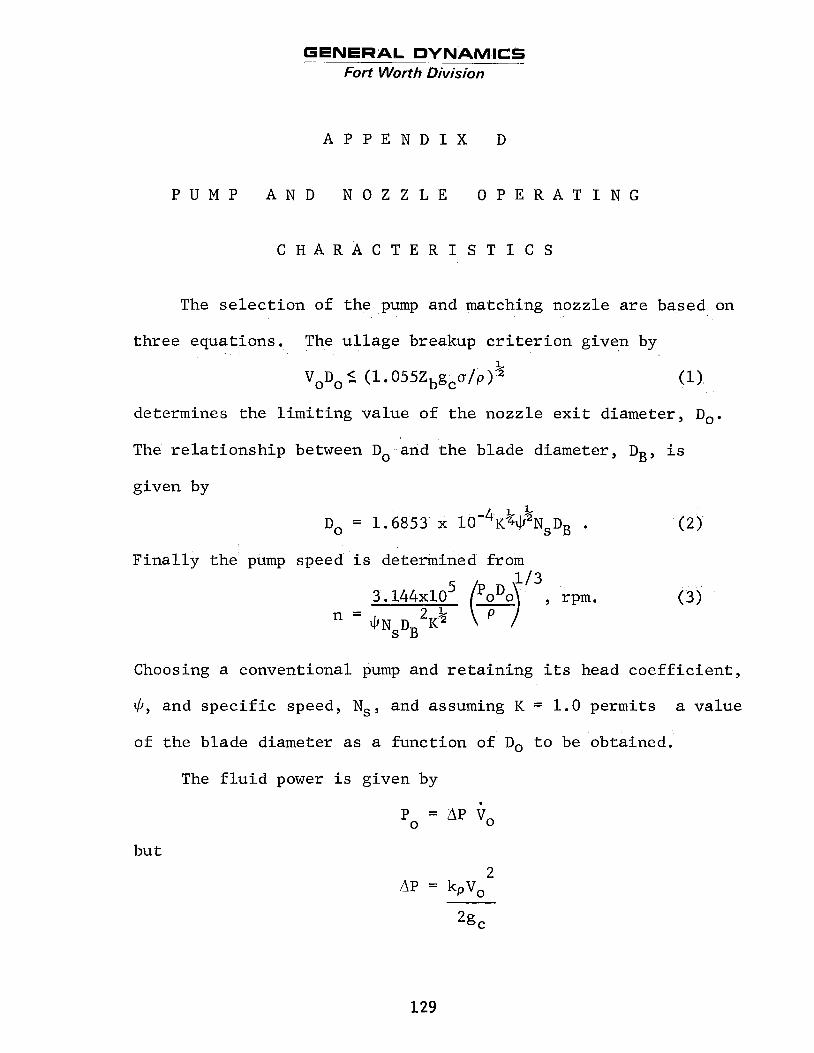
GENERAL DYNAMICS Fort Worth Division
A P P E N D I X D
P U M P A N D N O Z Z L E O P E R A T I N G
C H A R A C T E R I S T I C S
The select ion of the pump and matching nozzle a re based on
three equations. The ullage breakup c r i t e r ion given by
VoDo I (1 055Zbgca/p)’ (1)
determines the limiting value of the nozzle ex i t diameter, Do.
The relat ionship between Do and the blade diameter, Dg, i s
given by
(2) -4 1
DO = 1.6853 x 10 K6$2NsDB . Finally the pump speed i s determined from
Choosing a conventional pump and retaining i t s head coeff ic ient ,
6, and specif ic speed, N s , and assuming K = 1.0 permits
of the blade diameter as a function of Do t o be obtained.
a value
The f lu id power i s given by
P = AP Vo 0
but
2gC
129
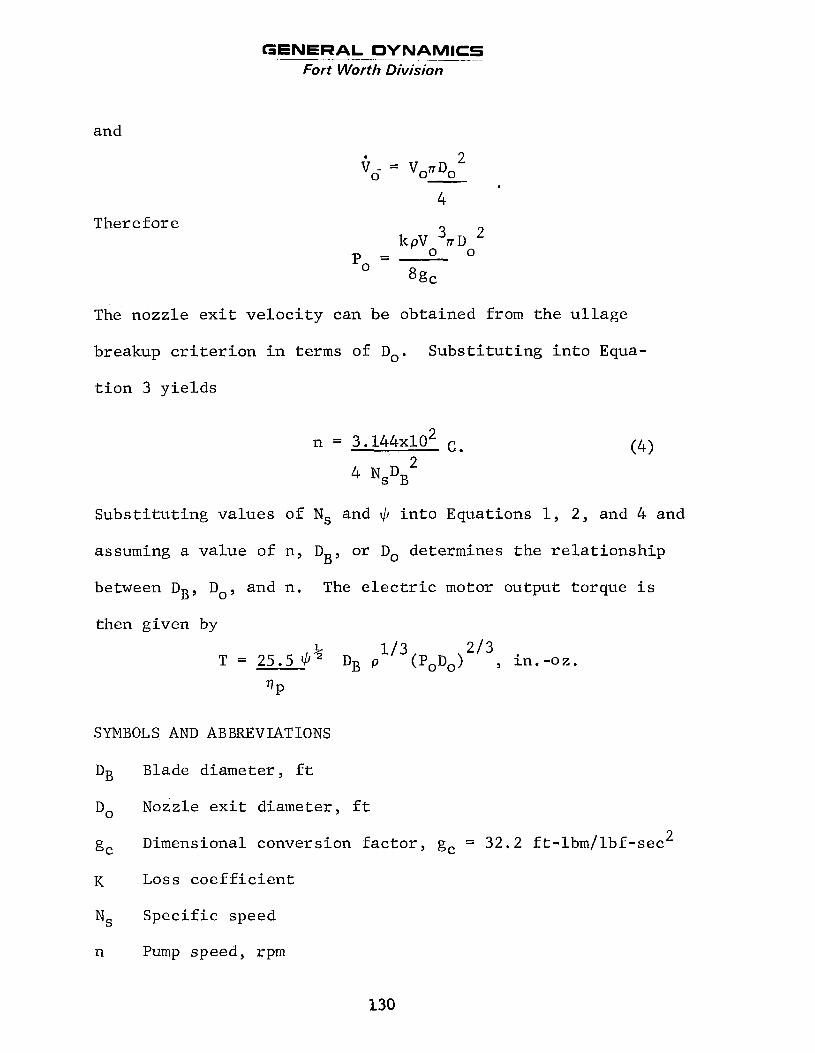
GENERAL DYNAMICS Fort Worth Division
and
Therefor e
2 V6 = VonDo - 4
3 2 kpV n D - 0 0
8gc -
The nozzle e x i t v e l o c i t y can be obtained from t h e u l l a g e
breakup c r i t e r i o n i n t e r m s of Do.
t i o n 3 y i e l d s
S u b s t i t u t i n g i n t o Equa-
( 4 ) n = 3.144~10’ C.
4
Subs t i t u t ing values o f Ns and + i n t o Equations 1, 2 , and 4 and
assuming a va lue of n ,
between D B y Do, and n.
or Do determines t h e r e l a t i o n s h i p DB , The e l e c t r i c motor output torque i s
then given by
T = 25.5 4% qP
SYMBOLS AND A B B R E V I A T I O N S
DB
DO
gC
K
NS
n
1’3(l?oDo) 2 / 3 , in . -oz. DB p
Blade diameter, f t
Nozzle e x i t diameter, f t
Dimensional conversion f a c t o r , gc = 32.2 f t - lbm/lbf-sec
Loss c o e f f i c i e n t
Spec i f i c speed
Pump speed, rpm
2
130
GENERAL DYNAMICS
0 P
T
VO
00
‘b
AP
?P
P
Fort Worth Division
Flu id power, w a t t s
Motor output torque, in-oz
Nozzle e x i t v e l o c i t y , f t / s ec
Nozzle e x i t volume flow r a t e , f t3 / sec
Liquid he igh t above nozzle , f t
Nozzle pressure drop, psf
Pump hydraul ic e f f i c i e n c y
Density, Ibm/ft3
Surface t ens ion , I b f / f t
Head c o e f f i c i e n t
131

GENERAL DYNAMICS Fort Worth Division
A P P E N D I X E
COPIES
1 1
1 1 1
1 1 1
2
1 1 1 1 1 1
1
5
D I S T R I B U T I O N L I S T
RECIPIENT DESIGNEE
NASA Headquarters, Washington, D.C. 20546 Contracting Of f i ce r Pa ten t Of f i ce
NASA L e w i s Research Center 2100 Brookpark Rd., Clevelend, Ohio 44135
Of f i ce of Technical Information Contracting Of f i ce r Pa ten t Of f i ce
NASA Manned Spacecraft Center Houston, Texas 77001
Off ice of Technical Information Contracting Of f i ce r Pa ten t Off ice
NASA Marshall Space F l i g h t Center Marshall Space F l igh t Center, Alabama 35812
Office of Technical Information, A&TS- MS-I Technical Library, A&TS-MS- IPL Purchasing Off ice , A&TS-PR-M Patent Off ice , A&TS-PAT D. Burrows, S&E-ASTN-PP Technology U t i l i z a t i o n Office, A&TS-TU B. Birdwell , S&E-ASTN-RRI
NASA Pasadena Off ice 4800 Oak Grove Drive, Pasadena, Calif. 91103
Pa ten t s and Contracts Management
Thomas W. Winstead (XI S&E-ASTN-PFC Marshall Space F l igh t Center Marshall Space F l i g h t Center, Alabama 35812
II I 1 'Copies s e n t d i r e c t l y t o "Recipient" marked with an X under
13 2 the column headed "Designee".
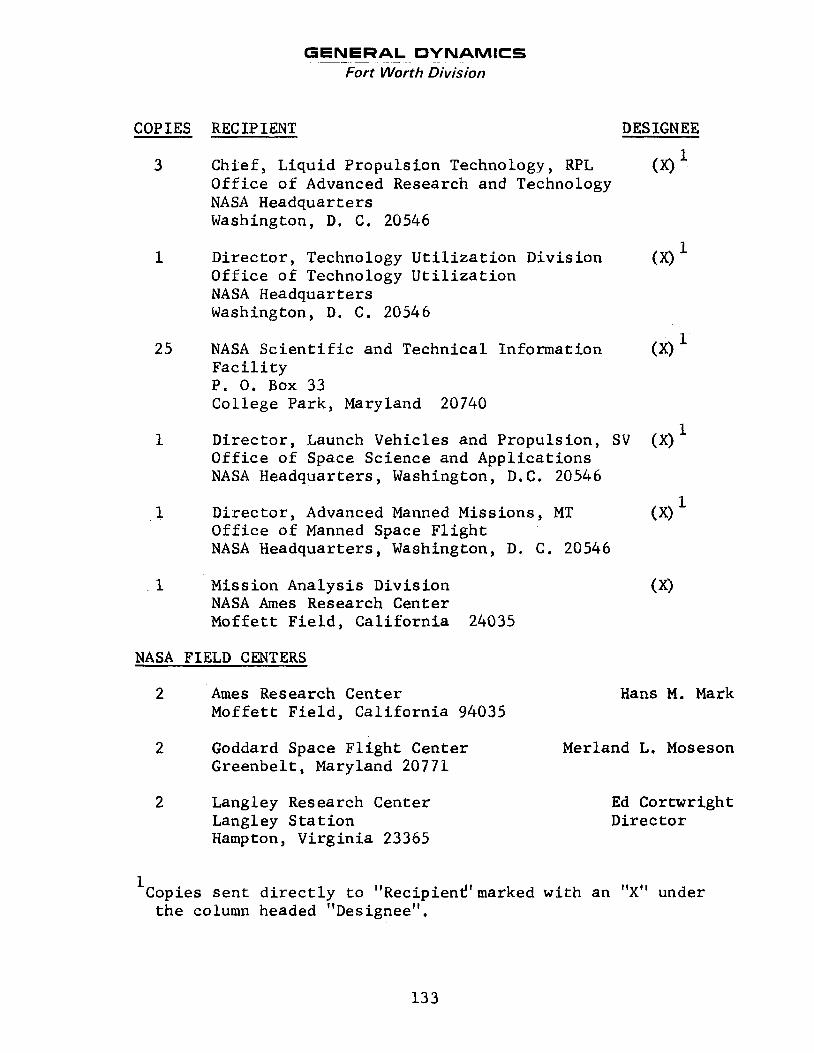
GENERAL DYNAMICS Fort Worth Division
_ _ -
COPIES RECIPIENT DESIGNEE
3 Chief , Liquid Propuls ion Technology, RPL ( X ) l Off i ce of Advanced Research and Technology NASA Headquarters Washington, D. C. 20546
1 Di rec to r , Technology U t i l i z a t i o n Divis ion (XI Of f i ce of Technology U t i l i z a t i o n NASA Headquarters Washington, D. C. 20546
25 NASA S c i e n t i f i c and Technical Information (X) F a c i l i t y P. 0. Box 33 College Park, Maryland 20740
1 1 Direc tor , Launch Vehicles and Propuls ion, SV (X) Office of Space Science and Applicat ions NASA Headquarters, Washington, D. C. 20546
1 Direc tor , Advanced Manned Missions, MT (X) Office of Manned Space F l i g h t NASA Headquarters, Washington, D. C. 20546
1 Mission Analysis Divis ion NASA Ames Research Center Moffet t F i e l d , Ca l i fo rn ia 24035
NASA FIELD CENTERS
2 A m e s Research Center Moffet t F i e ld , Ca l i fo rn ia 94035
Hans M. Mark
2 Goddard Space F l i g h t Center Merland L. Moseson Greenbel t , Maryland 20771
2 Langley Research Center Langley S t a t i o n Hampton , Virg in ia 23365
Ed Cortwright Di rec tor
Copies s e n t d i r e c t l y t o "Recipient!' marked with an "X" under 1
t h e column headed "Designee".
13.3

GENERAL DYNAMICS Fort Worth Division
NASA FIELD CENTERS
REC I P IEXT
2 L e w i s Research Center 21000 Brookpark Road Cleveland, Ohio 44135
DESIGNEE
Gordon Smith
2 John F. Kennedy Space Center , NASA D r . Kurt H. Debus Cocoa Beach, F lo r ida 32931
GOVERNMENT INSTALLATIONS
Aeronaut ical Systems Divis ion D. L. Schmidt A i r Force Systems Command Code ASRCNC-2 Wright-Patterson A i r Force Base Dayton, Ohio 45433
A i r Force Missile Development Center Maj. R. E. Bracken Holloman A i r Force Base, New Mexico 88330
A i r Force Missile Test Center P a t r i c k A i r Force Base, F lo r ida
Space and Missile Systems
A i r Force Unit Post Office Los Angeles, Ca l i fo rn ia 90045
Organizat ion
Bureau of Naval Weapons Department o f t h e Navy Washington, D. C. 20546
Defense Documentation Center Headquarters Cameron S t a t i o n , Building 5 5010 Duke S t r e e t Alexandria, Vi rg in ia 22314
Attn: TISIA
U. S. Army Missile Command Reds tone Arsenal Alabama 35809
L. H. U l l i a n
Col. Clark Technical Data
U. S. Naval Weapons Center China Lake C a l i f o r n i a 93557
J. Kay RTMS-41
M r . Walter Wharton
Code 4562 Chief, Missile Propulsion Div.
134
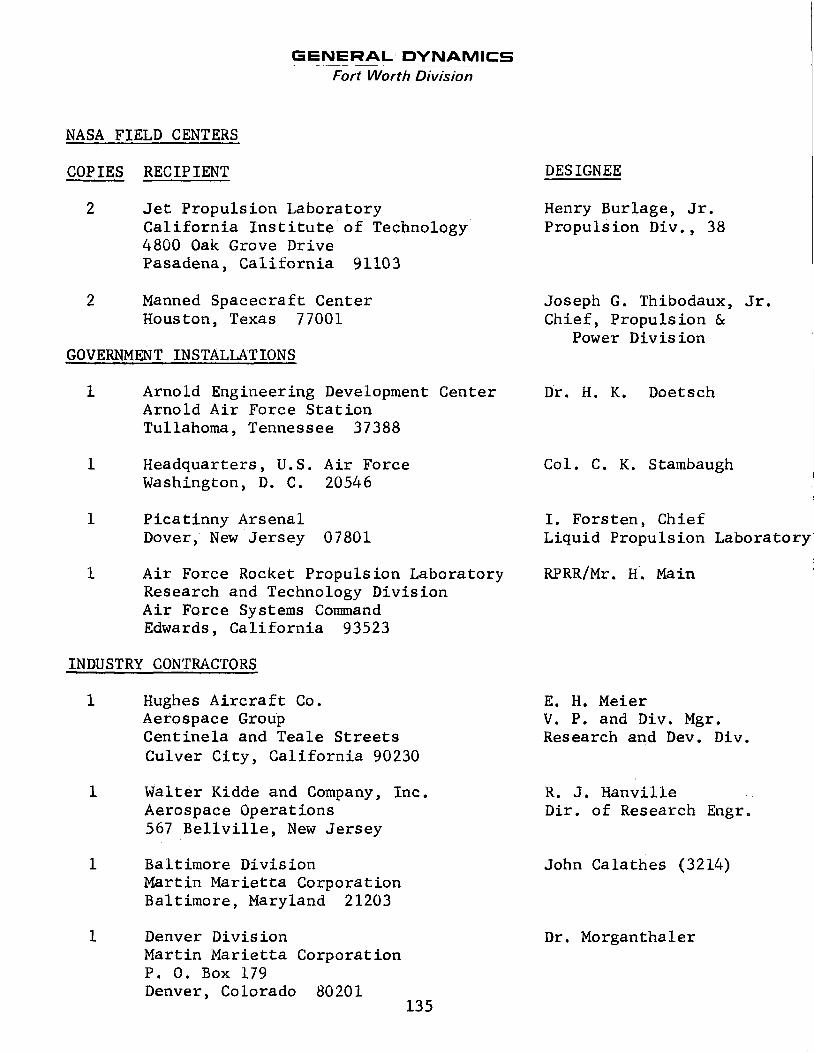
GENERAL DYNAMICS Fort Worth Division
~
NASA FIELD CENTERS
RECIPIENT
2 Je t Propuls ion Laboratory C a l i f o r n i a I n s t i t u t e of Technology 4800 Oak Grove Drive Pasadena, C a l i f o r n i a 91103
2 Manned Spacecraf t Center Houston, Texas 77001
GOVERNMENT INSTALLAT IONS
1 Arno Id Engineering Development Center Arnold A i r Force S t a t i o n Tullahoma, Tennessee 37388
1 Headquarters, U. S. A i r Force Washington, D. C. 20546
1 Pica t inny Arsenal Dover, New J e r sey 07801
1 A i r Force Rocket Propuls ion Laboratory Research and Technology Divis ion A i r Force Systems Command Edwards, Ca l i fo rn ia 93523
INDUSTRY CONTRACTORS
1 Hughes Aircraft Co. Aerospace Group Cent inela and Teale Streets Culver Ci ty , Ca l i fo rn ia 90230
1 Walter Kidde and Company, Inc. Aerospace Operations 567 B e l l v i l l e , New Je r sey
1 Baltimore Division Martin Marietta Corporation Baltimore, Maryland 21203
1 Denver Divis ion Martin Marietta Corporation P . 0. Box 179 Denver, Colorado 80201
13 5
DESIGNEE
Henry Burlage, Jr. Propuls ion Div., 38
Joseph G. Thibodaux, Jr. C h i e f , Propuls ion &
Power Divis ion
D r . H. K. Doetsch
Col. C. K. Stambaugh
I. Fors ten , Chief Liquid Propulsion Laboratory
RPRR/Mr. H. Main
E. H. Meier V. P. and Div. Mgr. Research and Dev. Div.
R. J. Hanvil le D i r . of Research Engr.
John Calathes (3214)
D r . Morganthaler
GENERAL DYNAMICS Fort Worth Division
C P I A
COPIES RECIPIENT DESIGNEE
1 Chemical Propulsion Information Agency Tom Reedy Applied Physics 8621 Georgia Avenue S i l v e r Spring, Maryland 20910
INDUSTRY CONTRACTORS
1 Aero j et-General Corporation P. 0. Box 296 Azusa Ca l i fo rn ia 91703
1 Aerojet-General Corporation P. 0. Box 1947 Technical Library Bldg. 2015, Dept . 2410 Sacramento, Ca l i fo rn ia 95803
1 Space Divis ion Aero j e t -General Corporation 9200 East F l a i r D r . E l Monte, Ca l i fo rn ia 91734
1 Aerospace Corporation 2400 East E l Segundo Boulevard P. 0. Box 95085 Los Angeles, Cal i forn ia 90045
1 A t l a n t i c Research Corporation Edsal l Road and Sh i r l ey Highway Alexandria Vi rg in ia 22314
1 Avco Sys t e m s Division Wilmington, Massachusetts
1 Beech A i r c r a f t Corporation Boulder Division Box 631 Boulder, Colorado
W. L. Rogers
R. S t i f f
S. Machlawski
John G. Wilder MS-2293
D r . Ray Friedman
Howard B. Winkler
J. H. Rodgers
136
GENERAL DYNAMICS Fort Worth Division
INDUSTRY CONTRACTORS
COPIES
1
1
1
1
1
1
1
1
1
1
RECIPIENT
B e l l Aerosystems Company P. 0. Box 1 Buffalo, New York 14240
Bellcomm 955 L'Enfant Plaza, S.W. Washington, D. C.
Bendix Sys terns Divis ion Bendix Corporation 3300 Plymouth Street Ann Arbor, Michigan
Boeing Company P. 0. Box 3707 S e a t t l e , Washington 98124
Boeing Company 1625 K Street , N. W. Washington, D. C. 20006
Boeing Company P. 0. Box 1680 Huntsv i l le , Alabama 35801
Missile Division Chrysler Corporation P. 0. Box 2628 Det ro i t , Michigan 48231
Wright Aeronautical Division Curtiss-Wright Corporation Wood-Ridge, New Jersey 07075
Research Center Fa i r ch i ld H i l l e r Corporation Germantown, Maryland
Republic Aviation Corporation Fairch i l d H i 1 l e r Corporation Farmingdale, Long Is land , New York
DESIGNEE
W. pi. Smith
H.S. London
John M, Brueger
J. D. Alexander
Library
Ted Snow
John Gates
G. K e l l e y
Ralph Hall
Library
137
GENERAL DYNAMICS Fort Worth Division
INDUSTRY CONTRACTORS
COPIES
1.
1
1
1
1
1
1
1
1
RECIPIENT
General Dynamics, Convair Divis ion Library & Information Serv ices (128-00) P. 0. Box 1128 San Diego, Ca l i fo rn ia 92112
Missile and Space Systems Center General Electric Company Valley Forge Space Technology Center P. 0. Box 8555 Ph i l ade lph ia , Pa.
Gruman A i r c r a f t Engineering Corp . Bethpage, Long Is land , New York
Honeywell, Inc. Aerospace Divis ion 2600 Ridgway Road Minneapolis, Minnesota
Arthur D. L i t t l e , Inc. 20 Acorn Park Cambridge, Massachusetts 02140
Lockheed Missiles and Space Co. Attn: Technical Information Center P. 0. Box 504 Sunnyvale, C a l i f o r n i a 94088
Lockheed Propuls ion Company P. 0. Box 111 Redlands, Ca l i fo rn ia 92374
The Marquardt Corporation 16555 Sa t icoy S t r e e t Van Nuys, Ca l i fo rn ia 91409
Orlando Divis ion Martin Marietta Corp. Box 5837 Orlando, F lo r ida
DESIGNEE
Frank Dore
F. Mezger F. E. Schul tz
Joseph Gavin
Gordon Harms
Library
J. G u i l l
H.L. Thackwell
Howard McFarland
J. Fern
13 8
GENERAL DYNAMICS Fort Worth Division
INDUSTRY CONTRACTORS
COPIES
1 t
1
1
1
1
1
1
1
1
RECIPIENT DESIGNEE
McDonnell Douglas A i r c r a f t Corp. R.A. Herzmark P. 0. Box 516 Munic i p a 1 Airpor t St. Louis, Missouri 63166
Space & Information Systems Division Library North American Rockwell 12214 Lakewood Boulevard Downey, Ca l i fo rn ia 90241
Northrop Space Laborator ies D r . W i l l i a m Howard 3401 West Broadway Hawthorne, Ca l i fo rn ia
Aeronutronic Division Phi lco Corporation Ford Road Newport Beach, Ca l i fo rn ia 92663
Astro-Electronics Division Radio Corporation of America Princeton, New J e r sey 08540
Sunstrand Aviation 2421 11th S t r e e t Rockford, I l l i n o i s 61101
TRW Systems Group TRW Incorporated One Space Park Redondo Beach, Ca l i fo rn ia 90278
TAPCO Division TRW, Incorporated 23555 Euclid Avenue Cleveland, Ohio 44117
Reaction Motors Divioion Thiskol Chemical Corporation Denville, New J e r sey 07832
D.A. Garrison
Y. B r i l l
R. W . Reynolds
G.W. Elverum
P.T. Angel1
Dwight S. Smith
139
GENERAL DYNAMICS Fort Worth Division
INDUSTRY CONTRACTORS
COPIES
1
1
1
1
1
1
1
1
1
RECIPIENT
Research Laborator ies United Aircraft Corporation 4 0 0 Main S t r e e t East Hartford, Connecticut 06108
Hamilton Standard Division United Aircraft Corporation Windsor Locks, Connecticut 06096
United Technology Center 587 Methilda Avenue P. 0. Box 358 Sunnyvale, Ca l i fo rn ia 94088
Flor ida Research and Development P r a t t and Whitney Aircraft United A i r c r a f t Corporation P. 0. Box 2 6 9 1 West Palm Beach, Flor ida 33402
Vickers, Inc . Box 302 Troy, Michigan
Missile and Space System Division McDonnell-Douglas A i r c r a f t Company 3000 Ocean Park Boulevard Santa Monica, Ca l i fo rn ia 90406
Rocketdyne (Library 586-306) 6633 Cdnoga Avenue Canoga Park, Ca l i fo rn ia 91304
Rocket Research Corporation 520 South Port land Street S e a t t l e , Washington 98108
Stanford Research I n s t i t u t e 333 Ravenswood Avenue Menlo Park, Cal i forn ia 94025
DESIGNEE
Erle Martin
R. Hatch
D r . David Altman
R. J. Coar
R. W. Hallet Chief Engineer Adv. Space Tech.
D r . R. J. Thompson S. F. I a c o b e l l i s
Foy McCullough, Jr.
D r . Gerald Marksman
140

GENERAL DYNAMICS Fort Worth Division
P. 0. Box 748
Fort Worth, Texas 76101