study managed workplaces 2015 an ecological and ... executive summary managed workplaces 2015 1 as...
TRANSCRIPT

Study
"Managed Workplaces 2015" An ecological and economic analysis of software thin clients
© Fraunhofer UMSICHT
for: IGEL Technology GmbH Dr. Frank Lampe Hanna-Kunath-Str. 31 28199 Bremen
Oberhausen, 12 March 2015

"Managed Workplaces 2015" An ecological and economic analysis of software thin clients
presented by: Fraunhofer Institute for Environmental, Safety, and Energy Technology UMSICHT Director Prof. Dr.-Ing. Eckhard Weidner Osterfelder Straße 3 46047 Oberhausen Internet: www.umsicht.fraunhofer.de
Project team and contacts:
Name Telephone E-mail
Christian Knermann* 0208 8598-1118 [email protected]
Thorsten Wack 0208 8598-1278 [email protected]
André Reinecke 0208 8598-1318 [email protected]
Thomas Bieseke 0208 8598-1199 [email protected]
Dr.-Ing. Markus Hiebel 0208 8598-1181 [email protected]
Dipl.-Lök. Daniel Maga 0208 8598-1191 [email protected]
Tatiana Bladier 0208 8598-1494 [email protected]
* Project management
Date of last revision: 12 March 2015
Copyright notice
Copyright to the concepts, drafts, analyses, studies and other documents prepared as
part of this study by Fraunhofer UMSICHT lies with Fraunhofer UMSICHT. Any transfer
of copyright must be stated in writing.
The client is entitled to use this study for the purposes set out in the order. Duplication
is only permitted if explicitly approved by Fraunhofer UMSICHT. Modifications, transla-
tions and digital editing are prohibited. Forwarding the study to third parties, except for
public funding bodies or financiers, is prohibited unless approved in writing by Fraun-
hofer UMSICHT.
©Copyright Fraunhofer UMSICHT, 2015

I As at: 12 March 2015 ©Fraunhofer UMSICHT
Contents
1 Executive summary 1
2 Objective 5 2.1 Historical background 5 2.2 Hardware thin clients 6 2.3 Software thin clients 6
3 Methodology 8 3.1 Calculating greenhouse gas emissions: carbon footprint 8 3.2 System limits 8 3.3 Systems and scenarios considered 9 3.4 Functional unit 11 3.5 Use of devices to measure power consumption 11 3.6 Installing thin client software 12
4 Collecting data and selecting the devices to be compared 14
4.1 Data basis and data quality 14 4.2 Production phase 15 4.2.1 Selecting the analyzed desktop PC 15 4.2.2 Selecting the analyzed notebook 19 4.2.3 Selecting the analyzed server 23 4.3 Distribution 26 4.4 Usage phase 27 4.4.1 PC with thin client software 28 4.4.2 PC with Windows 7 28 4.4.3 Notebook with thin client software 30 4.4.4 Notebook with Windows 7 31 4.4.5 Server share 32 4.5 End of life 32
5 Calculating the carbon footprint 34 5.1 Results for scenarios 1 to 4 34 5.2 Sensitivity analyses for the production phase 35 5.2.1 Sensitivity analysis: low emissions 35 5.2.2 Sensitivity analysis: high emissions 36 5.3 Sensitivity analysis for the distribution phase 37 5.4 Sensitivity analyses for the operating phase 37 5.4.1 Older PC with high power consumption 37 5.4.2 Country comparisons – USA and GB 38

II As at: 12 March 2015 ©Fraunhofer UMSICHT
6 Interpretation of the results 41 6.1 Assumptions, consistency and data quality 41
7 Cost-effectiveness 43 7.1 Life cycle during company use 43 7.1.1 Procurement and installation 43 7.1.2 Operation 44 7.1.3 Uninstalling and disposal 44 7.2 Life cycle for each usage scenario 44 7.2.1 New desktop PC 44 7.2.2 New notebook 46 7.2.3 Old desktop PC as a software thin client 47 7.2.4 Old notebook as a software thin client 48 7.2.5 New hardware thin client 49 7.3 Comparison 49 7.4 Projection 50
8 Conclusion and recommendations 53
9 List of literature 55
10 List of tables 58
11 List of figures 59

1 EXECUT IVE SUMMARY
1
FINAL REPORT Managed Workplaces 2015
As at: 12 March 2015 ©Fraunhofer UMSICHT
1 Executive summary
The greenhouse effect is a natural process within the Earth's atmosphere which causes temperatures that humans find pleasant to prevail on the Earth. Howev-er, particularly since the onset of industrialization, the human race has intensi-fied this effect as combustion and other industrial processes release green-house gases which, with their increased concentration, influence the Earth's radiation balance and thus the greenhouse effect.
A long-term stabilization of the atmosphere's natural greenhouse effect can only be achieved by significantly reducing emissions of CO2 or CO2 equivalents. Possible measures for reducing greenhouse gas emissions include increasing the energy efficiency of machinery, e.g. through intelligent control programs, or replacing energy-intensive computer architectures with low-CO2 solutions. Under the heading of "Green IT", approaches and solutions which would ena-ble the IT sector to help reduce greenhouse gas emissions are being discussed.
These emissions are by no means caused by the power consumption of com-puter systems during the operating phase alone. The production of these sys-tems too makes a significant contribution towards greenhouse gas emissions. Accordingly, a comprehensive ecological assessment of an IT component or in-frastructure should cover the entire life cycle, including the production, manu-facturing, distribution, operating and recycling/disposal phases.
In view of the above, the object of this study is to investigate possible ways of reducing emissions of CO2 equivalents by IT components. The study focuses on the operating models of various workstation computers and, in particular, so-called software thin clients. This term refers to a software solution which allows existing workstation computers (desktop PCs or notebooks) to be converted in-to logical thin clients in order to extend the devices' operating lives. The devices are put to secondary use as clients in server-based computing infrastructures.
The technical details of this approach are presented, before the use of software thin clients is compared with that of conventional desktop PCs and notebooks. This comparison is made as part of a complete environmental analysis which assesses the entire life cycle including production, manufacturing, distribution, operation and recycling/disposal.
The impact category GWP (global warming potential measured in kilograms of CO2 equivalents [kg CO2e]) is used in the final assessment.
In a further step, the use of the various solutions is also examined from an eco-nomic point of view for companies of different sizes.
Initial situation
Objective

1 EXECUT IVE SUMMARY
2
FINAL REPORT Managed Workplaces 2015
As at: 12 March 2015 ©Fraunhofer UMSICHT
The analysis of the entire life cycle shows that a significant proportion of CO2e emissions can be attributed to the production of the devices. This means that, conversely, the reuse of old devices as logical thin clients avoids or postpones the production of new devices and thus has a positive impact on the environ-ment.
If a newly purchased, modern PC model (scenario 1) is directly compared with an older PC which continues to be used as a software thin client (scenario 2), it becomes apparent that the software thin client reduces emissions in relative terms by approx. 59 % over the entire three-year evaluation period1. In abso-lute terms, this equates to a reduction of 198.8 kg CO2e per workstation.
If, in an ideal scenario, all workstations at a company were converted into thin clients, the saving for 100 workstations would amount to 19.88 t CO2e. For a larger company with 600 workstations, this figure would accordingly be 119.3 t CO2e and for a very large company with 15,000 workstations, 2,982 t CO2e could be avoided.
The following graphic visualizes the results. In scenarios 3 and 4, the end-of-life phase is so small that it is not shown.
Figure 1-1: Greenhouse gas (GG) emissions for the sce-narios with German electricity mix (ICT = information and communication tech-nology)
The use of software thin clients appears to makes sense from an economic point of view too. For the desktop PC in a scenario with 100 clients, costs of approx. €2,165 are incurred. For the notebook, this figure is approx. €2,590. In contrast, an older desktop PC operating as a logical thin client costs approx. €1,157, a notebook operating as a logical thin client approx. €1,176 and a hardware thin client €1,413.
1 The difference between scenarios 3 and 4 corresponds approximately to a relative saving of 33 %.
Summary of the
results
1 EXECUT IVE SUMMARY
3
FINAL REPORT Managed Workplaces 2015
As at: 12 March 2015 ©Fraunhofer UMSICHT
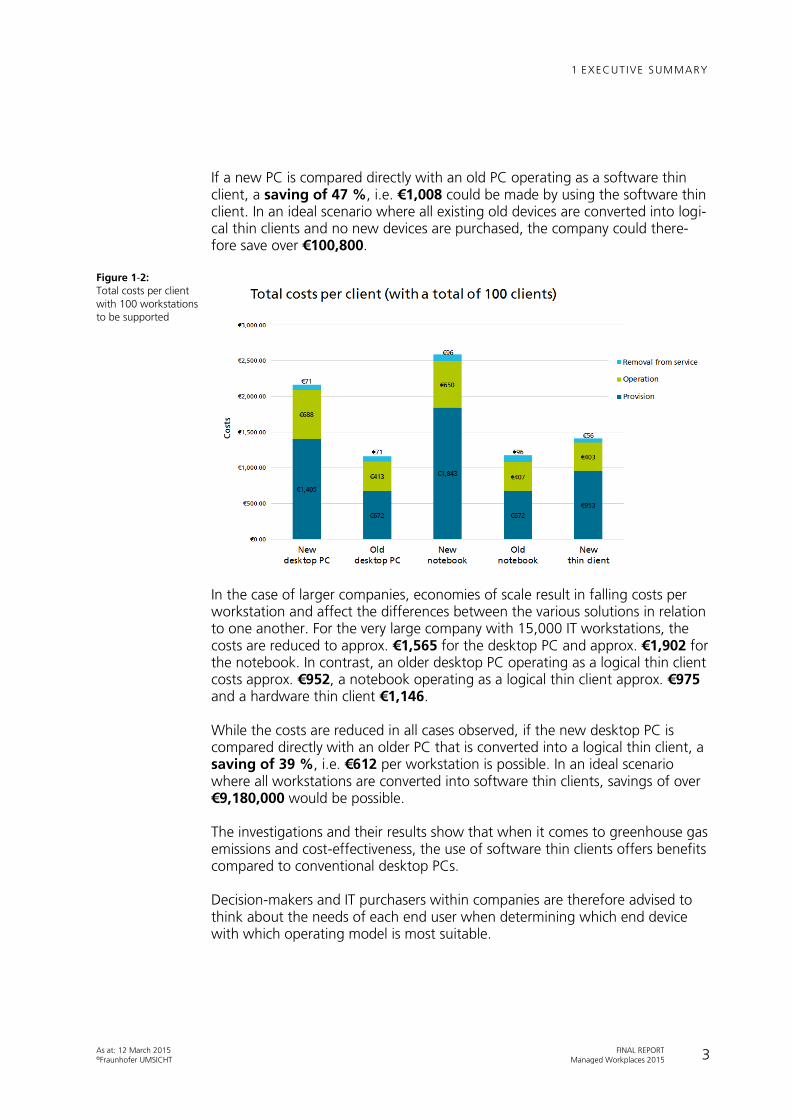
If a new PC is compared directly with an old PC operating as a software thin client, a saving of 47 %, i.e. €1,008 could be made by using the software thin client. In an ideal scenario where all existing old devices are converted into logi-cal thin clients and no new devices are purchased, the company could there-fore save over €100,800.
Figure 1-2: Total costs per client with 100 workstations to be supported
In the case of larger companies, economies of scale result in falling costs per workstation and affect the differences between the various solutions in relation to one another. For the very large company with 15,000 IT workstations, the costs are reduced to approx. €1,565 for the desktop PC and approx. €1,902 for the notebook. In contrast, an older desktop PC operating as a logical thin client costs approx. €952, a notebook operating as a logical thin client approx. €975 and a hardware thin client €1,146.
While the costs are reduced in all cases observed, if the new desktop PC is compared directly with an older PC that is converted into a logical thin client, a saving of 39 %, i.e. €612 per workstation is possible. In an ideal scenario where all workstations are converted into software thin clients, savings of over €9,180,000 would be possible.
The investigations and their results show that when it comes to greenhouse gas emissions and cost-effectiveness, the use of software thin clients offers benefits compared to conventional desktop PCs.
Decision-makers and IT purchasers within companies are therefore advised to think about the needs of each end user when determining which end device with which operating model is most suitable.

1 EXECUT IVE SUMMARY
4
FINAL REPORT Managed Workplaces 2015
As at: 12 March 2015 ©Fraunhofer UMSICHT
In this context, software thin clients provide an ideal introduction to the strate-gic use of server-based computing. Since the old devices that are converted in-to logical thin clients are already available within the company, there is no need to invest in new hardware and only moderate costs are incurred as a result of procuring and commissioning the thin client software and, if necessary, setting up further terminal servers to support these clients.
Software thin clients therefore offer an economical way of achieving gentle migration towards a strategic thin client concept. The logical next step on this route is to replace the old devices with hardware thin clients once the old de-vices reach the end of their extended life cycle.

2 OBJECT IVE
5
FINAL REPORT Managed Workplaces 2015
As at: 12 March 2015 ©Fraunhofer UMSICHT
2 Objective
This study looks at the use of so-called software thin clients from an ecological and economic point of view. The technical and historical background of soft-ware thin clients is described briefly in the following sections, before the meth-odology, data collection and data evaluation are presented in the subsequent main chapters.
The study thus continues the investigations carried out in the earlier "Thin Cli-ents 2011 – Ecological and Economic Aspects of Virtual Desktops" report [Fraunhofer UMSICHT – 2011] and broadens the focus to include this new sce-nario with software thin clients. Here too, production, operation and the sub-sequent disposal of the hardware required for operation are taken into ac-count.
The greenhouse gas emissions were calculated once again in order to assess the environmental impact. The topic remains a current one and without specific reduction targets on the part of the world community, it will be virtually impos-sible to achieve the goal of limiting the global temperature increase to 2 °C. Other, intelligent usage concepts (in the area of IT too) are required here in or-der to help protect the climate (and thus reduce greenhouse gas emissions).
2.1 Historical background
The technical basis for server-based computing (SBC) is not a fundamentally new invention. It goes back to an operating model that was used during the mainframes era from the middle of the last century. In relation to the power available, computing capacities were scarce and significantly more expensive than they are today. At workstations, simple text terminals such as the "VT100" model developed by the Digital Equipment Corporation (DEC) in the 1970s were used. These devices were connected to the central computers us-ing serial cables and were only used for input and output operations – all calcu-lations were carried out centrally. This is also referred to as the remote presen-tation principle.
The development of networks with the Ethernet standard and the TCP/IP pro-tocol commonly used today did not start until later. Distributed working on the basis of the remote presentation principle was possible in these networks too, for example with the X11 protocol implemented in the UNIX operating system.
The switch to the local use of computing capacities and distributed data stor-age only began when the IBM PC and compatible systems were launched. At the time, the widespread MS-DOS operating system with its graphical user in-terface Windows (for Workgroups) still lacked multi-user and multi-tasking support, which meant that remote presentation work was initially not possible.

2 OBJECT IVE
6
FINAL REPORT Managed Workplaces 2015
As at: 12 March 2015 ©Fraunhofer UMSICHT
All data processing took place on the clients. The fact that PC systems offered computing power for a relatively low cost price, encouraged this development.
Given the increasing costs of client management and more exacting security requirements, another rethink took place in the mid-1990s and working on central servers once again became more popular. In the world of Windows op-erating systems, Microsoft supported this process by developing the "Terminal Server Edition (TSE)", a variant of the Windows NT operating system, in coop-eration with Citrix Systems. This system supported not only multi-user and mul-ti-tasking operation but also remote access – initially via Citrix's own "Inde-pendent Computing Architecture (ICA)" protocol and, later, via Microsoft's "Remote Desktop Protocol (RDP)".
2.2 Hardware thin clients
At the same time, so-called thin clients, descendants of the text terminals from the early days of data processing, became established as an alternative to con-ventional PCs. Since then, thin clients have been available as hardware in vari-ous forms. The systems are significantly more compact than PCs and generally do not require active components such as fans or hard disks. As far as the op-erating system is concerned, the systems often use an embedded version of Microsoft Windows or a Linux system which has been specially adapted for this purpose. A key task of the thin client operating systems is to serve as a plat-form for the client programs of various server infrastructures.
Unlike in the early days of Windows NT TSE, the clients now have a rich ecosys-tem with various solutions on the server side. Examples include the remote desktop services which are still accessible via RDP (a Microsoft-only solution) and Citrix XenApp which communicates via ICA. In addition to the classic ter-minal servers, desktop virtualization too is now an established operating model. In this case, a dedicated client operating system is made available to each user instead of a server operating system running in multi-user mode. Microsoft and Citrix offer solutions in this area as well. However, there are other players too, for example VMware with its Horizon View product and its own protocol for remote presentation called "PC-over-IP (PCoIP)".
Given the further development of the infrastructure solutions in conjunction with significant improvements in the performance of remote protocols, thin cli-ents nowadays can be used for virtually any application which is possible with a conventional PC.
2.3 Software thin clients
In recent years, software thin clients have become established as a further al-ternative to conventional PCs and the now well-known hardware thin clients. In 2002, IGEL introduced the IGEL Thin Client Card (TC Card), a precursor to this development. Thanks to an integrated CompactFlash card, it converted a conventional PC into a thin client.

2 OBJECT IVE
7
FINAL REPORT Managed Workplaces 2015
As at: 12 March 2015 ©Fraunhofer UMSICHT
In contrast, thin client operating systems nowadays are usually installed on the hard disk or a solid state disk (SSD). The term "PC repurposing" is also used in this context. The aim here is to use PC and notebook hardware in a different way. In this case, the thin client is not offered as a complete package compris-ing client hardware and software. Instead, an adapted thin client operating sys-tem such as the IGEL Universal Desktop Converter (UDC2) introduced in 2009 is used for installation on any PC or notebook system [Knermann – 2014].
Various factors have led to a surge in the popularity of software thin clients. These include the end of support for the Microsoft Windows XP operating sys-tem in April 2014. As a result of this, it would no longer be possible to contin-ue using numerous client computers, in particular in company settings, reliably. In many cases, the systems were simply outdated and were unsuitable for up-dating to newer versions of Windows owing to a lack of performance or tech-nical compatibility.
By converting them into thin clients, computers like these do not necessarily need to be disposed of. Thanks to remote presentation, they can continue to operate for a number of years as clients for a terminal server or virtual desktop. The ecological and economic effects of this approach are examined and as-sessed below.

3 METHODOLOGY
8
FINAL REPORT Managed Workplaces 2015
As at: 12 March 2015 ©Fraunhofer UMSICHT
3 Methodology
3.1 Calculating greenhouse gas emissions: carbon footprint
Given its wide-reaching, global effects, climate change is a particularly im-portant issue nowadays. Climate change refers to the negative environmental effects of the anthropogenic warming of the Earth's atmosphere and is one of the most commonly assessed categories in environmental analyses.
With the GWP (global warming potential) for climate-relevant gases, the Inter-governmental Panel on Climate Change (IPCC) has created an appropriate, in-ternationally recognized system for converting and aggregating figures relating to these gases within the climate change (global warming potential) category [IPCC – 2007]. This system allows the global warming potential of a product over its life cycle to be calculated using the "Increase in infrared radiation" in-dicator with the "CO2 equivalents (CO2e)" indicator value (unit) and the "glob-al warming potential (GWP) for each greenhouse gas" characterizing factor. In order to assess the climate impact of ICT devices (ICT = Information and Com-munication Technology), the "Increase in infrared radiation" indicator which takes into account greenhouse gases including carbon dioxide (CO2), methane (CH4), nitrous oxide (laughing gas, N2O), haloalkanes and sulfur hexafluoride (SF6) is used. For the calculation, characterizing factors in accordance with ReCiPe 1.08 (Hierarchist model, last updated December 2013) are used [Goedkoop – 2013]. It is assumed that the greenhouse gases remain in the at-mosphere for a period of 100 years.
3.2 System limits
The study looks at the carbon footprint of ICT devices "from the cradle to the grave". The life cycle phases are visualized in Figure 3-1.
Figure 3-1: Life cycle approach for analyzing ICT devices
The following phases of the life cycle are explicitly taken into account. It is as-sumed that the systems are used as intended at all times:
Material manufacture and production of the ICT device (without display)
Logistics/distribution
Use of the ICT device
End-of-life phase (disposal/recycling) of the ICT device
3 METHODOLOGY
9
FINAL REPORT Managed Workplaces 2015
As at: 12 March 2015 ©Fraunhofer UMSICHT
When analyzing the production of notebooks, the integrated display is included for design reasons. This is not the case with a desktop PC. During the usage phase, the power consumption of the notebook screen is not included by measuring the notebook in its docking station with the lid closed.
3.3 Systems and scenarios considered
The analysis of the environmental effects involves assessing the operation of a workstation device as a software thin client with regard to production, opera-tion and disposal, paying particular attention to the energy intensity (CO2 emis-sions) for
a typical desktop PC and
a typical notebook.
The cost-effectiveness analysis involves assessing five usage scenarios for managed desktops with regard to procurement costs, work-related outlay and power consumption. The following usage scenarios are considered:
Purchasing a new PC
Purchasing a new notebook
Continuing to use an old PC as a software thin client
Continuing to use an old notebook as a software thin client
Purchasing a new hardware thin client
A projection is also made for two company types:
1. A medium-sized company with 600 IT workstations
2. A large company with 15,000 IT workstations.
The scenarios investigated are presented in greater detail from an environmen-tal point of view below.
In scenario 1 which serves as a reference scenario and is shown in Figure 3-2, the entire life cycle of a desktop PC is assessed with regard to its greenhouse gas emissions. This includes its production, use and disposal.

3 METHODOLOGY
10
FINAL REPORT Managed Workplaces 2015
As at: 12 March 2015 ©Fraunhofer UMSICHT
Figure 3-2: Scenario 1: Working with a new desktop PC
Scenario 2 looks at a situation where an old desktop PC can continue to be used as a software thin client. In this case, the production of the device can be disregarded. At the end of its life cycle, the device is disposed of like a new PC. Scenario 2 is visualized in Figure 3-3.
Figure 3-3: Scenario 2: Working with a used desktop PC as a thin client
In scenario 3, it is assumed that work is carried out on a new notebook.
Figure 3-4: Scenario 3: Working with a new notebook
Scenario 3 is compared to the option of continuing to use an old notebook as a software thin client. This option is explored in scenario 4.

3 METHODOLOGY
11
FINAL REPORT Managed Workplaces 2015
As at: 12 March 2015 ©Fraunhofer UMSICHT
Figure 3-5: Scenario 4: Working with a used notebook as a thin client
3.4 Functional unit
According to ISO 14040, the functional unit is defined as the "quantified per-formance of a product system for use as a reference unit in a life cycle assess-ment study" [DIN Deutsches Institut für Normung e.V. – November 2009].
The "three-year use" of an ICT device is defined as the functional unit. This means that a production outlay of three years is used as a basis and applied to the relevant ICT device depending on its own operating life. It is assumed that new devices (desktop PC and notebook) have an operating life of five years. As a result, 3/5 of the production outlay is used for the functional unit. The same applies to distribution and the end-of-life phase (recycling/disposal) of the ICT devices. For power consumption during the usage phase, three years' operation is used in line with the functional unit. User behavior is described in detail in Chapter 4.3. As far as the old devices are concerned, it is assumed that they can be operated as thin clients for another three years without having to be re-placed. Since the old devices are ICT devices that would otherwise have to be disposed of, the outlay for their manufacture is not taken into account in the analysis.
3.5 Use of devices to measure power consumption
The electricity consumption of IT components measured in watts (W) is a key factor when assessing the operating phase of IT components from an environ-mental point of view. When measuring the power consumption, however, it must not be forgotten that the power supply units used in computers create a phase shift between current and voltage owing to capacitive and inductive ef-fects. The product of the effective values of current and voltage is termed the apparent power and is measured in volt-amperes (VA).

3 METHODOLOGY
12
FINAL REPORT Managed Workplaces 2015
As at: 12 March 2015 ©Fraunhofer UMSICHT
However, only the active power is relevant here because this is the part of the apparent power that actually produces work, i.e. uses power and is ultimately converted into heat.
The relationship between apparent and active power is expressed by the so-called power factor (PF). The apparent and active powers are identical only in an ideal scenario with a PF of 1. Many low-cost measuring devices that do not take the power factor into account record the apparent power but not the ac-tive power that is relevant for energy consumption and thus provide values that are too high, which would distort the results.
Although the power supply units of PCs which typically have a nominal rating of over 50 W or 75 W (depending on the device category) must include power-factor correction in accordance with the EN 61000-3-2 standard, this cannot completely compensate for phase shift and thus a deviation between the active and apparent power. Accordingly, the high-precision single-phase power ana-lyzer LMG95 from the company ZES Zimmer Electronic Systems was used to record the power consumption of the clients in the scenarios considered. This device also allows precise measurement of non-linear loads which are typically present in switching power supply units and indicates the PF as well as the ap-parent and active power. The device's error of measurement is 0.015 % of the measured value and 0.01 % of the measuring range for a fundamental fre-quency of 45-65 Hz.
In order to determine the environmental impact when operating the clients, the active power is considered in relation to the expected emissions of CO2 equiva-lents (CO2e).
3.6 Installing thin client software
The IGEL Universal Desktop Converter (UDC2) in Version 5.05.100 was installed locally, using the interactive setup, on the devices examined in Chapter 4.4 by way of example. In order to do this, a USB stick bootable with Syslinux was created using the "UDC2Stick.exe" setup program provided by IGEL and then used for installation.
For installations on a large number of clients, the manufacturer offers two pro-cedures for automatically installing the UDC2. This is possible via a pre-config-ured virtual machine, the so-called "UDC Deployment Appliance" or via the Microsoft Remote Installation Services (RIS). Further information regarding in-stallation, technical requirements and the properties of the UDC2 can be found in [Knermann – 2014].
After being installed successfully, the clients were integrated into the central-ized management system of an instance of the IGEL Universal Management Suite (UMS) in Version 4.08.100 and supplied with the necessary settings via the management server in order to be able to access a central terminal server infrastructure.

3 METHODOLOGY
13
FINAL REPORT Managed Workplaces 2015
As at: 12 March 2015 ©Fraunhofer UMSICHT
The UMS allows 100 % of the client configuration of Linux devices to be man-aged centrally. As a result, the client computers can be incorporated efficiently into a management concept and the need for local administrative work on the device itself is virtually eliminated.

4 COLLECT ING DATA AND SELECT ING THE DEV ICE S TO BE COMPARED
14
FINAL REPORT Managed Workplaces 2015
As at: 12 March 2015 ©Fraunhofer UMSICHT
4 Collecting data and selecting the devices to be compared
4.1 Data basis and data quality
The data needed to calculate greenhouse gas emissions are based on publicly accessible environmental analysis studies of ICT devices that were carried out in recent years. During literature research, a total of ten studies on desktop PCs in which 22 desktop PCs were analyzed from an environmental point of view were identified. As regards notebooks, 13 studies in which 30 notebooks were examined were identified. Most of these studies examined the environmental effects of the ICT devices over their life cycle, while a number of them relate to the social effects [Ciroth – 2011; Ekener-Petersen – 2013; Manhart – 2006].
Apple has published "Environmental Reports" which show the carbon footprint of current desktop PCs and notebooks (e.g. [Apple Inc – 2014e], [Apple Inc – 2014c]). Since these reports are published by Apple itself, it is difficult to assess the quality of the data.
In addition to the reports from Apple, publicly subsidized studies relating either to average ICT device groups or a specific model have been carried out. An ex-ample of average ICT devices is the group made up of a desktop PC and a notebook (IVF – 2007) published in the "Lot 3 Study". These were used as a reference in previous studies for IGEL Technology GmbH. In recent years, fur-ther studies relating to desktop PCs from Dell have been published. The Dell OptiPlex 580, Dell OptiPlex 790 (IVF – 2007), Dell OptiPlex 780 Mini Tower and the Dell FX-100 zero client [Teehan, Kandlikar – 2013a] were examined. Details of the materials and components which make up the Dell OptiPlex 780 can be found in the annex to the dissertation of Teehan [Teehan, Kandlikar – 2013b]. The Dell Optiplex 780 Mini Tower desktop was produced in around 2010, measures 41 cm x 43 cm x 19 cm and weighs 10.7 kg.
The majority of environmental analysis studies use background data which con-tain information on the environmental impact of ICT components such as tran-sistors which were taken from the ecoinvent database. The ecoinvent data pro-vide details of the production, use and disposal of the components [Hischier, Classen, Lehmann, Scharnhorst – 2007a]. ecoinvent also contains data on modules such as [Hischier, Classen, Lehmann, Scharnhorst – 2007b], entire de-vices such as a desktop computer, LCD monitor etc. [Lehmann, Hischier – 2007], consumption figures during the usage phase [Lehmann – 2007] and specific data on various disposal paths and recycling processes [Hischier – 2007].
In addition to these background databases, special databases such as that of the MEErP study [Kemna – 2011], the national Korean database [Choi – 2006] or the GaBi database of PE International [Herrmann – 2008] are used in this study.

4 COLLECT ING DATA AND SELECT ING THE DEV ICE S TO BE COMPARED
15
FINAL REPORT Managed Workplaces 2015
As at: 12 March 2015 ©Fraunhofer UMSICHT
4.2 Production phase
4.2.1 Selecting the analyzed desktop PC
Not all of the studies on desktop PCs give clear details of greenhouse gas emis-sions during the production phase. A total of 14 greenhouse gas analyses for desktop PCs have been included in the study [Scheumann – 2013] [Apple Inc – 2014e] [Apple Inc – 2013a] [Apple Inc – 2014f] [Apple Inc – 2014i] [Apple Inc – 2013e] [IVF – 2007] [Song – 2013] [Teehan, Kandlikar – 2013a]. Figure 4-1 shows the greenhouse gas emissions and the weight of various desktop PCs. For visual reasons,a value for an older PC dating back to 1998 with a weight of 22 kg and 189 kg CO2 equivalents is not shown in Figure 4-1.
Figure 4-1: Greenhouse gas emis-sions during the pro-duction of desktop PCs and their weights (14 values, one is hidden, green dots represent the average)
Figure 4-1 shows that there is no clear link between the weight of a desktop PC and the greenhouse gas emissions during its production. The Apple devices tend to be heavier and have a comparatively large carbon footprint. Although the reason for this is subject to conjecture, it could, to an extent, be due to the fact that Apple manufactures its housings from energy-intensive aluminum, while most other market players use plastics.

4 COLLECT ING DATA AND SELECT ING THE DEV ICE S TO BE COMPARED
16
FINAL REPORT Managed Workplaces 2015
As at: 12 March 2015 ©Fraunhofer UMSICHT
Older devices such as the desktop PC analyzed in the IVF study [IVF – 2007] have a relatively high weight (> 12 kg) and a comparatively small carbon foot-print. The desktop PCs from Dell (OptiPlex 580,780) [Teehan, Kandlikar – 2013a], [Scheumann – 2013] as well as an average desktop PC from Dell from Macau [Song – 2013] weigh approx. 10 kg and have a carbon footprint of be-tween approx. 200 and 300 kg CO2 equivalents. The smaller Dell FX-100 zero client and Dell OptiPlex 780 Ultra-Small Form Factor (USFF) weigh less than 4 kg and have a carbon footprint of less than 100 kg CO2 equivalents.
Figure 4-2 shows the statistical distribution of the carbon footprint and the weights in the random sample. The diagram is subdivided into quartiles: 50 % of the values are between 164 and 477 kg CO2 equivalents/between 5.7 and 11 kg.
Figure 4-2: Scatter plot of green-house gas emissions during the production of desktop PCs (13 studies)
As Table 4-1 shows, the median is 266.4 kg CO2 equivalents/9.3 kg weight and the arithmetic mean is 309.9 kg CO2 equivalents/8.5 kg.
Table 4-1: Descriptive statistics for greenhouse gas emissions and the weight of desktop PCs
The foThe following devices/studies indicate greenhouse gas emissions close to the mean value:
Dell OptiPlex 580/790: 233 kg CO2e (Scheumann – 2013)
Statistic GWP during production
[kg CO2e]
Weight [kg]
No. of observations 13 13
Minimum 33.6 1.3
Maximum 821.1 22
Median 266.4 9.3
Mean value 309.9 8.5
Standard deviation (n-1) 215.5 5.5

4 COLLECT ING DATA AND SELECT ING THE DEV ICE S TO BE COMPARED
17
FINAL REPORT Managed Workplaces 2015
As at: 12 March 2015 ©Fraunhofer UMSICHT
Dell OptiPlex 780 Mini Tower, 2010: 164 kg CO2e [Teehan, Kandlikar – 2013a]
Dell from Macau 2007-2010: 266 kg CO2e [Song – 2013]
It is difficult to judge the quality of the data for the PC group in the AfB study. Although it is based on the data sheets for the Dell OptiPlex 580/790 comput-ers, it uses data for other devices which were collected during the "Dismantling 53 desktop PCs" project carried out by the TU Berlin's Chair of Solid Waste Management. This study is therefore not used further in this document. Figure 4-3 shows the make-up of the Dell Optiplex 580 analyzed.
Figure 4-3: Data and weights for the Dell Optiplex 580 in [Scheumann – 2013]
Detailed data are available for the Dell OptiPlex 780 Mini Tower (2010). Each component shown in Figure 4-4 is described in detail down to individual coils, capacitors etc. For reasons of space, the detailed information is not shown here.

4 COLLECT ING DATA AND SELECT ING THE DEV ICE S TO BE COMPARED
18
FINAL REPORT Managed Workplaces 2015
As at: 12 March 2015 ©Fraunhofer UMSICHT
Figure 4-4: Data and weights for the Dell OptiPlex 780 Mini Tower in [Teehan, Kandlikar – 2013b]
The make-up of the Dell desktop PC from Macau was determined by disman-tling devices manufactured between 2007 and 2010 and is summarized in [Song – 2013].
Figure 4-5: Data and weights for the desktop PC in [Song – 2013]
All three studies use ecoinvent 2.2. data to illustrate the production processes [Hischier, Classen, Lehmann, Scharnhorst – 2007a].
The [Teehan, Kandlikar – 2013a] study uses the most detailed data base, espe-cially when it comes to the make-up of the device.
The [Song – 2013] study is closest to the mean value and the median for all de-vices examined in this study. The Dell desktop PC analyzed in [Song – 2013] is therefore used in this study as a reference value, i.e. the most representative value.

4 COLLECT ING DATA AND SELECT ING THE DEV ICE S TO BE COMPARED
19
FINAL REPORT Managed Workplaces 2015
As at: 12 March 2015 ©Fraunhofer UMSICHT
4.2.2 Selecting the analyzed notebook
22 carbon footprints taken from various notebook studies are used as a data basis. An overview of the greenhouse gas emissions and weights of various notebooks is shown in Figure 4-6 [Apple Inc – 2014a], [Apple Inc – 2014b], [Apple Inc – 2014c], [Apple Inc – 2012], [Deng – 2011], [Herrmann – 2008], [Lu – 2006], [Prakash – 2012], [Scheumann – 2013], [Teehan, Kandlikar – 2013a], [Teehan, Kandlikar – 2013b]. As with the desktop PC, there is no clear correla-tion between the greenhouse gas emissions during production and the weight of the notebook. It is also worthy of note that the MacBooks sold by Apple tend to have higher greenhouse gas emissions.
Figure 4-6: Greenhouse gas emis-sions during the pro-duction of notebooks and their weights (22 values)
In addition to the MacBooks, generic notebooks and those of HP, Dell, Fujitsu and Asus were examined.
As shown in Figure 4-7 and Table 4-2, the carbon footprint for notebook man-ufacture is between 48 and 704 kg CO2 equivalents and the weight between 1.1 and 3.6 kg.

4 COLLECT ING DATA AND SELECT ING THE DEV ICE S TO BE COMPARED
20
FINAL REPORT Managed Workplaces 2015
As at: 12 March 2015 ©Fraunhofer UMSICHT
Figure 4-7: Scatter plot of green-house gas emissions during the production of notebooks (22 values)
As Table 4-2 shows, the median is 231 kg CO2 equivalents/2.2 kg and the arithmetic mean is 253 kg CO2 equivalents/2.3 kg. The median is more repre-sentative for this random sample because less consideration is given to outliers than with the arithmetic mean.
Table 4-2: Descriptive statistics for greenhouse gas emissions and the weight of notebooks
The folliwThe following devices/studies indicate greenhouse gas emissions close to the mean value:
ASUS UL50: 197 kg CO2 equivalents ([Scheumann – 2013], [Ciroth – 2011])
HP Omnibook 500 12.1", ecoinvent 2.2, 2010: 214 kg CO2 equivalents [Prakash – 2012]
Average laptop computer: 248.5 kg CO2 equivalents [Deng – 2011]
12.1" HP Omnibook with dock, ecoinvent 2.1: 250 kg CO2 equivalents [Pra-kash – 2013]
The make-up of the ASUS UL50 is shown in Figure 4-8.
Statistic GWP during produc-
tion [kg CO2 equiva-
lents]
Weight
[kg]
No. of observations 22 22
Minimum 48 1.08
Maximum 704 3.78
Median 231.3 2.2
Mean value 253.1 2.3
Standard deviation (n-1) 174.8 0.75

4 COLLECT ING DATA AND SELECT ING THE DEV ICE S TO BE COMPARED
21
FINAL REPORT Managed Workplaces 2015
As at: 12 March 2015 ©Fraunhofer UMSICHT
Figure 4-8: Data and weights for the ASUS UL50 notebook from [Ciroth – 2011] in [Scheumann – 2013]
It is difficult to judge the quality of the data for the ASUS UL50 study because it includes not only data from [Ciroth – 2011] but also data for a Toshiba device and data from [Prakash – 2012].
The data for the HP Omnibook 500 12.1", ecoinvent 2.2, 2010, published in [Prakash – 2012] relate to ecoinvent 2.2 data [Lehmann, Hischier – 2007] which were updated with data from the "Creating a data basis for determining the ecological effects of ICT products" project [Prakash – 2013]. The "integrated circuits " (IC) and "screen module" data sets were updated [Prakash – 2013].
The greenhouse gas emissions over the life cycle are shown in Figure 4-9.

4 COLLECT ING DATA AND SELECT ING THE DEV ICE S TO BE COMPARED
22
FINAL REPORT Managed Workplaces 2015
As at: 12 March 2015 ©Fraunhofer UMSICHT
Figure 4-9: Greenhouse gas emis-sions for an HP Omni-book 500 12.1", ecoin-vent 2.2 with data from [Prakash – 2013], source: [Prakash – 2012]
The assumptions in the study for analyzing international transport and local dis-tribution to stores are taken from the O'Connell and Stutz study [O'Connell – 2010] [O'Connell] . These take into account air transport from China to Poland as well as additional land transport by HGV from Poland to end customers. The study is based on the following specific assumptions:
500 km and 80% use of capacity (16-32 t HGV) from the production sites to the airport,
8,000 km from Shanghai PuDong Airport to Warsaw Airport,
1,000 km and 80% use of capacity (7.5-16 t HGV) from Poland to the local stores.
Table 4-3 summarizes the data sets for international transport and local distri-bution.
Table 4-3: Data sets for transport and local distribution [Prakash – 2012]
The "12.The "12.1" HP Omnibook with dock, ecoinvent 2.1" [Prakash – 2013] is based on the same data basis as the "HP Omnibook 500 12.1", ecoinvent 2.2, 2010"
Input Data sets Time refer-
ence
Location
reference
Source
Transport from production
sites to the airport
Transport, 16-32 t
HGV, EURO3
2005 Europe ecoinvent
2.2
Air transport (from
Shanghai to Warsaw)
Transport, air cargo,
intercontinental
2000 Europe ecoinvent
2.2
Local distribution (from
the airport to stores)
Transport, 7.5-16 t
HGV, EURO3
2005 Europe ecoinvent
2.2

4 COLLECT ING DATA AND SELECT ING THE DEV ICES TO BE COMPARED
23
FINAL REPORT Managed Workplaces 2015
As at: 12 March 2015 ©Fraunhofer UMSICHT
[Prakash – 2012], except that old background data were used. It is therefore not taken into account further.
The notebook analyzed by [Deng – 2011] as shown in Figure 4-10 weighs ap-prox. 3.8 kg and is therefore comparatively heavy.
Figure 4-10: Data and weights for a generic notebook [Deng – 2011]
Since the trend is moving towards lighter notebooks nowadays, this notebook is not used as a reference. The data for the ASUS UL50 are not used either be-cause the quality of the data could not be judged sufficiently.
The background data for the HP Omnibook 500 12.1" are relatively up to date (last update 2012). At 214 kg CO2 equivalents, the carbon footprint for pro-duction is close to the calculated median of 231 kg CO2 equivalents (Table 4-2).
The carbon footprint for this notebook (214 kg CO2 equivalents) is therefore used as a reference value for this study.
4.2.3 Selecting the analyzed server
Only two studies in which greenhouse gas emissions during the manufacture of servers are examined are available.
In the first of these, Dell analyzed the "PowerEdge R710 2U rack server" with two processors, 12 GB RAM, four 146 GB hard disks, two power connections, a DVD drive and four fans with regard to greenhouse gas emissions [Stutz – 2012]. 471 kg CO2 equivalents was calculated for the production of the device in Texas as far as the factory gate. Figure 4-11 shows the greenhouse gas emis-sions for the Dell PowerEdge R710 2U rack server over its life cycle. It can be seen that over 90 % of greenhouse gas emissions are caused by use. Approx. 7 % of emissions are the result of production.

4 COLLECT ING DATA AND SELECT ING THE DEV ICE S TO BE COMPARED
24
FINAL REPORT Managed Workplaces 2015
As at: 12 March 2015 ©Fraunhofer UMSICHT
Figure 4-11: Carbon footprint of a Dell PowerEdge R710 2U rack server [Stutz – 2012]
A further study examined a Dell PowerEdge rack server, model EMU 3710P71, manufactured in 2005 [Teehan – 2013]. Table 4-4 summarizes the weights and greenhouse gas emissions for this server according to the individual component modules.
Table 4-4: Weight and greenhouse gas emissions for various components in the Dell PowerEdge rack server,
model EMU 3710P71, manufactured in 2005 [Teehan, Kandlikar – 2013b]
In total, 38
Module Weight [g] Greenhouse gas emis-
sions [kg CO2 equiva-
lents]
Power supply 2,911 89.3
Casing 8,767 18.5
Circuit boards 2,199 128.8
ICs (packages) 88 50.8
ICs (die) 3,043 72.4
Other 1,506 18.2
Transport - 3.9
Assembly - 1.2
Total 15,471 383.1

4 COLLECT ING DATA AND SELECT ING THE DEV ICES TO BE COMPARED
25
FINAL REPORT Managed Workplaces 2015
As at: 12 March 2015 ©Fraunhofer UMSICHT
In total, 383.1 kg CO2 equivalents was released during the manufacture of the Dell PowerEdge rack server, model EMU 3710P71, with over 60 % of green-house gas emissions attributable to the circuit boards and ICs. Compared to a desktop PC, the greenhouse gas emissions of a server like this are slightly high-er as shown in Figure 4-12 below.
Figure 4-12: Mean values for green-house gas emissions in ICT device production, the error bars indicate standard deviation; source: [Teehan, Kandlikar – 2013a]
No further data are currently available. Given the problematic data basis, the more recent data for the Dell PowerEdge R710 2U rack server are used as an approximation. The Dell device was available from 2009 and has already been replaced by a newer model. In this version, the server had 12 GB RAM which corresponds to a minimum specification. In view of this, an additional six memory modules, each with 16 GB, were included in the analysis, thus result-ing in a total memory of 108 GB. Table 4-5 summarizes the greenhouse gas emissions which result from the production of a memory module. Approx. 2.4 kg CO2 equivalents is emitted per memory module. For six memory mod-

4 COLLECT ING DATA AND SELECT ING THE DEV ICE S TO BE COMPARED
26
FINAL REPORT Managed Workplaces 2015
As at: 12 March 2015 ©Fraunhofer UMSICHT
ules, this equates to 14.51 kg CO2 equivalents of additional greenhouse gas emissions.
Table 4-5: Analysis of a RAM module [Teehan, Kandlikar – 2013b]
In total, 471 + 14.51 = 485.51 kg CO2 equivalents is emitted during production of the server.
4.3 Distribution
The distribution outlay depends to a large extent on the local conditions. As described in Chapter 4.2.2, HGV transport in China, air transport from China to Poland as well as additional land transport by HGV from Poland to end cus-tomers in Germany were taken into account for the notebook. The following assumptions are made for new devices.
Table 4-6: Assumptions regarding the distribution of new devices
As far as
2 Data set documentation available online at: http://gabi-documentation-2014.gabi-software.com/xml-data/processes/8fe17ed4-
0fee-4350-a707-2d539a5bfd6f.xml
Module ecoinvent
background data
Weight [g] Greenhouse gas
emissions [kg CO2
equivalents]
RAM ICs: 60-pin
8x12mm 18X @ 0.16g
each
GLO: Integrated circuit,
IC, memory type, at
plant
2.9 0.0029 kg*506 kg
CO2e = 1.47
RAM: Other ICs GLO: Integrated circuit,
IC, memory type, at
plant
0.4 0.0004 kg*506 kg
CO2e = 0.2
RAM 2 PCB: 6 layer, 3 x
13 cm
GaBi data set "GLO:
Printed wiring board 4-
layer rigid FR4 with
HASL finish (subtractive
method)"2
13 0.0039 m2*192 kg
CO2e = 0.7488
Total 16.3 2.4188
Input Data sets Route kg CO2e *t-1*km-1
GG emissions per kg
Source
Transport from
production
sites to the
airport
Transport, 16-
32 t HGV, EU-
RO3
500 0.185 0.0925 ecoinvent 2.2
Air transport
(from Shanghai
to Warsaw)
Transport, air
cargo, intercon-
tinental
8,000 1.07 8.56 ecoinvent 2.2
Local distribu-
tion (from the
airport to
stores)
Transport, 7.5-
16t HGV, EU-
RO3
1,000 0.238 0.238 ecoinvent 2.2

4 COLLECT ING DATA AND SELECT ING THE DEV ICE S TO BE COMPARED
27
FINAL REPORT Managed Workplaces 2015
As at: 12 March 2015 ©Fraunhofer UMSICHT
As far as the old devices are concerned, it is assumed that they can either be used further in the company and thus no distribution is necessary or that they are transported 300 km within Germany. A share of 1:1 is assumed. The as-sumptions regarding the greenhouse gas emissions for old devices are docu-mented in Table 4-7.
Table 4-7: Assumptions regarding the distribution of old devices
The greenhouse gas emissions resulting from distribution can be calculated on the basis of the figures in Table 4-6 and Table 4-7. These are summarized in Table 4-8.
Table 4-8: Assumptions regarding the distribution of old devices
The figures from Table 4-8 are used to calculate the carbon footprint in Chap-ter 5. A sensitivity analysis (with air transport replaced by container ship transport) can be found in Chapter 5.3.
4.4 Usage phase
In order to obtain meaningful average values for power consumption during the operating phase, the usage scenarios which are to be distinguished are measured while typical users do their work using the devices. The power con-sumption for each usage scenario is recorded over a week and mean values for the operating and standby modes are then calculated. These are subsequently used to determine the annual energy requirement used in the environmental analysis.
For all usage scenarios, the screen, peripherals such as the keyboard and mouse as well as all infrastructure components (central storage, routers, switches, firewalls, e-mail, print and database servers) are not taken into account be-cause these are required for all usage scenarios and therefore "cancel each other out".
Input Data sets Route kg CO2e* t-1*km-1
GG emissions per kg
Source
Local distribu-
tion (from the
airport to
stores)
Transport, 7.5-
16t HGV, EU-
RO3
300 0.238 0.0714 ecoinvent 2.2
ICT device Weight kg CO2e* kg-1*km-1
Share CO2e/device CO2e/functional unit
Desktop PC 9.47 8.89 1.00 84.19 50.52
Notebook 2.2 8.89 1.00 19.56 11.74
Old desktop PC 12.8 0.0714 0.50 0.46 0.016
Old notebook 3.7 0.0714 0.50 0.13 0.005

4 COLLECT ING DATA AND SELECT ING THE DEV ICE S TO BE COMPARED
28
FINAL REPORT Managed Workplaces 2015
As at: 12 March 2015 ©Fraunhofer UMSICHT
In the usage scenarios for notebooks, the notebooks were operated with a docking station and an external monitor. The internal monitor of the note-books was disabled in each case.
4.4.1 PC with thin client software
For operation with the IGEL UDC2 thin client software, an approximately three-year-old PC with the following technical data was selected.
Processor: Intel Core i3-2100 CPU (3.10 GHz)
Main memory: 4 GB
Hard disk: 300 GB (conventional hard disk)
Optical drive: 1x DVD-RW
Power supply: 250 W (internal)
Weight: 9.90 kg
When this particular device was launched, it was a very environmentally-friendly model with a low energy consumption and a power consumption of 0 W in standby. During operation, a number of peak loads were observed while a user performed typical office activities using the device. However, the mean value for power consumption during operation – 19.15 W – was rela-tively constant over the one-week observation period.
In order to determine the annual power consumption, it is assumed that the device is operated as a thin client for nine hours a day, 220 working days per year. For this period, the average power consumption during operation is used. For the remaining time, the standby power consumption is always used. The reason for this is that no functional restrictions for users result when the clients are switched off. Even when the power is disconnected, sessions remain on the servers and there is no need to close applications or log off. Access to the ter-minal servers, for instance from external sites or at weekends, is always possi-ble, even without a client running in the office.
For a PC operated as a logical thin client, the energy requirement per year is as follows:
PC ("thin client") 220 days x (9 h x 19.15 W + 15 h x 0 W) + 145 days x 24 h x 0 W = 37.92 kWh
4.4.2 PC with Windows 7
For the usage scenario with a newly purchased PC, an up-to-date model with the following technical data was selected:
Processor: Intel Core i5-4570 CPU (3.20 GHz)

4 COLLECT ING DATA AND SELECT ING THE DEV ICE S TO BE COMPARED
29
FINAL REPORT Managed Workplaces 2015
As at: 12 March 2015 ©Fraunhofer UMSICHT
Main memory: 8 GB
Hard disk: 250 GB (SSD)
Optical drive: 1x DVD-RW
Power supply: 250 W (internal)
Weight: 8.99 kg
With the so-called Haswell Architecture, this PC has an up-to-date Intel proces-sor which, like the entire system, is optimized for low energy requirements and has a power consumption of 0 W in standby. Instead of a conventional hard disk, a solid state disk (SSD) with no moving parts is used. Over the one-week observation period, a power consumption of 15.79 W was measured during operation.
In order to determine the annual power consumption, it was assumed, as in other observations [Fraunhofer UMSICHT – 2011] "(…), that a PC is operated for nine hours a day, 220 working days per year. The average power consump-tion during operation is measured for this period. Many users shut their sys-tems down outside these working hours. In such cases, the standby power consumption is used.
However, it is calculated that only 2/3 of desktop PCs are switched off outside the core working hours. There are both technical and organizational reasons for this. For instance, as explained above, it is part of Fraunhofer UMSICHT's IT strategy to store all data in a storage area network (SAN). In addition, many us-ers use not only local applications but also client/server applications which in-teract with databases and other infrastructure services. For these reasons, it is not possible to establish directives, according to which running computers are switched to sleep mode on a time-controlled basis. This would disturb open network connections and could lead to data loss. Furthermore, power users in particular access their desktops from external sites via the remote desktop pro-tocol outside the core working hours too.
For the purposes of the calculation model, it is thus assumed that currently one third of all PCs are continuously in operation. This is a rather conservative esti-mate in comparison to other investigations. For instance, the British environ-mental organization Global Action Plan (cf. [GAP – 2007], p. 6) also assumes that around 30 % of office PCs in the UK are continuously not switched off – a value which is probably similar in other industrial nations. For the USA, the en-vironmental authority EPA has determined that almost 60 % of desktop com-puters are not switched off at night [Lüke – 2007] (…)" (cf. [Fraunhofer UM-SICHT – 2011], p. 28). As the discussion regarding green IT concepts continues, a rethink is slowly taking place. However, the authors' experiences gained from day-to-day IT operations also show that users tend to leave their PC running the more applications they use in parallel as part of multi-tasking.

4 COLLECT ING DATA AND SELECT ING THE DEV ICE S TO BE COMPARED
30
FINAL REPORT Managed Workplaces 2015
As at: 12 March 2015 ©Fraunhofer UMSICHT
For a PC which is regularly switched off, the following annual consumption ap-plies:
PC ("standby") 220 days x (9 h x 15.79 W + 15 h x 0 W) + 145 days x 24 h x 0 W = 31.26 kWh
For a PC which is not switched off, but left "idling" outside working hours, the annual consumption increases accordingly:
PC ("idle") 365 days x 24 h x 15.79 W = 138.32 kWh
In the following, this case is considered with a share of 1/3, which produces the following average value:
PC ø 1/3 x 138.32 kWh + 2/3 x 31.26 kWh = 66.95 kWh
During the sensitivity analysis (Chapter 5.4.1), the effects on the model of using less energy-efficient PCs is investigated.
4.4.3 Notebook with thin client software
For operation with the IGEL UDC2 thin client software, a notebook which is likewise approx. three years old with the following technical data was selected:
Processor: Intel Core i5-2410M CPU (2.30 GHz)
Main memory: 2 GB
Hard disk: 160 GB (conventional hard disk)
Optical drive: 1x DVD-RW
Power supply: 80 W (external)
Weight (incl. docking station and power supply): 3.37 kg
In this case, a power consumption of 0.62 W was measured in standby. While an end user worked on the device in a terminal server session, a mean value of 13.42 W was recorded during operation over the one-week observation peri-od.
In order to determine the annual power consumption, it is assumed here too that the device is operated as a thin client for nine hours a day, 220 working days per year. For this period, the average power consumption during opera-tion is used. For the remaining time, the standby power consumption is always used. This usage scenario therefore does not entirely replicate operation as a fat client because, as a logical thin client, the notebook is functionally depend-ent on the terminal servers or virtual desktops in the computer center. Essen-tially speaking, a software thin client too supports mobile use thanks to WLAN and VPN support. Although access to central services is possible even when on

4 COLLECT ING DATA AND SELECT ING THE DEV ICE S TO BE COMPARED
31
FINAL REPORT Managed Workplaces 2015
As at: 12 March 2015 ©Fraunhofer UMSICHT
the move, this scenario is not taken into account in the analysis because of a lack of reliable data regarding the effects of the rechargeable battery's charg-ing and discharging cycles. In this case, however, it can be assumed that the energy requirement is higher. One reason for this is that the notebook is gen-erally operated with its built-in screen when it is used on the move.
For a notebook operated as a logical thin client, the energy requirement per year is as follows:
Notebook ("thin client") 220 days x (9 h x 13.42 W + 15 h x 0.62 W) + 145 days x 24 h x 0.62 W = 30.78 kWh
4.4.4 Notebook with Windows 7
For the usage scenario with a newly purchased notebook, an up-to-date model with the following technical data was selected.
Processor: Intel Core i5-4300U CPU (1.90 GHz)
Main memory: 8 GB
Hard disk: 250 GB (SSD)
Optical drive: –
Power supply: 90 W (external)
Weight (incl. docking station and power supply): 2.77 kg
In this scenario, a power consumption of 0.45 W was measured in standby. While an end user worked on the device in a terminal server session, a mean value of 9.42 W was recorded over the one-week observation period.
In order to determine the annual power consumption, it was assumed, as in the case of the PC, that the device is operated for nine hours a day, 220 work-ing days per year. For this period, the average power consumption during op-eration is used as a basis. For the remaining time, the standby power consump-tion is used.
The energy requirement for the notebook per year is as follows:
Notebook ("standby") 220 days x (9 h x 9.42 W + 15 h x 0.45 W) + 145 days x 24 h x 0.45 W = 21.70 kWh
The nature of a notebook means that mobile use too is possible. Because of a lack of reliable data regarding the effects of the rechargeable battery's charg-ing and discharging cycles, this scenario has not been taken into account. In this case, however, it can be assumed that the energy requirement is higher. One reason for this is that the notebook is generally operated with its built-in screen when it is used on the move.

4 COLLECT ING DATA AND SELECT ING THE DEV ICE S TO BE COMPARED
32
FINAL REPORT Managed Workplaces 2015
As at: 12 March 2015 ©Fraunhofer UMSICHT
4.4.5 Server share
Results from earlier analyses show that systems comparable to the server sys-tem selected in Chapter 4.2.3 with two height units (2U) have a peak power consumption of up to 284 W when operating virtual terminal servers or desk-tops over the course of a day. Over the whole 24 hours, the average con-sumption is 226 W on workdays. On free days (weekend, public holidays) the server runs in "idle" mode the whole time. In this case, the average consump-tion is 212 W.
These values are multiplied by 1.7 so as to take into account the computer cen-ter's air conditioning system and UPS. With 220 working days, the annual consumption is as follows:
Server 220 days x 24 h x (226 x 1.7) W + 145 days x 24 h x (212 x 1.7) W = 3,282.77 kWh
This value should be apportioned to the clients on a pro rata basis. When oper-ating terminal servers, it is assumed that the hardware can serve up to 100 cli-ents if it serves as a virtualization platform for a number of virtual terminal server VMs.
For the PC operated as a logical thin client, the total energy requirement per year is as follows:
PC ("thin client") 37.92 kWh + server share + 3,282.77 kWh / 100 = 70.75 kWh
For the notebook operated as a logical thin client, the total energy requirement is as follows:
Notebook ("thin client") 30.78 kWh + server share + 3,282.77 kWh / 100 = 63.61 kWh
4.5 End of life
The emissions resulting from disposal or recycling depend to a large extent on the disposal or recycling path, the local conditions and the assumptions made, e.g. with regard to the handling of credits for recycled material. Furthermore, many environmental analysis studies do not look at the end-of-life phase.
The greenhouse gas emissions reported range from -1 kg CO2 equivalents per desktop PC [IVF – 2007] to 28.8 kg CO2 equivalents [Apple Inc – 2014f]. Nega-tive values are obtained when the outlay for disposal is less than the emissions that can be saved as a result of obtaining secondary raw materials. For the se-lected desktop PC, greenhouse gas emissions of 3.28 kg CO2 equivalents were calculated [Song – 2013]. During this study, these are used both for the new and the old desktop PC.

4 COLLECT ING DATA AND SELECT ING THE DEV ICE S TO BE COMPARED
33
FINAL REPORT Managed Workplaces 2015
As at: 12 March 2015 ©Fraunhofer UMSICHT
Table 4-9: Assumptions regarding the end-of-life phase of ICT devices
The greenhouse gas emissions for the end-of-life phase reported in literature are between -20.5 kg CO2 equivalents [Herrmann – 2008] and 8.8 kg CO2 equivalents [Apple Inc – 2014d]. For the "HP Omnibook 500 12.1" , ecoinvent 2.2, 2010" notebook examined [Prakash – 2012], -1 kg CO2 equivalents was reported. This value is used for analyzing the new and the old notebook.
ICT device CO2e/device CO2e/functional unit
Source
Desktop PC 3.28 1.97 [Song – 2013]
Notebook -1.00 -0.60 [Prakash – 2012]
Old desktop PC 3.28 3.28 [Song – 2013]
Old notebook -1.00 -1.00 [Prakash – 2012]

5 CALCULAT ING THE CARBON FOOT PRINT
34
FINAL REPORT Managed Workplaces 2015
As at: 12 March 2015 ©Fraunhofer UMSICHT
5 Calculating the carbon footprint
5.1 Results for scenarios 1 to 4
The following table shows the results for the scenarios described above with the German electricity mix. Scenarios 1 and 3 with newly purchased devices re-sult in the highest greenhouse gas emissions with approx. 336 kg and 180 kg CO2 equivalents respectively. These are followed by the thin client solutions (scenarios 2 and 4). The difference between scenario 1 and 2 corresponds ap-proximately to a saving of 59 %; the difference between Scenarios 3 and 4 cor-responds approximately to a saving of 33 %.
Table 5-1: Results showing greenhouse gas emissions for all scenarios (German electricity mix)
The following graphic visualizes the results. The end-of-life phase for the note-books is so small that it can only be seen in scenarios 1 and 2.
Figure 5-1: Greenhouse gas (GG) emissions for the sce-narios with German electricity mix

5 CALCULAT ING THE CARBON FOOTPRINT
35
FINAL REPORT Managed Workplaces 2015
As at: 12 March 2015 ©Fraunhofer UMSICHT
5.2 Sensitivity analyses for the production phase
5.2.1 Sensitivity analysis: low emissions
As described in Chapter 4.2, the greenhouse gas emissions during the produc-tion of desktop PCs and notebooks differ considerably. In this chapter, devices whose production results in low greenhouse gas emissions were assumed. The value of the 1st quartile was selected for production (see Chapter 4.2.1 and 4.2.2).
Table 5-2: Results when assuming low greenhouse gas emissions during the production phase
As far as desktop PCs are concerned, the benefits of operating them as thin cli-ents from the point of view of greenhouse gas emissions are obvious in this sensitivity analysis too. In contrast, the results for the two notebook scenarios are virtually the same owing to the lesser influence of the production phase (124 as opposed to 120 kg CO2 equivalents).
Figure 5-2: Low greenhouse gas (GG) emissions during the production phase

5 CALCULAT ING THE CARBON FOOTPRINT
36
FINAL REPORT Managed Workplaces 2015
As at: 12 March 2015 ©Fraunhofer UMSICHT
5.2.2 Sensitivity analysis: high emissions
In this chapter, devices whose production results in high greenhouse gas emis-sions were assumed. The 3rd quartile was selected for the production phase (see Chapter 4.2.1 and 4.2.2).
Table 5-3: Results when assuming high greenhouse gas emissions during the production phase
In this sensitivity analysis, all thin client variants offer significant benefits owing to the greater influence of the production phase, with 137 as opposed to 462 kg CO2 equivalents for scenarios 2 and 1 and with 120 kg as opposed to 253 kg CO2 equivalents in scenarios 4 and 3.
Figure 5-3: High greenhouse gas (GG) emissions during the production phase

5 CALCULAT ING THE CARBON FOOTPRINT
37
FINAL REPORT Managed Workplaces 2015
As at: 12 March 2015 ©Fraunhofer UMSICHT
5.3 Sensitivity analysis for the distribution phase
As with the majority of comparative studies from literature, it was assumed in all of the calculations that the ICT devices are transported by plane from Shanghai to Warsaw (see Chapter 4.3). In many cases, however, they are transported in an energy-efficient manner by container ship, especially if their delivery is not urgent. In this sensitivity calculation, air transport was therefore replaced by sea transport (container ship from Shanghai to Rotterdam with ap-prox. 20,000 km). The other parameters ("transport to the airport in China" and "local distribution from the airport to stores") remain unchanged. Even if very high greenhouse gas emissions of 0.038 kg CO2e/t*km for the container ship are assumed, the emissions during the distribution phase for the desktop PC (Scenario 1) and the notebook (Scenario 3) are reduced to 10.8 kg CO2e for the desktop PC and 2.6 kg CO2e for the notebook. From the point of view of greenhouse gas emissions, this transport variant is therefore preferable. It probably reflects the realistic transport route better too.
IGEL Technology GmbH has taken part in trials to transport devices to Europe by rail via China and Russia. This is a logistic challenge because the track gages change. In environmental terms, however, significant amounts of greenhouse gases could be saved compared to air transport.
The emissions during distribution in the scenarios where the devices continue to be used as thin clients (scenarios 2 and 4) only relate to the server share and are of secondary importance.
5.4 Sensitivity analyses for the operating phase
5.4.1 Older PC with high power consumption
When it was launched on the market, the three-year-old PC which was used by way of example for energy measurements in Chapter 4.4.1 was a particularly environmentally-friendly model with a low energy consumption. Certain older desktop PCs have a much higher power consumption than this system or new-er models. For example, the calculation models used in an earlier study on the use of thin clients [Fraunhofer UMSICHT – 2008] as well as in the EuP Report were based on average values of 78.2 W when "idling" and 2.7 W in standby (cf. [IVF – 2007] p.140ff). These values relate to the basis year 2005. However, the fact that the power requirements on the client side tend to be low during operation as a logical thin client means that even an old system like this could in principle still be used as a thin client.
The sensitivity analysis therefore looks at the environmental effects when using a client with a much higher power consumption. For an older PC operated as a logical thin client, the energy requirement per year is as follows:
PC ("thin client") 220 days x (9 h x 78.2 W + 15 h x 2.7 W) + 145 days x 24 h x 2.7 W = 173.14 kWh

5 CALCULAT ING THE CARBON FOOTPRINT
38
FINAL REPORT Managed Workplaces 2015
As at: 12 March 2015 ©Fraunhofer UMSICHT
If the terminal server required to operate the client is also taken into account, the total energy requirement per year is as follows:
PC ("thin client") 173.14 kWh + server share + 3,282.77 kWh / 100 = 205.97 kWh
When this power consumption of 206 kWh is taken into account, it is clear that it would be better from a greenhouse gas point of view to procure a new desktop PC because the high emissions during the usage phase exceed the sav-ings made as a result of not purchasing a PC. At approx. 50 kg CO2 equiva-lents, the difference is immediately obvious.
Table 5-4: Results showing greenhouse gas emissions for desktop computers with high power consumption
Evidently, operating an old desktop PC as a software thin client only makes sense from the point of view of greenhouse gases if the device requires less than 178 kWh of energy per year. A PC that uses around 66 W or less when idling and 2 W or less in standby mode would meet this requirement. This would apply to the majority of three to five-year-old desktop PCs for normal of-fice use. Further use as software thin clients is not recommended only in the case of very old devices.
5.4.2 Country comparisons – USA and GB
Owing to slightly lower emissions resulting from the electricity mix, the green-house gas emissions when operating ICT devices in Great Britain are slightly lower than in Germany (approx. 14 kg difference in scenarios 1 and 2, approx. 13 kg in scenario 4 and approx. 4 kg in scenario 3).
Table 5-5: Results showing greenhouse gas emissions for the English electricity mix (Great Britain)

5 CALCULAT ING THE CARBON FOOTPRINT
39
FINAL REPORT Managed Workplaces 2015
As at: 12 March 2015 ©Fraunhofer UMSICHT
The following graphic visualizes the results.
Figure 5-4: Greenhouse gas (GG) emissions for various ICT devices with English electricity mix (Great Britain)
Owing to slightly higher emissions resulting from the electricity mix, the green-house gas emissions when operating ICT devices in the USA are slightly higher than in Germany (approx. 5 kg difference in scenarios 1 and 2, approx. 5 kg in Scenario 4 and approx. 2 kg in scenario 3).
Table 5-6: Results showing greenhouse gas emissions for the American electricity mix (USA)

5 CALCULAT ING THE CARBON FOOTPRINT
40
FINAL REPORT Managed Workplaces 2015
As at: 12 March 2015 ©Fraunhofer UMSICHT
Figure 5-5: Greenhouse gas (GG) emissions for various ICT devices with Ameri-can electricity mix (United States)
The influence of power consumption barely changes when using ICT devices in the two selected countries (United States and Great Britain) because the green-house gas intensity of electricity production is similar. The evaluation reveals slightly lower emissions in Great Britain and slightly higher emissions in the USA.

6 INTERPRETAT ION OF THE RESULTS
41
FINAL REPORT Managed Workplaces 2015
As at: 12 March 2015 ©Fraunhofer UMSICHT
6 Interpretation of the results
6.1 Assumptions, consistency and data quality
When interpreting and communicating the results, it must be pointed out that the desktop PCs and notebooks measured during the operating phase are spe-cific individual models which were selected as examples, while the extensive analysis of the literature concerning production provided average values for various models. Accordingly, these average values were used for the calcula-tions concerning the production phase and there are statistical bandwidths as explained in Chapter 4.2.1 and 4.2.2.
Unlike desktop PCs, notebooks have a built-in monitor and, thanks to a re-chargeable battery, can also be used while on the move. Because of a lack of reliable data regarding the effects of the rechargeable battery's charging and discharging cycles, this scenario has not been taken into account. In this case, however, it can be assumed that the energy requirement is higher. One reason for this is that the notebook is operated with its built-in screen when it is used on the move.
As far as the production of the server is concerned, assumptions were made in order to increase its main memory. However, there are uncertainties here which cannot be quantified exactly (see Chapter 4.2.3).
Sensitivities for the production phase were calculated with low and high greenhouse gas emissions during this phase. From the point of view of green-house gases, the notebook as a logical thin client has only slight advantages where emissions are low during the production phase (see Chapter 5.2.1 and 5.2.2).
It would be interesting to analyze the thin clients themselves in more detail in order to gain an insight into greenhouse gas-intensive components. Informa-tion regarding the component modules and their weights would be necessary for this purpose. The results could then be taken into account in the product design and help IGEL to achieve a competitive advantage.
For the distribution phase, a sensitivity analysis with ship instead of air transport was carried out (see Chapter 5.3). The emissions values for this phase used in literature tend to be very high. IGEL Technology GmbH has taken part in trials to transport devices to Europe by rail via China and Russia. This is a logistic challenge because the track gages change. In environmental terms, however, significant amounts of greenhouse gases could be saved compared to air transport.
If desktop PCs with high energy consumption are used, procuring a new device may be better from the point of view of greenhouse gases than continuing to

6 INTERPRETAT ION OF THE RESULTS
42
FINAL REPORT Managed Workplaces 2015
As at: 12 March 2015 ©Fraunhofer UMSICHT
operate the old ones. In order to be viable, the old desktop PC that is convert-ed into a logical thin client must have a power consumption of less than 178 kWh per year (see Chapter 5.4.1).
The disposal phase is very difficult to assess. There are significant uncertainties here and the credits are very small.
The data quality of the study's own measurements for the devices can be de-scribed as very high.

7 COST -EFFECT IVENESS
43
FINAL REPORT Managed Workplaces 2015
As at: 12 March 2015 ©Fraunhofer UMSICHT
7 Cost-effectiveness
Naturally, companies that are thinking of using specific end devices are inter-ested not only in their environmental impact over their entire life cycle but also in their economic credentials. For many decision makers and IT purchasers, a positive environmental evaluation alone is not enough. The use of a software thin client as a managed workplace must make economic sense too.
7.1 Life cycle during company use
The economic aspects of various operating models and types of workstation computers were already the subject of earlier investigations and are also taken into account below for the scenarios previously described. The focus here is on the part of the device life cycle which relates to the use of the computers with-in a company. This part of the life cycle can be subdivided into the following three phases:
7.1.1 Procurement and installation
When procuring and using a workstation computer for the first time, not only the cost price of the hardware needs to be taken into account. There are also licensing costs for the operating system and/or access to server resources. The costs of hardware and software on the server side also need to be taken into account depending on the operating model and apportioned to the clients on a pro rata basis.
All work-related outlay across all groups of employees involved also needs to be taken into account. This is incurred even before the device is procured as a result of specifying the specific needs of an end user. In addition to the user themselves, a system technician who clarifies the fundamental question as to whether a desktop PC, a notebook or a thin client is most suitable for the user and their work is also involved.
Quotations are then obtained depending on the specific requirements. The procurement process then begins. The process is approved by the user's supe-rior as the decision maker responsible and then dealt with further by adminis-trative staff.
System technicians then take delivery of the components ordered, enter them in the asset management system, check that they work properly and install them. Eventually, the end device is handed over to the user. This means addi-tional outlay not only for a system technician but also for the end user them-selves because their work is interrupted as a result of replacing their client computer. The user must then familiarize themselves with their new work de-vice and reconfigure at least parts of the work environment in accordance with their individual requirements which results in short-term productivity losses.

7 COST -EFFECT IVENESS
44
FINAL REPORT Managed Workplaces 2015
As at: 12 March 2015 ©Fraunhofer UMSICHT
7.1.2 Operation
The operating phase, which is also assumed to last three years as it was in the environmental analysis in the previous chapters, covers all outlay associated with continuous use of the workstation computers. Ongoing jobs such as in-stalling application and security updates or maintaining antivirus definitions are included here.
Processes initiated at the explicit request of the user such as installing new, ad-ditional application programs also come under this category. In all cases, there is outlay on the part of the system technicians who package the software, in-stall it, test it and then monitor the rollout. Outlay on the part of users owing to lost working hours, for example if a workstation computer needs to be re-booted in order to complete the installation of applications and updates, also needs to be taken into account.
The calculation also takes into account the fact that, during the operating life of an end device, a user will move to another office, building or site at least once and take their device with them, thus necessitating support on the part of system technicians. The system technicians not only assist in transporting and dismantling/setting up the workstation. They also configure network ports and update the asset management system.
7.1.3 Uninstalling and disposal
Company use of a workstation computer ends when it is taken out of service. The device is collected from the end user's workstation by system technicians and the hard drive must be formated or, depending on regional regulations re-lating to IT security, deleted3. The entries for the hardware and software licens-es must be updated in the asset management system. Depending on the pro-curement path, the device is then returned to the leasing provider, handed over to someone else for secondary use or recycled for a fee.
7.2 Life cycle for each usage scenario
The previously mentioned phases in the life cycle of client computers during their use within a company are examined individually below with a description of the aspects to be taken into account.
7.2.1 New desktop PC
With a desktop PC, several licenses need to be taken into account in addition to the purchase price of the hardware (approx. €750.004 for a typical branded
3 In Germany, recommendations can be found in the "IT-Grundschutz" catalogs published by the Federal Office for Information
Security (BSI): https://www.bsi.bund.de/DE/Themen/ITGrundschutz/ITGrundschutzKataloge/Inhalt/_content/baust/b01/b01015.html 4 This price is a negotiated purchase price which can be assumed for a small to medium-sized company. The computer is a midi
tower PC with Intel Core i5 processor, 8 GB RAM and a 250 GB SSD hard disk. The price includes an extended guarantee for three
years' on-site service.

7 COST -EFFECT IVENESS
45
FINAL REPORT Managed Workplaces 2015
As at: 12 March 2015 ©Fraunhofer UMSICHT
office PC). On top of the actual Windows operating system, a license for ac-cessing the basic services provided by Windows servers, the so-called Client Ac-cess License (CAL) is needed. A license for the system for automatically distrib-uting the operating system, applications and updates is also required. These li-censes costing approx. €210.00 are taken into account in the calculation.
At least one server system with sufficient hard disk space must also be provided for the automatic distribution of the software. A server of this type costing ap-prox. €3,800.00 for the hardware is taken into account in the calculation mod-el. On top of this, a license for the basic Windows server operating system is required. This license costing approx. €583.00 is likewise taken into account in the calculation. The costs for the server, putting it into service and operating it are apportioned to all clients on a pro rata basis.
As far as putting the server into operation is concerned, it is assumed that the relevant knowledge of central software distribution (installing the server com-ponents, distributing operating systems and drivers, scripting and packaging applications etc.) is already available within the company and this knowledge does not need to be built up from scratch.
The outlay when installing an individual computer is therefore small compared with an entirely manual installation. Nevertheless, each PC still requires manual work. Each client needs to be unpacked, connected up and booted. Although the actual installation takes place unsupervised, a manual check for errors must be carried out. In the event of a change of model, installation processes may need to be adapted and new drivers, system software or applications packaged and tested. This in turn is carried out centrally which means that the server-side outlay is apportioned between the thin clients.
Once the installation is complete, the device is handed over to the end user. This process creates work for the system technician and the user. The first thing that needs to be done is to coordinate a delivery date. The transport distances also need to be taken into account – within a building, between a number of buildings on one site or even between a number of sites. The technician dis-mantles the old device and sets up the new computer in the end user's office. Data or individual settings on the old device may need to be backed up and transferred to the new computer. This prevents the user from doing their regu-lar work and thus needs to be taken into account as lost working time.
During the operating phase, hardly any work needs to be carried out on the client itself if central software distribution is used. The packaging of new soft-ware and updates takes place centrally and is apportioned to all clients on a pro rata basis. On the client itself, only outlay on the part of the end user needs to be taken into account. This can occur for example if the computer needs to be rebooted to complete installations or if faults that are directly connected with the client occur.

7 COST -EFFECT IVENESS
46
FINAL REPORT Managed Workplaces 2015
As at: 12 March 2015 ©Fraunhofer UMSICHT
The power consumption, which is discussed in detail in Chapter 4.3, is of fur-ther relevance to the costs during the operating phase. A price of €0.28/kWh is used to calculate the resulting costs. This is an average price which can be as-sumed for households and small to medium-sized companies. Companies only benefit from significantly lower prices if they use a minimum of 1 GWh. Ac-cordingly, an electricity price of €0.12/kWh is used for the projection in Chap-ter 7.4.
At the end of its life cycle, the workstation computer is taken out of service at the company. The outlay when collecting it from the end user is already taken into account in the delivery because an old device is usually collected and a new system delivered in a single step. Accordingly, only the subsequent activi-ties need to be taken into account. These include deleting the hard disk secure-ly in accordance with the relevant regional regulations and removing the com-puter from all administrative systems including asset management. Eventually, the device is disposed of or handed over to another company for secondary use.
7.2.2 New notebook
For a centrally managed notebook as an alternative to a stationary desktop PC, virtually all the considerations set out in the previous chapter apply when it comes to licensing costs and the work involved. During the procurement phase, the notebook differs significantly owing to the costs of procuring the hard-ware. In the cost-effectiveness analysis, a procurement price of approx. €1,185.00 (business notebook5 from a branded manufacturer) is calculated for the notebook.
The price includes a docking station in addition to the notebook. The back-ground to this is that in Germany a notebook without peripherals (external keyboards and mouse) and an external monitor does not comply with the "Di-rective on Safety and Health Protection for Work with Visual Display Units (VDU Directive [BildscharbV]) and therefore may not be used on its own as an office workstation on a long-term basis.
The higher procurement price is offset by greater benefits during the operating phase because the notebook can generally be used when on the move. How-ever, this scenario is not taken into account in the environmental analysis be-cause of a lack of reliable data regarding the effects of the rechargeable bat-tery's charging and discharging cycles. In this case, however, it can be assumed that the energy requirement is higher. One reason for this is that the notebook is generally operated with its built-in screen when it is used on the move. Fur-thermore, this scenario cannot be reproduced with the other end devices in the
5 This price is a negotiated purchase price which can be assumed for a small to medium-sized company. The computer is a note-
book with a 14 inch display, Intel Core i5 processor, 8 GB RAM and a 250 GB SSD hard disk. The price includes an extended guar-
antee for three years' on-site service.

7 COST-EFFECT IVENESS
47
FINAL REPORT Managed Workplaces 2015
As at: 12 March 2015 ©Fraunhofer UMSICHT
analysis and only those aspects of operation which are possible with thin clients too are considered.
Because of the internal monitor and the rechargeable battery, the disposal costs for a notebook at the end of its life cycle are higher than those for a PC. As far as the work involved is concerned, the same considerations as in the previous chapter apply.
7.2.3 Old desktop PC as a software thin client
If an old item of hardware which is already present within the company is con-verted into a logical thin client, the costs of procuring the client hardware no longer apply. However, licensing costs for hardware and software thin clients need to be taken into account. In addition to a Client Access License (CAL) for using basic Windows server services, a further CAL for using the remote desk-top services of a terminal server, the so-called RDS-CAL is required. If the Citrix XenApp add-on is used on the server side, a license for this too is needed. These licenses costing approx. €305.00 are taken into account in the cost model. The IGEL Universal Desktop Converter (UDC2) for software thin clients with a list price of €59.00 is also taken into account.
Although in this scenario no physical hardware needs to be delivered to the end user, work similar to that when switching to a new workstation PC is nec-essary because a system technician must assist the end user in backing up exist-ing data or individual settings from the old device. The new thin client operat-ing system is then installed. As described in Chapter 3.6, it makes sense to do this via central software distribution if large numbers of clients are involved. The system technician merely needs to monitor the installation and check for errors before recording the client in the central management system and assist-ing the end user in putting it into service.
If numerous clients are converted into logical thin clients, additional resources need to be provided on the terminal server side. This means that one or more servers need to be procured and put into operation. The costs for this are ap-portioned to the clients on a pro rata basis. Suitable server hardware costing approx. €6,160.00 is taken into account in the calculation model. As in previ-ous analyses, it is assumed that virtualization technologies are used. This means that a number of terminal servers run as virtual machines on physical server hardware. To reduce outlay, these can be created from a standardized image using automatic provision systems, e.g. Citrix Provisioning Services.
In order to operate the server, it is assumed that a license for Windows Server Datacenter Edition which allows an unlimited number of virtual Windows ma-chines to run is obtained. If, as an alternative to Microsoft Hyper-V, a hypervi-sor from another manufacturer such as VMware ESX or Citrix XenServer is used, the estimated licensing costs must be added on, which means approx. €6,260.00 of additional costs for software.

7 COST -EFFECT IVENESS
48
FINAL REPORT Managed Workplaces 2015
As at: 12 March 2015 ©Fraunhofer UMSICHT
As with the systems for central software distribution described in Chapter 7.2.1, it is assumed that company employees are already familiar with and con-fident in using the technologies and this knowledge does not need to be built up from scratch. The activities when putting the server into operation include accepting and taking stock of the physical system, setting it up in the computer center, installing the hypervisor and incorporating it into a central management system. Putting the actual terminal servers into operation is then restricted to providing the necessary images and provisioning the virtual machines so that the outlay compared to the previous (at least partially) manual installation of the Windows servers can be reduced significantly. There may also be additional outlay when setting up the software to manage the thin clients centrally. Ra-ther than requiring dedicated physical hardware, this is carried out on a sepa-rate VM.
The outlay associated with the physical server and the VMs is apportioned to all clients on a pro rata basis. At the same time, it is assumed that a server can serve up to 100 clients with the usage profile for typical office work.
During operation, there is some outlay on the client side for updating the thin client software, but this outlay is very small as the updates are distributed cen-trally. On the server side, the images must be updated. Because this takes place at a central point, this has little effect on the outlay for each client. On top of this, there is the power consumption of the client and server described in Chapter 4.3.
There is further outlay when clients are taken out of service – updating the in-ventory, deleting hard disks and removing the server – along with the costs of disposing of the clients and server.
7.2.4 Old notebook as a software thin client
The considerations in the previous chapter apply equally to a notebook which is converted into a logical thin client. Here too, it must be pointed out that a docking station must also be provided because in Germany a notebook without peripherals and an external monitor does not comply with the "Directive on Safety and Health Protection for Work with Visual Display Units (VDU Directive [BildscharbV]) and therefore may not be used on its own as an office work-station on a long-term basis.
However, it is assumed that a docking station was available when the device was used previously, so that no procurement costs for hardware are incurred in this case too.
The only difference when operating a notebook as a thin client as opposed to a desktop PC is the power consumption during the operating phase and the slightly more expensive disposal costs because the notebook has an internal monitor and a rechargeable battery.

7 COST -EFFECT IVENESS
49
FINAL REPORT Managed Workplaces 2015
As at: 12 March 2015 ©Fraunhofer UMSICHT
7.2.5 New hardware thin client
Although the scenario where a new thin client is procured as hardware was not part of the environmental analysis in the previous chapters of this document, it should be mentioned briefly with regard to the assessment of cost-effective-ness. This is important for a longer-term strategic assessment. After all, when the old desktop PCs and notebooks used as logical thin clients reach the end of their life cycle, a decision must be made as to how to replace them.
Any number of mini PCs which continue to use the license of the software thin client could be procured. Devices like these are available as complete comput-ers from €190.00 upwards [Hirsch – 2015]. Alternatively, a hardware thin client can be used. This scenario is discussed here. The considerations set out in the previous chapters on software thin clients apply virtually unchanged. The only difference lies in the assumption that an IGEL UD3 LX model costing approx. €335.00 is purchased during the procurement phase instead of the license for the software thin client.
7.3 Comparison
Below, the total cost of ownership [TCO] over the life cycle for a desktop PC and notebook managed using automatic software distribution are compared to the software thin clients and a hardware thin client. The calculation is based on 100 workstations requiring support at a small company over a three-year peri-od.
In this scenario, the desktop PC costs approx. €2,165 over the life cycle of three years. For the notebook, this figure is approx. €2,590. In contrast, an older desktop PC operating as a logical thin client costs approx. €1,157, a notebook operating as a logical thin client approx. €1,176 and a hardware thin client €1,413.
By offering the option of working offline and when on the move, a notebook naturally offers a functional advantage which is not possible in the other sce-narios, albeit for a high price. However, even a new PC or an old PC operating as a software thin client – solutions offering equivalent levels of practicality and functions – would result in a saving of 47 %, i.e. €1,008, when using the software thin client. In an ideal scenario where all existing old devices are con-verted into logical thin clients and no new devices are purchased, the company could therefore save over €100,800.
If, instead, a PC is replaced by a hardware thin client, a saving of 35 %, i.e. €752 per client, is still possible. If hardware thin clients are used throughout the company, savings of over €75,200 could be made.
As far as the procurement phase is concerned, the higher costs are mainly due to the higher procurement costs for the desktop PC and notebooks or the fact

7 COST -EFFECT IVENESS
50
FINAL REPORT Managed Workplaces 2015
As at: 12 March 2015 ©Fraunhofer UMSICHT
that, in the case of software thin clients, no costs are incurred for the procure-ment of client hardware.
Figure 7-1: Total costs per client with 100 workstations to be supported
During the operating phase, the lower costs for thin clients are due to the cen-tral server-based computing approach, where virtually all maintenance work on the software on the terminal servers is carried out in the computer center. At the same time, the client computers are less maintenance-intensive. The slightly lower operating costs of notebooks compared to desktop PCs are primarily the result of their lower energy consumption. In contrast, the costs when taking notebooks out of service are higher than with PCs. This is because higher dis-posal costs can be assumed owing to the integrated monitor and rechargeable battery.
7.4 Projection
In order to project the total costs per client for larger companies, a small to medium-sized company with 600 computer workstations is used as a basis. For this scenario, it is assumed that the company requires more than the minimum 1 GWh of electricity per year and therefore benefits from significantly lower prices. In this case, the electricity price drops to €0.12/kWh.
An assumed discount of 15 % off the purchase price of hardware and software is also taken into account in the calculation. As far as the client-side work-related outlay is concerned, it is assumed that there are no significant changes compared to the previous example with 100 clients. On the server side too, the work-related outlay does not change, although it is spread between the larger number of clients. It is assumed that only one server is required in order to supply the 600 clients with software and updates.

7 COST -EFFECT IVENESS
51
FINAL REPORT Managed Workplaces 2015
As at: 12 March 2015 ©Fraunhofer UMSICHT
Figure 7-2: Total costs per client with 600 workstations to be supported
In this scenario, there are reduced costs of approx. €1,780 for the desktop PC and approx. €2,161 for the notebook. In contrast, an older desktop PC operat-ing as a logical thin client costs approx. €1,049, a notebook operating as a log-ical thin client approx. €1,072 and a hardware thin client €1,270.
While the costs are reduced in all cases observed, if a new desktop PC is com-pared directly with an older PC that is converted into a logical thin client, a saving of 41 %, i.e. €730 per workstation, is possible. In an ideal scenario where all workstations are converted into logical thin clients and no new devic-es are necessary, the company could therefore save over €438,000 by using software thin clients.
If, instead, the PC is replaced by a hardware thin client, a saving of 29 %, i.e. €509 per workstation, is possible. If this figure is projected for all end devices, savings of €305,400 could be made.
In the third scenario discussed, the costs for a large company with 15,000 em-ployees based at a number of sites are determined. In this case too, the re-duced electricity price of €0.12/kWh applies.
An assumed discount of 25 % off the purchase price of hardware is also taken into account in the calculation. As far as the software licenses are concerned, it is assumed that the company can make significant savings, for example as a re-sult of a framework agreement with Microsoft (Enterprise Agreement, Select or Campus contract). Other economies of scale are taken into account when de-termining work-related outlay. For example, it is assumed that a number of servers are needed for automatic software distribution owing to there being a number of sites, but that only one server is required at each site in order to serve 1,000 clients.
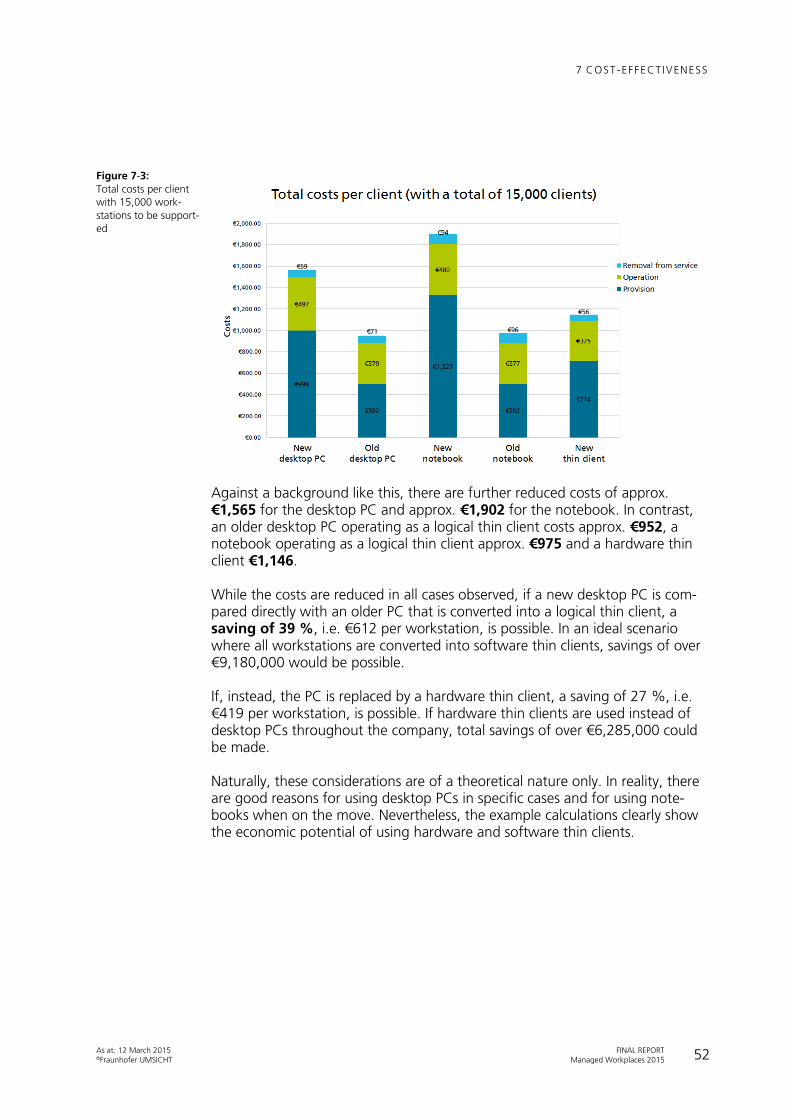
7 COST -EFFECT IVENESS
52
FINAL REPORT Managed Workplaces 2015
As at: 12 March 2015 ©Fraunhofer UMSICHT
Figure 7-3: Total costs per client with 15,000 work-stations to be support-ed
Against a background like this, there are further reduced costs of approx. €1,565 for the desktop PC and approx. €1,902 for the notebook. In contrast, an older desktop PC operating as a logical thin client costs approx. €952, a notebook operating as a logical thin client approx. €975 and a hardware thin client €1,146.
While the costs are reduced in all cases observed, if a new desktop PC is com-pared directly with an older PC that is converted into a logical thin client, a saving of 39 %, i.e. €612 per workstation, is possible. In an ideal scenario where all workstations are converted into software thin clients, savings of over €9,180,000 would be possible.
If, instead, the PC is replaced by a hardware thin client, a saving of 27 %, i.e. €419 per workstation, is possible. If hardware thin clients are used instead of desktop PCs throughout the company, total savings of over €6,285,000 could be made.
Naturally, these considerations are of a theoretical nature only. In reality, there are good reasons for using desktop PCs in specific cases and for using note-books when on the move. Nevertheless, the example calculations clearly show the economic potential of using hardware and software thin clients.

8 CONCLUS ION AND RECOMMENDAT IONS
53
FINAL REPORT Managed Workplaces 2015
As at: 12 March 2015 ©Fraunhofer UMSICHT
8 Conclusion and recommendations
The investigations and their results show that when it comes to greenhouse gas emissions and economics, the use of hardware and software thin clients offers benefits compared to conventional desktop PCs. Likewise, the use of corre-sponding workstation concepts makes more sense than the use of notebooks, if these are used in a stationary manner in the office.
Unquestionably, notebooks offer crucial advantages for many employees be-cause they allow mobile work. However, the results of this study show that a notebook is the most expensive option when providing and operating an IT workstation and also has the greatest environmental impact. Decision makers and IT purchasers within companies are therefore advised to think about the needs of each end user when determining which end device with which oper-ating model is most suitable.
In this context, software thin clients provide an ideal introduction to the strate-gic use of server-based computing. Since the old devices that are converted in-to logical thin clients are already available within the company, there is no need to invest in new hardware and only moderate costs are incurred as a result of procuring and commissioning the thin client software and, if necessary, setting up further terminal servers to support these clients.
Software thin clients as managed workplaces therefore offer an economical way of achieving gentle migration towards a strategic thin client concept. The logical next step on this route is to replace the old devices with hardware thin clients once the old devices reach the end of their extended life cycle.
When it comes to greenhouse gas emissions and economics, the use of a hardware thin client as a managed workplace also offers financial and envi-ronmental benefits compared to purchasing a new desktop PC. Firstly, the pro-duction and distribution of a new desktop PC is completely avoided. Secondly, the production and distribution of a hardware thin client result in far lower greenhouse gas emissions.
Researchers and the manufacturers of thin clients are advised to carry out further investigations into the various workstation concepts and, in particular, to increase their efforts with regard to the production phase. The findings of this study show that there is room for improvement when it comes to the data basis for assessing the environmental impact during production. The available results are very wide ranging and, owing to different methodical approaches, are often not directly comparable. Accordingly, the production of desktop PCs and, in particular server systems, should be the subject of further research. Likewise, the environmental impact of the mobile use of notebooks, taking into account rechargeable battery use, should be looked at in more detail. Research projects should be rounded off by a further investigation into the production of

8 CONCLUS ION AND RECOMMENDAT IONS
54
FINAL REPORT Managed Workplaces 2015
As at: 12 March 2015 ©Fraunhofer UMSICHT
current hardware thin clients in order to allow a more accurate comparison with other operating models on the basis of up-to-date data.

9 L IST OF L ITERATURE
55
FINAL REPORT Managed Workplaces 2015
As at: 12 March 2015 ©Fraunhofer UMSICHT
9 List of literature
Apple Inc (2014i): Mac mini. Environmental Report. Last checked on:
03.02.2015. https://www.apple.com/environment/reports/.
Apple Inc (2013e): Mac Pro. Environmental Report. Last checked on:
03.02.2015. https://www.apple.com/environment/reports/.
Apple Inc (2012): 13-inch MacBook Pro. Environmental Report. Last checked
on: 03.02.2015. https://www.apple.com/environment/reports/.
Choi, Byung-Chul; Shin, Hang-Sik; Lee, Su-Yol et al. (2006): Life Cycle Assess-
ment of a Personal Computer and its Effective Recycling Rate (7 pp). In: The In-
ternational Journal of Life Cycle Assessment, 11(2), S. 122–128.
Ciroth, Andreas; Franze, Juliane (2011): LCA of an Ecolabeled Notebook. Con-
sideration of Social and Environmental Impacts Along the Entire Life Cycle. Ber-
lin.
Deng, Liqiu; Babbitt, Callie W.; Williams, Eric D. (2011): Economic-balance hy-
brid LCA extended with uncertainty analysis: case study of a laptop computer.
In: Journal of Cleaner Production, 19(11), S. 1198–1206.
DIN Deutsches Institut für Normung e.V. (November 2009): Umweltmanage-
ment - Ökobilanz - Grundsätze und Rahmenbedinungen (ISO
14040:2006); Deutsche und Englische Fassung EN ISO 14040:2006. Umwelt-
management – Ökobilanz – Grundsätze und Rahmenbedingungen (ISO
14040:2006), 13.020.10(14040). Berlin: Beuth Verlag GmbH (13.020.10).
Ekener-Petersen, Elisabeth; Finnveden, Göran (2013): Potential hotspots identi-
fied by social LCA—part 1: a case study of a laptop computer. In: The Interna-
tional Journal of Life Cycle Assessment, 18(1), S. 127–143.
Fraunhofer UMSICHT (2008): Ökologischer Vergleich der Klimarelevanz von PC
und Thin Client.
Fraunhofer UMSICHT (2011): Thin Clients 2011 – Ökologische und ökonomi-
sche Aspekte virtueller Desktops.
GAP (2007): An Inefficient Truth - Report. Last checked on: 13.03.2015.
http://www.it-
energy.co.uk/pdf/GAP%20An%20Inefficient%20Truth%20Dec%202007.pdf.
Goedkoop, Mark; Heijungs, Reinout; Huijbregts, Mark; an de Schryver; Struijs,
J.; van Zelm, Rosalie (2013): ReCiPe 2008. A life cycle impact assessment meth-
od which comprises harmonised category indicators at the midpoint and the
endpoint level. First edition (revised). Report I: Characterisation. Amersfoort,
Leiden, Nijmegen, Bilthoven.
Herrmann, Constantin (2008): Environmental footprint of ICT equipment in
manufacture, use and end of life.

9 L IST OF L ITERATURE
56
FINAL REPORT Managed Workplaces 2015
As at: 12 March 2015 ©Fraunhofer UMSICHT
Hirsch, Christian (2015): Die 1-Liter-PCs. Kaufberatung für kompakte Desktop-
Rechner. In: c't, (3), S. 72–74.
Hischier, Roland (2007): Life Cycle Inventory of Electric and Eletronic Equip-
ment: Production, Use and Disposal Part V: Disposal of Electric and Electronic
Equipment (e-Waste). ecoinvent data v2.0. ecoinvent report No. 18 - V.
Dübendorf, Switzerland.
Hischier, Roland; Classen, Mischa; Lehmann, Martin; Scharnhorst, Wolfram
(2007a): Life Cycle Inventory of Electric and Eletronic Equipment: Production,
Use and Disposal. ecoinvent data v2.0. ecoinvent report No. 18 - I. St. Gallen,
Dübendorf.
Hischier, Roland; Classen, Mischa; Lehmann, Martin; Scharnhorst, Wolfram
(2007b): Life Cycle Inventory of Electric and Eletronic Equipment: Production,
Use and Disposal Part II: Modules. ecoinvent data v2.0. ecoinvent report No. 18
- II. Dübendorf, Switzerland.
IPCC (2007): Climate Change 2007. Mitigation of Climate Change. Contribu-
tion of working group III to the fourth assessment report of the Intergovern-
mental Panel on Climate Change. Cambridge, New York.
http://www.ipcc.ch/publications_and_data/publications_ipcc_fourth_assessmen
t_report_wg3_report_mitigation_of_climate_change.htm.
IVF (2007): Lot 3 Personal Computers (desktops and laptops) and computer
monitors—final report (task 1–8). Mölndal, Sweden.
Kemna, René (2011): Methodology for Ecodesign of Energy-related Products.
MEErP 2011, Methodology Report Part 1: Methods. Brussels/Delft.
Knermann, Christian (2014): Zweiter Frühling für PCs – Vergleichstest: Soft-
ware-Thin Clients. München (12).
Lehmann, Martin (2007): Life Cycle Inventory of Electric and Eletronic Equip-
ment: Production, Use and Disposal Part IV: Use. ecoinvent data v2.0. ecoinvent
report No. 18 - IV. Dübendorf, Switzerland.
Lehmann, Martin; Hischier, Roland (2007): Life Cycle Inventory of Electric and
Eletronic Equipment: Production, Use and Disposal Part III: Electronic Devices.
ecoinvent data v2.0. ecoinvent report No. 18 - III. Dübendorf, Switzerland.
Lu, Li-Teh; Wernick, Iddo K.; Hsiao, Teng-Yuan et al. (2006): Balancing the life
cycle impacts of notebook computers: Taiwan's experience. In: Resources, Con-
servation and Recycling, 48(1), S. 13–25.
Lüke, Detlef (2007): Energie effizient nutzen - Zentrales Power-Management
für Client-Bestände (LANline Sonderveröffentlichung "Green IT"). Leinfelden-
Echterdingen. Last checked on: 13.03.2015.
http://www.lanline.de/fachartikel/energie-effizient-nutzen.html?page=1.
Manhart, Andreas; Grießhammer, Rainer (2006): Social impacts of the produc-
tion of notebook PCs. Contribution to the development of a Product Sustaina-
bility Assessment (PROSA).

9 L IST OF L ITERATURE
57
FINAL REPORT Managed Workplaces 2015
As at: 12 March 2015 ©Fraunhofer UMSICHT
O'Connell, Scott; Stutz, Markus (2010): Product carbon footprint (PCF) assess-
ment of Dell laptop - Results and recommendations. In: 2010 IEEE International
Symposium on Sustainable Systems and Technology (ISSST), S. 1–6.
Prakash, Siddharth; Liu, Ran; Schischke, Karsten; Stobbe, Lutz (2012): Zeitlich
optimierter Ersatz eines Notebooks unter ökologischen Gesichtspunkten. Des-
sau-Roßlau.
Prakash, Siddharth; Liu, Ran; Schischke, Karsten; Stobbe, Lutz; Gensch, Carl-
Otto (2013): Schaffung einer Datenbasis zur Ermittlung ökologischer Wirkun-
gen der Produkte der Informations- und Kommunikationstechnik (IKT). Teilvor-
haben C des Gesamtvorhabens Ressourcenschonung im Aktionsfeld Informa-
tions- und Kommunikationstechnik (IKT). Dessau-Roßlau.
Scheumann, René; Finkbeiner, Matthias (2013): Carbon Footprint & ökobilanzi-
elle Bewertung der Aufbereitung und Vermarktung gebrauchter IT-Hardware.
Projektbericht im Auftrag der AfB. Berlin.
Song, Qingbin; Wang, Zhishi; Li, Jinhui et al. (2013): Life cycle assessment of
desktop PCs in Macau. In: The International Journal of Life Cycle Assessment,
18(3), S. 553–566.
Stutz, Markus; O'Connell, Scott; Pflueger, John (2012): Carbon Footprint of a
Dell Rack Server. Frankfurt, Austin.
Teehan, Paul (2013): Integrative approaches to environmental life cycle assess-
ment of consumer electronics and connected media. PhD thesis. Vancouver.
Teehan, Paul; Kandlikar, Milind (2013a): Comparing Embodied Greenhouse
Gas Emissions of Modern Computing and Electronics Products. In: Environmen-
tal Science & Technology, 47(9), S. 3997–4003.
Teehan, Paul; Kandlikar, Milind (2013b): Supporting Information: Comparing
embodied greenhouse gas emissions of modern computing and electronics
products. Vancouver.

10 L IST OF TABLES
58
FINAL REPORT Managed Workplaces 2015
As at: 12 March 2015 ©Fraunhofer UMSICHT
10 List of tables
Table 4-1: Descriptive statistics for greenhouse gas emissions and the weight of desktop PCs 16
Table 4-2: Descriptive statistics for greenhouse gas emissions and the weight of notebooks 20
Table 4-3: Data sets for transport and local distribution [Prakash – 2012] 22
Table 4-4: Weight and greenhouse gas emissions for various components in the Dell PowerEdge rack server, model EMU 3710P71, manufactured in 2005 [Teehan, Kandlikar – 2013b] 24
Table 4-5: Analysis of a RAM module [Teehan, Kandlikar – 2013b] 26
Table 4-6: Assumptions regarding the distribution of new devices 26
Table 4-7: Assumptions regarding the distribution of old devices 27
Table 4-8: Assumptions regarding the distribution of old devices 27
Table 4-9: Assumptions regarding the end-of-life phase of ICT devices 33
Table 5-1: Results showing greenhouse gas emissions for all scenarios (German electricity mix) 34
Table 5-2: Results when assuming low greenhouse gas emissions during the production phase 35
Table 5-3: Results when assuming high greenhouse gas emissions during the production phase 36
Table 5-4: Results showing greenhouse gas emissions for desktop computers with high power consumption 38
Table 5-5: Results showing greenhouse gas emissions for the English electricity mix (Great Britain) 38
Table 5-6: Results showing greenhouse gas emissions for the American electricity mix (USA) 39
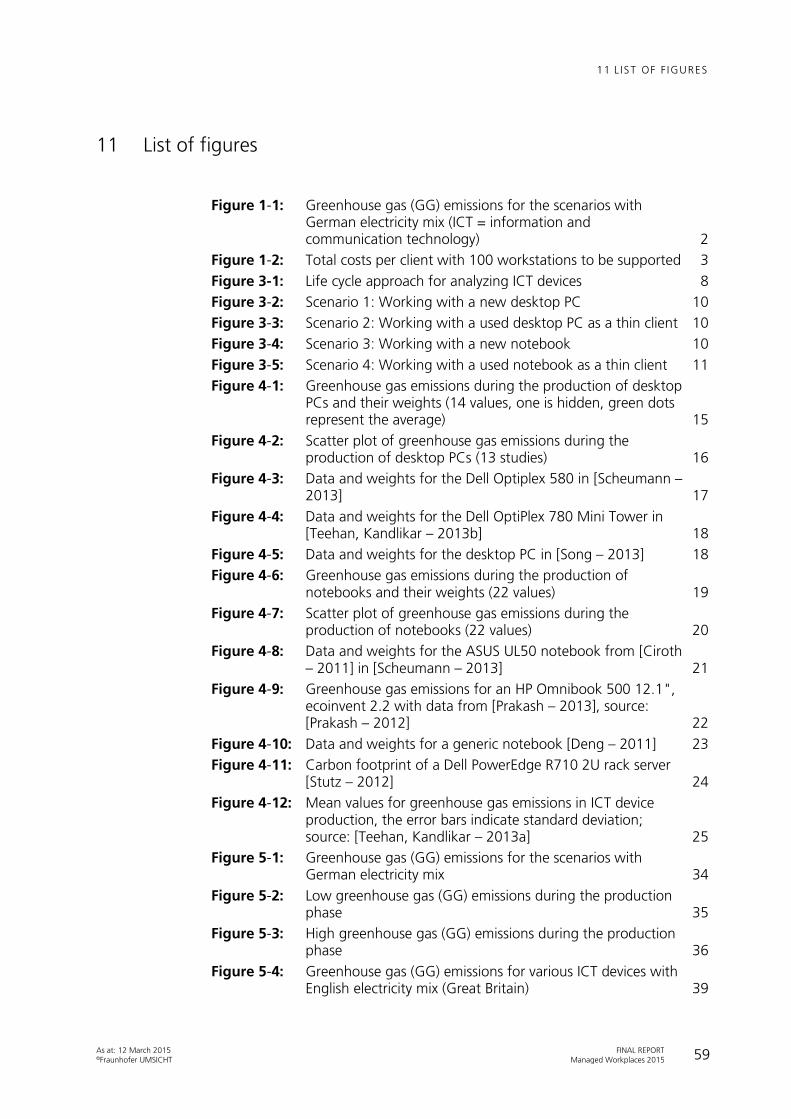
11 L IST OF F IGURES
59
FINAL REPORT Managed Workplaces 2015
As at: 12 March 2015 ©Fraunhofer UMSICHT
11 List of figures
Figure 1-1: Greenhouse gas (GG) emissions for the scenarios with German electricity mix (ICT = information and communication technology) 2
Figure 1-2: Total costs per client with 100 workstations to be supported 3
Figure 3-1: Life cycle approach for analyzing ICT devices 8
Figure 3-2: Scenario 1: Working with a new desktop PC 10
Figure 3-3: Scenario 2: Working with a used desktop PC as a thin client 10
Figure 3-4: Scenario 3: Working with a new notebook 10
Figure 3-5: Scenario 4: Working with a used notebook as a thin client 11
Figure 4-1: Greenhouse gas emissions during the production of desktop PCs and their weights (14 values, one is hidden, green dots represent the average) 15
Figure 4-2: Scatter plot of greenhouse gas emissions during the production of desktop PCs (13 studies) 16
Figure 4-3: Data and weights for the Dell Optiplex 580 in [Scheumann – 2013] 17
Figure 4-4: Data and weights for the Dell OptiPlex 780 Mini Tower in [Teehan, Kandlikar – 2013b] 18
Figure 4-5: Data and weights for the desktop PC in [Song – 2013] 18
Figure 4-6: Greenhouse gas emissions during the production of notebooks and their weights (22 values) 19
Figure 4-7: Scatter plot of greenhouse gas emissions during the production of notebooks (22 values) 20
Figure 4-8: Data and weights for the ASUS UL50 notebook from [Ciroth – 2011] in [Scheumann – 2013] 21
Figure 4-9: Greenhouse gas emissions for an HP Omnibook 500 12.1", ecoinvent 2.2 with data from [Prakash – 2013], source: [Prakash – 2012] 22
Figure 4-10: Data and weights for a generic notebook [Deng – 2011] 23
Figure 4-11: Carbon footprint of a Dell PowerEdge R710 2U rack server [Stutz – 2012] 24
Figure 4-12: Mean values for greenhouse gas emissions in ICT device production, the error bars indicate standard deviation; source: [Teehan, Kandlikar – 2013a] 25
Figure 5-1: Greenhouse gas (GG) emissions for the scenarios with German electricity mix 34
Figure 5-2: Low greenhouse gas (GG) emissions during the production phase 35
Figure 5-3: High greenhouse gas (GG) emissions during the production phase 36
Figure 5-4: Greenhouse gas (GG) emissions for various ICT devices with English electricity mix (Great Britain) 39

11 L IST OF F IGURES
60
FINAL REPORT Managed Workplaces 2015
As at: 12 March 2015 ©Fraunhofer UMSICHT
Figure 5-5: Greenhouse gas (GG) emissions for various ICT devices with American electricity mix (United States) 40
Figure 7-1: Total costs per client with 100 workstations to be supported 50
Figure 7-2: Total costs per client with 600 workstations to be supported 51
Figure 7-3: Total costs per client with 15,000 workstations to be supported 52