study guide review question solutions
TRANSCRIPT
Study Guide Review Question Solutions
Answers to Chapter 2 Review Questions
1. If we put the following countries on Figure 2-2, would we expect them to be on the 45-degree line, above it, or below it? Why? a. Canada: As we saw later in the chapter, Canada is far above the 45-degree line. In large part due
to its proximity, it trades far more with the United States than the size of its GDP would predict. b. Mongolia: Below the line. Mongolia is far away from the United States is landlocked, which
makes transport expensive, and has no particular strong ties to the United States so we might expect it to trade less with the United States than even its relatively small GDP predicts.
c. Norway: On the line. Norway is much like other European countries with regards to distance and general ties to the United States. As Sweden is right on the line, we might expect Norway to also be on the line.
2. Beginning from Tij = A × Yi × Yj /Dij . We can back out the value of “A” from the value of exports from A to B of 1.6 trillion, 1.6 = A × 4 × 4/100. In this case, A must be 10. We can then use that value of A to plug the other data on GDP and distance into the formula to see how much the other country pairs trade.
Value of Exports ($ trillion) A B C D
A × 1.6 0.04 0.4 B 1.6 × 0.04 0.2 C 0.04 0.04 × 0.01
D 0.4 0.2 0.01 ×
3. The table is filled in below providing the expected sign for these factors. One assumes that a shared language would reduce trade costs and hence increase trade generating a positive expected sign. If one country is landlocked, this should increase trade costs and thus draws a negative sign. If countries share a common currency, this should reduce trade costs and draws a positive sign. If the countries are at war, this makes trade more difficult, and reduces trade. Finally, if both countries are in the same free trade agreement, this should make sure trade barriers are low.
Variable Expected SignDistance – GDP + Share common language + One country landlocked – Share common currency + The two countries are at war – Both members of a Free Trade Area +
214 Krugman/Obstfeld • International Economics: Theory and Policy, Eighth Edition
4. The following technology helped turn these items from nontradable to tradable: a. Perishable Food: Refrigerated boxcars, trucks, and shipping containers. Until refrigeration
protected these goods in transit, they could not be traded over long distances. b. Call Centers: Cheap broadband access. Even though telephone lines have been in existence for
decades, it was the advent of very cheap, high volume communication that allowed employers to hire people half a world away to talk on the phone to customers.
c. Legal Services: Fax technology. Once the fax became more prevalent, legal services could be done at longer distances.
d. Agriculture Grown in an Interior State: Railroads. Until railroads criss-crossed the United States and Argentina, agriculture grown in their interiors could not easily be traded on world markets. Once the railroads were finished these countries became major agricultural exporters.
e. Iron or Heavy Manufactures: Steam ships. Steam ship travel revolutionized the speed and cost of shipping heavy products and was crucial to the growth of trade in the first era of widespread globalization.
5. It seems unlikely that trade to GDP ratios fall back towards where they were in the 1950s. Trade would have to collapse and many firms have integrated their production processes across countries and consumers have gotten used to international products. The costs to efficiency of bringing trade down to 1950 levels would be striking and probably not politically sustainable. On the other hand, it is distinctly possible that in 1905, people viewed the conveniences and efficiencies of trade as something that could not be interrupted. As it turned out, war and protectionist policies drastically reduced trade for generations. The circumstances that might trigger such a collapse revolve around two possibilities. The first is a sustained war across many countries and continents. In such a scenario, it is possible that trade costs would rise considerably and countries might shutdown trade routes as part of the war. Another scenario might be a widespread outbreak of disease (say Avian flu coming from Asia) that led to some legitimate and some xenophobic responses to reduce contact with different countries. This might generate retaliatory responses until a trade protectionist battle broke out. Finally, insecurities about the impact of imports could lead a few countries to institute protectionist policies and reduce trade (more will be said about this in Chapters 4 and 8–11). All scenarios seem somewhat unlikely to really reduce trade.
Answers to Chapter 3 Review Questions
1. a. Home is more efficient and has an absolute advantage in the production of butter, while Foreign has an absolute advantage in the production of cloth.
b. Given the unit labor requirements of the problem, Home can trade off 5 units of butter for 1 unit of cloth when both goods are produced domestically. If, instead, Home trades 5 units of butter for 3 units of cloth with Foreign, Home gains 2 units of cloth or saves 2 labor hours. Likewise, the 5 units of butter which Foreign receives when it trades with Home would have required 5 labor hours to produce. These same 5 labor hours can be used to produce 15 units of cloth. Through trade Foreign has a net gain of 12 units of cloth.
c. If Home trades 5 units of butter for 6 units of cloth with Foreign, Home gains 5 units of cloth. Since 5 units of butter is equivalent to 15 units of cloth in Foreign and Foreign only sacrifices 6 units of cloth for 5 units of butter, Foreign gains 9 units of cloth.
Study Guide Review Question Solutions 215
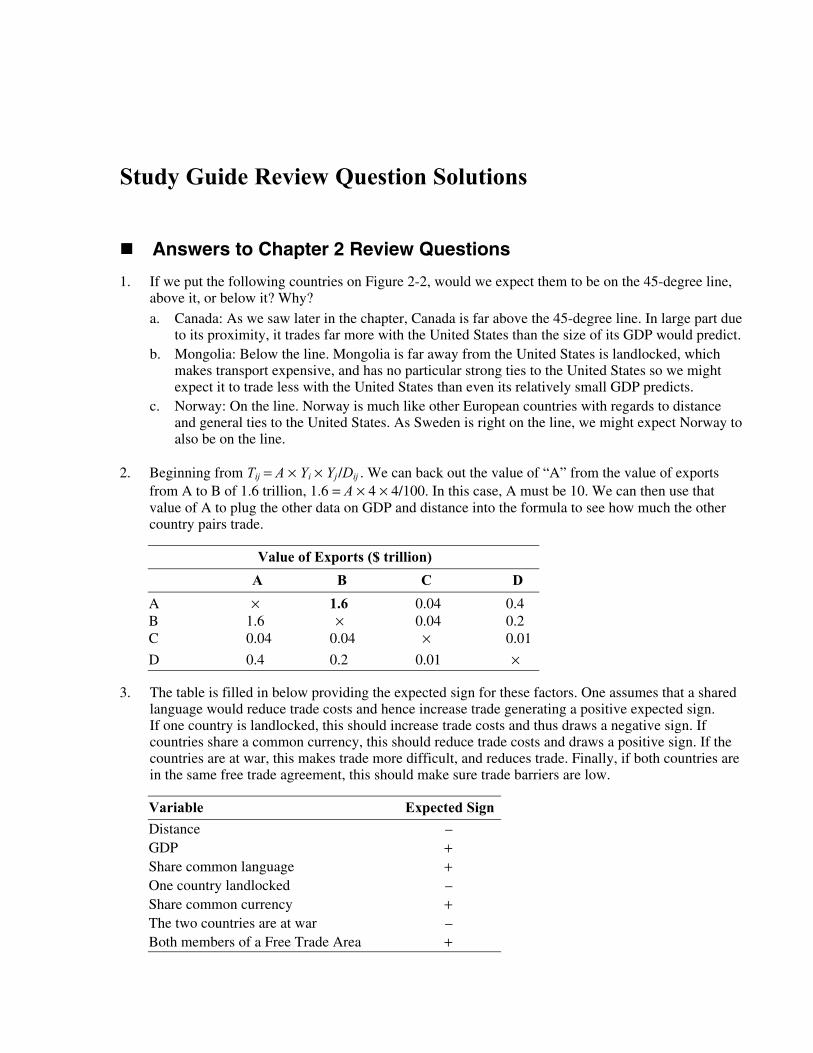
2. a. The graphical representation of the Home and Foreign production possibility frontiers are:
b. Home: / / 5 / 2 2.5b s Lb Lsp p a a= = =
Foreign: * * * */ / 3 /3 1b s Lb Lsp p a a= = =
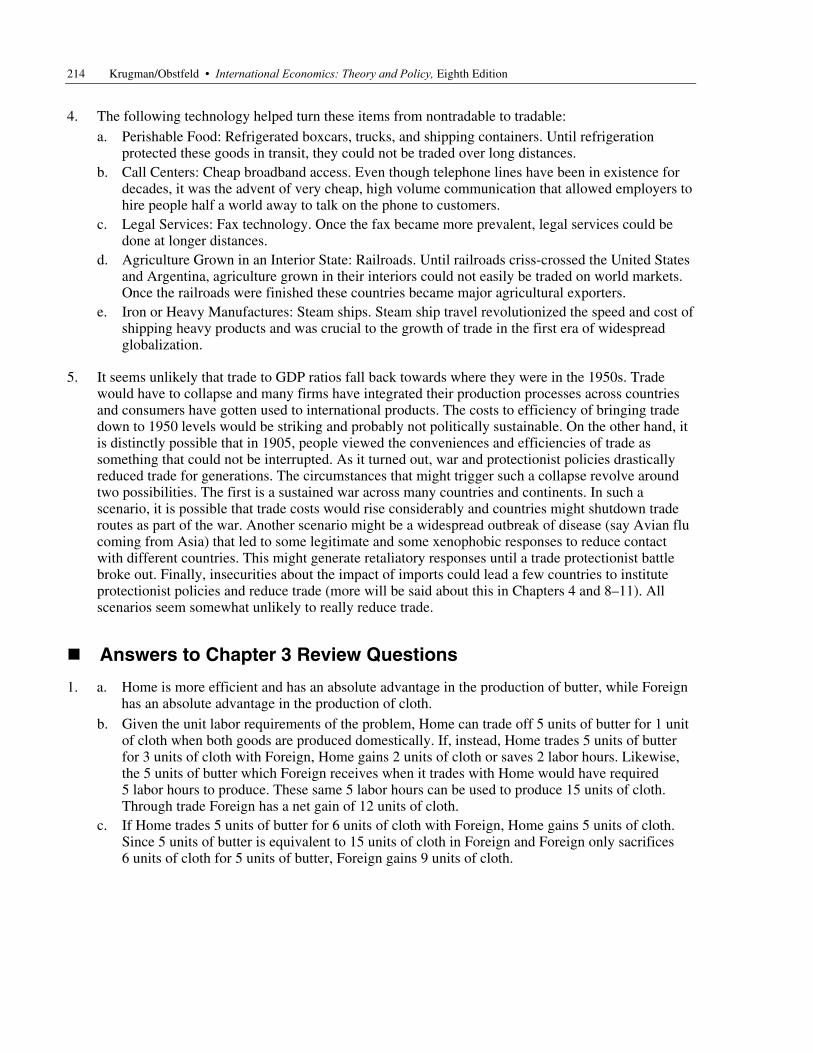
c. In the absence of trade, Home and Foreign consumption possibilities are limited along their respective production possibilities frontiers, as in Part (a). With trade, however, each economy can consume a bundle of bicycles and skateboards which is greater than what it alone can produce. Specifically, with trade, Home consumption possibilities expand from AB to TB while foreign consumption possibilities expand from A* B* to A* T*.
3. a. Home has a relative productivity advantage in tennis rackets.
b. Home opportunity cost equals aLR/aLB = 2/6 = 1/3. Foreign opportunity cost equals * */LR LBa a =
4/1 = 4. c. The world equilibrium price of rackets to bats will lie between the two autarky
prices: 1/ 3 ( / ) 4.wr Bp p< <
216 Krugman/Obstfeld • International Economics: Theory and Policy, Eighth Edition
d. Given pr /pB = 2, each country’s production specialization can be determined by comparing the wages which workers earn in the tennis racket industry with those earned in the bat industry. The Home worker earns pr /aLr = 2/2 = 1 producing rackets and pB/aLB = 1/6 producing bats. The workers will seek the highest wages and will move into the racket industry, leading to Home specialization in rackets. By an analogous argument you can show that the foreign country will specialize in bat production.
e. In autarky, an hour of Foreign labor can produce 1 bat or 1/4 tennis racket. If Foreign labor chooses to produce 1 bat, this bat can be traded at pr /pB = 2 for 1/2 racket. This is twice as many rackets as it would receive if Foreign produced and consumed domestically. This demonstrates that foreign gains from trade.
4. a. Relative Home productivity advantage is given by * / .Li Lia a Thus, its greatest productivity advantage lies in production of Good A at 12 (12/1) and its worst advantage lies with Good D at 2 (30/15). The reverse order is true for the Foreign advantage.
b. Goods A and B will be produced at Home. Goods C and D will be produced in the Foreign country. To determine which country produces which goods, you must know the relative wage ratio (w/w*). The Home will have a cost advantage in any Good I for which its relative productivity *( / )Li Lia a exceeds the relative wage *( / ).i iw w The Foreign country will have a cost advantage in any Good I for which its relative productivity *( / )Li Lia a is less than the relative wage *( / ) .i iw w
c. The gains from trade can be seen by comparing the labor costs of producing the good directly in a country with the costs of producing another good and then engaging in trade. If the relative wage rate is 8, Part (b) showed that Home will not produce Goods C or D and would instead import them from Foreign. To produce one unit of Good C requires 24 units of Foreign labor compared with only 4 units of Home labor. However, given the difference in wages of 8 to 1, it costs Home 4 × 8 = 32 versus 24 × 1 = 24 for Foreign. It ends up being least costly to produce the unit of Good C in Foreign. You can also demonstrate this point using man-hours required for production of the goods.
d. If w/w* = 6, Home will still produce Goods A and B while Foreign produces Good D. Moreover, it is likely that Good C (with * */ / 6)Lc Lca a w w= = will be produced in both countries.
e. The high transport costs for certain goods moved over large distances may lead countries to choose self-sufficiency in production in certain goods despite the country’s lack of comparative advantage in those goods.
5. a. In the absence of trade, Home can produce 1 unit of butter with half of the labor hours required to produce 1 unit of cloth. This implies that in autarky the Home price of producing 1 unit of butter is expressed as pB/pc = 1/2. In the absence of trade, Foreign requires twice as much labor to produce butter as cloth so that the pre-trade price is 2.
b. The pre-trade relative prices reflect the Home comparative advantage in butter and the Foreign comparative advantage in cloth.
c. The world relative price of butter in terms of cloth will fall somewhere between the two autarkic prices.
d. If pB/pc = 1 with trade, Home gains by being able to import cloth from Foreign at a lower relative price than it would have if the cloth had been produced domestically. Alternatively stated, Home can import 1 unit of cloth by giving up only 1 unit of butter if trade is allowed, whereas Home would have to give up 2 units of butter if it did not trade.
Study Guide Review Question Solutions 217
Answers to Chapter 4 Review Questions
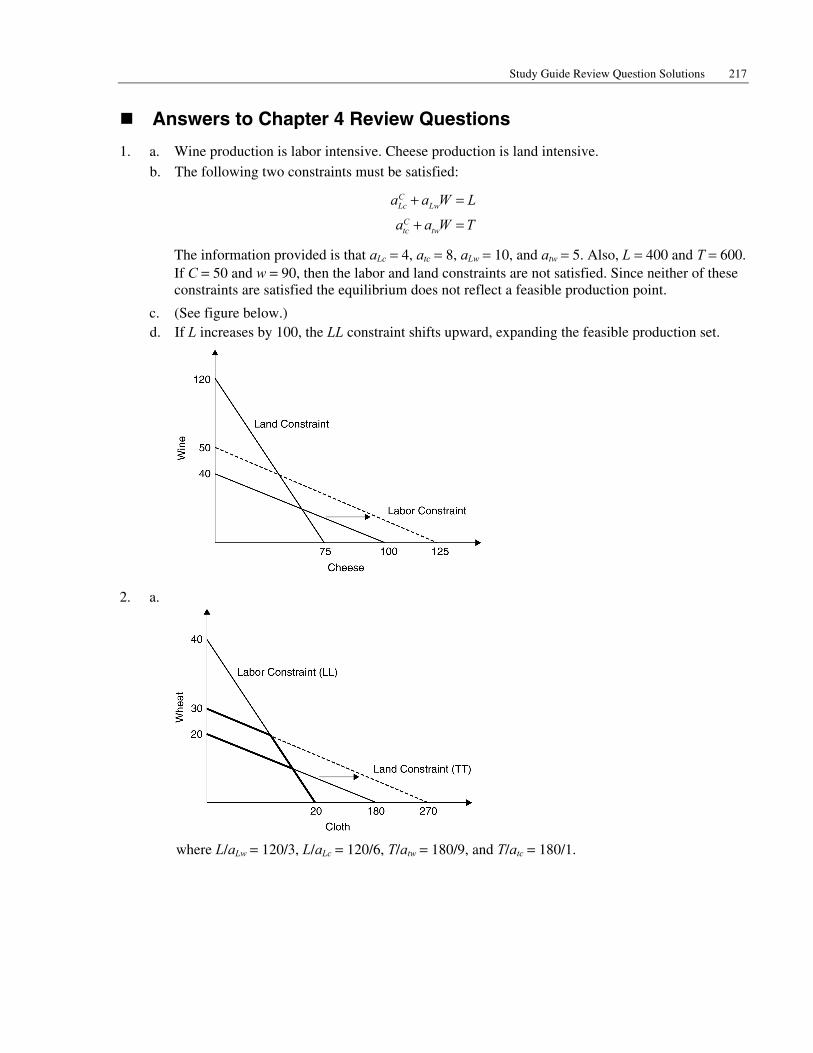
1. a. Wine production is labor intensive. Cheese production is land intensive. b. The following two constraints must be satisfied:
CLc Lw
Ctc tw
a a W L
a a W T
+ =
+ =
The information provided is that aLc = 4, atc = 8, aLw = 10, and atw = 5. Also, L = 400 and T = 600. If C = 50 and w = 90, then the labor and land constraints are not satisfied. Since neither of these constraints are satisfied the equilibrium does not reflect a feasible production point.
c. (See figure below.) d. If L increases by 100, the LL constraint shifts upward, expanding the feasible production set.
2. a.
where L/aLw = 120/3, L/aLc = 120/6, T/atw = 180/9, and T/atc = 180/1.

218 Krugman/Obstfeld • International Economics: Theory and Policy, Eighth Edition
b. The TT line shifts up to yield a new production possibilities frontier where T/atw = 270/9 and T/atc = 270/1. When the supply of land increases the TT constraint is relaxed and the production possibilities expand with a bias in favor of the land-intensive good, wheat. This explains why an economy tends to be very effective at producing goods that are intensive in the factors which are relatively abundant at home.
3. a. The factor proportions theory predicts that countries tend to export goods whose production is intensive in the relatively abundant factors of the economy. In this example, Foreign would be considered to be labor-abundant even though it has less labor than home. (Remember that abundance is defined in a relative sense.) Home is land abundant. Consequently, we can expect Home to export rice which Foreign exports televisions, the labor intensive good.
b. A variety of real world complications can overturn the predictions of the factor proportions theory. The “Leontief Paradox” demonstrates some of these complications. Leontief showed that U.S. exports were less capital intensive than U.S. imports, despite the observation that the United States is relatively capital intensive. Part of the explanation of this paradox is based on the definition of and measurement of the factors of production. There are differences within the category of labor (skilled versus unskilled workers) that suggest that aggregation into a single category of labor is misleading. There are other problems in the definition of capital, since it does not reflect the technology intensiveness of exports compared with imports.
c.
4. a. In a competitive economy, the price of any good is exactly equal to the cost of producing it. This means that the following constraints must hold:
c Lc tc
w Lw tw
p a W a rp a W a r
= += +
However, plugging into these constraint equations shows that prices are less than marginal costs for both goods. These prices would not exist in a competitive economy because the producers would be taking losses on each unit sold.
Study Guide Review Question Solutions 219
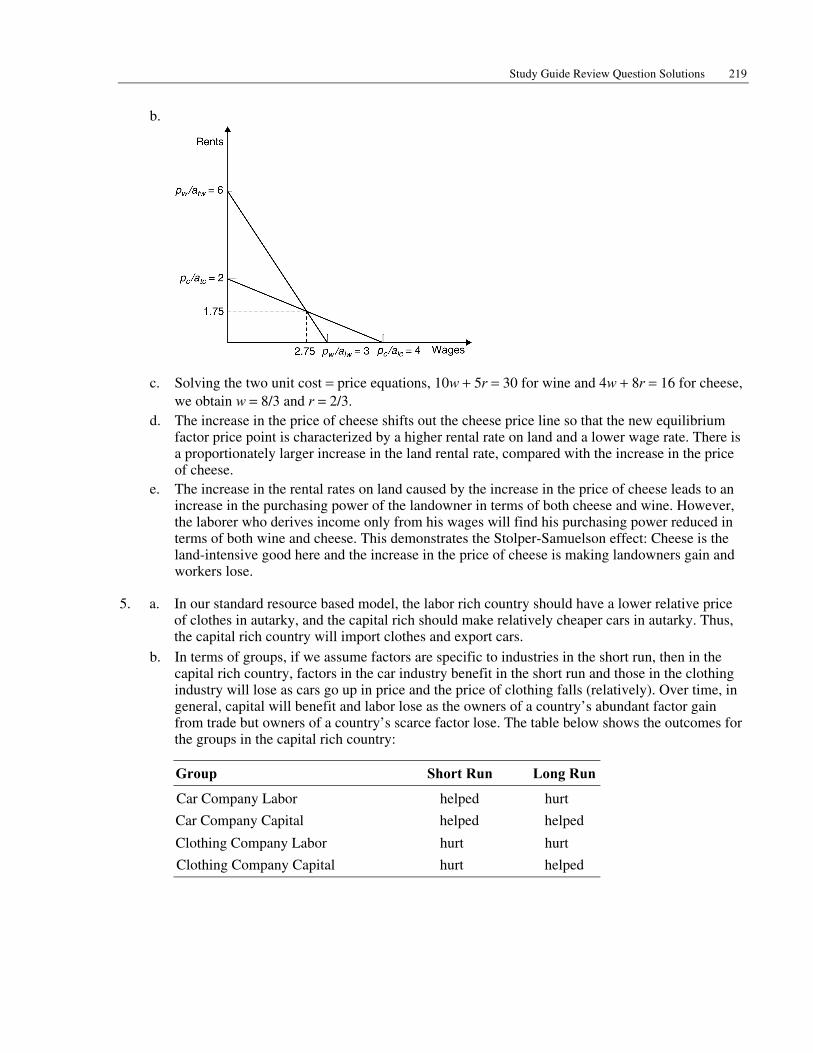
b.
c. Solving the two unit cost = price equations, 10w + 5r = 30 for wine and 4w + 8r = 16 for cheese, we obtain w = 8/3 and r = 2/3.
d. The increase in the price of cheese shifts out the cheese price line so that the new equilibrium factor price point is characterized by a higher rental rate on land and a lower wage rate. There is a proportionately larger increase in the land rental rate, compared with the increase in the price of cheese.
e. The increase in the rental rates on land caused by the increase in the price of cheese leads to an increase in the purchasing power of the landowner in terms of both cheese and wine. However, the laborer who derives income only from his wages will find his purchasing power reduced in terms of both wine and cheese. This demonstrates the Stolper-Samuelson effect: Cheese is the land-intensive good here and the increase in the price of cheese is making landowners gain and workers lose.
5. a. In our standard resource based model, the labor rich country should have a lower relative price of clothes in autarky, and the capital rich should make relatively cheaper cars in autarky. Thus, the capital rich country will import clothes and export cars.
b. In terms of groups, if we assume factors are specific to industries in the short run, then in the capital rich country, factors in the car industry benefit in the short run and those in the clothing industry will lose as cars go up in price and the price of clothing falls (relatively). Over time, in general, capital will benefit and labor lose as the owners of a country’s abundant factor gain from trade but owners of a country’s scarce factor lose. The table below shows the outcomes for the groups in the capital rich country:
Group Short Run Long Run
Car Company Labor helped hurt
Car Company Capital helped helped
Clothing Company Labor hurt hurt
Clothing Company Capital hurt helped
220 Krugman/Obstfeld • International Economics: Theory and Policy, Eighth Edition
Answers to Chapter 5 Review Questions
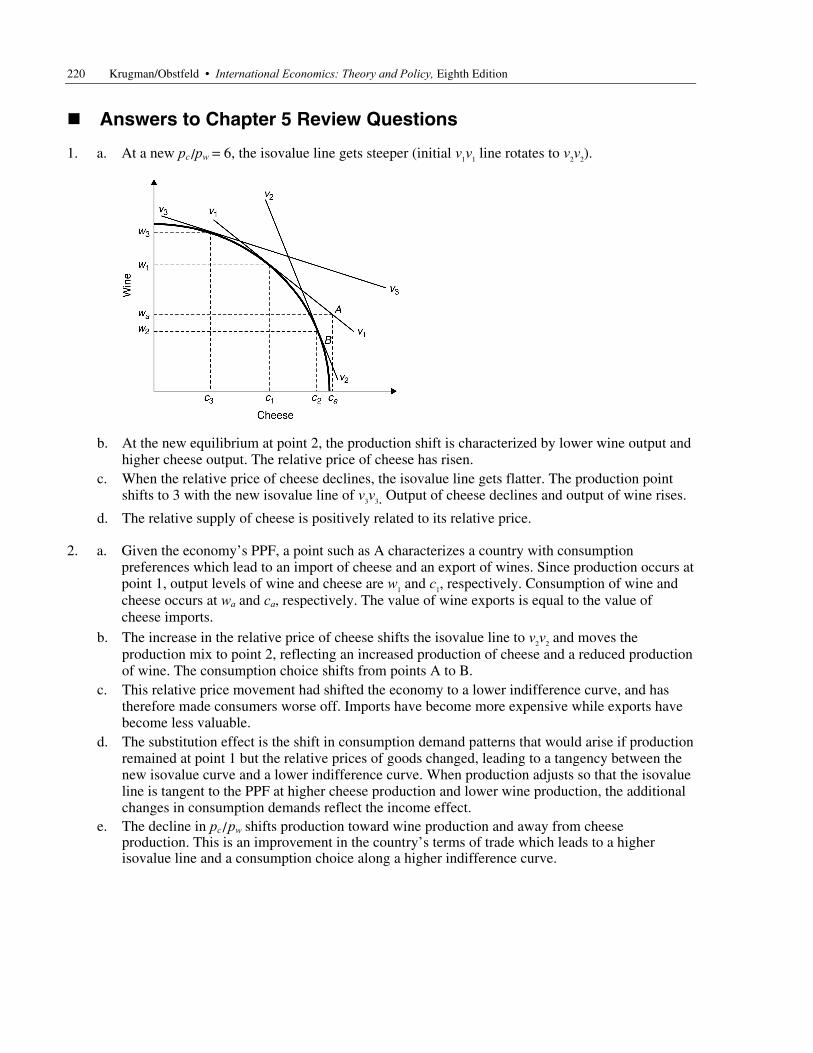
1. a. At a new pc /pw = 6, the isovalue line gets steeper (initial v1v1 line rotates to v2v2).
b. At the new equilibrium at point 2, the production shift is characterized by lower wine output and higher cheese output. The relative price of cheese has risen.
c. When the relative price of cheese declines, the isovalue line gets flatter. The production point shifts to 3 with the new isovalue line of v3v3. Output of cheese declines and output of wine rises.
d. The relative supply of cheese is positively related to its relative price.
2. a. Given the economy’s PPF, a point such as A characterizes a country with consumption preferences which lead to an import of cheese and an export of wines. Since production occurs at point 1, output levels of wine and cheese are w1 and c1, respectively. Consumption of wine and cheese occurs at wa and ca, respectively. The value of wine exports is equal to the value of cheese imports.
b. The increase in the relative price of cheese shifts the isovalue line to v2v2 and moves the production mix to point 2, reflecting an increased production of cheese and a reduced production of wine. The consumption choice shifts from points A to B.
c. This relative price movement had shifted the economy to a lower indifference curve, and has therefore made consumers worse off. Imports have become more expensive while exports have become less valuable.
d. The substitution effect is the shift in consumption demand patterns that would arise if production remained at point 1 but the relative prices of goods changed, leading to a tangency between the new isovalue curve and a lower indifference curve. When production adjusts so that the isovalue line is tangent to the PPF at higher cheese production and lower wine production, the additional changes in consumption demands reflect the income effect.
e. The decline in pc /pw shifts production toward wine production and away from cheese production. This is an improvement in the country’s terms of trade which leads to a higher isovalue line and a consumption choice along a higher indifference curve.
Study Guide Review Question Solutions 221
3. a. At a point such as A the economy has reached its highest indifference curve along isovalue line v1v1. This describes an economy which exports cheese and imports wine.
b. A decline in pc /pw causes the isovalue line to flatten out, yielding increased wine production and decreased cheese production.
c. The terms of trade have worsened, and the trading equilibrium reflects a tangency between the isovalue line and a lower indifference curve. The combination of income and substitution effects make the economy worse off.
d. An improvement (worsening) in an economy’s terms of trade increases (reduces) its welfare.
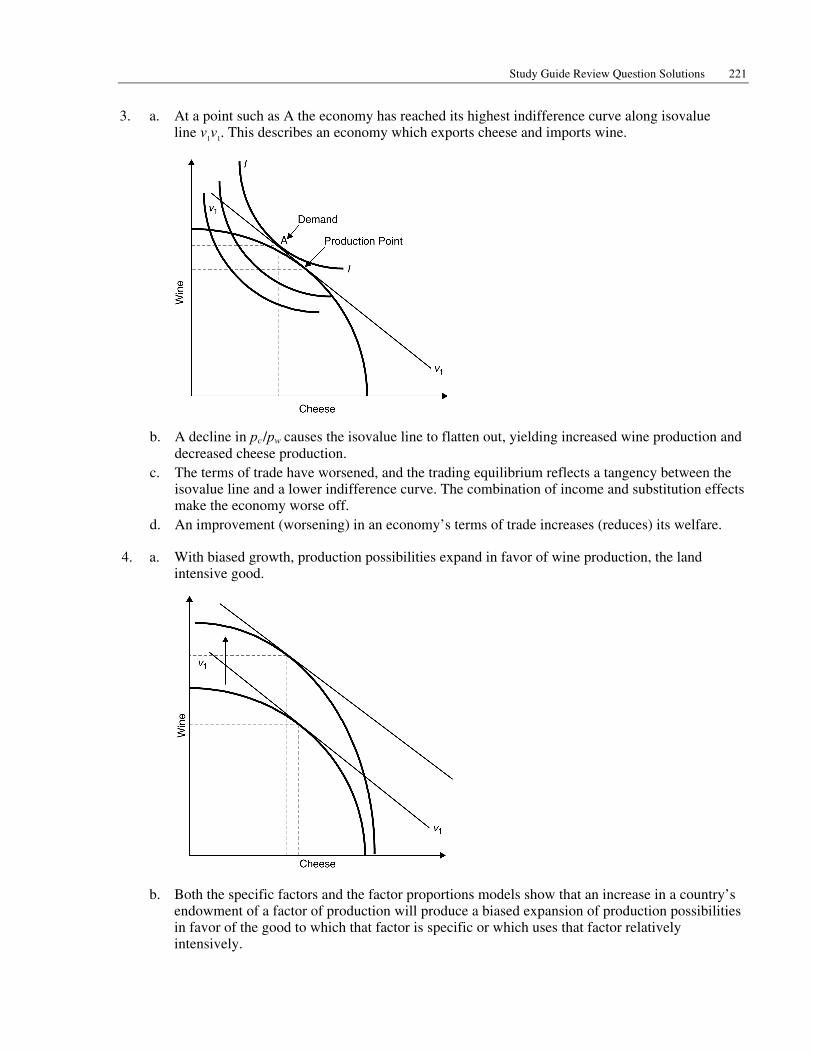
4. a. With biased growth, production possibilities expand in favor of wine production, the land intensive good.
b. Both the specific factors and the factor proportions models show that an increase in a country’s endowment of a factor of production will produce a biased expansion of production possibilities in favor of the good to which that factor is specific or which uses that factor relatively intensively.

222 Krugman/Obstfeld • International Economics: Theory and Policy, Eighth Edition
c. If the relative price of cheese is unchanged following a biased production expansion in favor of wine, this implies that the new equilibrium is characterized by higher wine production and lower cheese production.
d. If the policy objective is to stabilize the production of cheese, despite biased growth in favor of wine, the relative price of cheese would have to increase. This might be accomplished through a distortionary subsidy to cheese production or a tax on wine production. Even with such a relative price increase, the new equilibrium is characterized by a higher relative output of wine after biased growth.
5. a. Holding the relative price of sneakers and beets constant, the new production point reflects increased production of sneakers and decreased production of beets. The good which experiences biased growth expands production. In doing so it draws some resources away from the low growth sector and leads to contraction in the output of the low-growth good.
b. The world relative supply curve shifts to the right, reflecting a higher relative supply of sneakers to beets at every ps /pb. This causes the relative price of sneakers to fall leading to an increase in the world equilibrium consumption of sneakers increases.
c. Since sneakers are the export of this country, the relative decline of the export price is a worsening of this country’s terms of trade. While this terms of trade worsening could bring about immiserizing growth, this possibility is a remote one. It is more likely that the welfare of this country will be improved.
d. If biased growth occurs in the import competing sector, the terms of trade will improve following the leftward shift of the relative supply of sneakers. This terms of trade improvement due to growth will improve the welfare of the economy.
6. a. The relative price of wine to cheese facing both consumers and producers will be 25 percent higher than the relative price on world markets. The relative price of cheese will be comparatively lower at Home than in world markets.
b. Home producers will contract production of cheese and expand production of wine. Home consumers will increase their demand for cheese and reduce their demand for wine. The new equilibrium price of cheese relative to wine will be higher than the pre-tariff price. The size of the shifts of the relative demand and supply curves must be determined before one can posit whether there is an overall expansion or contraction in the equilibrium quantity of cheese relative to wine and whether the relative price adjustment exceeds the 25 percent tariff.
c. The Home terms of trade improves. d. The outcome depends on the large country assumption. Unlike a large country, a small country
could not achieve substantial changes in world relative prices or quantities by imposing a tariff.
Answers to Chapter 6 Review Questions
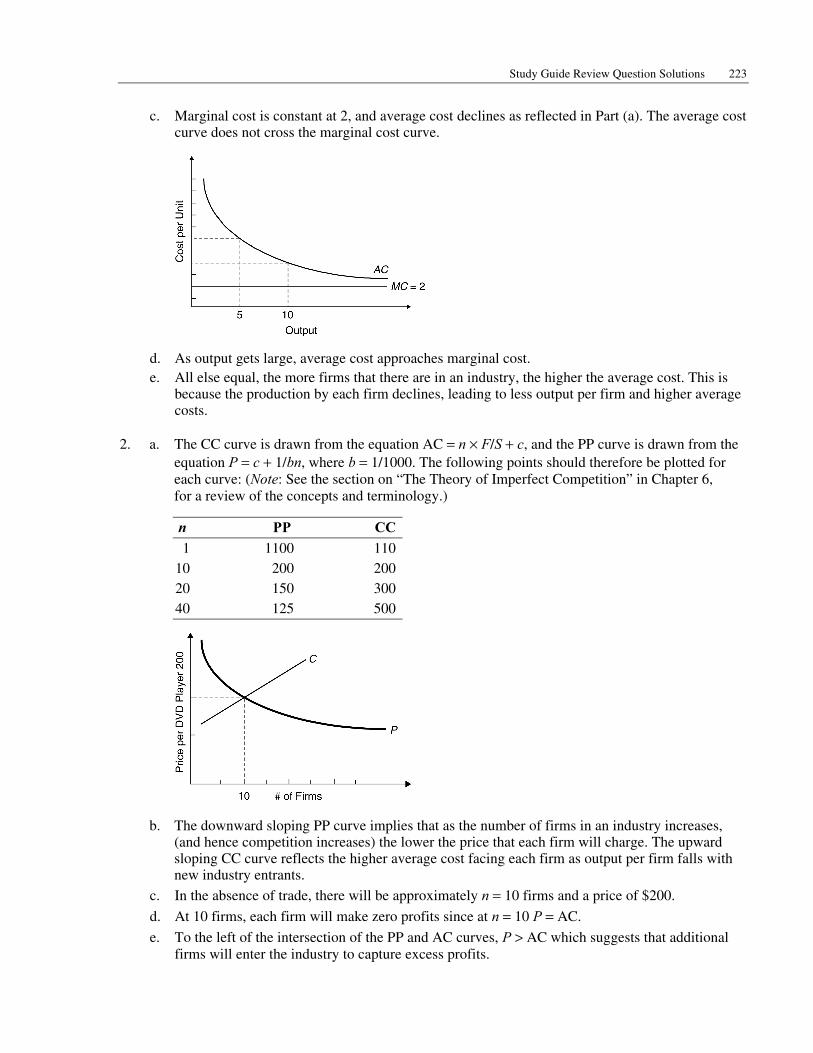
1. a. Using the equation for average cost, AC = F/X + c, where F = 20, c = 2, and X = 5, 10, 20, 40 yields respective average costs equal to 6, 4, 3, and 2.5.
b. Average costs decline as output increases because the firms’ fixed costs are spread over larger output.
Study Guide Review Question Solutions 223
c. Marginal cost is constant at 2, and average cost declines as reflected in Part (a). The average cost curve does not cross the marginal cost curve.
d. As output gets large, average cost approaches marginal cost. e. All else equal, the more firms that there are in an industry, the higher the average cost. This is
because the production by each firm declines, leading to less output per firm and higher average costs.
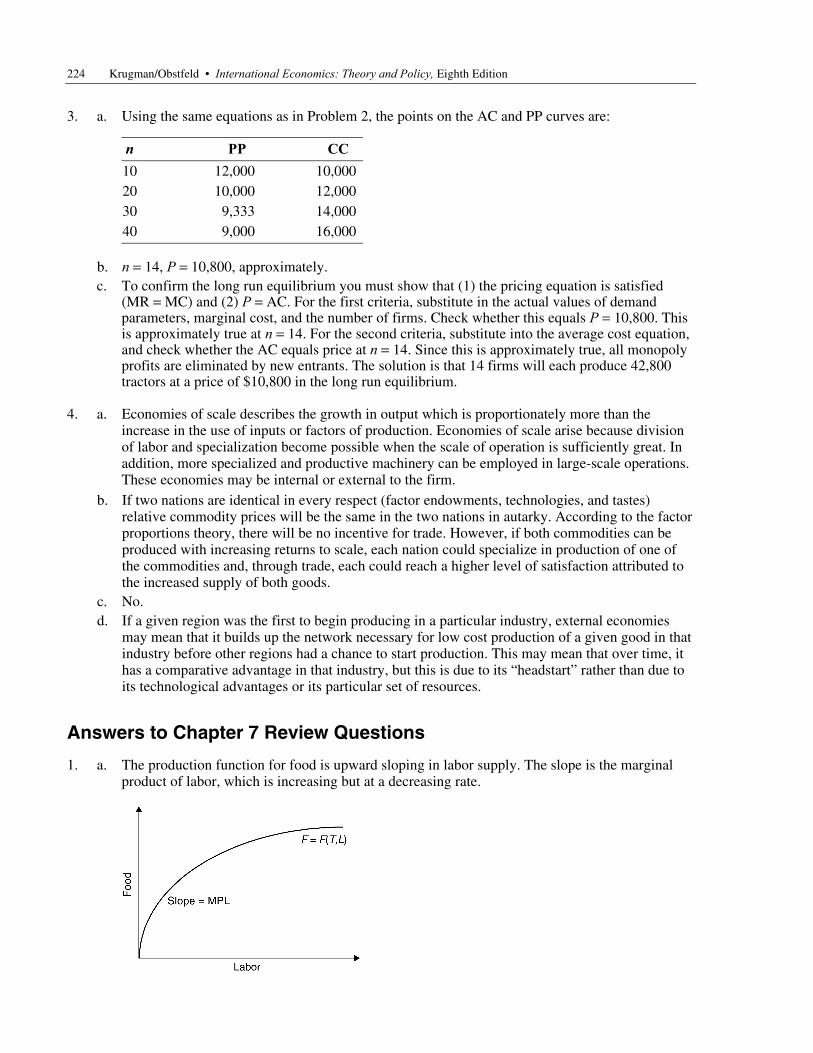
2. a. The CC curve is drawn from the equation AC = n × F/S + c, and the PP curve is drawn from the equation P = c + 1/bn, where b = 1/1000. The following points should therefore be plotted for each curve: (Note: See the section on “The Theory of Imperfect Competition” in Chapter 6, for a review of the concepts and terminology.)
n PP CC1 1100 110
10 200 20020 150 30040 125 500
b. The downward sloping PP curve implies that as the number of firms in an industry increases, (and hence competition increases) the lower the price that each firm will charge. The upward sloping CC curve reflects the higher average cost facing each firm as output per firm falls with new industry entrants.
c. In the absence of trade, there will be approximately n = 10 firms and a price of $200.
d. At 10 firms, each firm will make zero profits since at n = 10 P = AC.
e. To the left of the intersection of the PP and AC curves, P > AC which suggests that additional firms will enter the industry to capture excess profits.
224 Krugman/Obstfeld • International Economics: Theory and Policy, Eighth Edition
3. a. Using the same equations as in Problem 2, the points on the AC and PP curves are:
n PP CC 10 12,000 10,00020 10,000 12,00030 9,333 14,00040 9,000 16,000
b. n = 14, P = 10,800, approximately. c. To confirm the long run equilibrium you must show that (1) the pricing equation is satisfied
(MR = MC) and (2) P = AC. For the first criteria, substitute in the actual values of demand parameters, marginal cost, and the number of firms. Check whether this equals P = 10,800. This is approximately true at n = 14. For the second criteria, substitute into the average cost equation, and check whether the AC equals price at n = 14. Since this is approximately true, all monopoly profits are eliminated by new entrants. The solution is that 14 firms will each produce 42,800 tractors at a price of $10,800 in the long run equilibrium.
4. a. Economies of scale describes the growth in output which is proportionately more than the increase in the use of inputs or factors of production. Economies of scale arise because division of labor and specialization become possible when the scale of operation is sufficiently great. In addition, more specialized and productive machinery can be employed in large-scale operations. These economies may be internal or external to the firm.
b. If two nations are identical in every respect (factor endowments, technologies, and tastes) relative commodity prices will be the same in the two nations in autarky. According to the factor proportions theory, there will be no incentive for trade. However, if both commodities can be produced with increasing returns to scale, each nation could specialize in production of one of the commodities and, through trade, each could reach a higher level of satisfaction attributed to the increased supply of both goods.
c. No. d. If a given region was the first to begin producing in a particular industry, external economies
may mean that it builds up the network necessary for low cost production of a given good in that industry before other regions had a chance to start production. This may mean that over time, it has a comparative advantage in that industry, but this is due to its “headstart” rather than due to its technological advantages or its particular set of resources.
Answers to Chapter 7 Review Questions
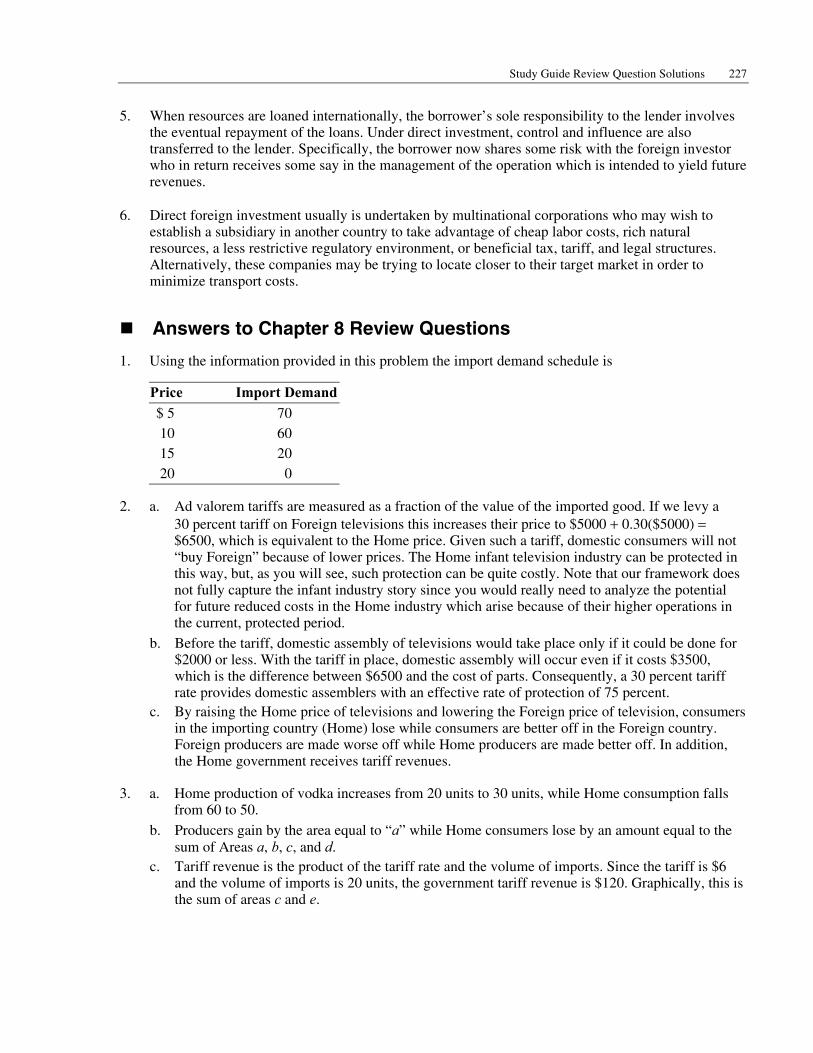
1. a. The production function for food is upward sloping in labor supply. The slope is the marginal product of labor, which is increasing but at a decreasing rate.

Study Guide Review Question Solutions 225
b. The production function has this shape because of the decreasing or diminishing returns to labor, given the fixed supply of land. In other words, as the ratio of labor to land increases, the marginal output of each additional worker declines.
c. In a perfectly competitive economy, the real wage earned by each unit of labor depends on the marginal product of labor. Since the marginal product of labor declines as the number of workers increases, so do the wages received by workers.
d. If the landlord employs 2 workers, he must pay them each $10, implying a total wage bill equal to $20. The rental fee earned by the landlord is the remaining area under the MPL curve and above the MPL = 10 level.
e. If the landlord hires 4 more workers (total workers = 6) the real wage will fall to $2 per worker. The total wage bill will equal $12. The rents received by the landlord increase substantially.
2. a. Since Foreign is labor abundant, workers earn less than workers in the Home country. Consequently, Foreign workers would prefer to move to Home where they can earn higher wages.
b.
The initial labor allocation might have OL1 workers in Home and O*L1 in Foreign, where OL1 < O*L1. At this allocation, the MPL and wages are higher at Home than in Foreign.
c. Labor will shift from Foreign to Home until the real wage and MPL are equalized across the two countries. This occurs at point E in the figure, where the labor allocation is now OL2 and O*L2. Home gains labor at the expense of Foreign. The real wage and the MPL fall in Home and increase in Foreign.
d. While those who remain in Foreign gain from higher wages since labor becomes more scarce, those who remain at Home now receive lower wages. Likewise, landowners at Home benefit from the increased supply of labor while Foreign landowners become worse off.
226 Krugman/Obstfeld • International Economics: Theory and Policy, Eighth Edition
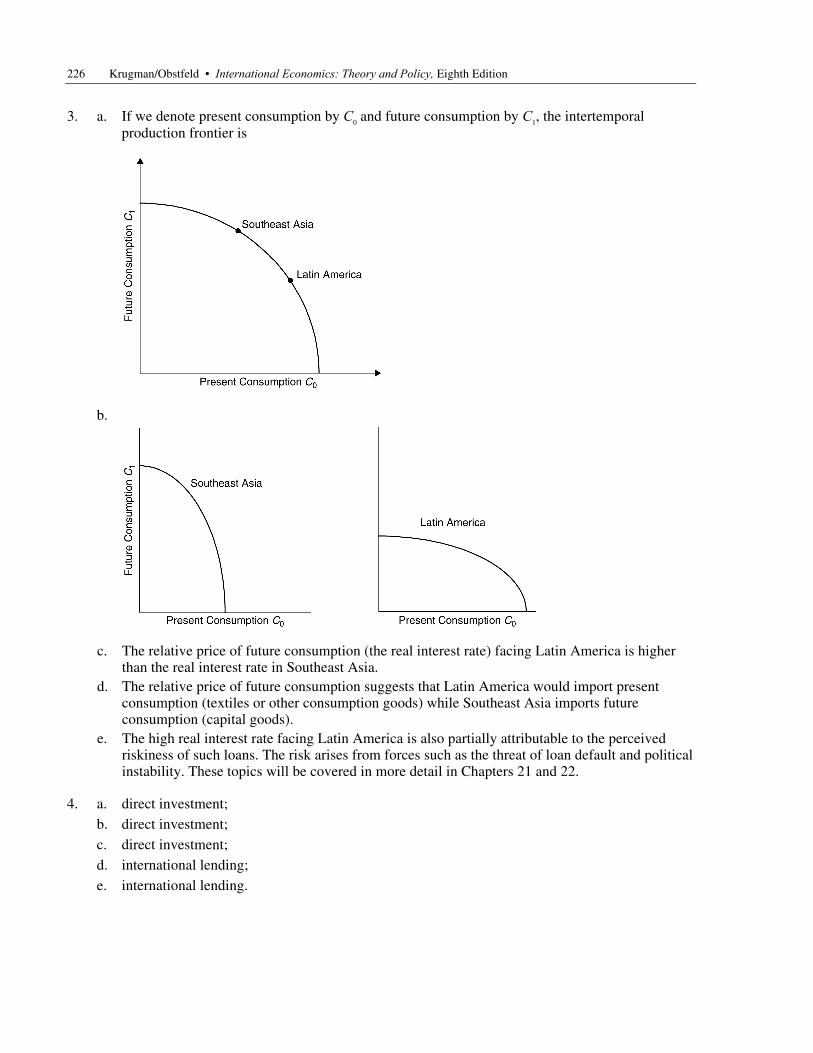
3. a. If we denote present consumption by C0 and future consumption by C1, the intertemporal production frontier is
b.
c. The relative price of future consumption (the real interest rate) facing Latin America is higher than the real interest rate in Southeast Asia.
d. The relative price of future consumption suggests that Latin America would import present consumption (textiles or other consumption goods) while Southeast Asia imports future consumption (capital goods).
e. The high real interest rate facing Latin America is also partially attributable to the perceived riskiness of such loans. The risk arises from forces such as the threat of loan default and political instability. These topics will be covered in more detail in Chapters 21 and 22.
4. a. direct investment; b. direct investment; c. direct investment; d. international lending; e. international lending.
Study Guide Review Question Solutions 227
5. When resources are loaned internationally, the borrower’s sole responsibility to the lender involves the eventual repayment of the loans. Under direct investment, control and influence are also transferred to the lender. Specifically, the borrower now shares some risk with the foreign investor who in return receives some say in the management of the operation which is intended to yield future revenues.
6. Direct foreign investment usually is undertaken by multinational corporations who may wish to establish a subsidiary in another country to take advantage of cheap labor costs, rich natural resources, a less restrictive regulatory environment, or beneficial tax, tariff, and legal structures. Alternatively, these companies may be trying to locate closer to their target market in order to minimize transport costs.
Answers to Chapter 8 Review Questions
1. Using the information provided in this problem the import demand schedule is
Price Import Demand $ 5 70 10 60 15 20 20 0
2. a. Ad valorem tariffs are measured as a fraction of the value of the imported good. If we levy a 30 percent tariff on Foreign televisions this increases their price to $5000 + 0.30($5000) = $6500, which is equivalent to the Home price. Given such a tariff, domestic consumers will not “buy Foreign” because of lower prices. The Home infant television industry can be protected in this way, but, as you will see, such protection can be quite costly. Note that our framework does not fully capture the infant industry story since you would really need to analyze the potential for future reduced costs in the Home industry which arise because of their higher operations in the current, protected period.
b. Before the tariff, domestic assembly of televisions would take place only if it could be done for $2000 or less. With the tariff in place, domestic assembly will occur even if it costs $3500, which is the difference between $6500 and the cost of parts. Consequently, a 30 percent tariff rate provides domestic assemblers with an effective rate of protection of 75 percent.
c. By raising the Home price of televisions and lowering the Foreign price of television, consumers in the importing country (Home) lose while consumers are better off in the Foreign country. Foreign producers are made worse off while Home producers are made better off. In addition, the Home government receives tariff revenues.
3. a. Home production of vodka increases from 20 units to 30 units, while Home consumption falls from 60 to 50.
b. Producers gain by the area equal to “a” while Home consumers lose by an amount equal to the sum of Areas a, b, c, and d.
c. Tariff revenue is the product of the tariff rate and the volume of imports. Since the tariff is $6 and the volume of imports is 20 units, the government tariff revenue is $120. Graphically, this is the sum of areas c and e.
228 Krugman/Obstfeld • International Economics: Theory and Policy, Eighth Edition
d. If the government wishes to help the consumers, it could begin by redistributing the tariff revenues back to consumers through tax rebates, consumer subsidies, increased social services, and so on.
e. If Home were a small country, it would not be able to drive down the foreign export price to $9. Consequently, it would lose the terms of trade gain from the tariff represented by area e. Welfare in the small country clearly would be reduced under such a tariff.
4. a. While the price in the exporting country (Home) rises from $6000 to $6450, the price in the Foreign country falls from $6000 to $5550. The price increase at Home is less than the subsidy, due to the elasticities of demand at home and abroad.
b. As a result of the price increase, Home production of tractors expands from 70 to 80 units and exports expand by 20 units, from 50 to 70 tractors.
c. Tractor consumers at Home are hurt by the price rise. Producers of tractors gain. The government loses. Instead of receiving the revenue as it does in the tariff case, it must expend money on the export subsidy.
d. Graphically, the consumer loss is equal to the areas a + b, the producer gain is the areas a + b + c, and the government loss is b + c + d + e + f + g + h + i.
e. The export subsidy worsens the Home terms of trade by lowering the export price in the foreign market. This is in direct contrast to the terms of trade effects of a tariff.
5. a. Under free trade, Home imports of cheese equal 60(65 – 5) pounds. Under the quota, cheese imports are restricted to 40 pounds.
b. The quota increases the domestic price of cheese and leads to a reduction of consumer surplus equal to the areas (a + b + c + d). Home cheese producers gain from the higher price: this amount is equal to area a.
c. The quota rents are equivalent to area c. d. No, there is no terms of trade effect. This is because Home is a small country and
does not alter world prices. The fact that the policy is a quota is irrelevant.
Answers to Chapter 9 Review Questions
1. a. When a tariff of 25 percent is imposed, the new small country price is (1 + t)pw = $10,000.
b. In the large country case, the imposition of a tariff increases the domestic price of the protected good and lowers the foreign price of the good. However, in the small country case neither the price on world markets of the terms of trade are affected.
c. The tariff causes a net loss to the Foreign (small) country which is measured by the production and consumption distortion triangles.
d. The United States is relatively less dependent on trade than are other large industrialized countries. There is also relatively less protectionism in U.S. markets.
2. While, in general, rich country agricultural subsidies are often seen as preventing poor countries from exporting agricultural goods, and thus hurting poor countries, this is not true for all countries. Subsidies in agriculture lower the world price of those goods, and hence, any exporter of those goods is hurt, but any importer is helped. Thus, countries that import agricultural goods and export manufacturing (or tourism) are in fact helped by rich country subsidies. Countries that only export agriculture are unambiguously hurt, and those countries that export some products and import others are in a middle ground where they may be helped or hurt depending on the volume and price impacts.
Study Guide Review Question Solutions 229
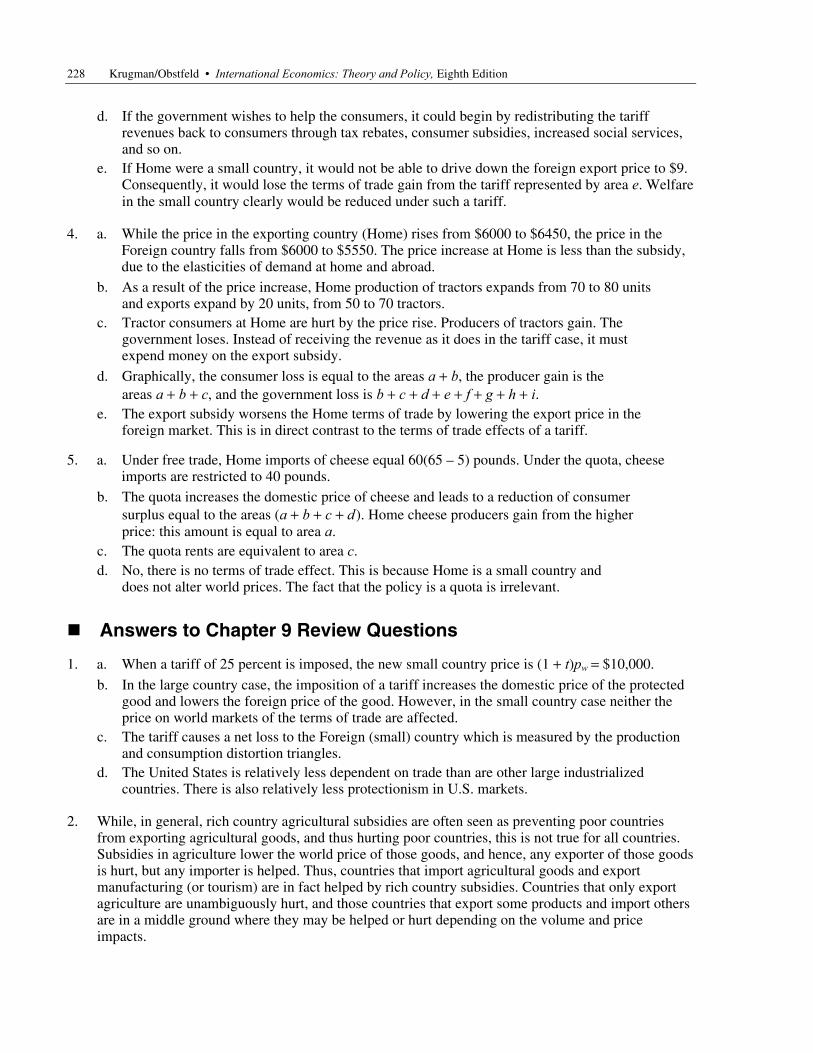
3. a. Increases in any tariff rate t < t* will benefit national welfare; declines in any tariff rates greater than t* will also increase national welfare.
b. A large country that can influence the price facing foreign exporters can improve welfare by imposing a small tariff because it causes the world relative price of imports to decline. At t*, the optimal tariff rate, the marginal gains from the improved terms of trade are precisely equal to the marginal efficiency losses associated with the imposition of the tariff.
c. At point B, the tariff rate is so prohibitively high that all trade ceases. The country is worse off than with free trade (t = 0) or any lower tariff rates. Increasing the tariff further has no additional effect since trade is already wiped out.
d. A large country can potentially exploit its national monopoly power to extract rents from its trading partners. In doing so, it risks bad economic relations with other countries as well as retaliatory actions.
4. a. The theory of second-best argues that if certain markets (for example, labor markets or capital markets) are not functioning properly, government intervention may actually lead to increased national welfare if some of the costs of market failures are offset. The gains from reducing the market failure costs could potentially exceed the negative distortionary effects of tariffs and other protectionist policies. Applied specifically to trade policy, it is argued that imperfections in the domestic internal economy may justify interference in the external economy. This requires that domestic policies aimed directly at the domestic market failure are infeasible.
b. The price facing the small country rises to Pw + t, causing textile production domestically to increase and consumption to fall.
c. Standard trade theory argues that such a tariff will produce consumption and production distortions. There are no terms of trade gains which could potentially offset these efficiency losses.
d. The extra social benefits yielded by textile production must also be included in the calculations of producer surplus. Therefore, the small country can gain from the imposition of the tariff if this additional societal gain (area c) exceeds the production and consumption deadweight losses (areas a + b).
e. The same increase in textile production caused by the tariff could have been achieved by directly targeting the industry with a production subsidy. This would have avoided the consumer surplus losses (area b).
230 Krugman/Obstfeld • International Economics: Theory and Policy, Eighth Edition
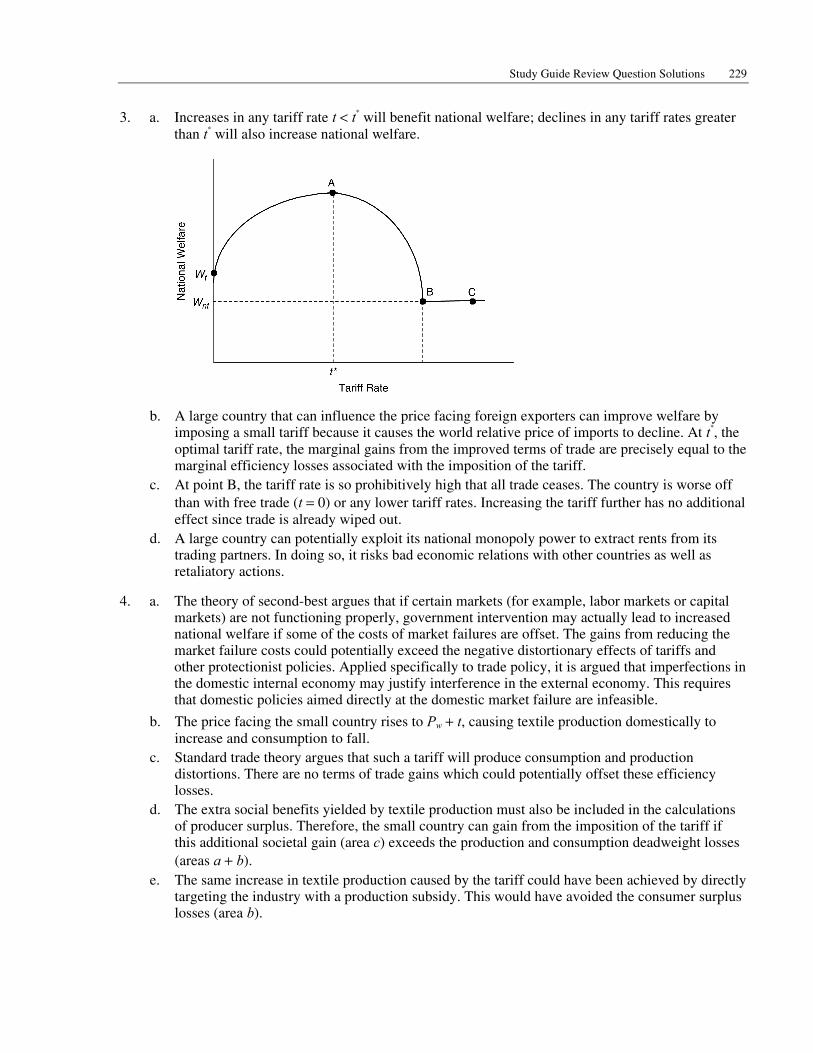
5. a. A small country that imposes a tariff can expect unchanged prices on the world markets, domestic prices of the imported good to increase by the full amount of the tariff, domestic production of the imported good to increase and be absorbed by world markets, domestic consumption of the imported good to decline, and welfare of the small country to decline.
b.
If the small country imposes a 100 percent ad valorem tariff on cloth imports, Pc /Pw will remain at 1 on the world market, but will increase to 2 for domestic producers and consumers, thereby reflecting the full tariff without any terms of trade adjustment. At this new relative price, the small country will produce at point C and consume at point D, where the lower indifference curve reflects the decline in national welfare.
6. a. A 50 percent ad valorem tariff increases the home price from $2 to $3, by the full amount of the tariff without any effect on foreign prices. At the new price, Home consumption is 20 units less (from 100 to 80 units), and domestic production of cloth rises by 20 units (from 20 to 40). Consequently, the net effect on trade is a 40 unit reduction in imports of cloth. Since 40 units remain imported, the government revenues are $1 × 40 = $40.
b. Consumption and production effects, and the effects of the trade balance, would be increased the greater the elasticity of the demand and supply curves. However, when demand and supply curves are highly elastic, the tariff will lead to lower revenues. This implies that a government can collect higher levels of tariff revenues on more inelastic goods. However, it should be noted that the accumulation of such revenues is not the primary objective of trade policies.
c. A prohibitive tariff is one which is high enough to stop all imports of a good. If the Home price of cloth increases to $4 then domestic production is sufficient to satisfy domestic demand, resulting in zero imports. This could be achieved by a 100 percent ad valorem tariff on the initial price. If there are transport costs this ad valorem tariff can be less than 100 percent and achieve the same goal.
Study Guide Review Question Solutions 231
Answers to Chapter 10 Review Questions
1. a. Traditional trade theory is often criticized for being static, meaning that it is only useful for determining a nation’s comparative advantage and trade patterns at a point in time without adequately considering the potential for economic growth. To properly consider economic growth arguments, a more dynamic framework is required. Traditional trade theory prescribes that developing countries should specialize in the areas in which they have comparative advantage. For many developing countries this implies the production and export of raw materials, textiles, and agricultural products, and the import of manufactures and high technology goods from the developed nations. Developing countries fear that these prescriptions relegate them to a subordinate and dependent position relative to developed nations.
b. Proponents of the traditional theory would argue that it is quite straight forward to extend traditional arguments to take into account any changes in factor endowments, technologies, and tastes of developing countries. As developing countries acquire new capital, skills, and technologies, even traditional trade theory would modify the production orientation of the developing countries. Of course, it can be argued that by adopting the initial production and growth strategy, a country might develop skills and vested interests which delay the development of an alternative mix of industries.
2. The 19th century development and rapid economic growth of the Western Hemisphere was spurred by large inflows of capital and skilled labor from overpopulated Europe. The Industrial Revolution was also associated with increased demand for food, raw materials, and other products from the developing countries.
Today’s less developed countries, however, are generally overpopulated and resources are poor (with the exception of those which export petroleum) and face declining terms of trade for their products, including foodstuffs and raw materials. This seriously damages their immediate prospects for export-led growth and leads to pressures to protect the agricultural and raw materials sectors, further aggravating the problems. The absence of demand driven growth, (in fact demand has slackened), accompanied by reluctance to transfer factors across sectors of the economy hinder the potential for a repeat of the phenomenon of the massive Western Hemisphere growth.
3.
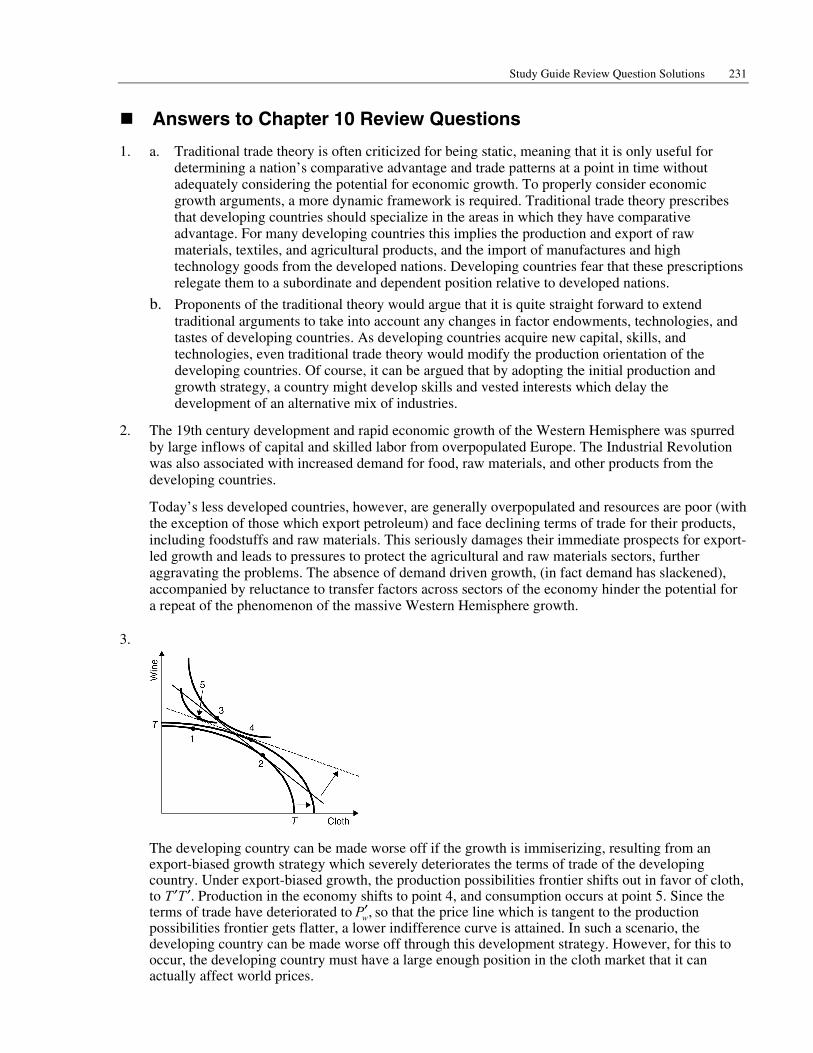
The developing country can be made worse off if the growth is immiserizing, resulting from an export-biased growth strategy which severely deteriorates the terms of trade of the developing country. Under export-biased growth, the production possibilities frontier shifts out in favor of cloth, to T ′T ′. Production in the economy shifts to point 4, and consumption occurs at point 5. Since the terms of trade have deteriorated to ,wP′ so that the price line which is tangent to the production possibilities frontier gets flatter, a lower indifference curve is attained. In such a scenario, the developing country can be made worse off through this development strategy. However, for this to occur, the developing country must have a large enough position in the cloth market that it can actually affect world prices.
232 Krugman/Obstfeld • International Economics: Theory and Policy, Eighth Edition
4. One problem is that if incentives are very strong in the export zone, the policy could harm domestic-oriented industries that have to compete for talent and capital with the companies in the export zone. In addition, the plan could worsen problems of economic dualism. If the wage in the export zone is sufficiently higher than the prevailing wage in the country, excess labor could flow to the area even if the odds of getting a job are low. This, in turn, could lead to high levels of urban unemployment and homelessness.
5. a. A large country may have a large enough domestic market to attempt import substitution, and if it is rich in the resources used to make the product, it may have a long-run comparative advantage in the product. The fact that the product is currently made by a foreign monopolist may imply that the home country is currently paying monopoly rents to the foreign producer, further justifying a trade intervention. Dangers of the policy include the fact that the home country may not have a comparative advantage in the industry in the long run. In this case, an inefficient industry which is dependent on the tariff could develop leaving the customers paying a higher price for and inferior good.
b. Export orientation may be the best choice given the strong ports and the likelihood that the small domestic market will imply that producers aimed only at the domestic market may not have sufficient scale. Choosing specific industries could be dangerous, because the government could focus its energies in the wrong place, but a general support of light industry and a campaign to gather the necessary capital investments could be helpful.
c. Given the country’s beauty and lack of a natural manufacturing or commercial base, this country would probably be best to focus on its comparative advantage, tourism or cultural and artistic exports. Excessive growth in tourism could lead to a one-dimensional economy and overdevelopment, but protection of manufacturing would probably only lead to inefficient industries and costs to consumers.
6. a. The Czech Republic has a highly-educated workforce and is located near large consumer markets in the EU. It could thus possibly benefit from policies that promoted manufacturing and exports (as well as a continued focus on education).
b. Because India is a huge country with a substantial rural population, an export manufacturing sector, while possibly beneficial, would not solve all of India’s economic problems. Policies which help productivity in the agriculture sector, educate the rural population, and spread opportunities for education throughout the country would probably be more beneficial.
c. Malawi is a landlocked country making a focus on exports to large developed country markets difficult to pursue.
Answers to Chapter 11 Review Questions
1. a. Just as market failures provide a justification for certain trade policies as a second best approach to a distortion, government intervention in industrial activity and economic growth is also second best. An active government strategic trade policy which encourages the transfer of resources across sectors is justified if, when left alone to market forces, the shift would occur too slowly or not at all. The government intervention in the success of an industry encourages a transfer of resources which the market would not directly support. The market failure may be in the inability of producers to capture societal externalities.

Study Guide Review Question Solutions 233
b. Rather than examining which sectors should be growing more rapidly than that dictated by pure market forces, governments often attempt to predict which industries will be associated with future industrial growth. The industries which are often targeted and excessively encouraged are high value added industries, linkage industries, industries with high growth potential, and industries targeted by foreign governments. These are the wrong selection criterion. Instead, the government should assess the extent of the market failures afflicting an industry and the costs of these market failures.
c. It is generally inappropriate to target a domestic industry for expanded growth simply because a foreign country has targeted the industry. This choice can be damaging because it is independent of market failure arguments, because it ignores the principles of comparative advantage, and because it draws additional resources into a sector which is already expanding supply and therefore lowering profit rates.
2. a. Two market failures which occur among industrialized nations include: (i) the inability of firms in high technology industries to capture the full social returns associated with their investment in knowledge (this is in part due to spillovers into other domestic firms, and in part due to spillovers appropriated by foreign firms); and (ii) the presence of monopoly profits in highly oligopolistic industries.
b. The creation of knowledge vis-à-vis the high technology industry can span the initial innovation through the range of eventual applications. Many of the innovations are never developed into products and do not find practical application. Research and development fulfills the dual role of generating many innovations which will never see practical applications nor reap profits and generating innovations which will contribute to social welfare and profitability.
3. The success of Internet industries and particularly those in the United States highlights the way in which strategic trade policies may be difficult to carry out and in fact could be harmful. Ten to fifteen years ago, few would have known to focus on the Internet and especially not on specific companies or segments of the Internet economy. The spectacular success of entrepreneur-driven enterprises and the ability of venture capital and capital markets to fund these businesses calls into question the need or ability of the government to spur growth industries. Even today, it would be difficult to predict where this industry is going or how the government could help it. These businesses succeeded in the United States without the help of strategic trade policies, and in fact, had the government pursued strategic trade policies more broadly, aimed at other high-tech industries, it is possible that capital and talent would have been diverted from the Internet economy and the United States would not have had the success it has had to date. Entrepreneurs and capital markets did their jobs, and, in a sense, these are the areas the United States has a comparative advantage, making its success in the Internet logical from a standard trade theory perspective.
4. The crucial test would be whether U.S. and foreign firms were treated equally. If many U.S. firms were able to get exemptions or enforcement was not tight, but foreign firms had to meet the standards in all cases, then the law may be considered in violation of WTO rules. On the other hand, if the domestic and foreign firms are treated equivalently, then the law should pass muster. As for the case when only U.S. firms meet the standards, it becomes more difficult. While meeting the letter of the law, the intent of the law may be to ban or hinder imports. This may make the WTO more apt to look for flaws in the law to strike down the de facto protectionism. Clearly, though, some who voted for the law would have done so for purely environmentalist reasons and they may be quite upset at any action of the WTO to prevent the United States from pursuing its goals, especially if they meet the letter of the law.
5. Rich-country workers will benefit as the price of products from low-wage countries will rise and become less competitive with those made in the high-wage countries. Rich-country consumers, though, will lose as they must pay more for products manufactured abroad. Whether any one individual benefits would depend on the industry in which they work and their consumption bundle.

234 Krugman/Obstfeld • International Economics: Theory and Policy, Eighth Edition
Poor country workers may or may not be better off. It depends on whether the working conditions or wages rise fast enough to compensate for any possible job losses due to the increased cost of production. It is quite likely that some will lose their jobs, but the benefits that accrue to those who keep their jobs may outweigh the costs of reduced employment. For poor-country consumers, it would depend on how labor standards are raised. If it is done through specific laws regarding export sectors and export industries, then there should be little effect on the consumption basket of the local consumers. On the other hand, if the standards are accomplished through broad labor market reforms, local consumers may also have to pay more for products they typically consume.
6. As noted in the text, trade can have a complex set of impacts on the environment. Based on the environmental Kuznets curve, though, we might think that increased trade between the United States and China would have two offsetting effects. It should make both the countries richer, moving China up the slope from poor to middle class and pushing the United States down the slope from rich to richer. If we think production of goods will shift from clean factories in the U.S. to dirtier ones in China, it would be bad for the environment. However, if it means closing old U.S. factories and opening newer cleaner ones in China it might be good. The U.S.–Korea trade relationship should be less ambiguous as it would make both countries richer and move both down the downward sloping side of the curve. As both countries get richer they should be able to afford greater environmental regulation. In general, the environmental benefits should outweigh the costs.
Answers to Chapter 12 Review Questions
1. a. For a Closed Economy:
i. Y = C + I + G
ii. Y = C + Sp + T
Sp – I = G – T b. For an Open Economy:
i. Y = C + I + G + EX – IM
ii. Y = C + Sp + T
iii. CA = EX – IM
Sp – I = G – T + CA
2. a.
Country S/GNP I/GNP (G − T)/GNP CA/GNP Oceania 0.22 0.20 0.02 0.00 Armansk 0.22 0.15 –0.01 0.08 Naboo 0.17 0.22 0.00 –0.05 Klingon 0.21 0.15 0.05 0.01
b. There is no consistent relationship since the difference between the fiscal budget and the current account just reflects differences in national savings or investment rates.
c. Again, there is no consistent relationship since there are differences in national savings or investment rates.

Study Guide Review Question Solutions 235
3. The Freedonia Balance of Payments Account (millions of Freedonia Dollars)
Current Account 1. Exports of which: $48 2. Merchandise e + h + j + k + r 3. Investment Income Received p 4. Imports of which: −$44 5. Merchandise c + d + i + n + q + t 6. Investment Income Paid b 7. Net Unilateral Transfers m – u 8. Balance on Current Account $8
Financial Account 9. Freedonian assets held abroad of which: –$28 10. Official Reserve Assets l 11. Other Assets g 12. Foreign Assets Held in Freedonia of which: $32 13. Official Reserve Assets o 14. Other Assets a + f + s 15. Balance on Financial Account $4 16. Statistical Discrepancy –$12
Note: Foreign aid is a current account item unless it is debt forgiveness. The reason debt forgiveness is separate is to prevent forgiveness from causing a one-time shift in both the grantor’s and receiver’s current account.
Answers to Chapter 13 Review Questions
1. Suppose that it takes 1.1 U.S. dollars to purchase 1 euro, and 1.5 U.S. dollars to purchase 1 British pound. Then the number of euro per pound is calculated by dividing ($/£)/($/euro) = 1.5/1.1 = 1.36 euro/£.
2. a.
University Price of T-Shirt Exchange Rate Dollar Price Sorbonne 12 Euro 1 Euro/$ $12.00 Delhi University 350 Rupees 35 Rupees/$ $10.00
Seoul Nat. Univ. 8080 Wons 800 Wons/$ $10.10
Hebrew Univ. 24 Shekels 3 Shekels/$ $ 8.00
Trinity College 8 Pounds 0.7 Pounds/$ $11.43
b.
Currency Franc Rupee Won Shekel Punt Exchange Rate: 0.9 F/$ 30 R/$ 880 W/$ 2.5 S/$ 0.6 P/$Appreciation or Apprec. Apprec. Depr. Apprec. Apprec. Depreciation? Dollar Price Rise Rise Fall Rise Rise Rise or Fall?
236 Krugman/Obstfeld • International Economics: Theory and Policy, Eighth Edition
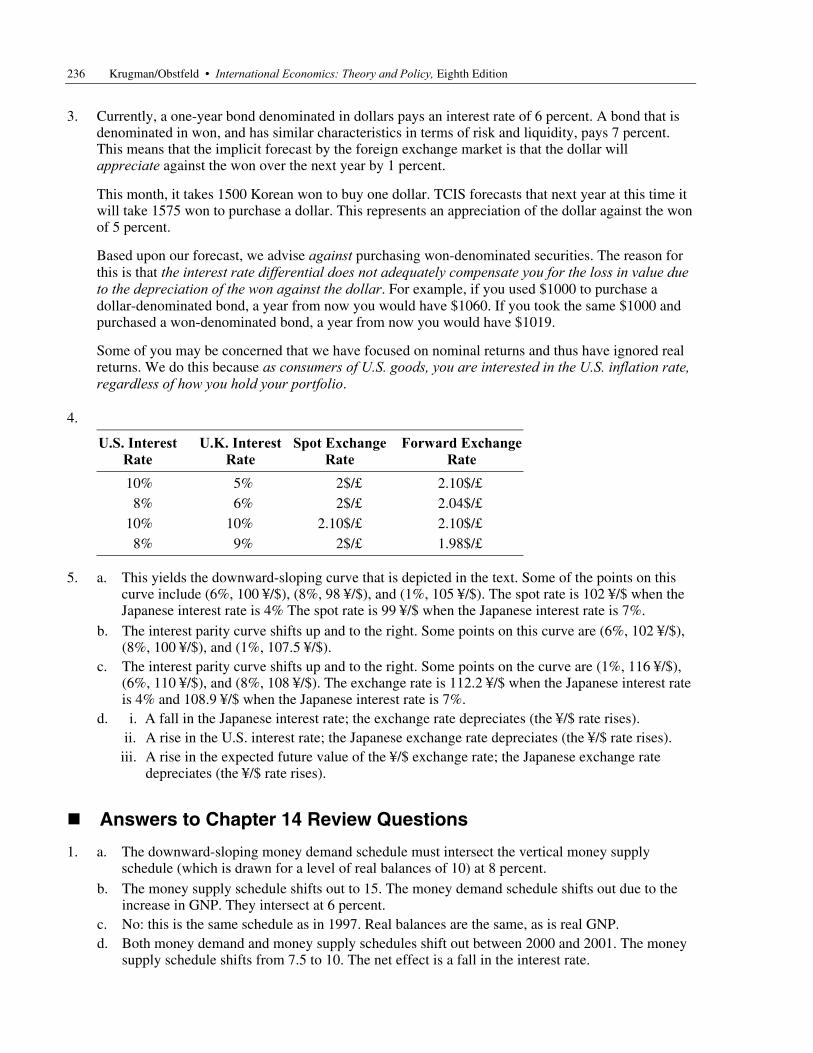
3. Currently, a one-year bond denominated in dollars pays an interest rate of 6 percent. A bond that is denominated in won, and has similar characteristics in terms of risk and liquidity, pays 7 percent. This means that the implicit forecast by the foreign exchange market is that the dollar will appreciate against the won over the next year by 1 percent.
This month, it takes 1500 Korean won to buy one dollar. TCIS forecasts that next year at this time it will take 1575 won to purchase a dollar. This represents an appreciation of the dollar against the won of 5 percent.
Based upon our forecast, we advise against purchasing won-denominated securities. The reason for this is that the interest rate differential does not adequately compensate you for the loss in value due to the depreciation of the won against the dollar. For example, if you used $1000 to purchase a dollar-denominated bond, a year from now you would have $1060. If you took the same $1000 and purchased a won-denominated bond, a year from now you would have $1019.
Some of you may be concerned that we have focused on nominal returns and thus have ignored real returns. We do this because as consumers of U.S. goods, you are interested in the U.S. inflation rate, regardless of how you hold your portfolio.
4.
U.S. Interest Rate
U.K. Interest Rate
Spot ExchangeRate
Forward ExchangeRate
10% 5% 2$/£ 2.10$/£ 8% 6% 2$/£ 2.04$/£
10% 10% 2.10$/£ 2.10$/£ 8% 9% 2$/£ 1.98$/£
5. a. This yields the downward-sloping curve that is depicted in the text. Some of the points on this curve include (6%, 100 ¥/$), (8%, 98 ¥/$), and (1%, 105 ¥/$). The spot rate is 102 ¥/$ when the Japanese interest rate is 4% The spot rate is 99 ¥/$ when the Japanese interest rate is 7%.
b. The interest parity curve shifts up and to the right. Some points on this curve are (6%, 102 ¥/$), (8%, 100 ¥/$), and (1%, 107.5 ¥/$).
c. The interest parity curve shifts up and to the right. Some points on the curve are (1%, 116 ¥/$), (6%, 110 ¥/$), and (8%, 108 ¥/$). The exchange rate is 112.2 ¥/$ when the Japanese interest rate is 4% and 108.9 ¥/$ when the Japanese interest rate is 7%.
d. i. A fall in the Japanese interest rate; the exchange rate depreciates (the ¥/$ rate rises). ii. A rise in the U.S. interest rate; the Japanese exchange rate depreciates (the ¥/$ rate rises). iii. A rise in the expected future value of the ¥/$ exchange rate; the Japanese exchange rate
depreciates (the ¥/$ rate rises).
Answers to Chapter 14 Review Questions
1. a. The downward-sloping money demand schedule must intersect the vertical money supply schedule (which is drawn for a level of real balances of 10) at 8 percent.
b. The money supply schedule shifts out to 15. The money demand schedule shifts out due to the increase in GNP. They intersect at 6 percent.
c. No: this is the same schedule as in 1997. Real balances are the same, as is real GNP. d. Both money demand and money supply schedules shift out between 2000 and 2001. The money
supply schedule shifts from 7.5 to 10. The net effect is a fall in the interest rate.

Study Guide Review Question Solutions 237
2. a. A temporary increase in the money supply shifts out the money supply line, lowering interest rates and depreciating the currency.
b. An increase in the price level lowers real balances, shifting the money supply line up, raising interest rates and appreciating the currency. If the change in the price level is temporary, there is no effect on the interest parity line.
c. A decrease (that is, an appreciation) in the expected future exchange rate shifts the interest parity curve in but has no effect on the money market. This causes the spot exchange rate to appreciate.
3.
Short-Run Effect Long-Run EffectPrices N I Output I N Nominal E.R. I (depreciates) I (depreciates) Real E.R. I N Real M. Balances I N
4. Graph 4-1 demonstrates an equilibrium where the money supply is $400 million, the U.S. price level is equal to 100, the U.S. interest rate is 7 percent, and the U.S. dollar/U.K. pound exchange rate equals its long-run expected level of 2. Not shown in the graph is the U.K. price level, which is equal to 50. a. The temporary decrease in the money supply to $300 lowers real balances, raises the interest
rate, and causes the nominal and real exchange rates to appreciate. This effect is depicted by an upward shift of the money supply schedule.
b. The interest parity line shifts down when the money supply schedule shifts in. This causes a larger initial appreciation of the currency than if the money supply change were temporary.
c. The long-run value of the U.S. price level is 75. The U.S. interest rate is still 7 percent in the long run. The dollar/pound exchange rate is 1.5 (in order to return to the same real exchange rate of 2 × 50/100 = 1, we need the exchange rate to appreciate to 1.5 since 1.5 × 50/75 = 1).
d. Over time, as the price level falls the money supply line shifts out, eventually returning to its original position. The price level steadily falls towards its new level, real balances first fall and then return to their original level, and the exchange rate appreciates, at first overshooting its long-run level and then depreciating back to 1.5 dollars/pound.
Answers to Chapter 15 Review Questions
1. a. Calculate this by the following formula:
$/£ real exchange rate = [(nominal rate × British CPI)]/U.S. CPI.
b. Absolute purchasing power parity predicts that the real exchange rate is constant across time.

238 Krugman/Obstfeld • International Economics: Theory and Policy, Eighth Edition
c. In general, we cannot use CPI data to test absolute PPP because different countries have different baskets of goods and more importantly different base years to their indices, making absolute comparisons difficult. These data do not show us if prices are equivalent for each good, they are only helpful in showing relative changes. Thus, while the real exchange rate is stable in the 1960s, we cannot say if absolute PPP held during this time. We can see that in the 1980s and 2000s absolute PPP did not hold because the real exchange rate is not constant over time.
Year
$/£ Real Exch. Rate
% Change fromPrevious Year
1961 1.223 1962 1.262 3.2% 1963 1.269 0.6% 1964 1.289 1.6% 1965 1.331 3.2% 1966 1.341 0.8% 1967 1.314 −2.0%
1980 1.909 1981 1.688 −11.6% 1982 1.490 −11.7% 1983 1.309 −12.2% 1984 1.160 −11.4% 1985 1.152 −0.6% 1986 1.324 14.9% 1987 1.485 12.2%
Year
$/£ Real Exch. Rate
% Change fromPrevious Year
2000 1.516 2001 1.426 −6.0% 2002 1.487 4.3% 2003 1.629 9.6% 2004 1.831 12.4% 2005 1.810 −1.2% 2006 1.832 1.2%
2. a. Relative purchasing power parity predicts that the change in the real exchange rate over time is zero.
b. Using the data in Question 1 we find that relative purchasing power parity appears to have held reasonably well in the 1960s, but was violated in the 1980s.
c. The 1960s were a period of fixed nominal exchange rates while the 1980s were a period of floating exchange rates. A large part of the movement in real exchange rates is due to nominal exchange rate movements, which were much larger in the 1980s than in the 1960s.
3. * *{ ( / ) (1 )}/{ ( / ) (1 )}.n t n tq b P P b a P P a= + − + −
Study Guide Review Question Solutions 239
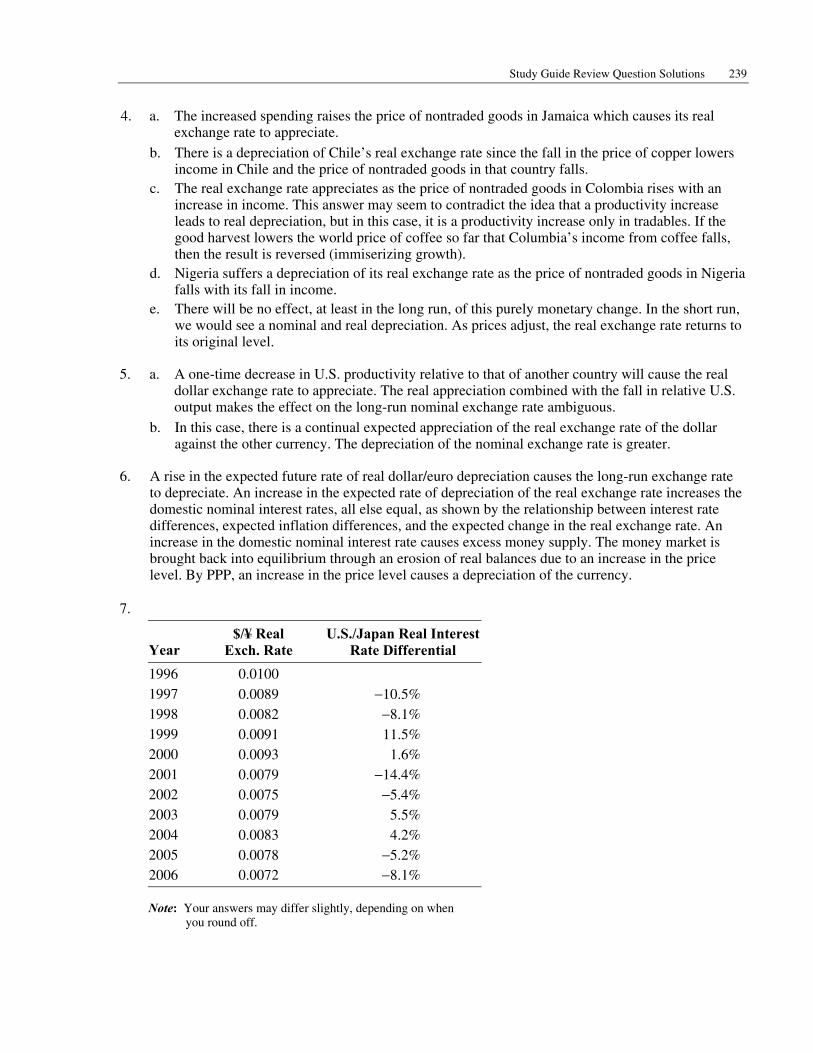
4. a. The increased spending raises the price of nontraded goods in Jamaica which causes its real exchange rate to appreciate.
b. There is a depreciation of Chile’s real exchange rate since the fall in the price of copper lowers income in Chile and the price of nontraded goods in that country falls.
c. The real exchange rate appreciates as the price of nontraded goods in Colombia rises with an increase in income. This answer may seem to contradict the idea that a productivity increase leads to real depreciation, but in this case, it is a productivity increase only in tradables. If the good harvest lowers the world price of coffee so far that Columbia’s income from coffee falls, then the result is reversed (immiserizing growth).
d. Nigeria suffers a depreciation of its real exchange rate as the price of nontraded goods in Nigeria falls with its fall in income.
e. There will be no effect, at least in the long run, of this purely monetary change. In the short run, we would see a nominal and real depreciation. As prices adjust, the real exchange rate returns to its original level.
5. a. A one-time decrease in U.S. productivity relative to that of another country will cause the real dollar exchange rate to appreciate. The real appreciation combined with the fall in relative U.S. output makes the effect on the long-run nominal exchange rate ambiguous.
b. In this case, there is a continual expected appreciation of the real exchange rate of the dollar against the other currency. The depreciation of the nominal exchange rate is greater.
6. A rise in the expected future rate of real dollar/euro depreciation causes the long-run exchange rate to depreciate. An increase in the expected rate of depreciation of the real exchange rate increases the domestic nominal interest rates, all else equal, as shown by the relationship between interest rate differences, expected inflation differences, and the expected change in the real exchange rate. An increase in the domestic nominal interest rate causes excess money supply. The money market is brought back into equilibrium through an erosion of real balances due to an increase in the price level. By PPP, an increase in the price level causes a depreciation of the currency.
7.
Year
$/¥ Real Exch. Rate
U.S./Japan Real InterestRate Differential
1996 0.0100 1997 0.0089 −10.5% 1998 0.0082 −8.1% 1999 0.0091 11.5% 2000 0.0093 1.6% 2001 0.0079 −14.4% 2002 0.0075 −5.4% 2003 0.0079 5.5% 2004 0.0083 4.2% 2005 0.0078 −5.2% 2006 0.0072 −8.1%
Note: Your answers may differ slightly, depending on when you round off.
240 Krugman/Obstfeld • International Economics: Theory and Policy, Eighth Edition
Answers to Chapter 16 Review Questions
1. a. A temporary increase in output in a foreign economy shifts the DD schedule down and to the right, raising domestic output and appreciating the domestic currency before consideration of AA effects.
b. A temporary rise in the foreign interest rate shifts the AA schedule out and to the right, depreciating the domestic currency and raising domestic output.
c. Fiscal expansion raises output and the interest rate. A monetary expansion raises output and lowers the interest rate.
d. A foreign fiscal expansion shifts both the DD and the AA schedules out which causes domestic output to rise and has an ambiguous effect on the exchange rate. A foreign monetary expansion also shifts the DD curve out, but the AA curve shifts back which causes the exchange rate to appreciate, but has an ambiguous effect on output.
2. a. This causes the expected exchange rate to appreciate which shifts the AA curve in and appreciates the exchange rate today while decreasing output today.
b. The expected exchange rate depreciates, shifting out the AA curve, causing output to rise today and the exchange rate to depreciate today.
c. Since there is an ambiguous effect on the expected exchange rate, there is an ambiguous effect on the AA curve and we cannot say what the effect will be today on the exchange rate or output.
3. This is incorrect. If there is a monetary contraction coupled with a tax cut, the current account will be more in deficit than if there were no change in monetary policy, or if monetary policy were expansionary. In terms of the diagram: a. The DD curve shifts out. b. This increases income, appreciates the exchange rate, and worsened the current account (as the
comment says). c. If there is a monetary contraction, the AA curve shifts in. d. This does moderate the rise in income, but the current account deficit is even larger than with no
change to the AA curve. Current account balance can be restored with a monetary expansion, but this would put even more inflationary pressure on the economy.
4. a. The AA curve now shifts with a change in the tax on foreign assets. An increase in T shifts the AA curve down and to the left.
b. A temporary increase in T causes the exchange rate to appreciate and output to fall.
5. a. In this case, the AA schedule is vertical and the DD schedule retains its former positive slope.
b. A temporary increase in the money supply has a larger effect on the exchange rate and on output when we assume that the exchange rate always equals its long-run level.
c. A temporary increase in government spending has no effect on output, and a larger effect on the exchange rate when we assume that the future exchange rate always equals its long-run level.
6. A depreciation of the exchange rate may be caused by a fiscal contraction or by a monetary expansion. If prices of imports are affected by the exchange rate, we expect to find an increase in import prices with a depreciation of the currency. If import prices are also affected by demand conditions, the rise in import prices will be larger with a monetary expansion than with a fiscal contraction, for a given depreciation, since the former is associated with an increase in demand while the latter is associated with a decline in demand.

Study Guide Review Question Solutions 241
Answers to Chapter 17 Review Questions
1. a. Balance of Payments = Current Account Surplus + Financial Account Surplus
H$0 million = H$1 million + (–H$1 million)
b. Balance Sheet of the Central Bank
On December 31, 2000 On December 31, 2001 Assets Liabilities Assets Liabilities
Domestic Domestic H$100 mil. H$120 mil. H$100 mil. H$120 mil.Foreign Foreign H$20 mil. H$20 mil.
c. Balance of Payments = Current Account Surplus + Financial Account Surplus
H$1 million = H$1 million + H$0
d. Balance Sheet of the Central Bank
On December 31, 2000 On December 31, 2001 Assets Liabilities Assets Liabilities
Domestic Domestic H$100 mil. H$120 mil. H$100 mil. H$121 mil.Foreign Foreign H$20 mil. H$21 mil.
2. a. The DD curve shifts out, causing the exchange rate to appreciate. Fiscal authorities, to maintain the exchange rate, would need to raise taxes or cut government spending to keep the exchange rate at E0.
b. The AA curve shifts out with a fall in money demand. Fiscalian authorities would need to increase government spending or cut taxes to shift out the DD curve and keep the exchange rate at E0.
c. Fiscal policy cannot alter output in Fiscalia since any attempt to use it results in its reversal to maintain the fixed exchange rate. Monetary policy, however, elicits a fiscal response that magnifies its effect on output. The reason behind this is which authority is responsible for maintaining the fixed exchange rate.
3. a. For example, we may find the following (only the direction of change, not the actual amounts, can be inferred from the question).
Balance Sheet of the Federal Reserve
Before Intervention After Intervention Assets Liabilities Assets Liabilities
Domestic Domestic $500 bil. $600 bil. $400 bil. $600 bil.Foreign Foreign $100 bil. $200 bil.
242 Krugman/Obstfeld • International Economics: Theory and Policy, Eighth Edition
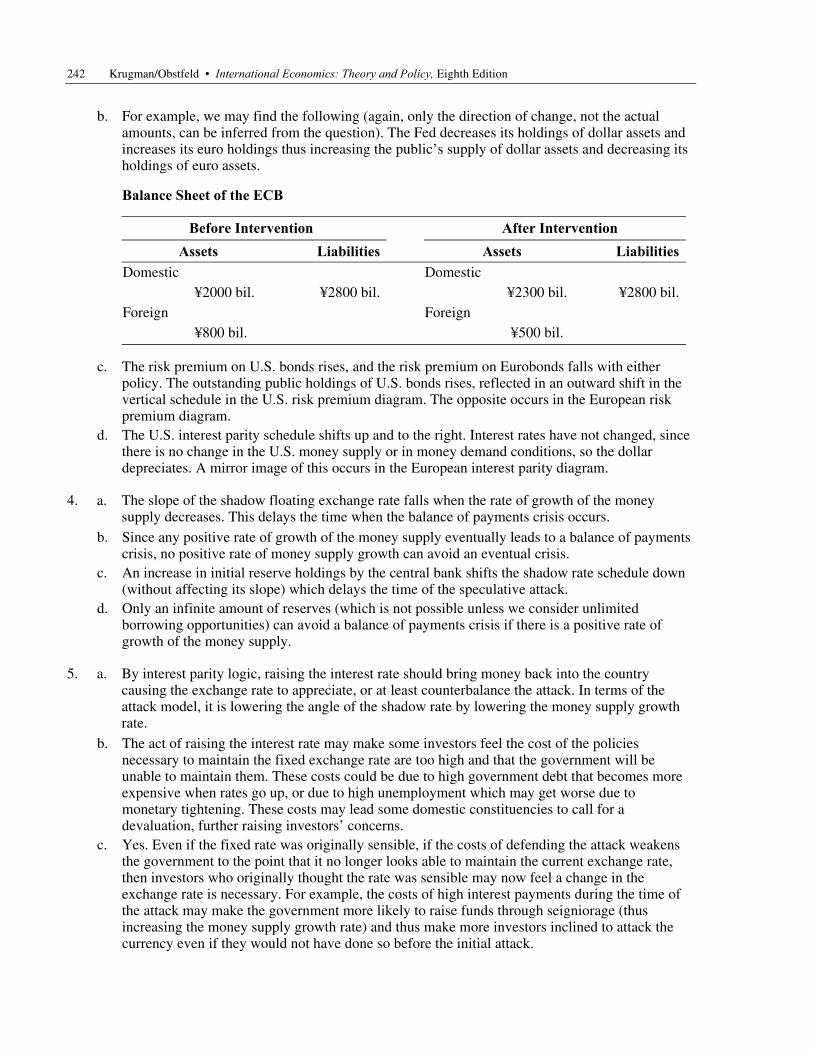
b. For example, we may find the following (again, only the direction of change, not the actual amounts, can be inferred from the question). The Fed decreases its holdings of dollar assets and increases its euro holdings thus increasing the public’s supply of dollar assets and decreasing its holdings of euro assets.
Balance Sheet of the ECB
Before Intervention After Intervention Assets Liabilities Assets Liabilities
Domestic Domestic ¥2000 bil. ¥2800 bil. ¥2300 bil. ¥2800 bil.Foreign Foreign ¥800 bil. ¥500 bil.
c. The risk premium on U.S. bonds rises, and the risk premium on Eurobonds falls with either policy. The outstanding public holdings of U.S. bonds rises, reflected in an outward shift in the vertical schedule in the U.S. risk premium diagram. The opposite occurs in the European risk premium diagram.
d. The U.S. interest parity schedule shifts up and to the right. Interest rates have not changed, since there is no change in the U.S. money supply or in money demand conditions, so the dollar depreciates. A mirror image of this occurs in the European interest parity diagram.
4. a. The slope of the shadow floating exchange rate falls when the rate of growth of the money supply decreases. This delays the time when the balance of payments crisis occurs.
b. Since any positive rate of growth of the money supply eventually leads to a balance of payments crisis, no positive rate of money supply growth can avoid an eventual crisis.
c. An increase in initial reserve holdings by the central bank shifts the shadow rate schedule down (without affecting its slope) which delays the time of the speculative attack.
d. Only an infinite amount of reserves (which is not possible unless we consider unlimited borrowing opportunities) can avoid a balance of payments crisis if there is a positive rate of growth of the money supply.
5. a. By interest parity logic, raising the interest rate should bring money back into the country causing the exchange rate to appreciate, or at least counterbalance the attack. In terms of the attack model, it is lowering the angle of the shadow rate by lowering the money supply growth rate.
b. The act of raising the interest rate may make some investors feel the cost of the policies necessary to maintain the fixed exchange rate are too high and that the government will be unable to maintain them. These costs could be due to high government debt that becomes more expensive when rates go up, or due to high unemployment which may get worse due to monetary tightening. These costs may lead some domestic constituencies to call for a devaluation, further raising investors’ concerns.
c. Yes. Even if the fixed rate was originally sensible, if the costs of defending the attack weakens the government to the point that it no longer looks able to maintain the current exchange rate, then investors who originally thought the rate was sensible may now feel a change in the exchange rate is necessary. For example, the costs of high interest payments during the time of the attack may make the government more likely to raise funds through seigniorage (thus increasing the money supply growth rate) and thus make more investors inclined to attack the currency even if they would not have done so before the initial attack.
Study Guide Review Question Solutions 243
6. a. An expansion of the money supply in Britain (not matched by a similar expansion in Germany) would lower interest rates in the United Kingdom and depreciate its currency relative to the DM. The implication of this is that, under a (mostly) fixed rate with the DM, Britain would have less latitude for conducting monetary policy.
b. A contraction of the German money supply shifts the interest parity curve out. British monetary authorities would be forced to contract their money supply in response to maintain the fixed £/DM exchange rate.
c. Joining the EMS would involve following Germany’s monetary policy because it was the reserve currency of the system (loosely speaking). With the common currency, monetary policy decisions are no longer made by Germany alone, but by a supranational organization, the European Central Bank. Either one involves Britain losing its domestic autonomy, but under the euro, this no longer means German monetary domination.
7. a. An increase in output raises money demand which increases the foreign assets held by the central bank. The domestic money supply rises.
b. An increase in the rate of growth of domestic-currency assets held by the central bank will just be offset by a decline in the central bank’s foreign-currency assets since there is no change in money demand. There is no net effect on the money supply. Of course, as Question 4 showed, this process will eventually lead to a crisis.
c. When there is a fall in money demand, balance of payments equilibrium is maintained by decreasing money supply. Alternatively, a fall in investment, which causes output and thus money demand to fall, would also require a decrease in the money supply. In the first case, there will be much less of a change in output than in the second case, where we would expect that the fall in investment demand coupled with a monetary contraction would cause a big decline in output.
Answers to Chapter 18 Review Questions
1. a. The discovery of gold in Alaska represents an increase in the U.S. money supply. This raises U.S. prices, appreciating its real exchange rate and leading to a current account deficit. The current account deficit causes a balance of payments deficit that decreases the U.S. money supply.
b. There will be no long-run effect of the discovery of gold on real balances in the United States.
2. a. A country with a current account deficit that follows the rules of the game will see its money supply shrink.
b. The decline in the money supply can be avoided if a country has an open market purchase of domestic assets. This, however, represents a violation of the “rules of the game.”
c. These findings imply that Germany and France were following the rules of the game while Great Britain was not.
d. The gold standard may have represented an asymmetric system, with Great Britain at its center. This framework would give Great Britain control over its monetary policy while other countries would not have similar control over their respective monetary policies. Alternatively, it may have been easier to violate the rules of the game when running a current account surplus. During the years in question, Great Britain tended to be running current account surpluses.
244 Krugman/Obstfeld • International Economics: Theory and Policy, Eighth Edition
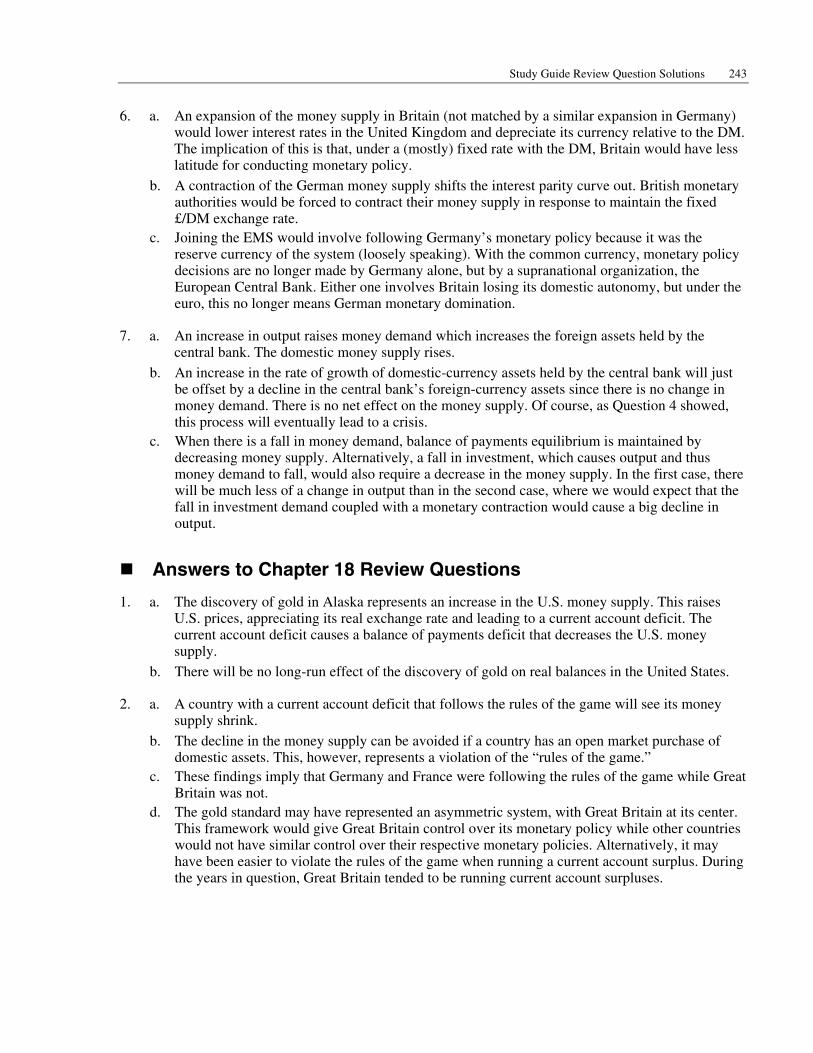
3. a. The XX curve shifts up and to the left to X′X′. If the exchange rate and fiscal policies do not change, Midas stays at point a where there is internal balance, but there will be an external imbalance: specifically a balance of payments deficit.
b. A devaluation (to point a ′) can restore external balance, but Midas cannot have both internal and external balance with just this one policy. At a ′, there is internal imbalance in the form of overemployment and inflation.
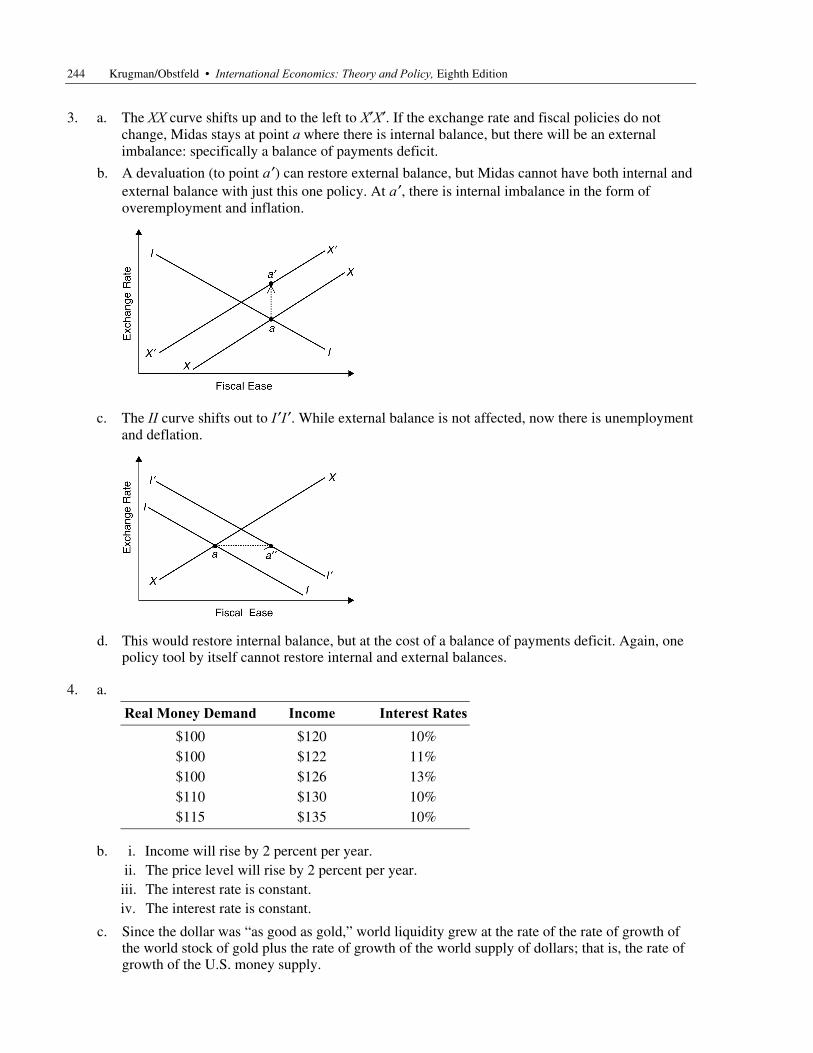
c. The II curve shifts out to I ′I ′. While external balance is not affected, now there is unemployment and deflation.
d. This would restore internal balance, but at the cost of a balance of payments deficit. Again, one policy tool by itself cannot restore internal and external balances.
4. a.
Real Money Demand Income Interest Rates$100 $120 10% $100 $122 11% $100 $126 13% $110 $130 10% $115 $135 10%
b. i. Income will rise by 2 percent per year. ii. The price level will rise by 2 percent per year. iii. The interest rate is constant. iv. The interest rate is constant.
c. Since the dollar was “as good as gold,” world liquidity grew at the rate of the rate of growth of the world stock of gold plus the rate of growth of the world supply of dollars; that is, the rate of growth of the U.S. money supply.
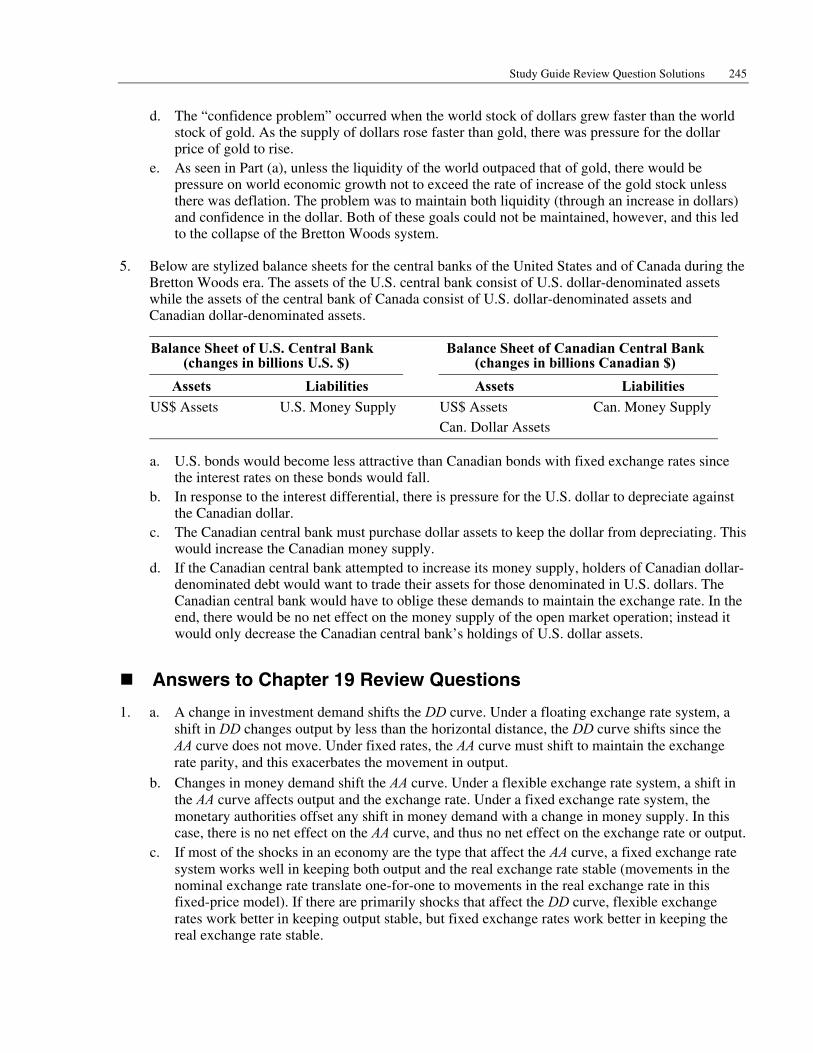
Study Guide Review Question Solutions 245
d. The “confidence problem” occurred when the world stock of dollars grew faster than the world stock of gold. As the supply of dollars rose faster than gold, there was pressure for the dollar price of gold to rise.
e. As seen in Part (a), unless the liquidity of the world outpaced that of gold, there would be pressure on world economic growth not to exceed the rate of increase of the gold stock unless there was deflation. The problem was to maintain both liquidity (through an increase in dollars) and confidence in the dollar. Both of these goals could not be maintained, however, and this led to the collapse of the Bretton Woods system.
5. Below are stylized balance sheets for the central banks of the United States and of Canada during the Bretton Woods era. The assets of the U.S. central bank consist of U.S. dollar-denominated assets while the assets of the central bank of Canada consist of U.S. dollar-denominated assets and Canadian dollar-denominated assets.
Balance Sheet of U.S. Central Bank (changes in billions U.S. $)
Balance Sheet of Canadian Central Bank (changes in billions Canadian $)
Assets Liabilities Assets Liabilities US$ Assets U.S. Money Supply US$ Assets Can. Money Supply Can. Dollar Assets
a. U.S. bonds would become less attractive than Canadian bonds with fixed exchange rates since the interest rates on these bonds would fall.
b. In response to the interest differential, there is pressure for the U.S. dollar to depreciate against the Canadian dollar.
c. The Canadian central bank must purchase dollar assets to keep the dollar from depreciating. This would increase the Canadian money supply.
d. If the Canadian central bank attempted to increase its money supply, holders of Canadian dollar-denominated debt would want to trade their assets for those denominated in U.S. dollars. The Canadian central bank would have to oblige these demands to maintain the exchange rate. In the end, there would be no net effect on the money supply of the open market operation; instead it would only decrease the Canadian central bank’s holdings of U.S. dollar assets.
Answers to Chapter 19 Review Questions
1. a. A change in investment demand shifts the DD curve. Under a floating exchange rate system, a shift in DD changes output by less than the horizontal distance, the DD curve shifts since the AA curve does not move. Under fixed rates, the AA curve must shift to maintain the exchange rate parity, and this exacerbates the movement in output.
b. Changes in money demand shift the AA curve. Under a flexible exchange rate system, a shift in the AA curve affects output and the exchange rate. Under a fixed exchange rate system, the monetary authorities offset any shift in money demand with a change in money supply. In this case, there is no net effect on the AA curve, and thus no net effect on the exchange rate or output.
c. If most of the shocks in an economy are the type that affect the AA curve, a fixed exchange rate system works well in keeping both output and the real exchange rate stable (movements in the nominal exchange rate translate one-for-one to movements in the real exchange rate in this fixed-price model). If there are primarily shocks that affect the DD curve, flexible exchange rates work better in keeping output stable, but fixed exchange rates work better in keeping the real exchange rate stable.

246 Krugman/Obstfeld • International Economics: Theory and Policy, Eighth Edition
2. a. A monetary expansion in Home depreciates the home currency and this leads to more exports and fewer imports by Home, strengthening the Home current account and stimulating output in Home. But, this also means that there are fewer exports and more imports in Foreign and, consequently, output will fall there.
b. Equal-sized monetary expansions offset each other since interest rates in each economy fall by the same amount. Therefore, there is no effect on the exchange rate (think why this is true, using the interest parity relationship) and no effect on the current account. The reduction in interest rates in each economy, however, will raise investment and interest-sensitive consumption spending in each economy and, therefore, raise output in each economy.
c. A fiscal expansion in the Home country stimulates demand in the Home country and raises Home output. The increase in Home output raises money demand in Home, causing the Home interest rate to rise and the Home currency to appreciate. Output in Foreign therefore rises due to the increased demand in Foreign exports to Home, both because of the higher level of demand in Home and because of the relative price effect that arises through the appreciation of the Home currency (which is the same as saying the depreciation of the Foreign currency).
d. A fiscal expansion raises aggregate demand in both countries. Both countries, therefore, also face an increase in money demand and a rise in the interest rate. Since interest rates rise in both countries, there is no change in the exchange rate between the two countries and, broadly speaking, no change in the current account of each country. If only one country had a fiscal expansion, then it would face “crowding out” through the current account; in this case, however, this type of crowding out does not occur and, therefore, we conclude that a fiscal expansion in one country has a larger effect on output when it is matched by a simultaneous fiscal expansion in the other country.
3. a. The communiqué affected the expected value of the dollar. The expected future value of the dollar after the Plaza meeting was more depreciated than before the meeting. On the day following the communiqué, the dollar depreciated, even before there was any money market effect of the planned coordination. In terms of the diagram, neither the money demand nor money supply curves are shifted between Friday, September 20, 1985 and Monday, September 23. The interest parity curve shifts up, however, with the increase in the expected future exchange rate. This shift in the interest parity curve causes the dollar to depreciate, even though interest rates have not changed.
b. The “hands-off” approach by the United States to exchange rate management before the Plaza meeting meant that there was no intervention to slow the appreciation of the dollar in the first half of the 1980s. When monetary authorities’ concern with the current account manifested itself in a willingness to intervene, news of a larger-than-expected current account deficit caused participants in the foreign exchange market to rationally believe that there would be a loosening of U.S. monetary policy and a depreciation of the dollar in the future. As shown in Part (a), this shift in expectations causes an immediate depreciation of the dollar.
4. a. At a one-to-one conversion rate, the West German Bundesbank will trade each Ost-mark for one Deutschemark. If conversion had taken place at a less favorable rate, say five-to-one, then the Bundesbank would have created fewer Deutschemarks when monetary union occurred. The actual increase in the German money supply under the enacted play was about DM120 billion, which represented about a 10 percent increase over the West German money supply before unification. This increase represents a one-time rise in the money supply that would not contribute, by itself, to ongoing inflation. Although, if money demand rose by less than 10 percent, prices would rise slowly to their new equilibrium level causing some short-term inflation. In fact, had money demand risen by more than 10 percent with the incorporation of the East German population into a greater Germany, prices could have fallen as a result of unification.
Study Guide Review Question Solutions 247
b. East German labor becomes more expensive as the conversion rate becomes more favorable to the Ost-mark. By choosing a one-to-one conversion rate rather than a five-to-one conversion rate, it is likely that more East German firms will go bankrupt and that unemployment will be higher, at least initially, in East Germany. No matter what the initial starting point (which is determined by the conversion rate), however, East German wages will eventually have to change to reflect market conditions and productivity.
c. Wage differentials encourage labor movement from low-wage areas to high-wage areas. The relatively high wages in West Germany encourage East German workers to migrate there. This would have the effect of making wages throughout Germany more comparable, to the benefit of East Germans and, perhaps, to the detriment of West Germans. For more information on labor mobility you may want to reread the material in Chapter 7.
5. Capital controls break interest parity. There is no more free asset trade meaning speculation cannot take place. Even tight capital controls, though, can often be avoided with various financial tricks. Controls tight enough to avoid all speculation are often so tight that they make trade and cross-border investment difficult. A single currency means that the expected value of the exchange rate is constant and the domestic and foreign interest rate must be the same as they are guided by a single monetary policy.
Answers to Chapter 20 Review Questions
1. a. Inflation rates in each country decline over the 1980s, moving towards the inflation rate in Germany.
b. In a quasi-fixed exchange rate system like the EMS, monetary policy cannot be set independently in each country. Instead, members of the EMS must either follow one central country’s policy or some fixed rule, as in the gold standard. The evidence in the graph suggests that Germany did not change its monetary policy as much as other EMS countries (as reflected in its relatively stable inflation rate over the period). This provides evidence that the EMS is an asymmetric system, with Germany at its center (other studies focusing on different types of data reach the same conclusion).
c. These data show a declining inflation rate in the United States and the United Kingdom during the 1980s.
d. An alternative to the hypothesis that inflation convergence in a number of European countries was due to their membership in the EMS is the hypothesis that declining inflation rates in industrial countries was a worldwide phenomenon in the 1980s. The data for the United States and the United Kingdom suggest, at a minimum, that some countries that were not members of the EMS had similar inflation experiences to member countries in the 1980s. Empirical work by Professor Susan Collins of Harvard University fails to find a significant difference in inflation experience between members of the EMS and other industrial countries in the 1980s, thus suggesting that membership in the EMS was not a significant factor in declining European inflation rates. Other studies have found a weak link between EMS membership and inflation reduction, but the benefits (if present at all) were not as dramatic as originally claimed by pro-EMS policy makers.

248 Krugman/Obstfeld • International Economics: Theory and Policy, Eighth Edition
2. a. Nominal Exchange Rates:
1979 1985 DM/lira 0.0022 0.0016DM/franc 0.43 0.33 franc/lira 0.0051 0.0048
b. Bilateral Real Exchange Rates:
1979 Actual 1985 If No Realignment DM/lira 100 132 182 DM/franc 100 107 140 franc/lira 100 122 130
c. Inflation differentials and fixed exchange rates led to currency misalignments. Had there been no realignments, the lira would have appreciated by 82 percent against the DM and by 30 percent against the franc while the franc would have appreciated by 40 percent against the DM. The realignments partially offset the appreciations due to inflation differentials, as shown in the above chart: for example, the actual real appreciation of the franc against the DM was only 7 percent.
3. a. (0.25 × 2.6) + (0.75 × 2.8) = 2.75.
b. Expected depreciation of the DM/pound exchange rate was (2.75 – 2.8)/2.8 = –0. 0179. Thus, pound-denominated securities had to pay 1.79 percent higher rates than comparable DM-denominated securities.
c. (0.5 × 2.6) + (0.5 × 2.8) = 2.7
d. –0.02 = {[(0.5 × 2.6) + (0.5 × E)] – E}/E
E = 2.71 DM/pound
4. a. This makes the establishment of the Quebec franc more desirable. The differences in language and customs would tend to reduce the economic integration (especially as regards labor mobility) between Quebec and the rest of Canada. This reduces the desirability of a fixed exchange rate area. In terms of the GG-LL diagram, the actual level of integration would be smaller (closer to the origin) than if the cultures and languages were more similar. Therefore it is more likely that, all else equal, the intersection of the GG and LL schedules is at a level of integration higher than the actual level of integration.
b. This makes the establishment of the Quebec franc less desirable. There is a high level of integration between Quebec and Ontario. This makes it more likely, all else equal, that the intersection of the GG and LL schedules is to the left of the actual level of integration. If this were the case, a single currency would be desirable.
c. This makes the establishment of the Quebec franc more desirable. Sector-specific shocks will have different effects in Quebec as compared to the rest of Canada. This reduces the desirability of a common currency. Shocks that shift the DD curve for Quebec are likely to have different effects on the DD curve for the rest of Canada.
d. This makes the establishment of the Quebec franc more desirable. The small amount of fiscal federalism means that region-specific shocks, which can be exacerbated by a single Canadian currency, are less likely to be mitigated by transfers from the central government. This question was posed using the benchmark case of the United States; your answer might have differed had the question been stated by making the comparison between relatively high transfers within Canada and relatively low international transfers within Europe.
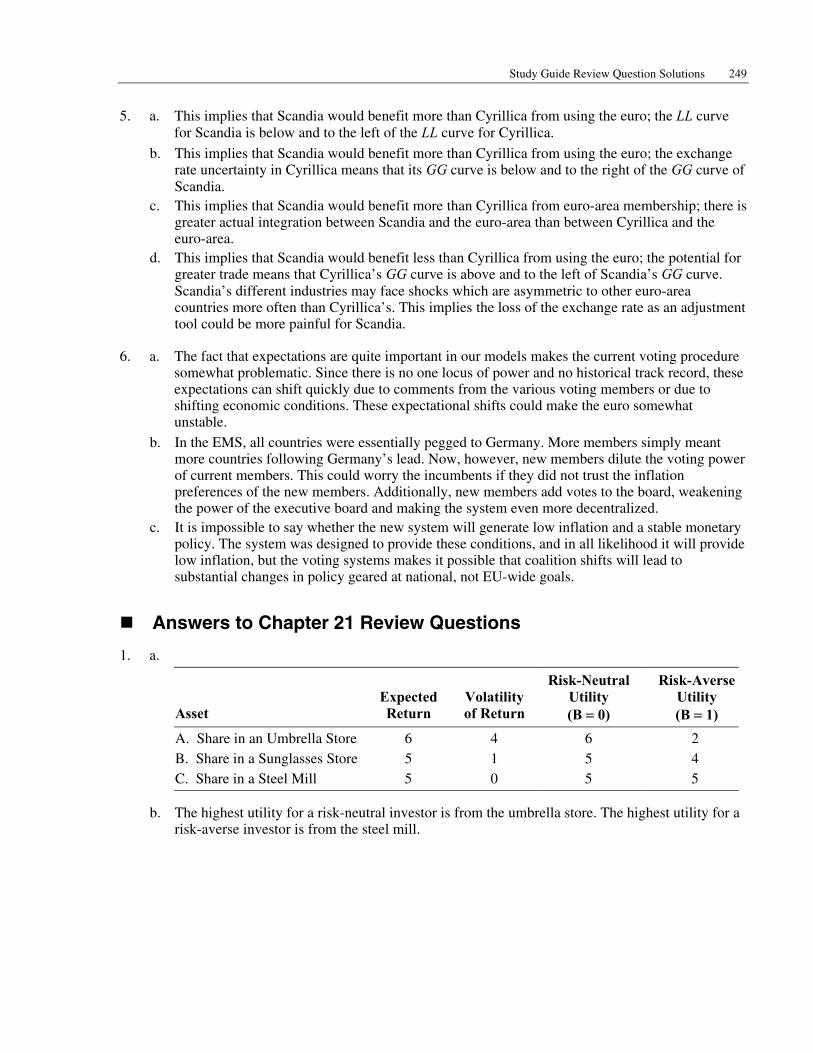
Study Guide Review Question Solutions 249
5. a. This implies that Scandia would benefit more than Cyrillica from using the euro; the LL curve for Scandia is below and to the left of the LL curve for Cyrillica.
b. This implies that Scandia would benefit more than Cyrillica from using the euro; the exchange rate uncertainty in Cyrillica means that its GG curve is below and to the right of the GG curve of Scandia.
c. This implies that Scandia would benefit more than Cyrillica from euro-area membership; there is greater actual integration between Scandia and the euro-area than between Cyrillica and the euro-area.
d. This implies that Scandia would benefit less than Cyrillica from using the euro; the potential for greater trade means that Cyrillica’s GG curve is above and to the left of Scandia’s GG curve. Scandia’s different industries may face shocks which are asymmetric to other euro-area countries more often than Cyrillica’s. This implies the loss of the exchange rate as an adjustment tool could be more painful for Scandia.
6. a. The fact that expectations are quite important in our models makes the current voting procedure somewhat problematic. Since there is no one locus of power and no historical track record, these expectations can shift quickly due to comments from the various voting members or due to shifting economic conditions. These expectational shifts could make the euro somewhat unstable.
b. In the EMS, all countries were essentially pegged to Germany. More members simply meant more countries following Germany’s lead. Now, however, new members dilute the voting power of current members. This could worry the incumbents if they did not trust the inflation preferences of the new members. Additionally, new members add votes to the board, weakening the power of the executive board and making the system even more decentralized.
c. It is impossible to say whether the new system will generate low inflation and a stable monetary policy. The system was designed to provide these conditions, and in all likelihood it will provide low inflation, but the voting systems makes it possible that coalition shifts will lead to substantial changes in policy geared at national, not EU-wide goals.
Answers to Chapter 21 Review Questions
1. a.
Asset
Expected Return
Volatility of Return
Risk-Neutral Utility (B = 0)
Risk-AverseUtility (B = 1)
A. Share in an Umbrella Store 6 4 6 2 B. Share in a Sunglasses Store 5 1 5 4 C. Share in a Steel Mill 5 0 5 5
b. The highest utility for a risk-neutral investor is from the umbrella store. The highest utility for a risk-averse investor is from the steel mill.
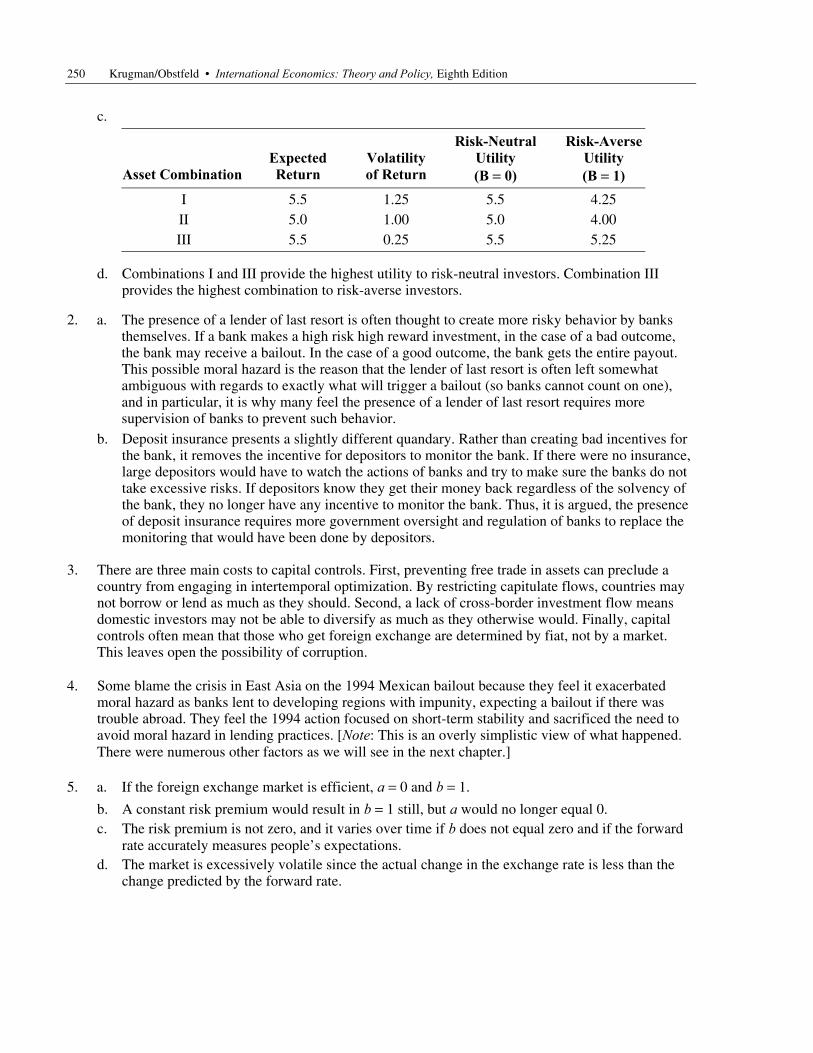
250 Krugman/Obstfeld • International Economics: Theory and Policy, Eighth Edition
c.
Asset Combination
Expected Return
Volatility of Return
Risk-Neutral Utility (B = 0)
Risk-Averse Utility (B = 1)
I 5.5 1.25 5.5 4.25 II 5.0 1.00 5.0 4.00 III 5.5 0.25 5.5 5.25
d. Combinations I and III provide the highest utility to risk-neutral investors. Combination III provides the highest combination to risk-averse investors.
2. a. The presence of a lender of last resort is often thought to create more risky behavior by banks themselves. If a bank makes a high risk high reward investment, in the case of a bad outcome, the bank may receive a bailout. In the case of a good outcome, the bank gets the entire payout. This possible moral hazard is the reason that the lender of last resort is often left somewhat ambiguous with regards to exactly what will trigger a bailout (so banks cannot count on one), and in particular, it is why many feel the presence of a lender of last resort requires more supervision of banks to prevent such behavior.
b. Deposit insurance presents a slightly different quandary. Rather than creating bad incentives for the bank, it removes the incentive for depositors to monitor the bank. If there were no insurance, large depositors would have to watch the actions of banks and try to make sure the banks do not take excessive risks. If depositors know they get their money back regardless of the solvency of the bank, they no longer have any incentive to monitor the bank. Thus, it is argued, the presence of deposit insurance requires more government oversight and regulation of banks to replace the monitoring that would have been done by depositors.
3. There are three main costs to capital controls. First, preventing free trade in assets can preclude a country from engaging in intertemporal optimization. By restricting capitulate flows, countries may not borrow or lend as much as they should. Second, a lack of cross-border investment flow means domestic investors may not be able to diversify as much as they otherwise would. Finally, capital controls often mean that those who get foreign exchange are determined by fiat, not by a market. This leaves open the possibility of corruption.
4. Some blame the crisis in East Asia on the 1994 Mexican bailout because they feel it exacerbated moral hazard as banks lent to developing regions with impunity, expecting a bailout if there was trouble abroad. They feel the 1994 action focused on short-term stability and sacrificed the need to avoid moral hazard in lending practices. [Note: This is an overly simplistic view of what happened. There were numerous other factors as we will see in the next chapter.]
5. a. If the foreign exchange market is efficient, a = 0 and b = 1.
b. A constant risk premium would result in b = 1 still, but a would no longer equal 0. c. The risk premium is not zero, and it varies over time if b does not equal zero and if the forward
rate accurately measures people’s expectations. d. The market is excessively volatile since the actual change in the exchange rate is less than the
change predicted by the forward rate.

Study Guide Review Question Solutions 251
Answers to Chapter 22 Review Questions
1. There is not a one-for-one increase in seigniorage revenues with inflation. Seigniorage is the product of real balances and the inflation rate. An increase in the inflation rate, which raises seigniorage revenues, also tends to lower money demand since, by the Fisher equation, nominal interest rates rise with an increase in expected inflation. Thus, a rise in inflation raises one component of the determinant of seigniorage while reducing the other component. This is clearly seen by comparing Nigeria with Peru where the inflation rate in the latter is more than ten times that in the former, but the seigniorage revenues, as a percent of GNP, are only five times as high in Peru. Also, seigniorage in Peru is higher than that in Argentina even though Argentina has an inflation rate half-again as high as that in Peru.
2. a. The black market rate is more depreciated than the official rate. Otherwise, there is no incentive for a black market since foreign exchange could be purchased more cheaply directly from the central bank.
b. A depreciation of the official rate to a level equal to the black market rate increases the price of imports and reduces the standard of living of residents (at least those who do not benefit from being able to export more due to an increase in competitiveness that comes with a depreciation). This usually hurts those living in cities, which is where governments are based, and hence there is often pressure not to do so.
c. Exporters receive less domestic currency for each unit of foreign currency they earn at the official exchange rate than at the black market rate. This serves as a tax on export earnings. The “tax rate” is the difference between the market exchange rate, that is, the black market rate, and the official exchange rate.
3. a. Many characteristics of developing countries prevent them from utilizing the same technology as industrialized countries. Often, the agricultural or medical developments in rich countries are not easily transferred to poor countries due to broad differences in climate. The wide difference in education levels means that often developing countries do not have a work force trained to use the new technologies developed in rich countries. Additionally, corruption and underdeveloped financial markets may prevent inventors or entrepreneurs from realizing all the gains from enterprises that use new technology, thus stunting its use. In general, cutting-edge technology is generally developed with the industrialized core countries in mind, and it does not always transfer well to developing countries.
b. Some of the HPAEs were able to avoid some of these problems because they had highly educated work forces (or they educated them), their climates were similar to the industrialized core, and they encouraged the use of new technology in the export sectors. The countries are different, so it is difficult to generalize, but these factors helped some HPAEs enjoy rapid increases in living standards that caught them up to some industrialized nations.
4. If inflation remains high while the crawling peg reduces the rate of depreciation of the exchange rate the real exchange rate appreciates. This makes foreign assets cheaper. These assets are especially attractive if people think there may be a large devaluation which would give holders of foreign assets large capital gains. Thus, capital flight increased in the face of a crawling peg policy which lacked long-term credibility.
5. Political cronyism may worsen moral hazard. If some businesses are supported no matter what they do, the owners of those businesses may take excessive risks since they receive the rewards, but do not face the risks. This risk taking and the government guarantees tied to the risks, could leave many companies and the government itself open to a financial crisis. This was quite likely one of the problems in Indonesia.
252 Krugman/Obstfeld • International Economics: Theory and Policy, Eighth Edition
6. If investors do not have good information, signals of a potential problem with future profits or of the stability of an exchange rate peg could cause all investors to rapidly adjust their expectations a large amount all at once. In our models, these shifts could cause a rational crisis since expectations of the future value of the exchange rate are so important. One of these signals regarding the safety of a country (Country A) could be if Country B, which is perceived to be similar to Country A, begins to have financial difficulties. Not knowing the true situation in Country A, investors may worry that it is likely to have the same types of problems Country B is encountering. Thus, since they do not know the true financial condition of the government or companies, investors may take the only information they have and all panic at once.
7. If poor geography hindered economic growth for centuries, but is no longer a barrier, we might still expect to see differences in income levels today as “good” geography countries may have had a large headstart in raising living standards. At the same time, we might expect that “bad” geography countries, now able to overcome the bad geography with technology, will grow faster as they converge towards “good” geography living standards. So, we would expect the “bad” geography countries to be poorer, but to grow faster today. Alternatively, if the “bad” geography and current low income levels have a deleterious impact on the creation of sound institutions, it is possible that despite the geography no longer being a direct barrier to growth, these countries are still hindered by indirect long lasting impacts. In that case, the bad geography countries would be both poorer and growing slower.