study documentation - home | scholar.uib.no · data collection ... - weight 1 based on demographic...
TRANSCRIPT

Norway
Elisabeth Ivarsflaten, Coordinator, Norwegian Citizen Panel
Norwegian Citizen Panel Wave 1
Study Documentation
January 17, 2014

Metadata ProductionMetadata Producer(s) Jostein Ryssevik , Ideas2evidence , Quality assurance
Øivind Skjervheim , Ideas2evidence , ResearcherAsle Høgestøl , Ideas2evidence , Coordinator
Production Date January 13, 2013
Identification NMP-13-1

Table of ContentsOverview............................................................................................................................................................. 4Scope & Coverage.............................................................................................................................................. 4Producers & Sponsors.........................................................................................................................................4Sampling..............................................................................................................................................................4Data Collection....................................................................................................................................................5Files Description................................................................................................................................................. 6
Norsk Medborgerpanel runde 1......................................................................................................6Variables List...................................................................................................................................................... 7
Norsk Medborgerpanel runde 1......................................................................................................7Variables Description........................................................................................................................................24
Norsk Medborgerpanel runde 1....................................................................................................25

Norwegian Citizen Panel Wave 1 - Overview
- 4 -
Norwegian Citizen Panel Wave 1
Overview
Identification NMP-13-1
Version 1.0
Unit of Analysis Individuals
Scope & Coverage
Countries Norway
Geographic CoverageNational geographic coverage. Counties as geographic coding.
UniverseNorwegian citizens above the age of 18.
Producers & Sponsors
PrimaryInvestigator(s)
Elisabeth Ivarsflaten, Coordinator, Norwegian Citizen Panel
Other Producer(s)
Sampling
Sampling ProcedureBased on international literature the panel recruitment process was expected to have a success rate of approximately 14percent. In order to reach our minimum target of 3 500 respondents we therefore had to draw a gross sample of 25 000individuals.
The sample was drawn from the Norwegian National Population Registry. This register includes everyone born in Norwayas well as former and current inhabitants. The Norwegian Tax Administration is responsible for the register, but theadministration is partly outsourced to the private IT-company Evry. Evry drew the sample on behalf of the Citizen Panel afterthe necessary permissions were acquired from the Norwegian Tax Administration.
25 000 individuals over the age of 18 were randomly drawn from the register. The extracted data was a) last name, b) firstname, c) address, d) gender, and e) age. The sample excluded people with no current home address in Norway.
Furthermore, all individuals over the age of 95 were excluded from the sample. This amounted to 58 persons, thus leaving anet sample of 24 942 individuals before the recruitment process started.
WeightingTo compensate for the observed bias, a set of weights has been calculated. The weights equal the relation between a givenstrata in the population and the total population, divided by the relation between a given strata in the net sample and the totalnet sample. This procedure returns values around 1, but above 0. Respondents who are underrepresented will receive a weightabove 1 and respondents who are overrepresented a weight below 1. The weights of the different stratums are listed in thedocumentation report (table 8 in the appendix).
When calculating the weights, the information regarding the respondent's geographical location, gender and age arebased on registry data. These attributes were included in the sample file we received from the Norwegian PopulationRegister. Information regarding the level of education is provided by the respondents when answering the questionnaire.

Norwegian Citizen Panel Wave 1 - Overview
- 5 -
Approximately 9 percent of the net sample did not answer this question. Because of this, two different weights have beencalculated:
- Weight 1 based on demographic variables (age, gender and geography)- Weight 2 combining the demographic variables with education. Respondents with missing data on the education variableare only weighted on demography (the education component of the weight is set to 1 in these cases).
When applied, both weights will provide a weighted N equal to the number of cases in the dataset.We will strongly recommend using weight 2 in any statistical analysis, as this weight provides the most accuratecompensation for the various sources of bias in the net sample. An illustration of this is provided in table 5 which shows theeffect of weight 2 on the distribution of self-reported level of education in the net sample:
Data Collection
Data Collection Mode Panel members were recruited per post in two steps.
First, letters were sent to everyone in the sample. The letters contained the following information;a) a description of the project, b) the Citizen Panel's policy on privacy and measures taken to protectthe anonymity of the participators, c) the time-frame of the project, d) the participants' rights to optout of the panel at any time in the future, e) contact information for the people responsible for theproject, f) a unique log-in id and the web address to the panel's web site and g) the estimated timerequired to complete the survey (20 minutes).
In order to maximize the response rate, an incentive in the form of a travel gift card was includedin the project. The value of the gift card was 25 000 NOK. To enter the lottery respondents wererequired to join the panel and provide their e-mail addresses. Respondents were asked to registeron the panel's web site and log into the survey using the unique id-code provided in their personalletter. Information on the lottery was included in all correspondence with respondents.
The letter was posted on the 6th of November 2013.
A reminder post card was sent on the 22nd of November 2013 to those respondents who a) had notlogged into the survey, or b) had neither completed the survey nor provided their e-mail address.Respondents were encouraged to join the panel, with reference to the letter sent two weeks prior.The unique log-in id provided in the original letter was also included in the post card.
A reminder e-mail was sent on the 25th of November to those respondents who had provided theire-mail addresses, but had not yet completed the survey.
Depositor(s)

Norwegian Citizen Panel Wave 1 - Files Description
- 6 -
Files DescriptionDataset contains 1 file(s)
Norsk Medborgerpanel runde 1
# Cases 4905
# Variable(s) 328
Norwegian Citizen Panel Wave 1 - Variables List
- 7 -
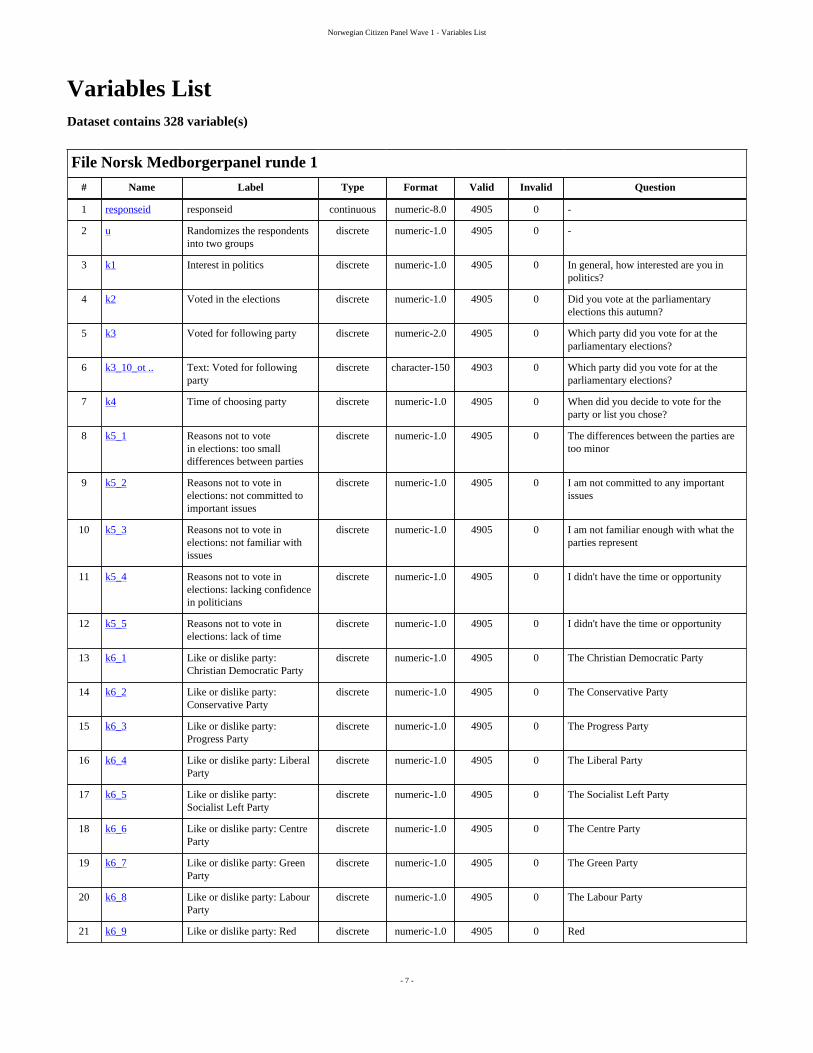
Variables ListDataset contains 328 variable(s)
File Norsk Medborgerpanel runde 1
# Name Label Type Format Valid Invalid Question
1 responseid responseid continuous numeric-8.0 4905 0 -
2 u Randomizes the respondentsinto two groups
discrete numeric-1.0 4905 0 -
3 k1 Interest in politics discrete numeric-1.0 4905 0 In general, how interested are you inpolitics?
4 k2 Voted in the elections discrete numeric-1.0 4905 0 Did you vote at the parliamentaryelections this autumn?
5 k3 Voted for following party discrete numeric-2.0 4905 0 Which party did you vote for at theparliamentary elections?
6 k3_10_ot .. Text: Voted for followingparty
discrete character-150 4903 0 Which party did you vote for at theparliamentary elections?
7 k4 Time of choosing party discrete numeric-1.0 4905 0 When did you decide to vote for theparty or list you chose?
8 k5_1 Reasons not to votein elections: too smalldifferences between parties
discrete numeric-1.0 4905 0 The differences between the parties aretoo minor
9 k5_2 Reasons not to vote inelections: not committed toimportant issues
discrete numeric-1.0 4905 0 I am not committed to any importantissues
10 k5_3 Reasons not to vote inelections: not familiar withissues
discrete numeric-1.0 4905 0 I am not familiar enough with what theparties represent
11 k5_4 Reasons not to vote inelections: lacking confidencein politicians
discrete numeric-1.0 4905 0 I didn't have the time or opportunity
12 k5_5 Reasons not to vote inelections: lack of time
discrete numeric-1.0 4905 0 I didn't have the time or opportunity
13 k6_1 Like or dislike party:Christian Democratic Party
discrete numeric-1.0 4905 0 The Christian Democratic Party
14 k6_2 Like or dislike party:Conservative Party
discrete numeric-1.0 4905 0 The Conservative Party
15 k6_3 Like or dislike party:Progress Party
discrete numeric-1.0 4905 0 The Progress Party
16 k6_4 Like or dislike party: LiberalParty
discrete numeric-1.0 4905 0 The Liberal Party
17 k6_5 Like or dislike party:Socialist Left Party
discrete numeric-1.0 4905 0 The Socialist Left Party
18 k6_6 Like or dislike party: CentreParty
discrete numeric-1.0 4905 0 The Centre Party
19 k6_7 Like or dislike party: GreenParty
discrete numeric-1.0 4905 0 The Green Party
20 k6_8 Like or dislike party: LabourParty
discrete numeric-1.0 4905 0 The Labour Party
21 k6_9 Like or dislike party: Red discrete numeric-1.0 4905 0 Red

Norwegian Citizen Panel Wave 1 - Variables List
- 8 -
File Norsk Medborgerpanel runde 1
# Name Label Type Format Valid Invalid Question
22 k7 Satisfied with newGovernment
discrete numeric-1.0 4905 0 How satisfied are you with the newGovernment of Norway?
23 dt19 Anticipated red-green victory discrete numeric-1.0 4905 0 If you consider the period priorto the parliamentary elections inSeptember, did you expect the red-green government to continue after theelection?
24 dt20 Government colationconsided most likely
discrete numeric-1.0 4905 0 In your opinion, which government didyou consider to be most likely?
25 dt20_8_o .. Text: Government colationconsided most likely
discrete character-150 4905 0 In your opinion, which government didyou consider to be most likely?
26 dt21 Would vote differently ifpremonition of outcome
discrete numeric-1.0 4905 0 Now that you know that a ConservativeParty and Progress Party governmentwas the outcome of the election, wouldyou have changed your vote if you hadknown this in advance?
27 dt22 Would vote for followingparty if knowledge ofoutcome
discrete numeric-1.0 4905 0 Which party would have voted for if thisis the case?
28 dt22_9_o .. Text: Would vote forfollowing party if knowledgeof outcome
discrete character-150 4905 0 Which party would have voted for if thisis the case?
29 k8_1 Placement on the politicalspectrum
discrete numeric-2.0 4905 0 Where would you place yourself on sucha scale?
30 k9_1 1. Text: Political issuewith personal importance[anonymised]
discrete character-150 0 0 What are the most important politicalissues or areas for you personally?[anonymised: Data withheld for the sakeof anonymity]
31 k9_2 2. Text: Political issuewith personal importance[anonymised]
discrete character-150 0 0 What are the most important politicalissues or areas for you personally?[anonymised: Data withheld for the sakeof anonymity]
32 k9_3 3. Text: Political issuewith personal importance[anonymised]
discrete character-150 0 0 What are the most important politicalissues or areas for you personally?[anonymised: Data withheld for the sakeof anonymity]
33 dt16_1 Place party on politicalspectrum: ChristianDemocractic Party
discrete numeric-2.0 4905 0 The Christian Democratic Party
34 dt16_2 Place party on politicalspectrum: Conservative Party
discrete numeric-2.0 4905 0 The Conservative Party
35 dt16_3 Place party on politicalspectrum: Progress Party
discrete numeric-2.0 4905 0 The Progress Party
36 dt16_4 Place party on politicalspectrum: Liberal Party
discrete numeric-2.0 4905 0 The Liberal Party
37 dt16_5 Place party on politicalspectrum: Socialist Left Party
discrete numeric-2.0 4905 0 The Socialist Left Party
38 dt16_6 Place party on politicalspectrum: Centre Party
discrete numeric-2.0 4905 0 The Centre Party
39 dt16_7 Place party on politicalspectrum: Green Party
discrete numeric-2.0 4905 0 The Green Party
40 dt16_8 Place party on politicalspectrum: Labour Party
discrete numeric-2.0 4905 0 The Labour Party

Norwegian Citizen Panel Wave 1 - Variables List
- 9 -
File Norsk Medborgerpanel runde 1
# Name Label Type Format Valid Invalid Question
41 dt16_9 Place party on politicalspectrum: Red
discrete numeric-2.0 4905 0 Red
42 k10 Perception of currenteconomic situation
discrete numeric-1.0 4905 0 How do you perceive the currenteconomic situation in Norway? Do youbelieve it is:
43 k11 Satisfaction with theNorwegian democracy
discrete numeric-1.0 4905 0 All things considered, how satisfied areyou with the way democracy works inNorway?
44 k12_1 Trust in institution or player:Government
discrete numeric-1.0 4905 0 The Government
45 k12_2 Trust in institution or player:Parliament
discrete numeric-1.0 4905 0 Parliament
46 k12_3 Trust in institution or player:Politicians
discrete numeric-1.0 4905 0 Politicians
47 k12_4 Trust in institution or player:Parties
discrete numeric-1.0 4905 0 Parties
48 k12_5 Trust in institution or player:The Sameting
discrete numeric-1.0 4905 0 The Sameting
49 k12_6 Trust in institution or player:The County Council
discrete numeric-1.0 4905 0 The County Council
50 k12_7 Trust in institution or player:The Municipal Council
discrete numeric-1.0 4905 0 The municipal council
51 k12_8 Trust in institution or player:EU
discrete numeric-1.0 4905 0 The EU
52 k12_9 Trust in institution or player:UN
discrete numeric-1.0 4905 0 The UN
53 dt5_1 Trust in institution or player:Courts
discrete numeric-1.0 4905 0 The Courts/Judiciary
54 dt5_2 Trust in institution or player:Police
discrete numeric-1.0 4905 0 The Police
55 dt5_3 Trust in institution or player:Media
discrete numeric-1.0 4905 0 Media
56 dt5_4 Trust in institution or player:Scientists
discrete numeric-1.0 4905 0 Scientists
57 dt5_5 Trust in institution or player:NAV
discrete numeric-1.0 4905 0 NAV
58 dt5_6 Trust in institution or player:The banking sector
discrete numeric-1.0 4905 0 The banking sector
59 dt5_7 Trust in institution or player:The health services
discrete numeric-1.0 4905 0 The health services
60 k31_1 Statement: The state shouldreduce income inequality
discrete numeric-1.0 4905 0 The state should contribute to reducinginequalities in income in society
61 k31_2 Statement: Better withdiversity of religions
discrete numeric-1.0 4905 0 It is better for a country if there is adiversity of different religions and viewson life.
62 k31_3 Statement: Emissionreductions should be madeabroad
discrete numeric-1.0 4905 0 Most of the emission reductions Norwayis committed to should be made abroad.
63 k14_1 Statement: Politics iscomplicated
discrete numeric-1.0 4905 0 Sometimes politics is so complicatedthat people like me have nounderstanding of what it's about.
Norwegian Citizen Panel Wave 1 - Variables List
- 10 -
File Norsk Medborgerpanel runde 1
# Name Label Type Format Valid Invalid Question
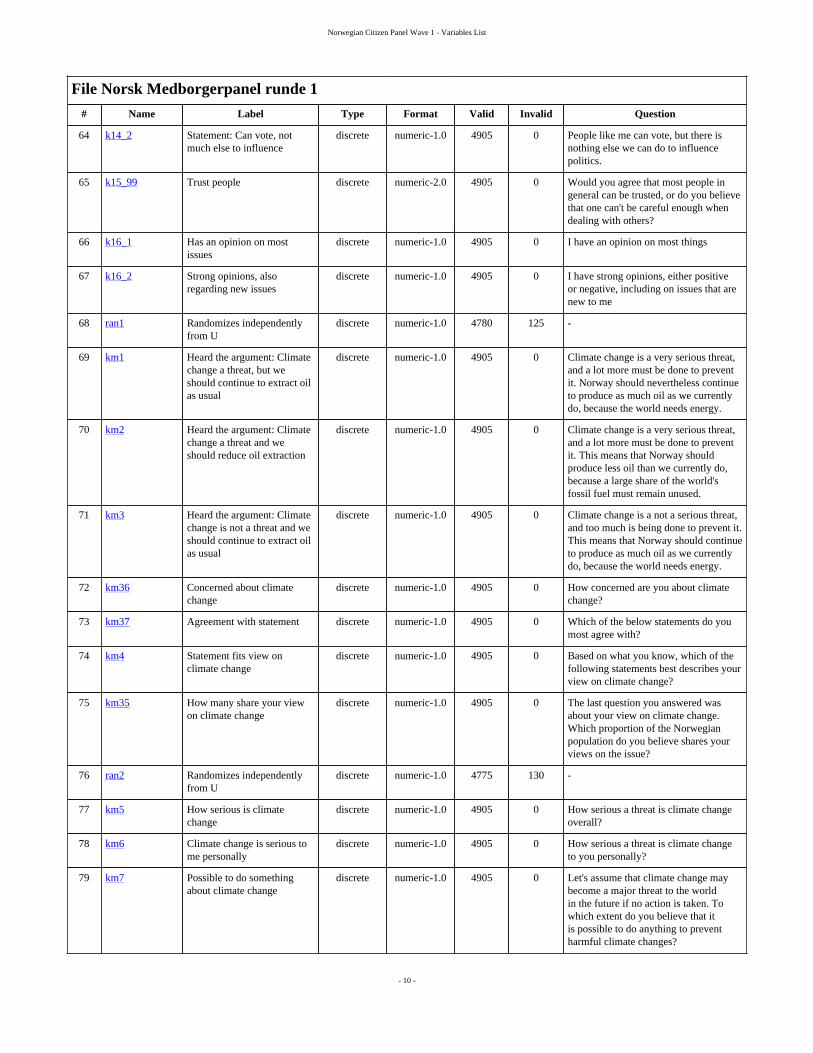
64 k14_2 Statement: Can vote, notmuch else to influence
discrete numeric-1.0 4905 0 People like me can vote, but there isnothing else we can do to influencepolitics.
65 k15_99 Trust people discrete numeric-2.0 4905 0 Would you agree that most people ingeneral can be trusted, or do you believethat one can't be careful enough whendealing with others?
66 k16_1 Has an opinion on mostissues
discrete numeric-1.0 4905 0 I have an opinion on most things
67 k16_2 Strong opinions, alsoregarding new issues
discrete numeric-1.0 4905 0 I have strong opinions, either positiveor negative, including on issues that arenew to me
68 ran1 Randomizes independentlyfrom U
discrete numeric-1.0 4780 125 -
69 km1 Heard the argument: Climatechange a threat, but weshould continue to extract oilas usual
discrete numeric-1.0 4905 0 Climate change is a very serious threat,and a lot more must be done to preventit. Norway should nevertheless continueto produce as much oil as we currentlydo, because the world needs energy.
70 km2 Heard the argument: Climatechange a threat and weshould reduce oil extraction
discrete numeric-1.0 4905 0 Climate change is a very serious threat,and a lot more must be done to preventit. This means that Norway shouldproduce less oil than we currently do,because a large share of the world'sfossil fuel must remain unused.
71 km3 Heard the argument: Climatechange is not a threat and weshould continue to extract oilas usual
discrete numeric-1.0 4905 0 Climate change is a not a serious threat,and too much is being done to prevent it.This means that Norway should continueto produce as much oil as we currentlydo, because the world needs energy.
72 km36 Concerned about climatechange
discrete numeric-1.0 4905 0 How concerned are you about climatechange?
73 km37 Agreement with statement discrete numeric-1.0 4905 0 Which of the below statements do youmost agree with?
74 km4 Statement fits view onclimate change
discrete numeric-1.0 4905 0 Based on what you know, which of thefollowing statements best describes yourview on climate change?
75 km35 How many share your viewon climate change
discrete numeric-1.0 4905 0 The last question you answered wasabout your view on climate change.Which proportion of the Norwegianpopulation do you believe shares yourviews on the issue?
76 ran2 Randomizes independentlyfrom U
discrete numeric-1.0 4775 130 -
77 km5 How serious is climatechange
discrete numeric-1.0 4905 0 How serious a threat is climate changeoverall?
78 km6 Climate change is serious tome personally
discrete numeric-1.0 4905 0 How serious a threat is climate changeto you personally?
79 km7 Possible to do somethingabout climate change
discrete numeric-1.0 4905 0 Let's assume that climate change maybecome a major threat to the worldin the future if no action is taken. Towhich extent do you believe that itis possible to do anything to preventharmful climate changes?

Norwegian Citizen Panel Wave 1 - Variables List
- 11 -
File Norsk Medborgerpanel runde 1
# Name Label Type Format Valid Invalid Question
80 ran3sel_1 Randomizes if U=1: selectsKM13_1
discrete numeric-1.0 1189 3716 -
81 ran3sel_2 Randomizes if U=1: selectsKM13_2
discrete numeric-1.0 1211 3694 -
82 ran3sel_3 Randomizes if U=1: selectsKM13_3
discrete numeric-1.0 1204 3701 -
83 ran3sel_4 Randomizes if U=1: selectsKM13_4
discrete numeric-1.0 1196 3709 -
84 ran3sel_5 Randomizes if U=1: selectsKM13_5
discrete numeric-1.0 1197 3708 -
85 ran3sel_6 Randomizes if U=1: selectsKM13_6
discrete numeric-1.0 1203 3702 -
86 ran3sel_7 Randomizes if U=1: selectsKM13_7
discrete numeric-1.0 1225 3680 -
87 ran3sel_8 Randomizes if U=1: selectsKM13_8
discrete numeric-1.0 1175 3730 -
88 ran3sel_9 Randomizes if U=1: selectsKM13_9
discrete numeric-1.0 2400 2505 -
89 km13_1 Measure: Tighten rules onCO2 emissions by qutoareductions
discrete numeric-1.0 4905 0 Tighten the rules for how much CO2industry in Norway and Europe maydischarge by cutting the total number ofquotas these may use.
90 km13_2 Measure: Tighten rules onCO2 emissions by limitingamount
discrete numeric-1.0 4905 0 Tighten the rules for how much CO2industry in Norway and Europe maydischarge overall.
91 km13_3 Measure: Capture and storeCO2
discrete numeric-1.0 4905 0 Strengthen focus on capture andstorage of CO2 beneath the seabed orunderground.
92 km13_4 Measure: Capture and storeCO2, like on Mognstad
discrete numeric-1.0 4905 0 Strengthen focus on capture andstorage of CO2 beneath the seabedor underground, such as the so-called“mission to the moon” project atMongstad
93 km13_5 Measure: Reduce taxincentives regarding oilfieldexploration
discrete numeric-1.0 4905 0 Reduce tax incentives for oil explorationon the Norwegian continental shelf.
94 km13_6 Measure: Tighten taxregulation regarding oilfieldexploration
discrete numeric-1.0 4905 0 Tighten the tax regulations foroil exploration on the Norwegiancontinental shelf.
95 km13_7 Measure: Prevent harmfuleffects of storms andprecipitation
discrete numeric-1.0 4905 0 Strengthen efforts to prevent the harmfuleffects of storms and precipitation.
96 km13_8 Measure: Prevent harmfuleffects of storms andprecipitation, even at the costof other issues
discrete numeric-1.0 4905 0 Strengthen efforts to prevent the harmfuleffects of storms and precipitation, evenif this is at the cost of other importantcauses.
97 km13_9 Measure: Change the climateby blocking the sunlight
discrete numeric-1.0 4905 0 Attempt to alter the weather and climateby e.g. launching sulphur particles thatblock sunlight
98 km17 If nothing is done aboutclimate change weather willbe more extreme
discrete numeric-1.0 4905 0 If nothing is done to prevent it, do youbelieve global warming will lead tomore harmful extreme weather over the

Norwegian Citizen Panel Wave 1 - Variables List
- 12 -
File Norsk Medborgerpanel runde 1
# Name Label Type Format Valid Invalid Question
next 100 years, or do you believe globalwarming will not lead to this?
99 km20 Moral obligation to preventclimate change
discrete numeric-1.0 4905 0 To which degree do you view it as amoral duty for individuals to contributeto prevent climate change?
100 km22 Knowledge about climatechange
discrete numeric-1.0 4905 0 In your opinion, how good is yourknowledge on climate change?
101 km22k Comment: Knowledge aboutclimate change [anonymised]
discrete character-150 0 0 If you have any comments to thequestion, you may enter them here:[anonymised: Data withheld for the sakeof anonymity]
102 km23 Discussion on climate changeis characterized by conflictand disagreement
discrete numeric-1.0 4905 0 To which degree do you thinkdiscussion concerning climate changeis characterized by conflict anddisagreement?
103 km26 Diversity of opinion onclimate change in the media
discrete numeric-1.0 4905 0 In your opinion, how great is thediversity in opinion on climate changethat emerges in the media?
104 ran4 Randomiserer dersom U=1 discrete numeric-1.0 2389 2516 -
105 km27 Scientists agree on climatechange
discrete numeric-1.0 4905 0 To which degree do you have theimpression that scientists agree onclimate change?
106 km28_2_1 Proportion of scientist thatagree on climate change
discrete numeric-3.0 4905 0 In your opinion, which proportion ofclimate scientists agree that globalwarming is a direct consequence ofhumans using coal, oil and gas?
107 km28k Comment: Proportion ofscientist that agree on climatechange [anonymised]
discrete character-150 0 0 If you have comments to the question,you may enter them here: [anonymised:Data withheld for the sake ofanonymity]
108 ran5 Randomizes if U=1 discrete numeric-1.0 2387 2518 -
109 km29 Norway commited throughinternational agreements tocut emissions
discrete numeric-1.0 4905 0 As you may know, governmentleaders from all over the world metin November to negotiate a newinternational agreement to limit theemissions of greenhouse gases. Towhich extent do you agree that Norwaycommits itself in such internationalagreements?
110 km30 Norway commited throughinternational agreements tocut emissions, even if Chinadoes not
discrete numeric-1.0 4905 0 km30 question details
111 dt1_1 Authorities have a right to:indefinite detainment
discrete numeric-1.0 4905 0 Keep individuals in custody as long asthey want without a judicial process
112 dt1_2 Authorities have a right to:tapping phone calls
discrete numeric-1.0 4905 0 Tap people's phone calls
113 dt1_3 Authorities have a right to:randomly stop and searchpeople on the street
discrete numeric-1.0 4905 0 Randomly stop and search people on thestreet
114 dt1_4 Authorities have a rightto: arrest people withoutsuspision
discrete numeric-1.0 4905 0 Arrest people without specific suspicion

Norwegian Citizen Panel Wave 1 - Variables List
- 13 -
File Norsk Medborgerpanel runde 1
# Name Label Type Format Valid Invalid Question
115 dt1_5 Authorities have a rightto: monitor electroniccommunication
discrete numeric-1.0 4905 0 Monitor electronic communication(beyond telephones)
116 dt1_6 Authorities have a right to:monitor/bug room
discrete numeric-1.0 4905 0 Monitor/bug rooms
117 dt1_7 Authorities have a right to:block off lagre part of thecity
discrete numeric-1.0 4905 0 Cordon off large parts of the city
118 dt1_8 Authorities have a right to:patrol the streets with armedmilitary or police
discrete numeric-1.0 4905 0 Allow armed police or militarypersonnel to patrol the streets
119 dt1k Comment: Authorities havea right to [anonymised: Datawithheld for the sake ofanonymity]
discrete character-150 0 0 If you have any comments to thequestion, enter them here: [anonymised:Data withheld for the sake ofanonymity]
120 dt2 Willing to accept thatmaintaining the safety ofsociety must be at the cost ofcivil liberties
discrete numeric-1.0 4905 0 How willing are you to accept thatmaintaining the safety of societymust be at the cost of the freedom ofindividuals (such as privacy)?
121 ran7 Randomizes independentlyfrom U
discrete numeric-1.0 4750 155 -
122 dt3_1 Trust in central governmentto handle: natural disasters
discrete numeric-1.0 4905 0 Natural disasters such as landslides,floods and hurricanes
123 dt3_2 Trust in central governmentto handle: transportationaccident
discrete numeric-1.0 4905 0 Accidents in connection with aviation,railroads, roads and shipping
124 dt3_3 Trust in central governmentto handle: contagious disease
discrete numeric-1.0 4905 0 Contagion in connection with food,drinking water or epidemics (forexample bird flu, swine flu, E.coli)
125 dt3_4 Trust in central governmentto handle: failure in criticalinfratructure
discrete numeric-1.0 4905 0 Failure in critical infrastructure(such as power supply, electroniccommunication, telecommunication, oiland fuel supply)
126 dt3_5 Trust in central governmentto handle: terrorist attack
discrete numeric-1.0 4905 0 Terrorist attacks
127 dt4_1 Trust in local government tohandle: natural disaster
discrete numeric-1.0 4905 0 Natural disasters such as landslides,floods and hurricanes
128 dt4_2 Trust in local governmentto handle: transporatationaccident
discrete numeric-1.0 4905 0 Accidents in connection with aviation,railroads, roads and shipping
129 dt4_3 Trust in local government tohandle: contagious disease
discrete numeric-1.0 4905 0 Contagion in connection with food,drinking water or epidemics (forexample bird flu, swine flu, E.coli)
130 dt4_4 Trust in local governmentto handle: failure in criticalinfrastructure
discrete numeric-1.0 4905 0 Failure in critical infrastructure(such as power supply, electroniccommunication, telecommunication, oiland fuel supply)
131 dt4_5 Trust in local government tohandle: terrorist attack
discrete numeric-1.0 4905 0 Terrorist attacks
132 dt6_1 People are considerate andhelpful
discrete numeric-2.0 4905 0 Would you say that people usuallytry to be considerate to others andhelpful, or that they mainly look out forthemselves? Indicate your opinion usingthe scale below.

Norwegian Citizen Panel Wave 1 - Variables List
- 14 -
File Norsk Medborgerpanel runde 1
# Name Label Type Format Valid Invalid Question
133 dt7_1 People are exploitative discrete numeric-2.0 4905 0 Do you believe that most people wouldtry to take advantage of you if they hadthe chance, or do you think they wouldtry to be kind? Indicate your opinionbelow.
134 dv30_1 Statement: lower taxes evenif it means cuts to welfare
discrete numeric-1.0 4905 0 Tax rates should be lowered, even if itleads to cutbacks in the welfare state.
135 dv30_2 Statement: allowcommercialized privateschools
discrete numeric-1.0 4905 0 Commercial private schools should bepermitted.
136 dv30_3 Statement: public servicescheaper and better if left toprivate actors
discrete numeric-1.0 4905 0 Many public services could be carriedout both better and cheaper if they wereleft to private parties.
137 dt8_1 Has in the last 12 months:contacted local politician
discrete numeric-1.0 4905 0 Contacted a local politician
138 dt8_2 Has in the last 12 months:contacted national politician
discrete numeric-1.0 4905 0 Contacted a national politician
139 dt8_3 Has in the last 12 months:contacted voluntaryorganization
discrete numeric-1.0 4905 0 Contacted a voluntary organization orassociation
140 dt8_4 Has in the last 12 months:contacted a public official atthe national level
discrete numeric-1.0 4905 0 Contacted a public official at thenational level
141 dt8_5 Has in the last 12 months:contacted a public official atthe local level
discrete numeric-1.0 4905 0 Contacted a public official at the locallevel
142 dt8_6 Has in the last 12 months:participated in work in apolitical party
discrete numeric-1.0 4905 0 Participated in work in a political party
143 dt8_7 Has in the last 12 months:participated in work forprotest group
discrete numeric-1.0 4905 0 Participated in work in a political actiongroup, local protest group or similar
144 dt8_8 Has in the last 12 months:participated in work forvoluntary organization
discrete numeric-1.0 4905 0 Participated in work in a voluntaryorganization or association
145 dt8_9 Has in the last 12 months:worn or posted champaignsticker or emblem
discrete numeric-1.0 4905 0 Worn or posted a campaign sticker oremblem
146 dt8_10 Has in the last 12 months:signed a petition
discrete numeric-1.0 4905 0 Signed an appeal, a petition, action listor similar
147 dt8_11 Has in the last 12 months:participated in public protest
discrete numeric-1.0 4905 0 Participated in a public demonstration
148 dt8_12 Has in the last 12 months:boycotted certain products
discrete numeric-1.0 4905 0 Boycotted specific products
149 dt8_13 Has in the last 12 months:consciously puchasedspecific products for politicalreasons
discrete numeric-1.0 4905 0 Consciously purchased specific productsfor political, moral or environmentalreasons
150 dt8_14 Has in the last 12 months:provided financial support
discrete numeric-1.0 4905 0 Provided financial support
151 dt8_15 Has in the last 12 months:collected money
discrete numeric-1.0 4905 0 Collected money

Norwegian Citizen Panel Wave 1 - Variables List
- 15 -
File Norsk Medborgerpanel runde 1
# Name Label Type Format Valid Invalid Question
152 dt8_16 Has in the last 12 months:contacted or appeared inmedia
discrete numeric-1.0 4905 0 Contacted or appeared in the media
153 dt8_17 Has in the last 12 months:contacted lawyer
discrete numeric-1.0 4905 0 Contacted a lawyer or legal advisor
154 dt8_18 Has in the last 12 months:participated in publicmeeting
discrete numeric-1.0 4905 0 Participated in a public meeting
155 dt8_19 Has in the last 12 months:participated in politicalmeeting
discrete numeric-1.0 4905 0 Participated at a political meeting orevent
156 dt9_1 Has in the last 12 months:, incommunity: participated inpublic meeting
discrete numeric-1.0 4905 0 Participated in or taken the initiative to apublic meeting to discuss issues relatedto conditions in the community
157 dt9_2 Has in the last 12 months:, incommunity: participated involuntary work
discrete numeric-1.0 4905 0 Participated in or taken the initiativefor voluntary work to fix or improvesomething in the community
158 dt9_3 Has in the last 12 months:, incommunity: been involved inassociation
discrete numeric-1.0 4905 0 Become involved in a residents'association, neighbourhood associationor similar organizations in thecommunity
159 dt10_1 Membership: Sports oroutdoor organization
discrete numeric-1.0 4905 0 Sports or outdoor organization
160 dt10_2 Membership: Humanitarianaid organization
discrete numeric-1.0 4905 0 Humanitarian aid organization
161 dt10_3 Membership: Religious orother belief organization
discrete numeric-1.0 4905 0 Religious or other belief organization
162 dt10_4 Membership: Political party discrete numeric-1.0 4905 0 Political party
163 dt10_5 Membership: Temperanceorganization
discrete numeric-1.0 4905 0 Temperance organization
164 dt10_6 Membership: Languageorganization or similar
discrete numeric-1.0 4905 0 Language organization or similar
165 dt10_7 Membership: Environmentalprotection/animal welfareorganization
discrete numeric-1.0 4905 0 Environmental protection/animalwelfare organization
166 dt10_8 Membership: Residents'association/neighbourhoodassociation
discrete numeric-1.0 4905 0 Residents' association/neighbourhoodassociation/community association
167 dt10_9 Membership: Housingcooperative
discrete numeric-1.0 4905 0 Housing cooperative
168 dt10_10 Membership: House ownerassociation and land ownerassociation
discrete numeric-1.0 4905 0 House owner association and land ownerassociation
169 dt10_11 Membership: Consumerorganization
discrete numeric-1.0 4905 0 Cultural association (music, dance,theatre, hobby, etc.)
170 dt10_12 Membership: Lodge discrete numeric-1.0 4905 0 Lodge
171 dt10_13 Membership: Consumerassociation
discrete numeric-1.0 4905 0 Consumer organization
172 dt10_14 Membership: Car association discrete numeric-1.0 4905 0 Car association
Norwegian Citizen Panel Wave 1 - Variables List
- 16 -
File Norsk Medborgerpanel runde 1
# Name Label Type Format Valid Invalid Question
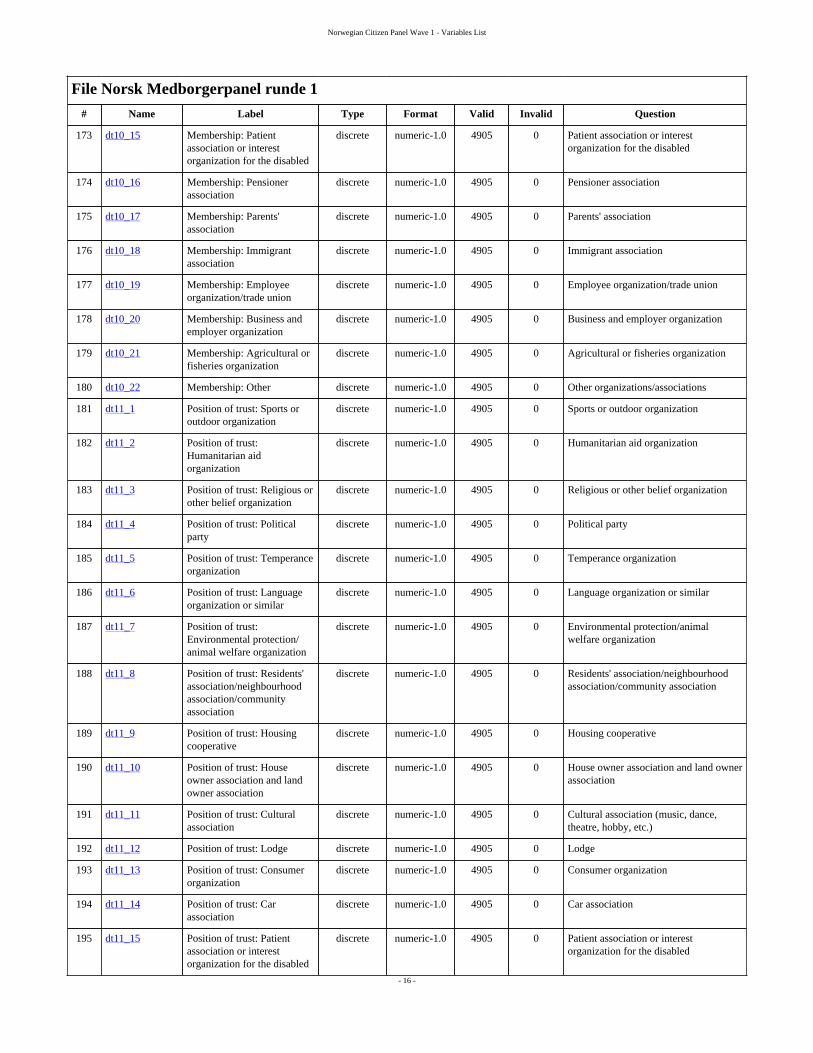
173 dt10_15 Membership: Patientassociation or interestorganization for the disabled
discrete numeric-1.0 4905 0 Patient association or interestorganization for the disabled
174 dt10_16 Membership: Pensionerassociation
discrete numeric-1.0 4905 0 Pensioner association
175 dt10_17 Membership: Parents'association
discrete numeric-1.0 4905 0 Parents' association
176 dt10_18 Membership: Immigrantassociation
discrete numeric-1.0 4905 0 Immigrant association
177 dt10_19 Membership: Employeeorganization/trade union
discrete numeric-1.0 4905 0 Employee organization/trade union
178 dt10_20 Membership: Business andemployer organization
discrete numeric-1.0 4905 0 Business and employer organization
179 dt10_21 Membership: Agricultural orfisheries organization
discrete numeric-1.0 4905 0 Agricultural or fisheries organization
180 dt10_22 Membership: Other discrete numeric-1.0 4905 0 Other organizations/associations
181 dt11_1 Position of trust: Sports oroutdoor organization
discrete numeric-1.0 4905 0 Sports or outdoor organization
182 dt11_2 Position of trust:Humanitarian aidorganization
discrete numeric-1.0 4905 0 Humanitarian aid organization
183 dt11_3 Position of trust: Religious orother belief organization
discrete numeric-1.0 4905 0 Religious or other belief organization
184 dt11_4 Position of trust: Politicalparty
discrete numeric-1.0 4905 0 Political party
185 dt11_5 Position of trust: Temperanceorganization
discrete numeric-1.0 4905 0 Temperance organization
186 dt11_6 Position of trust: Languageorganization or similar
discrete numeric-1.0 4905 0 Language organization or similar
187 dt11_7 Position of trust:Environmental protection/animal welfare organization
discrete numeric-1.0 4905 0 Environmental protection/animalwelfare organization
188 dt11_8 Position of trust: Residents'association/neighbourhoodassociation/communityassociation
discrete numeric-1.0 4905 0 Residents' association/neighbourhoodassociation/community association
189 dt11_9 Position of trust: Housingcooperative
discrete numeric-1.0 4905 0 Housing cooperative
190 dt11_10 Position of trust: Houseowner association and landowner association
discrete numeric-1.0 4905 0 House owner association and land ownerassociation
191 dt11_11 Position of trust: Culturalassociation
discrete numeric-1.0 4905 0 Cultural association (music, dance,theatre, hobby, etc.)
192 dt11_12 Position of trust: Lodge discrete numeric-1.0 4905 0 Lodge
193 dt11_13 Position of trust: Consumerorganization
discrete numeric-1.0 4905 0 Consumer organization
194 dt11_14 Position of trust: Carassociation
discrete numeric-1.0 4905 0 Car association
195 dt11_15 Position of trust: Patientassociation or interestorganization for the disabled
discrete numeric-1.0 4905 0 Patient association or interestorganization for the disabled

Norwegian Citizen Panel Wave 1 - Variables List
- 17 -
File Norsk Medborgerpanel runde 1
# Name Label Type Format Valid Invalid Question
196 dt11_16 Position of trust: Pensionerassociation
discrete numeric-1.0 4905 0 Pensioner association
197 dt11_17 Position of trust: Parents'association
discrete numeric-1.0 4905 0 Parents' association
198 dt11_18 Position of trust: Immigrantassociation
discrete numeric-1.0 4905 0 Immigrant association
199 dt11_19 Position of trust: Employeeorganization/trade union
discrete numeric-1.0 4905 0 Employee organization/trade union
200 dt11_20 Position of trust: Businessand employer organization
discrete numeric-1.0 4905 0 Business and employer organization
201 dt11_21 Position of trust: Agriculturalor fisheries organization
discrete numeric-1.0 4905 0 Agricultural or fisheries organization
202 dt11_22 Position of trust: Other discrete numeric-1.0 4905 0 Other organizations/associations
203 dt12 Would attempt to influencepolitical process regardingcontroversial measure
discrete numeric-1.0 4905 0 Let's assume that the Storting isdiscussing a new measure that youconsider to be completely unreasonable.How likely is it that you would attemptto do something to affect the outcome?
204 dt13 Means to influence politicalprocess
discrete numeric-1.0 4905 0 If you wanted to affect the outcome ofan issue, what would be your favouredprocedure?
205 km34 Norway morally obligated toreduce emissions
discrete numeric-1.0 4905 0 To which extent do you agree ordisagree with the following statement:“Rich countries like Norway have amoral obligation to show internationalleadership by reducing their greenhousegas emissions.”
206 grup Randomizes if U=2 discrete numeric-1.0 2344 2561 -
207 dv1 Benefit for Norway thatpeople from other countriessettles down here
discrete numeric-1.0 4905 0 How great an advantage or disadvantagewould you say it is for Norway thatpeople from other countries come to livehere?
208 dv2 Benefit for Norway thatimmigrants settles down here
discrete numeric-1.0 4905 0 How great an advantage or disadvantagewould you say it is for Norway thatimmigrants come to live here?
209 dv3 Policies aimed at people fromother countries that settledown personally important
discrete numeric-1.0 4905 0 How important are policies aimed atpeople from other countries who cometo live in Norway to you personally?
210 dv4 Immigration policy imporantpersonally
discrete numeric-1.0 4905 0 How important is immigration policy toyou personally?
211 dv5 Party with best policyregarding settlement offoreigners
discrete numeric-2.0 4905 0 Which political party do you believehas the best policy aimed at people whocome from other countries to live inNorway?
212 dv5_10_o .. Other: Party with best policyregarding settlement offoreigners
discrete character-150 4905 0 Which political party do you believehas the best policy aimed at people whocome from other countries to live inNorway?
213 dv6 Party with the bestimmigration policy
discrete numeric-2.0 4905 0 In your opinion, which political partyhas the best immigration policy?
214 dv6_10_o .. Other: Party with bestimmigration policy
discrete character-150 4905 0 In your opinion, which political partyhas the best immigration policy?

Norwegian Citizen Panel Wave 1 - Variables List
- 18 -
File Norsk Medborgerpanel runde 1
# Name Label Type Format Valid Invalid Question
215 dv7 Share of foreigners incommunity
discrete numeric-1.0 4905 0 If you consider people in yourcommunity or school district, aroundhow many have come from a differentcountry to live there or have at leastone parent who has come from anothercountry?
216 dv8 Share of immigrants incommunity
discrete numeric-1.0 4905 0 If you consider people in yourcommunity or school district, aroundhow many have immigrated or have atleast one parent who has immigrated?
217 dv9 Encounters with foreigners indaily life
discrete numeric-1.0 4905 0 Imagine people you randomlyencounter in your daily life, for exampleon the bus, at the shop or in yourneighbourhood. How often would yousay that you encounter people who havecome from other countries to live here?
218 dv10 Encounters with immigrantsin daily life
discrete numeric-1.0 4905 0 Imagine people you randomlyencounter in your daily life, for exampleon the bus, at the shop or in yourneighbourhood. How often would yousay you encounter immigrants?
219 dv11 Experience of meetingforeigners
discrete numeric-1.0 4905 0 How good or bad an experience havethese short, random encounters been?
220 dv12 Experience of meetingimmigrants
discrete numeric-1.0 4905 0 How good or bad an experience havethese short, random encounters been?
221 dv13 Share of friends that areforeigners
discrete numeric-1.0 4905 0 How many of your close friends havecome from another country to live inNorway or have parents (mother, fatheror both parents) who have come fromanother country to live in Norway?
222 dv14 Share of friends that areimmigrants
discrete numeric-1.0 4905 0 How many of your close friends haveimmigrated to Norway or have parents(mother, father or both parents) whohave immigrated to Norway?
223 grup2 Randomizes independentlyfrom U
discrete numeric-1.0 4709 196 -
224 dv15 Claim: Immigrans has toapply for more jobs thanNorwegians, according to1800 job applications
discrete numeric-1.0 4905 0 Research based on 1,800 jobapplications concludes that Norwegianswith immigrant backgrounds must applyfor far more jobs than others in orderto be called for an interview. To whichextent do you agree that this is the casein Norway just now?
225 dv16 Claim: Immigrans has toapply for more jobs thanNorwegians, according to 42interviews
discrete numeric-1.0 4905 0 Research based on 42 interviews withemployers concludes that Norwegianswith immigrant backgrounds must applyfor far more jobs than others in orderto be called for an interview. To whichextent do you agree that this is the casein Norway just now?
226 dv17 Claim: Immigrans has toapply for more jobs thanNorwegians, according toresearch
discrete numeric-1.0 4905 0 Research concludes that Norwegianswith immigrant backgrounds must applyfor far more jobs than others in orderto be called for an interview. To whichextent do you agree that this is the casein Norway just now?
227 dv18 Claim: Immigrans has toapply for more jobs than
discrete numeric-1.0 4905 0 A governmental ministry concludesthat Norwegians with immigrant

Norwegian Citizen Panel Wave 1 - Variables List
- 19 -
File Norsk Medborgerpanel runde 1
# Name Label Type Format Valid Invalid Question
Norwegians, according to agovernmental ministry
backgrounds must apply for far morejobs than others in order to be called foran interview. To which extent do youagree that this is the case in Norway justnow?
228 dv19 Claim: Immigrans has toapply for more jobs thanNorwegians, accordingto The Norwegian Centreagainst Racism
discrete numeric-1.0 4905 0 The Norwegian Centre against Racismconcludes that Norwegians withimmigrant backgrounds must apply forfar more jobs than others in order tobe called for an interview. To whichextent do you agree that this is the casein Norway just now?
229 dv20 Claim: Immigrans has toapply for more jobs thanNorwegians, according topublic debate
discrete numeric-1.0 4905 0 Social debate participants concludethat Norwegians with immigrantbackgrounds must apply for far morejobs than others in order to be called foran interview. To which extent do youagree that this is the case in Norway justnow?
230 grup3 Randomizes if U=2 discrete numeric-1.0 2338 2567 -
231 dv21 Allow Muslim schools discrete numeric-1.0 4905 0 Some Muslims in Norway wish to sendtheir children to Islamic schools thatfollow the Norwegian curriculum butadditionally teach Islam. To whichextent do you agree or disagree thatMuslims in Norway should be permittedto send their children to Islamic schools?
232 dv22 Allow Muslim schools,even though it may disruptintegration, according topublic debate
discrete numeric-1.0 4905 0 dv22 question details
233 dv23 Allow Muslim schools,even though it may disruptintegration, according toProgress Party
discrete numeric-1.0 4905 0 dv23 question details
234 dv24 Allow Muslim schools,even though it may disruptintegration, according toLabour Party
discrete numeric-1.0 4905 0 dv24 question details
235 grup4 Randomizes if U=2 discrete numeric-1.0 2335 2570 -
236 dv25 Claim: Muslim cultureshould be respected
discrete numeric-1.0 4905 0 Muslims in Norway are entitled torespect for their traditions and culture.
237 dv26 Claim: Muslim cultureshould be protected
discrete numeric-1.0 4905 0 Muslims in Norway are entitled toprotection of their traditions and culture.
238 dv27 Claim: Immigrant cultureshould be respected
discrete numeric-1.0 4905 0 Immigrants in Norway are entitled torespect for their traditions and culture.
239 dv28 Claim: Muslim cultureshould be protected
discrete numeric-1.0 4905 0 Immigrants in Norway are entitled toprotection of their traditions and culture.
240 dv29_1 Statement: Refugees shouldbe entitled to social services
discrete numeric-1.0 4905 0 Refugees should have the same right tosocial services as Norwegians, even ifthey are not Norwegian citizens.
241 dv29_2 Statement: Begging shouldbe banned
discrete numeric-1.0 4905 0 Begging should be banned in Norway.
242 dv29_3 Statement: Norway will loseit's identity if more Muslimscome to live here
discrete numeric-1.0 4905 0 Norway will lose its identity if moreMuslims come to live here.

Norwegian Citizen Panel Wave 1 - Variables List
- 20 -
File Norsk Medborgerpanel runde 1
# Name Label Type Format Valid Invalid Question
243 dv29_4 Statement: Norwegianmuslims more loyal to othermuslims
discrete numeric-1.0 4905 0 Norwegian Muslims are more loyal toother Muslims in the world than to thepeople of this country.
244 dv29_5 Statement: Better for acountry if most people sharethe same traditions andcustoms
discrete numeric-1.0 4905 0 It is better for a country if nearlyeveryone shares the same traditions andcustoms.
245 dv33 Foreigners are better offcompared to people like me
discrete numeric-1.0 4905 0 In your opinion, how much better orworse off are the majority of people whohave come to live in Norway comparedto people like you?
246 dv34 Immigrans are better offcompared to people like me
discrete numeric-1.0 4905 0 In your opinion, how much better orworse off are the majority of people whohave immigrated to Norway comparedto people like you?
247 grup5 Randomizes independentlyfrom U
discrete numeric-1.0 4693 212 -
248 dv35_1 Fitting description: Importantnot to not have prejudicestowards immigrants
discrete numeric-1.0 4905 0 It is important to me personally to beunprejudiced towards immigrants.
249 dv35_2 Fitting description: Don'twant to appear racist
discrete numeric-1.0 4905 0 I would not like to be perceived asracist, not even unto myself.
250 dv35_3 Fitting description: Feelguilty about negative feelingtowards immigrants
discrete numeric-1.0 4905 0 I feel guilty if I have negative feelingstowards immigrants.
251 dv35_4 Fitting description: Tryingnot to not have prejudicestowards immigrants
discrete numeric-1.0 4905 0 I try to be unprejudiced towardsimmigrants due to my own conviction.
252 dv36 Directly affected by July22nd [anonymised]
discrete numeric-1.0 0 4905 dv36 question details
253 dv36_5_o .. Other: Directly affected byJuly 22nd [anonymised]
discrete character-150 0 0 Other: [anonymised: Data withheld forthe sake of anonymity]
254 dv37_1 Reaction: Remember where Iwas when the news came
discrete numeric-1.0 4905 0 I remember where I was when I got thenews
255 dv37_2 Reaction: Remember whoI was with when the newscame
discrete numeric-1.0 4905 0 I remember who I was with when I gotthe news
256 dv37_3 Reaction: Paid close attentionto the news
discrete numeric-1.0 4905 0 I followed the news with extra interest inthe time following the events
257 dv37_4 Reaction: Was saddend discrete numeric-1.0 4905 0 I was sad
258 dv37_5 Reaction: Got angry discrete numeric-1.0 4905 0 I was angry
259 dv37_6 Reaction: Discussed eventswith friends and relatives
discrete numeric-1.0 4905 0 I discussed 22. July with friends andacquaintances
260 dv37_8 Reaction: Became moreinterested in politics
discrete numeric-1.0 4905 0 I became more interested in politics
261 dv37_10 Reaction: The attacks madeno impression
discrete numeric-1.0 4905 0 The attacks didn't affect me much
262 dv37_ann .. Other: Reaction[anonymised]
discrete character-150 0 0 Other: [anonymised: Data withheld forthe sake of anonymity]
263 dv371 Participated in remembranceservices in the periodfollowing the attacks
discrete numeric-1.0 4905 0 Did you participate in the remembranceservices in the period following theattacks?

Norwegian Citizen Panel Wave 1 - Variables List
- 21 -
File Norsk Medborgerpanel runde 1
# Name Label Type Format Valid Invalid Question
264 dv372 Joined political party orassociation in the periodfollowing the attacks
discrete numeric-1.0 4905 0 Did you become a member of a politicalparty or an association in the period afterthe terrorist attacks?
265 dv372_1_ .. Text: Joined political partyor association in the periodfollowing the attacks
discrete character-150 4905 0 Did you become a member of a politicalparty or an association in the period afterthe terrorist attacks?
266 dv39 Think, read or talk about July22nd
discrete numeric-1.0 4905 0 More than two years have passed sincethe attacks. As for you personally, howoften would you say that you think, reador talk about things that have to do with22 July nowadays?
267 dv38_1 Fitting description: Importantnot to not have prejudicestowards immigrants
discrete numeric-1.0 4905 0 It is important to me personally to beunprejudiced towards immigrants.
268 dv38_2 Fitting description: Don'twant to appear racist
discrete numeric-1.0 4905 0 I would not like to be perceived asracist, not even unto myself.
269 dv38_3 Fitting description: Feelguilty about negative feelingtowards immigrants
discrete numeric-1.0 4905 0 I feel guilty if I have negative feelingstowards immigrants.
270 dv38_4 Fitting description: Tryingnot to not have prejudicestowards immigrants
discrete numeric-1.0 4905 0 I try to be unprejudiced towardsimmigrants due to my own conviction.
271 k17_1 Usage of media channels fornews: TV
discrete numeric-1.0 4905 0 TV
272 k17_2 Usage of media channels fornews: Radio
discrete numeric-1.0 4905 0 Radio
273 k17_3 Usage of media channels fornews: Newspaper
discrete numeric-1.0 4905 0 Printed newspapers
274 k17_4 Usage of media channels fornews: Online newspaper
discrete numeric-1.0 4905 0 Online newspapers
275 k17_5 Usage of media channels fornews: Facebook
discrete numeric-1.0 4905 0 Facebook
276 k17_6 Usage of media channels fornews: Twitter
discrete numeric-1.0 4905 0 Twitter
277 k17_7 Usage of media channels fornews: Other websites
discrete numeric-1.0 4905 0 Other websites
278 k18_1 Interested in media content:International news
discrete numeric-1.0 4905 0 International news
279 k18_2 Interested in media content:Domestic news
discrete numeric-1.0 4905 0 Domestic news
280 k18_3 Interested in media content:Local news
discrete numeric-1.0 4905 0 Local news
281 k18_4 Interested in media content:Health/ consumer/ lifestyle
discrete numeric-1.0 4905 0 Health/ consumer/ lifestyle
282 k18_5 Interested in media content:Debate
discrete numeric-1.0 4905 0 Debate
283 k18_6 Interested in media content:Culture and feature
discrete numeric-1.0 4905 0 Culture and feature
284 k18_7 Interested in media content:Entertainment and celebritynews
discrete numeric-1.0 4905 0 Entertainment and celebrity news

Norwegian Citizen Panel Wave 1 - Variables List
- 22 -
File Norsk Medborgerpanel runde 1
# Name Label Type Format Valid Invalid Question
285 k18_8 Interested in media content:Sports
discrete numeric-1.0 4905 0 Sports
286 k19_1 Profile on social network:Facebook
discrete numeric-1.0 4905 0 Facebook
287 k19_2 Profile on social network:Twitter
discrete numeric-1.0 4905 0 Twitter
288 k19_3 Profile on social network:Instagram
discrete numeric-1.0 4905 0 Instagram
289 k19_4 Profile on social network:Youtube
discrete numeric-1.0 4905 0 YouTube
290 k19_5 Profile on social network:Flickr
discrete numeric-1.0 4905 0 Flickr
291 k19_6 Profile on social network:LinkedIn
discrete numeric-1.0 4905 0 LinkedIn
292 k19_7 Profile on social network:Myspace
discrete numeric-1.0 4905 0 Myspace
293 k19_8 Profile on social network:Origo
discrete numeric-1.0 4905 0 Origo
294 k19_9 Profile on social network:Biip
discrete numeric-1.0 4905 0 Biip
295 k19_10 Profile on social network:Other
discrete numeric-1.0 4905 0 Other
296 k19_11 Profile on social network:None
discrete numeric-1.0 4905 0 None
297 k20 Description of employment discrete numeric-1.0 4905 0 Which of the descriptions fits best withwhat you have done for the past 7 days?
298 k21 Type of business discrete numeric-1.0 4905 0 Which type of business do you work in?
299 k21_6_ot .. Other: Type of business discrete character-150 4905 0 Which type of business do you work in?
300 k23 Text: Description ofprofession [anonymised]
discrete character-150 0 0 What kind of work do you primarily doin your main profession? [anonymised:Data withheld for the sake ofanonymity]
301 k23a Text: Name or title ofprofession [anonymised]
discrete character-150 0 0 What is the name or title of your mainprofession? [anonymised: Data withheldfor the sake of anonymity]
302 k23b Responsible for supervisingemployees
discrete numeric-1.0 4905 0 Are you responsible for supervising thework of other employees in your mainwork?
303 k24 Work in gas or oilmanufacturing
discrete numeric-1.0 4905 0 Is your workplace in the oil and gassector, or closely related to it?
304 k25_1 Gross annual income continuous numeric-11.0 4905 0 Gross annual income is:
305 k26 Highest completed education discrete numeric-2.0 4905 0 What is your highest completededucation?
306 k27 Marital status discrete numeric-1.0 4905 0 Marital status. Are/have you:
307 k27_9_ot .. Other: Marital status discrete character-150 4905 0 Marital status. Are/have you:
308 k28 Citizenship discrete numeric-1.0 4905 0 Citizenship. Are you:
309 k28_2_ot .. Text: Citizenship in othercountry
discrete character-150 4905 0 Please indicate which country

Norwegian Citizen Panel Wave 1 - Variables List
- 23 -
File Norsk Medborgerpanel runde 1
# Name Label Type Format Valid Invalid Question
310 k29 Parents immigrated toNorway
discrete numeric-1.0 4905 0 Have you or your parents (mother, fatheror both) immigrated to Norway?
311 k30_1 Text: Home country beforeimmigration [anonymised]
discrete character-150 0 0 Which country did you live in beforeimmigrating? [anonymised: Datawithheld for the sake of anonymity]
312 k30_2_1 Text: Parents home country,mother [anonymised]
discrete character-150 0 0 Mother: [anonymised: Data withheld forthe sake of anonymity]
313 k30_2_2 Text: Parents home country,father [anonymised]
discrete character-150 0 0 Father: [anonymised: Data withheld forthe sake of anonymity]
314 k30_3_1 Text: Mothers last homecountry [anonymised]
discrete character-150 0 0 Which country did your motherlive in before she immigrated?[anonymised: Data withheld for the sakeof anonymity]
315 k30_4_1 Text: Fathers last homecountry [anonymised]
discrete character-150 0 0 Which country did your father live inbefore he immigrated? [anonymised:Data withheld for the sake ofanonymity]
316 ran6 Randomizes if U=1 discrete numeric-1.0 2349 2556 -
317 dt14 Who should get 5000 kr, theparticipants have no say
discrete numeric-1.0 4905 0 dt14 question details
318 dt15 Who should get 5000 kr, youas a participant have a say
discrete numeric-1.0 4905 0 dt15 question details
319 km31 Text: Thoughts on climatechange [anonymised]
discrete character-150 0 0 What do you think when you hear thewords “climate change”? Please notethe first thing that springs to mind.We appreciate all kinds of answers.[anonymised: Data withheld for the sakeof anonymity]
320 comment Text: Comments orsuggestions for the survey[anonymised]
discrete character-150 0 0 If you have any comments orsuggestions for the survey and theCitizen Panel, please write them here.[anonymised: Data withheld for the sakeof anonymity]
321 P1 Gender discrete numeric-11.0 4905 0 -
322 P2 Region discrete numeric-11.0 4905 0 -
323 P3 County discrete numeric-11.0 4905 0 -
324 P4 Highest completed education discrete numeric-11.0 4905 0 -
325 P5_1 Age discrete numeric-11.0 4905 0 -
326 P5_2 Age discrete numeric-11.0 4905 0 -
327 Weight1 Weight based on variablesP3, P5_2, and P1. Seedocumentation report.
discrete numeric-11.0 4905 0 -
328 Weight2 Weight based on variablesP3, P5_2, P4, and P1. Seedocumentation report
discrete numeric-11.0 4905 0 -

Norwegian Citizen Panel Wave 1 - Variables Description
- 24 -
Variables DescriptionDataset contains 328 variable(s)

- 25 -
File : Norsk Medborgerpanel runde 1# responseid: responseid
Information [Type= continuous] [Format=numeric] [Range= 1-5018] [Missing=*]
Statistics [NW/ W] [Valid=4905 /-] [Invalid=0 /-] [Mean=2572.765 /-] [StdDev=1487.408 /-]
# u: Randomizes the respondents into two groups
Information [Type= discrete] [Format=numeric] [Range= 1-2] [Missing=*]
Statistics [NW/ W] [Valid=4905 /-] [Invalid=0 /-]
Pre-question Randomizes the respondents into two groups. The two groups are asked questions common to them both, and questionsunique to the group.
Value Label Cases Percentage
1 u1 2471 50.4%
2 u2 2434 49.6%Warning: these figures indicate the number of cases found in the data file. They cannot be interpreted as summary statistics of the population of interest.
# k1: Interest in politics
Information [Type= discrete] [Format=numeric] [Range= 1-5] [Missing=*]
Statistics [NW/ W] [Valid=4905 / 4905 ] [Invalid=0 / 0 ]
Literal question In general, how interested are you in politics?
Value Label Cases Weighted Percentage (Weighted)
1 Very interested 505 449.1 9.2%
2 Interested 2158 2033.0 41.4%
3 Somewhat interested 1671 1772.7 36.1%
4 Not interested 490 541.2 11.0%
5 Not interested at all 73 100.3 2.0%
97 No answer 8 8.6 0.2%Warning: these figures indicate the number of cases found in the data file. They cannot be interpreted as summary statistics of the population of interest.
# k2: Voted in the elections
Information [Type= discrete] [Format=numeric] [Range= 1-3] [Missing=*]
Statistics [NW/ W] [Valid=4905 / 4905 ] [Invalid=0 / 0 ]
Literal question Did you vote at the parliamentary elections this autumn?
Value Label Cases Weighted Percentage (Weighted)
1 Yes 4199 4143.1 84.5%
2 No 682 734.3 15.0%
3 Don't remember 7 7.1 0.1%
97 No answer 17 20.5 0.4%Warning: these figures indicate the number of cases found in the data file. They cannot be interpreted as summary statistics of the population of interest.
# k3: Voted for following party
Information [Type= discrete] [Format=numeric] [Range= 1-10] [Missing=*]
Statistics [NW/ W] [Valid=4905 / 4905 ] [Invalid=0 / 0 ]
Literal question Which party did you vote for at the parliamentary elections?
Value Label Cases Weighted Percentage (Weighted)
1 The Christian Democratic Party 213 184.4 3.8%
2 The Conservative Party 1158 1125.7 23.0%
3 The Progress Party 534 629.4 12.8%

- 26 -
File : Norsk Medborgerpanel runde 1# k3: Voted for following party
Value Label Cases Weighted Percentage (Weighted)
4 The Liberal Party 291 248.7 5.1%
5 The Socialist Left Party 263 206.9 4.2%
6 The Centre Party 175 174.5 3.6%
7 The Green Party 171 137.2 2.8%
8 The Labour Party 1188 1228.7 25.0%
9 Red 80 64.5 1.3%
10 Other: 67 74.5 1.5%
97 No answer 59 68.7 1.4%
98 Not asked 706 761.9 15.5%Warning: these figures indicate the number of cases found in the data file. They cannot be interpreted as summary statistics of the population of interest.
# k3_10_other: Text: Voted for following party
Information [Type= discrete] [Format=character] [Missing=*]
Statistics [NW/ W] [Valid=4903 /-] [Invalid=0 /-]
Literal question Which party did you vote for at the parliamentary elections?
# k4: Time of choosing party
Information [Type= discrete] [Format=numeric] [Range= 1-3] [Missing=*]
Statistics [NW/ W] [Valid=4905 / 4905 ] [Invalid=0 / 0 ]
Literal question When did you decide to vote for the party or list you chose?
Value Label Cases Weighted Percentage (Weighted)
1 Before the election campaign 2749 2770.8 56.5%
2 During the election campaign 1041 967.1 19.7%
3 On the day of the election 335 325.2 6.6%
97 No answer 74 80.0 1.6%
98 Not asked 706 761.9 15.5%Warning: these figures indicate the number of cases found in the data file. They cannot be interpreted as summary statistics of the population of interest.
# k5_1: Reasons not to vote in elections: too small differences between parties
Information [Type= discrete] [Format=numeric] [Range= 1-5] [Missing=*]
Statistics [NW/ W] [Valid=4905 / 4905 ] [Invalid=0 / 0 ]
Pre-question There may be many reasons for people not voting at parliamentary elections. Indicate how important the following reasonswere for you:
Literal question The differences between the parties are too minor
Value Label Cases Weighted Percentage (Weighted)
1 Very important 51 62.5 1.3%
2 Important 98 107.6 2.2%
3 Somewhat important 130 150.8 3.1%
4 Not very important 84 80.3 1.6%
5 Not important at all 125 132.9 2.7%
97 No answer 194 200.1 4.1%
98 Not asked 4223 4170.7 85.0%Warning: these figures indicate the number of cases found in the data file. They cannot be interpreted as summary statistics of the population of interest.

- 27 -
File : Norsk Medborgerpanel runde 1# k5_2: Reasons not to vote in elections: not committed to important issues
Information [Type= discrete] [Format=numeric] [Range= 1-5] [Missing=*]
Statistics [NW/ W] [Valid=4905 / 4905 ] [Invalid=0 / 0 ]
Pre-question There may be many reasons for people not voting at parliamentary elections. Indicate how important the following reasonswere for you:
Literal question I am not committed to any important issues
Value Label Cases Weighted Percentage (Weighted)
1 Very important 33 32.7 0.7%
2 Important 75 93.6 1.9%
3 Somewhat important 121 132.6 2.7%
4 Not very important 93 113.2 2.3%
5 Not important at all 157 146.1 3.0%
97 No answer 203 216.2 4.4%
98 Not asked 4223 4170.7 85.0%Warning: these figures indicate the number of cases found in the data file. They cannot be interpreted as summary statistics of the population of interest.
# k5_3: Reasons not to vote in elections: not familiar with issues
Information [Type= discrete] [Format=numeric] [Range= 1-5] [Missing=*]
Statistics [NW/ W] [Valid=4905 / 4905 ] [Invalid=0 / 0 ]
Pre-question There may be many reasons for people not voting at parliamentary elections. Indicate how important the following reasonswere for you:
Literal question I am not familiar enough with what the parties represent
Value Label Cases Weighted Percentage (Weighted)
1 Very important 89 125.0 2.5%
2 Important 135 140.8 2.9%
3 Somewhat important 97 112.3 2.3%
4 Not very important 63 56.8 1.2%
5 Not important at all 119 110.3 2.2%
97 No answer 179 189.1 3.9%
98 Not asked 4223 4170.7 85.0%Warning: these figures indicate the number of cases found in the data file. They cannot be interpreted as summary statistics of the population of interest.
# k5_4: Reasons not to vote in elections: lacking confidence in politicians
Information [Type= discrete] [Format=numeric] [Range= 1-5] [Missing=*]
Statistics [NW/ W] [Valid=4905 / 4905 ] [Invalid=0 / 0 ]
Pre-question There may be many reasons for people not voting at parliamentary elections. Indicate how important the following reasonswere for you:
Literal question I didn't have the time or opportunity
Value Label Cases Weighted Percentage (Weighted)
1 Very important 118 152.5 3.1%
2 Important 116 125.1 2.5%
3 Somewhat important 101 117.5 2.4%
4 Not very important 55 56.8 1.2%
5 Not important at all 117 106.6 2.2%
97 No answer 175 175.7 3.6%
98 Not asked 4223 4170.7 85.0%

- 28 -
File : Norsk Medborgerpanel runde 1# k5_4: Reasons not to vote in elections: lacking confidence in politiciansWarning: these figures indicate the number of cases found in the data file. They cannot be interpreted as summary statistics of the population of interest.
# k5_5: Reasons not to vote in elections: lack of time
Information [Type= discrete] [Format=numeric] [Range= 1-5] [Missing=*]
Statistics [NW/ W] [Valid=4905 / 4905 ] [Invalid=0 / 0 ]
Pre-question There may be many reasons for people not voting at parliamentary elections. Indicate how important the following reasonswere for you:
Literal question I didn't have the time or opportunity
Value Label Cases Weighted Percentage (Weighted)
1 Very important 125 122.4 2.5%
2 Important 75 86.2 1.8%
3 Somewhat important 72 80.4 1.6%
4 Not very important 64 77.2 1.6%
5 Not important at all 184 196.4 4.0%
97 No answer 162 171.6 3.5%
98 Not asked 4223 4170.7 85.0%Warning: these figures indicate the number of cases found in the data file. They cannot be interpreted as summary statistics of the population of interest.
# k6_1: Like or dislike party: Christian Democratic Party
Information [Type= discrete] [Format=numeric] [Range= 1-7] [Missing=*]
Statistics [NW/ W] [Valid=4905 / 4905 ] [Invalid=0 / 0 ]
Pre-question We would like you to assess how much you like or dislike the various Norwegian political parties.
Literal question The Christian Democratic Party
Value Label Cases Weighted Percentage (Weighted)
1 Strongly dislike 338 368.1 7.5%
2 Somewhat dislike 571 563.1 11.5%
3 Misliker noe 1084 1064.5 21.7%
4 Neither dislike nor like 1197 1226.6 25.0%
5 Somewhat like 1015 998.8 20.4%
6 Significantly like 365 330.1 6.7%
7 Strongly like 73 69.6 1.4%
97 No answer 262 284.2 5.8%Warning: these figures indicate the number of cases found in the data file. They cannot be interpreted as summary statistics of the population of interest.
# k6_2: Like or dislike party: Conservative Party
Information [Type= discrete] [Format=numeric] [Range= 1-7] [Missing=*]
Statistics [NW/ W] [Valid=4905 / 4905 ] [Invalid=0 / 0 ]
Pre-question We would like you to assess how much you like or dislike the various Norwegian political parties.
Literal question The Conservative Party
Value Label Cases Weighted Percentage (Weighted)
1 Strongly dislike 118 135.9 2.8%
2 Somewhat dislike 375 362.3 7.4%
3 Misliker noe 728 694.9 14.2%
4 Neither dislike nor like 642 655.6 13.4%
5 Somewhat like 1224 1232.2 25.1%

- 29 -
File : Norsk Medborgerpanel runde 1# k6_2: Like or dislike party: Conservative Party
Value Label Cases Weighted Percentage (Weighted)
6 Significantly like 1191 1168.5 23.8%
7 Strongly like 392 393.3 8.0%
97 No answer 235 262.3 5.3%Warning: these figures indicate the number of cases found in the data file. They cannot be interpreted as summary statistics of the population of interest.
# k6_3: Like or dislike party: Progress Party
Information [Type= discrete] [Format=numeric] [Range= 1-7] [Missing=*]
Statistics [NW/ W] [Valid=4905 / 4905 ] [Invalid=0 / 0 ]
Pre-question We would like you to assess how much you like or dislike the various Norwegian political parties.
Literal question The Progress Party
Value Label Cases Weighted Percentage (Weighted)
1 Strongly dislike 1086 982.7 20.0%
2 Somewhat dislike 827 737.3 15.0%
3 Misliker noe 677 655.5 13.4%
4 Neither dislike nor like 484 520.5 10.6%
5 Somewhat like 838 898.0 18.3%
6 Significantly like 515 576.5 11.8%
7 Strongly like 236 271.5 5.5%
97 No answer 242 262.9 5.4%Warning: these figures indicate the number of cases found in the data file. They cannot be interpreted as summary statistics of the population of interest.
# k6_4: Like or dislike party: Liberal Party
Information [Type= discrete] [Format=numeric] [Range= 1-7] [Missing=*]
Statistics [NW/ W] [Valid=4905 / 4905 ] [Invalid=0 / 0 ]
Pre-question We would like you to assess how much you like or dislike the various Norwegian political parties.
Literal question The Liberal Party
Value Label Cases Weighted Percentage (Weighted)
1 Strongly dislike 135 168.5 3.4%
2 Somewhat dislike 296 311.8 6.4%
3 Misliker noe 792 851.7 17.4%
4 Neither dislike nor like 1426 1473.5 30.0%
5 Somewhat like 1320 1224.6 25.0%
6 Significantly like 533 474.9 9.7%
7 Strongly like 125 104.4 2.1%
97 No answer 278 295.7 6.0%Warning: these figures indicate the number of cases found in the data file. They cannot be interpreted as summary statistics of the population of interest.
# k6_5: Like or dislike party: Socialist Left Party
Information [Type= discrete] [Format=numeric] [Range= 1-7] [Missing=*]
Statistics [NW/ W] [Valid=4905 / 4905 ] [Invalid=0 / 0 ]
Pre-question We would like you to assess how much you like or dislike the various Norwegian political parties.
Literal question The Socialist Left Party

- 30 -
File : Norsk Medborgerpanel runde 1# k6_5: Like or dislike party: Socialist Left Party
Value Label Cases Weighted Percentage (Weighted)
1 Strongly dislike 681 709.6 14.5%
2 Somewhat dislike 768 751.2 15.3%
3 Misliker noe 772 785.9 16.0%
4 Neither dislike nor like 982 1058.5 21.6%
5 Somewhat like 832 766.6 15.6%
6 Significantly like 441 386.9 7.9%
7 Strongly like 137 129.1 2.6%
97 No answer 292 317.4 6.5%Warning: these figures indicate the number of cases found in the data file. They cannot be interpreted as summary statistics of the population of interest.
# k6_6: Like or dislike party: Centre Party
Information [Type= discrete] [Format=numeric] [Range= 1-7] [Missing=*]
Statistics [NW/ W] [Valid=4905 / 4905 ] [Invalid=0 / 0 ]
Pre-question We would like you to assess how much you like or dislike the various Norwegian political parties.
Literal question The Centre Party
Value Label Cases Weighted Percentage (Weighted)
1 Strongly dislike 267 272.6 5.6%
2 Somewhat dislike 530 507.5 10.3%
3 Misliker noe 1049 1015.2 20.7%
4 Neither dislike nor like 1559 1601.2 32.6%
5 Somewhat like 917 898.9 18.3%
6 Significantly like 235 233.6 4.8%
7 Strongly like 57 54.9 1.1%
97 No answer 291 321.1 6.5%Warning: these figures indicate the number of cases found in the data file. They cannot be interpreted as summary statistics of the population of interest.
# k6_7: Like or dislike party: Green Party
Information [Type= discrete] [Format=numeric] [Range= 1-7] [Missing=*]
Statistics [NW/ W] [Valid=4905 / 4905 ] [Invalid=0 / 0 ]
Pre-question We would like you to assess how much you like or dislike the various Norwegian political parties.
Literal question The Green Party
Value Label Cases Weighted Percentage (Weighted)
1 Strongly dislike 349 393.7 8.0%
2 Somewhat dislike 391 413.7 8.4%
3 Misliker noe 630 650.8 13.3%
4 Neither dislike nor like 1588 1627.7 33.2%
5 Somewhat like 1041 972.7 19.8%
6 Significantly like 478 407.8 8.3%
7 Strongly like 136 119.8 2.4%
97 No answer 292 318.8 6.5%Warning: these figures indicate the number of cases found in the data file. They cannot be interpreted as summary statistics of the population of interest.
# k6_8: Like or dislike party: Labour Party
Information [Type= discrete] [Format=numeric] [Range= 1-7] [Missing=*]

- 31 -
File : Norsk Medborgerpanel runde 1# k6_8: Like or dislike party: Labour Party
Statistics [NW/ W] [Valid=4905 / 4905 ] [Invalid=0 / 0 ]
Pre-question We would like you to assess how much you like or dislike the various Norwegian political parties.
Literal question The Labour Party
Value Label Cases Weighted Percentage (Weighted)
1 Strongly dislike 209 239.8 4.9%
2 Somewhat dislike 360 347.1 7.1%
3 Misliker noe 670 671.1 13.7%
4 Neither dislike nor like 631 675.0 13.8%
5 Somewhat like 1236 1160.7 23.7%
6 Significantly like 1168 1134.9 23.1%
7 Strongly like 401 434.3 8.9%
97 No answer 230 242.1 4.9%Warning: these figures indicate the number of cases found in the data file. They cannot be interpreted as summary statistics of the population of interest.
# k6_9: Like or dislike party: Red
Information [Type= discrete] [Format=numeric] [Range= 1-7] [Missing=*]
Statistics [NW/ W] [Valid=4905 / 4905 ] [Invalid=0 / 0 ]
Pre-question We would like you to assess how much you like or dislike the various Norwegian political parties.
Literal question Red
Value Label Cases Weighted Percentage (Weighted)
1 Strongly dislike 1076 1095.3 22.3%
2 Somewhat dislike 794 789.2 16.1%
3 Misliker noe 743 747.8 15.2%
4 Neither dislike nor like 1205 1244.4 25.4%
5 Somewhat like 548 509.2 10.4%
6 Significantly like 174 150.8 3.1%
7 Strongly like 69 58.0 1.2%
97 No answer 296 310.2 6.3%Warning: these figures indicate the number of cases found in the data file. They cannot be interpreted as summary statistics of the population of interest.
# k7: Satisfied with new Government
Information [Type= discrete] [Format=numeric] [Range= 1-5] [Missing=*]
Statistics [NW/ W] [Valid=4905 / 4905 ] [Invalid=0 / 0 ]
Literal question How satisfied are you with the new Government of Norway?
Value Label Cases Weighted Percentage (Weighted)
1 Very satisfied 287 293.4 6.0%
2 Satisfied 1564 1573.2 32.1%
3 Somewhat satisfied 1475 1529.1 31.2%
4 Dissatisfied 1035 992.9 20.2%
5 Very dissatisfied 428 397.7 8.1%
97 No answer 116 118.8 2.4%Warning: these figures indicate the number of cases found in the data file. They cannot be interpreted as summary statistics of the population of interest.
# dt19: Anticipated red-green victory
Information [Type= discrete] [Format=numeric] [Range= 1-2] [Missing=*]

- 32 -
File : Norsk Medborgerpanel runde 1# dt19: Anticipated red-green victory
Statistics [NW/ W] [Valid=4905 / 4905 ] [Invalid=0 / 0 ]
Literal question If you consider the period prior to the parliamentary elections in September, did you expect the red-green government tocontinue after the election?
Value Label Cases Weighted Percentage (Weighted)
1 Yes 428 450.5 9.2%
2 No 1952 1895.0 38.6%
97 Not asked 54 59.2 1.2%
98 No answer 2471 2500.4 51.0%Warning: these figures indicate the number of cases found in the data file. They cannot be interpreted as summary statistics of the population of interest.
# dt20: Government colation consided most likely
Information [Type= discrete] [Format=numeric] [Range= 1-8] [Missing=*]
Statistics [NW/ W] [Valid=4905 / 4905 ] [Invalid=0 / 0 ]
Literal question In your opinion, which government did you consider to be most likely?
Value Label Cases Weighted Percentage (Weighted)
1 The Conservative Party 94 105.1 2.1%
2 The Conservative Party and the Progress Party 675 666.1 13.6%
3 The Conservative Party, the Progress Party, theChristian Democratic Party and the Liberal Party
616 573.3 11.7%
4 The Conservative Party, the Progress Party andthe Christian Democratic Party
148 150.4 3.1%
5 The Conservative Party, the Progress Party andthe Liberal Party
171 170.3 3.5%
6 The Conservative Party, the Christian DemocraticParty and the Liberal Party
138 114.5 2.3%
7 The Labour Party 51 53.8 1.1%
8 Other: 20 18.9 0.4%
97 No answer 39 42.7 0.9%
98 Not asked 2953 3010.0 61.4%Warning: these figures indicate the number of cases found in the data file. They cannot be interpreted as summary statistics of the population of interest.
# dt20_8_other: Text: Government colation consided most likely
Information [Type= discrete] [Format=character] [Missing=*]
Statistics [NW/ W] [Valid=4905 /-] [Invalid=0 /-]
Literal question In your opinion, which government did you consider to be most likely?
# dt21: Would vote differently if premonition of outcome
Information [Type= discrete] [Format=numeric] [Range= 1-2] [Missing=*]
Statistics [NW/ W] [Valid=4905 / 4905 ] [Invalid=0 / 0 ]
Literal question Now that you know that a Conservative Party and Progress Party government was the outcome of the election, would youhave changed your vote if you had known this in advance?
Value Label Cases Weighted Percentage (Weighted)
1 Yes 196 198.2 4.0%
2 No 2142 2111.6 43.1%
97 No answer 96 94.8 1.9%
98 Not asked 2471 2500.4 51.0%Warning: these figures indicate the number of cases found in the data file. They cannot be interpreted as summary statistics of the population of interest.

- 33 -
File : Norsk Medborgerpanel runde 1# dt22: Would vote for following party if knowledge of outcome
Information [Type= discrete] [Format=numeric] [Range= 1-9] [Missing=*]
Statistics [NW/ W] [Valid=4905 / 4905 ] [Invalid=0 / 0 ]
Literal question Which party would have voted for if this is the case?
Value Label Cases Weighted Percentage (Weighted)
1 The Christian Democratic Party 10 8.8 0.2%
2 The Conservative Party 17 13.5 0.3%
3 The Progress Party 5 6.8 0.1%
4 The Liberal Party 28 29.5 0.6%
5 The Socialist Left Party 9 9.7 0.2%
6 The Centre Party 8 8.3 0.2%
7 The Green Party 18 14.5 0.3%
8 The Labour Party 96 99.1 2.0%
9 Other: 2 4.1 0.1%
97 No answer 3 4.0 0.1%
98 Not asked 4709 4706.8 96.0%Warning: these figures indicate the number of cases found in the data file. They cannot be interpreted as summary statistics of the population of interest.
# dt22_9_other: Text: Would vote for following party if knowledge of outcome
Information [Type= discrete] [Format=character] [Missing=*]
Statistics [NW/ W] [Valid=4905 /-] [Invalid=0 /-]
Literal question Which party would have voted for if this is the case?
Value Label Cases Percentage
4903 100.0%
apepartiet 1 0.0%
rødt 1 0.0%Warning: these figures indicate the number of cases found in the data file. They cannot be interpreted as summary statistics of the population of interest.
# k8_1: Placement on the political spectrum
Information [Type= discrete] [Format=numeric] [Range= 0-99] [Missing=*]
Statistics [NW/ W] [Valid=4905 / 4905 ] [Invalid=0 / 0 ]
Pre-question In politics one often speaks of the “left wing” and “right wing.” Below is a scale where 0 represents those who are at the farleft politically, while 10 represents those who are at the far right.
Literal question Where would you place yourself on such a scale?
Value Label Cases Weighted Percentage (Weighted)
0 0 Right 88 92.2 1.9%
1 1 127 115.5 2.4%
2 2 351 325.6 6.6%
3 3 629 563.9 11.5%
4 4 503 492.1 10.0%
5 5 683 742.3 15.1%
6 6 649 610.5 12.4%
7 7 716 688.9 14.0%
8 8 485 528.1 10.8%
9 9 183 198.6 4.0%

- 34 -
File : Norsk Medborgerpanel runde 1# k8_1: Placement on the political spectrum
Value Label Cases Weighted Percentage (Weighted)
10 10 Right 162 183.2 3.7%
97 No answer 138 142.8 2.9%
99 No response 191 221.3 4.5%Warning: these figures indicate the number of cases found in the data file. They cannot be interpreted as summary statistics of the population of interest.
# k9_1: 1. Text: Political issue with personal importance [anonymised]
Information [Type= discrete] [Format=character] [Missing=*]
Statistics [NW/ W] [Valid=0 /-] [Invalid=0 /-]
Literal question What are the most important political issues or areas for you personally?[anonymised: Data withheld for the sake of anonymity]
Interviewer's instructions Please list the three most important issues where 1 is the most important, 2 the second most important and 3 is the third mostimportant.
Value Label Cases Percentage
97 No answerWarning: these figures indicate the number of cases found in the data file. They cannot be interpreted as summary statistics of the population of interest.
# k9_2: 2. Text: Political issue with personal importance [anonymised]
Information [Type= discrete] [Format=character] [Missing=*]
Statistics [NW/ W] [Valid=0 /-] [Invalid=0 /-]
Literal question What are the most important political issues or areas for you personally?[anonymised: Data withheld for the sake of anonymity]
Interviewer's instructions Please list the three most important issues where 1 is the most important, 2 the second most important and 3 is the third mostimportant.
Value Label Cases Percentage
97 No answerWarning: these figures indicate the number of cases found in the data file. They cannot be interpreted as summary statistics of the population of interest.
# k9_3: 3. Text: Political issue with personal importance [anonymised]
Information [Type= discrete] [Format=character] [Missing=*]
Statistics [NW/ W] [Valid=0 /-] [Invalid=0 /-]
Literal question What are the most important political issues or areas for you personally?[anonymised: Data withheld for the sake of anonymity]
Interviewer's instructions Please list the three most important issues where 1 is the most important, 2 the second most important and 3 is the third mostimportant.
Value Label Cases Percentage
97 No answerWarning: these figures indicate the number of cases found in the data file. They cannot be interpreted as summary statistics of the population of interest.
# dt16_1: Place party on political spectrum: Christian Democractic Party
Information [Type= discrete] [Format=numeric] [Range= 0-99] [Missing=*]
Statistics [NW/ W] [Valid=4905 / 4905 ] [Invalid=0 / 0 ]
Pre-question In politics there is often talk of the left and right wings. Where would you place the following parties on a scale, where 0indicates farthest to the left and 10 indicates farthest to the right?
Literal question The Christian Democratic Party
Value Label Cases Weighted Percentage (Weighted)
0 0 Right 28 32.6 0.7%

- 35 -
File : Norsk Medborgerpanel runde 1# dt16_1: Place party on political spectrum: Christian Democractic Party
Value Label Cases Weighted Percentage (Weighted)
1 1 41 46.4 0.9%
2 2 83 105.1 2.1%
3 3 171 197.1 4.0%
4 4 367 361.5 7.4%
5 5 1000 989.4 20.2%
6 6 1048 948.3 19.3%
7 7 738 701.2 14.3%
8 8 352 323.2 6.6%
9 9 119 116.3 2.4%
10 10 Right 63 65.8 1.3%
97 No answer 895 1018.2 20.8%Warning: these figures indicate the number of cases found in the data file. They cannot be interpreted as summary statistics of the population of interest.
# dt16_2: Place party on political spectrum: Conservative Party
Information [Type= discrete] [Format=numeric] [Range= 0-99] [Missing=*]
Statistics [NW/ W] [Valid=4905 / 4905 ] [Invalid=0 / 0 ]
Pre-question In politics there is often talk of the left and right wings. Where would you place the following parties on a scale, where 0indicates farthest to the left and 10 indicates farthest to the right?
Literal question The Conservative Party
Value Label Cases Weighted Percentage (Weighted)
0 0 Right 6 8.0 0.2%
1 1 10 11.6 0.2%
2 2 14 15.6 0.3%
3 3 15 23.2 0.5%
4 4 31 34.3 0.7%
5 5 81 89.2 1.8%
6 6 167 157.0 3.2%
7 7 630 551.4 11.2%
8 8 1254 1096.8 22.4%
9 9 1157 1131.1 23.1%
10 10 Right 730 864.8 17.6%
97 No answer 810 922.1 18.8%Warning: these figures indicate the number of cases found in the data file. They cannot be interpreted as summary statistics of the population of interest.
# dt16_3: Place party on political spectrum: Progress Party
Information [Type= discrete] [Format=numeric] [Range= 0-99] [Missing=*]
Statistics [NW/ W] [Valid=4905 / 4905 ] [Invalid=0 / 0 ]
Pre-question In politics there is often talk of the left and right wings. Where would you place the following parties on a scale, where 0indicates farthest to the left and 10 indicates farthest to the right?
Literal question The Progress Party
Value Label Cases Weighted Percentage (Weighted)
0 0 Right 16 20.9 0.4%
1 1 18 19.2 0.4%
2 2 15 21.8 0.4%

- 36 -
File : Norsk Medborgerpanel runde 1# dt16_3: Place party on political spectrum: Progress Party
Value Label Cases Weighted Percentage (Weighted)
3 3 27 34.0 0.7%
4 4 36 51.9 1.1%
5 5 89 87.0 1.8%
6 6 70 70.6 1.4%
7 7 193 179.5 3.7%
8 8 499 503.5 10.3%
9 9 1033 995.0 20.3%
10 10 Right 2075 1973.2 40.2%
97 No answer 834 948.3 19.3%Warning: these figures indicate the number of cases found in the data file. They cannot be interpreted as summary statistics of the population of interest.
# dt16_4: Place party on political spectrum: Liberal Party
Information [Type= discrete] [Format=numeric] [Range= 0-99] [Missing=*]
Statistics [NW/ W] [Valid=4905 / 4905 ] [Invalid=0 / 0 ]
Pre-question In politics there is often talk of the left and right wings. Where would you place the following parties on a scale, where 0indicates farthest to the left and 10 indicates farthest to the right?
Literal question The Liberal Party
Value Label Cases Weighted Percentage (Weighted)
0 0 Right 327 394.7 8.0%
1 1 217 260.6 5.3%
2 2 247 253.3 5.2%
3 3 307 319.6 6.5%
4 4 466 445.4 9.1%
5 5 839 761.0 15.5%
6 6 891 804.8 16.4%
7 7 502 445.3 9.1%
8 8 178 169.2 3.5%
9 9 40 41.5 0.8%
10 10 Right 21 21.0 0.4%
97 No answer 870 988.8 20.2%Warning: these figures indicate the number of cases found in the data file. They cannot be interpreted as summary statistics of the population of interest.
# dt16_5: Place party on political spectrum: Socialist Left Party
Information [Type= discrete] [Format=numeric] [Range= 0-99] [Missing=*]
Statistics [NW/ W] [Valid=4905 / 4905 ] [Invalid=0 / 0 ]
Pre-question In politics there is often talk of the left and right wings. Where would you place the following parties on a scale, where 0indicates farthest to the left and 10 indicates farthest to the right?
Literal question The Socialist Left Party
Value Label Cases Weighted Percentage (Weighted)
0 0 Right 716 756.7 15.4%
1 1 1340 1251.1 25.5%
2 2 1139 1069.1 21.8%
3 3 509 472.0 9.6%
4 4 164 162.7 3.3%

- 37 -
File : Norsk Medborgerpanel runde 1# dt16_5: Place party on political spectrum: Socialist Left Party
Value Label Cases Weighted Percentage (Weighted)
5 5 89 109.6 2.2%
6 6 23 21.4 0.4%
7 7 13 20.6 0.4%
8 8 6 6.6 0.1%
9 9 12 13.9 0.3%
10 10 Right 8 8.0 0.2%
97 No answer 886 1013.2 20.7%Warning: these figures indicate the number of cases found in the data file. They cannot be interpreted as summary statistics of the population of interest.
# dt16_6: Place party on political spectrum: Centre Party
Information [Type= discrete] [Format=numeric] [Range= 0-99] [Missing=*]
Statistics [NW/ W] [Valid=4905 / 4905 ] [Invalid=0 / 0 ]
Pre-question In politics there is often talk of the left and right wings. Where would you place the following parties on a scale, where 0indicates farthest to the left and 10 indicates farthest to the right?
Literal question The Centre Party
Value Label Cases Weighted Percentage (Weighted)
0 0 Right 65 70.6 1.4%
1 1 113 136.4 2.8%
2 2 299 310.3 6.3%
3 3 560 554.5 11.3%
4 4 1058 1036.2 21.1%
5 5 1176 1098.3 22.4%
6 6 442 390.9 8.0%
7 7 159 160.0 3.3%
8 8 60 57.7 1.2%
9 9 20 19.9 0.4%
10 10 Right 7 8.7 0.2%
97 No answer 946 1061.5 21.6%Warning: these figures indicate the number of cases found in the data file. They cannot be interpreted as summary statistics of the population of interest.
# dt16_7: Place party on political spectrum: Green Party
Information [Type= discrete] [Format=numeric] [Range= 0-99] [Missing=*]
Statistics [NW/ W] [Valid=4905 / 4905 ] [Invalid=0 / 0 ]
Pre-question In politics there is often talk of the left and right wings. Where would you place the following parties on a scale, where 0indicates farthest to the left and 10 indicates farthest to the right?
Literal question The Green Party
Value Label Cases Weighted Percentage (Weighted)
0 0 Right 306 344.0 7.0%
1 1 427 434.4 8.9%
2 2 662 610.5 12.4%
3 3 675 632.6 12.9%
4 4 677 636.7 13.0%
5 5 694 668.3 13.6%
6 6 169 152.8 3.1%

- 38 -
File : Norsk Medborgerpanel runde 1# dt16_7: Place party on political spectrum: Green Party
Value Label Cases Weighted Percentage (Weighted)
7 7 62 59.0 1.2%
8 8 20 21.8 0.4%
9 9 10 16.8 0.3%
10 10 Right 12 15.1 0.3%
97 No answer 1191 1313.1 26.8%Warning: these figures indicate the number of cases found in the data file. They cannot be interpreted as summary statistics of the population of interest.
# dt16_8: Place party on political spectrum: Labour Party
Information [Type= discrete] [Format=numeric] [Range= 0-99] [Missing=*]
Statistics [NW/ W] [Valid=4905 / 4905 ] [Invalid=0 / 0 ]
Pre-question In politics there is often talk of the left and right wings. Where would you place the following parties on a scale, where 0indicates farthest to the left and 10 indicates farthest to the right?
Literal question The Labour Party
Value Label Cases Weighted Percentage (Weighted)
0 0 Right 138 191.3 3.9%
1 1 264 313.2 6.4%
2 2 612 589.2 12.0%
3 3 996 926.5 18.9%
4 4 926 816.3 16.6%
5 5 653 638.8 13.0%
6 6 268 234.5 4.8%
7 7 101 102.7 2.1%
8 8 42 49.6 1.0%
9 9 25 29.9 0.6%
10 10 Right 24 31.6 0.6%
97 No answer 856 981.4 20.0%Warning: these figures indicate the number of cases found in the data file. They cannot be interpreted as summary statistics of the population of interest.
# dt16_9: Place party on political spectrum: Red
Information [Type= discrete] [Format=numeric] [Range= 0-99] [Missing=*]
Statistics [NW/ W] [Valid=4905 / 4905 ] [Invalid=0 / 0 ]
Pre-question In politics there is often talk of the left and right wings. Where would you place the following parties on a scale, where 0indicates farthest to the left and 10 indicates farthest to the right?
Literal question Red
Value Label Cases Weighted Percentage (Weighted)
0 0 Right 2508 2313.8 47.2%
1 1 728 685.8 14.0%
2 2 256 278.7 5.7%
3 3 100 112.7 2.3%
4 4 76 97.0 2.0%
5 5 89 105.7 2.2%
6 6 29 37.4 0.8%
7 7 21 27.1 0.6%
8 8 17 28.2 0.6%

- 39 -
File : Norsk Medborgerpanel runde 1# dt16_9: Place party on political spectrum: Red
Value Label Cases Weighted Percentage (Weighted)
9 9 15 18.0 0.4%
10 10 Right 19 28.7 0.6%
97 No answer 1047 1171.9 23.9%Warning: these figures indicate the number of cases found in the data file. They cannot be interpreted as summary statistics of the population of interest.
# k10: Perception of current economic situation
Information [Type= discrete] [Format=numeric] [Range= 1-7] [Missing=*]
Statistics [NW/ W] [Valid=4905 / 4905 ] [Invalid=0 / 0 ]
Literal question How do you perceive the current economic situation in Norway? Do you believe it is:
Value Label Cases Weighted Percentage (Weighted)
1 Very good 1832 1670.2 34.1%
2 Good 2178 2198.3 44.8%
3 Somewhat good 453 513.9 10.5%
4 Neither good nor poor 157 187.6 3.8%
5 Somewhat poor 101 131.4 2.7%
6 Poor 34 42.9 0.9%
7 Very poor 10 20.1 0.4%
97 No answer 140 140.6 2.9%Warning: these figures indicate the number of cases found in the data file. They cannot be interpreted as summary statistics of the population of interest.
# k11: Satisfaction with the Norwegian democracy
Information [Type= discrete] [Format=numeric] [Range= 1-5] [Missing=*]
Statistics [NW/ W] [Valid=4905 / 4905 ] [Invalid=0 / 0 ]
Literal question All things considered, how satisfied are you with the way democracy works in Norway?
Value Label Cases Weighted Percentage (Weighted)
1 Very satisfied 858 792.8 16.2%
2 Satisfied 2757 2725.0 55.6%
3 Somewhat satisfied 894 936.0 19.1%
4 Dissatisfied 188 225.7 4.6%
5 Very dissatisfied 43 54.5 1.1%
97 No answer 165 171.0 3.5%Warning: these figures indicate the number of cases found in the data file. They cannot be interpreted as summary statistics of the population of interest.
# k12_1: Trust in institution or player: Government
Information [Type= discrete] [Format=numeric] [Range= 1-8] [Missing=*]
Statistics [NW/ W] [Valid=4905 / 4905 ] [Invalid=0 / 0 ]
Pre-question Which level of confidence do you have to the following institutions and players?
Literal question The Government
Value Label Cases Weighted Percentage (Weighted)
1 Very high confidence 136 136.5 2.8%
2 High confidence 1410 1338.0 27.3%
3 Some confidence 1493 1459.5 29.8%
4 Neither confidence nor mistrust 613 667.1 13.6%
5 Some mistrust 545 551.5 11.2%

- 40 -
File : Norsk Medborgerpanel runde 1# k12_1: Trust in institution or player: Government
Value Label Cases Weighted Percentage (Weighted)
6 High mistrust 223 232.5 4.7%
7 Very high mistrust 90 100.6 2.1%
8 Don't know 92 104.8 2.1%
97 No answer 303 314.5 6.4%Warning: these figures indicate the number of cases found in the data file. They cannot be interpreted as summary statistics of the population of interest.
# k12_2: Trust in institution or player: Parliament
Information [Type= discrete] [Format=numeric] [Range= 1-8] [Missing=*]
Statistics [NW/ W] [Valid=4905 / 4905 ] [Invalid=0 / 0 ]
Pre-question Which level of confidence do you have to the following institutions and players?
Literal question Parliament
Value Label Cases Weighted Percentage (Weighted)
1 Very high confidence 256 243.0 5.0%
2 High confidence 1752 1565.9 31.9%
3 Some confidence 1446 1468.6 29.9%
4 Neither confidence nor mistrust 568 639.6 13.0%
5 Some mistrust 340 375.1 7.6%
6 High mistrust 102 125.7 2.6%
7 Very high mistrust 42 54.5 1.1%
8 Don't know 92 105.9 2.2%
97 No answer 307 326.7 6.7%Warning: these figures indicate the number of cases found in the data file. They cannot be interpreted as summary statistics of the population of interest.
# k12_3: Trust in institution or player: Politicians
Information [Type= discrete] [Format=numeric] [Range= 1-8] [Missing=*]
Statistics [NW/ W] [Valid=4905 / 4905 ] [Invalid=0 / 0 ]
Pre-question Which level of confidence do you have to the following institutions and players?
Literal question Politicians
Value Label Cases Weighted Percentage (Weighted)
1 Very high confidence 31 36.6 0.7%
2 High confidence 438 390.3 8.0%
3 Some confidence 1660 1585.0 32.3%
4 Neither confidence nor mistrust 827 845.9 17.2%
5 Some mistrust 1027 1065.7 21.7%
6 High mistrust 353 369.9 7.5%
7 Very high mistrust 170 190.2 3.9%
8 Don't know 85 95.5 1.9%
97 No answer 314 325.9 6.6%Warning: these figures indicate the number of cases found in the data file. They cannot be interpreted as summary statistics of the population of interest.
# k12_4: Trust in institution or player: Parties
Information [Type= discrete] [Format=numeric] [Range= 1-8] [Missing=*]
Statistics [NW/ W] [Valid=4905 / 4905 ] [Invalid=0 / 0 ]
Pre-question Which level of confidence do you have to the following institutions and players?

- 41 -
File : Norsk Medborgerpanel runde 1# k12_4: Trust in institution or player: Parties
Literal question Parties
Value Label Cases Weighted Percentage (Weighted)
1 Very high confidence 28 28.3 0.6%
2 High confidence 379 356.4 7.3%
3 Some confidence 1722 1674.5 34.1%
4 Neither confidence nor mistrust 1079 1056.4 21.5%
5 Some mistrust 887 899.7 18.3%
6 High mistrust 208 227.5 4.6%
7 Very high mistrust 59 62.4 1.3%
8 Don't know 190 223.4 4.6%
97 No answer 353 376.2 7.7%Warning: these figures indicate the number of cases found in the data file. They cannot be interpreted as summary statistics of the population of interest.
# k12_5: Trust in institution or player: The Sameting
Information [Type= discrete] [Format=numeric] [Range= 1-8] [Missing=*]
Statistics [NW/ W] [Valid=4905 / 4905 ] [Invalid=0 / 0 ]
Pre-question Which level of confidence do you have to the following institutions and players?
Literal question The Sameting
Value Label Cases Weighted Percentage (Weighted)
1 Very high confidence 44 59.0 1.2%
2 High confidence 228 193.3 3.9%
3 Some confidence 357 351.9 7.2%
4 Neither confidence nor mistrust 1488 1500.8 30.6%
5 Some mistrust 267 261.8 5.3%
6 High mistrust 192 201.0 4.1%
7 Very high mistrust 179 192.7 3.9%
8 Don't know 1796 1766.9 36.0%
97 No answer 354 377.5 7.7%Warning: these figures indicate the number of cases found in the data file. They cannot be interpreted as summary statistics of the population of interest.
# k12_6: Trust in institution or player: The County Council
Information [Type= discrete] [Format=numeric] [Range= 1-8] [Missing=*]
Statistics [NW/ W] [Valid=4905 / 4905 ] [Invalid=0 / 0 ]
Pre-question Which level of confidence do you have to the following institutions and players?
Literal question The County Council
Value Label Cases Weighted Percentage (Weighted)
1 Very high confidence 33 33.8 0.7%
2 High confidence 435 396.4 8.1%
3 Some confidence 1122 1101.4 22.5%
4 Neither confidence nor mistrust 1404 1408.1 28.7%
5 Some mistrust 589 595.0 12.1%
6 High mistrust 234 262.9 5.4%
7 Very high mistrust 153 174.4 3.6%
8 Don't know 588 574.3 11.7%

- 42 -
File : Norsk Medborgerpanel runde 1# k12_6: Trust in institution or player: The County Council
Value Label Cases Weighted Percentage (Weighted)
97 No answer 347 358.6 7.3%Warning: these figures indicate the number of cases found in the data file. They cannot be interpreted as summary statistics of the population of interest.
# k12_7: Trust in institution or player: The Municipal Council
Information [Type= discrete] [Format=numeric] [Range= 1-8] [Missing=*]
Statistics [NW/ W] [Valid=4905 / 4905 ] [Invalid=0 / 0 ]
Pre-question Which level of confidence do you have to the following institutions and players?
Literal question The municipal council
Value Label Cases Weighted Percentage (Weighted)
1 Very high confidence 46 47.9 1.0%
2 High confidence 739 676.0 13.8%
3 Some confidence 1676 1650.0 33.6%
4 Neither confidence nor mistrust 854 879.0 17.9%
5 Some mistrust 745 736.1 15.0%
6 High mistrust 243 266.2 5.4%
7 Very high mistrust 110 132.0 2.7%
8 Don't know 183 193.0 3.9%
97 No answer 309 324.7 6.6%Warning: these figures indicate the number of cases found in the data file. They cannot be interpreted as summary statistics of the population of interest.

- 43 -
# k12_8: Trust in institution or player: EU
Information [Type= discrete] [Format=numeric] [Range= 1-8] [Missing=*]
Statistics [NW/ W] [Valid=4905 / 4905 ] [Invalid=0 / 0 ]
Pre-question Which level of confidence do you have to the following institutions and players?
Literal question The EU
Value Label Cases Weighted Percentage (Weighted)
1 Very high confidence 62 63.4 1.3%
2 High confidence 425 367.7 7.5%
3 Some confidence 1112 1021.8 20.8%
4 Neither confidence nor mistrust 1003 1023.0 20.9%
5 Some mistrust 855 815.0 16.6%
6 High mistrust 555 593.1 12.1%
7 Very high mistrust 374 439.6 9.0%
8 Don't know 205 246.7 5.0%
97 No answer 314 334.8 6.8%Warning: these figures indicate the number of cases found in the data file. They cannot be interpreted as summary statistics of the population of interest.
# k12_9: Trust in institution or player: UN
Information [Type= discrete] [Format=numeric] [Range= 1-8] [Missing=*]
Statistics [NW/ W] [Valid=4905 / 4905 ] [Invalid=0 / 0 ]
Pre-question Which level of confidence do you have to the following institutions and players?
Literal question The UN
Value Label Cases Weighted Percentage (Weighted)
1 Very high confidence 324 335.9 6.8%
2 High confidence 1497 1386.5 28.3%
3 Some confidence 1356 1331.3 27.1%
4 Neither confidence nor mistrust 703 741.6 15.1%
5 Some mistrust 320 324.9 6.6%
6 High mistrust 126 145.4 3.0%
7 Very high mistrust 74 79.4 1.6%
8 Don't know 185 225.1 4.6%
97 No answer 320 334.8 6.8%Warning: these figures indicate the number of cases found in the data file. They cannot be interpreted as summary statistics of the population of interest.
# dt5_1: Trust in institution or player: Courts
Information [Type= discrete] [Format=numeric] [Range= 1-8] [Missing=*]
Statistics [NW/ W] [Valid=4905 / 4905 ] [Invalid=0 / 0 ]
Pre-question Which level of confidence do you have to the following institutions and players?
Literal question The Courts/Judiciary
Value Label Cases Weighted Percentage (Weighted)
1 Very high confidence 644 566.9 11.6%
2 High confidence 2124 1974.4 40.3%
3 Some confidence 962 1019.5 20.8%
4 Neither confidence nor mistrust 399 450.9 9.2%
5 Some mistrust 287 328.5 6.7%
6 High mistrust 85 114.6 2.3%

- 44 -
# dt5_1: Trust in institution or player: Courts
Value Label Cases Weighted Percentage (Weighted)
7 Very high mistrust 61 74.2 1.5%
8 Don't know 101 128.9 2.6%
97 No answer 242 247.2 5.0%Warning: these figures indicate the number of cases found in the data file. They cannot be interpreted as summary statistics of the population of interest.
# dt5_2: Trust in institution or player: Police
Information [Type= discrete] [Format=numeric] [Range= 1-8] [Missing=*]
Statistics [NW/ W] [Valid=4905 / 4905 ] [Invalid=0 / 0 ]
Pre-question Which level of confidence do you have to the following institutions and players?
Literal question The Police
Value Label Cases Weighted Percentage (Weighted)
1 Very high confidence 311 308.0 6.3%
2 High confidence 1884 1771.2 36.1%
3 Some confidence 1360 1361.3 27.8%
4 Neither confidence nor mistrust 385 404.4 8.2%
5 Some mistrust 434 468.1 9.5%
6 High mistrust 174 188.3 3.8%
7 Very high mistrust 96 119.9 2.4%
8 Don't know 34 47.0 1.0%
97 No answer 227 237.0 4.8%Warning: these figures indicate the number of cases found in the data file. They cannot be interpreted as summary statistics of the population of interest.
# dt5_3: Trust in institution or player: Media
Information [Type= discrete] [Format=numeric] [Range= 1-8] [Missing=*]
Statistics [NW/ W] [Valid=4905 / 4905 ] [Invalid=0 / 0 ]
Pre-question Which level of confidence do you have to the following institutions and players?
Literal question Media
Value Label Cases Weighted Percentage (Weighted)
1 Very high confidence 32 35.9 0.7%
2 High confidence 327 336.9 6.9%
3 Some confidence 1264 1236.3 25.2%
4 Neither confidence nor mistrust 927 970.4 19.8%
5 Some mistrust 1313 1284.2 26.2%
6 High mistrust 552 506.6 10.3%
7 Very high mistrust 211 229.5 4.7%
8 Don't know 44 61.0 1.2%
97 No answer 235 244.1 5.0%Warning: these figures indicate the number of cases found in the data file. They cannot be interpreted as summary statistics of the population of interest.
# dt5_4: Trust in institution or player: Scientists
Information [Type= discrete] [Format=numeric] [Range= 1-8] [Missing=*]
Statistics [NW/ W] [Valid=4905 / 4905 ] [Invalid=0 / 0 ]
Pre-question Which level of confidence do you have to the following institutions and players?
Literal question Scientists

- 45 -
# dt5_4: Trust in institution or player: Scientists
Value Label Cases Weighted Percentage (Weighted)
1 Very high confidence 351 349.9 7.1%
2 High confidence 1813 1741.1 35.5%
3 Some confidence 1398 1358.0 27.7%
4 Neither confidence nor mistrust 651 697.3 14.2%
5 Some mistrust 239 238.3 4.9%
6 High mistrust 53 66.2 1.3%
7 Very high mistrust 31 36.9 0.8%
8 Don't know 114 149.4 3.0%
97 No answer 255 267.9 5.5%Warning: these figures indicate the number of cases found in the data file. They cannot be interpreted as summary statistics of the population of interest.
# dt5_5: Trust in institution or player: NAV
Information [Type= discrete] [Format=numeric] [Range= 1-8] [Missing=*]
Statistics [NW/ W] [Valid=4905 / 4905 ] [Invalid=0 / 0 ]
Pre-question Which level of confidence do you have to the following institutions and players?
Literal question NAV
Value Label Cases Weighted Percentage (Weighted)
1 Very high confidence 59 63.3 1.3%
2 High confidence 495 491.7 10.0%
3 Some confidence 1282 1219.9 24.9%
4 Neither confidence nor mistrust 880 859.8 17.5%
5 Some mistrust 901 864.2 17.6%
6 High mistrust 504 531.4 10.8%
7 Very high mistrust 409 478.9 9.8%
8 Don't know 146 158.7 3.2%
97 No answer 229 237.1 4.8%Warning: these figures indicate the number of cases found in the data file. They cannot be interpreted as summary statistics of the population of interest.
# dt5_6: Trust in institution or player: The banking sector
Information [Type= discrete] [Format=numeric] [Range= 1-8] [Missing=*]
Statistics [NW/ W] [Valid=4905 / 4905 ] [Invalid=0 / 0 ]
Pre-question Which level of confidence do you have to the following institutions and players?
Literal question The banking sector
Value Label Cases Weighted Percentage (Weighted)
1 Very high confidence 143 156.8 3.2%
2 High confidence 1286 1275.6 26.0%
3 Some confidence 1357 1332.9 27.2%
4 Neither confidence nor mistrust 787 819.2 16.7%
5 Some mistrust 685 640.3 13.1%
6 High mistrust 227 231.1 4.7%
7 Very high mistrust 100 96.8 2.0%
8 Don't know 80 103.2 2.1%
97 No answer 240 249.2 5.1%Warning: these figures indicate the number of cases found in the data file. They cannot be interpreted as summary statistics of the population of interest.

- 46 -
# dt5_7: Trust in institution or player: The health services
Information [Type= discrete] [Format=numeric] [Range= 1-8] [Missing=*]
Statistics [NW/ W] [Valid=4905 / 4905 ] [Invalid=0 / 0 ]
Pre-question Which level of confidence do you have to the following institutions and players?
Literal question The health services
Value Label Cases Weighted Percentage (Weighted)
1 Very high confidence 206 203.2 4.1%
2 High confidence 1730 1594.9 32.5%
3 Some confidence 1529 1526.0 31.1%
4 Neither confidence nor mistrust 358 404.6 8.2%
5 Some mistrust 566 591.2 12.1%
6 High mistrust 189 222.1 4.5%
7 Very high mistrust 76 91.4 1.9%
8 Don't know 26 38.1 0.8%
97 No answer 225 233.4 4.8%Warning: these figures indicate the number of cases found in the data file. They cannot be interpreted as summary statistics of the population of interest.
# k31_1: Statement: The state should reduce income inequality
Information [Type= discrete] [Format=numeric] [Range= 1-7] [Missing=*]
Statistics [NW/ W] [Valid=4905 / 4905 ] [Invalid=0 / 0 ]
Pre-question Consider the statements below. To which extent do you agree or disagree with them?
Literal question The state should contribute to reducing inequalities in income in society
Value Label Cases Weighted Percentage (Weighted)
1 Strongly agree 867 888.9 18.1%
2 Agree 1152 1143.5 23.3%
3 Agree somewhat 1205 1171.7 23.9%
4 Neither agree nor disagree 459 504.7 10.3%
5 Disagree somewhat 497 476.3 9.7%
6 Disagree 375 364.6 7.4%
7 Strongly disagree 151 157.2 3.2%
97 No answer 199 198.1 4.0%Warning: these figures indicate the number of cases found in the data file. They cannot be interpreted as summary statistics of the population of interest.
# k31_2: Statement: Better with diversity of religions
Information [Type= discrete] [Format=numeric] [Range= 1-7] [Missing=*]
Statistics [NW/ W] [Valid=4905 / 4905 ] [Invalid=0 / 0 ]
Pre-question Consider the statements below. To which extent do you agree or disagree with them?
Literal question It is better for a country if there is a diversity of different religions and views on life.
Value Label Cases Weighted Percentage (Weighted)
1 Strongly agree 462 412.6 8.4%
2 Agree 957 849.3 17.3%
3 Agree somewhat 1001 977.9 19.9%
4 Neither agree nor disagree 645 661.6 13.5%
5 Disagree somewhat 730 741.2 15.1%
6 Disagree 542 631.7 12.9%
7 Strongly disagree 366 424.1 8.6%

- 47 -
# k31_2: Statement: Better with diversity of religions
Value Label Cases Weighted Percentage (Weighted)
97 No answer 202 206.6 4.2%Warning: these figures indicate the number of cases found in the data file. They cannot be interpreted as summary statistics of the population of interest.
# k31_3: Statement: Emission reductions should be made abroad
Information [Type= discrete] [Format=numeric] [Range= 1-7] [Missing=*]
Statistics [NW/ W] [Valid=4905 / 4905 ] [Invalid=0 / 0 ]
Pre-question Consider the statements below. To which extent do you agree or disagree with them?
Literal question Most of the emission reductions Norway is committed to should be made abroad.
Value Label Cases Weighted Percentage (Weighted)
1 Strongly agree 175 192.9 3.9%
2 Agree 388 431.1 8.8%
3 Agree somewhat 611 648.1 13.2%
4 Neither agree nor disagree 1389 1469.1 30.0%
5 Disagree somewhat 788 744.6 15.2%
6 Disagree 868 785.6 16.0%
7 Strongly disagree 446 383.5 7.8%
97 No answer 240 250.1 5.1%Warning: these figures indicate the number of cases found in the data file. They cannot be interpreted as summary statistics of the population of interest.
# k14_1: Statement: Politics is complicated
Information [Type= discrete] [Format=numeric] [Range= 1-7] [Missing=*]
Statistics [NW/ W] [Valid=4905 / 4905 ] [Invalid=0 / 0 ]
Pre-question Consider the statements below. To which extent do you agree or disagree with them?
Literal question Sometimes politics is so complicated that people like me have no understanding of what it's about.
Value Label Cases Weighted Percentage (Weighted)
1 Strongly agree 275 350.8 7.2%
2 Agree 665 800.3 16.3%
3 Agree somewhat 1340 1392.0 28.4%
4 Neither agree nor disagree 444 474.4 9.7%
5 Disagree somewhat 697 649.9 13.3%
6 Disagree 947 777.7 15.9%
7 Strongly disagree 339 257.5 5.3%
97 No answer 198 202.3 4.1%Warning: these figures indicate the number of cases found in the data file. They cannot be interpreted as summary statistics of the population of interest.
# k14_2: Statement: Can vote, not much else to influence
Information [Type= discrete] [Format=numeric] [Range= 1-7] [Missing=*]
Statistics [NW/ W] [Valid=4905 / 4905 ] [Invalid=0 / 0 ]
Pre-question Consider the statements below. To which extent do you agree or disagree with them?
Literal question People like me can vote, but there is nothing else we can do to influence politics.
Value Label Cases Weighted Percentage (Weighted)
1 Strongly agree 278 373.7 7.6%
2 Agree 640 788.9 16.1%
3 Agree somewhat 759 791.5 16.1%
4 Neither agree nor disagree 354 379.1 7.7%

- 48 -
# k14_2: Statement: Can vote, not much else to influence
Value Label Cases Weighted Percentage (Weighted)
5 Disagree somewhat 984 962.9 19.6%
6 Disagree 1184 989.9 20.2%
7 Strongly disagree 501 413.3 8.4%
97 No answer 205 205.8 4.2%Warning: these figures indicate the number of cases found in the data file. They cannot be interpreted as summary statistics of the population of interest.
# k15_99: Trust people
Information [Type= discrete] [Format=numeric] [Range= 0-97] [Missing=*]
Statistics [NW/ W] [Valid=4905 / 4905 ] [Invalid=0 / 0 ]
Pre-question Now to a more general question:
Literal question Would you agree that most people in general can be trusted, or do you believe that one can't be careful enough when dealingwith others?
Interviewer's instructions 0 means “Can't be careful enough” and 10 means “Most people can be trusted.”
Value Label Cases Weighted Percentage (Weighted)
0 0 - Can't be careful enough 79 97.4 2.0%
1 1 60 77.9 1.6%
2 2 122 151.6 3.1%
3 3 223 242.5 4.9%
4 4 266 286.1 5.8%
5 5 527 601.1 12.3%
6 6 516 506.3 10.3%
7 7 1079 1014.2 20.7%
8 8 961 906.8 18.5%
9 9 435 383.7 7.8%
10 10 - Most people can be trusted 409 398.8 8.1%
97 Ikke svart 228 238.6 4.9%Warning: these figures indicate the number of cases found in the data file. They cannot be interpreted as summary statistics of the population of interest.
# k16_1: Has an opinion on most issues
Information [Type= discrete] [Format=numeric] [Range= 1-7] [Missing=*]
Statistics [NW/ W] [Valid=4905 / 4905 ] [Invalid=0 / 0 ]
Pre-question How do the following statements apply to you as a person?
Literal question I have an opinion on most things
Value Label Cases Weighted Percentage (Weighted)
1 Apply very well 525 561.7 11.5%
2 Apply well 1776 1739.5 35.5%
3 Apply somewhat well 1610 1607.3 32.8%
4 Apply neither well nor poorly 457 460.4 9.4%
5 Apply somewhat poorly 261 253.0 5.2%
6 Apply poorly 85 85.0 1.7%
7 Apply very poorly 6 8.5 0.2%
97 No answer 185 189.6 3.9%Warning: these figures indicate the number of cases found in the data file. They cannot be interpreted as summary statistics of the population of interest.
# k16_2: Strong opinions, also regarding new issues
Information [Type= discrete] [Format=numeric] [Range= 1-7] [Missing=*]

- 49 -
# k16_2: Strong opinions, also regarding new issues
Statistics [NW/ W] [Valid=4905 / 4905 ] [Invalid=0 / 0 ]
Pre-question How do the following statements apply to you as a person?
Literal question I have strong opinions, either positive or negative, including on issues that are new to me
Value Label Cases Weighted Percentage (Weighted)
1 Apply very well 191 253.4 5.2%
2 Apply well 749 845.2 17.2%
3 Apply somewhat well 1335 1312.6 26.8%
4 Apply neither well nor poorly 1055 1064.2 21.7%
5 Apply somewhat poorly 787 690.5 14.1%
6 Apply poorly 453 397.9 8.1%
7 Apply very poorly 104 97.1 2.0%
97 No answer 231 244.0 5.0%Warning: these figures indicate the number of cases found in the data file. They cannot be interpreted as summary statistics of the population of interest.
# ran1: Randomizes independently from U
Information [Type= discrete] [Format=numeric] [Range= 1-3] [Missing=*]
Statistics [NW/ W] [Valid=4780 /-] [Invalid=125 /-]
Pre-question Randomizes into three groups and selects one of the following questions: KM1, KM2, KM3
Value Label Cases Percentage
1 1607 33.6%
2 1601 33.5%
3 1572 32.9%
Sysmiss 125Warning: these figures indicate the number of cases found in the data file. They cannot be interpreted as summary statistics of the population of interest.
# km1: Heard the argument: Climate change a threat, but we should continue to extract oil as usual
Information [Type= discrete] [Format=numeric] [Range= 1-2] [Missing=*]
Statistics [NW/ W] [Valid=4905 / 4905 ] [Invalid=0 / 0 ]
Pre-question Have you heard or read the following statement?
Literal question Climate change is a very serious threat, and a lot more must be done to prevent it. Norway should nevertheless continue toproduce as much oil as we currently do, because the world needs energy.
Value Label Cases Weighted Percentage (Weighted)
1 Yes, I have heard or read this. 609 609.5 12.4%
2 No, I have not heard or read this 175 178.7 3.6%
97 No answer 12 17.5 0.4%
98 Not asked 4109 4099.3 83.6%Warning: these figures indicate the number of cases found in the data file. They cannot be interpreted as summary statistics of the population of interest.
# km2: Heard the argument: Climate change a threat and we should reduce oil extraction
Information [Type= discrete] [Format=numeric] [Range= 1-2] [Missing=*]
Statistics [NW/ W] [Valid=4905 / 4905 ] [Invalid=0 / 0 ]
Pre-question Have you heard or read the following statement?
Literal question Climate change is a very serious threat, and a lot more must be done to prevent it. This means that Norway should produceless oil than we currently do, because a large share of the world's fossil fuel must remain unused.
Value Label Cases Weighted Percentage (Weighted)
1 Yes, I have heard or read this. 653 634.2 12.9%

- 50 -
# km2: Heard the argument: Climate change a threat and we should reduce oil extraction
Value Label Cases Weighted Percentage (Weighted)
2 No, I have not heard or read this 127 135.1 2.8%
97 No answer 14 12.4 0.3%
98 Not asked 4111 4123.4 84.1%Warning: these figures indicate the number of cases found in the data file. They cannot be interpreted as summary statistics of the population of interest.
# km3: Heard the argument: Climate change is not a threat and we should continue to extract oil as usual
Information [Type= discrete] [Format=numeric] [Range= 1-2] [Missing=*]
Statistics [NW/ W] [Valid=4905 / 4905 ] [Invalid=0 / 0 ]
Pre-question Have you heard or read the following statement?
Literal question Climate change is a not a serious threat, and too much is being done to prevent it. This means that Norway should continue toproduce as much oil as we currently do, because the world needs energy.
Value Label Cases Weighted Percentage (Weighted)
1 Yes, I have heard or read this. 490 469.8 9.6%
2 No, I have not heard or read this 280 276.8 5.6%
97 No answer 16 12.7 0.3%
98 Not asked 4119 4145.8 84.5%Warning: these figures indicate the number of cases found in the data file. They cannot be interpreted as summary statistics of the population of interest.
# km36: Concerned about climate change
Information [Type= discrete] [Format=numeric] [Range= 1-5] [Missing=*]
Statistics [NW/ W] [Valid=4905 / 4905 ] [Invalid=0 / 0 ]
Literal question How concerned are you about climate change?
Value Label Cases Weighted Percentage (Weighted)
1 Very concerned 753 663.9 13.5%
2 Concerned 1558 1444.5 29.5%
3 Somewhat concerned 1576 1681.8 34.3%
4 Not particularly concerned 680 737.7 15.0%
5 Not concerned 167 207.1 4.2%
97 No answer 171 169.9 3.5%Warning: these figures indicate the number of cases found in the data file. They cannot be interpreted as summary statistics of the population of interest.
# km37: Agreement with statement
Information [Type= discrete] [Format=numeric] [Range= 1-3] [Missing=*]
Statistics [NW/ W] [Valid=4905 / 4905 ] [Invalid=0 / 0 ]
Literal question Which of the below statements do you most agree with?
Value Label Cases Weighted Percentage (Weighted)
1 Norway should continue to produce as much oilas we currently do.
2293 2373.5 48.4%
2 Norway should produce less oil than we currentlydo
2056 1953.6 39.8%
3 Norway should produce more oil than wecurrently do
316 329.9 6.7%
97 No answer 240 248.0 5.1%Warning: these figures indicate the number of cases found in the data file. They cannot be interpreted as summary statistics of the population of interest.
# km4: Statement fits view on climate change
Information [Type= discrete] [Format=numeric] [Range= 1-4] [Missing=*]

- 51 -
# km4: Statement fits view on climate change
Statistics [NW/ W] [Valid=4905 / 4905 ] [Invalid=0 / 0 ]
Literal question Based on what you know, which of the following statements best describes your view on climate change?
Interviewer's instructions Choose one option.
Value Label Cases Weighted Percentage (Weighted)
1 I believe that the climate is not changing. 35 44.2 0.9%
2 I don't know whether the climate is changing ornot.
311 326.8 6.7%
3 I believe that the climate is changing, but that ithas little to do with human action.
1056 1207.3 24.6%
4 I believe that the climate is changing, and that itto a large extent is due to human action.
3299 3128.0 63.8%
97 No answer 204 198.7 4.1%Warning: these figures indicate the number of cases found in the data file. They cannot be interpreted as summary statistics of the population of interest.
# km35: How many share your view on climate change
Information [Type= discrete] [Format=numeric] [Range= 1-5] [Missing=*]
Statistics [NW/ W] [Valid=4905 / 4905 ] [Invalid=0 / 0 ]
Literal question The last question you answered was about your view on climate change. Which proportion of the Norwegian population doyou believe shares your views on the issue?
Value Label Cases Weighted Percentage (Weighted)
1 All, or nearly all 100 126.2 2.6%
2 Many (more than half) 1117 1080.2 22.0%
3 Around half 781 807.7 16.5%
4 Some (fewer than half) 356 371.1 7.6%
5 None, or nearly none 6 4.5 0.1%
97 No answer 2545 2515.4 51.3%Warning: these figures indicate the number of cases found in the data file. They cannot be interpreted as summary statistics of the population of interest.
# ran2: Randomizes independently from U
Information [Type= discrete] [Format=numeric] [Range= 1-2] [Missing=*]
Statistics [NW/ W] [Valid=4775 /-] [Invalid=130 /-]
Pre-question Randomizes into two groups and selects one of the following questions: KM5 or KM6
Value Label Cases Percentage
1 r1 2371 49.7%
2 r2 2404 50.3%
Sysmiss 130Warning: these figures indicate the number of cases found in the data file. They cannot be interpreted as summary statistics of the population of interest.
# km5: How serious is climate change
Information [Type= discrete] [Format=numeric] [Range= 1-5] [Missing=*]
Statistics [NW/ W] [Valid=4905 / 4905 ] [Invalid=0 / 0 ]
Literal question How serious a threat is climate change overall?
Value Label Cases Weighted Percentage (Weighted)
1 Very serious 622 554.0 11.3%
2 Serious 991 968.3 19.7%
3 Somewhat serious 556 588.3 12.0%
4 Not very serious 142 162.6 3.3%

- 52 -
# km5: How serious is climate change
Value Label Cases Weighted Percentage (Weighted)
5 Not a threat 24 26.5 0.5%
97 No answer 36 47.7 1.0%
98 Not asked 2534 2557.7 52.1%Warning: these figures indicate the number of cases found in the data file. They cannot be interpreted as summary statistics of the population of interest.
# km6: Climate change is serious to me personally
Information [Type= discrete] [Format=numeric] [Range= 1-5] [Missing=*]
Statistics [NW/ W] [Valid=4905 / 4905 ] [Invalid=0 / 0 ]
Literal question How serious a threat is climate change to you personally?
Value Label Cases Weighted Percentage (Weighted)
1 Very serious 138 113.8 2.3%
2 Serious 517 494.2 10.1%
3 Somewhat serious 833 838.9 17.1%
4 Not very serious 664 697.4 14.2%
5 Not a threat 227 257.9 5.3%
97 No answer 25 24.1 0.5%
98 Not asked 2501 2478.8 50.5%Warning: these figures indicate the number of cases found in the data file. They cannot be interpreted as summary statistics of the population of interest.
# km7: Possible to do something about climate change
Information [Type= discrete] [Format=numeric] [Range= 1-4] [Missing=*]
Statistics [NW/ W] [Valid=4905 / 4905 ] [Invalid=0 / 0 ]
Literal question Let's assume that climate change may become a major threat to the world in the future if no action is taken. To which extentdo you believe that it is possible to do anything to prevent harmful climate changes?
Interviewer's instructions Select the statement that is closest to your view:
Value Label Cases Weighted Percentage (Weighted)
1 It is impossible to do anything to prevent harmfulclimate change.
253 291.1 5.9%
2 It is possible, but very difficult to do somethingto prevent harmful climate change.
2661 2598.2 53.0%
3 It is possible and completely realistic to dosomething to prevent harmful climate change.
1434 1400.6 28.6%
4 It is easy to prevent harmful climate change. 64 71.4 1.5%
97 No answer 493 543.7 11.1%Warning: these figures indicate the number of cases found in the data file. They cannot be interpreted as summary statistics of the population of interest.
# ran3sel_1: Randomizes if U=1: selects KM13_1
Information [Type= discrete] [Format=numeric] [Range= 1-1] [Missing=*]
Statistics [NW/ W] [Valid=1189 /-] [Invalid=3716 /-]
Pre-question Randomizes if U=1: selects KM13_1
Value Label Cases Percentage
1 1189 100.0%
Sysmiss 3716Warning: these figures indicate the number of cases found in the data file. They cannot be interpreted as summary statistics of the population of interest.
# ran3sel_2: Randomizes if U=1: selects KM13_2
Information [Type= discrete] [Format=numeric] [Range= 1-1] [Missing=*]
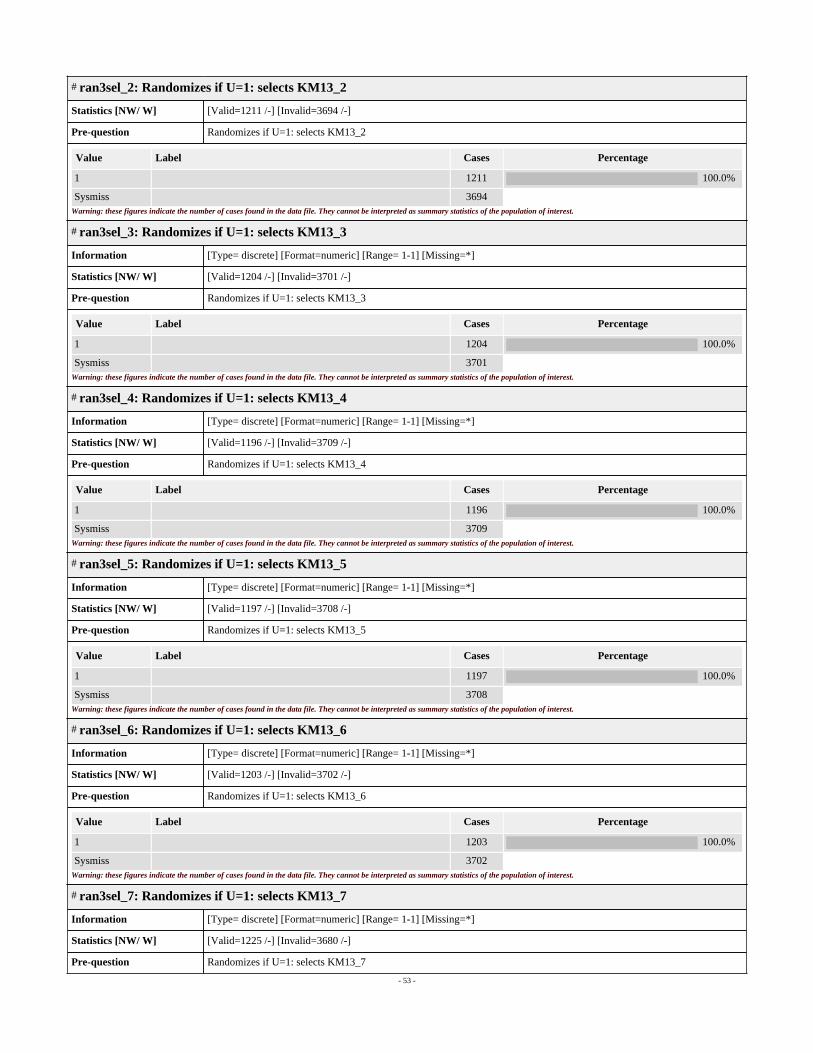
- 53 -
# ran3sel_2: Randomizes if U=1: selects KM13_2
Statistics [NW/ W] [Valid=1211 /-] [Invalid=3694 /-]
Pre-question Randomizes if U=1: selects KM13_2
Value Label Cases Percentage
1 1211 100.0%
Sysmiss 3694Warning: these figures indicate the number of cases found in the data file. They cannot be interpreted as summary statistics of the population of interest.
# ran3sel_3: Randomizes if U=1: selects KM13_3
Information [Type= discrete] [Format=numeric] [Range= 1-1] [Missing=*]
Statistics [NW/ W] [Valid=1204 /-] [Invalid=3701 /-]
Pre-question Randomizes if U=1: selects KM13_3
Value Label Cases Percentage
1 1204 100.0%
Sysmiss 3701Warning: these figures indicate the number of cases found in the data file. They cannot be interpreted as summary statistics of the population of interest.
# ran3sel_4: Randomizes if U=1: selects KM13_4
Information [Type= discrete] [Format=numeric] [Range= 1-1] [Missing=*]
Statistics [NW/ W] [Valid=1196 /-] [Invalid=3709 /-]
Pre-question Randomizes if U=1: selects KM13_4
Value Label Cases Percentage
1 1196 100.0%
Sysmiss 3709Warning: these figures indicate the number of cases found in the data file. They cannot be interpreted as summary statistics of the population of interest.
# ran3sel_5: Randomizes if U=1: selects KM13_5
Information [Type= discrete] [Format=numeric] [Range= 1-1] [Missing=*]
Statistics [NW/ W] [Valid=1197 /-] [Invalid=3708 /-]
Pre-question Randomizes if U=1: selects KM13_5
Value Label Cases Percentage
1 1197 100.0%
Sysmiss 3708Warning: these figures indicate the number of cases found in the data file. They cannot be interpreted as summary statistics of the population of interest.
# ran3sel_6: Randomizes if U=1: selects KM13_6
Information [Type= discrete] [Format=numeric] [Range= 1-1] [Missing=*]
Statistics [NW/ W] [Valid=1203 /-] [Invalid=3702 /-]
Pre-question Randomizes if U=1: selects KM13_6
Value Label Cases Percentage
1 1203 100.0%
Sysmiss 3702Warning: these figures indicate the number of cases found in the data file. They cannot be interpreted as summary statistics of the population of interest.
# ran3sel_7: Randomizes if U=1: selects KM13_7
Information [Type= discrete] [Format=numeric] [Range= 1-1] [Missing=*]
Statistics [NW/ W] [Valid=1225 /-] [Invalid=3680 /-]
Pre-question Randomizes if U=1: selects KM13_7

- 54 -
# ran3sel_7: Randomizes if U=1: selects KM13_7
Value Label Cases Percentage
1 1225 100.0%
Sysmiss 3680Warning: these figures indicate the number of cases found in the data file. They cannot be interpreted as summary statistics of the population of interest.
# ran3sel_8: Randomizes if U=1: selects KM13_8
Information [Type= discrete] [Format=numeric] [Range= 1-1] [Missing=*]
Statistics [NW/ W] [Valid=1175 /-] [Invalid=3730 /-]
Pre-question Randomizes if U=1: selects KM13_8
Value Label Cases Percentage
1 1175 100.0%
Sysmiss 3730Warning: these figures indicate the number of cases found in the data file. They cannot be interpreted as summary statistics of the population of interest.
# ran3sel_9: Randomizes if U=1: selects KM13_9
Information [Type= discrete] [Format=numeric] [Range= 1-1] [Missing=*]
Statistics [NW/ W] [Valid=2400 /-] [Invalid=2505 /-]
Pre-question Randomizes if U=1: selects KM13_9
Value Label Cases Percentage
1 2400 100.0%
Sysmiss 2505Warning: these figures indicate the number of cases found in the data file. They cannot be interpreted as summary statistics of the population of interest.
# km13_1: Measure: Tighten rules on CO2 emissions by qutoa reductions
Information [Type= discrete] [Format=numeric] [Range= 1-7] [Missing=*]
Statistics [NW/ W] [Valid=4905 / 4905 ] [Invalid=0 / 0 ]
Pre-question We would no like to ask your opinion on certain measures that have been proposed to reduce climate change. Many expertsbelieve that the measures mentioned below will work. However, there may be disagreement on whether these are goodmeasures to implement. How positive or negative are you towards the measures mentioned here?
Literal question Tighten the rules for how much CO2 industry in Norway and Europe may discharge by cutting the total number of quotasthese may use.
Value Label Cases Weighted Percentage (Weighted)
1 Very positive 163 156.9 3.2%
2 Positive 402 371.1 7.6%
3 Somewhat positive 300 322.6 6.6%
4 Neither positive nor negative 162 176.5 3.6%
5 Somewhat negative 47 45.3 0.9%
6 Negative 38 38.4 0.8%
7 Very negative 23 27.3 0.6%
97 No answer 54 64.8 1.3%
98 Not asked 3716 3702.0 75.5%Warning: these figures indicate the number of cases found in the data file. They cannot be interpreted as summary statistics of the population of interest.
# km13_2: Measure: Tighten rules on CO2 emissions by limiting amount
Information [Type= discrete] [Format=numeric] [Range= 1-7] [Missing=*]
Statistics [NW/ W] [Valid=4905 / 4905 ] [Invalid=0 / 0 ]

- 55 -
# km13_2: Measure: Tighten rules on CO2 emissions by limiting amount
Pre-question We would no like to ask your opinion on certain measures that have been proposed to reduce climate change. Many expertsbelieve that the measures mentioned below will work. However, there may be disagreement on whether these are goodmeasures to implement. How positive or negative are you towards the measures mentioned here?
Literal question Tighten the rules for how much CO2 industry in Norway and Europe may discharge overall.
Value Label Cases Weighted Percentage (Weighted)
1 Very positive 199 202.1 4.1%
2 Positive 484 445.9 9.1%
3 Somewhat positive 292 327.3 6.7%
4 Neither positive nor negative 121 127.2 2.6%
5 Somewhat negative 39 35.3 0.7%
6 Negative 16 19.3 0.4%
7 Very negative 10 11.9 0.2%
97 No answer 50 56.2 1.1%
98 Not asked 3694 3679.7 75.0%Warning: these figures indicate the number of cases found in the data file. They cannot be interpreted as summary statistics of the population of interest.
# km13_3: Measure: Capture and store CO2
Information [Type= discrete] [Format=numeric] [Range= 1-7] [Missing=*]
Statistics [NW/ W] [Valid=4905 / 4905 ] [Invalid=0 / 0 ]
Pre-question We would no like to ask your opinion on certain measures that have been proposed to reduce climate change. Many expertsbelieve that the measures mentioned below will work. However, there may be disagreement on whether these are goodmeasures to implement. How positive or negative are you towards the measures mentioned here?
Literal question Strengthen focus on capture and storage of CO2 beneath the seabed or underground.
Value Label Cases Weighted Percentage (Weighted)
1 Very positive 76 70.4 1.4%
2 Positive 244 224.3 4.6%
3 Somewhat positive 272 284.4 5.8%
4 Neither positive nor negative 343 384.9 7.8%
5 Somewhat negative 87 79.8 1.6%
6 Negative 82 83.4 1.7%
7 Very negative 36 42.1 0.9%
97 No answer 64 78.2 1.6%
98 Not asked 3701 3657.4 74.6%Warning: these figures indicate the number of cases found in the data file. They cannot be interpreted as summary statistics of the population of interest.
# km13_4: Measure: Capture and store CO2, like on Mognstad
Information [Type= discrete] [Format=numeric] [Range= 1-7] [Missing=*]
Statistics [NW/ W] [Valid=4905 / 4905 ] [Invalid=0 / 0 ]
Pre-question We would no like to ask your opinion on certain measures that have been proposed to reduce climate change. Many expertsbelieve that the measures mentioned below will work. However, there may be disagreement on whether these are goodmeasures to implement. How positive or negative are you towards the measures mentioned here?
Literal question Strengthen focus on capture and storage of CO2 beneath the seabed or underground, such as the so-called “mission to themoon” project at Mongstad
Value Label Cases Weighted Percentage (Weighted)
1 Very positive 74 71.9 1.5%
2 Positive 230 226.7 4.6%
3 Somewhat positive 272 255.3 5.2%
4 Neither positive nor negative 336 353.7 7.2%

- 56 -
# km13_4: Measure: Capture and store CO2, like on Mognstad
Value Label Cases Weighted Percentage (Weighted)
5 Somewhat negative 98 84.6 1.7%
6 Negative 69 65.8 1.3%
7 Very negative 39 38.6 0.8%
97 No answer 78 84.1 1.7%
98 Not asked 3709 3724.3 75.9%Warning: these figures indicate the number of cases found in the data file. They cannot be interpreted as summary statistics of the population of interest.
# km13_5: Measure: Reduce tax incentives regarding oilfield exploration
Information [Type= discrete] [Format=numeric] [Range= 1-7] [Missing=*]
Statistics [NW/ W] [Valid=4905 / 4905 ] [Invalid=0 / 0 ]
Pre-question We would no like to ask your opinion on certain measures that have been proposed to reduce climate change. Many expertsbelieve that the measures mentioned below will work. However, there may be disagreement on whether these are goodmeasures to implement. How positive or negative are you towards the measures mentioned here?
Literal question Reduce tax incentives for oil exploration on the Norwegian continental shelf.
Value Label Cases Weighted Percentage (Weighted)
1 Very positive 71 55.4 1.1%
2 Positive 166 150.4 3.1%
3 Somewhat positive 227 230.3 4.7%
4 Neither positive nor negative 398 416.2 8.5%
5 Somewhat negative 148 134.1 2.7%
6 Negative 82 95.4 1.9%
7 Very negative 36 41.5 0.8%
97 No answer 69 71.0 1.4%
98 Not asked 3708 3710.9 75.7%Warning: these figures indicate the number of cases found in the data file. They cannot be interpreted as summary statistics of the population of interest.
# km13_6: Measure: Tighten tax regulation regarding oilfield exploration
Information [Type= discrete] [Format=numeric] [Range= 1-7] [Missing=*]
Statistics [NW/ W] [Valid=4905 / 4905 ] [Invalid=0 / 0 ]
Pre-question We would no like to ask your opinion on certain measures that have been proposed to reduce climate change. Many expertsbelieve that the measures mentioned below will work. However, there may be disagreement on whether these are goodmeasures to implement. How positive or negative are you towards the measures mentioned here?
Literal question Tighten the tax regulations for oil exploration on the Norwegian continental shelf.
Value Label Cases Weighted Percentage (Weighted)
1 Very positive 79 67.4 1.4%
2 Positive 149 143.4 2.9%
3 Somewhat positive 210 200.0 4.1%
4 Neither positive nor negative 358 373.8 7.6%
5 Somewhat negative 154 162.7 3.3%
6 Negative 112 109.9 2.2%
7 Very negative 59 76.3 1.6%
97 No answer 82 100.6 2.1%
98 Not asked 3702 3670.9 74.8%Warning: these figures indicate the number of cases found in the data file. They cannot be interpreted as summary statistics of the population of interest.
# km13_7: Measure: Prevent harmful effects of storms and precipitation
Information [Type= discrete] [Format=numeric] [Range= 1-7] [Missing=*]

- 57 -
# km13_7: Measure: Prevent harmful effects of storms and precipitation
Statistics [NW/ W] [Valid=4905 / 4905 ] [Invalid=0 / 0 ]
Pre-question We would no like to ask your opinion on certain measures that have been proposed to reduce climate change. Many expertsbelieve that the measures mentioned below will work. However, there may be disagreement on whether these are goodmeasures to implement. How positive or negative are you towards the measures mentioned here?
Literal question Strengthen efforts to prevent the harmful effects of storms and precipitation.
Value Label Cases Weighted Percentage (Weighted)
1 Very positive 151 157.2 3.2%
2 Positive 401 391.0 8.0%
3 Somewhat positive 277 271.7 5.5%
4 Neither positive nor negative 239 252.5 5.1%
5 Somewhat negative 49 43.1 0.9%
6 Negative 24 22.7 0.5%
7 Very negative 16 32.2 0.7%
97 No answer 68 73.5 1.5%
98 Not asked 3680 3660.9 74.6%Warning: these figures indicate the number of cases found in the data file. They cannot be interpreted as summary statistics of the population of interest.
# km13_8: Measure: Prevent harmful effects of storms and precipitation, even at the cost of other issues
Information [Type= discrete] [Format=numeric] [Range= 1-7] [Missing=*]
Statistics [NW/ W] [Valid=4905 / 4905 ] [Invalid=0 / 0 ]
Pre-question We would no like to ask your opinion on certain measures that have been proposed to reduce climate change. Many expertsbelieve that the measures mentioned below will work. However, there may be disagreement on whether these are goodmeasures to implement. How positive or negative are you towards the measures mentioned here?
Literal question Strengthen efforts to prevent the harmful effects of storms and precipitation, even if this is at the cost of other importantcauses.
Value Label Cases Weighted Percentage (Weighted)
1 Very positive 41 48.4 1.0%
2 Positive 203 197.9 4.0%
3 Somewhat positive 327 317.4 6.5%
4 Neither positive nor negative 322 322.1 6.6%
5 Somewhat negative 122 121.2 2.5%
6 Negative 67 76.0 1.5%
7 Very negative 19 13.9 0.3%
97 No answer 74 87.4 1.8%
98 Not asked 3730 3720.8 75.9%Warning: these figures indicate the number of cases found in the data file. They cannot be interpreted as summary statistics of the population of interest.
# km13_9: Measure: Change the climate by blocking the sunlight
Information [Type= discrete] [Format=numeric] [Range= 1-7] [Missing=*]
Statistics [NW/ W] [Valid=4905 / 4905 ] [Invalid=0 / 0 ]
Pre-question We would no like to ask your opinion on certain measures that have been proposed to reduce climate change. Many expertsbelieve that the measures mentioned below will work. However, there may be disagreement on whether these are goodmeasures to implement. How positive or negative are you towards the measures mentioned here?
Literal question Attempt to alter the weather and climate by e.g. launching sulphur particles that block sunlight
Value Label Cases Weighted Percentage (Weighted)
1 Very positive 14 15.1 0.3%
2 Positive 37 39.2 0.8%
3 Somewhat positive 76 83.5 1.7%

- 58 -
# km13_9: Measure: Change the climate by blocking the sunlight
Value Label Cases Weighted Percentage (Weighted)
4 Neither positive nor negative 632 650.2 13.3%
5 Somewhat negative 304 297.9 6.1%
6 Negative 569 569.0 11.6%
7 Very negative 620 607.4 12.4%
97 No answer 148 165.9 3.4%
98 Not asked 2505 2476.7 50.5%Warning: these figures indicate the number of cases found in the data file. They cannot be interpreted as summary statistics of the population of interest.
# km17: If nothing is done about climate change weather will be more extreme
Information [Type= discrete] [Format=numeric] [Range= 1-2] [Missing=*]
Statistics [NW/ W] [Valid=4905 / 4905 ] [Invalid=0 / 0 ]
Literal question If nothing is done to prevent it, do you believe global warming will lead to more harmful extreme weather over the next 100years, or do you believe global warming will not lead to this?
Value Label Cases Weighted Percentage (Weighted)
1 Global warming will lead to more harmfulextreme weather
2021 1982.4 40.4%
2 Global warming will not lead to more harmfulextreme weather
285 333.7 6.8%
97 No answer 165 184.2 3.8%
98 Not asked 2434 2404.6 49.0%Warning: these figures indicate the number of cases found in the data file. They cannot be interpreted as summary statistics of the population of interest.
# km20: Moral obligation to prevent climate change
Information [Type= discrete] [Format=numeric] [Range= 1-5] [Missing=*]
Statistics [NW/ W] [Valid=4905 / 4905 ] [Invalid=0 / 0 ]
Literal question To which degree do you view it as a moral duty for individuals to contribute to prevent climate change?
Value Label Cases Weighted Percentage (Weighted)
1 To a very great degree 520 455.7 9.3%
2 To a great degree 893 884.1 18.0%
3 To some degree 728 793.9 16.2%
4 To a small degree 163 185.9 3.8%
5 Not at all 47 51.6 1.1%
97 No answer 120 129.1 2.6%
98 Not asked 2434 2404.6 49.0%Warning: these figures indicate the number of cases found in the data file. They cannot be interpreted as summary statistics of the population of interest.
# km22: Knowledge about climate change
Information [Type= discrete] [Format=numeric] [Range= 1-5] [Missing=*]
Statistics [NW/ W] [Valid=4905 / 4905 ] [Invalid=0 / 0 ]
Literal question In your opinion, how good is your knowledge on climate change?
Value Label Cases Weighted Percentage (Weighted)
1 Very good knowledge 55 52.5 1.1%
2 Good knowledge 530 494.1 10.1%
3 Some knowledge 1362 1340.9 27.3%
4 Little knowledge 391 471.5 9.6%
5 No knowledge 24 28.4 0.6%

- 59 -
# km22: Knowledge about climate change
Value Label Cases Weighted Percentage (Weighted)
97 No answer 109 112.9 2.3%
98 Not asked 2434 2404.6 49.0%Warning: these figures indicate the number of cases found in the data file. They cannot be interpreted as summary statistics of the population of interest.

- 60 -
# km22k: Comment: Knowledge about climate change [anonymised]
Information [Type= discrete] [Format=character] [Missing=*]
Statistics [NW/ W] [Valid=0 /-] [Invalid=0 /-]
Literal question If you have any comments to the question, you may enter them here:[anonymised: Data withheld for the sake of anonymity]
Value Label Cases Percentage
97 No answerWarning: these figures indicate the number of cases found in the data file. They cannot be interpreted as summary statistics of the population of interest.
# km23: Discussion on climate change is characterized by conflict and disagreement
Information [Type= discrete] [Format=numeric] [Range= 1-5] [Missing=*]
Statistics [NW/ W] [Valid=4905 / 4905 ] [Invalid=0 / 0 ]
Literal question To which degree do you think discussion concerning climate change is characterized by conflict and disagreement?
Value Label Cases Weighted Percentage (Weighted)
1 To a very great degree 326 325.3 6.6%
2 To a great degree 1096 1132.0 23.1%
3 To some degree 839 816.0 16.6%
4 To a small degree 80 86.9 1.8%
5 Not at all 6 6.1 0.1%
97 No answer 124 134.0 2.7%
98 Not asked 2434 2404.6 49.0%Warning: these figures indicate the number of cases found in the data file. They cannot be interpreted as summary statistics of the population of interest.
# km26: Diversity of opinion on climate change in the media
Information [Type= discrete] [Format=numeric] [Range= 1-5] [Missing=*]
Statistics [NW/ W] [Valid=4905 / 4905 ] [Invalid=0 / 0 ]
Literal question In your opinion, how great is the diversity in opinion on climate change that emerges in the media?
Value Label Cases Weighted Percentage (Weighted)
1 Very great diversity 43 39.8 0.8%
2 Great diversity 578 612.0 12.5%
3 Some diversity 1134 1144.9 23.3%
4 Little diversity 504 481.2 9.8%
5 No diversity at all 34 31.2 0.6%
97 No answer 178 191.3 3.9%
98 Not asked 2434 2404.6 49.0%Warning: these figures indicate the number of cases found in the data file. They cannot be interpreted as summary statistics of the population of interest.
# ran4: Randomiserer dersom U=1
Information [Type= discrete] [Format=numeric] [Range= 1-2] [Missing=*]
Statistics [NW/ W] [Valid=2389 /-] [Invalid=2516 /-]
Pre-question Randomizes if U=1 into two groups and selects one of the following questions: KM27 or KM28
Value Label Cases Percentage
1 1183 49.5%
2 1206 50.5%
Sysmiss 2516Warning: these figures indicate the number of cases found in the data file. They cannot be interpreted as summary statistics of the population of interest.

- 61 -
# km27: Scientists agree on climate change
Information [Type= discrete] [Format=numeric] [Range= 1-5] [Missing=*]
Statistics [NW/ W] [Valid=4905 / 4905 ] [Invalid=0 / 0 ]
Literal question To which degree do you have the impression that scientists agree on climate change?
Value Label Cases Weighted Percentage (Weighted)
1 To a very great degree 95 85.8 1.8%
2 To a great degree 393 378.0 7.7%
3 To some degree 477 502.9 10.3%
4 To a small degree 156 159.8 3.3%
5 Not at all 34 40.7 0.8%
97 28 33.6 0.7%
98 3722 3704.2 75.5%Warning: these figures indicate the number of cases found in the data file. They cannot be interpreted as summary statistics of the population of interest.
# km28_2_1: Proportion of scientist that agree on climate change
Information [Type= discrete] [Format=numeric] [Range= 0-999] [Missing=*]
Statistics [NW/ W] [Valid=4905 / 4905 ] [Invalid=0 / 0 ]
Literal question In your opinion, which proportion of climate scientists agree that global warming is a direct consequence of humans usingcoal, oil and gas?
Interviewer's instructions Please pick a number between 0% and 100% below.
Value Label Cases Weighted Percentage (Weighted)
0 0 % 1 0.8 0.0%
10 10 11 12.1 0.2%
20 20 13 15.8 0.3%
30 30 37 41.5 0.8%
40 40 41 50.5 1.0%
50 50 100 126.6 2.6%
60 60 135 159.7 3.3%
70 70 209 210.0 4.3%
80 80 214 175.0 3.6%
90 90 228 206.4 4.2%
100 100 % 49 40.6 0.8%
997 No answer 52 56.2 1.1%
998 Not asked 3699 3689.2 75.2%
999 No response 116 120.6 2.5%Warning: these figures indicate the number of cases found in the data file. They cannot be interpreted as summary statistics of the population of interest.
# km28k: Comment: Proportion of scientist that agree on climate change [anonymised]
Information [Type= discrete] [Format=character] [Missing=*]
Statistics [NW/ W] [Valid=0 /-] [Invalid=0 /-]
Literal question If you have comments to the question, you may enter them here:[anonymised: Data withheld for the sake of anonymity]
Value Label Cases Percentage
97 No answerWarning: these figures indicate the number of cases found in the data file. They cannot be interpreted as summary statistics of the population of interest.
# ran5: Randomizes if U=1
Information [Type= discrete] [Format=numeric] [Range= 1-2] [Missing=*]

- 62 -
# ran5: Randomizes if U=1
Statistics [NW/ W] [Valid=2387 /-] [Invalid=2518 /-]
Pre-question Randomizes if U=1 into two groups and selects one of the following questions: KM29 or KM30
Value Label Cases Percentage
1 1159 48.6%
2 1228 51.4%
Sysmiss 2518Warning: these figures indicate the number of cases found in the data file. They cannot be interpreted as summary statistics of the population of interest.
# km29: Norway commited through international agreements to cut emissions
Information [Type= discrete] [Format=numeric] [Range= 1-7] [Missing=*]
Statistics [NW/ W] [Valid=4905 / 4905 ] [Invalid=0 / 0 ]
Literal question As you may know, government leaders from all over the world met in November to negotiate a new international agreementto limit the emissions of greenhouse gases. To which extent do you agree that Norway commits itself in such internationalagreements?
Value Label Cases Weighted Percentage (Weighted)
1 Strongly agree 409 370.1 7.5%
2 Agree 433 408.1 8.3%
3 Agree somewhat 157 186.7 3.8%
4 Neither agree nor disagree 77 95.0 1.9%
5 Disagree somewhat 31 36.3 0.7%
6 Disagree 17 15.3 0.3%
7 Strongly disagree 16 14.6 0.3%
97 No answer 19 18.6 0.4%
98 Not asked 3746 3760.3 76.7%Warning: these figures indicate the number of cases found in the data file. They cannot be interpreted as summary statistics of the population of interest.
# km30: Norway commited through international agreements to cut emissions, even if China does not
Information [Type= discrete] [Format=numeric] [Range= 1-7] [Missing=*]
Statistics [NW/ W] [Valid=4905 / 4905 ] [Invalid=0 / 0 ]
Literal question As you may know, government leaders from all over the world met in November to negotiate a new international agreementto limit the emissions of greenhouse gases. To which extent do you agree that Norway commits itself in such internationalagreements, even if it means that Norway does this before other countries such as e.g. China?
Value Label Cases Weighted Percentage (Weighted)
1 Strongly agree 262 234.3 4.8%
2 Agree 426 413.1 8.4%
3 Agree somewhat 248 279.5 5.7%
4 Neither agree nor disagree 98 114.0 2.3%
5 Disagree somewhat 81 93.5 1.9%
6 Disagree 54 60.5 1.2%
7 Strongly disagree 37 50.4 1.0%
97 No answer 22 24.7 0.5%
98 Not asked 3677 3635.1 74.1%Warning: these figures indicate the number of cases found in the data file. They cannot be interpreted as summary statistics of the population of interest.
# dt1_1: Authorities have a right to: indefinite detainment
Information [Type= discrete] [Format=numeric] [Range= 1-8] [Missing=*]
Statistics [NW/ W] [Valid=4905 / 4905 ] [Invalid=0 / 0 ]
Pre-question Now we shall go on to another topic.

- 63 -
# dt1_1: Authorities have a right to: indefinite detainmentImagine that the authorities suspected that a terrorist attack was imminent. To which extent do you agree that the authoritiesshould be entitled to:
Literal question Keep individuals in custody as long as they want without a judicial process
Value Label Cases Weighted Percentage (Weighted)
1 Strongly agree 123 134.3 2.7%
2 Agree 164 182.8 3.7%
3 Agree somewhat 291 340.5 6.9%
4 Neither agree nor disagree 167 192.9 3.9%
5 Disagree somewhat 293 301.0 6.1%
6 Disagree 517 489.8 10.0%
7 Strongly disagree 724 652.4 13.3%
8 Dont wan't to respond 40 48.6 1.0%
97 No answer 152 157.9 3.2%
98 Not asked 2434 2404.6 49.0%Warning: these figures indicate the number of cases found in the data file. They cannot be interpreted as summary statistics of the population of interest.
# dt1_2: Authorities have a right to: tapping phone calls
Information [Type= discrete] [Format=numeric] [Range= 1-8] [Missing=*]
Statistics [NW/ W] [Valid=4905 / 4905 ] [Invalid=0 / 0 ]
Pre-question Now we shall go on to another topic.Imagine that the authorities suspected that a terrorist attack was imminent. To which extent do you agree that the authoritiesshould be entitled to:
Literal question Tap people's phone calls
Value Label Cases Weighted Percentage (Weighted)
1 Strongly agree 289 303.7 6.2%
2 Agree 524 492.0 10.0%
3 Agree somewhat 580 592.9 12.1%
4 Neither agree nor disagree 194 224.7 4.6%
5 Disagree somewhat 236 217.6 4.4%
6 Disagree 250 237.7 4.8%
7 Strongly disagree 220 237.1 4.8%
8 Dont wan't to respond 28 41.7 0.9%
97 No answer 150 153.0 3.1%
98 Not asked 2434 2404.6 49.0%Warning: these figures indicate the number of cases found in the data file. They cannot be interpreted as summary statistics of the population of interest.
# dt1_3: Authorities have a right to: randomly stop and search people on the street
Information [Type= discrete] [Format=numeric] [Range= 1-8] [Missing=*]
Statistics [NW/ W] [Valid=4905 / 4905 ] [Invalid=0 / 0 ]
Pre-question Now we shall go on to another topic.Imagine that the authorities suspected that a terrorist attack was imminent. To which extent do you agree that the authoritiesshould be entitled to:
Literal question Randomly stop and search people on the street
Value Label Cases Weighted Percentage (Weighted)
1 Strongly agree 192 200.1 4.1%
2 Agree 353 358.0 7.3%
3 Agree somewhat 464 503.5 10.3%

- 64 -
# dt1_3: Authorities have a right to: randomly stop and search people on the street
Value Label Cases Weighted Percentage (Weighted)
4 Neither agree nor disagree 176 178.9 3.6%
5 Disagree somewhat 321 322.1 6.6%
6 Disagree 369 341.0 7.0%
7 Strongly disagree 421 409.6 8.4%
8 Dont wan't to respond 25 33.4 0.7%
97 No answer 150 153.8 3.1%
98 Not asked 2434 2404.6 49.0%Warning: these figures indicate the number of cases found in the data file. They cannot be interpreted as summary statistics of the population of interest.
# dt1_4: Authorities have a right to: arrest people without suspision
Information [Type= discrete] [Format=numeric] [Range= 1-8] [Missing=*]
Statistics [NW/ W] [Valid=4905 / 4905 ] [Invalid=0 / 0 ]
Pre-question Now we shall go on to another topic.Imagine that the authorities suspected that a terrorist attack was imminent. To which extent do you agree that the authoritiesshould be entitled to:
Literal question Arrest people without specific suspicion
Value Label Cases Weighted Percentage (Weighted)
1 Strongly agree 124 122.4 2.5%
2 Agree 202 217.2 4.4%
3 Agree somewhat 326 355.0 7.2%
4 Neither agree nor disagree 235 270.7 5.5%
5 Disagree somewhat 334 339.8 6.9%
6 Disagree 544 506.7 10.3%
7 Strongly disagree 515 487.9 9.9%
8 Dont wan't to respond 38 46.1 0.9%
97 No answer 153 154.5 3.2%
98 Not asked 2434 2404.6 49.0%Warning: these figures indicate the number of cases found in the data file. They cannot be interpreted as summary statistics of the population of interest.
# dt1_5: Authorities have a right to: monitor electronic communication
Information [Type= discrete] [Format=numeric] [Range= 1-8] [Missing=*]
Statistics [NW/ W] [Valid=4905 / 4905 ] [Invalid=0 / 0 ]
Pre-question Now we shall go on to another topic.Imagine that the authorities suspected that a terrorist attack was imminent. To which extent do you agree that the authoritiesshould be entitled to:
Literal question Monitor electronic communication (beyond telephones)
Value Label Cases Weighted Percentage (Weighted)
1 Strongly agree 386 405.6 8.3%
2 Agree 664 646.1 13.2%
3 Agree somewhat 576 583.2 11.9%
4 Neither agree nor disagree 157 181.0 3.7%
5 Disagree somewhat 185 167.5 3.4%
6 Disagree 180 170.4 3.5%
7 Strongly disagree 149 165.6 3.4%
8 Ønsker ikke å svare 26 32.5 0.7%
97 No answer 148 148.3 3.0%

- 65 -
# dt1_5: Authorities have a right to: monitor electronic communication
Value Label Cases Weighted Percentage (Weighted)
98 Not asked 2434 2404.6 49.0%Warning: these figures indicate the number of cases found in the data file. They cannot be interpreted as summary statistics of the population of interest.
# dt1_6: Authorities have a right to: monitor/bug room
Information [Type= discrete] [Format=numeric] [Range= 1-8] [Missing=*]
Statistics [NW/ W] [Valid=4905 / 4905 ] [Invalid=0 / 0 ]
Pre-question Now we shall go on to another topic.Imagine that the authorities suspected that a terrorist attack was imminent. To which extent do you agree that the authoritiesshould be entitled to:
Literal question Monitor/bug rooms
Value Label Cases Weighted Percentage (Weighted)
1 Strongly agree 373 397.3 8.1%
2 Agree 564 575.6 11.7%
3 Agree somewhat 618 586.2 12.0%
4 Neither agree nor disagree 188 212.0 4.3%
5 Disagree somewhat 209 196.2 4.0%
6 Disagree 170 157.7 3.2%
7 Strongly disagree 168 182.7 3.7%
8 Dont wan't to respond 29 38.5 0.8%
97 No answer 152 154.3 3.1%
98 Not asked 2434 2404.6 49.0%Warning: these figures indicate the number of cases found in the data file. They cannot be interpreted as summary statistics of the population of interest.
# dt1_7: Authorities have a right to: block off lagre part of the city
Information [Type= discrete] [Format=numeric] [Range= 1-8] [Missing=*]
Statistics [NW/ W] [Valid=4905 / 4905 ] [Invalid=0 / 0 ]
Pre-question Now we shall go on to another topic.Imagine that the authorities suspected that a terrorist attack was imminent. To which extent do you agree that the authoritiesshould be entitled to:
Literal question Cordon off large parts of the city
Value Label Cases Weighted Percentage (Weighted)
1 Strongly agree 411 434.2 8.9%
2 Agree 728 713.1 14.5%
3 Agree somewhat 552 555.7 11.3%
4 Neither agree nor disagree 229 240.8 4.9%
5 Disagree somewhat 132 138.3 2.8%
6 Disagree 149 140.8 2.9%
7 Strongly disagree 87 81.6 1.7%
8 Dont wan't to respond 29 35.1 0.7%
97 No answer 154 160.7 3.3%
98 Not asked 2434 2404.6 49.0%Warning: these figures indicate the number of cases found in the data file. They cannot be interpreted as summary statistics of the population of interest.
# dt1_8: Authorities have a right to: patrol the streets with armed military or police
Information [Type= discrete] [Format=numeric] [Range= 1-8] [Missing=*]
Statistics [NW/ W] [Valid=4905 / 4905 ] [Invalid=0 / 0 ]
Pre-question Now we shall go on to another topic.

- 66 -
# dt1_8: Authorities have a right to: patrol the streets with armed military or policeImagine that the authorities suspected that a terrorist attack was imminent. To which extent do you agree that the authoritiesshould be entitled to:
Literal question Allow armed police or military personnel to patrol the streets
Value Label Cases Weighted Percentage (Weighted)
1 Strongly agree 490 525.1 10.7%
2 Agree 729 748.0 15.2%
3 Agree somewhat 514 496.9 10.1%
4 Neither agree nor disagree 139 153.2 3.1%
5 Disagree somewhat 174 165.0 3.4%
6 Disagree 143 130.5 2.7%
7 Strongly disagree 121 116.5 2.4%
8 Dont wan't to respond 17 18.0 0.4%
97 No answer 144 147.1 3.0%
98 Not asked 2434 2404.6 49.0%Warning: these figures indicate the number of cases found in the data file. They cannot be interpreted as summary statistics of the population of interest.
# dt1k: Comment: Authorities have a right to [anonymised: Data withheld for the sake of anonymity]
Information [Type= discrete] [Format=character] [Missing=*]
Statistics [NW/ W] [Valid=0 /-] [Invalid=0 /-]
Literal question If you have any comments to the question, enter them here:[anonymised: Data withheld for the sake of anonymity]
# dt2: Willing to accept that maintaining the safety of society must be at the cost of civil liberties
Information [Type= discrete] [Format=numeric] [Range= 1-5] [Missing=*]
Statistics [NW/ W] [Valid=4905 / 4905 ] [Invalid=0 / 0 ]
Literal question How willing are you to accept that maintaining the safety of society must be at the cost of the freedom of individuals (such asprivacy)?
Value Label Cases Weighted Percentage (Weighted)
1 Very willing 180 181.0 3.7%
2 Willing 601 608.5 12.4%
3 Somewhat willing 899 912.6 18.6%
4 Not very willing 500 469.3 9.6%
5 Not willing at all 157 189.6 3.9%
97 No answer 134 139.3 2.8%
98 Not asked 2434 2404.6 49.0%Warning: these figures indicate the number of cases found in the data file. They cannot be interpreted as summary statistics of the population of interest.
# ran7: Randomizes independently from U
Information [Type= discrete] [Format=numeric] [Range= 1-2] [Missing=*]
Statistics [NW/ W] [Valid=4750 /-] [Invalid=155 /-]
Pre-question Randomizes into two groups and selects one of the following questions: DT3 and DT4
Value Label Cases Percentage
1 2351 49.5%
2 2399 50.5%
Sysmiss 155Warning: these figures indicate the number of cases found in the data file. They cannot be interpreted as summary statistics of the population of interest.

- 67 -
# dt3_1: Trust in central government to handle: natural disasters
Information [Type= discrete] [Format=numeric] [Range= 1-8] [Missing=*]
Statistics [NW/ W] [Valid=4905 / 4905 ] [Invalid=0 / 0 ]
Pre-question To which extent do you have confidence or mistrust that central Norwegian authorities are capable of handling various formsof accidents and disasters?
Literal question Natural disasters such as landslides, floods and hurricanes
Value Label Cases Weighted Percentage (Weighted)
1 Very high confidence 78 73.2 1.5%
2 High confidence 668 601.8 12.3%
3 Some confidence 864 844.0 17.2%
4 Neither confidence nor mistrust 245 277.2 5.7%
5 Some mistrust 271 303.6 6.2%
6 High mistrust 103 108.3 2.2%
7 Very high mistrust 30 32.5 0.7%
8 Don't know 27 34.7 0.7%
97 No answer 65 75.3 1.5%
98 Not asked 2554 2554.4 52.1%Warning: these figures indicate the number of cases found in the data file. They cannot be interpreted as summary statistics of the population of interest.
# dt3_2: Trust in central government to handle: transportation accident
Information [Type= discrete] [Format=numeric] [Range= 1-8] [Missing=*]
Statistics [NW/ W] [Valid=4905 / 4905 ] [Invalid=0 / 0 ]
Pre-question To which extent do you have confidence or mistrust that central Norwegian authorities are capable of handling various formsof accidents and disasters?
Literal question Accidents in connection with aviation, railroads, roads and shipping
Value Label Cases Weighted Percentage (Weighted)
1 Very high confidence 85 82.7 1.7%
2 High confidence 824 743.6 15.2%
3 Some confidence 826 855.6 17.4%
4 Neither confidence nor mistrust 187 201.6 4.1%
5 Some mistrust 223 238.9 4.9%
6 High mistrust 84 88.1 1.8%
7 Very high mistrust 26 25.4 0.5%
8 Don't know 31 40.7 0.8%
97 No answer 65 73.9 1.5%
98 Not asked 2554 2554.4 52.1%Warning: these figures indicate the number of cases found in the data file. They cannot be interpreted as summary statistics of the population of interest.
# dt3_3: Trust in central government to handle: contagious disease
Information [Type= discrete] [Format=numeric] [Range= 1-8] [Missing=*]
Statistics [NW/ W] [Valid=4905 / 4905 ] [Invalid=0 / 0 ]
Pre-question To which extent do you have confidence or mistrust that central Norwegian authorities are capable of handling various formsof accidents and disasters?
Literal question Contagion in connection with food, drinking water or epidemics (for example bird flu, swine flu, E.coli)
Value Label Cases Weighted Percentage (Weighted)
1 Very high confidence 74 76.5 1.6%
2 High confidence 611 574.7 11.7%

- 68 -
# dt3_3: Trust in central government to handle: contagious disease
Value Label Cases Weighted Percentage (Weighted)
3 Some confidence 799 783.5 16.0%
4 Neither confidence nor mistrust 266 294.1 6.0%
5 Some mistrust 341 349.6 7.1%
6 High mistrust 119 102.1 2.1%
7 Very high mistrust 40 41.6 0.8%
8 Don't know 34 48.9 1.0%
97 No answer 67 79.6 1.6%
98 Not asked 2554 2554.4 52.1%Warning: these figures indicate the number of cases found in the data file. They cannot be interpreted as summary statistics of the population of interest.
# dt3_4: Trust in central government to handle: failure in critical infratructure
Information [Type= discrete] [Format=numeric] [Range= 1-8] [Missing=*]
Statistics [NW/ W] [Valid=4905 / 4905 ] [Invalid=0 / 0 ]
Pre-question To which extent do you have confidence or mistrust that central Norwegian authorities are capable of handling various formsof accidents and disasters?
Literal question Failure in critical infrastructure (such as power supply, electronic communication, telecommunication, oil and fuel supply)
Value Label Cases Weighted Percentage (Weighted)
1 Very high confidence 46 52.3 1.1%
2 High confidence 505 454.5 9.3%
3 Some confidence 796 773.9 15.8%
4 Neither confidence nor mistrust 285 332.7 6.8%
5 Some mistrust 402 391.6 8.0%
6 High mistrust 139 132.7 2.7%
7 Very high mistrust 60 59.2 1.2%
8 Don't know 52 74.3 1.5%
97 No answer 66 79.6 1.6%
98 Not asked 2554 2554.4 52.1%Warning: these figures indicate the number of cases found in the data file. They cannot be interpreted as summary statistics of the population of interest.
# dt3_5: Trust in central government to handle: terrorist attack
Information [Type= discrete] [Format=numeric] [Range= 1-8] [Missing=*]
Statistics [NW/ W] [Valid=4905 / 4905 ] [Invalid=0 / 0 ]
Pre-question To which extent do you have confidence or mistrust that central Norwegian authorities are capable of handling various formsof accidents and disasters?
Literal question Terrorist attacks
Value Label Cases Weighted Percentage (Weighted)
1 Very high confidence 30 34.8 0.7%
2 High confidence 284 285.5 5.8%
3 Some confidence 766 724.4 14.8%
4 Neither confidence nor mistrust 242 267.4 5.5%
5 Some mistrust 481 473.3 9.6%
6 High mistrust 294 284.3 5.8%
7 Very high mistrust 155 161.1 3.3%
8 Don't know 34 44.1 0.9%
97 No answer 65 75.7 1.5%
98 Not asked 2554 2554.4 52.1%

- 69 -
# dt3_5: Trust in central government to handle: terrorist attackWarning: these figures indicate the number of cases found in the data file. They cannot be interpreted as summary statistics of the population of interest.
# dt4_1: Trust in local government to handle: natural disaster
Information [Type= discrete] [Format=numeric] [Range= 1-8] [Missing=*]
Statistics [NW/ W] [Valid=4905 / 4905 ] [Invalid=0 / 0 ]
Pre-question To which extent do you have confidence or mistrust that local Norwegian authorities are capable of handling various formsof accidents and disasters?
Literal question Natural disasters such as landslides, floods and hurricanes
Value Label Cases Weighted Percentage (Weighted)
1 Very high confidence 48 53.9 1.1%
2 High confidence 583 538.8 11.0%
3 Some confidence 918 898.7 18.3%
4 Neither confidence nor mistrust 286 318.5 6.5%
5 Some mistrust 311 328.5 6.7%
6 High mistrust 117 121.2 2.5%
7 Very high mistrust 46 50.2 1.0%
8 Don't know 30 32.8 0.7%
97 No answer 60 55.1 1.1%
98 Not asked 2506 2507.2 51.1%Warning: these figures indicate the number of cases found in the data file. They cannot be interpreted as summary statistics of the population of interest.
# dt4_2: Trust in local government to handle: transporatation accident
Information [Type= discrete] [Format=numeric] [Range= 1-8] [Missing=*]
Statistics [NW/ W] [Valid=4905 / 4905 ] [Invalid=0 / 0 ]
Pre-question To which extent do you have confidence or mistrust that local Norwegian authorities are capable of handling various formsof accidents and disasters?
Literal question Accidents in connection with aviation, railroads, roads and shipping
Value Label Cases Weighted Percentage (Weighted)
1 Very high confidence 63 66.4 1.4%
2 High confidence 698 649.1 13.2%
3 Some confidence 856 873.7 17.8%
4 Neither confidence nor mistrust 261 273.9 5.6%
5 Some mistrust 308 308.8 6.3%
6 High mistrust 94 99.5 2.0%
7 Very high mistrust 33 38.7 0.8%
8 Don't know 25 29.9 0.6%
97 No answer 61 57.8 1.2%
98 Not asked 2506 2507.2 51.1%Warning: these figures indicate the number of cases found in the data file. They cannot be interpreted as summary statistics of the population of interest.
# dt4_3: Trust in local government to handle: contagious disease
Information [Type= discrete] [Format=numeric] [Range= 1-8] [Missing=*]
Statistics [NW/ W] [Valid=4905 / 4905 ] [Invalid=0 / 0 ]
Pre-question To which extent do you have confidence or mistrust that local Norwegian authorities are capable of handling various formsof accidents and disasters?
Literal question Contagion in connection with food, drinking water or epidemics (for example bird flu, swine flu, E.coli)

- 70 -
# dt4_3: Trust in local government to handle: contagious disease
Value Label Cases Weighted Percentage (Weighted)
1 Very high confidence 56 63.8 1.3%
2 High confidence 532 510.5 10.4%
3 Some confidence 853 841.0 17.1%
4 Neither confidence nor mistrust 258 291.2 5.9%
5 Some mistrust 381 373.1 7.6%
6 High mistrust 160 161.5 3.3%
7 Very high mistrust 62 64.5 1.3%
8 Don't know 38 36.1 0.7%
97 No answer 59 56.1 1.1%
98 Not asked 2506 2507.2 51.1%Warning: these figures indicate the number of cases found in the data file. They cannot be interpreted as summary statistics of the population of interest.
# dt4_4: Trust in local government to handle: failure in critical infrastructure
Information [Type= discrete] [Format=numeric] [Range= 1-8] [Missing=*]
Statistics [NW/ W] [Valid=4905 / 4905 ] [Invalid=0 / 0 ]
Pre-question To which extent do you have confidence or mistrust that local Norwegian authorities are capable of handling various formsof accidents and disasters?
Literal question Failure in critical infrastructure (such as power supply, electronic communication, telecommunication, oil and fuel supply)
Value Label Cases Weighted Percentage (Weighted)
1 Very high confidence 40 51.1 1.0%
2 High confidence 462 467.5 9.5%
3 Some confidence 826 795.5 16.2%
4 Neither confidence nor mistrust 319 331.4 6.8%
5 Some mistrust 407 396.0 8.1%
6 High mistrust 164 163.0 3.3%
7 Very high mistrust 63 70.0 1.4%
8 Don't know 54 57.1 1.2%
97 No answer 64 66.3 1.4%
98 Not asked 2506 2507.2 51.1%Warning: these figures indicate the number of cases found in the data file. They cannot be interpreted as summary statistics of the population of interest.
# dt4_5: Trust in local government to handle: terrorist attack
Information [Type= discrete] [Format=numeric] [Range= 1-8] [Missing=*]
Statistics [NW/ W] [Valid=4905 / 4905 ] [Invalid=0 / 0 ]
Pre-question To which extent do you have confidence or mistrust that local Norwegian authorities are capable of handling various formsof accidents and disasters?
Literal question Terrorist attacks
Value Label Cases Weighted Percentage (Weighted)
1 Very high confidence 23 26.8 0.5%
2 High confidence 199 202.6 4.1%
3 Some confidence 594 583.6 11.9%
4 Neither confidence nor mistrust 314 317.4 6.5%
5 Some mistrust 531 512.4 10.4%
6 High mistrust 408 426.2 8.7%
7 Very high mistrust 224 223.6 4.6%
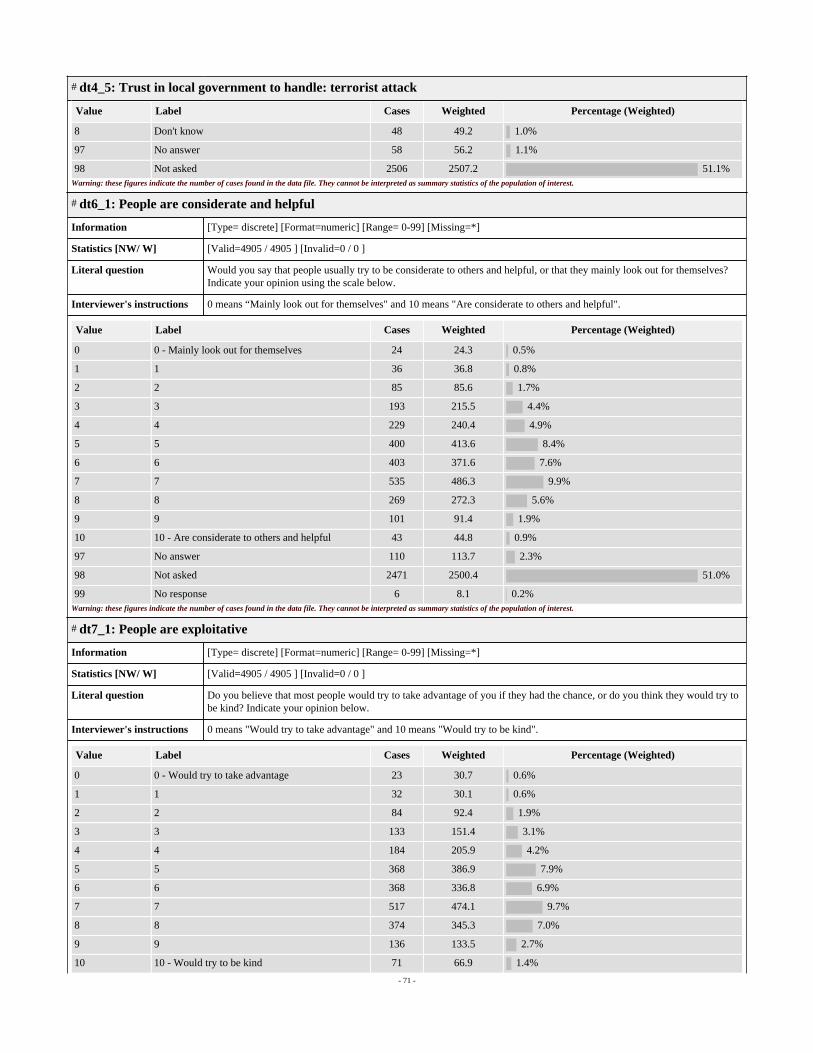
- 71 -
# dt4_5: Trust in local government to handle: terrorist attack
Value Label Cases Weighted Percentage (Weighted)
8 Don't know 48 49.2 1.0%
97 No answer 58 56.2 1.1%
98 Not asked 2506 2507.2 51.1%Warning: these figures indicate the number of cases found in the data file. They cannot be interpreted as summary statistics of the population of interest.
# dt6_1: People are considerate and helpful
Information [Type= discrete] [Format=numeric] [Range= 0-99] [Missing=*]
Statistics [NW/ W] [Valid=4905 / 4905 ] [Invalid=0 / 0 ]
Literal question Would you say that people usually try to be considerate to others and helpful, or that they mainly look out for themselves?Indicate your opinion using the scale below.
Interviewer's instructions 0 means “Mainly look out for themselves" and 10 means "Are considerate to others and helpful".
Value Label Cases Weighted Percentage (Weighted)
0 0 - Mainly look out for themselves 24 24.3 0.5%
1 1 36 36.8 0.8%
2 2 85 85.6 1.7%
3 3 193 215.5 4.4%
4 4 229 240.4 4.9%
5 5 400 413.6 8.4%
6 6 403 371.6 7.6%
7 7 535 486.3 9.9%
8 8 269 272.3 5.6%
9 9 101 91.4 1.9%
10 10 - Are considerate to others and helpful 43 44.8 0.9%
97 No answer 110 113.7 2.3%
98 Not asked 2471 2500.4 51.0%
99 No response 6 8.1 0.2%Warning: these figures indicate the number of cases found in the data file. They cannot be interpreted as summary statistics of the population of interest.
# dt7_1: People are exploitative
Information [Type= discrete] [Format=numeric] [Range= 0-99] [Missing=*]
Statistics [NW/ W] [Valid=4905 / 4905 ] [Invalid=0 / 0 ]
Literal question Do you believe that most people would try to take advantage of you if they had the chance, or do you think they would try tobe kind? Indicate your opinion below.
Interviewer's instructions 0 means "Would try to take advantage" and 10 means "Would try to be kind".
Value Label Cases Weighted Percentage (Weighted)
0 0 - Would try to take advantage 23 30.7 0.6%
1 1 32 30.1 0.6%
2 2 84 92.4 1.9%
3 3 133 151.4 3.1%
4 4 184 205.9 4.2%
5 5 368 386.9 7.9%
6 6 368 336.8 6.9%
7 7 517 474.1 9.7%
8 8 374 345.3 7.0%
9 9 136 133.5 2.7%
10 10 - Would try to be kind 71 66.9 1.4%

- 72 -
# dt7_1: People are exploitative
Value Label Cases Weighted Percentage (Weighted)
97 No answer 131 134.4 2.7%
98 Not asked 2471 2500.4 51.0%
99 No response 13 16.2 0.3%Warning: these figures indicate the number of cases found in the data file. They cannot be interpreted as summary statistics of the population of interest.
# dv30_1: Statement: lower taxes even if it means cuts to welfare
Information [Type= discrete] [Format=numeric] [Range= 1-7] [Missing=*]
Statistics [NW/ W] [Valid=4905 / 4905 ] [Invalid=0 / 0 ]
Pre-question To which extent do you agree or disagree with the following statements?
Literal question Tax rates should be lowered, even if it leads to cutbacks in the welfare state.
Value Label Cases Weighted Percentage (Weighted)
1 Strongly agree 98 114.0 2.3%
2 Agree 182 176.7 3.6%
3 Agree somewhat 374 382.9 7.8%
4 Neither agree nor disagree 287 322.4 6.6%
5 Disagree somewhat 439 421.8 8.6%
6 Disagree 530 509.5 10.4%
7 Strongly disagree 400 352.1 7.2%
97 No answer 124 125.3 2.6%
98 Not asked 2471 2500.4 51.0%Warning: these figures indicate the number of cases found in the data file. They cannot be interpreted as summary statistics of the population of interest.
# dv30_2: Statement: allow commercialized private schools
Information [Type= discrete] [Format=numeric] [Range= 1-7] [Missing=*]
Statistics [NW/ W] [Valid=4905 / 4905 ] [Invalid=0 / 0 ]
Pre-question To which extent do you agree or disagree with the following statements?
Literal question Commercial private schools should be permitted.
Value Label Cases Weighted Percentage (Weighted)
1 Strongly agree 174 185.6 3.8%
2 Agree 412 404.6 8.2%
3 Agree somewhat 483 468.8 9.6%
4 Neither agree nor disagree 330 391.8 8.0%
5 Disagree somewhat 313 314.7 6.4%
6 Disagree 302 263.8 5.4%
7 Strongly disagree 296 251.2 5.1%
97 No answer 124 124.2 2.5%
98 Not asked 2471 2500.4 51.0%Warning: these figures indicate the number of cases found in the data file. They cannot be interpreted as summary statistics of the population of interest.
# dv30_3: Statement: public services cheaper and better if left to private actors
Information [Type= discrete] [Format=numeric] [Range= 1-7] [Missing=*]
Statistics [NW/ W] [Valid=4905 / 4905 ] [Invalid=0 / 0 ]
Pre-question To which extent do you agree or disagree with the following statements?
Literal question Many public services could be carried out both better and cheaper if they were left to private parties.

- 73 -
# dv30_3: Statement: public services cheaper and better if left to private actors
Value Label Cases Weighted Percentage (Weighted)
1 Strongly agree 208 213.5 4.4%
2 Agree 408 419.8 8.6%
3 Agree somewhat 584 612.5 12.5%
4 Neither agree nor disagree 258 295.1 6.0%
5 Disagree somewhat 316 285.3 5.8%
6 Disagree 337 281.5 5.7%
7 Strongly disagree 201 177.9 3.6%
97 No answer 122 119.0 2.4%
98 Not asked 2471 2500.4 51.0%Warning: these figures indicate the number of cases found in the data file. They cannot be interpreted as summary statistics of the population of interest.
# dt8_1: Has in the last 12 months: contacted local politician
Information [Type= discrete] [Format=numeric] [Range= 0-1] [Missing=*]
Statistics [NW/ W] [Valid=4905 / 4905 ] [Invalid=0 / 0 ]
Pre-question In the course of the last 12 months, have you as an individual done any of the following to try to influence a politicaldecision?
Literal question Contacted a local politician
Value Label Cases Weighted Percentage (Weighted)
0 Not selected 4156 4172.9 85.1%
1 Selected 570 551.6 11.2%
97 No answer 179 180.5 3.7%Warning: these figures indicate the number of cases found in the data file. They cannot be interpreted as summary statistics of the population of interest.
# dt8_2: Has in the last 12 months: contacted national politician
Information [Type= discrete] [Format=numeric] [Range= 0-1] [Missing=*]
Statistics [NW/ W] [Valid=4905 / 4905 ] [Invalid=0 / 0 ]
Pre-question In the course of the last 12 months, have you as an individual done any of the following to try to influence a politicaldecision?
Literal question Contacted a national politician
Value Label Cases Weighted Percentage (Weighted)
0 Not selected 4520 4522.5 92.2%
1 Selected 206 202.0 4.1%
97 No answer 179 180.5 3.7%Warning: these figures indicate the number of cases found in the data file. They cannot be interpreted as summary statistics of the population of interest.
# dt8_3: Has in the last 12 months: contacted voluntary organization
Information [Type= discrete] [Format=numeric] [Range= 0-1] [Missing=*]
Statistics [NW/ W] [Valid=4905 / 4905 ] [Invalid=0 / 0 ]
Pre-question In the course of the last 12 months, have you as an individual done any of the following to try to influence a politicaldecision?
Literal question Contacted a voluntary organization or association
Value Label Cases Weighted Percentage (Weighted)
0 Not selected 4136 4163.1 84.9%
1 Selected 590 561.4 11.4%
97 No answer 179 180.5 3.7%Warning: these figures indicate the number of cases found in the data file. They cannot be interpreted as summary statistics of the population of interest.

- 74 -
# dt8_4: Has in the last 12 months: contacted a public official at the national level
Information [Type= discrete] [Format=numeric] [Range= 0-1] [Missing=*]
Statistics [NW/ W] [Valid=4905 / 4905 ] [Invalid=0 / 0 ]
Pre-question In the course of the last 12 months, have you as an individual done any of the following to try to influence a politicaldecision?
Literal question Contacted a public official at the national level
Value Label Cases Weighted Percentage (Weighted)
0 Not selected 4579 4601.5 93.8%
1 Selected 147 123.0 2.5%
97 No answer 179 180.5 3.7%Warning: these figures indicate the number of cases found in the data file. They cannot be interpreted as summary statistics of the population of interest.
# dt8_5: Has in the last 12 months: contacted a public official at the local level
Information [Type= discrete] [Format=numeric] [Range= 0-1] [Missing=*]
Statistics [NW/ W] [Valid=4905 / 4905 ] [Invalid=0 / 0 ]
Pre-question In the course of the last 12 months, have you as an individual done any of the following to try to influence a politicaldecision?
Literal question Contacted a public official at the local level
Value Label Cases Weighted Percentage (Weighted)
0 Not selected 4250 4245.4 86.6%
1 Selected 476 479.1 9.8%
97 No answer 179 180.5 3.7%Warning: these figures indicate the number of cases found in the data file. They cannot be interpreted as summary statistics of the population of interest.
# dt8_6: Has in the last 12 months: participated in work in a political party
Information [Type= discrete] [Format=numeric] [Range= 0-1] [Missing=*]
Statistics [NW/ W] [Valid=4905 / 4905 ] [Invalid=0 / 0 ]
Pre-question In the course of the last 12 months, have you as an individual done any of the following to try to influence a politicaldecision?
Literal question Participated in work in a political party
Value Label Cases Weighted Percentage (Weighted)
0 Not selected 4505 4505.2 91.8%
1 Selected 221 219.3 4.5%
97 No answer 179 180.5 3.7%Warning: these figures indicate the number of cases found in the data file. They cannot be interpreted as summary statistics of the population of interest.
# dt8_7: Has in the last 12 months: participated in work for protest group
Information [Type= discrete] [Format=numeric] [Range= 0-1] [Missing=*]
Statistics [NW/ W] [Valid=4905 / 4905 ] [Invalid=0 / 0 ]
Pre-question In the course of the last 12 months, have you as an individual done any of the following to try to influence a politicaldecision?
Literal question Participated in work in a political action group, local protest group or similar
Value Label Cases Weighted Percentage (Weighted)
0 Not selected 4544 4546.4 92.7%
1 Selected 182 178.2 3.6%
97 No answer 179 180.5 3.7%Warning: these figures indicate the number of cases found in the data file. They cannot be interpreted as summary statistics of the population of interest.

- 75 -
# dt8_8: Has in the last 12 months: participated in work for voluntary organization
Information [Type= discrete] [Format=numeric] [Range= 0-1] [Missing=*]
Statistics [NW/ W] [Valid=4905 / 4905 ] [Invalid=0 / 0 ]
Pre-question In the course of the last 12 months, have you as an individual done any of the following to try to influence a politicaldecision?
Literal question Participated in work in a voluntary organization or association
Value Label Cases Weighted Percentage (Weighted)
0 Not selected 3721 3793.6 77.3%
1 Selected 1005 930.9 19.0%
97 No answer 179 180.5 3.7%Warning: these figures indicate the number of cases found in the data file. They cannot be interpreted as summary statistics of the population of interest.
# dt8_9: Has in the last 12 months: worn or posted champaign sticker or emblem
Information [Type= discrete] [Format=numeric] [Range= 0-1] [Missing=*]
Statistics [NW/ W] [Valid=4905 / 4905 ] [Invalid=0 / 0 ]
Pre-question In the course of the last 12 months, have you as an individual done any of the following to try to influence a politicaldecision?
Literal question Worn or posted a campaign sticker or emblem
Value Label Cases Weighted Percentage (Weighted)
0 Not selected 4467 4476.4 91.3%
1 Selected 259 248.1 5.1%
97 No answer 179 180.5 3.7%Warning: these figures indicate the number of cases found in the data file. They cannot be interpreted as summary statistics of the population of interest.
# dt8_10: Has in the last 12 months: signed a petition
Information [Type= discrete] [Format=numeric] [Range= 0-1] [Missing=*]
Statistics [NW/ W] [Valid=4905 / 4905 ] [Invalid=0 / 0 ]
Pre-question In the course of the last 12 months, have you as an individual done any of the following to try to influence a politicaldecision?
Literal question Signed an appeal, a petition, action list or similar
Value Label Cases Weighted Percentage (Weighted)
0 Not selected 3379 3517.1 71.7%
1 Selected 1347 1207.4 24.6%
97 No answer 179 180.5 3.7%Warning: these figures indicate the number of cases found in the data file. They cannot be interpreted as summary statistics of the population of interest.
# dt8_11: Has in the last 12 months: participated in public protest
Information [Type= discrete] [Format=numeric] [Range= 0-1] [Missing=*]
Statistics [NW/ W] [Valid=4905 / 4905 ] [Invalid=0 / 0 ]
Pre-question In the course of the last 12 months, have you as an individual done any of the following to try to influence a politicaldecision?
Literal question Participated in a public demonstration
Value Label Cases Weighted Percentage (Weighted)
0 Not selected 4502 4516.2 92.1%
1 Selected 224 208.3 4.2%
97 No answer 179 180.5 3.7%Warning: these figures indicate the number of cases found in the data file. They cannot be interpreted as summary statistics of the population of interest.

- 76 -
# dt8_12: Has in the last 12 months: boycotted certain products
Information [Type= discrete] [Format=numeric] [Range= 0-1] [Missing=*]
Statistics [NW/ W] [Valid=4905 / 4905 ] [Invalid=0 / 0 ]
Pre-question In the course of the last 12 months, have you as an individual done any of the following to try to influence a politicaldecision?
Literal question Boycotted specific products
Value Label Cases Weighted Percentage (Weighted)
0 Not selected 3479 3616.3 73.7%
1 Selected 1247 1108.2 22.6%
97 No answer 179 180.5 3.7%Warning: these figures indicate the number of cases found in the data file. They cannot be interpreted as summary statistics of the population of interest.
# dt8_13: Has in the last 12 months: consciously puchased specific products for political reasons
Information [Type= discrete] [Format=numeric] [Range= 0-1] [Missing=*]
Statistics [NW/ W] [Valid=4905 / 4905 ] [Invalid=0 / 0 ]
Pre-question In the course of the last 12 months, have you as an individual done any of the following to try to influence a politicaldecision?
Literal question Consciously purchased specific products for political, moral or environmental reasons
Value Label Cases Weighted Percentage (Weighted)
0 Not selected 3132 3315.7 67.6%
1 Selected 1594 1408.8 28.7%
97 No answer 179 180.5 3.7%Warning: these figures indicate the number of cases found in the data file. They cannot be interpreted as summary statistics of the population of interest.
# dt8_14: Has in the last 12 months: provided financial support
Information [Type= discrete] [Format=numeric] [Range= 0-1] [Missing=*]
Statistics [NW/ W] [Valid=4905 / 4905 ] [Invalid=0 / 0 ]
Pre-question In the course of the last 12 months, have you as an individual done any of the following to try to influence a politicaldecision?
Literal question Provided financial support
Value Label Cases Weighted Percentage (Weighted)
0 Not selected 2908 2977.1 60.7%
1 Selected 1818 1747.4 35.6%
97 No answer 179 180.5 3.7%Warning: these figures indicate the number of cases found in the data file. They cannot be interpreted as summary statistics of the population of interest.

- 77 -
# dt8_15: Has in the last 12 months: collected money
Information [Type= discrete] [Format=numeric] [Range= 0-1] [Missing=*]
Statistics [NW/ W] [Valid=4905 / 4905 ] [Invalid=0 / 0 ]
Pre-question In the course of the last 12 months, have you as an individual done any of the following to try to influence a politicaldecision?
Literal question Collected money
Value Label Cases Weighted Percentage (Weighted)
0 Not selected 4344 4353.1 88.7%
1 Selected 382 371.4 7.6%
97 No answer 179 180.5 3.7%Warning: these figures indicate the number of cases found in the data file. They cannot be interpreted as summary statistics of the population of interest.
# dt8_16: Has in the last 12 months: contacted or appeared in media
Information [Type= discrete] [Format=numeric] [Range= 0-1] [Missing=*]
Statistics [NW/ W] [Valid=4905 / 4905 ] [Invalid=0 / 0 ]
Pre-question In the course of the last 12 months, have you as an individual done any of the following to try to influence a politicaldecision?
Literal question Contacted or appeared in the media
Value Label Cases Weighted Percentage (Weighted)
0 Not selected 4432 4450.6 90.7%
1 Selected 294 273.9 5.6%
97 No answer 179 180.5 3.7%Warning: these figures indicate the number of cases found in the data file. They cannot be interpreted as summary statistics of the population of interest.
# dt8_17: Has in the last 12 months: contacted lawyer
Information [Type= discrete] [Format=numeric] [Range= 0-1] [Missing=*]
Statistics [NW/ W] [Valid=4905 / 4905 ] [Invalid=0 / 0 ]
Pre-question In the course of the last 12 months, have you as an individual done any of the following to try to influence a politicaldecision?
Literal question Contacted a lawyer or legal advisor
Value Label Cases Weighted Percentage (Weighted)
0 Not selected 4534 4508.7 91.9%
1 Selected 192 215.8 4.4%
97 No answer 179 180.5 3.7%Warning: these figures indicate the number of cases found in the data file. They cannot be interpreted as summary statistics of the population of interest.
# dt8_18: Has in the last 12 months: participated in public meeting
Information [Type= discrete] [Format=numeric] [Range= 0-1] [Missing=*]
Statistics [NW/ W] [Valid=4905 / 4905 ] [Invalid=0 / 0 ]
Pre-question In the course of the last 12 months, have you as an individual done any of the following to try to influence a politicaldecision?
Literal question Participated in a public meeting
Value Label Cases Weighted Percentage (Weighted)
0 Not selected 4029 4082.4 83.2%
1 Selected 697 642.1 13.1%
97 No answer 179 180.5 3.7%Warning: these figures indicate the number of cases found in the data file. They cannot be interpreted as summary statistics of the population of interest.

- 78 -
# dt8_19: Has in the last 12 months: participated in political meeting
Information [Type= discrete] [Format=numeric] [Range= 0-1] [Missing=*]
Statistics [NW/ W] [Valid=4905 / 4905 ] [Invalid=0 / 0 ]
Pre-question In the course of the last 12 months, have you as an individual done any of the following to try to influence a politicaldecision?
Literal question Participated at a political meeting or event
Value Label Cases Weighted Percentage (Weighted)
0 Not selected 4311 4313.0 87.9%
1 Selected 415 411.5 8.4%
97 No answer 179 180.5 3.7%Warning: these figures indicate the number of cases found in the data file. They cannot be interpreted as summary statistics of the population of interest.
# dt9_1: Has in the last 12 months:, in community: participated in public meeting
Information [Type= discrete] [Format=numeric] [Range= 0-1] [Missing=*]
Statistics [NW/ W] [Valid=4905 / 4905 ] [Invalid=0 / 0 ]
Pre-question Have you in the past 12 months participated in any of the following activities to improve conditions in your ownneighbourhood or community?
Literal question Participated in or taken the initiative to a public meeting to discuss issues related to conditions in the community
Interviewer's instructions Check if yes.
Value Label Cases Weighted Percentage (Weighted)
0 Not selected 2093 2083.9 42.5%
1 Selected 260 239.9 4.9%
97 No answer 81 80.8 1.6%
98 Not asked 2471 2500.4 51.0%Warning: these figures indicate the number of cases found in the data file. They cannot be interpreted as summary statistics of the population of interest.
# dt9_2: Has in the last 12 months:, in community: participated in voluntary work
Information [Type= discrete] [Format=numeric] [Range= 0-1] [Missing=*]
Statistics [NW/ W] [Valid=4905 / 4905 ] [Invalid=0 / 0 ]
Pre-question Have you in the past 12 months participated in any of the following activities to improve conditions in your ownneighbourhood or community?
Literal question Participated in or taken the initiative for voluntary work to fix or improve something in the community
Interviewer's instructions Check if yes.
Value Label Cases Weighted Percentage (Weighted)
0 Not selected 1414 1436.5 29.3%
1 Selected 939 887.3 18.1%
97 No answer 81 80.8 1.6%
98 Not asked 2471 2500.4 51.0%Warning: these figures indicate the number of cases found in the data file. They cannot be interpreted as summary statistics of the population of interest.
# dt9_3: Has in the last 12 months:, in community: been involved in association
Information [Type= discrete] [Format=numeric] [Range= 0-1] [Missing=*]
Statistics [NW/ W] [Valid=4905 / 4905 ] [Invalid=0 / 0 ]
Pre-question Have you in the past 12 months participated in any of the following activities to improve conditions in your ownneighbourhood or community?
Literal question Become involved in a residents' association, neighbourhood association or similar organizations in the community
Interviewer's instructions Check if yes.

- 79 -
# dt9_3: Has in the last 12 months:, in community: been involved in association
Value Label Cases Weighted Percentage (Weighted)
0 Not selected 1734 1752.1 35.7%
1 Selected 619 571.7 11.7%
97 No answer 81 80.8 1.6%
98 Not asked 2471 2500.4 51.0%Warning: these figures indicate the number of cases found in the data file. They cannot be interpreted as summary statistics of the population of interest.
# dt10_1: Membership: Sports or outdoor organization
Information [Type= discrete] [Format=numeric] [Range= 0-1] [Missing=*]
Statistics [NW/ W] [Valid=4905 / 4905 ] [Invalid=0 / 0 ]
Pre-question Below we have listed some types of organizations. Could you place a checkmark if you are a member of any of these?
Literal question Sports or outdoor organization
Interviewer's instructions Check if yes.
Value Label Cases Weighted Percentage (Weighted)
0 Not selected 1656 1696.1 34.6%
1 Selected 694 624.8 12.7%
97 No answer 84 83.7 1.7%
98 Not asked 2471 2500.4 51.0%Warning: these figures indicate the number of cases found in the data file. They cannot be interpreted as summary statistics of the population of interest.
# dt10_2: Membership: Humanitarian aid organization
Information [Type= discrete] [Format=numeric] [Range= 0-1] [Missing=*]
Statistics [NW/ W] [Valid=4905 / 4905 ] [Invalid=0 / 0 ]
Pre-question Below we have listed some types of organizations. Could you place a checkmark if you are a member of any of these?
Literal question Humanitarian aid organization
Interviewer's instructions Check if yes.
Value Label Cases Weighted Percentage (Weighted)
0 Not selected 1914 1944.6 39.6%
1 Selected 436 376.3 7.7%
97 No answer 84 83.7 1.7%
98 Not asked 2471 2500.4 51.0%Warning: these figures indicate the number of cases found in the data file. They cannot be interpreted as summary statistics of the population of interest.
# dt10_3: Membership: Religious or other belief organization
Information [Type= discrete] [Format=numeric] [Range= 0-1] [Missing=*]
Statistics [NW/ W] [Valid=4905 / 4905 ] [Invalid=0 / 0 ]
Pre-question Below we have listed some types of organizations. Could you place a checkmark if you are a member of any of these?
Literal question Religious or other belief organization
Interviewer's instructions Check if yes.
Value Label Cases Weighted Percentage (Weighted)
0 Not selected 2074 2091.3 42.6%
1 Selected 276 229.6 4.7%
97 No answer 84 83.7 1.7%
98 Not asked 2471 2500.4 51.0%Warning: these figures indicate the number of cases found in the data file. They cannot be interpreted as summary statistics of the population of interest.

- 80 -
# dt10_4: Membership: Political party
Information [Type= discrete] [Format=numeric] [Range= 0-1] [Missing=*]
Statistics [NW/ W] [Valid=4905 / 4905 ] [Invalid=0 / 0 ]
Pre-question Below we have listed some types of organizations. Could you place a checkmark if you are a member of any of these?
Literal question Political party
Interviewer's instructions Check if yes.
Value Label Cases Weighted Percentage (Weighted)
0 Not selected 2145 2114.0 43.1%
1 Selected 205 206.9 4.2%
97 No answer 84 83.7 1.7%
98 Not asked 2471 2500.4 51.0%Warning: these figures indicate the number of cases found in the data file. They cannot be interpreted as summary statistics of the population of interest.
# dt10_5: Membership: Temperance organization
Information [Type= discrete] [Format=numeric] [Range= 0-1] [Missing=*]
Statistics [NW/ W] [Valid=4905 / 4905 ] [Invalid=0 / 0 ]
Pre-question Below we have listed some types of organizations. Could you place a checkmark if you are a member of any of these?
Literal question Temperance organization
Interviewer's instructions Check if yes.
Value Label Cases Weighted Percentage (Weighted)
0 Not selected 2332 2297.8 46.8%
1 Selected 18 23.2 0.5%
97 No answer 84 83.7 1.7%
98 Not asked 2471 2500.4 51.0%Warning: these figures indicate the number of cases found in the data file. They cannot be interpreted as summary statistics of the population of interest.
# dt10_6: Membership: Language organization or similar
Information [Type= discrete] [Format=numeric] [Range= 0-1] [Missing=*]
Statistics [NW/ W] [Valid=4905 / 4905 ] [Invalid=0 / 0 ]
Pre-question Below we have listed some types of organizations. Could you place a checkmark if you are a member of any of these?
Literal question Language organization or similar
Interviewer's instructions Check if yes.
Value Label Cases Weighted Percentage (Weighted)
0 Not selected 2323 2298.8 46.9%
1 Selected 27 22.1 0.4%
97 No answer 84 83.7 1.7%
98 Not asked 2471 2500.4 51.0%Warning: these figures indicate the number of cases found in the data file. They cannot be interpreted as summary statistics of the population of interest.
# dt10_7: Membership: Environmental protection/animal welfare organization
Information [Type= discrete] [Format=numeric] [Range= 0-1] [Missing=*]
Statistics [NW/ W] [Valid=4905 / 4905 ] [Invalid=0 / 0 ]
Pre-question Below we have listed some types of organizations. Could you place a checkmark if you are a member of any of these?
Literal question Environmental protection/animal welfare organization
Interviewer's instructions Check if yes.

- 81 -
# dt10_7: Membership: Environmental protection/animal welfare organization
Value Label Cases Weighted Percentage (Weighted)
0 Not selected 2199 2194.9 44.7%
1 Selected 151 126.0 2.6%
97 No answer 84 83.7 1.7%
98 Not asked 2471 2500.4 51.0%Warning: these figures indicate the number of cases found in the data file. They cannot be interpreted as summary statistics of the population of interest.
# dt10_8: Membership: Residents' association/neighbourhood association
Information [Type= discrete] [Format=numeric] [Range= 0-1] [Missing=*]
Statistics [NW/ W] [Valid=4905 / 4905 ] [Invalid=0 / 0 ]
Pre-question Below we have listed some types of organizations. Could you place a checkmark if you are a member of any of these?
Literal question Residents' association/neighbourhood association/community association
Interviewer's instructions Check if yes.
Value Label Cases Weighted Percentage (Weighted)
0 Not selected 1797 1816.9 37.0%
1 Selected 553 504.1 10.3%
97 No answer 84 83.7 1.7%
98 Not asked 2471 2500.4 51.0%Warning: these figures indicate the number of cases found in the data file. They cannot be interpreted as summary statistics of the population of interest.
# dt10_9: Membership: Housing cooperative
Information [Type= discrete] [Format=numeric] [Range= 0-1] [Missing=*]
Statistics [NW/ W] [Valid=4905 / 4905 ] [Invalid=0 / 0 ]
Pre-question Below we have listed some types of organizations. Could you place a checkmark if you are a member of any of these?
Literal question Housing cooperative
Interviewer's instructions Check if yes.
Value Label Cases Weighted Percentage (Weighted)
0 Not selected 1913 1909.6 38.9%
1 Selected 437 411.3 8.4%
97 No answer 84 83.7 1.7%
98 Not asked 2471 2500.4 51.0%Warning: these figures indicate the number of cases found in the data file. They cannot be interpreted as summary statistics of the population of interest.
# dt10_10: Membership: House owner association and land owner association
Information [Type= discrete] [Format=numeric] [Range= 0-1] [Missing=*]
Statistics [NW/ W] [Valid=4905 / 4905 ] [Invalid=0 / 0 ]
Pre-question Below we have listed some types of organizations. Could you place a checkmark if you are a member of any of these?
Literal question House owner association and land owner association
Interviewer's instructions Check if yes.
Value Label Cases Weighted Percentage (Weighted)
0 Not selected 1985 1989.3 40.6%
1 Selected 365 331.6 6.8%
97 No answer 84 83.7 1.7%
98 Not asked 2471 2500.4 51.0%Warning: these figures indicate the number of cases found in the data file. They cannot be interpreted as summary statistics of the population of interest.

- 82 -
# dt10_11: Membership: Consumer organization
Information [Type= discrete] [Format=numeric] [Range= 0-1] [Missing=*]
Statistics [NW/ W] [Valid=4905 / 4905 ] [Invalid=0 / 0 ]
Pre-question Below we have listed some types of organizations. Could you place a checkmark if you are a member of any of these?
Literal question Cultural association (music, dance, theatre, hobby, etc.)
Interviewer's instructions Check if yes.
Value Label Cases Weighted Percentage (Weighted)
0 Not selected 2002 1993.8 40.6%
1 Selected 348 327.2 6.7%
97 No answer 84 83.7 1.7%
98 Not asked 2471 2500.4 51.0%Warning: these figures indicate the number of cases found in the data file. They cannot be interpreted as summary statistics of the population of interest.
# dt10_12: Membership: Lodge
Information [Type= discrete] [Format=numeric] [Range= 0-1] [Missing=*]
Statistics [NW/ W] [Valid=4905 / 4905 ] [Invalid=0 / 0 ]
Pre-question Below we have listed some types of organizations. Could you place a checkmark if you are a member of any of these?
Literal question Lodge
Interviewer's instructions Check if yes.
Value Label Cases Weighted Percentage (Weighted)
0 Not selected 2280 2249.1 45.9%
1 Selected 70 71.8 1.5%
97 No answer 84 83.7 1.7%
98 Not asked 2471 2500.4 51.0%Warning: these figures indicate the number of cases found in the data file. They cannot be interpreted as summary statistics of the population of interest.
# dt10_13: Membership: Consumer association
Information [Type= discrete] [Format=numeric] [Range= 0-1] [Missing=*]
Statistics [NW/ W] [Valid=4905 / 4905 ] [Invalid=0 / 0 ]
Pre-question Below we have listed some types of organizations. Could you place a checkmark if you are a member of any of these?
Literal question Consumer organization
Interviewer's instructions Check if yes.
Value Label Cases Weighted Percentage (Weighted)
0 Not selected 2273 2256.6 46.0%
1 Selected 77 64.3 1.3%
97 No answer 84 83.7 1.7%
98 Not asked 2471 2500.4 51.0%Warning: these figures indicate the number of cases found in the data file. They cannot be interpreted as summary statistics of the population of interest.
# dt10_14: Membership: Car association
Information [Type= discrete] [Format=numeric] [Range= 0-1] [Missing=*]
Statistics [NW/ W] [Valid=4905 / 4905 ] [Invalid=0 / 0 ]
Pre-question Below we have listed some types of organizations. Could you place a checkmark if you are a member of any of these?
Literal question Car association
Interviewer's instructions Check if yes.

- 83 -
# dt10_14: Membership: Car association
Value Label Cases Weighted Percentage (Weighted)
0 Not selected 1901 1917.8 39.1%
1 Selected 449 403.2 8.2%
97 No answer 84 83.7 1.7%
98 Not asked 2471 2500.4 51.0%Warning: these figures indicate the number of cases found in the data file. They cannot be interpreted as summary statistics of the population of interest.
# dt10_15: Membership: Patient association or interest organization for the disabled
Information [Type= discrete] [Format=numeric] [Range= 0-1] [Missing=*]
Statistics [NW/ W] [Valid=4905 / 4905 ] [Invalid=0 / 0 ]
Pre-question Below we have listed some types of organizations. Could you place a checkmark if you are a member of any of these?
Literal question Patient association or interest organization for the disabled
Interviewer's instructions Check if yes.
Value Label Cases Weighted Percentage (Weighted)
0 Not selected 2233 2188.7 44.6%
1 Selected 117 132.2 2.7%
97 No answer 84 83.7 1.7%
98 Not asked 2471 2500.4 51.0%Warning: these figures indicate the number of cases found in the data file. They cannot be interpreted as summary statistics of the population of interest.
# dt10_16: Membership: Pensioner association
Information [Type= discrete] [Format=numeric] [Range= 0-1] [Missing=*]
Statistics [NW/ W] [Valid=4905 / 4905 ] [Invalid=0 / 0 ]
Pre-question Below we have listed some types of organizations. Could you place a checkmark if you are a member of any of these?
Literal question Pensioner association
Interviewer's instructions Check if yes.
Value Label Cases Weighted Percentage (Weighted)
0 Not selected 2215 2160.2 44.0%
1 Selected 135 160.7 3.3%
97 No answer 84 83.7 1.7%
98 Not asked 2471 2500.4 51.0%Warning: these figures indicate the number of cases found in the data file. They cannot be interpreted as summary statistics of the population of interest.
# dt10_17: Membership: Parents' association
Information [Type= discrete] [Format=numeric] [Range= 0-1] [Missing=*]
Statistics [NW/ W] [Valid=4905 / 4905 ] [Invalid=0 / 0 ]
Pre-question Below we have listed some types of organizations. Could you place a checkmark if you are a member of any of these?
Literal question Parents' association
Interviewer's instructions Check if yes.
Value Label Cases Weighted Percentage (Weighted)
0 Not selected 2244 2235.5 45.6%
1 Selected 106 85.4 1.7%
97 No answer 84 83.7 1.7%
98 Not asked 2471 2500.4 51.0%Warning: these figures indicate the number of cases found in the data file. They cannot be interpreted as summary statistics of the population of interest.

- 84 -
# dt10_18: Membership: Immigrant association
Information [Type= discrete] [Format=numeric] [Range= 0-1] [Missing=*]
Statistics [NW/ W] [Valid=4905 / 4905 ] [Invalid=0 / 0 ]
Pre-question Below we have listed some types of organizations. Could you place a checkmark if you are a member of any of these?
Literal question Immigrant association
Interviewer's instructions Check if yes.
Value Label Cases Weighted Percentage (Weighted)
0 Not selected 2331 2295.8 46.8%
1 Selected 19 25.1 0.5%
97 No answer 84 83.7 1.7%
98 Not asked 2471 2500.4 51.0%Warning: these figures indicate the number of cases found in the data file. They cannot be interpreted as summary statistics of the population of interest.
# dt10_19: Membership: Employee organization/trade union
Information [Type= discrete] [Format=numeric] [Range= 0-1] [Missing=*]
Statistics [NW/ W] [Valid=4905 / 4905 ] [Invalid=0 / 0 ]
Pre-question Below we have listed some types of organizations. Could you place a checkmark if you are a member of any of these?
Literal question Employee organization/trade union
Interviewer's instructions Check if yes.
Value Label Cases Weighted Percentage (Weighted)
0 Not selected 1477 1565.5 31.9%
1 Selected 873 755.4 15.4%
97 No answer 84 83.7 1.7%
98 Not asked 2471 2500.4 51.0%Warning: these figures indicate the number of cases found in the data file. They cannot be interpreted as summary statistics of the population of interest.
# dt10_20: Membership: Business and employer organization
Information [Type= discrete] [Format=numeric] [Range= 0-1] [Missing=*]
Statistics [NW/ W] [Valid=4905 / 4905 ] [Invalid=0 / 0 ]
Pre-question Below we have listed some types of organizations. Could you place a checkmark if you are a member of any of these?
Literal question Business and employer organization
Interviewer's instructions Check if yes.
Value Label Cases Weighted Percentage (Weighted)
0 Not selected 2238 2224.4 45.3%
1 Selected 112 96.5 2.0%
97 No answer 84 83.7 1.7%
98 Not asked 2471 2500.4 51.0%Warning: these figures indicate the number of cases found in the data file. They cannot be interpreted as summary statistics of the population of interest.
# dt10_21: Membership: Agricultural or fisheries organization
Information [Type= discrete] [Format=numeric] [Range= 0-1] [Missing=*]
Statistics [NW/ W] [Valid=4905 / 4905 ] [Invalid=0 / 0 ]
Pre-question Below we have listed some types of organizations. Could you place a checkmark if you are a member of any of these?
Literal question Agricultural or fisheries organization
Interviewer's instructions Check if yes.
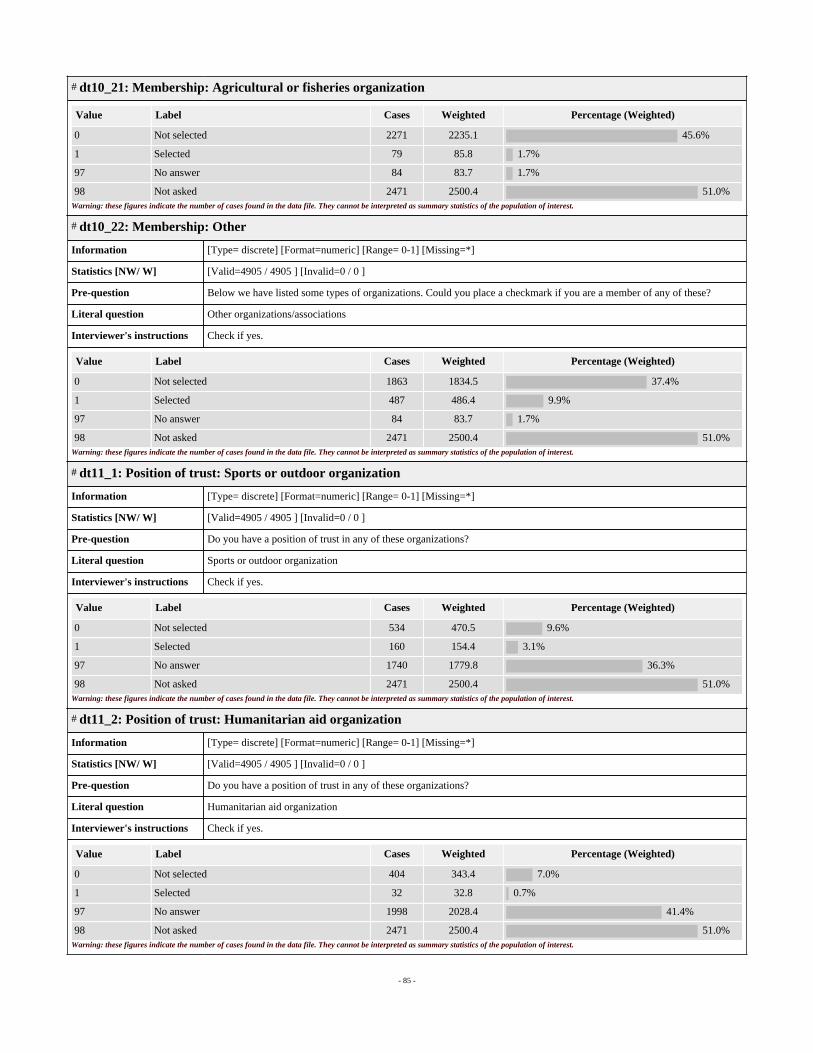
- 85 -
# dt10_21: Membership: Agricultural or fisheries organization
Value Label Cases Weighted Percentage (Weighted)
0 Not selected 2271 2235.1 45.6%
1 Selected 79 85.8 1.7%
97 No answer 84 83.7 1.7%
98 Not asked 2471 2500.4 51.0%Warning: these figures indicate the number of cases found in the data file. They cannot be interpreted as summary statistics of the population of interest.
# dt10_22: Membership: Other
Information [Type= discrete] [Format=numeric] [Range= 0-1] [Missing=*]
Statistics [NW/ W] [Valid=4905 / 4905 ] [Invalid=0 / 0 ]
Pre-question Below we have listed some types of organizations. Could you place a checkmark if you are a member of any of these?
Literal question Other organizations/associations
Interviewer's instructions Check if yes.
Value Label Cases Weighted Percentage (Weighted)
0 Not selected 1863 1834.5 37.4%
1 Selected 487 486.4 9.9%
97 No answer 84 83.7 1.7%
98 Not asked 2471 2500.4 51.0%Warning: these figures indicate the number of cases found in the data file. They cannot be interpreted as summary statistics of the population of interest.
# dt11_1: Position of trust: Sports or outdoor organization
Information [Type= discrete] [Format=numeric] [Range= 0-1] [Missing=*]
Statistics [NW/ W] [Valid=4905 / 4905 ] [Invalid=0 / 0 ]
Pre-question Do you have a position of trust in any of these organizations?
Literal question Sports or outdoor organization
Interviewer's instructions Check if yes.
Value Label Cases Weighted Percentage (Weighted)
0 Not selected 534 470.5 9.6%
1 Selected 160 154.4 3.1%
97 No answer 1740 1779.8 36.3%
98 Not asked 2471 2500.4 51.0%Warning: these figures indicate the number of cases found in the data file. They cannot be interpreted as summary statistics of the population of interest.
# dt11_2: Position of trust: Humanitarian aid organization
Information [Type= discrete] [Format=numeric] [Range= 0-1] [Missing=*]
Statistics [NW/ W] [Valid=4905 / 4905 ] [Invalid=0 / 0 ]
Pre-question Do you have a position of trust in any of these organizations?
Literal question Humanitarian aid organization
Interviewer's instructions Check if yes.
Value Label Cases Weighted Percentage (Weighted)
0 Not selected 404 343.4 7.0%
1 Selected 32 32.8 0.7%
97 No answer 1998 2028.4 41.4%
98 Not asked 2471 2500.4 51.0%Warning: these figures indicate the number of cases found in the data file. They cannot be interpreted as summary statistics of the population of interest.

- 86 -
# dt11_3: Position of trust: Religious or other belief organization
Information [Type= discrete] [Format=numeric] [Range= 0-1] [Missing=*]
Statistics [NW/ W] [Valid=4905 / 4905 ] [Invalid=0 / 0 ]
Pre-question Do you have a position of trust in any of these organizations?
Literal question Religious or other belief organization
Interviewer's instructions Check if yes.
Value Label Cases Weighted Percentage (Weighted)
0 Not selected 196 154.1 3.1%
1 Selected 80 75.5 1.5%
97 No answer 2158 2175.1 44.3%
98 Not asked 2471 2500.4 51.0%Warning: these figures indicate the number of cases found in the data file. They cannot be interpreted as summary statistics of the population of interest.
# dt11_4: Position of trust: Political party
Information [Type= discrete] [Format=numeric] [Range= 0-1] [Missing=*]
Statistics [NW/ W] [Valid=4905 / 4905 ] [Invalid=0 / 0 ]
Pre-question Do you have a position of trust in any of these organizations?
Literal question Political party
Interviewer's instructions Check if yes.
Value Label Cases Weighted Percentage (Weighted)
0 Not selected 158 164.1 3.3%
1 Selected 47 42.8 0.9%
97 No answer 2229 2197.8 44.8%
98 Not asked 2471 2500.4 51.0%Warning: these figures indicate the number of cases found in the data file. They cannot be interpreted as summary statistics of the population of interest.
# dt11_5: Position of trust: Temperance organization
Information [Type= discrete] [Format=numeric] [Range= 0-1] [Missing=*]
Statistics [NW/ W] [Valid=4905 / 4905 ] [Invalid=0 / 0 ]
Pre-question Do you have a position of trust in any of these organizations?
Literal question Temperance organization
Interviewer's instructions Check if yes.
Value Label Cases Weighted Percentage (Weighted)
0 Not selected 14 18.4 0.4%
1 Selected 4 4.8 0.1%
97 No answer 2416 2381.5 48.6%
98 Not asked 2471 2500.4 51.0%Warning: these figures indicate the number of cases found in the data file. They cannot be interpreted as summary statistics of the population of interest.
# dt11_6: Position of trust: Language organization or similar
Information [Type= discrete] [Format=numeric] [Range= 0-1] [Missing=*]
Statistics [NW/ W] [Valid=4905 / 4905 ] [Invalid=0 / 0 ]
Pre-question Do you have a position of trust in any of these organizations?
Literal question Language organization or similar
Interviewer's instructions Check if yes.

- 87 -
# dt11_6: Position of trust: Language organization or similar
Value Label Cases Weighted Percentage (Weighted)
0 Not selected 25 20.2 0.4%
1 Selected 2 1.8 0.0%
97 No answer 2407 2382.6 48.6%
98 Not asked 2471 2500.4 51.0%Warning: these figures indicate the number of cases found in the data file. They cannot be interpreted as summary statistics of the population of interest.
# dt11_7: Position of trust: Environmental protection/animal welfare organization
Information [Type= discrete] [Format=numeric] [Range= 0-1] [Missing=*]
Statistics [NW/ W] [Valid=4905 / 4905 ] [Invalid=0 / 0 ]
Pre-question Do you have a position of trust in any of these organizations?
Literal question Environmental protection/animal welfare organization
Interviewer's instructions Check if yes.
Value Label Cases Weighted Percentage (Weighted)
0 Not selected 133 108.9 2.2%
1 Selected 18 17.1 0.3%
97 No answer 2283 2278.6 46.5%
98 Not asked 2471 2500.4 51.0%Warning: these figures indicate the number of cases found in the data file. They cannot be interpreted as summary statistics of the population of interest.
# dt11_8: Position of trust: Residents' association/neighbourhood association/community association
Information [Type= discrete] [Format=numeric] [Range= 0-1] [Missing=*]
Statistics [NW/ W] [Valid=4905 / 4905 ] [Invalid=0 / 0 ]
Pre-question Do you have a position of trust in any of these organizations?
Literal question Residents' association/neighbourhood association/community association
Interviewer's instructions Check if yes.
Value Label Cases Weighted Percentage (Weighted)
0 Not selected 426 395.3 8.1%
1 Selected 127 108.8 2.2%
97 No answer 1881 1900.6 38.7%
98 Not asked 2471 2500.4 51.0%Warning: these figures indicate the number of cases found in the data file. They cannot be interpreted as summary statistics of the population of interest.
# dt11_9: Position of trust: Housing cooperative
Information [Type= discrete] [Format=numeric] [Range= 0-1] [Missing=*]
Statistics [NW/ W] [Valid=4905 / 4905 ] [Invalid=0 / 0 ]
Pre-question Do you have a position of trust in any of these organizations?
Literal question Housing cooperative
Interviewer's instructions Check if yes.
Value Label Cases Weighted Percentage (Weighted)
0 Not selected 348 329.2 6.7%
1 Selected 89 82.1 1.7%
97 No answer 1997 1993.3 40.6%
98 Not asked 2471 2500.4 51.0%Warning: these figures indicate the number of cases found in the data file. They cannot be interpreted as summary statistics of the population of interest.

- 88 -
# dt11_10: Position of trust: House owner association and land owner association
Information [Type= discrete] [Format=numeric] [Range= 0-1] [Missing=*]
Statistics [NW/ W] [Valid=4905 / 4905 ] [Invalid=0 / 0 ]
Pre-question Do you have a position of trust in any of these organizations?
Literal question House owner association and land owner association
Interviewer's instructions Check if yes.
Value Label Cases Weighted Percentage (Weighted)
0 Not selected 342 312.8 6.4%
1 Selected 23 18.8 0.4%
97 No answer 2069 2073.0 42.3%
98 Not asked 2471 2500.4 51.0%Warning: these figures indicate the number of cases found in the data file. They cannot be interpreted as summary statistics of the population of interest.
# dt11_11: Position of trust: Cultural association
Information [Type= discrete] [Format=numeric] [Range= 0-1] [Missing=*]
Statistics [NW/ W] [Valid=4905 / 4905 ] [Invalid=0 / 0 ]
Pre-question Do you have a position of trust in any of these organizations?
Literal question Cultural association (music, dance, theatre, hobby, etc.)
Interviewer's instructions Check if yes.
Value Label Cases Weighted Percentage (Weighted)
0 Not selected 262 239.4 4.9%
1 Selected 86 87.8 1.8%
97 No answer 2086 2077.5 42.4%
98 Not asked 2471 2500.4 51.0%Warning: these figures indicate the number of cases found in the data file. They cannot be interpreted as summary statistics of the population of interest.
# dt11_12: Position of trust: Lodge
Information [Type= discrete] [Format=numeric] [Range= 0-1] [Missing=*]
Statistics [NW/ W] [Valid=4905 / 4905 ] [Invalid=0 / 0 ]
Pre-question Do you have a position of trust in any of these organizations?
Literal question Lodge
Interviewer's instructions Check if yes.
Value Label Cases Weighted Percentage (Weighted)
0 Not selected 51 49.2 1.0%
1 Selected 19 22.6 0.5%
97 No answer 2364 2332.9 47.6%
98 Not asked 2471 2500.4 51.0%Warning: these figures indicate the number of cases found in the data file. They cannot be interpreted as summary statistics of the population of interest.
# dt11_13: Position of trust: Consumer organization
Information [Type= discrete] [Format=numeric] [Range= 0-1] [Missing=*]
Statistics [NW/ W] [Valid=4905 / 4905 ] [Invalid=0 / 0 ]
Pre-question Do you have a position of trust in any of these organizations?
Literal question Consumer organization
Interviewer's instructions Check if yes.

- 89 -
# dt11_13: Position of trust: Consumer organization
Value Label Cases Weighted Percentage (Weighted)
0 Not selected 75 63.4 1.3%
1 Selected 2 0.9 0.0%
97 No answer 2357 2340.4 47.7%
98 Not asked 2471 2500.4 51.0%Warning: these figures indicate the number of cases found in the data file. They cannot be interpreted as summary statistics of the population of interest.
# dt11_14: Position of trust: Car association
Information [Type= discrete] [Format=numeric] [Range= 0-1] [Missing=*]
Statistics [NW/ W] [Valid=4905 / 4905 ] [Invalid=0 / 0 ]
Pre-question Do you have a position of trust in any of these organizations?
Literal question Car association
Interviewer's instructions Check if yes.
Value Label Cases Weighted Percentage (Weighted)
0 Not selected 437 389.0 7.9%
1 Selected 12 14.1 0.3%
97 No answer 1985 2001.5 40.8%
98 Not asked 2471 2500.4 51.0%Warning: these figures indicate the number of cases found in the data file. They cannot be interpreted as summary statistics of the population of interest.
# dt11_15: Position of trust: Patient association or interest organization for the disabled
Information [Type= discrete] [Format=numeric] [Range= 0-1] [Missing=*]
Statistics [NW/ W] [Valid=4905 / 4905 ] [Invalid=0 / 0 ]
Pre-question Do you have a position of trust in any of these organizations?
Literal question Patient association or interest organization for the disabled
Interviewer's instructions Check if yes.
Value Label Cases Weighted Percentage (Weighted)
0 Not selected 103 116.3 2.4%
1 Selected 14 15.9 0.3%
97 No answer 2317 2272.4 46.3%
98 Not asked 2471 2500.4 51.0%Warning: these figures indicate the number of cases found in the data file. They cannot be interpreted as summary statistics of the population of interest.
# dt11_16: Position of trust: Pensioner association
Information [Type= discrete] [Format=numeric] [Range= 0-1] [Missing=*]
Statistics [NW/ W] [Valid=4905 / 4905 ] [Invalid=0 / 0 ]
Pre-question Do you have a position of trust in any of these organizations?
Literal question Pensioner association
Interviewer's instructions Check if yes.
Value Label Cases Weighted Percentage (Weighted)
0 Not selected 113 136.0 2.8%
1 Selected 22 24.7 0.5%
97 No answer 2299 2243.9 45.7%
98 Not asked 2471 2500.4 51.0%Warning: these figures indicate the number of cases found in the data file. They cannot be interpreted as summary statistics of the population of interest.

- 90 -
# dt11_17: Position of trust: Parents' association
Information [Type= discrete] [Format=numeric] [Range= 0-1] [Missing=*]
Statistics [NW/ W] [Valid=4905 / 4905 ] [Invalid=0 / 0 ]
Pre-question Do you have a position of trust in any of these organizations?
Literal question Parents' association
Interviewer's instructions Check if yes.
Value Label Cases Weighted Percentage (Weighted)
0 Not selected 64 51.8 1.1%
1 Selected 42 33.6 0.7%
97 No answer 2328 2319.2 47.3%
98 Not asked 2471 2500.4 51.0%Warning: these figures indicate the number of cases found in the data file. They cannot be interpreted as summary statistics of the population of interest.
# dt11_18: Position of trust: Immigrant association
Information [Type= discrete] [Format=numeric] [Range= 0-1] [Missing=*]
Statistics [NW/ W] [Valid=4905 / 4905 ] [Invalid=0 / 0 ]
Pre-question Do you have a position of trust in any of these organizations?
Literal question Immigrant association
Interviewer's instructions Check if yes.
Value Label Cases Weighted Percentage (Weighted)
0 Not selected 11 14.6 0.3%
1 Selected 8 10.5 0.2%
97 No answer 2415 2379.5 48.5%
98 Not asked 2471 2500.4 51.0%Warning: these figures indicate the number of cases found in the data file. They cannot be interpreted as summary statistics of the population of interest.
# dt11_19: Position of trust: Employee organization/trade union
Information [Type= discrete] [Format=numeric] [Range= 0-1] [Missing=*]
Statistics [NW/ W] [Valid=4905 / 4905 ] [Invalid=0 / 0 ]
Pre-question Do you have a position of trust in any of these organizations?
Literal question Employee organization/trade union
Interviewer's instructions Check if yes.
Value Label Cases Weighted Percentage (Weighted)
0 Not selected 766 669.7 13.7%
1 Selected 107 85.8 1.7%
97 No answer 1561 1649.2 33.6%
98 Not asked 2471 2500.4 51.0%Warning: these figures indicate the number of cases found in the data file. They cannot be interpreted as summary statistics of the population of interest.
# dt11_20: Position of trust: Business and employer organization
Information [Type= discrete] [Format=numeric] [Range= 0-1] [Missing=*]
Statistics [NW/ W] [Valid=4905 / 4905 ] [Invalid=0 / 0 ]
Pre-question Do you have a position of trust in any of these organizations?
Literal question Business and employer organization
Interviewer's instructions Check if yes.

- 91 -
# dt11_20: Position of trust: Business and employer organization
Value Label Cases Weighted Percentage (Weighted)
0 Not selected 83 72.5 1.5%
1 Selected 29 24.0 0.5%
97 No answer 2322 2308.1 47.1%
98 Not asked 2471 2500.4 51.0%Warning: these figures indicate the number of cases found in the data file. They cannot be interpreted as summary statistics of the population of interest.

- 92 -
# dt11_21: Position of trust: Agricultural or fisheries organization
Information [Type= discrete] [Format=numeric] [Range= 0-1] [Missing=*]
Statistics [NW/ W] [Valid=4905 / 4905 ] [Invalid=0 / 0 ]
Pre-question Do you have a position of trust in any of these organizations?
Literal question Agricultural or fisheries organization
Interviewer's instructions Check if yes.
Value Label Cases Weighted Percentage (Weighted)
0 Not selected 65 70.9 1.4%
1 Selected 14 14.9 0.3%
97 No answer 2355 2318.9 47.3%
98 Not asked 2471 2500.4 51.0%Warning: these figures indicate the number of cases found in the data file. They cannot be interpreted as summary statistics of the population of interest.
# dt11_22: Position of trust: Other
Information [Type= discrete] [Format=numeric] [Range= 0-1] [Missing=*]
Statistics [NW/ W] [Valid=4905 / 4905 ] [Invalid=0 / 0 ]
Pre-question Do you have a position of trust in any of these organizations?
Literal question Other organizations/associations
Interviewer's instructions Check if yes.
Value Label Cases Weighted Percentage (Weighted)
0 Not selected 373 372.4 7.6%
1 Selected 114 114.1 2.3%
97 No answer 1947 1918.2 39.1%
98 Not asked 2471 2500.4 51.0%Warning: these figures indicate the number of cases found in the data file. They cannot be interpreted as summary statistics of the population of interest.
# dt12: Would attempt to influence political process regarding controversial measure
Information [Type= discrete] [Format=numeric] [Range= 1-5] [Missing=*]
Statistics [NW/ W] [Valid=4905 / 4905 ] [Invalid=0 / 0 ]
Literal question Let's assume that the Storting is discussing a new measure that you consider to be completely unreasonable. How likely is itthat you would attempt to do something to affect the outcome?
Value Label Cases Weighted Percentage (Weighted)
1 Very likely 79 82.4 1.7%
2 Likely 250 222.5 4.5%
3 Somewhat likely 683 658.9 13.4%
4 Not very likely 1016 1007.0 20.5%
5 Not likely at all 267 286.6 5.8%
97 No answer 139 147.2 3.0%
98 Not asked 2471 2500.4 51.0%Warning: these figures indicate the number of cases found in the data file. They cannot be interpreted as summary statistics of the population of interest.
# dt13: Means to influence political process
Information [Type= discrete] [Format=numeric] [Range= 1-9] [Missing=*]
Statistics [NW/ W] [Valid=4905 / 4905 ] [Invalid=0 / 0 ]
Literal question If you wanted to affect the outcome of an issue, what would be your favoured procedure?
Value Label Cases Weighted Percentage (Weighted)
1 Would write a letter to the newspaper 340 321.0 6.5%

- 93 -
# dt13: Means to influence political process
Value Label Cases Weighted Percentage (Weighted)
2 Would work to get media coverage elsewhere 219 204.5 4.2%
3 Would discuss the matter with the party or otherorganization I am a member of
147 130.5 2.7%
4 Would contact a politician 261 254.7 5.2%
5 Would contact an employee of the ministryconcerned
100 92.8 1.9%
6 Would organize a petition 89 89.7 1.8%
7 Would organize a demonstration 28 34.1 0.7%
8 Not sure 923 938.3 19.1%
9 Other ways 121 119.1 2.4%
97 No answer 206 219.9 4.5%
98 Not asked 2471 2500.4 51.0%Warning: these figures indicate the number of cases found in the data file. They cannot be interpreted as summary statistics of the population of interest.
# km34: Norway morally obligated to reduce emissions
Information [Type= discrete] [Format=numeric] [Range= 1-7] [Missing=*]
Statistics [NW/ W] [Valid=4905 / 4905 ] [Invalid=0 / 0 ]
Literal question To which extent do you agree or disagree with the following statement: “Rich countries like Norway have a moral obligationto show international leadership by reducing their greenhouse gas emissions.”
Value Label Cases Weighted Percentage (Weighted)
1 Strongly agree 508 426.9 8.7%
2 Agree 680 615.0 12.5%
3 Agree somewhat 572 589.6 12.0%
4 Neither agree nor disagree 251 300.1 6.1%
5 Disagree somewhat 114 114.1 2.3%
6 Disagree 98 115.4 2.4%
7 Strongly disagree 68 96.5 2.0%
97 No answer 143 147.0 3.0%
98 Not asked 2471 2500.4 51.0%Warning: these figures indicate the number of cases found in the data file. They cannot be interpreted as summary statistics of the population of interest.
# grup: Randomizes if U=2
Information [Type= discrete] [Format=numeric] [Range= 1-2] [Missing=*]
Statistics [NW/ W] [Valid=2344 /-] [Invalid=2561 /-]
Pre-question Randomizes if U=2 into two groups and selects pairwise the following questions: DV1 - DV14
Value Label Cases Percentage
1 1163 49.6%
2 1181 50.4%
Sysmiss 2561Warning: these figures indicate the number of cases found in the data file. They cannot be interpreted as summary statistics of the population of interest.
# dv1: Benefit for Norway that people from other countries settles down here
Information [Type= discrete] [Format=numeric] [Range= 1-7] [Missing=*]
Statistics [NW/ W] [Valid=4905 / 4905 ] [Invalid=0 / 0 ]
Literal question How great an advantage or disadvantage would you say it is for Norway that people from other countries come to live here?

- 94 -
# dv1: Benefit for Norway that people from other countries settles down here
Value Label Cases Weighted Percentage (Weighted)
1 Very great advantage 37 31.8 0.6%
2 Great advantage 177 155.9 3.2%
3 A certain advantage 420 389.6 7.9%
4 Neither an advantage nor disadvantage 172 174.9 3.6%
5 A certain disadvantage 215 245.2 5.0%
6 A great disadvantage 73 90.4 1.8%
7 A very great disadvantage 37 46.9 1.0%
97 No answer 32 30.6 0.6%
98 Not asked 3742 3739.6 76.2%Warning: these figures indicate the number of cases found in the data file. They cannot be interpreted as summary statistics of the population of interest.
# dv2: Benefit for Norway that immigrants settles down here
Information [Type= discrete] [Format=numeric] [Range= 1-7] [Missing=*]
Statistics [NW/ W] [Valid=4905 / 4905 ] [Invalid=0 / 0 ]
Literal question How great an advantage or disadvantage would you say it is for Norway that immigrants come to live here?
Value Label Cases Weighted Percentage (Weighted)
1 Very great advantage 37 32.2 0.7%
2 Great advantage 181 162.0 3.3%
3 A certain advantage 402 369.9 7.5%
4 Neither an advantage nor disadvantage 169 164.1 3.3%
5 A certain disadvantage 237 248.7 5.1%
6 A great disadvantage 72 79.8 1.6%
7 A very great disadvantage 48 53.8 1.1%
97 No answer 35 38.8 0.8%
98 Not asked 3724 3755.8 76.6%Warning: these figures indicate the number of cases found in the data file. They cannot be interpreted as summary statistics of the population of interest.
# dv3: Policies aimed at people from other countries that settle down personally important
Information [Type= discrete] [Format=numeric] [Range= 1-5] [Missing=*]
Statistics [NW/ W] [Valid=4905 / 4905 ] [Invalid=0 / 0 ]
Literal question How important are policies aimed at people from other countries who come to live in Norway to you personally?
Value Label Cases Weighted Percentage (Weighted)
1 Very important 194 197.0 4.0%
2 Important 442 418.8 8.5%
3 Somewhat important 349 351.5 7.2%
4 Not very important 114 124.6 2.5%
5 Not important at all 24 28.1 0.6%
97 No answer 40 45.4 0.9%
98 Not asked 3742 3739.6 76.2%Warning: these figures indicate the number of cases found in the data file. They cannot be interpreted as summary statistics of the population of interest.
# dv4: Immigration policy imporant personally
Information [Type= discrete] [Format=numeric] [Range= 1-5] [Missing=*]
Statistics [NW/ W] [Valid=4905 / 4905 ] [Invalid=0 / 0 ]
Literal question How important is immigration policy to you personally?

- 95 -
# dv4: Immigration policy imporant personally
Value Label Cases Weighted Percentage (Weighted)
1 Very important 156 168.1 3.4%
2 Important 433 403.1 8.2%
3 Somewhat important 444 413.2 8.4%
4 Not very important 115 127.5 2.6%
5 Not important at all 18 18.8 0.4%
97 No answer 15 18.5 0.4%
98 Not asked 3724 3755.8 76.6%Warning: these figures indicate the number of cases found in the data file. They cannot be interpreted as summary statistics of the population of interest.
# dv5: Party with best policy regarding settlement of foreigners
Information [Type= discrete] [Format=numeric] [Range= 1-11] [Missing=*]
Statistics [NW/ W] [Valid=4905 / 4905 ] [Invalid=0 / 0 ]
Literal question Which political party do you believe has the best policy aimed at people who come from other countries to live in Norway?
Value Label Cases Weighted Percentage (Weighted)
1 The Labour Party 239 227.7 4.6%
2 The Progress Party 247 281.3 5.7%
3 The Conservative Party 174 151.0 3.1%
4 The Socialist Left Party 111 109.3 2.2%
5 The Centre Party 9 9.7 0.2%
6 The Christian Democratic Party 61 55.3 1.1%
7 The Liberal Party 75 71.5 1.5%
8 Red 24 19.8 0.4%
9 The Green Party 6 5.0 0.1%
10 Others (Note) 7 12.5 0.3%
11 None 121 128.4 2.6%
97 No answer 89 93.9 1.9%
98 Not asked 3742 3739.6 76.2%Warning: these figures indicate the number of cases found in the data file. They cannot be interpreted as summary statistics of the population of interest.
# dv5_10_other: Other: Party with best policy regarding settlement of foreigners
Information [Type= discrete] [Format=character] [Missing=*]
Statistics [NW/ W] [Valid=4905 /-] [Invalid=0 /-]
Literal question Which political party do you believe has the best policy aimed at people who come from other countries to live in Norway?
Value Label Cases Percentage
4898 99.9%
97 No answer 0
Det LiberaleFolkeparti
1 0.0%
Det LiberaleFolkepartiet
1 0.0%
Senterpartiet-Krf-Miljøpart.degrønne-Venstre
1 0.0%
Trodde det varFremskrittspartiet,men det ser ut
1 0.0%

- 96 -
# dv5_10_other: Other: Party with best policy regarding settlement of foreigners
Value Label Cases Percentage
alle partier harforbedringspotensiale
1 0.0%
alle partier hargod politikk forinnvandrerne,me
1 0.0%
vet ikke 1 0.0%Warning: these figures indicate the number of cases found in the data file. They cannot be interpreted as summary statistics of the population of interest.
# dv6: Party with the best immigration policy
Information [Type= discrete] [Format=numeric] [Range= 1-11] [Missing=*]
Statistics [NW/ W] [Valid=4905 / 4905 ] [Invalid=0 / 0 ]
Literal question In your opinion, which political party has the best immigration policy?
Value Label Cases Weighted Percentage (Weighted)
1 The Labour Party 222 211.7 4.3%
2 The Progress Party 277 299.8 6.1%
3 The Conservative Party 203 195.8 4.0%
4 The Socialist Left Party 81 61.0 1.2%
5 The Centre Party 12 10.5 0.2%
6 The Christian Democratic Party 62 56.8 1.2%
7 The Liberal Party 61 56.1 1.1%
8 Red 27 25.3 0.5%
9 The Green Party 7 5.8 0.1%
10 Others (Note) 12 9.4 0.2%
11 None 141 143.8 2.9%
97 No answer 76 73.2 1.5%
98 Not asked 3724 3755.8 76.6%Warning: these figures indicate the number of cases found in the data file. They cannot be interpreted as summary statistics of the population of interest.
# dv6_10_other: Other: Party with best immigration policy
Information [Type= discrete] [Format=character] [Missing=*]
Statistics [NW/ W] [Valid=4905 /-] [Invalid=0 /-]
Literal question In your opinion, which political party has the best immigration policy?
Value Label Cases Percentage
97 No answerWarning: these figures indicate the number of cases found in the data file. They cannot be interpreted as summary statistics of the population of interest.
# dv7: Share of foreigners in community
Information [Type= discrete] [Format=numeric] [Range= 1-5] [Missing=*]
Statistics [NW/ W] [Valid=4905 / 4905 ] [Invalid=0 / 0 ]
Literal question If you consider people in your community or school district, around how many have come from a different country to livethere or have at least one parent who has come from another country?
Value Label Cases Weighted Percentage (Weighted)
1 All, or nearly all 12 13.9 0.3%
2 Many (more than half) 48 46.7 1.0%
3 Around half 69 78.6 1.6%
4 Some (fewer than half) 756 745.0 15.2%

- 97 -
# dv7: Share of foreigners in community
Value Label Cases Weighted Percentage (Weighted)
5 None, or nearly none 234 224.2 4.6%
97 No answer 44 57.0 1.2%
98 Not asked 3742 3739.6 76.2%Warning: these figures indicate the number of cases found in the data file. They cannot be interpreted as summary statistics of the population of interest.
# dv8: Share of immigrants in community
Information [Type= discrete] [Format=numeric] [Range= 1-5] [Missing=*]
Statistics [NW/ W] [Valid=4905 / 4905 ] [Invalid=0 / 0 ]
Literal question If you consider people in your community or school district, around how many have immigrated or have at least one parentwho has immigrated?
Value Label Cases Weighted Percentage (Weighted)
1 All, or nearly all 10 10.9 0.2%
2 Many (more than half) 59 62.8 1.3%
3 Around half 84 73.7 1.5%
4 Some (fewer than half) 695 682.4 13.9%
5 None, or nearly none 284 261.2 5.3%
97 No answer 49 58.3 1.2%
98 Not asked 3724 3755.8 76.6%Warning: these figures indicate the number of cases found in the data file. They cannot be interpreted as summary statistics of the population of interest.
# dv9: Encounters with foreigners in daily life
Information [Type= discrete] [Format=numeric] [Range= 1-5] [Missing=*]
Statistics [NW/ W] [Valid=4905 / 4905 ] [Invalid=0 / 0 ]
Literal question Imagine people you randomly encounter in your daily life, for example on the bus, at the shop or in your neighbourhood.How often would you say that you encounter people who have come from other countries to live here?
Value Label Cases Weighted Percentage (Weighted)
1 Every day 725 715.2 14.6%
2 Weekly 218 211.0 4.3%
3 A few times a month 124 126.8 2.6%
4 More seldom, but it has occurred 53 65.8 1.3%
5 Never 5 5.3 0.1%
97 No answer 38 41.2 0.8%
98 Not asked 3742 3739.6 76.2%Warning: these figures indicate the number of cases found in the data file. They cannot be interpreted as summary statistics of the population of interest.
# dv10: Encounters with immigrants in daily life
Information [Type= discrete] [Format=numeric] [Range= 1-5] [Missing=*]
Statistics [NW/ W] [Valid=4905 / 4905 ] [Invalid=0 / 0 ]
Literal question Imagine people you randomly encounter in your daily life, for example on the bus, at the shop or in your neighbourhood.How often would you say you encounter immigrants?
Value Label Cases Weighted Percentage (Weighted)
1 Every day 866 836.5 17.1%
2 Weekly 191 195.2 4.0%
3 A few times a month 76 72.4 1.5%
4 More seldom, but it has occurred 31 29.5 0.6%
5 Never 1 0.9 0.0%

- 98 -
# dv10: Encounters with immigrants in daily life
Value Label Cases Weighted Percentage (Weighted)
97 No answer 16 14.6 0.3%
98 Not asked 3724 3755.8 76.6%Warning: these figures indicate the number of cases found in the data file. They cannot be interpreted as summary statistics of the population of interest.
# dv11: Experience of meeting foreigners
Information [Type= discrete] [Format=numeric] [Range= 1-7] [Missing=*]
Statistics [NW/ W] [Valid=4905 / 4905 ] [Invalid=0 / 0 ]
Literal question How good or bad an experience have these short, random encounters been?
Value Label Cases Weighted Percentage (Weighted)
1 Very good 87 79.3 1.6%
2 Good 375 350.3 7.1%
3 Somewhat good 93 92.0 1.9%
4 Neither good nor bad 471 481.2 9.8%
5 Somewhat bad 53 60.9 1.2%
6 Bad 24 33.3 0.7%
7 Very bad 6 7.2 0.1%
97 No answer 54 61.2 1.2%
98 Not asked 3742 3739.6 76.2%Warning: these figures indicate the number of cases found in the data file. They cannot be interpreted as summary statistics of the population of interest.
# dv12: Experience of meeting immigrants
Information [Type= discrete] [Format=numeric] [Range= 1-7] [Missing=*]
Statistics [NW/ W] [Valid=4905 / 4905 ] [Invalid=0 / 0 ]
Literal question How good or bad an experience have these short, random encounters been?
Value Label Cases Weighted Percentage (Weighted)
1 Very good 98 95.8 2.0%
2 Good 377 345.8 7.0%
3 Somewhat good 81 80.1 1.6%
4 Neither good nor bad 519 522.6 10.7%
5 Somewhat bad 46 41.1 0.8%
6 Bad 28 32.1 0.7%
7 Very bad 8 9.4 0.2%
97 No answer 24 22.3 0.5%
98 Not asked 3724 3755.8 76.6%Warning: these figures indicate the number of cases found in the data file. They cannot be interpreted as summary statistics of the population of interest.
# dv13: Share of friends that are foreigners
Information [Type= discrete] [Format=numeric] [Range= 1-5] [Missing=*]
Statistics [NW/ W] [Valid=4905 / 4905 ] [Invalid=0 / 0 ]
Literal question How many of your close friends have come from another country to live in Norway or have parents (mother, father or bothparents) who have come from another country to live in Norway?
Value Label Cases Weighted Percentage (Weighted)
1 All, or nearly all 11 8.8 0.2%
2 Many (more than half) 46 37.2 0.8%
3 Around half 66 64.4 1.3%
4 Some (fewer than half) 454 456.9 9.3%

- 99 -
# dv13: Share of friends that are foreigners
Value Label Cases Weighted Percentage (Weighted)
5 None, or nearly none 557 563.3 11.5%
97 No answer 29 34.8 0.7%
98 Not asked 3742 3739.6 76.2%Warning: these figures indicate the number of cases found in the data file. They cannot be interpreted as summary statistics of the population of interest.
# dv14: Share of friends that are immigrants
Information [Type= discrete] [Format=numeric] [Range= 1-5] [Missing=*]
Statistics [NW/ W] [Valid=4905 / 4905 ] [Invalid=0 / 0 ]
Literal question How many of your close friends have immigrated to Norway or have parents (mother, father or both parents) who haveimmigrated to Norway?
Value Label Cases Weighted Percentage (Weighted)
1 All, or nearly all 9 12.7 0.3%
2 Many (more than half) 47 46.5 0.9%
3 Around half 57 46.7 1.0%
4 Some (fewer than half) 411 398.2 8.1%
5 None, or nearly none 638 623.8 12.7%
97 No answer 19 21.3 0.4%
98 Not asked 3724 3755.8 76.6%Warning: these figures indicate the number of cases found in the data file. They cannot be interpreted as summary statistics of the population of interest.
# grup2: Randomizes independently from U
Information [Type= discrete] [Format=numeric] [Range= 1-6] [Missing=*]
Statistics [NW/ W] [Valid=4709 /-] [Invalid=196 /-]
Pre-question Randomizes if U=2 into six groups and selects one the following questions: DV15- DV20
Value Label Cases Percentage
1 788 16.7%
2 754 16.0%
3 778 16.5%
4 817 17.3%
5 789 16.8%
6 783 16.6%
Sysmiss 196Warning: these figures indicate the number of cases found in the data file. They cannot be interpreted as summary statistics of the population of interest.
# dv15: Claim: Immigrans has to apply for more jobs than Norwegians, according to 1800 job applications
Information [Type= discrete] [Format=numeric] [Range= 1-7] [Missing=*]
Statistics [NW/ W] [Valid=4905 / 4905 ] [Invalid=0 / 0 ]
Literal question Research based on 1,800 job applications concludes that Norwegians with immigrant backgrounds must apply for far morejobs than others in order to be called for an interview. To which extent do you agree that this is the case in Norway just now?
Value Label Cases Weighted Percentage (Weighted)
1 Strongly agree 178 176.7 3.6%
2 Agree 294 266.8 5.4%
3 Agree somewhat 132 142.1 2.9%
4 Neither agree nor disagree 85 99.1 2.0%
5 Disagree somewhat 26 28.0 0.6%
6 Disagree 31 37.0 0.8%

- 100 -
# dv15: Claim: Immigrans has to apply for more jobs than Norwegians, according to 1800 job applications
Value Label Cases Weighted Percentage (Weighted)
7 Strongly disagree 17 15.6 0.3%
97 No answer 25 24.5 0.5%
98 Not asked 4117 4115.2 83.9%Warning: these figures indicate the number of cases found in the data file. They cannot be interpreted as summary statistics of the population of interest.
# dv16: Claim: Immigrans has to apply for more jobs than Norwegians, according to 42 interviews
Information [Type= discrete] [Format=numeric] [Range= 1-7] [Missing=*]
Statistics [NW/ W] [Valid=4905 / 4905 ] [Invalid=0 / 0 ]
Literal question Research based on 42 interviews with employers concludes that Norwegians with immigrant backgrounds must apply for farmore jobs than others in order to be called for an interview. To which extent do you agree that this is the case in Norway justnow?
Value Label Cases Weighted Percentage (Weighted)
1 Strongly agree 158 135.5 2.8%
2 Agree 306 296.5 6.0%
3 Agree somewhat 141 159.8 3.3%
4 Neither agree nor disagree 75 98.1 2.0%
5 Disagree somewhat 22 28.7 0.6%
6 Disagree 27 29.3 0.6%
7 Strongly disagree 10 9.5 0.2%
97 No answer 15 16.0 0.3%
98 Not asked 4151 4131.7 84.2%Warning: these figures indicate the number of cases found in the data file. They cannot be interpreted as summary statistics of the population of interest.
# dv17: Claim: Immigrans has to apply for more jobs than Norwegians, according to research
Information [Type= discrete] [Format=numeric] [Range= 1-7] [Missing=*]
Statistics [NW/ W] [Valid=4905 / 4905 ] [Invalid=0 / 0 ]
Literal question Research concludes that Norwegians with immigrant backgrounds must apply for far more jobs than others in order to becalled for an interview. To which extent do you agree that this is the case in Norway just now?
Value Label Cases Weighted Percentage (Weighted)
1 Strongly agree 175 166.9 3.4%
2 Agree 302 309.4 6.3%
3 Agree somewhat 134 135.3 2.8%
4 Neither agree nor disagree 96 107.8 2.2%
5 Disagree somewhat 29 29.3 0.6%
6 Disagree 21 19.6 0.4%
7 Strongly disagree 9 9.1 0.2%
97 No answer 12 12.6 0.3%
98 Not asked 4127 4115.0 83.9%Warning: these figures indicate the number of cases found in the data file. They cannot be interpreted as summary statistics of the population of interest.
# dv18: Claim: Immigrans has to apply for more jobs than Norwegians, according to a governmental ministry
Information [Type= discrete] [Format=numeric] [Range= 1-7] [Missing=*]
Statistics [NW/ W] [Valid=4905 / 4905 ] [Invalid=0 / 0 ]
Literal question A governmental ministry concludes that Norwegians with immigrant backgrounds must apply for far more jobs than others inorder to be called for an interview. To which extent do you agree that this is the case in Norway just now?
Value Label Cases Weighted Percentage (Weighted)
1 Strongly agree 201 185.7 3.8%

- 101 -
# dv18: Claim: Immigrans has to apply for more jobs than Norwegians, according to a governmental ministry
Value Label Cases Weighted Percentage (Weighted)
2 Agree 308 298.6 6.1%
3 Agree somewhat 142 161.6 3.3%
4 Neither agree nor disagree 84 98.8 2.0%
5 Disagree somewhat 26 32.3 0.7%
6 Disagree 25 29.6 0.6%
7 Strongly disagree 16 15.4 0.3%
97 No answer 15 13.2 0.3%
98 Not asked 4088 4069.8 83.0%Warning: these figures indicate the number of cases found in the data file. They cannot be interpreted as summary statistics of the population of interest.
# dv19: Claim: Immigrans has to apply for more jobs than Norwegians, according to The Norwegian Centre againstRacism
Information [Type= discrete] [Format=numeric] [Range= 1-7] [Missing=*]
Statistics [NW/ W] [Valid=4905 / 4905 ] [Invalid=0 / 0 ]
Literal question The Norwegian Centre against Racism concludes that Norwegians with immigrant backgrounds must apply for far more jobsthan others in order to be called for an interview. To which extent do you agree that this is the case in Norway just now?
Value Label Cases Weighted Percentage (Weighted)
1 Strongly agree 178 144.3 2.9%
2 Agree 296 284.7 5.8%
3 Agree somewhat 128 118.5 2.4%
4 Neither agree nor disagree 117 134.4 2.7%
5 Disagree somewhat 14 9.5 0.2%
6 Disagree 26 29.2 0.6%
7 Strongly disagree 15 14.3 0.3%
97 No answer 15 17.6 0.4%
98 Not asked 4116 4152.6 84.7%Warning: these figures indicate the number of cases found in the data file. They cannot be interpreted as summary statistics of the population of interest.
# dv20: Claim: Immigrans has to apply for more jobs than Norwegians, according to public debate
Information [Type= discrete] [Format=numeric] [Range= 1-7] [Missing=*]
Statistics [NW/ W] [Valid=4905 / 4905 ] [Invalid=0 / 0 ]
Literal question Social debate participants conclude that Norwegians with immigrant backgrounds must apply for far more jobs than others inorder to be called for an interview. To which extent do you agree that this is the case in Norway just now?
Value Label Cases Weighted Percentage (Weighted)
1 Strongly agree 163 143.4 2.9%
2 Agree 313 305.9 6.2%
3 Agree somewhat 136 130.9 2.7%
4 Neither agree nor disagree 109 125.2 2.6%
5 Disagree somewhat 21 20.2 0.4%
6 Disagree 17 15.9 0.3%
7 Strongly disagree 9 6.3 0.1%
97 No answer 15 19.4 0.4%
98 Not asked 4122 4137.8 84.4%Warning: these figures indicate the number of cases found in the data file. They cannot be interpreted as summary statistics of the population of interest.
# grup3: Randomizes if U=2
Information [Type= discrete] [Format=numeric] [Range= 1-4] [Missing=*]

- 102 -
# grup3: Randomizes if U=2
Statistics [NW/ W] [Valid=2338 /-] [Invalid=2567 /-]
Pre-question Randomizes if U=2 into four groups and selects one the following questions: DV21-25
Value Label Cases Percentage
1 642 27.5%
2 559 23.9%
3 591 25.3%
4 546 23.4%
Sysmiss 2567Warning: these figures indicate the number of cases found in the data file. They cannot be interpreted as summary statistics of the population of interest.
# dv21: Allow Muslim schools
Information [Type= discrete] [Format=numeric] [Range= 1-7] [Missing=*]
Statistics [NW/ W] [Valid=4905 / 4905 ] [Invalid=0 / 0 ]
Literal question Some Muslims in Norway wish to send their children to Islamic schools that follow the Norwegian curriculum butadditionally teach Islam. To which extent do you agree or disagree that Muslims in Norway should be permitted to send theirchildren to Islamic schools?
Value Label Cases Weighted Percentage (Weighted)
1 Strongly agree 14 21.8 0.4%
2 Agree 47 40.8 0.8%
3 Agree somewhat 64 61.5 1.3%
4 Neither agree nor disagree 83 85.7 1.7%
5 Disagree somewhat 95 91.9 1.9%
6 Disagree 139 129.8 2.6%
7 Strongly disagree 181 195.3 4.0%
97 No answer 4282 4278.2 87.2%
98 Not asked 0 0.0Warning: these figures indicate the number of cases found in the data file. They cannot be interpreted as summary statistics of the population of interest.
# dv22: Allow Muslim schools, even though it may disrupt integration, according to public debate
Information [Type= discrete] [Format=numeric] [Range= 1-7] [Missing=*]
Statistics [NW/ W] [Valid=4905 / 4905 ] [Invalid=0 / 0 ]
Literal question Some Muslims in Norway wish to send their children to Islamic schools that follow the Norwegian curriculum butadditionally teach Islam. Some participants in the social debate have argued against such schools because they believe theyobstruct integration. To which extent do you agree or disagree that Muslims in Norway should be permitted to send theirchildren to Islamic schools?
Value Label Cases Weighted Percentage (Weighted)
1 Strongly agree 19 17.1 0.3%
2 Agree 35 33.4 0.7%
3 Agree somewhat 43 38.7 0.8%
4 Neither agree nor disagree 62 59.8 1.2%
5 Disagree somewhat 91 87.8 1.8%
6 Disagree 134 116.4 2.4%
7 Strongly disagree 164 178.2 3.6%
97 No answer 4357 4373.5 89.2%
98 Not asked 0 0.0Warning: these figures indicate the number of cases found in the data file. They cannot be interpreted as summary statistics of the population of interest.

- 103 -
# dv23: Allow Muslim schools, even though it may disrupt integration, according to Progress Party
Information [Type= discrete] [Format=numeric] [Range= 1-7] [Missing=*]
Statistics [NW/ W] [Valid=4905 / 4905 ] [Invalid=0 / 0 ]
Literal question Some Muslims in Norway wish to send their children to Islamic schools that follow the Norwegian curriculum butadditionally teach Islam. Certain Progress Party politicians have argued against such schools because they believe theyobstruct integration. To which extent do you agree or disagree that Muslims in Norway should be permitted to send theirchildren to Islamic schools?
Value Label Cases Weighted Percentage (Weighted)
1 Strongly agree 20 26.6 0.5%
2 Agree 47 35.9 0.7%
3 Agree somewhat 77 73.0 1.5%
4 Neither agree nor disagree 70 75.0 1.5%
5 Disagree somewhat 86 80.4 1.6%
6 Disagree 119 129.6 2.6%
7 Strongly disagree 160 159.1 3.2%
97 No answer 4326 4325.3 88.2%
98 Not asked 0 0.0Warning: these figures indicate the number of cases found in the data file. They cannot be interpreted as summary statistics of the population of interest.
# dv24: Allow Muslim schools, even though it may disrupt integration, according to Labour Party
Information [Type= discrete] [Format=numeric] [Range= 1-7] [Missing=*]
Statistics [NW/ W] [Valid=4905 / 4905 ] [Invalid=0 / 0 ]
Literal question Some Muslims in Norway wish to send their children to Islamic schools that follow the Norwegian curriculum butadditionally teach Islam. Certain Labour Party politicians have argued against such schools because they believe theyobstruct integration. To which extent do you agree or disagree that Muslims in Norway should be permitted to send theirchildren to Islamic schools?
Value Label Cases Weighted Percentage (Weighted)
1 Strongly agree 18 14.5 0.3%
2 Agree 29 25.9 0.5%
3 Agree somewhat 48 39.3 0.8%
4 Neither agree nor disagree 57 71.1 1.4%
5 Disagree somewhat 84 74.8 1.5%
6 Disagree 136 128.1 2.6%
7 Strongly disagree 163 158.8 3.2%
97 No answer 4370 4392.4 89.6%
98 Not asked 0 0.0Warning: these figures indicate the number of cases found in the data file. They cannot be interpreted as summary statistics of the population of interest.
# grup4: Randomizes if U=2
Information [Type= discrete] [Format=numeric] [Range= 1-4] [Missing=*]
Statistics [NW/ W] [Valid=2335 /-] [Invalid=2570 /-]
Pre-question Randomizes if U=2 into four groups and selects one the following questions: DV25-28
Value Label Cases Percentage
1 579 24.8%
2 619 26.5%
3 564 24.2%
4 573 24.5%
Sysmiss 2570Warning: these figures indicate the number of cases found in the data file. They cannot be interpreted as summary statistics of the population of interest.

- 104 -
# dv25: Claim: Muslim culture should be respected
Information [Type= discrete] [Format=numeric] [Range= 1-7] [Missing=*]
Statistics [NW/ W] [Valid=4905 / 4905 ] [Invalid=0 / 0 ]
Pre-question To which extent do you agree or disagree with the following statement:
Literal question Muslims in Norway are entitled to respect for their traditions and culture.
Value Label Cases Weighted Percentage (Weighted)
1 Strongly agree 61 57.1 1.2%
2 Agree 140 109.4 2.2%
3 Agree somewhat 162 152.6 3.1%
4 Neither agree nor disagree 51 56.2 1.1%
5 Disagree somewhat 67 71.0 1.4%
6 Disagree 36 37.4 0.8%
7 Strongly disagree 48 57.5 1.2%
97 No answer 4340 4363.9 89.0%
98 Not asked 0 0.0Warning: these figures indicate the number of cases found in the data file. They cannot be interpreted as summary statistics of the population of interest.
# dv26: Claim: Muslim culture should be protected
Information [Type= discrete] [Format=numeric] [Range= 1-7] [Missing=*]
Statistics [NW/ W] [Valid=4905 / 4905 ] [Invalid=0 / 0 ]
Pre-question To which extent do you agree or disagree with the following statement:
Literal question Muslims in Norway are entitled to protection of their traditions and culture.
Value Label Cases Weighted Percentage (Weighted)
1 Strongly agree 13 9.2 0.2%
2 Agree 52 46.4 0.9%
3 Agree somewhat 150 128.5 2.6%
4 Neither agree nor disagree 79 83.6 1.7%
5 Disagree somewhat 129 130.8 2.7%
6 Disagree 99 102.6 2.1%
7 Strongly disagree 88 108.0 2.2%
97 No answer 4295 4295.9 87.6%
98 Not asked 0 0.0Warning: these figures indicate the number of cases found in the data file. They cannot be interpreted as summary statistics of the population of interest.
# dv27: Claim: Immigrant culture should be respected
Information [Type= discrete] [Format=numeric] [Range= 1-7] [Missing=*]
Statistics [NW/ W] [Valid=4905 / 4905 ] [Invalid=0 / 0 ]
Pre-question To which extent do you agree or disagree with the following statement:
Literal question Immigrants in Norway are entitled to respect for their traditions and culture.
Value Label Cases Weighted Percentage (Weighted)
1 Strongly agree 47 48.7 1.0%
2 Agree 161 134.2 2.7%
3 Agree somewhat 174 172.0 3.5%
4 Neither agree nor disagree 44 43.9 0.9%
5 Disagree somewhat 72 82.4 1.7%
6 Disagree 28 30.4 0.6%

- 105 -
# dv27: Claim: Immigrant culture should be respected
Value Label Cases Weighted Percentage (Weighted)
7 Strongly disagree 28 30.0 0.6%
97 No answer 4351 4363.3 89.0%
98 Not asked 0 0.0Warning: these figures indicate the number of cases found in the data file. They cannot be interpreted as summary statistics of the population of interest.
# dv28: Claim: Muslim culture should be protected
Information [Type= discrete] [Format=numeric] [Range= 1-7] [Missing=*]
Statistics [NW/ W] [Valid=4905 / 4905 ] [Invalid=0 / 0 ]
Pre-question To which extent do you agree or disagree with the following statement:
Literal question Immigrants in Norway are entitled to protection of their traditions and culture.
Value Label Cases Weighted Percentage (Weighted)
1 Strongly agree 17 19.2 0.4%
2 Agree 79 76.0 1.5%
3 Agree somewhat 146 122.6 2.5%
4 Neither agree nor disagree 71 77.2 1.6%
5 Disagree somewhat 112 125.8 2.6%
6 Disagree 73 77.4 1.6%
7 Strongly disagree 64 74.3 1.5%
97 No answer 4343 4332.6 88.3%
98 Not asked 0 0.0Warning: these figures indicate the number of cases found in the data file. They cannot be interpreted as summary statistics of the population of interest.
# dv29_1: Statement: Refugees should be entitled to social services
Information [Type= discrete] [Format=numeric] [Range= 1-7] [Missing=*]
Statistics [NW/ W] [Valid=4905 / 4905 ] [Invalid=0 / 0 ]
Pre-question Consider the statements below. To which extent do you agree or disagree with them?
Literal question Refugees should have the same right to social services as Norwegians, even if they are not Norwegian citizens.
Value Label Cases Weighted Percentage (Weighted)
1 Strongly agree 166 153.2 3.1%
2 Agree 513 446.6 9.1%
3 Agree somewhat 438 430.8 8.8%
4 Neither agree nor disagree 212 229.2 4.7%
5 Disagree somewhat 328 331.2 6.8%
6 Disagree 359 352.5 7.2%
7 Strongly disagree 245 287.2 5.9%
97 No answer 173 173.9 3.5%
98 Not asked 2471 2500.4 51.0%Warning: these figures indicate the number of cases found in the data file. They cannot be interpreted as summary statistics of the population of interest.
# dv29_2: Statement: Begging should be banned
Information [Type= discrete] [Format=numeric] [Range= 1-7] [Missing=*]
Statistics [NW/ W] [Valid=4905 / 4905 ] [Invalid=0 / 0 ]
Pre-question Consider the statements below. To which extent do you agree or disagree with them?
Literal question Begging should be banned in Norway.

- 106 -
# dv29_2: Statement: Begging should be banned
Value Label Cases Weighted Percentage (Weighted)
1 Strongly agree 833 879.8 17.9%
2 Agree 515 515.0 10.5%
3 Agree somewhat 321 304.6 6.2%
4 Neither agree nor disagree 218 201.6 4.1%
5 Disagree somewhat 148 145.0 3.0%
6 Disagree 144 120.2 2.5%
7 Strongly disagree 87 71.9 1.5%
97 No answer 168 166.6 3.4%
98 Not asked 2471 2500.4 51.0%Warning: these figures indicate the number of cases found in the data file. They cannot be interpreted as summary statistics of the population of interest.
# dv29_3: Statement: Norway will lose it's identity if more Muslims come to live here
Information [Type= discrete] [Format=numeric] [Range= 1-7] [Missing=*]
Statistics [NW/ W] [Valid=4905 / 4905 ] [Invalid=0 / 0 ]
Pre-question Consider the statements below. To which extent do you agree or disagree with them?
Literal question Norway will lose its identity if more Muslims come to live here.
Value Label Cases Weighted Percentage (Weighted)
1 Strongly agree 284 337.3 6.9%
2 Agree 287 326.4 6.7%
3 Agree somewhat 440 436.8 8.9%
4 Neither agree nor disagree 351 344.0 7.0%
5 Disagree somewhat 299 269.5 5.5%
6 Disagree 395 350.1 7.1%
7 Strongly disagree 208 173.5 3.5%
97 No answer 170 167.1 3.4%
98 Not asked 2471 2500.4 51.0%Warning: these figures indicate the number of cases found in the data file. They cannot be interpreted as summary statistics of the population of interest.
# dv29_4: Statement: Norwegian muslims more loyal to other muslims
Information [Type= discrete] [Format=numeric] [Range= 1-7] [Missing=*]
Statistics [NW/ W] [Valid=4905 / 4905 ] [Invalid=0 / 0 ]
Pre-question Consider the statements below. To which extent do you agree or disagree with them?
Literal question Norwegian Muslims are more loyal to other Muslims in the world than to the people of this country.
Value Label Cases Weighted Percentage (Weighted)
1 Strongly agree 284 324.9 6.6%
2 Agree 389 415.7 8.5%
3 Agree somewhat 452 429.5 8.8%
4 Neither agree nor disagree 733 718.5 14.6%
5 Disagree somewhat 158 141.7 2.9%
6 Disagree 167 138.0 2.8%
7 Strongly disagree 69 56.5 1.2%
97 No answer 182 179.9 3.7%
98 Not asked 2471 2500.4 51.0%Warning: these figures indicate the number of cases found in the data file. They cannot be interpreted as summary statistics of the population of interest.

- 107 -
# dv29_5: Statement: Better for a country if most people share the same traditions and customs
Information [Type= discrete] [Format=numeric] [Range= 1-7] [Missing=*]
Statistics [NW/ W] [Valid=4905 / 4905 ] [Invalid=0 / 0 ]
Pre-question Consider the statements below. To which extent do you agree or disagree with them?
Literal question It is better for a country if nearly everyone shares the same traditions and customs.
Value Label Cases Weighted Percentage (Weighted)
1 Strongly agree 214 234.8 4.8%
2 Agree 317 353.2 7.2%
3 Agree somewhat 411 398.0 8.1%
4 Neither agree nor disagree 409 428.5 8.7%
5 Disagree somewhat 370 331.0 6.7%
6 Disagree 375 333.4 6.8%
7 Strongly disagree 165 152.2 3.1%
97 No answer 173 173.5 3.5%
98 Not asked 2471 2500.4 51.0%Warning: these figures indicate the number of cases found in the data file. They cannot be interpreted as summary statistics of the population of interest.
# dv33: Foreigners are better off compared to people like me
Information [Type= discrete] [Format=numeric] [Range= 1-7] [Missing=*]
Statistics [NW/ W] [Valid=4905 / 4905 ] [Invalid=0 / 0 ]
Literal question In your opinion, how much better or worse off are the majority of people who have come to live in Norway compared topeople like you?
Value Label Cases Weighted Percentage (Weighted)
1 Much better 12 18.7 0.4%
2 Better 32 39.9 0.8%
3 Somewhat better 54 69.1 1.4%
4 Neither better nor worse 348 392.6 8.0%
5 Somewhat worse 296 281.0 5.7%
6 Worse 300 249.8 5.1%
7 Much worse 70 57.4 1.2%
97 No answer 51 56.8 1.2%
98 Not asked 3742 3739.6 76.2%Warning: these figures indicate the number of cases found in the data file. They cannot be interpreted as summary statistics of the population of interest.
# dv34: Immigrans are better off compared to people like me
Information [Type= discrete] [Format=numeric] [Range= 1-7] [Missing=*]
Statistics [NW/ W] [Valid=4905 / 4905 ] [Invalid=0 / 0 ]
Literal question In your opinion, how much better or worse off are the majority of people who have immigrated to Norway compared topeople like you?
Value Label Cases Weighted Percentage (Weighted)
1 Much better 12 23.1 0.5%
2 Better 40 48.7 1.0%
3 Somewhat better 52 64.3 1.3%
4 Neither better nor worse 399 430.9 8.8%
5 Somewhat worse 380 337.3 6.9%
6 Worse 205 162.1 3.3%
7 Much worse 41 31.9 0.6%
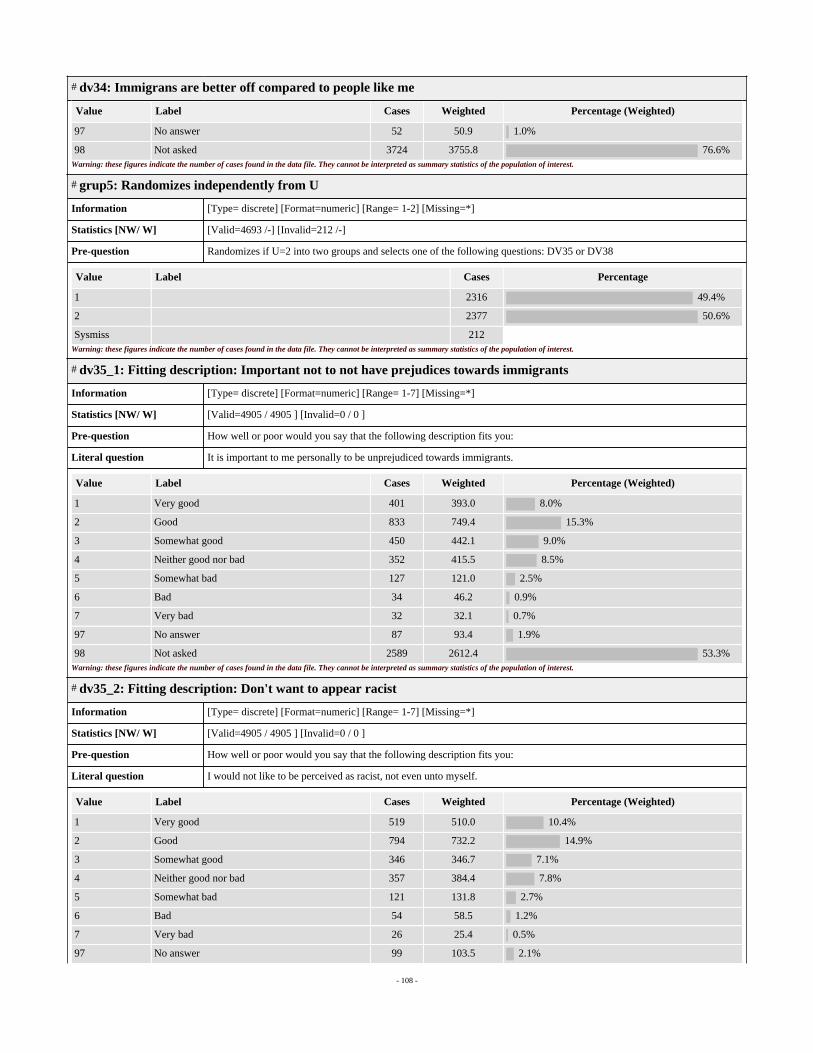
- 108 -
# dv34: Immigrans are better off compared to people like me
Value Label Cases Weighted Percentage (Weighted)
97 No answer 52 50.9 1.0%
98 Not asked 3724 3755.8 76.6%Warning: these figures indicate the number of cases found in the data file. They cannot be interpreted as summary statistics of the population of interest.
# grup5: Randomizes independently from U
Information [Type= discrete] [Format=numeric] [Range= 1-2] [Missing=*]
Statistics [NW/ W] [Valid=4693 /-] [Invalid=212 /-]
Pre-question Randomizes if U=2 into two groups and selects one of the following questions: DV35 or DV38
Value Label Cases Percentage
1 2316 49.4%
2 2377 50.6%
Sysmiss 212Warning: these figures indicate the number of cases found in the data file. They cannot be interpreted as summary statistics of the population of interest.
# dv35_1: Fitting description: Important not to not have prejudices towards immigrants
Information [Type= discrete] [Format=numeric] [Range= 1-7] [Missing=*]
Statistics [NW/ W] [Valid=4905 / 4905 ] [Invalid=0 / 0 ]
Pre-question How well or poor would you say that the following description fits you:
Literal question It is important to me personally to be unprejudiced towards immigrants.
Value Label Cases Weighted Percentage (Weighted)
1 Very good 401 393.0 8.0%
2 Good 833 749.4 15.3%
3 Somewhat good 450 442.1 9.0%
4 Neither good nor bad 352 415.5 8.5%
5 Somewhat bad 127 121.0 2.5%
6 Bad 34 46.2 0.9%
7 Very bad 32 32.1 0.7%
97 No answer 87 93.4 1.9%
98 Not asked 2589 2612.4 53.3%Warning: these figures indicate the number of cases found in the data file. They cannot be interpreted as summary statistics of the population of interest.
# dv35_2: Fitting description: Don't want to appear racist
Information [Type= discrete] [Format=numeric] [Range= 1-7] [Missing=*]
Statistics [NW/ W] [Valid=4905 / 4905 ] [Invalid=0 / 0 ]
Pre-question How well or poor would you say that the following description fits you:
Literal question I would not like to be perceived as racist, not even unto myself.
Value Label Cases Weighted Percentage (Weighted)
1 Very good 519 510.0 10.4%
2 Good 794 732.2 14.9%
3 Somewhat good 346 346.7 7.1%
4 Neither good nor bad 357 384.4 7.8%
5 Somewhat bad 121 131.8 2.7%
6 Bad 54 58.5 1.2%
7 Very bad 26 25.4 0.5%
97 No answer 99 103.5 2.1%

- 109 -
# dv35_2: Fitting description: Don't want to appear racist
Value Label Cases Weighted Percentage (Weighted)
98 Not asked 2589 2612.4 53.3%Warning: these figures indicate the number of cases found in the data file. They cannot be interpreted as summary statistics of the population of interest.
# dv35_3: Fitting description: Feel guilty about negative feeling towards immigrants
Information [Type= discrete] [Format=numeric] [Range= 1-7] [Missing=*]
Statistics [NW/ W] [Valid=4905 / 4905 ] [Invalid=0 / 0 ]
Pre-question How well or poor would you say that the following description fits you:
Literal question I feel guilty if I have negative feelings towards immigrants.
Value Label Cases Weighted Percentage (Weighted)
1 Very good 176 179.4 3.7%
2 Good 368 344.3 7.0%
3 Somewhat good 358 357.1 7.3%
4 Neither good nor bad 577 602.3 12.3%
5 Somewhat bad 272 263.0 5.4%
6 Bad 290 272.6 5.6%
7 Very bad 176 173.2 3.5%
97 No answer 99 100.7 2.1%
98 Not asked 2589 2612.4 53.3%Warning: these figures indicate the number of cases found in the data file. They cannot be interpreted as summary statistics of the population of interest.
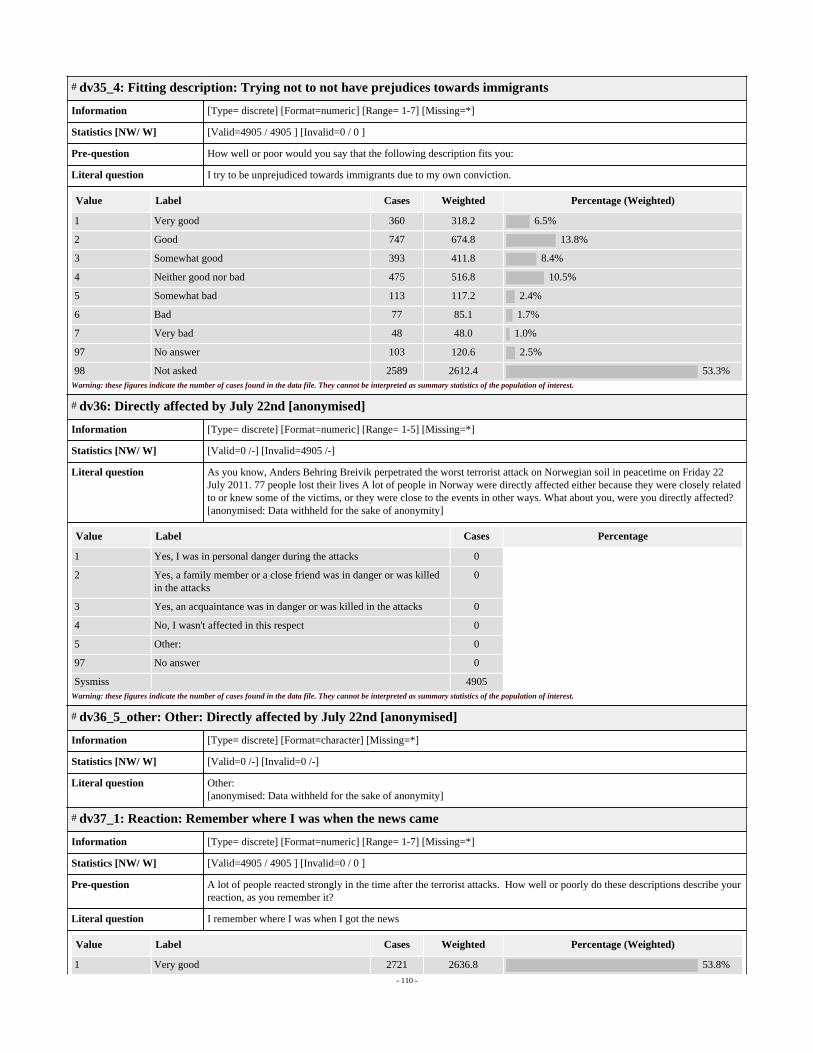
- 110 -
# dv35_4: Fitting description: Trying not to not have prejudices towards immigrants
Information [Type= discrete] [Format=numeric] [Range= 1-7] [Missing=*]
Statistics [NW/ W] [Valid=4905 / 4905 ] [Invalid=0 / 0 ]
Pre-question How well or poor would you say that the following description fits you:
Literal question I try to be unprejudiced towards immigrants due to my own conviction.
Value Label Cases Weighted Percentage (Weighted)
1 Very good 360 318.2 6.5%
2 Good 747 674.8 13.8%
3 Somewhat good 393 411.8 8.4%
4 Neither good nor bad 475 516.8 10.5%
5 Somewhat bad 113 117.2 2.4%
6 Bad 77 85.1 1.7%
7 Very bad 48 48.0 1.0%
97 No answer 103 120.6 2.5%
98 Not asked 2589 2612.4 53.3%Warning: these figures indicate the number of cases found in the data file. They cannot be interpreted as summary statistics of the population of interest.
# dv36: Directly affected by July 22nd [anonymised]
Information [Type= discrete] [Format=numeric] [Range= 1-5] [Missing=*]
Statistics [NW/ W] [Valid=0 /-] [Invalid=4905 /-]
Literal question As you know, Anders Behring Breivik perpetrated the worst terrorist attack on Norwegian soil in peacetime on Friday 22July 2011. 77 people lost their lives A lot of people in Norway were directly affected either because they were closely relatedto or knew some of the victims, or they were close to the events in other ways. What about you, were you directly affected?[anonymised: Data withheld for the sake of anonymity]
Value Label Cases Percentage
1 Yes, I was in personal danger during the attacks 0
2 Yes, a family member or a close friend was in danger or was killedin the attacks
0
3 Yes, an acquaintance was in danger or was killed in the attacks 0
4 No, I wasn't affected in this respect 0
5 Other: 0
97 No answer 0
Sysmiss 4905Warning: these figures indicate the number of cases found in the data file. They cannot be interpreted as summary statistics of the population of interest.
# dv36_5_other: Other: Directly affected by July 22nd [anonymised]
Information [Type= discrete] [Format=character] [Missing=*]
Statistics [NW/ W] [Valid=0 /-] [Invalid=0 /-]
Literal question Other:[anonymised: Data withheld for the sake of anonymity]
# dv37_1: Reaction: Remember where I was when the news came
Information [Type= discrete] [Format=numeric] [Range= 1-7] [Missing=*]
Statistics [NW/ W] [Valid=4905 / 4905 ] [Invalid=0 / 0 ]
Pre-question A lot of people reacted strongly in the time after the terrorist attacks. How well or poorly do these descriptions describe yourreaction, as you remember it?
Literal question I remember where I was when I got the news
Value Label Cases Weighted Percentage (Weighted)
1 Very good 2721 2636.8 53.8%

- 111 -
# dv37_1: Reaction: Remember where I was when the news came
Value Label Cases Weighted Percentage (Weighted)
2 Good 576 603.6 12.3%
3 Somewhat good 126 142.1 2.9%
4 Neither good nor bad 132 158.6 3.2%
5 Somewhat bad 49 56.6 1.2%
6 Bad 88 78.6 1.6%
7 Very bad 109 111.4 2.3%
97 No answer 92 103.0 2.1%
98 Not asked 1012 1014.3 20.7%Warning: these figures indicate the number of cases found in the data file. They cannot be interpreted as summary statistics of the population of interest.
# dv37_2: Reaction: Remember who I was with when the news came
Information [Type= discrete] [Format=numeric] [Range= 1-7] [Missing=*]
Statistics [NW/ W] [Valid=4905 / 4905 ] [Invalid=0 / 0 ]
Pre-question A lot of people reacted strongly in the time after the terrorist attacks. How well or poorly do these descriptions describe yourreaction, as you remember it?
Literal question I remember who I was with when I got the news
Value Label Cases Weighted Percentage (Weighted)
1 Very good 2570 2463.4 50.2%
2 Good 598 598.3 12.2%
3 Somewhat good 130 141.8 2.9%
4 Neither good nor bad 181 214.6 4.4%
5 Somewhat bad 52 73.8 1.5%
6 Bad 116 113.8 2.3%
7 Very bad 130 136.7 2.8%
97 No answer 116 148.4 3.0%
98 Not asked 1012 1014.3 20.7%Warning: these figures indicate the number of cases found in the data file. They cannot be interpreted as summary statistics of the population of interest.
# dv37_3: Reaction: Paid close attention to the news
Information [Type= discrete] [Format=numeric] [Range= 1-7] [Missing=*]
Statistics [NW/ W] [Valid=4905 / 4905 ] [Invalid=0 / 0 ]
Pre-question A lot of people reacted strongly in the time after the terrorist attacks. How well or poorly do these descriptions describe yourreaction, as you remember it?
Literal question I followed the news with extra interest in the time following the events
Value Label Cases Weighted Percentage (Weighted)
1 Very good 2355 2287.5 46.6%
2 Good 917 939.8 19.2%
3 Somewhat good 297 304.7 6.2%
4 Neither good nor bad 124 130.9 2.7%
5 Somewhat bad 50 66.5 1.4%
6 Bad 30 30.3 0.6%
7 Very bad 41 43.5 0.9%
97 No answer 79 87.6 1.8%
98 Not asked 1012 1014.3 20.7%Warning: these figures indicate the number of cases found in the data file. They cannot be interpreted as summary statistics of the population of interest.

- 112 -
# dv37_4: Reaction: Was saddend
Information [Type= discrete] [Format=numeric] [Range= 1-7] [Missing=*]
Statistics [NW/ W] [Valid=4905 / 4905 ] [Invalid=0 / 0 ]
Pre-question A lot of people reacted strongly in the time after the terrorist attacks. How well or poorly do these descriptions describe yourreaction, as you remember it?
Literal question I was sad
Value Label Cases Weighted Percentage (Weighted)
1 Very good 2181 2172.8 44.3%
2 Good 919 909.5 18.5%
3 Somewhat good 331 319.6 6.5%
4 Neither good nor bad 222 221.0 4.5%
5 Somewhat bad 42 47.9 1.0%
6 Bad 45 49.5 1.0%
7 Very bad 46 57.8 1.2%
97 No answer 107 112.6 2.3%
98 Not asked 1012 1014.3 20.7%Warning: these figures indicate the number of cases found in the data file. They cannot be interpreted as summary statistics of the population of interest.
# dv37_5: Reaction: Got angry
Information [Type= discrete] [Format=numeric] [Range= 1-7] [Missing=*]
Statistics [NW/ W] [Valid=4905 / 4905 ] [Invalid=0 / 0 ]
Pre-question A lot of people reacted strongly in the time after the terrorist attacks. How well or poorly do these descriptions describe yourreaction, as you remember it?
Literal question I was angry
Value Label Cases Weighted Percentage (Weighted)
1 Very good 1553 1643.8 33.5%
2 Good 804 800.3 16.3%
3 Somewhat good 494 473.7 9.7%
4 Neither good nor bad 521 494.3 10.1%
5 Somewhat bad 142 124.0 2.5%
6 Bad 150 130.0 2.6%
7 Very bad 102 90.4 1.8%
97 No answer 127 134.2 2.7%
98 Not asked 1012 1014.3 20.7%Warning: these figures indicate the number of cases found in the data file. They cannot be interpreted as summary statistics of the population of interest.
# dv37_6: Reaction: Discussed events with friends and relatives
Information [Type= discrete] [Format=numeric] [Range= 1-7] [Missing=*]
Statistics [NW/ W] [Valid=4905 / 4905 ] [Invalid=0 / 0 ]
Pre-question A lot of people reacted strongly in the time after the terrorist attacks. How well or poorly do these descriptions describe yourreaction, as you remember it?
Literal question I discussed 22. July with friends and acquaintances
Value Label Cases Weighted Percentage (Weighted)
1 Very good 2106 2017.9 41.1%
2 Good 1118 1153.9 23.5%
3 Somewhat good 351 374.9 7.6%
4 Neither good nor bad 134 148.1 3.0%

- 113 -
# dv37_6: Reaction: Discussed events with friends and relatives
Value Label Cases Weighted Percentage (Weighted)
5 Somewhat bad 37 44.1 0.9%
6 Bad 24 22.5 0.5%
7 Very bad 29 24.7 0.5%
97 No answer 94 104.5 2.1%
98 Not asked 1012 1014.3 20.7%Warning: these figures indicate the number of cases found in the data file. They cannot be interpreted as summary statistics of the population of interest.
# dv37_8: Reaction: Became more interested in politics
Information [Type= discrete] [Format=numeric] [Range= 1-7] [Missing=*]
Statistics [NW/ W] [Valid=4905 / 4905 ] [Invalid=0 / 0 ]
Pre-question A lot of people reacted strongly in the time after the terrorist attacks. How well or poorly do these descriptions describe yourreaction, as you remember it?
Literal question I became more interested in politics
Value Label Cases Weighted Percentage (Weighted)
1 Very good 202 215.2 4.4%
2 Good 407 387.3 7.9%
3 Somewhat good 663 662.0 13.5%
4 Neither good nor bad 1579 1582.7 32.3%
5 Somewhat bad 227 225.1 4.6%
6 Bad 385 362.6 7.4%
7 Very bad 267 269.7 5.5%
97 No answer 163 186.1 3.8%
98 Not asked 1012 1014.3 20.7%Warning: these figures indicate the number of cases found in the data file. They cannot be interpreted as summary statistics of the population of interest.
# dv37_10: Reaction: The attacks made no impression
Information [Type= discrete] [Format=numeric] [Range= 1-7] [Missing=*]
Statistics [NW/ W] [Valid=4905 / 4905 ] [Invalid=0 / 0 ]
Pre-question A lot of people reacted strongly in the time after the terrorist attacks. How well or poorly do these descriptions describe yourreaction, as you remember it?
Literal question The attacks didn't affect me much
Value Label Cases Weighted Percentage (Weighted)
1 Very good 191 255.5 5.2%
2 Good 151 213.2 4.3%
3 Somewhat good 67 67.4 1.4%
4 Neither good nor bad 110 126.1 2.6%
5 Somewhat bad 139 141.3 2.9%
6 Bad 638 611.3 12.5%
7 Very bad 2397 2235.0 45.6%
97 No answer 200 240.9 4.9%
98 Not asked 1012 1014.3 20.7%Warning: these figures indicate the number of cases found in the data file. They cannot be interpreted as summary statistics of the population of interest.
# dv37_annet_1: Other: Reaction [anonymised]
Information [Type= discrete] [Format=character] [Missing=*]
Statistics [NW/ W] [Valid=0 /-] [Invalid=0 /-]

- 114 -
# dv37_annet_1: Other: Reaction [anonymised]
Pre-question A lot of people reacted strongly in the time after the terrorist attacks. How well or poorly do these descriptions describe yourreaction, as you remember it?
Literal question Other:[anonymised: Data withheld for the sake of anonymity]
# dv371: Participated in remembrance services in the period following the attacks
Information [Type= discrete] [Format=numeric] [Range= 1-2] [Missing=*]
Statistics [NW/ W] [Valid=4905 /-] [Invalid=0 /-]
Literal question Did you participate in the remembrance services in the period following the attacks?
Value Label Cases Percentage
1 Yes 1133 23.1%
2 No 2702 55.1%
97 No answer 58 1.2%
98 Not asked 1012 20.6%Warning: these figures indicate the number of cases found in the data file. They cannot be interpreted as summary statistics of the population of interest.
# dv372: Joined political party or association in the period following the attacks
Information [Type= discrete] [Format=numeric] [Range= 1-2] [Missing=*]
Statistics [NW/ W] [Valid=4905 /-] [Invalid=0 /-]
Literal question Did you become a member of a political party or an association in the period after the terrorist attacks?
Value Label Cases Percentage
1 Yes, and if so which: 38 0.8%
2 No 3804 77.6%
97 No answer 51 1.0%
98 Not asked 1012 20.6%Warning: these figures indicate the number of cases found in the data file. They cannot be interpreted as summary statistics of the population of interest.
# dv372_1_other: Text: Joined political party or association in the period following the attacks
Information [Type= discrete] [Format=character] [Missing=*]
Statistics [NW/ W] [Valid=4905 /-] [Invalid=0 /-]
Literal question Did you become a member of a political party or an association in the period after the terrorist attacks?
# dv39: Think, read or talk about July 22nd
Information [Type= discrete] [Format=numeric] [Range= 1-5] [Missing=*]
Statistics [NW/ W] [Valid=4905 /-] [Invalid=0 /-]
Literal question More than two years have passed since the attacks. As for you personally, how often would you say that you think, read ortalk about things that have to do with 22 July nowadays?
Value Label Cases Percentage
1 Every day 40 0.8%
2 Weekly 535 10.9%
3 A few times a month 1467 29.9%
4 More seldom, but it occurs 2339 47.7%
5 Never 198 4.0%
97 No answer 326 6.6%Warning: these figures indicate the number of cases found in the data file. They cannot be interpreted as summary statistics of the population of interest.
# dv38_1: Fitting description: Important not to not have prejudices towards immigrants
Information [Type= discrete] [Format=numeric] [Range= 1-7] [Missing=*]

- 115 -
# dv38_1: Fitting description: Important not to not have prejudices towards immigrants
Statistics [NW/ W] [Valid=4905 / 4905 ] [Invalid=0 / 0 ]
Pre-question How well or poorly would you say that the following description fits you:
Literal question It is important to me personally to be unprejudiced towards immigrants.
Value Label Cases Weighted Percentage (Weighted)
1 Very well 468 447.7 9.1%
2 Well 815 780.5 15.9%
3 Somewhat well 452 462.4 9.4%
4 Neither well nor poorly 337 383.7 7.8%
5 Somewhat poorly 121 131.6 2.7%
6 Poorly 72 78.5 1.6%
7 Very poorly 35 37.7 0.8%
97 No answer 77 77.3 1.6%
98 Not asked 2528 2505.5 51.1%Warning: these figures indicate the number of cases found in the data file. They cannot be interpreted as summary statistics of the population of interest.
# dv38_2: Fitting description: Don't want to appear racist
Information [Type= discrete] [Format=numeric] [Range= 1-7] [Missing=*]
Statistics [NW/ W] [Valid=4905 / 4905 ] [Invalid=0 / 0 ]
Pre-question How well or poorly would you say that the following description fits you:
Literal question I would not like to be perceived as racist, not even unto myself.
Value Label Cases Weighted Percentage (Weighted)
1 Very well 551 545.6 11.1%
2 Well 841 832.3 17.0%
3 Somewhat well 352 353.5 7.2%
4 Neither well nor poorly 327 355.6 7.2%
5 Somewhat poorly 120 121.0 2.5%
6 Poorly 58 57.6 1.2%
7 Very poorly 34 37.1 0.8%
97 No answer 94 97.0 2.0%
98 Not asked 2528 2505.5 51.1%Warning: these figures indicate the number of cases found in the data file. They cannot be interpreted as summary statistics of the population of interest.
# dv38_3: Fitting description: Feel guilty about negative feeling towards immigrants
Information [Type= discrete] [Format=numeric] [Range= 1-7] [Missing=*]
Statistics [NW/ W] [Valid=4905 / 4905 ] [Invalid=0 / 0 ]
Pre-question How well or poorly would you say that the following description fits you:
Literal question I feel guilty if I have negative feelings towards immigrants.
Value Label Cases Weighted Percentage (Weighted)
1 Very well 169 188.8 3.8%
2 Well 367 367.5 7.5%
3 Somewhat well 377 385.6 7.9%
4 Neither well nor poorly 558 581.4 11.9%
5 Somewhat poorly 280 272.7 5.6%
6 Poorly 332 304.3 6.2%
7 Very poorly 193 195.1 4.0%

- 116 -
# dv38_3: Fitting description: Feel guilty about negative feeling towards immigrants
Value Label Cases Weighted Percentage (Weighted)
97 No answer 101 104.0 2.1%
98 Not asked 2528 2505.5 51.1%Warning: these figures indicate the number of cases found in the data file. They cannot be interpreted as summary statistics of the population of interest.
# dv38_4: Fitting description: Trying not to not have prejudices towards immigrants
Information [Type= discrete] [Format=numeric] [Range= 1-7] [Missing=*]
Statistics [NW/ W] [Valid=4905 / 4905 ] [Invalid=0 / 0 ]
Pre-question How well or poorly would you say that the following description fits you:
Literal question I try to be unprejudiced towards immigrants due to my own conviction.
Value Label Cases Weighted Percentage (Weighted)
1 Very well 380 362.5 7.4%
2 Well 711 682.7 13.9%
3 Somewhat well 426 412.5 8.4%
4 Neither well nor poorly 494 557.4 11.4%
5 Somewhat poorly 123 138.9 2.8%
6 Poorly 88 81.7 1.7%
7 Very poorly 61 71.4 1.5%
97 No answer 94 92.3 1.9%
98 Not asked 2528 2505.5 51.1%Warning: these figures indicate the number of cases found in the data file. They cannot be interpreted as summary statistics of the population of interest.
# k17_1: Usage of media channels for news: TV
Information [Type= discrete] [Format=numeric] [Range= 1-5] [Missing=*]
Statistics [NW/ W] [Valid=4905 / 4905 ] [Invalid=0 / 0 ]
Pre-question How often do you use these media channels to stay up to date on news?
Literal question TV
Value Label Cases Weighted Percentage (Weighted)
1 Several times a day 1235 1267.0 25.8%
2 Every day 2152 2156.8 44.0%
3 Several times a week 707 640.7 13.1%
4 Less frequently 390 405.9 8.3%
5 Never 99 101.5 2.1%
97 No answer 322 333.0 6.8%Warning: these figures indicate the number of cases found in the data file. They cannot be interpreted as summary statistics of the population of interest.
# k17_2: Usage of media channels for news: Radio
Information [Type= discrete] [Format=numeric] [Range= 1-5] [Missing=*]
Statistics [NW/ W] [Valid=4905 / 4905 ] [Invalid=0 / 0 ]
Pre-question How often do you use these media channels to stay up to date on news?
Literal question Radio
Value Label Cases Weighted Percentage (Weighted)
1 Several times a day 1293 1308.5 26.7%
2 Every day 1447 1424.2 29.0%
3 Several times a week 821 748.8 15.3%
4 Less frequently 705 719.1 14.7%

- 117 -
# k17_2: Usage of media channels for news: Radio
Value Label Cases Weighted Percentage (Weighted)
5 Never 207 245.9 5.0%
97 No answer 432 458.5 9.3%Warning: these figures indicate the number of cases found in the data file. They cannot be interpreted as summary statistics of the population of interest.
# k17_3: Usage of media channels for news: Newspaper
Information [Type= discrete] [Format=numeric] [Range= 1-5] [Missing=*]
Statistics [NW/ W] [Valid=4905 / 4905 ] [Invalid=0 / 0 ]
Pre-question How often do you use these media channels to stay up to date on news?
Literal question Printed newspapers
Value Label Cases Weighted Percentage (Weighted)
1 Several times a day 471 453.9 9.3%
2 Every day 1939 1942.5 39.6%
3 Several times a week 793 756.7 15.4%
4 Less frequently 1077 1074.6 21.9%
5 Never 199 229.3 4.7%
97 No answer 426 448.0 9.1%Warning: these figures indicate the number of cases found in the data file. They cannot be interpreted as summary statistics of the population of interest.
# k17_4: Usage of media channels for news: Online newspaper
Information [Type= discrete] [Format=numeric] [Range= 1-5] [Missing=*]
Statistics [NW/ W] [Valid=4905 / 4905 ] [Invalid=0 / 0 ]
Pre-question How often do you use these media channels to stay up to date on news?
Literal question Online newspapers
Value Label Cases Weighted Percentage (Weighted)
1 Several times a day 1759 1659.9 33.8%
2 Every day 1286 1278.5 26.1%
3 Several times a week 764 744.0 15.2%
4 Less frequently 503 553.4 11.3%
5 Never 156 196.5 4.0%
97 No answer 437 472.8 9.6%Warning: these figures indicate the number of cases found in the data file. They cannot be interpreted as summary statistics of the population of interest.
# k17_5: Usage of media channels for news: Facebook
Information [Type= discrete] [Format=numeric] [Range= 1-5] [Missing=*]
Statistics [NW/ W] [Valid=4905 / 4905 ] [Invalid=0 / 0 ]
Pre-question How often do you use these media channels to stay up to date on news?
Literal question Facebook
Value Label Cases Weighted Percentage (Weighted)
1 Several times a day 1003 1047.7 21.4%
2 Every day 879 883.5 18.0%
3 Several times a week 506 496.1 10.1%
4 Less frequently 563 518.5 10.6%
5 Never 1362 1334.0 27.2%
97 No answer 592 625.1 12.7%Warning: these figures indicate the number of cases found in the data file. They cannot be interpreted as summary statistics of the population of interest.
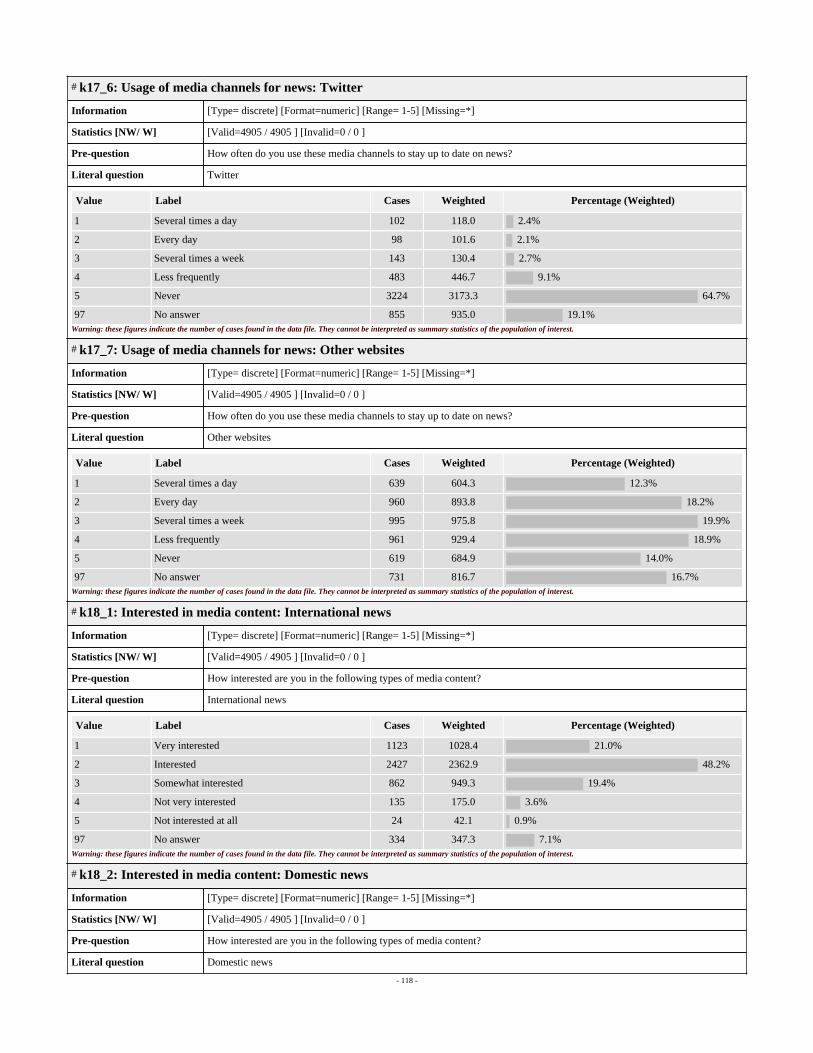
- 118 -
# k17_6: Usage of media channels for news: Twitter
Information [Type= discrete] [Format=numeric] [Range= 1-5] [Missing=*]
Statistics [NW/ W] [Valid=4905 / 4905 ] [Invalid=0 / 0 ]
Pre-question How often do you use these media channels to stay up to date on news?
Literal question Twitter
Value Label Cases Weighted Percentage (Weighted)
1 Several times a day 102 118.0 2.4%
2 Every day 98 101.6 2.1%
3 Several times a week 143 130.4 2.7%
4 Less frequently 483 446.7 9.1%
5 Never 3224 3173.3 64.7%
97 No answer 855 935.0 19.1%Warning: these figures indicate the number of cases found in the data file. They cannot be interpreted as summary statistics of the population of interest.
# k17_7: Usage of media channels for news: Other websites
Information [Type= discrete] [Format=numeric] [Range= 1-5] [Missing=*]
Statistics [NW/ W] [Valid=4905 / 4905 ] [Invalid=0 / 0 ]
Pre-question How often do you use these media channels to stay up to date on news?
Literal question Other websites
Value Label Cases Weighted Percentage (Weighted)
1 Several times a day 639 604.3 12.3%
2 Every day 960 893.8 18.2%
3 Several times a week 995 975.8 19.9%
4 Less frequently 961 929.4 18.9%
5 Never 619 684.9 14.0%
97 No answer 731 816.7 16.7%Warning: these figures indicate the number of cases found in the data file. They cannot be interpreted as summary statistics of the population of interest.
# k18_1: Interested in media content: International news
Information [Type= discrete] [Format=numeric] [Range= 1-5] [Missing=*]
Statistics [NW/ W] [Valid=4905 / 4905 ] [Invalid=0 / 0 ]
Pre-question How interested are you in the following types of media content?
Literal question International news
Value Label Cases Weighted Percentage (Weighted)
1 Very interested 1123 1028.4 21.0%
2 Interested 2427 2362.9 48.2%
3 Somewhat interested 862 949.3 19.4%
4 Not very interested 135 175.0 3.6%
5 Not interested at all 24 42.1 0.9%
97 No answer 334 347.3 7.1%Warning: these figures indicate the number of cases found in the data file. They cannot be interpreted as summary statistics of the population of interest.
# k18_2: Interested in media content: Domestic news
Information [Type= discrete] [Format=numeric] [Range= 1-5] [Missing=*]
Statistics [NW/ W] [Valid=4905 / 4905 ] [Invalid=0 / 0 ]
Pre-question How interested are you in the following types of media content?
Literal question Domestic news

- 119 -
# k18_2: Interested in media content: Domestic news
Value Label Cases Weighted Percentage (Weighted)
1 Very interested 1324 1355.2 27.6%
2 Interested 2591 2483.0 50.6%
3 Somewhat interested 547 602.2 12.3%
4 Not very interested 78 77.9 1.6%
5 Not interested at all 23 37.5 0.8%
97 No answer 342 349.1 7.1%Warning: these figures indicate the number of cases found in the data file. They cannot be interpreted as summary statistics of the population of interest.
# k18_3: Interested in media content: Local news
Information [Type= discrete] [Format=numeric] [Range= 1-5] [Missing=*]
Statistics [NW/ W] [Valid=4905 / 4905 ] [Invalid=0 / 0 ]
Pre-question How interested are you in the following types of media content?
Literal question Local news
Value Label Cases Weighted Percentage (Weighted)
1 Very interested 1451 1602.3 32.7%
2 Interested 2168 2077.7 42.4%
3 Somewhat interested 694 619.3 12.6%
4 Not very interested 217 209.5 4.3%
5 Not interested at all 36 50.7 1.0%
97 No answer 339 345.4 7.0%Warning: these figures indicate the number of cases found in the data file. They cannot be interpreted as summary statistics of the population of interest.
# k18_4: Interested in media content: Health/ consumer/ lifestyle
Information [Type= discrete] [Format=numeric] [Range= 1-5] [Missing=*]
Statistics [NW/ W] [Valid=4905 / 4905 ] [Invalid=0 / 0 ]
Pre-question How interested are you in the following types of media content?
Literal question Health/ consumer/ lifestyle
Value Label Cases Weighted Percentage (Weighted)
1 Very interested 718 740.7 15.1%
2 Interested 1785 1798.0 36.7%
3 Somewhat interested 1390 1346.7 27.5%
4 Not very interested 547 542.8 11.1%
5 Not interested at all 112 120.8 2.5%
97 No answer 353 355.9 7.3%Warning: these figures indicate the number of cases found in the data file. They cannot be interpreted as summary statistics of the population of interest.
# k18_5: Interested in media content: Debate
Information [Type= discrete] [Format=numeric] [Range= 1-5] [Missing=*]
Statistics [NW/ W] [Valid=4905 / 4905 ] [Invalid=0 / 0 ]
Pre-question How interested are you in the following types of media content?
Literal question Debate
Value Label Cases Weighted Percentage (Weighted)
1 Very interested 628 636.7 13.0%
2 Interested 1694 1600.6 32.6%
3 Somewhat interested 1419 1383.6 28.2%

- 120 -
# k18_5: Interested in media content: Debate
Value Label Cases Weighted Percentage (Weighted)
4 Not very interested 628 697.2 14.2%
5 Not interested at all 173 210.9 4.3%
97 No answer 363 376.0 7.7%Warning: these figures indicate the number of cases found in the data file. They cannot be interpreted as summary statistics of the population of interest.
# k18_6: Interested in media content: Culture and feature
Information [Type= discrete] [Format=numeric] [Range= 1-5] [Missing=*]
Statistics [NW/ W] [Valid=4905 / 4905 ] [Invalid=0 / 0 ]
Pre-question How interested are you in the following types of media content?
Literal question Culture and feature
Value Label Cases Weighted Percentage (Weighted)
1 Very interested 415 356.6 7.3%
2 Interested 1327 1235.8 25.2%
3 Somewhat interested 1639 1651.4 33.7%
4 Not very interested 929 1010.2 20.6%
5 Not interested at all 205 238.2 4.9%
97 No answer 390 412.8 8.4%Warning: these figures indicate the number of cases found in the data file. They cannot be interpreted as summary statistics of the population of interest.
# k18_7: Interested in media content: Entertainment and celebrity news
Information [Type= discrete] [Format=numeric] [Range= 1-5] [Missing=*]
Statistics [NW/ W] [Valid=4905 / 4905 ] [Invalid=0 / 0 ]
Pre-question How interested are you in the following types of media content?
Literal question Entertainment and celebrity news
Value Label Cases Weighted Percentage (Weighted)
1 Very interested 169 186.4 3.8%
2 Interested 742 811.9 16.6%
3 Somewhat interested 1403 1460.1 29.8%
4 Not very interested 1631 1517.1 30.9%
5 Not interested at all 571 528.7 10.8%
97 No answer 389 400.7 8.2%Warning: these figures indicate the number of cases found in the data file. They cannot be interpreted as summary statistics of the population of interest.
# k18_8: Interested in media content: Sports
Information [Type= discrete] [Format=numeric] [Range= 1-5] [Missing=*]
Statistics [NW/ W] [Valid=4905 / 4905 ] [Invalid=0 / 0 ]
Pre-question How interested are you in the following types of media content?
Literal question Sports
Value Label Cases Weighted Percentage (Weighted)
1 Very interested 715 752.4 15.3%
2 Interested 1005 1022.4 20.8%
3 Somewhat interested 956 959.2 19.6%
4 Not very interested 1103 1054.0 21.5%
5 Not interested at all 760 738.1 15.0%
97 No answer 366 378.8 7.7%

- 121 -
# k18_8: Interested in media content: SportsWarning: these figures indicate the number of cases found in the data file. They cannot be interpreted as summary statistics of the population of interest.
# k19_1: Profile on social network: Facebook
Information [Type= discrete] [Format=numeric] [Range= 0-1] [Missing=*]
Statistics [NW/ W] [Valid=4905 / 4905 ] [Invalid=0 / 0 ]
Pre-question Which social network sites do you have a profile on?
Literal question Facebook
Interviewer's instructions Flere kryss mulig.
Value Label Cases Weighted Percentage (Weighted)
0 Not selected 697 713.8 14.6%
1 Selected 1619 1572.7 32.1%
97 No answer 118 118.1 2.4%
98 Not asked 2471 2500.4 51.0%Warning: these figures indicate the number of cases found in the data file. They cannot be interpreted as summary statistics of the population of interest.
# k19_2: Profile on social network: Twitter
Information [Type= discrete] [Format=numeric] [Range= 0-1] [Missing=*]
Statistics [NW/ W] [Valid=4905 / 4905 ] [Invalid=0 / 0 ]
Pre-question Which social network sites do you have a profile on?
Literal question Twitter
Interviewer's instructions Flere kryss mulig.
Value Label Cases Weighted Percentage (Weighted)
0 Not selected 1900 1894.8 38.6%
1 Selected 416 391.7 8.0%
97 No answer 118 118.1 2.4%
98 Not asked 2471 2500.4 51.0%Warning: these figures indicate the number of cases found in the data file. They cannot be interpreted as summary statistics of the population of interest.
# k19_3: Profile on social network: Instagram
Information [Type= discrete] [Format=numeric] [Range= 0-1] [Missing=*]
Statistics [NW/ W] [Valid=4905 / 4905 ] [Invalid=0 / 0 ]
Pre-question Which social network sites do you have a profile on?
Literal question Instagram
Interviewer's instructions Flere kryss mulig.
Value Label Cases Weighted Percentage (Weighted)
0 Not selected 1834 1832.1 37.4%
1 Selected 482 454.4 9.3%
97 No answer 118 118.1 2.4%
98 Not asked 2471 2500.4 51.0%Warning: these figures indicate the number of cases found in the data file. They cannot be interpreted as summary statistics of the population of interest.
# k19_4: Profile on social network: Youtube
Information [Type= discrete] [Format=numeric] [Range= 0-1] [Missing=*]
Statistics [NW/ W] [Valid=4905 / 4905 ] [Invalid=0 / 0 ]
Pre-question Which social network sites do you have a profile on?
Literal question YouTube

- 122 -
# k19_4: Profile on social network: Youtube
Interviewer's instructions Flere kryss mulig.
Value Label Cases Weighted Percentage (Weighted)
0 Not selected 1822 1766.7 36.0%
1 Selected 494 519.8 10.6%
97 No answer 118 118.1 2.4%
98 Not asked 2471 2500.4 51.0%Warning: these figures indicate the number of cases found in the data file. They cannot be interpreted as summary statistics of the population of interest.
# k19_5: Profile on social network: Flickr
Information [Type= discrete] [Format=numeric] [Range= 0-1] [Missing=*]
Statistics [NW/ W] [Valid=4905 / 4905 ] [Invalid=0 / 0 ]
Pre-question Which social network sites do you have a profile on?
Literal question Flickr
Interviewer's instructions Flere kryss mulig.
Value Label Cases Weighted Percentage (Weighted)
0 Not selected 2236 2209.2 45.0%
1 Selected 80 77.3 1.6%
97 No answer 118 118.1 2.4%
98 Not asked 2471 2500.4 51.0%Warning: these figures indicate the number of cases found in the data file. They cannot be interpreted as summary statistics of the population of interest.
# k19_6: Profile on social network: LinkedIn
Information [Type= discrete] [Format=numeric] [Range= 0-1] [Missing=*]
Statistics [NW/ W] [Valid=4905 / 4905 ] [Invalid=0 / 0 ]
Pre-question Which social network sites do you have a profile on?
Literal question LinkedIn
Interviewer's instructions Flere kryss mulig.
Value Label Cases Weighted Percentage (Weighted)
0 Not selected 1826 1926.0 39.3%
1 Selected 490 360.5 7.3%
97 No answer 118 118.1 2.4%
98 Not asked 2471 2500.4 51.0%Warning: these figures indicate the number of cases found in the data file. They cannot be interpreted as summary statistics of the population of interest.
# k19_7: Profile on social network: Myspace
Information [Type= discrete] [Format=numeric] [Range= 0-1] [Missing=*]
Statistics [NW/ W] [Valid=4905 / 4905 ] [Invalid=0 / 0 ]
Pre-question Which social network sites do you have a profile on?
Literal question Myspace
Interviewer's instructions Flere kryss mulig.
Value Label Cases Weighted Percentage (Weighted)
0 Not selected 2268 2237.9 45.6%
1 Selected 48 48.6 1.0%
97 No answer 118 118.1 2.4%
98 Not asked 2471 2500.4 51.0%Warning: these figures indicate the number of cases found in the data file. They cannot be interpreted as summary statistics of the population of interest.
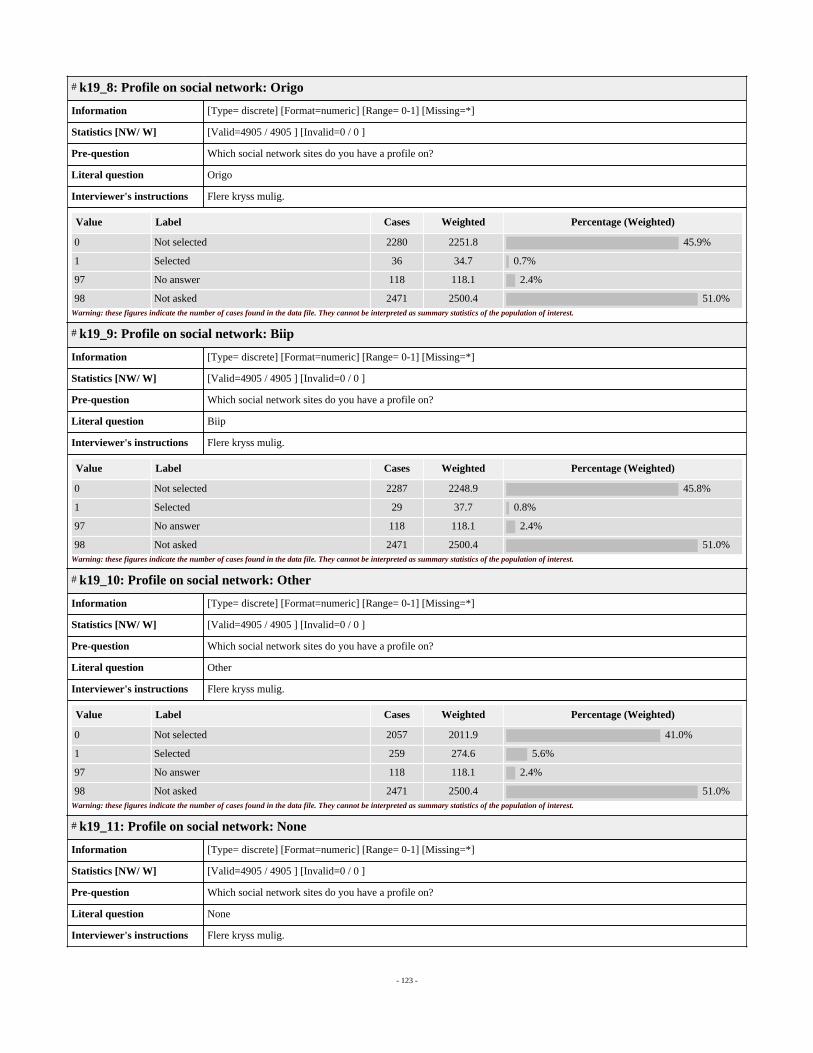
- 123 -
# k19_8: Profile on social network: Origo
Information [Type= discrete] [Format=numeric] [Range= 0-1] [Missing=*]
Statistics [NW/ W] [Valid=4905 / 4905 ] [Invalid=0 / 0 ]
Pre-question Which social network sites do you have a profile on?
Literal question Origo
Interviewer's instructions Flere kryss mulig.
Value Label Cases Weighted Percentage (Weighted)
0 Not selected 2280 2251.8 45.9%
1 Selected 36 34.7 0.7%
97 No answer 118 118.1 2.4%
98 Not asked 2471 2500.4 51.0%Warning: these figures indicate the number of cases found in the data file. They cannot be interpreted as summary statistics of the population of interest.
# k19_9: Profile on social network: Biip
Information [Type= discrete] [Format=numeric] [Range= 0-1] [Missing=*]
Statistics [NW/ W] [Valid=4905 / 4905 ] [Invalid=0 / 0 ]
Pre-question Which social network sites do you have a profile on?
Literal question Biip
Interviewer's instructions Flere kryss mulig.
Value Label Cases Weighted Percentage (Weighted)
0 Not selected 2287 2248.9 45.8%
1 Selected 29 37.7 0.8%
97 No answer 118 118.1 2.4%
98 Not asked 2471 2500.4 51.0%Warning: these figures indicate the number of cases found in the data file. They cannot be interpreted as summary statistics of the population of interest.
# k19_10: Profile on social network: Other
Information [Type= discrete] [Format=numeric] [Range= 0-1] [Missing=*]
Statistics [NW/ W] [Valid=4905 / 4905 ] [Invalid=0 / 0 ]
Pre-question Which social network sites do you have a profile on?
Literal question Other
Interviewer's instructions Flere kryss mulig.
Value Label Cases Weighted Percentage (Weighted)
0 Not selected 2057 2011.9 41.0%
1 Selected 259 274.6 5.6%
97 No answer 118 118.1 2.4%
98 Not asked 2471 2500.4 51.0%Warning: these figures indicate the number of cases found in the data file. They cannot be interpreted as summary statistics of the population of interest.
# k19_11: Profile on social network: None
Information [Type= discrete] [Format=numeric] [Range= 0-1] [Missing=*]
Statistics [NW/ W] [Valid=4905 / 4905 ] [Invalid=0 / 0 ]
Pre-question Which social network sites do you have a profile on?
Literal question None
Interviewer's instructions Flere kryss mulig.
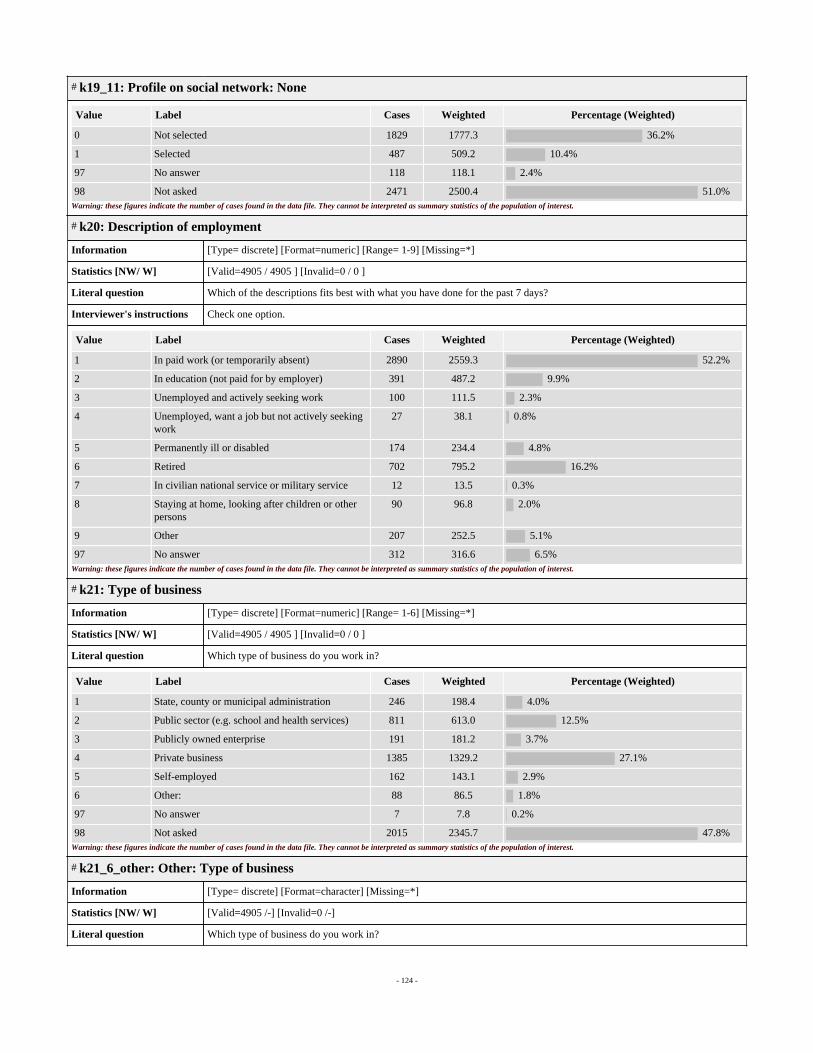
- 124 -
# k19_11: Profile on social network: None
Value Label Cases Weighted Percentage (Weighted)
0 Not selected 1829 1777.3 36.2%
1 Selected 487 509.2 10.4%
97 No answer 118 118.1 2.4%
98 Not asked 2471 2500.4 51.0%Warning: these figures indicate the number of cases found in the data file. They cannot be interpreted as summary statistics of the population of interest.
# k20: Description of employment
Information [Type= discrete] [Format=numeric] [Range= 1-9] [Missing=*]
Statistics [NW/ W] [Valid=4905 / 4905 ] [Invalid=0 / 0 ]
Literal question Which of the descriptions fits best with what you have done for the past 7 days?
Interviewer's instructions Check one option.
Value Label Cases Weighted Percentage (Weighted)
1 In paid work (or temporarily absent) 2890 2559.3 52.2%
2 In education (not paid for by employer) 391 487.2 9.9%
3 Unemployed and actively seeking work 100 111.5 2.3%
4 Unemployed, want a job but not actively seekingwork
27 38.1 0.8%
5 Permanently ill or disabled 174 234.4 4.8%
6 Retired 702 795.2 16.2%
7 In civilian national service or military service 12 13.5 0.3%
8 Staying at home, looking after children or otherpersons
90 96.8 2.0%
9 Other 207 252.5 5.1%
97 No answer 312 316.6 6.5%Warning: these figures indicate the number of cases found in the data file. They cannot be interpreted as summary statistics of the population of interest.
# k21: Type of business
Information [Type= discrete] [Format=numeric] [Range= 1-6] [Missing=*]
Statistics [NW/ W] [Valid=4905 / 4905 ] [Invalid=0 / 0 ]
Literal question Which type of business do you work in?
Value Label Cases Weighted Percentage (Weighted)
1 State, county or municipal administration 246 198.4 4.0%
2 Public sector (e.g. school and health services) 811 613.0 12.5%
3 Publicly owned enterprise 191 181.2 3.7%
4 Private business 1385 1329.2 27.1%
5 Self-employed 162 143.1 2.9%
6 Other: 88 86.5 1.8%
97 No answer 7 7.8 0.2%
98 Not asked 2015 2345.7 47.8%Warning: these figures indicate the number of cases found in the data file. They cannot be interpreted as summary statistics of the population of interest.
# k21_6_other: Other: Type of business
Information [Type= discrete] [Format=character] [Missing=*]
Statistics [NW/ W] [Valid=4905 /-] [Invalid=0 /-]
Literal question Which type of business do you work in?

- 125 -
# k23: Text: Description of profession [anonymised]
Information [Type= discrete] [Format=character] [Missing=*]
Statistics [NW/ W] [Valid=0 /-] [Invalid=0 /-]
Literal question What kind of work do you primarily do in your main profession?[anonymised: Data withheld for the sake of anonymity]

- 126 -
# k23a: Text: Name or title of profession [anonymised]
Information [Type= discrete] [Format=character] [Missing=*]
Statistics [NW/ W] [Valid=0 /-] [Invalid=0 /-]
Literal question What is the name or title of your main profession?[anonymised: Data withheld for the sake of anonymity]
# k23b: Responsible for supervising employees
Information [Type= discrete] [Format=numeric] [Range= 1-3] [Missing=*]
Statistics [NW/ W] [Valid=4905 / 4905 ] [Invalid=0 / 0 ]
Literal question Are you responsible for supervising the work of other employees in your main work?
Value Label Cases Weighted Percentage (Weighted)
1 No 1952 1763.0 35.9%
2 Yes, I supervise 10 or more employees 342 270.1 5.5%
3 Yes, I supervise 10 or less employees 577 510.7 10.4%
97 No answer 19 15.5 0.3%
98 Not asked 2015 2345.7 47.8%Warning: these figures indicate the number of cases found in the data file. They cannot be interpreted as summary statistics of the population of interest.
# k24: Work in gas or oil manufacturing
Information [Type= discrete] [Format=numeric] [Range= 1-3] [Missing=*]
Statistics [NW/ W] [Valid=4905 / 4905 ] [Invalid=0 / 0 ]
Literal question Is your workplace in the oil and gas sector, or closely related to it?
Value Label Cases Weighted Percentage (Weighted)
1 Yes, I work in the oil and gas sector 146 119.1 2.4%
2 Yes, my work is closely related to the oil and gassector
151 129.1 2.6%
3 No 2569 2288.7 46.7%
97 No answer 24 22.4 0.5%
98 Not asked 2015 2345.7 47.8%Warning: these figures indicate the number of cases found in the data file. They cannot be interpreted as summary statistics of the population of interest.
# k25_1: Gross annual income
Information [Type= continuous] [Format=numeric] [Range= 0-8500000] [Missing=*]
Statistics [NW/ W] [Valid=4905 / 4905 ] [Invalid=0 / 0 ] [Mean=387027.991 / 331320.308 ] [StdDev=411341.665 / 374250.131 ]
Pre-question What is your current income?
Literal question Gross annual income is:
Value Label Cases Weighted Percentage (Weighted)
97 No answer 779 864.5 100.0%
98 0 0.0Warning: these figures indicate the number of cases found in the data file. They cannot be interpreted as summary statistics of the population of interest.
# k26: Highest completed education
Information [Type= discrete] [Format=numeric] [Range= 1-15] [Missing=*]
Statistics [NW/ W] [Valid=4905 / 4905 ] [Invalid=0 / 0 ]
Literal question What is your highest completed education?
Value Label Cases Weighted Percentage (Weighted)
1 No completed education 28 89.9 1.8%
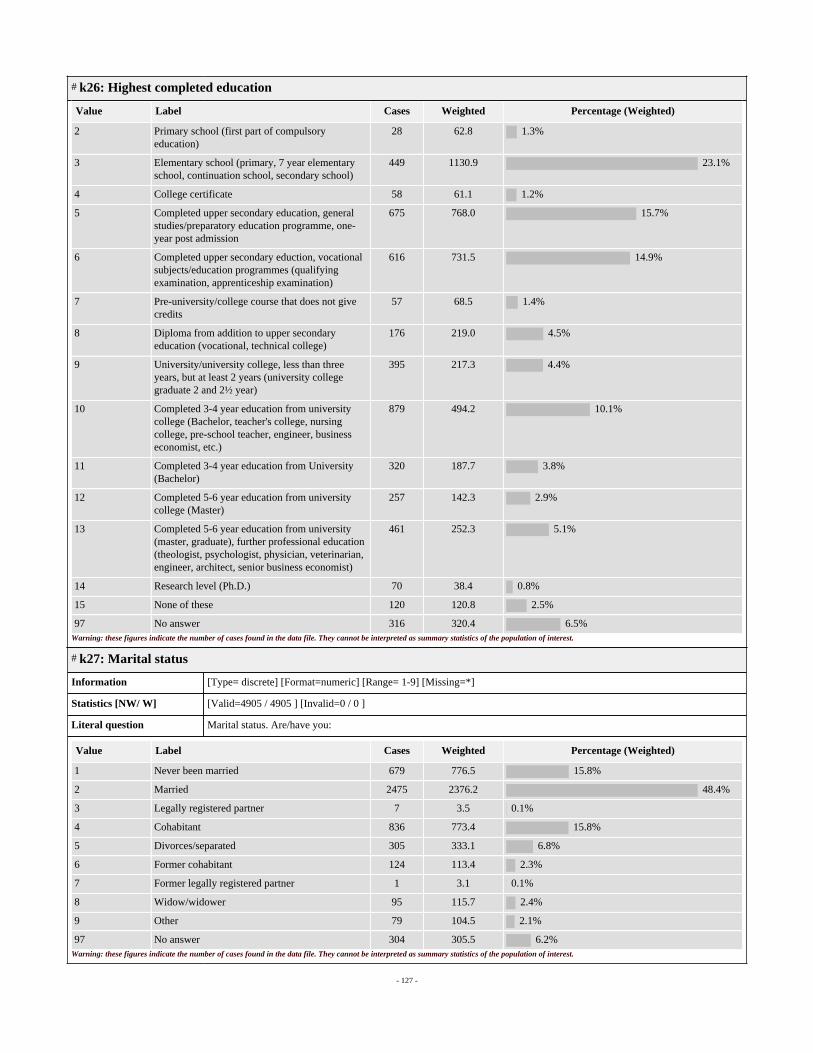
- 127 -
# k26: Highest completed education
Value Label Cases Weighted Percentage (Weighted)
2 Primary school (first part of compulsoryeducation)
28 62.8 1.3%
3 Elementary school (primary, 7 year elementaryschool, continuation school, secondary school)
449 1130.9 23.1%
4 College certificate 58 61.1 1.2%
5 Completed upper secondary education, generalstudies/preparatory education programme, one-year post admission
675 768.0 15.7%
6 Completed upper secondary eduction, vocationalsubjects/education programmes (qualifyingexamination, apprenticeship examination)
616 731.5 14.9%
7 Pre-university/college course that does not givecredits
57 68.5 1.4%
8 Diploma from addition to upper secondaryeducation (vocational, technical college)
176 219.0 4.5%
9 University/university college, less than threeyears, but at least 2 years (university collegegraduate 2 and 2½ year)
395 217.3 4.4%
10 Completed 3-4 year education from universitycollege (Bachelor, teacher's college, nursingcollege, pre-school teacher, engineer, businesseconomist, etc.)
879 494.2 10.1%
11 Completed 3-4 year education from University(Bachelor)
320 187.7 3.8%
12 Completed 5-6 year education from universitycollege (Master)
257 142.3 2.9%
13 Completed 5-6 year education from university(master, graduate), further professional education(theologist, psychologist, physician, veterinarian,engineer, architect, senior business economist)
461 252.3 5.1%
14 Research level (Ph.D.) 70 38.4 0.8%
15 None of these 120 120.8 2.5%
97 No answer 316 320.4 6.5%Warning: these figures indicate the number of cases found in the data file. They cannot be interpreted as summary statistics of the population of interest.
# k27: Marital status
Information [Type= discrete] [Format=numeric] [Range= 1-9] [Missing=*]
Statistics [NW/ W] [Valid=4905 / 4905 ] [Invalid=0 / 0 ]
Literal question Marital status. Are/have you:
Value Label Cases Weighted Percentage (Weighted)
1 Never been married 679 776.5 15.8%
2 Married 2475 2376.2 48.4%
3 Legally registered partner 7 3.5 0.1%
4 Cohabitant 836 773.4 15.8%
5 Divorces/separated 305 333.1 6.8%
6 Former cohabitant 124 113.4 2.3%
7 Former legally registered partner 1 3.1 0.1%
8 Widow/widower 95 115.7 2.4%
9 Other 79 104.5 2.1%
97 No answer 304 305.5 6.2%Warning: these figures indicate the number of cases found in the data file. They cannot be interpreted as summary statistics of the population of interest.
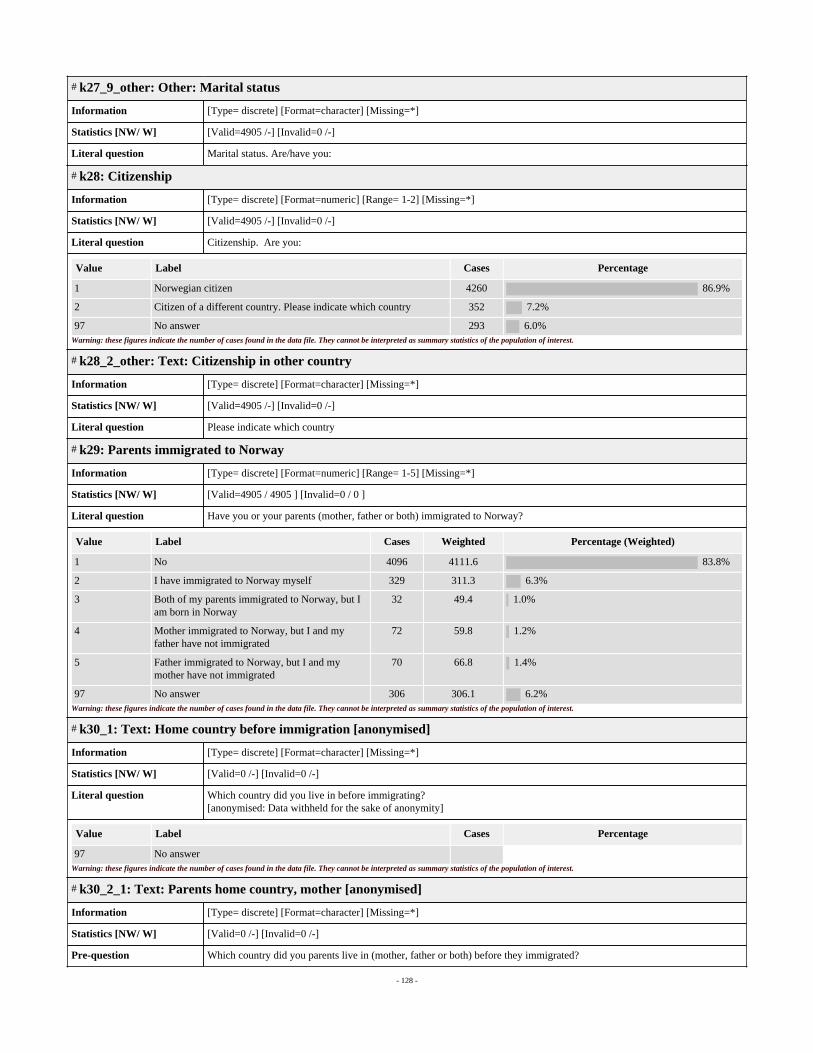
- 128 -
# k27_9_other: Other: Marital status
Information [Type= discrete] [Format=character] [Missing=*]
Statistics [NW/ W] [Valid=4905 /-] [Invalid=0 /-]
Literal question Marital status. Are/have you:
# k28: Citizenship
Information [Type= discrete] [Format=numeric] [Range= 1-2] [Missing=*]
Statistics [NW/ W] [Valid=4905 /-] [Invalid=0 /-]
Literal question Citizenship. Are you:
Value Label Cases Percentage
1 Norwegian citizen 4260 86.9%
2 Citizen of a different country. Please indicate which country 352 7.2%
97 No answer 293 6.0%Warning: these figures indicate the number of cases found in the data file. They cannot be interpreted as summary statistics of the population of interest.
# k28_2_other: Text: Citizenship in other country
Information [Type= discrete] [Format=character] [Missing=*]
Statistics [NW/ W] [Valid=4905 /-] [Invalid=0 /-]
Literal question Please indicate which country
# k29: Parents immigrated to Norway
Information [Type= discrete] [Format=numeric] [Range= 1-5] [Missing=*]
Statistics [NW/ W] [Valid=4905 / 4905 ] [Invalid=0 / 0 ]
Literal question Have you or your parents (mother, father or both) immigrated to Norway?
Value Label Cases Weighted Percentage (Weighted)
1 No 4096 4111.6 83.8%
2 I have immigrated to Norway myself 329 311.3 6.3%
3 Both of my parents immigrated to Norway, but Iam born in Norway
32 49.4 1.0%
4 Mother immigrated to Norway, but I and myfather have not immigrated
72 59.8 1.2%
5 Father immigrated to Norway, but I and mymother have not immigrated
70 66.8 1.4%
97 No answer 306 306.1 6.2%Warning: these figures indicate the number of cases found in the data file. They cannot be interpreted as summary statistics of the population of interest.
# k30_1: Text: Home country before immigration [anonymised]
Information [Type= discrete] [Format=character] [Missing=*]
Statistics [NW/ W] [Valid=0 /-] [Invalid=0 /-]
Literal question Which country did you live in before immigrating?[anonymised: Data withheld for the sake of anonymity]
Value Label Cases Percentage
97 No answerWarning: these figures indicate the number of cases found in the data file. They cannot be interpreted as summary statistics of the population of interest.
# k30_2_1: Text: Parents home country, mother [anonymised]
Information [Type= discrete] [Format=character] [Missing=*]
Statistics [NW/ W] [Valid=0 /-] [Invalid=0 /-]
Pre-question Which country did you parents live in (mother, father or both) before they immigrated?

- 129 -
# k30_2_1: Text: Parents home country, mother [anonymised]
Literal question Mother:[anonymised: Data withheld for the sake of anonymity]
Value Label Cases Percentage
97 No answerWarning: these figures indicate the number of cases found in the data file. They cannot be interpreted as summary statistics of the population of interest.
# k30_2_2: Text: Parents home country, father [anonymised]
Information [Type= discrete] [Format=character] [Missing=*]
Statistics [NW/ W] [Valid=0 /-] [Invalid=0 /-]
Pre-question Which country did you parents live in (mother, father or both) before they immigrated?
Literal question Father:[anonymised: Data withheld for the sake of anonymity]
Value Label Cases Percentage
97 No answerWarning: these figures indicate the number of cases found in the data file. They cannot be interpreted as summary statistics of the population of interest.
# k30_3_1: Text: Mothers last home country [anonymised]
Information [Type= discrete] [Format=character] [Missing=*]
Statistics [NW/ W] [Valid=0 /-] [Invalid=0 /-]
Literal question Which country did your mother live in before she immigrated?[anonymised: Data withheld for the sake of anonymity]
Value Label Cases Percentage
97 No answerWarning: these figures indicate the number of cases found in the data file. They cannot be interpreted as summary statistics of the population of interest.
# k30_4_1: Text: Fathers last home country [anonymised]
Information [Type= discrete] [Format=character] [Missing=*]
Statistics [NW/ W] [Valid=0 /-] [Invalid=0 /-]
Literal question Which country did your father live in before he immigrated?[anonymised: Data withheld for the sake of anonymity]
Value Label Cases Percentage
97 No answerWarning: these figures indicate the number of cases found in the data file. They cannot be interpreted as summary statistics of the population of interest.
# ran6: Randomizes if U=1
Information [Type= discrete] [Format=numeric] [Range= 1-2] [Missing=*]
Statistics [NW/ W] [Valid=2349 /-] [Invalid=2556 /-]
Pre-question Randomizes if U=1 into two groups and selects one of the following questions: DT14 or DT15
Value Label Cases Percentage
1 1206 51.3%
2 1143 48.7%
Sysmiss 2556Warning: these figures indicate the number of cases found in the data file. They cannot be interpreted as summary statistics of the population of interest.
# dt14: Who should get 5000 kr, the participants have no say
Information [Type= discrete] [Format=numeric] [Range= 1-3] [Missing=*]
Statistics [NW/ W] [Valid=4905 / 4905 ] [Invalid=0 / 0 ]

- 130 -
# dt14: Who should get 5000 kr, the participants have no say
Literal question One of the researchers linked to the Citizen Panel has NOK 5,000 at his disposal. These funds will either be drawn as a travelgift card to one of the Citizen Panel's participants, or they will be donated to the charitable organization Doctors WithoutBorders. The participants have no say on this decision, but it is nevertheless interesting to know your preference in how thismoney should be used. What do you prefer?
Value Label Cases Weighted Percentage (Weighted)
1 A NOK 5,000 gift card drawn as a prize for oneof the Citizen Panel's participants
137 172.4 3.5%
2 A donation of NOK 5,000 given to the charitableorganization Doctors Without Borders
964 974.4 19.9%
3 No opinion 89 85.6 1.7%
97 No answer 16 16.5 0.3%
98 Not asked 3699 3656.1 74.5%Warning: these figures indicate the number of cases found in the data file. They cannot be interpreted as summary statistics of the population of interest.
# dt15: Who should get 5000 kr, you as a participant have a say
Information [Type= discrete] [Format=numeric] [Range= 1-3] [Missing=*]
Statistics [NW/ W] [Valid=4905 / 4905 ] [Invalid=0 / 0 ]
Literal question One of the researchers linked to the Citizen Panel has NOK 5,000 at his disposal. These funds will either be drawn as agift card to one of the Citizen Panel's participants, or they will be donated to the charitable organization Doctors WithoutBorders. You as a participant have a say in this decision, and it is therefore interesting to know your preference in how thismoney should be used. What do you prefer?
Value Label Cases Weighted Percentage (Weighted)
1 A NOK 5,000 gift card drawn as a prize for oneof the Citizen Panel's participants
118 116.1 2.4%
2 A donation of NOK 5,000 given to the charitableorganization Doctors Without Borders
950 923.8 18.8%
3 No opinion 69 83.1 1.7%
97 No answer 6 6.7 0.1%
98 Not asked 3762 3775.3 77.0%Warning: these figures indicate the number of cases found in the data file. They cannot be interpreted as summary statistics of the population of interest.
# km31: Text: Thoughts on climate change [anonymised]
Information [Type= discrete] [Format=character] [Missing=*]
Statistics [NW/ W] [Valid=0 / 0 ] [Invalid=0 / 0 ]
Pre-question Finally, a question on the climate.
Literal question What do you think when you hear the words “climate change”? Please note the first thing that springs to mind. We appreciateall kinds of answers.[anonymised: Data withheld for the sake of anonymity]
Value Label Cases Percentage
97 No answerWarning: these figures indicate the number of cases found in the data file. They cannot be interpreted as summary statistics of the population of interest.
# comment: Text: Comments or suggestions for the survey [anonymised]
Information [Type= discrete] [Format=character] [Missing=*]
Statistics [NW/ W] [Valid=0 /-] [Invalid=0 /-]
Literal question If you have any comments or suggestions for the survey and the Citizen Panel, please write them here.[anonymised: Data withheld for the sake of anonymity]
# P1: Gender
Information [Type= discrete] [Format=numeric] [Missing=*]
Statistics [NW/ W] [Valid=4905 / 4905 ] [Invalid=0 / 0 ]

- 131 -
# P1: Gender
Value Label Cases Weighted Percentage (Weighted)
1 Male 2470 2440.9 49.8%
2 Female 2435 2464.1 50.2%Warning: these figures indicate the number of cases found in the data file. They cannot be interpreted as summary statistics of the population of interest.
# P2: Region
Information [Type= discrete] [Format=numeric] [Missing=*]
Statistics [NW/ W] [Valid=4905 / 4905 ] [Invalid=0 / 0 ]
Value Label Cases Weighted Percentage (Weighted)
1 Oslo/Akershus 1346 1147.6 23.4%
2 Eastern Norway 1202 1317.6 26.9%
3 Southern Norway 257 281.1 5.7%
4 Western Norway 1336 1258.4 25.7%
5 Trøndelag 391 424.8 8.7%
6 Northern Norway 373 475.4 9.7%Warning: these figures indicate the number of cases found in the data file. They cannot be interpreted as summary statistics of the population of interest.
# P3: County
Information [Type= discrete] [Format=numeric] [Missing=*]
Statistics [NW/ W] [Valid=4905 / 4905 ] [Invalid=0 / 0 ]
Value Label Cases Weighted Percentage (Weighted)
1 Akershus 587 517.2 10.5%
2 Oslo 759 630.4 12.9%
3 Østfold 246 287.8 5.9%
4 Vestfold 229 234.7 4.8%
5 Hedmark 148 164.5 3.4%
6 Oppland 168 183.8 3.7%
7 Buskerud 261 294.0 6.0%
8 Telemark 150 152.8 3.1%
9 Vest-Agder 159 174.8 3.6%
10 Aust-Agder 98 106.3 2.2%
11 Rogaland 461 442.5 9.0%
12 Hordaland 574 527.0 10.7%
13 Sogn og Fjordane 90 94.6 1.9%
14 Møre og Romsdal 211 194.2 4.0%
15 Sør-Trøndelag 290 308.1 6.3%
16 Nord-Trøndelag 101 116.8 2.4%
17 Nordland 189 240.1 4.9%
18 Troms 134 169.6 3.5%
19 Finmark 50 65.8 1.3%Warning: these figures indicate the number of cases found in the data file. They cannot be interpreted as summary statistics of the population of interest.
# P4: Highest completed education
Information [Type= discrete] [Format=numeric] [Missing=*]
Statistics [NW/ W] [Valid=4905 / 4905 ] [Invalid=0 / 0 ]
Value Label Cases Weighted Percentage (Weighted)
1 No education/elementary school 505 1283.6 26.2%

- 132 -
# P4: Highest completed education
Value Label Cases Weighted Percentage (Weighted)
2 Upper secondary education 1582 1848.1 37.7%
3 University/University college 2382 1332.1 27.2%
97 Ikke svart 436 441.2 9.0%Warning: these figures indicate the number of cases found in the data file. They cannot be interpreted as summary statistics of the population of interest.
# P5_1: Age
Information [Type= discrete] [Format=numeric] [Missing=*]
Statistics [NW/ W] [Valid=4905 / 4905 ] [Invalid=0 / 0 ]
Value Label Cases Weighted Percentage (Weighted)
1 18-25 605 748.5 15.3%
2 26-35 776 679.4 13.9%
3 36-45 914 790.8 16.1%
4 46-55 982 937.3 19.1%
5 56-65 952 1009.9 20.6%
6 66-75 564 616.8 12.6%
7 75 and above 112 122.4 2.5%Warning: these figures indicate the number of cases found in the data file. They cannot be interpreted as summary statistics of the population of interest.
# P5_2: Age
Information [Type= discrete] [Format=numeric] [Missing=*]
Statistics [NW/ W] [Valid=4905 / 4905 ] [Invalid=0 / 0 ]
Value Label Cases Weighted Percentage (Weighted)
1 18-29 years 899 1020.4 20.8%
2 30-59 years 2801 2554.2 52.1%
3 60 and above 1205 1330.4 27.1%Warning: these figures indicate the number of cases found in the data file. They cannot be interpreted as summary statistics of the population of interest.
# Weight1: Weight based on variables P3, P5_2, and P1. See documentation report.
Information [Type= discrete] [Format=numeric] [Missing=*]
Statistics [NW/ W] [Valid=4905 /-] [Invalid=0 /-]
# Weight2: Weight based on variables P3, P5_2, P4, and P1. See documentation report
Information [Type= discrete] [Format=numeric] [Missing=*]
Statistics [NW/ W] [Valid=4905 /-] [Invalid=0 /-]