study and modelling of saltwater intrusion into...
TRANSCRIPT

Study and Modelling of Saltwater Intrusion into Aquifers. Proceedings 12th Saltwater Intrusion Meeting, Barcelona, Nov. 1992. CIHS. © CIMNE. Barcelona, 1993: 715-728.
REDUCING SALTWATER INTRUSION IN SHALLOW WELLS USING INFILTRATION GALLERIES ON AUNU'U ISLAND - A CASE STUDY
E. Livingston HDR Engineering, Inc. 6200 Uptown Boulevard, Suite 150 Albuquerque, New Mexico 87110-4142 u.s;A,
SUMMARY
On Aunu'u island, within the United States Territory of American Samoa, three wells were designed and constructed. These wells utilized infiltration galleries with horizontal collectors to act as skimming wells to extract the uppermost layer of fresh water within the basal lens. The collectors were designed to withdraw an equal amount of water uniformly along the length of the collector. This design minimizes the local drawdown and subsequent interface upconing, and reduces saltwater encroachment.
1. INTRODUCTION
Aunu'u Island is a part of the u.s. Territory of American Samoa, located at latitude 14° 17' south and longitude 170° 33' west, in the South Pacific Ocean (Fig. 1). The island is inhabited by approximately 450 people.
In times previous, the villagers of Aunu'u Island have relied on rooftop rainwater catchment systems and shallow dug wells to provide for their drinking and washing water. The dug wells were typically located within a few hu~dred feet from the shoreline, and in close proximity to areas fenced off for raLsing swine. As a result, the quality of the water obtained from these wells was typically high in chloride concentration and polluted with fecal coliform bacteria.
A new water system was designed and construction completed in November 1991. This author was serving as the Project Engineer for the American samoa Power Authority during the project,
This paper will present the details of the design and construction of the infiltration galleries used for the wells, and discuss field pump test results.
2. GEOLOGICAL CONSIDERATIONS
Aunu 'u island is composed of a lithic-vitric tuff cone which occ~pies approximately one half of the eastern portion of the island, and a loW pla7n.of wave deposited marine sediments (coral, sands, etc.) occupying the remaLnLng western half [l] (Fig. 2). A watershed basin divide is formed by the western ';im of the cone. The volcanic tuff is nearly impermeable [1], and the resultLng rainfall within the eastern basin drains into the crater. On the western side of the island, where the villagers reside, rainfall recharges the thin basal lens aquifer within the marine sediments. This lens is the best source of fresh water on the island. A marsh occupies the central portion of the island, approximat';'lY 1/3 of the area within the low lying plain, and has water continuously st~ndLng within the irrigation canal network. Previous studies indicate the water Ln the marsh may be a perched aquifer [ 1]. However, the marsh water could be a potential source of contamination due to high concentrations of decomposed organic material and high coliform bacteria counts.
3. WATER BUDGET CONSIDERATIONS
Aunu'u island receives approximately 240 em of rainfall per year. This corresponds to an average total potential groundwater recharge of 15 ~ 5 m' per ~ay island wide, taking into consideration 203 em per year of potentLal evapotranspiration. For the western watershed basin, approximately one-half of

716 SURVEY AND MONITORING OF SALT WATER INTRUSION
':'N.O.MPA~'l'Ni'mM.o. I MAlleUs 11 v,~t•/ ,,~ __ _!~!:.~~C~n.::_r ___ _ ______ / _____ _
WAKE (U.S.A.)
BIKINI IS,;-, •,\, .! •'": •tBIKAR
MARSHALL IS. , .;: •
::• JWAJALE!N ~~·,;;~:~~~J~~~TAK .~ TRUK U tv POHNPEI CHAIN J , CHAIN
ot-iOGUisl~~N.Ds ' .,/J JAL 'i".Lt.LE:·:: '·:· KUSAIE '
.FEDERATED STATES OF f:-l!CRONESIA I ::MAKIN
.-<{:(KIRIBATI TARAWA' •
•NAURU ..ti ... NOUTI
' oBERU
JOHNSTON ATOLL (U.S A)
HOWLAND (U.s.A.)'.BAKER (U.s.A.)
Fig. 1.- Location of American Samoa
C7KIRITIMATI {KIA)
•JARVIS (U.S.A,)
~MALDEN,
STARBUCK'
I """ 1
!

-~.
Lo R
4t~t~~'lfJ '-~u'lr'"J , 1 /
slams \ )/ \ l._/ ,o / ~~-1 ~'
I 90 ....__ .--'
/~---~--------------------------/
258
270
J/2
.?10
JOO
t'-
E. Livingston
r, s \
Rocks I I I
/
*' ~- 21
I '-->o,~
5'
42 / /
__./~2-o..--"'
Fig. 2.- Aunu'u island. Altitudes in feet
717
l!i8
72
198
JOO

718 SURVEY AND MONITORING OF SALT WATER INTRUSION
this ie recharged into the freshwater lens, or 757 m' per day.
Future water demands of the village require a peak day demand of approximately 190 m' per day, assuming average per capita usage of 380 liters per day, and 500 villagers. This extraction rate from the freshwater lens is 25% of the average daily groundwater recharge, and is most likely the maximum sustainable yield.
4. GROUNDWATER RESOURCES
4.1 Test holes and water levels
To determine the quantity and quality of the freshwater lens, a series of test holes were excavated using a backhoe in the marine sediments composing the alluvial plain. The test holes were located in potential future well locations, typically 180 m to 210 m from the coastline, and 46 m from the marsh. Altogether, nine separate pits were excavated to depths of 60 em to 120 em below the water table elevation (Fig. 3). The lithology of each test pit was observed, along with depth to groundwater. A Stevens recorder was set up at four of the test pits, and continuous water level measurements were obtained for periods of up to seven days each. Comparisons of the test hole water level signatures to ocean tidal charts were made, and groundwater elevations estimated. Table 1 shows high and low water surface elevations for the measured test holes. For test holes no. 1, 2 and 3, high tide to maximum water level lag times were determined, and averaged approximately 3.3 hours, and tidal efficiencies computed, which averaged about 0.20 [3].
Table 1 - Test Hole Water Levels
Test Recording Approx. Ground High Water Low Water Hole Dates Elev. (MSL) Level (MSL) Level (MSL)
1 9/18 - 24/91 2.2 m 0.42 m 0.27 m
2 9/5 - 18/91 1.6 m 0.50 m 0.26 m
3 8/27-9/11/91 1.1 m 0.53 m 0.03 m
9 11/9 - 12/91 2.0 m 0.45 m 0.20 m
The ground and water surface elevations shown were determined using an existing disturbed USGS brass cap (Aunu'u South) with an assumed elevation of 3.66 meters above MSL. However, field measurements indicated the actual elevations may be up to 0.15 m less [3].
4.2 Freshwater lens thickness
The thickness of the freshwater lens was estimated with the Ghyben-Herzberg principle and water level data [4]. Water level data indicated the average freshwater head above sea level was approximately 0.15 m to 0.23 m. This corresponds to a total lens thickness of between 6.1 m and 9.1 m, to the 50% seawater isochlor [4] (Fig. 4). The freshwater nucleus is considered to be the potable part of the groundwater body, usually dictated by having a chloride concentration of 500 mg/1 or less. The freshwater nucleus was estimated to be possibly 1.5 m thick.
Water samples were taken at each test hole to record static (before pumping) chloride concentrations. Grab samples were obtained from about 30 em below the water surface. Table 2 shows the chloride levels at the test holes for the dates sampled.

E. Livingston 719
Fig 3 • .- Test hole I . ocatwns in A unu'u island

ISLAND CENTER
' RAIN ~
ho
0
GROUND SURF ACE
i ~ WATER TABLE
h --------X
BASAL LENS ~~ /.f
~ ~~/::1
- - - --- <t"£>~' . / · NTERFACE !60% s~l>~.
7
/ -·--·--- / .......---/ ------ SEAWATER
TRANSITION ZONE
40hl -q=iX
lf =ilxlcl2 -x2)1 4lk
Fig. 4 - Ghyben-Herzburg Freshwater Lens
MEAN SEA LEVEL
-I
~
[/)
c ~ ti:I ><
~ ~
~ ~ ~ > ti ~ t;l :;>::!
~ ~ [/)
0 z

E. Livingston
Table 2 - Test Hole Chloride Levels
Teet Chloride Hole Level (mg[ll
l 121
90
2 61 53 61
3 136
4 182
5 61 128 106
68 76
5. WELL DESIGN
Date SamQled
6/12/91
9/16/91
6/12/91 9/18/91 10/2/91
6/12/91
6/12/91
6/12/91 10/17/91 10/26/91 11/6/91 11/8/91
Teet Hole
6
7
8
9
Chloride Level (mg[ll
53 53 68 76 84 98
106 152 159 167
76
61
Date SamQled
6/20/91 9/24/91 10/17/91 11/6/91 11/8/91 11/9/91
10/26/91 11/6/91 11/8/91 11/9/91
10/26/91
10/26/91
721
The total future domestic water demand of Aunu'u village was estimated to be 190 m3 per day. To meet this demand, a series of three wells were placed within the freshwater core. Two wells supply the daily water consumption, with one well as standby. Saltwater intrusion is associated with the interface rise which occurs when the groundwater level is lowered due to well pumping. In order to reduce saltwater intrusion into the production wells, localized drawdown due to pumpage must be minimized. To accomplish this, three methods were used:
5.1 Well locations
The wells were separated as far apart as possible, to mLnLmLze well influence overlap and distribute the pumpage evenly. Two production wells were located in the southern half of the island (well #301 and #302), and the third at the northern end (well #303) (Fig. 5). Because the thickest part of the lens is typically towards the center of the island [4], each well was positioned as far inland as possible, while maintaining a minimum of 46 m from the marsh area to minimize any potential contamination. Additionally, well #303 was located away from other potential sources of contamination, including a cemetery, landfill and pig pens.
5.2 Well type
The second method used to minimize drawdown and subsequent saltwater intrusion was in the well design. Instead of using shallow dug wells, which produce a typical vertical well cone of depression shaped drawdown curve, the well design employed horizontal infiltration galleries. Infiltration galleries consist of perforated collection piping placed horizontally and a few feet below the water table. The horizontal collectors act as skimming wells, removing the upper layer of fresh water from the top of the lens. The collection piping discharges into a sealed sump, and from there pumped into the water system. The wells utilized two infiltration galleries each, with horizontal perforated collectors placed 180 degrees apart and parallel to the coastline. Due to the layout of well #303, the collectors were placed at 120 degrees apart (Fig. 5).
5.3 Collector Design
The third method used to minimize drawdown was in the horizontal collector

722 SURVEY AND MONITORING OF SALT WATER INTRUSION
WELL #eo> t _.,... __ WELL #301
Fig. 5.- Well locations in Aunu'u island

E. Livingston 723
design. To minimize the effects of drawdown, the collectors were designed to withdraw an equal amount of water uniformly along the length of the collector, such that the inflow into the collector was equal at the distal end as at the sump end. This was accomplished by using small circular orifices along the invert of the collector, at specific spacings. The orifices behave as a submerged orifice, with the following equation (5]:
Q = CdAoJ2g.:lH ( 1)
where Q is the flowrate; Cd is the orifice coefficient of discharge, assumed as 0.60 (5]; Ao is the orifice open area; g is the acceleration due to gravity; and the term dH is the difference between the hydraulic head outside the collector and the hydraulic head inside the collector (Fig. 6). The hydraulic head outside the collector (at the orifice entrance) is the pumping water level minus headless through the aquifer to the orifice. The hydraulic head inside the collector is the headless through the orifice, given by equation (1), and the axial headless within the collector due to pipe flo•" given by the Hazen and Williams equation for pipe flow [6]:
r v 11.85 L (2)
[ 0. 85CnwR0·63 j
where hL is the headless; V is the axial flow velocity; Cnw is the dimensionless pipe roughness coefficient, assumed to be 150 [6]; R is the pipe hydraulic radius; L is the pipe length.
Because the cumulative flow within the collector increases towards the sump end (as uniform inflow occurs), the slope of the hydraulic grade line (HGL) steepens towards the sump end. The overall total headless at the sump end due to pipe friction will be the summation of the incremental headless due to additional inflows. The difference between the collector pipe HGL at the first orifice (distal end) and the HGL at the sump end results in an increase in dH. With .:lH increasing axially towards the sump end, and all other factors constant, orifice inflow will also increase towards the sump end. To overcome this, and maintain uniform inflow, the product of Ao and J.:lHmust be constant (because Q, Cd and 2g are constant). As dH increases towards the sump end, Ao must correspondingly decrease towards the sump end, Effectively, if the orifice diameters remain constant, the number of orifice openings required will decrease towards the sump end, or conversely, increase towards the distal end at a variable spacing related to the incremental difference in JAH. As a general guideline, to maintain uniform inflow into the collectors, the orifice headless AH should be at least 10 times as great as the sum of the collector axial frictional losses.
Infiltration galleries installed in Micronesia yield a flowrate of approximately 0.006 1/s per meter of collector, however, expected sustainable yields of galleries in atoll islands are as much as 0.02 1/s per meter [4].
A flowrate of 0. 031 1/s per meter of collector was used to design the orifice diameters and spacings for the Aunu'u galleries.
Collector lengths of 15.2, 30,5 and 45.7 meters were designed, for individual collector flows of 0.47 lfs, 0.95 1/s and 1.41 1/s, respectively. Each well was designed using two collectors each, 61 m in total length, for a capacity of 1.89 1/s per well. Wells #301 and #302 utilized two 30.5 m collectors each, and well #303 used one 15.2 m and one 45.7 m collector. An orifice headless of 3 em was used in the design, which provides a quantifiable measurement for field verification during pump testing. hn orifice diameter of 6.4 mm was used, at spacings of 45.7 em for wells #301 and #302, and a variable spacing between 45.7 em and 49.7 em for well #303. To minimize the pipe friction headless, a 152 mm diameter collector was utilized. Design flow velocities

CONCRETE SUMP
FLOW Qt .. L:qi
.. <f:
WATER LEVEL
o-,
GROUND SURF ACE
~ ...
HGL ORIFICE IPER UNIFORM INFLOW)
0-..
DRAWDOWN pr-----r---~~------~-----------------------------------------------L----~
o:
__j -·---.6H -'\___ HGL IN PIPE --------
---- J UNIFORM INFLOW,qi, WHERE qi=qn
r ~TT- + ' + '· + + + ' + + + + + + + i + + ~
ORIFICE, Ao HORIZONTAL PERFORATED COLLECTOR PIPE
qo = AoCd ~ t.H = HGLor:ifice - HGLpipe (SUBMERGED ORIFICE)
Fig. 6 - Uniform Inflow to Horizontal Collector
~ ...
WATER TABLE
_, N ,!>.
(/)
c ~ trl ~
~ t:l
~ 0 z § ;:c z 0 0 '"1'1
> t3 ~ ~ ;:c
z ..., ~ (/)
0 z

E. Livingston 725
through the orifices were 0.45 m/s, with a collector axial velocity of 0.052 m/s at the sump end. Computer spreadsheets were developed to aid in the design of the required orifice openings for the three collector lengths used.
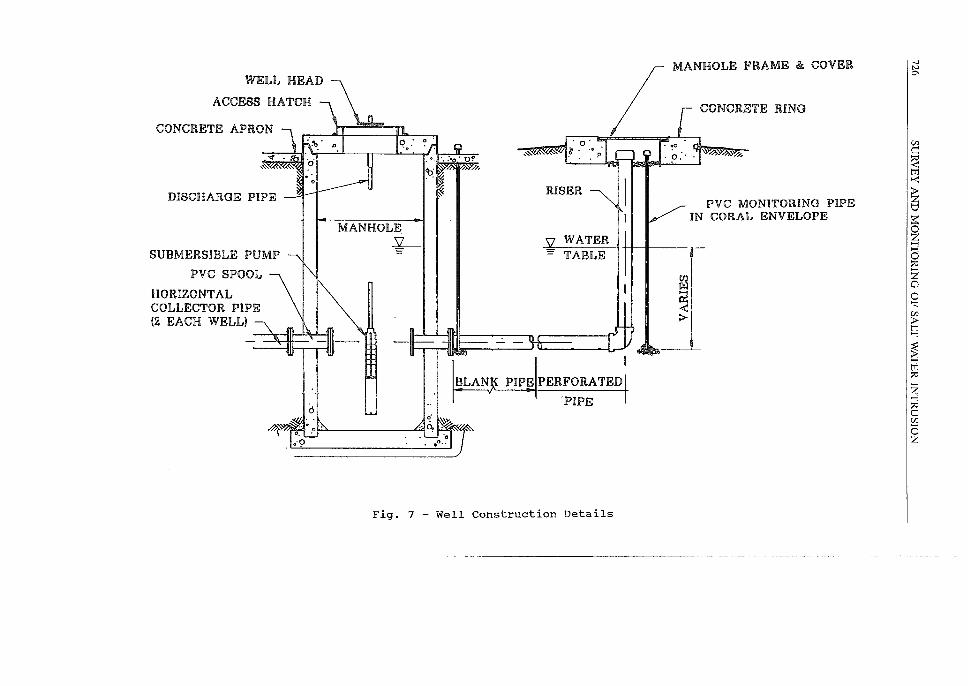
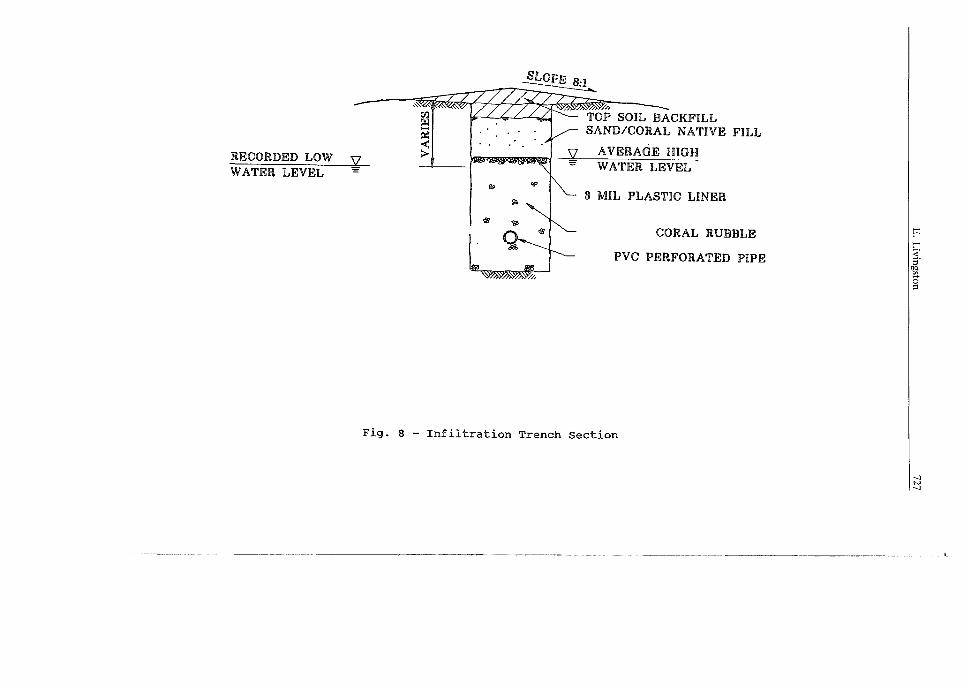
6. WELL CONSTRUCTION
The three wells were located as shown on Fig. 5. The sump of each well consisted of precast concrete manhole sections, 1.23 min diameter (Fig. 7). The sump included an integrally cast concrete base, and the manhole joints were sealed with epoxy. It is imperative that the sump is sealed water tight, so that the only flow into the well is from the collectors. The collectors were installed in open cut trench, and between 45 em and 75 em below the water table. A coral rubble envelope was placed around the collector (Fig. B). A thin plastic liner was placed on the top of the coral envelope, to inhibit the movement of sand into the gallery. Vertical risers were placed in the distal ends of the collectors to measure water levels (HGL) within the collector. Monitoring wells were placed at the sump and distal ends of the collectors, within the coral envelope, to measure static and pumping water levels within the aquifer (Fig. 7). A 1.26 1/s submersible electric pump was installed fn each sump, along with a flowmeter and a 5.25% sodium hypochlorite solution chlorination system.
7. PUMP TEST RESULTS
A large pump was used during the pump tests, to obtain various pumping rates and drawdown data. Results of the pump tests are shown in Table 3. The test results indicate that within the collectors, the water levels (HGL) were, within a reasonable tolerance, uniform and level. The data also indicates the drawdown within the aquifer was, within reasonable tolerance, uniform and level. Chloride level concentrations in the pumped water increased above static levels during the pump tests, but remained within acceptable limits. The coral rubble used for the gallery envelope contained a latent salt concentration, which added some initial chloride levels to the well (2].
Table 3 - Field Pum£ Test Results
Drawdown/Collector Drawdown/Aquifer Chloride Well Date Pum2age Gallery SumQ End Diet. End SumQ End Diet. End __Lg]gfll,
301 10/02/91 0.88 1/s east 2.1 em 2.1 em 0.9 em 0.3 em 420*
10/02/91 2.08 1/s east 13.1 em 12.8 em 4.0 em 4.3 em 420*
11/18/91 1. 39 1/s east 1.8 em 1.8 em 0.6 em 0.6 em 152 west 1.8 em 1.5 em 0.6 em 0.6 em 152
302 11/13/91 5.17 1/s north 44.2 em 42.4 em 2.4 em 2.4 em 114
11/18/91 1. 39 1/s north 1.5 em 1.5 em 0.6 em 0.6 em 106 south 1.5 em 1.8 em 0.6 em 0.6 em 106
303 11/26/91 2.84 1/s east 7.0 em 8.2 em N/A 4.3 em 152 west 7.0 em 7.6 em N/A 4.0 em 152
* - Coral envelope added initial chloride concentrations
The pump tests also indicated that the collectors were capable of delivering higher flows than their design rates, and maintain uniform drawdown within the aquifer,
ACCESS HATCH
CONCRETE APRON
DISCHARGE PIPE
PVC SPOOL
HORIZONTAL COLLECTOR PIPE 12 EACH WELL)
RISER
MANHOLE WATER
- TABLE
PIPEIPERFORATED
-PIPE
Fig. 7 - Well Construction Details
ttJ r>l
~ >
CONCRETE RING
~
PVC MONITORING PIPE IN CORAL ENVELOPE
_, N 0\
en c ~ til -< ~ t)
a:: 0 z § ;;c z 0 0 ~
en
~ ~ ~ ;;c
~ ~ en 0 z
RECORDED LOW \7 WATER LEVEL
.. ,~ Cll
f:3 ~ < >
~/,
TOP SOIL BACKFILL SAND/CORAL NATIVE FILL
AVERAGE HIGH WATER LEVEL
3 MIL PLASTIC LINER
CORAL RUBBLE
PVC PERFORATED PIPE
Fig. 8 - Infiltration Trench Section
~ l' :;:· Jj" "' 0 :;
-J N -J

728 SURVEY AND MONI1DRING OF SALT WATER INTRUSION
ACKNOWLEDGEMENTS
1. American Samoa Power Authority Pago Pago, American Samoa Abe u. Malae, Executive Director
2. US Geological Survey Water Resources Division Honolulu, Hawaii Paul Eyre, Hydrologist
REFERENCES
1. US GEOLOGICAL SURVEY - "Groundwater Resources of American samoa" Honolulu, Hawaii, 1975
2. LIVINGSTON, E. - Field notes from Aunu'u island 6/91 - 11/91
3. EYRE, P. - "Site Visit to Tutuila and Tau Islands, American samoa; September 17 Through October 3, 1991" US Geological Survey Honolulu, Hawaii, 1991
4. MINK, J. - "Trust Territory of the Pacific Islands Water Supply Initiative, Groundwater Resources and Development" US Environmental Protection Agency Region 9, 1986
5. BRATER, E. and KING, H. - "Handbook of Hydraulics" McGraw-Hill, Inc. New York, 1982
6. DAUGHERTY, R. and FRANZINI, J. - "Fluid Mechanics" McGraw-Hill, Inc. New York, 1977